
Local Government Victoria, FG 6 - 2017
www.delwp.vic.gov.au
Local Government Better Practice Guide
Strategic Resource Plan, 2017

AuthorLocal Government Victoria in the Department of Environment, Land, Water and Planning, 2 Lonsdale St Melbourne 3000
Photo creditTitle: “12 Apostles” Author: “Prerak Patel” “12 Apostles” is licenced under CC BY by the Department of Environment, Land, Water and Planning.© The State of Victoria Department of Environment, Land, Water and Planning 2017
This work is licensed under a Creative Commons Attribution 4.0 International licence. You are free to re-use the work under that licence, on the condition that you credit the State of Victoria as author. The licence does not apply to any images, photographs or branding, including the Victorian Coat of Arms, the Victorian Government logo and the Department of Environment, Land, Water and Planning (DELWP) logo. To view a copy of this licence, visit http://creativecommons.org/licenses/by/4.0/ISBN 978-1-76047-582-6 (pdf/online)
DisclaimerThis publication may be of assistance to you but the State of Victoria and its employees do not guarantee that the publication is without flaw of any kind or is wholly appropriate for your particular purposes and therefore disclaims all liability for any error, loss or other consequence which may arise from you relying on any information in this publication.
AccessibilityIf you would like to receive this publication in an alternative format, please telephone the DELWP Customer Service Centre on 136186, email [email protected] or local.government @delwp.vic.gov.au, or via the National Relay Service on 133 677 www.relayservice.com.au. This document is also available on the internet at www.delwp.vic.gov.au.

Introduction........................................................................................................................3The Local Government Act 1989......................................................................................3About this guide................................................................................................................3Planning and accountability framework..........................................................................5Strategic resource plan (overview)..................................................................................6Statutory requirements.....................................................................................................6Better practice guidance...................................................................................................8Strategic resource plan (guidance)................................................................................10Preparation of the strategic resource plan...................................................................10Briefing council and management.................................................................................11Developing forecasts......................................................................................................11Reviewing assumptions and forecasts.........................................................................12Selecting a preferred option...........................................................................................13Updating the budget forecasts.......................................................................................13Preparing the strategic resource plan report................................................................14Council adoption of the strategic resource plan..........................................................14Strategic resource plan (model).....................................................................................16Victorian City Council – Strategic Resource Plan........................................................17Comprehensive Income Statement................................................................................17Balance Sheet..................................................................................................................18Statement of Changes in Equity.....................................................................................19Statement of Cash Flows................................................................................................20Statement of Capital Works............................................................................................21Statement of Human Resources....................................................................................22Other information............................................................................................................23Victorian City Council – Strategic Resource Plan (alternative model).......................28Table of contents.............................................................................................................28Background......................................................................................................................30Objectives of the plan.....................................................................................................30How the plan was developed..........................................................................................31Assessment of council’s current financial position.....................................................31Key assumptions.............................................................................................................32
Contents
Local Government Better Practice GuideStrategic Resource Plan, 2017
1
General operating............................................................................................................33Service delivery...............................................................................................................34Other operating................................................................................................................35General balance sheet.....................................................................................................37Other balance sheet........................................................................................................37Capital works...................................................................................................................38Human resources............................................................................................................39Option analysis................................................................................................................40Higher cap option............................................................................................................40Rate cap option (no changes to key assumptions)......................................................41Rate cap option (changes to key assumptions)...........................................................42Outcomes.........................................................................................................................43Achievement of SRP objectives.....................................................................................46Appendix..........................................................................................................................48Glossary...........................................................................................................................49References.......................................................................................................................52Endnotes..........................................................................................................................53
AbbrieviationsCAANZ Chartered Accountants in Australia and New Zealand
CPI Consumer Price Index
ESC Essential Services Commission
LGPRF Local Government Performance Reporting Framework
LGPro Local Government Professionals
LGV Local Government Victoria
MAV Municipal Association of Victoria
VAGO Victorian Auditor-General’s Office
2 Local Government Better Practice GuideStrategic Resource Plan, 2017

Local government in Victoria manages approximately $84.6 billion of community assets and infrastructure and spends around $7.7 billion on the provision of services annuallyi. Local government, in partnership with other levels of government, is responsible for aspects of everyday life that people care about deeply – from vibrant and safe public spaces, to accessible libraries, to strong local business and employment opportunities. Effective planning and reporting by councils is essential for ensuring transparency and accountability to the community and other levels of government as to how public money is being spent and the quality of services delivered.
The Local Government Act 1989The Local Government Act 1989 (the Act) states that the primary objective of a council is to endeavour to achieve the best outcomes for the local community having regard to the long-term and cumulative effects of decisionsii. The Act sets out that local government in Victoria:
• is a distinct and essential tier of governmentiii
• must provide governance and leadership for the local community through advocacy, decision making and actioniv
• must be accountable to their local communities in the performance of functions and the exercise of powers and the use of resourcesv.
It is a statutory requirement that councils prepare and report on medium and short-term plans in order to discharge their duties of accountability and transparency to their communities.
About this guide This guide has been developed to assist local government in meeting the statutory requirements in regard to the preparation of a strategic resource plan. The guide is presented in five sections:
1. Planning and accountability framework: provides an overview of the relationship between the key planning and reporting documents in the Act
2. Strategic resource plan (overview): provides an overview of the statutory requirements and better practice guidance for preparing a strategic resource plan
3. Strategic resource plan (guidance): provides detailed guidance on the preparation of the strategic resource plan, including the process for identifying, collecting, modelling and reporting forecast information
4. Strategic resource plan (model): provides a model strategic resource plan prepared in accordance with the Act and regulations for inclusion in the council plan
5. Strategic resource plan (alternative format): provides a model strategic resource plan prepared in line with better practice guidance.
This guide is intended for use by specialists in the field of local government planning and reporting. It will also be instructive for
Introduction
Local Government Better Practice GuideStrategic Resource Plan, 2017
3

senior officers including chief executive officers (CEOs) and councillors. Each council retains the responsibility for preparing their strategic resource plan, including the format and the disclosures made. This guide represents the presentation required by Local Government Victoria (LGV).
Within this guide there are references to related information and further guidance. A full list of resources can be found in the reference section. Endnotes are used to reference legislative provisions and other information. Illustrative information and examples are provided in tables and boxed text.
4 Local Government Better Practice GuideStrategic Resource Plan, 2017

This guide can be used in conjunction with the 2017 Strategic Resource Plan excel template, which provides a template format for preparation of the financial statements and other information required to be contained in the strategic resource plan. The excel template can be found at www.delwp.vic.gov.au.
The planning and accountability framework is found in part 6 of the Act and in the Local Government (Planning and Reporting) Regulations 2014 (the regulations). The legislation requires councils to prepare the following documents:
• a council plan within the period of six months after each general election or by 30 June, whichever is latervi
• a strategic resource plan for a period of at least four years and include this in the council planvii
• a budget for each financial yearviii
• an annual report for each financial yearix.
The following diagram shows the relationships between the key planning and reporting documents that make up the planning and accountability framework for local government. It also shows that there are opportunities for community and stakeholder input at each stage of the planning and reporting cycle.Figure 1 - Planning and accountability framework
Local Government Better Practice GuideStrategic Resource Plan, 2017
5
Planning and accountability framework

“The Act requires councils to prepare a strategic resource plan and include this in the council plan”
Section 126 of the Act states that:
• the strategic resource plan is a plan of the resources required to achieve the council plan strategic objectivesx
• the strategic resource plan must include the financial statements describing the financial resources in respect of at least the next four financial yearsxi
• the strategic resource plan must include statements describing the non-financial resources including human resources in respect of at least the next four financial yearsxii
• the strategic resource plan must take into account services and initiatives contained in any plan adopted by council and if the council proposes to adopt a plan to provide services or take initiatives, the resources required must be consistent with the strategic resource planxiii
• council must review their strategic resource plan during the preparation of the council planxiv
• council must adopt the strategic resource plan not later than 30 June each year or such other date fixed by the Minister1 and a copy must be available for public inspection at the council office and internet websitexv.
In preparing the strategic resource plan, councils should comply with the principles of sound financial management as prescribed in the Actxvi being to:
• prudently manage financial risks relating to debt, assets and liabilities
• provide reasonable stability in the level of rate burden
• consider the financial effects of council decisions on future generations
• provide full, accurate and timely disclosure of financial information.
In addition to section 126 of the Act, part 2 of the regulations also prescribe further details about the preparation of a strategic resource plan.
1 The due date for adopting Council Plans, Strategic Resource Plans and Budgets for financial year 2017-18 has been extended to 31 August 2017.
6 Local Government Better Practice GuideStrategic Resource Plan, 2017

ChecklistThe strategic resource plan must:
take into account services and initiatives contained in any plan adopted by council
include financial statements describing the required financial resources for the next four financial years
include statements describing the required non-financial resources, including human resources for at least the next four financial years
include any other information prescribed by the regulations.
Local Government Better Practice GuideStrategic Resource Plan, 2017
7

Better practice guidanceThe strategic resource plan is the key medium-term financial plan produced by council on a rolling basis that summarises the resourcing forecasts of a council for at least four years and forms part of the council plan. Resource planning is important for ensuring that a council remains sustainable in the long term and better practice is to extend forecasting for a ten-year period, to take account of long lived assets such as road and drainage infrastructure.
The strategic resource plan summarises the financial and non-financial resources required to achieve the strategic objectives in the council plan and presents these in financial statements and statements of non-financial resources. The regulations require that the strategic resource plan must include:
• financial statements including a statement of capital works in the form set out in the Local Government Model Financial Report
• a summary of planned capital works expenditure in relation to non-current assets, classified in accordance with the asset classes and asset expenditure types specified in the Local Government Model Financial Report and a summary of funding sources in relation to the planned capital works expenditurexvii
• a statement of human resources
• a summary of planned expenditure in relation to permanent human resources and a summary of the planned number of permanent full time equivalent staff by organisational structurexviii.
In preparing the strategic resource plan councils must take into account services and initiatives contained in any plan adopted or proposed to be adopted by
council. The resources required must then be presented in the strategic resource plan on the basis of what is able to be funded over the four-year period. Councils should engage the officers responsible for service and capital works planning and delivery to develop the future forecasts to ensure that there is a robust and integrated approach to financial planning for all council’s activities and avoid the risk of committing future resources that are unaffordable and/or place an added burden on future generations.
Once the resources have been identified, councils should model a number of different financial options by changing the assumptions underlying forecasts for income, expenditure, assets, liabilities, equity, cash, capital works expenditure and human resources. This enables councils to identify the option that best achieves the council plan strategic objectives while remaining financially sustainable in the long term. The financial performance indicators and measures in the Local Government Performance Reporting Framework (LGPRF) can assist councils in determining their financial sustainability under the different options.
The final stage is to prepare the strategic resource plan for inclusion in the council plan, ensuring that it contains all the information required by the Act and regulations and has been adopted by council. It is better practice to prepare a standalone strategic resource plan document and provide a narrative setting out the objectives of the plan, how it was developed, the key assumptions underlying the forecasts and how it provides sufficient resources to achieve the strategic objectives in the council plan. The financial statements and other information required by the Act and regulations can then be included in an appendix. If a standalone strategic resource plan document is
8 Local Government Better Practice GuideStrategic Resource Plan, 2017

prepared, it must still be adopted by council and included in the council plan.
It is accepted practice to include an extract of the strategic resource plan in the budget to provide readers with information about how it fits within the planning and accountability framework and demonstrate
the linkage with the council plan and budget. A model budget is prepared annually by Chartered Accountants Australia and New Zealand (CAANZ), which provides further guidance on including an extract of the strategic resource plan in the budget.
For further information refer to: Department of Environment, Land, Water and Planning (2017), Local Government
Better Practice Guide Strategic Resource Plan, State of Victoria
Department of Environment, Land, Water and Planning (2017), Local Government Model Financial Report, State of Victoria
Department of Victorian Communities (2006), Local Government: Accounting for non-current physical assets under AASB 116: A Guide, State of Victoria
Chartered Accountants in Australia and New Zealand (2017), Victorian City Council Model Budget 2017-2018
Preparation of the strategic resource planCouncil are required to adopt the strategic resource plan by no later than 30 June each year (or such other dated fixed by the Minister2). In order for council to have sufficient confidence in the plan, it is essential that they are part of the preparation process and have
2 The due date for adopting Council Plans, Strategic Resource Plans and Budgets for financial year 2017-18 has been extended to 31 August 2017.
Local Government Better Practice GuideStrategic Resource Plan, 2017
9
Strategic resource plan (guidance)

input at key stages. In order for this to be achieved, the preparation of the strategic resource plan should not be seen as a finance responsibility, rather it needs to be driven from the top of the organisation (i.e. CEOs and their direct reports) and owned at all levels.
The following process is suggested to ensure that there is buy-in at all levels in the organisation, the forecasts are robust and council is assured it has sufficient influence over the plan outcomes.Figure 2 – Process for preparing a strategic resource plan
Each of the stages of the process are discussed in more detail in the following sections.
Briefing council and managementAs the council must have confidence in the strategic resource plan that it adopts, the preparation process should start with a detailed briefing well before forecast development begins. As a minimum, the council should be briefed on:
• the key objective of the strategic resource planning process
• the financial and non-financial outcomes of the current adopted strategic resource plan
• the process for updating the current strategic resource plan
• any matters of significance or new assumptions to be taken into account.
In addition to briefing the council on the strategic resource planning process, senior management should also be briefed to ensure that there is a clear connect between the council’s objectives and the officer’s forecasts.
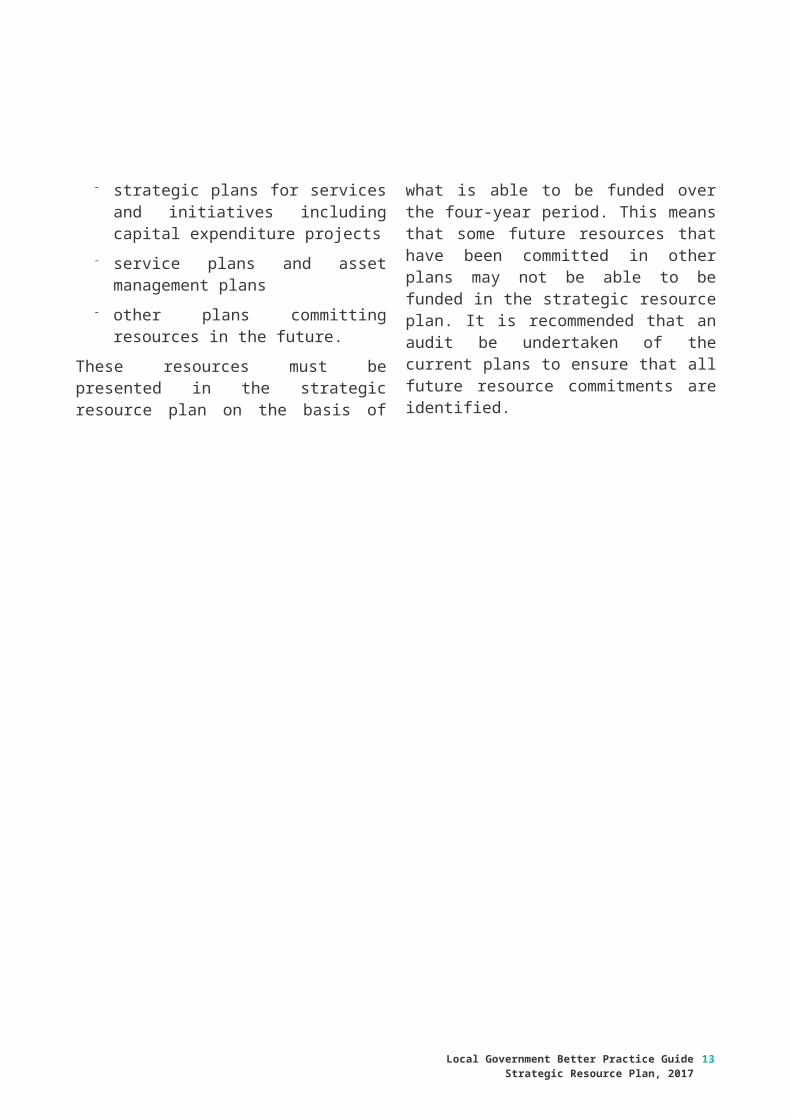
Developing forecastsIn preparing the strategic resource plan councils must take into account services and initiatives contained in any plan adopted or proposed to be adopted by council. These plans will include:
• strategic plans for services and initiatives including capital expenditure projects
• service plans and asset management plans
• other plans committing resources in the future.
These resources must be presented in the strategic resource plan on the basis of what is able to be funded over the four-year period. This means that some future resources that have been committed in other plans may not be able to be funded in the strategic resource plan. It is recommended that an audit be undertaken of the current plans to ensure that all future resource commitments are identified.
10 Local Government Better Practice GuideStrategic Resource Plan, 2017

It is better practice to engage the officers responsible for service and capital works planning and delivery to develop the future forecasts to ensure that there is a robust and integrated approach to financial planning for all council’s activities. This process should be facilitated through the development of guidance which outlines the process that officers should follow. For service forecasts, this would include:
• identifying the key drivers of the service or activity (e.g. population, demographics, government policy)
• understanding the current cost of the service and its components
• making reference to adopted and/or other plans that commit future resources
• using the most appropriate forecasting technique (e.g. extrapolation, regression, econometrics or judgemental)
• providing justification where future forecasts are different to ‘business as usual’.
For capital works expenditure forecasts, this would include for all categories of non-current assets:
• identifying asset renewal needs
• identifying new, expanded or upgraded asset expenditure
• identifying asset maintenance
• identifying asset sales.
While the strategic resource plan must describe the resources required for at least the next four financial years, better practice is to extend forecasting for a ten-year period, to take account of long lived assets such as road and drainage infrastructure.
The collection of forecast information can be facilitated through automated techniques such as spreadsheets, core financial systems or executive information systems.
Reviewing assumptions and forecastsOnce the resources have been identified, councils should model a number of different options by changing the assumptions underlying the forecasts for income, expenditure, assets, liabilities, equity, cash, capital works expenditure and human resources. In reality there are only a small number of levers that will have a significant impact on the future forecasts. These include:
• rates and charges
• operating budget savings
• capital works expenditure (renewal, new, expansion and upgrade)
• borrowings
• asset sales.
The objective of this process is to develop options that achieve a sustainable financial position over the long term. The financial performance indicators and measures in the
Local Government Better Practice GuideStrategic Resource Plan, 2017
11

LGPRF can assist councils in determining their financial sustainability under the different scenarios. The key indicators for undertaking this analysis are set out in box 1.Box 1: Key financial performance indicators
Indicator Target
Adjusted underlying result Greater than 0%
Working capital 120% to 200%
Loans and Borrowings 20% to 60%
Asset renewal 90% to 110%
Selecting a preferred optionThe next step is to brief the council on the various options with the objective of identifying the option that best achieves the council plan strategic objectives and strategies while remaining financialy sustainable in the long term.
It is important that the council is assured it is able to influence the final outcome of the strategic resource planning process and as a minimum should be briefed on:
• the process for developing the forecasts
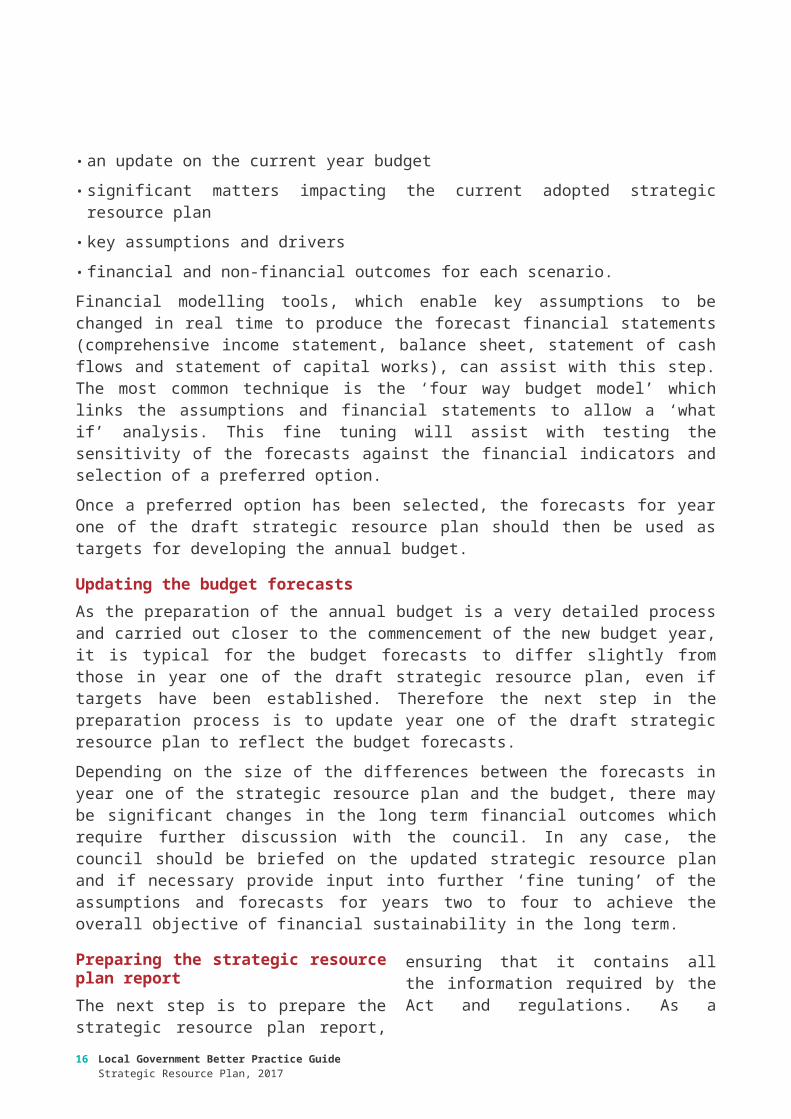
• an update on the current year budget
• significant matters impacting the current adopted strategic resource plan
• key assumptions and drivers
• financial and non-financial outcomes for each scenario.
Financial modelling tools, which enable key assumptions to be changed in real time to produce the forecast financial statements (comprehensive income statement, balance sheet, statement of cash flows and statement of capital works), can assist with this step. The most common technique is the ‘four way budget model’ which links the assumptions and financial statements to allow a ‘what if’ analysis. This fine tuning will assist with testing the sensitivity of the forecasts against the financial indicators and selection of a preferred option.
Once a preferred option has been selected, the forecasts for year one of the draft strategic resource plan should then be used as targets for developing the annual budget.
Updating the budget forecastsAs the preparation of the annual budget is a very detailed process and carried out closer to the commencement of the new budget year, it is typical for the budget forecasts to differ slightly from those in year one of the draft strategic resource plan, even if targets have been established. Therefore the next step in the preparation process is to update year one of the draft strategic resource plan to reflect the budget forecasts.
12 Local Government Better Practice GuideStrategic Resource Plan, 2017
Depending on the size of the differences between the forecasts in year one of the strategic resource plan and the budget, there may be significant changes in the long term financial outcomes which require further discussion with the council. In any case, the council should be briefed on the updated strategic resource plan and if necessary provide input into further ‘fine tuning’ of the assumptions and forecasts for years two to four to achieve the overall objective of financial sustainability in the long term.
Preparing the strategic resource plan reportThe next step is to prepare the strategic resource plan report, ensuring that it contains all the information required by the Act and regulations. As a minimum the strategic resource plan must contain:
• financial statements including a statement of capital works in the form set out in the Local Government Model Financial Report
• a summary of planned capital works expenditure in relation to non-current assets, classified in accordance with the asset classes and asset expenditure types in the Local Government Model Financial Report and a summary of funding sources in relation to the planned capital works expenditure
• a statement of human resources
• a summary of planned expenditure in relation to permanent human resources and a summary of the planned number of permanent full time equivalent staff by organisational structure.
It is better practice to prepare a standalone strategic resource plan document and provide a narrative at the beginning for the purpose of assisting readers to understand the information contained in the plan. The narrative should be written in plain English and include:
• the objectives of the plan
• how the plan was developed
• an assessment of the council’s current financial position and matters impacting the plan
• key assumptions underlying the forecasts for income, expenditure, assets, liabilities, equity, cash, capital works expenditure and human resources
• details of the options considered
• the financial and non-financial outcomes of the preferred option
• how the plan provides sufficient resources to achieve the strategic objectives in the council plan.
The disclosures required by the Act and regulations should be attached as an appendix to the above narrative.
Council adoption of the strategic resource planA council must adopt the strategic resource plan not later than 30 June each year and it must be included in the council plan3. While a person has a right to make a submission under section 223 of the Act on a proposed adjustment to a council plan, a person does not have a right to make a submission where the adjustment to the council plan is as a result of the strategic resource plan.
It is better practice for council to give its community the opportunity to consider the proposed strategic resource plan and make a submission when it is updated each year, as for the annual budget. This will ensure that the council’s longer term financial
3 The due date for adopting Council Plans, Strategic Resource Plans and Budgets for financial year 2017-18 has been extended to 31 August 2017.
Local Government Better Practice GuideStrategic Resource Plan, 2017
13

planning process is transparent and gives the community confidence that council is discharging its responsibilities of ensuring that resources are used efficiently and effectively and comply with the principles of sound financial management. If a council is applying for a higher rate cap it would be prudent to also engage with the community
during the preparation of the plan to demonstrate that their views have been taken into account.
If a standalone strategic resource plan document is prepared, it must still be adopted by council and included in the council plan.
NOTE: The regulations require that the financial statements included in the strategic resource plan must be in the form set out in the Local Government Model Financial Report (LGMFR). Preparers of the strategic resource plan should carefully review the form of the financial statements in the LGMFR along with the supporting guidance. In addition to the financial statements, there are two further disclosures, which are specific to the preparation of the strategic resource plan, being:
summary of planned capital works expenditure
summary of planned human resource expenditure.
Users should refer to this model for the presentation required by LGV for these additional disclosures.
Victorian City Council – Strategic Resource Plan Comprehensive Income StatementFor the four years ended 30 June 2021
2018 2019 2020 2021
$’000 $’000 $’000 $’000
Income
Rates and charges 43,457 46,273 48,725 51,263
Statutory fees and fines 2,690 2,818 2,785 2,834
User fees 7,680 7,828 8,004 8,184
Grants - Operating 13,617 13,604 13,746 13,987
Grants – Capital 6,277 9,407 1,694 1,367
Contributions - monetary 51 471 370 350
14 Local Government Better Practice GuideStrategic Resource Plan, 2017
Strategic resource plan (model)

Contributions - non-monetary 0 0 0 0
Net gain/(loss) on disposal of property, infrastructure, plant and equipment
539 479 488 497
Fair value adjustments for investment property 0 0 0 0
Share of net profits/(losses) of associates and joint ventures 0 0 0 0
Other income 3,263 2,734 2,782 2,830
Total income 77,574 83,614 78,594 81,312
Expenses
Employee costs 34,091 35,367 36,655 37,711
Materials and services 22,107 21,847 21,999 22,810
Bad and doubtful debts 340 348 356 364
Depreciation and amortisation 14,500 15,187 15,744 16,274
Borrowing costs 312 247 410 340
Other expenses 5,179 5,220 5,184 5,383
Total expenses 76,529 78,216 80,348 82,882
Surplus/(deficit) for the year 1,045 5,398 (1,754) (1,570)
Other comprehensive income
Items that will not be reclassified to surplus or deficit in future periods
Net asset revaluation increment/(decrement) 0 0 0 0
Share of other comprehensive income of associates and joint ventures
0 0 0 0
Items that may be reclassified to surplus or deficit in future periods
0 0 0 0
<<detail as appropriate>> 0 0 0 0
Total comprehensive result 1,045 5,398 (1,754) (1,570)
The above comprehensive income statement should be read in conjunction with the accompanying other information.
Local Government Better Practice GuideStrategic Resource Plan, 2017
15
Balance SheetFor the four years ended 30 June 2021
2018 2019 2020 2021
$’000 $’000 $’000 $’000
Assets
Current assets
Cash and cash equivalents 12,207 12,428 12,776 13,028
Trade and other receivables 5,367 5,467 5,567 5,667
Other financial assets 6 6 6 6
Inventories 0 0 0 0
Non-current assets classified as held for sale 0 0 0 0
Other assets 200 200 200 200
Total current assets 17,780 18,101 18,549 18,901
Non-current assets
Trade and other receivables 12 12 12 12
Investments in associates and joint ventures 0 0 0 0
Property, infrastructure, plant and equipment 514,527 518,681 517,558 514,586
Investment property 0 0 0 0
Intangible assets 0 0 0 0
Total non-current assets 514,539 518,693 517,570 514,598
Total assets 532,319 536,794 536,119 533,499
Liabilities
Current liabilities
Trade and other payables 5,880 5,880 5,880 5,880
Trust funds and deposits 0 0 0 0
Provisions 5,714 5,917 6,121 6,326
Interest-bearing loans and borrowings 1,161 1,161 1,290 1,322
Total current liabilities 12,755 12,598 13,291 13,528
Non-current liabilities
Provisions 1,008 1,043 1,079 1,114
Interest-bearing loans and borrowings 3,726 2,565 3,275 1,953
Total non-current liabilities 4,734 3,608 4,354 3,067
Total liabilities 17,489 16,566 17,645 16,595
Net Assets 514,830 520,228 518,474 516,904
Equity
Accumulated surplus 407,910 413,228 411,392 409,742
Reserves 106,920 107,000 107,082 107,162
Total Equity 514,830 520,228 518,474 516,904
The above balance sheet should be read in conjunction with the accompanying other information.
16 Local Government Better Practice GuideStrategic Resource Plan, 2017

Statement of Changes in Equity For the four years ended 30 June 2021
Total
Accum-ulatedSurplus
Reval-uationReserve
OtherReserves
$’000 $’000 $’000 $’000
2018
Balance at beginning of the financial year 513,785 398,518 102,118 13,149
Surplus/(deficit) for the year 1,045 1,045 0 0
Net asset revaluation increment /(decrement) 0 0 0 0
Transfers to other reserves 0 (2,001) 0 2,001
Transfers from other reserves 0 10,348 0 (10,348)
Balance at end of the financial year 514,830 407,910 102,118 4,802
2019
Balance at beginning of the financial year 514,830 407,910 102,118 4,802
Surplus/(deficit) for the year 5,398 5,398 0 0
Net asset revaluation increment /(decrement) 0 0 0 0
Transfers to other reserves 0 (1,510) 0 1,510
Transfers from other reserves 0 1,430 0 (1,430)
Balance at end of the financial year 520,228 413,228 102,118 4,882
2020
Balance at beginning of the financial year 520,228 413,228 102,118 4,882
Surplus/(deficit) for the year (1,754) (1,754) 0 0
Net asset revaluation increment /(decrement) 0 0 0 0
Transfers to other reserves 0 (1,450) 0 1,452
Transfers from other reserves 0 1,370 0 (1,370)
Balance at end of the financial year 518,474 411,392 102,118 4,964
2021
Balance at beginning of the financial year 518,474 411,392 102,118 4,964
Surplus/(deficit) for the year (1,570) (1,570) 0 0
Net asset revaluation increment /(decrement) 0 0 0 0
Transfers to other reserves 0 (1,410) 0 1,410
Transfers from other reserves 0 1,330 0 (1,330)
Balance at end of the financial year 516,904 409,742 102,118 5,044
The above statement of changes in equity should be read in conjunction with the accompanying other information.
Local Government Better Practice GuideStrategic Resource Plan, 2017
17

18 Local Government Better Practice GuideStrategic Resource Plan, 2017

Statement of Cash FlowsFor the four years ended 30 June 2021
2018 2019 2020 2021
Inflows/ (Outflows)
$’000
Inflows/ (Outflows)
$’000
Inflows/ (Outflows)
$’000
Inflows/ (Outflows)
$’000
Cash flows from operating activities
Rates and charges 43,357 46,173 48,625 51,163
Statutory fees and fines 2,690 2,818 2,785 2,834
User fees 7,680 7,828 8,004 8,184
Grants – operating 13,617 13,604 13,746 13,987
Grants – capital 6,277 9,407 1,694 1,367
Contributions – monetary 51 471 370 350
Interest received 1,820 1,264 1,278 1,292
Dividends received 0 0 0 0
Trust funds and deposits taken 0 0 0 0
Other receipts 1,443 1,469 1,503 1,538
Net GST refund/payment 0 0 0 0
Employee costs (33,841) (35,117) (36,405) (37,461)
Material and services (22,106) (21,848) (21,999) (22,810)
Trust funds and deposits repaid 0 0 0 0
Other payments (5,529) (5,577) (5,549) (5,757)
Net cash provided by /(used in) operating activities 15,459 20,492 14,052 14,687
Cash flows from investing activities
Payments for property, infrastructure, plant and equipment (29,195) (20,881) (16,169) (14,859)
Proceeds from sale of property, infrastructure, plant and equipment
3,741 2,018 2,036 2,054
Payments for investments 0 0 0 0
Proceeds from sale of investments 0 0 0 0
Loans and advances made 0 0 0 0
Payment of loans and advances 199 0 0 0
Net cash provided by /(used in) investing activities (25,255) (18,863) (14,133) (12,805)
Cash flows from financing activities
Finance costs (312) (247) (410) (340)
Proceeds from borrowings 0 0 2000 0
Repayment of borrowings (1,161) (1,161) (1,161) (1,290)
Net cash provided by /(used in) financing activities (1,473) (1,408) 429 (1,630)
Net increase (decrease) in cash and cash equivalents (11,269) 221 348 252
Cash and cash equivalents at the beginning of the financial year
23,476 12,207 12,428 12,776
Cash and cash equivalents at the end of the financial year 12,207 12,428 12,776 13,028
Local Government Better Practice GuideStrategic Resource Plan, 2017
19

Statement of Capital WorksFor the four years ended 30 June 2021
2018 2019 2020 2021
$’000 $’000 $’000 $’000
Property
Land 0 0 0 0
Land improvements 0 0 0 0
Total land 0 0 0 0
Buildings 13,368 10,114 8,064 7,550
Heritage buildings 0 0 0 0
Building improvements 117 89 71 66
Leasehold improvements 0 0 0 0
Total buildings 13,485 10,203 8,135 7,616
Total property 13,485 10,203 8,135 7,616
Plant and equipment
Heritage plant and equipment 0 0 0 0
Plant, machinery and equipment 3,179 2,406 1,917 1,796
Fixtures, fittings and furniture 0 0 0 0
Computers and telecommunications 2,112 1,598 1,274 1,193
Library books 500 378 302 282
Total plant and equipment 5,791 4,382 3,493 3,271
Infrastructure
Roads 5,367 4,061 3,239 3,031
Bridges 10 8 6 6
Footpaths and cycleways 681 515 411 385
Drainage 1,885 1,426 1,137 1,065
Recreational, leisure and community facilities 629 476 379 355
Waste management 0 0 0 0
Parks, open space and streetscapes 2,614 1,978 1,577 1,476
Aerodromes 0 0 0 0
Off street car parks 115 87 69 65
Other infrastructure 140 106 84 79
Total infrastructure 11,441 8,657 6,902 6,462
Total capital works expenditure 30,717 23,242 18,530 17,349
Represented by:
New asset expenditure 9,176 5,767 3,296 2,791
Asset renewal expenditure 17,454 15,928 13,145 13,560
Asset expansion expenditure 632 845 1,232 730
Asset upgrade expenditure 3,455 702 857 268
Total capital works expenditure 30,717 23,242 18,530 17,349
20 Local Government Better Practice GuideStrategic Resource Plan, 2017

The above statement of capital works should be read in conjunction with the accompanying other information.
Statement of Human ResourcesFor the four years ended 30 June 2021
2018 2019 2020 2021
$’000 $’000 $’000 $’000
Staff expenditure
Employee Costs – Operating 34,091 35,367 36,655 37,711
Employee Costs – Capital 0 0 0 0
Total staff expenditure 34,091 35,367 36,655 37,711
FTE FTE FTE FTE
Staff numbers
Employees 568.3 570.2 573.4 575.0
Total staff numbers 568.3 570.2 573.4 575.0
The above statement of human resources should be read in conjunction with the other information.
Local Government Better Practice GuideStrategic Resource Plan, 2017
21

Other informationFor the four years ended 30 June 2021
1. Summary of planned capital works expenditure
Asset Expenditure Types Funding SourcesTotal New Renewal Expans-
ionUpgrade Total Grants Contrib-
utionsCouncil Cash
Borrow-ings
2018 $’000 $’000 $’000 $’000 $’000 $’000 $’000 $’000 $’000 $’000PropertyLand 0 0 0 0 0 0 0 0 0 0Land improvements 0 0 0 0 0 0 0 0 0 0Total land 0 0 0 0 0 0 0 0 0 0Buildings 13,368 6,042 4,326 0 3,000 13,368 4,278 0 9,090 0Heritage buildings 0 0 0 0 0 0 0 0 0 0Building improvements 117 117 0 0 0 117 0 0 117 0Leasehold improvements 0 0 0 0 0 0 0 0 0 0Total buildings 13,485 6,159 4,326 0 3,000 13,485 4,278 0 9,207 0Total property 13,485 6,159 4,326 0 3,000 13,485 4,278 0 9,207 0Plant and equipmentHeritage plant and equipment 0 0 0 0 0 0 0 0 0 0Plant, machinery and equipment 3,179 0 3,179 0 0 3,179 435 0 2,744 0Fixtures, fittings and furniture 0 0 0 0 0 0 0 0 0 0Computers and telecommunications 2,112 1,433 679 0 0 2,112 0 0 2,112 0Library books 500 500 0 0 0 500 0 0 500 0Total plant and equipment 5,791 1,933 3,858 0 0 5,791 435 0 5,356 0InfrastructureRoads 5,367 195 4,433 434 305 5,367 808 0 4,559 0Bridges 10 0 10 0 0 10 0 0 10 0Footpaths and cycleways 681 80 601 0 0 681 161 0 520 0Drainage 1,885 40 1,497 198 150 1,885 560 0 1,325 0Recreational, leisure and community facilities 629 629 0 0 0 629 0 0 629 0Waste management 0 0 0 0 0 0 0 0 0 0Parks, open space and streetscapes 2,614 0 2,614 0 0 2,614 0 0 2,614 0Aerodromes 0 0 0 0 0 0 0 0 0 0Off street car parks 115 0 115 0 0 115 0 0 115 0Other infrastructure 140 140 0 0 0 140 35 0 105 0Total infrastructure 11,441 1,084 9,270 632 455 11,441 1,403 0 10,038 0Total capital works expenditure 30,717 9,176 17,454 632 3,455 30,717 6,277 0 24,440 0

1. Summary of planned capital works expenditure (continued)
Asset Expenditure Types Funding SourcesTotal New Renewal Expans-
ionUpgrade Total Grants Contrib-
utionsCouncil Cash
Borrow-ings
$’000 $’000 $’000 $’000 $’000 $’000 $’000 $’000 $’000 $’0002019PropertyLand 0 0 0 0 0 0 0 0 0 0Land improvements 0 0 0 0 0 0 0 0 0 0Total land 0 0 0 0 0 0 0 0 0 0Buildings 10,114 2,970 7,144 0 0 10,114 7,904 0 2,210 0Heritage buildings 0 0 0 0 0 0 0 0 0 0Building improvements 89 89 0 0 0 89 0 0 89 0Leasehold improvements 0 0 0 0 0 0 0 0 0 0Total buildings 10,203 3,059 7,144 0 0 10,203 7,904 0 2,299 0Total property 10,203 3,059 7,144 0 0 10,203 7,904 0 2,299 0Plant and equipmentHeritage plant and equipment 0 0 0 0 0 0 0 0 0 0Plant, machinery and equipment 2,406 0 2,406 0 0 2,406 635 0 1,771 0Fixtures, fittings and furniture 0 0 0 0 0 0 0 0 0 0Computers and telecommunications 1,598 1,433 165 0 0 1,598 0 0 1,598 0Library books 378 378 0 0 0 378 0 0 378 0Total plant and equipment 4,382 1,811 2,571 0 0 4,382 635 0 3,747 0InfrastructureRoads 4,061 195 2,827 534 505 4,061 608 0 3,453 0Bridges 8 0 8 0 0 8 0 0 8 0Footpaths and cycleways 515 80 435 0 0 515 0 0 515 0Drainage 1,426 40 878 311 197 1,426 260 0 1,166 0Recreational, leisure and community facilities 476 476 0 0 0 476 0 0 476 0Waste management 0 0 0 0 0 0 0 0 0 0Parks, open space and streetscapes 1,978 0 1,978 0 0 1,978 0 0 1,978 0Aerodromes 0 0 0 0 0 0 0 0 0 0Off street car parks 87 0 87 0 0 87 0 0 87 0
Local Government Better Practice GuideStrategic Resource Plan, 2017
23

Asset Expenditure Types Funding SourcesTotal New Renewal Expans-
ionUpgrade Total Grants Contrib-
utionsCouncil Cash
Borrow-ings
$’000 $’000 $’000 $’000 $’000 $’000 $’000 $’000 $’000 $’000Other infrastructure 106 106 0 0 0 106 0 0 106 0Total infrastructure 8,657 897 6,213 845 702 8,657 868 0 7,789 0Total capital works expenditure 23,242 5,767 15,928 845 702 23,242 9,407 0 13,835 0
24 Local Government Better Practice GuideStrategic Resource Plan, 2017

1. Summary of planned capital works expenditure (continued)
Asset Expenditure Types Funding SourcesTotal New Renewal Expans-
ionUpgrade Total Grants Contrib-
utionsCouncil Cash
Borrow-ings
$’000 $’000 $’000 $’000 $’000 $’000 $’000 $’000 $’000 $’0002020PropertyLand 0 0 0 0 0 0 0 0 0 0Land improvements 0 0 0 0 0 0 0 0 0 0Total land 0 0 0 0 0 0 0 0 0 0Buildings 8,064 1,322 6,742 0 0 8,064 91 0 5,973 2,000Heritage buildings 0 0 0 0 0 0 0 0 0 0Building improvements 71 71 0 0 0 71 0 0 71 0Leasehold improvements 0 0 0 0 0 0 0 0 0 0Total buildings 8,135 1,393 6,742 0 0 8,135 91 0 6,044 2,000Total property 8,135 1,393 6,742 0 0 8,135 91 0 6,044 2,000Plant and equipmentHeritage plant and equipment 0 0 0 0 0 0 0 0 0 0Plant, machinery and equipment 1,917 0 1,917 0 0 1,917 646 0 1,271 0Fixtures, fittings and furniture 0 0 0 0 0 0 0 0 0 0Computers and telecommunications 1,274 933 341 0 0 1,274 0 0 1,274 0Library books 302 302 0 0 0 302 0 0 302 0Total plant and equipment 3,493 1,235 2,258 0 0 3,493 646 0 2,847 0InfrastructureRoads 3,239 135 1,665 834 605 3,239 786 0 2,453 0Bridges 6 0 6 0 0 6 0 0 6 0Footpaths and cycleways 411 20 391 0 0 411 0 0 411 0Drainage 1,137 50 437 398 252 1,137 171 0 966 0Recreational, leisure and community facilities 379 379 0 0 0 379 0 0 379 0Waste management 0 0 0 0 0 0 0 0 0 0Parks, open space and streetscapes 1,577 0 1,577 0 0 1,577 0 0 1,577 0Aerodromes 0 0 0 0 0 0 0 0 0 0Off street car parks 69 0 69 0 0 69 0 0 69 0
Local Government Better Practice GuideStrategic Resource Plan, 2017
25

Asset Expenditure Types Funding SourcesTotal New Renewal Expans-
ionUpgrade Total Grants Contrib-
utionsCouncil Cash
Borrow-ings
$’000 $’000 $’000 $’000 $’000 $’000 $’000 $’000 $’000 $’000Other infrastructure 84 84 0 0 0 84 0 0 84 0Total infrastructure 6,902 668 4,145 1,232 857 6,902 957 0 5,945 0Total capital works expenditure 18,530 3,296 13,145 1,232 857 18,530 1,694 0 14,836 2,000
26 Local Government Better Practice GuideStrategic Resource Plan, 2017

1. Summary of planned capital works expenditure (continued)
Asset Expenditure Types Funding SourcesTotal New Renewal Expans-
ionUpgrade Total Grants Contrib-
utionsCouncil Cash
Borrow-ings
$’000 $’000 $’000 $’000 $’000 $’000 $’000 $’000 $’000 $’0002021PropertyLand 0 0 0 0 0 0 0 0 0 0Land improvements 0 0 0 0 0 0 0 0 0 0Total land 0 0 0 0 0 0 0 0 0 0Buildings 7,550 590 6,960 0 0 7,550 690 0 6,860 0Heritage buildings 0 0 0 0 0 0 0 0 0 0Building improvements 66 66 0 0 0 66 0 0 66 0Leasehold improvements 0 0 0 0 0 0 0 0 0 0Total buildings 7,616 656 6,960 0 0 7,616 690 0 6,926 0Total property 7,616 656 6,960 0 0 7,616 690 0 6,926 0Plant and equipmentHeritage plant and equipment 0 0 0 0 0 0 0 0 0 0Plant, machinery and equipment 1,796 0 1,796 0 0 1,796 0 0 1,796 0Fixtures, fittings and furniture 0 0 0 0 0 0 0 0 0 0Computers and telecommunications 1,193 734 459 0 0 1,193 0 0 1,193 0Library books 282 282 0 0 0 282 0 0 282 0Total plant and equipment 3,271 1,016 2,255 0 0 3,271 0 0 3,271 0InfrastructureRoads 3,031 435 1,866 730 0 3,031 578 0 2,453 0Bridges 6 0 6 0 0 6 0 0 6 0Footpaths and cycleways 385 0 385 0 0 385 0 0 385 0Drainage 1,065 250 547 0 268 1,065 99 0 966 0Recreational, leisure and community facilities 355 355 0 0 0 355 0 0 355 0Waste management 0 0 0 0 0 0 0 0 0 0Parks, open space and streetscapes 1,476 0 1,476 0 0 1,476 0 0 1,476 0Aerodromes 0 0 0 0 0 0 0 0 0 0Off street car parks 65 0 65 0 0 65 0 0 65 0
Local Government Better Practice GuideStrategic Resource Plan, 2017
27

Asset Expenditure Types Funding SourcesTotal New Renewal Expans-
ionUpgrade Total Grants Contrib-
utionsCouncil Cash
Borrow-ings
$’000 $’000 $’000 $’000 $’000 $’000 $’000 $’000 $’000 $’000Other infrastructure 79 79 0 0 0 79 0 0 79 0Total infrastructure 6,462 1,119 4,345 730 268 6,462 677 0 5,785 0Total capital works expenditure 17,349 2,791 13,560 730 268 17,349 1,367 0 15,982 0
28 Local Government Better Practice GuideStrategic Resource Plan, 2017

2. Summary of planned human resources expenditure2018 2019 2020 2021
Asset management $’000 $’000 $’000 $’000-Permanent full time 2,000 2,080 2,142 2,228-Permanent part time 500 520 536 557Total asset management 2,500 2,600 2,678 2,785City services-Permanent full time 7,000 7,280 7,498 7,798-Permanent part time 200 208 214 222Total city services 7,200 7,488 7,712 8,020Community services-Permanent full time 7,000 7,280 7,510 7,810-Permanent part time 1,500 1,560 1,622 1,641Total community services 8,500 8,840 9,132 9,451Corporate services-Permanent full time 4,000 4,160 4,326 4,456-Permanent part time 400 416 428 446Total corporate services 4,400 4,576 4,754 4,902Culture and leisure-Permanent full time 5,000 5,200 5,408 5,570-Permanent part time 300 312 324 334Total culture and leisure 5,300 5,512 5,732 5,904Environment and amenity-Permanent full time 4,000 4,160 4,297 4,469-Permanent part time 1,000 1,040 1,082 1,114Total environment and amenity 5,000 5,200 5,379 5,583Total casuals and other 1,191 1,151 1,268 1,066Total staff expenditure 34,091 35,367 36,655 37,711
Asset management FTE FTE FTE FTE-Permanent full time 33.3 34.4 35.2 35.3-Permanent part time 8.3 8.5 8.6 8.7Total asset management 41.6 42.9 43.8 44.0City services-Permanent full time 116.7 119.0 121.4 122.0-Permanent part time 3.3 3.4 3.4 3.5Total city services 120.0 122.4 124.8 125.5Community services-Permanent full time 116.7 119.0 121.4 122.0-Permanent part time 25.0 25.5 26.0 26.2Total community services 141.7 144.5 147.4 148.2Corporate services-Permanent full time 66.7 68.0 69.4 69.7-Permanent part time 6.7 6.9 7.0 7.0Total corporate services 73.4 74.9 76.4 76.7Culture and leisure-Permanent full time 83.3 85.0 86.7 87.1-Permanent part time 5.0 5.1 5.2 5.2Total culture and leisure 88.3 90.1 91.9 92.3Environment and amenity-Permanent full time 66.7 68.1 69.4 69.7
Local Government Better Practice GuideStrategic Resource Plan, 2017
29

-Permanent part time 16.7 17.0 17.4 17.5Total environment and amenity 83.4 85.1 86.8 87.2Total casuals and other 19.9 10.3 2.3 1.1Total staff numbers 568.3 570.2 573.4 575.0
For the four years ended 30 June 2021
NOTE: This alternative model is provided for councils who wish to prepare a standalone strategic resource plan document. The Strategic Resource Plan (Model) should be attached as an appendix and the document included with the council plan
Table of contents
Background 29
Objectives of the plan 29
How the plan was developed 30
Assessment of council’s current financial position 30
Key assumptions 31
General operating 31
Service delivery 32
Other operating 33
General balance sheet 34
Other balance sheet 34
Capital works 35
Human resources 36
Victorian City Council – Strategic Resource Plan (alternative model)
30 Local Government Better Practice GuideStrategic Resource Plan, 2017

Option analysis 37
Higher cap option 37
Rate cap option (no changes to assumptions) 38
Rate cap option (changes to assumptions) 39
Outcomes 40
Financial 40
Non-financial 42
Achievement of SRP objectives 42
Appendix 43
Financial statements
Non-financial statements
Other information
Local Government Better Practice GuideStrategic Resource Plan, 2017
31

BackgroundThe Local Government Act 1989 (the Act) requires council to prepare a strategic resource plan (SRP) for at least the next four financial years that describes both the financial and non-financial resources required to achieve the strategic objectives in the council plan. In preparing the SRP, council must take into account services and initiatives contained in any plan adopted or proposed to be adopted by council.
Council has prepared a SRP for the four years 2017-18 to 2020-21 as part of its integrated planning framework as set out below.
The council plan includes the strategic objectives, strategies for achieving these for at least the next four years and strategic indicators for monitoring achievement of the strategic objectives. The SRP is a plan of the resources for at least the next four years required to achieve the strategic objectives in the council plan. The SRP informs the preparation of the budget, which is a plan that describes the services and initiatives to be funded and how they will contribute to achieving the strategic objectives in the council plan.
Objectives of the planThe overall objective of the SRP is financial sustainability in the medium to long term, while still providing sufficient resources to achieve the council plan strategic objectives. The key objectives which underpin the SRP over the next four years are:
achieve a breakeven adjusted underlying result achieve a balanced budget on a cash basis maintain existing service levels meet council’s asset renewal requirements reduce debt to a low to moderate level to allow capacity to fund future infrastructure.
32 Local Government Better Practice GuideStrategic Resource Plan, 2017

In preparing the SRP, council has also been mindful of the need to comply with the principles of sound financial management in the Act which requires council to:
prudently manage financial risks relating to debt, assets and liabilities provide reasonable stability in the level of rate burden consider the financial effects of council decisions on future generations provide full, accurate and timely disclosure of financial information.
How the plan was developedThis SRP has been developed through a rigorous process and is based on the following key information:
audited financial statements as at 30 June 2016 assumptions provided by council service providers about changes in future income
and expenditure assumptions provided by council capital works expenditure providers about
requirements for future asset renewal, expansion, upgrade and new assets assumptions provided by finance regarding future changes in assets, liabilities and
equity information provided by the executive management team and council.
The financial projections included in the SRP have been developed using a ‘four-way’ budget model. This methodology is a computer based model, which enables the linking of the comprehensive income statement, balance sheet, statement of cash flows and statement of capital works.
Assessment of council’s current financial positionAn assessment has been undertaken of the council’s current financial position to identify any significant matters which may impact on the SRP. A summary of the budgeted and forecast financial results for the 2016-17 year are in the following table.
Result
Adopted Budget2017$’000
ForecastActual2017$’000
VarianceFav/(Unfav)$’000
Surplus/(deficit) for the year 1,475 (1,922) (3,397)
Cash and investments 17,946 23,476 5,530
Local Government Better Practice GuideStrategic Resource Plan, 2017
33

Capital works expenditure 29,747 22,617 7,130
A deficit of $1.92 million is forecasted to be achieved, compared with an original budgeted surplus of $1.48 million. The forecast $3.40 million unfavourable variance is primarily due to 50 percent of the 2016-17 financial assistance grants being received in the 2015-16 year. This unfavourable variance has been partially offset by higher developer contributions and additional supplementary rates.
Cash and investments is forecast to be $23.48 million compared with an original budget of $17.95 million. The forecast $5.53 million favourable variance is primarily due to $7.13 million of capital works expenditure which is forecast to be incomplete at the end of the 2016-17 year and will be carried forward for completion in the 2017-18 year.
Capital works expenditure is forecast to be $22.62 million compared with an original budget of $29.75 million. The forecast $7.13 million favourable variance is due to incomplete works forecast to be carried forward to the 2017-18 year for completion.
Significant matters arising from the assessment of council’s current financial position, which are expected to impact on the SRP includes:
the receipt of capital grants of $6.28 million for the construction of a Velodrome and State Bowls Centre at Victoria Park and the completion of Roads to Recovery projects
the writing down of flood and fire affected assets by $1.00 million and repairs of $1.20 million which will be required over the next two years. Compensation of $0.40 million has been confirmed by council’s insurers, with the balance to be funded by the Natural Disaster Assistance Fund (NDAF). An advance payment of $1.00 million from the NDAF has been received and council is also eligible to claim the first $0.03 million from the Victoria Grants Commission
removal of severely diseased street trees has resulted in an overrun of $0.48 million in the budget for tree maintenance
capital works expenditure totalling $7.13 million will be carried forward for completion in the 2017-18 year.
In addition to the above matters, the Victorian Government has legislated that local government rates be capped from the 2016-17 year. The rate cap for the 2017-18 year as set by the Minister for Local Government is 2.0 percent. Depending on the level at which rates are capped in future years, Council may need to review the level of services and capital works expenditure which are delivered in future years and/or apply for a higher cap.
Key assumptionsThere are a number of assumptions underlying the forecasts for income, expenditure, assets, liabilities, equity, cash, capital works expenditure and human resources included in the SRP. These assumptions have been derived from the following sources:
assessment of the current financial position scan of the external economic environment
34 Local Government Better Practice GuideStrategic Resource Plan, 2017

forecast changes in population and demographics advice from officers responsible for service and capital works planning and delivery services and initiatives contained in plans adopted or proposed to be adopted by
council.
The key assumptions underlying the SRP are set out below.
General operatingThe general assumptions affecting all operating income and expenditure are included the following table.
2018 2019 2020 2021
% % % %
Consumer Price Index 2.0 2.25 2.5 2.5
Rate cap 2.0 2.25 2.5 2.5
Property growth 1.0 0.8 0.6 0.6
Wages growth 3.5 3.5 3.5 3.5
Grants (operating) 1.5 1.75 2.0 2.0
Statutory fees 1.5 1.75 2.0 2.0
Investment return 3.5 3.0 2.5 2.5
Consumer price indexThe annual consumer price index (CPI) for the March 2017 quarter for Melbourne was 2.5 percent (ABS release 26 April 2017). The state-wide CPI is forecast to be 2.0 percent in 2017-18, 2.25 percent in 2018-19 and 2.5 percent for the remaining two years of the outlook period (Victorian State Government Budget Papers for 2017-18). For the purposes of developing the SRP, CPI has been set at 2.0 percent for the 2017-18 year and rates consistent with the Victorian Budget Papers for all remaining years and applied to all income and expense types with the exception of those specifically identified in the above table.
Rate capThe Victorian Government requires local government rates to be capped from 2016-17 onwards. The cap for the 2017-18 year is 2.0 percent and for the forecast period figures have been based on the state-wide CPI projections.
Local Government Better Practice GuideStrategic Resource Plan, 2017
35

Property growthThe municipality is expected to continue growing over the four-year period based on current trends in property development including the effects of major property developments at the two former psychiatric hospital sites. The population growth rate has been forecast to decline from 1.0 percent to 0.6 percent over the next three years as these developments are completed.
Wages growthThe collective wage agreement has been finalised and applies to wage rate changes for the next three years commencing 1 July 2017. The wages growth in the SRP is based on a 3.5 percent increase per annum.
Grants (operating)Council receives approximately $14.00 million annually in operating grants from State and Commonwealth sources for the purposes of funding the delivery of services to ratepayers. This includes $4.69 million for the 2017-18 year in financial assistance grants. Future increases in operating grants excluding financial assistance grants have been set at CPI minus 0.5 percent in all years.
Statutory feesCouncil raises approximately $3.00 million in fees and fines, which are imposed in line with legislation governing local government activities such as animal registrations and parking fines. Future increases in statutory fees have been set at CPI minus 0.5 percent in all years.
Investment returnThe official cash rate is now 1.5 percent, following four decreases of 0.25 percent by the Reserve Bank since February 2015. In the most recent Statement on Monetary Policy in February 2017, the Reserve Bank Governor noted that ‘Inflation is expected to increase as the effects of some factors that have been weighing on domestic cost pressures dissipate…’. Council has set its investment return at 3.5 percent in 2017-18 declining to 2.5 percent from 2019-20 onwards.
Service deliveryThe assumptions affecting specific services provided by council are set out below.
Transfer stationWaste tipping fees for inert waste are expected to increase as the Victorian Government continues to increase the levy payable upon disposal of waste at landfill. Following increases of $53.33 per tonne since 2008-09, the fee will rise a further $1.24 per tonne (2.3 percent) in 2017-18. The financial impact will be to increase tipping fee costs at the Transfer Station from $0.36 million in 2016-17 to $0.46 million in 2017-18. Similar increases are forecast in future years. The pricing structure currently in place for Transfer Station users will be adjusted to absorb all future cost increases.
36 Local Government Better Practice GuideStrategic Resource Plan, 2017

Residential garbage collectionWaste tipping charges associated with the disposal of residential garbage and growth in the number of tenements (1,000 pa over the four-year period) are expected to result in an increase of $0.03 million per annum excluding CPI. Increases in the landfill levy will also increase the cost of residential garbage disposal by $0.18 million in the 2017-18 financial year with similar increases forecast in future years.
Kerbside collection – recyclingThe contract for collection of recyclable waste expires on 30 June 2017. It is expected that the cost of this service will increase from $1.20 million to $1.40 million following re-tender in 2017-18 due to growth in the number of tenements. Future increases have been set at CPI.
Aged and disabilityGovernment funding for aged and disability services is expected to increase by approximately $0.14 million from 2017-18. This includes domestic care, personal care, respite care and meals.
Property valuationCouncil is required to revalue all properties within the municipality every two years. The last general revaluation was carried out as at 1 January 2016 effective for the 2017/18 year and the next revaluation will be undertaken as at 1 January 2018. An allowance of $0.10 million has been made every two years commencing in 2017-18 to meet the additional cost of resources to complete the revaluation process.
Animal managementThe contract for the provision of animal management expired on 1 January 2017 and is currently being renegotiated. It is expected that the cost of this service will rise from $0.36 million to $0.50 million per annum reflecting the forecast property growth. This will be partially offset by increases in registration fees of 0.5 percent above CPI or $0.06 million per annum in 2017-18.
Statutory planningThe statutory planning unit has been growing significantly over the past three years as the level of property development activity has increased. It is expected that the 2016-17 budget will be insufficient to meet the demand for processing property applications and an increase of $0.05 million per annum has been allowed from 2017-18 onwards.
Other operatingOther assumptions affecting operating income and expenditure which cannot be directly attributed to specific services are included the following table.
Local Government Better Practice GuideStrategic Resource Plan, 2017
37

2018$’000
2019$’000
2020$’000
2021$’000
Supplementary rates 500 450 400 400Developer contributions (cash) 51 471 370 350Developer contributions (non-cash)
0 0 0 0
Financial assistance grants 6,779 6,207 6,207 6,207Grants (capital) 6,277 9,407 1,694 1,367Asset sales (proceeds) 3,741 2,018 2,036 2,054
Supplementary ratesThe municipality is expected to continue growing over the four-year period based on current trends in property development including the effects of major property developments at the two former psychiatric hospital sites. The growth rate has been forecast to decline from 1.0 percent to 0.6 percent over the forecast period as these development are completed. This will contribute an additional $0.50 million in rate revenue in the 2017-18 year, reducing to $0.40 million from 2019-20 onwards.
Developer contributions (cash)Contributions are levied on developers for the purpose of offsetting future costs associated with the creation of open space and new community infrastructure. Based on the forecast property growth, the level of contributions is expected to be $0.05 million in 2017-18 increasing to $0.47 million in 2018-19 and then to around $0.40 million from 2019-20 onwards.
Developer contributions (non-cash)From time to time council receives infrastructure assets from developers at no cost which are recognised as income in the comprehensive income statement. This normally occurs following the completion of a property development, where the developer agrees to construct the required infrastructure including roads, footpaths and drains. At the conclusion of the development, these assets are handed over to council. It is expected that council will receive infrastructure assets during the four-year period as the major property developments at the two former psychiatric hospital sites are completed. As the value of assets cannot be reliably measured at this time no allowance has been made. However, the value of the assets could be in the order of $2.00 million to $3.00 million which may significantly impact future operating results.
Financial assistance grantsCouncil’s financial assistance grant allocation has been decreasing by around $0.30 million per annum due mainly to recent significant increases in council’s municipal property values relative to other Victorian councils. While the initial allocation for the 2017-18 year of $6.78 million is higher than expected, future allocations have been set based on the Victoria Grants Commission’s current transitional arrangements. These arrangements limit the annual decreases using a capping arrangement, with the minimum level expected to be reached in 2018-19.38 Local Government Better Practice Guide
Strategic Resource Plan, 2017

Grants (capital)Council receives both recurrent and non-recurrent government funding for capital works projects. Significant capital grants will be received in the 2017-18 and 2018-19 years to fund the construction of the Velodrome and State Bowls Centre at Victoria Park. Capital grants will reduce to more normal levels from the 2019-20 year reflecting the expected level of Roads to Recovery grants.
Asset sales (proceeds)Council has in the past disposed of surplus assets to partially fund its capital needs as well as replace existing light and heavy vehicle fleet in accordance with the plant replacement program. An amount of $3.74 million has been forecast in 2017-18 for the expected proceeds arising from the sale of surplus land and the plant replacement program. This is expected to reduce to around $2.00 million per annum in later years reflecting the normal plant replacement activity.
General balance sheetThe general assumptions affecting assets, liabilities and equity balances are set out below:
98.5 percent of the total rates and charges raised, is expected to be collected trade creditors is based on total capital and operating expenditure less written down
value of assets sold, depreciation and employee costs. The payment cycle is 30 days other debtors and creditors are expected to remain consistent with 2016-17 levels employee entitlements have increased in accordance with the collective wage
agreement outcome offset by the impact of more active management of leave entitlements of staff.
Other balance sheetThe assumptions affecting specific balance sheet items is set out below.
BorrowingsIn developing the SRP, borrowings were identified as an important funding source for capital works expenditure. Council has traditionally not borrowed to finance large infrastructure projects with the most recent borrowing being used to pay out council’s unfunded defined benefit superannuation obligation. This has resulted in a reduction in debt levels and servicing costs, but has meant that cash and investment reserves have been used as an alternate funding source for the capital works expenditure program. It has been necessary to reconsider the issue of borrowings due to council reserves forecast to be $13.15 million at 30 June 2017, followed by a significant reduction in 2017-18 to complete current infrastructure works in progress.
Local Government Better Practice GuideStrategic Resource Plan, 2017
39

Council has analysed its debt position against both Victorian council state and similar council averages over a number of different indicators including the ‘obligations’ indicators that are part of the prescribed Local Government Performance Reporting Framework (LGPRF) indicators. The outcome of the analysis highlighted that a debt of $8.00 million could be comfortably accommodated. Council has set a goal of reducing debt to below $4.00 million by 2020-21 to allow spare debt capacity for future major projects.
The following table summarises the level of forecast borrowings for the next four years.
YearNew Borrowings Principal Interest
Balance30 June
$’000 $’000 $’000 $’0002018 0 1,161 312 4,8872019 0 1,161 247 3,726
2020 2,000 1,161 410 4,5652021 0 1,290 340 3,275
Capital worksThe assumptions affecting asset renewal, expansion, upgrade and new assets are set out below.
Asset renewalCouncil has developed an infrastructure strategy based on the knowledge provided by asset management plans, which set out the capital expenditure requirements of Council for the next 10 years by class of asset. The strategy predicts infrastructure consumption, renewal needs and other infrastructure needs to meet future community service expectations. A key objective of the strategy is to renew existing assets in line with asset management plans to ensure they are maintained at the desired condition levels. If sufficient funds are not allocated to asset renewal then council’s investment in those assets will reduce, along with the capacity to maintain delivery of services to the community. The graph below sets out the required and actual asset renewal over the life of the current SRP and the renewal backlog.
Year
TotalCapital
Summary of funding sources
Program Grants Contributions Council Cash Borrowings$’000 $’000 $’000 $’000 $’000
2018 30,717 6,277 0 24,440 02019 23,242 9,407 0 13,835 02020 18,530 1,694 0 14,836 2,0002021 17,349 1,367 0 15,982 0
40 Local Government Better Practice GuideStrategic Resource Plan, 2017

2018 2019 2020 20210
2,000
4,000
6,000
8,000
10,000
12,000
14,000
16,000
18,000
20,000
Renewal required Renewal program Backlog
$'00
0
While council is endeavouring to provide a sufficient level of annual funding to meet the ongoing asset renewal needs, the above graph indicates that in later years the required asset renewal is not being addressed creating an asset renewal gap and increasing the level of backlog. Backlog is the renewal works that council has not been able to fund over the past years and is equivalent to the accumulated asset renewal gap. At the beginning of the 2017-18 year the backlog is expected to be $5.00 million rising to $6.62 million by the end of the 2020-21 year. Council has committed to increasing the level of asset renewal funding over the next 10 years to close the renewal gap and address the backlog.
Capital expenditure programIn developing the capital expenditure program for the next four years, the following matters have had a significant impact:
reduction in the amount of cash and investment reserves available to fund future capital expenditure programs
environmental issues at the Victoria Park Lake resulting in the bringing forward of future planned expenditure
availability of significant Commonwealth funding for the upgrade of roads decision by the Victorian Government to award council with construction of a
Velodrome and Lawn Bowls Centre
Local Government Better Practice GuideStrategic Resource Plan, 2017
41

new building regulations requiring all child care centres to be immediately upgraded to ensure compliance
the need to close the renewal gap and address the backlog.
The following table summarises the forecast capital works expenditure including funding sources for the next four years.
Human resourcesThe assumptions affecting the level of human resources are set out in the following table.
2018 2019 2020 2021
Employee cost growth (%) 3.5 3.5 3.5 3.5
Employee numbers growth (FTE) 3.9 1.9 3.2 1.6
Employee costsThe collective wage agreement has been finalised and applies to wage rate changes for the next three years commencing 1 July 2017. The employee cost growth in the SRP is based on a 3.5 percent increase per annum and planned increases in employee numbers.
Employee numbersA key objective of the SRP is maintaining existing service levels, however this needs to be balanced against the introduction of rate capping from the 2016-17 year onwards which will result in downward pressure being placed on employee costs. Staff numbers are forecast to increase only marginally over the four-year period from 568 FTE to 575 FTE. This level of growth is a reduction in real terms when compared to forecast property growth and the associated increase in service demand over the same period.
Option analysisIn order to achieve the overall objective of the SRP, it was necessary to model a number of different options by changing the assumptions underlying the SRP forecasts. In undertaking the option analysis, council considered the following two options: higher cap option (i.e. a rate increase above the rate cap) rate cap option.
Higher cap optionThe following table sets out the key assumptions underlying the higher cap option.
Assumptions 2018 2019 2020 2021General rates increase (%) 3.9 3.5 3.5 3.5
Operating budget savings ($’000) 0 0 0 0Capital works expenditure ($’000) 31,220 24,140 19,857 19,136
Borrowings ($’000) 0 0 2,000 0Asset sales ($’000) 3,741 2,018 2,036 2,054
42 Local Government Better Practice GuideStrategic Resource Plan, 2017

The following table and graph summarise the key financial outcomes for the next four years for the higher cap option.
Result2018 2019 2020 2021 Trend
$’000 $’000 $’000 $’000 +/o/-
Adjusted underlying result (4,453) (3,630) (2,948) (2,397) +
Net (cost) of services (41,967) (43,633) (44,851) (46,551) +
Net increase/(decrease) in cash (11,269) 221 348 252 +
Asset renewal 17,454 16,326 13,927 14,847 o
Borrowings 4,887 3,726 4,565 3,275 +
Key to Forecast Trend:
+ Forecasts improvement in council's financial performance/financial position indicator o Forecasts that council's financial performance/financial position indicator will be steady - Forecasts deterioration in council's financial performance/financial position indicator
2018 2019 2020 2021
-15,000
-10,000
-5,000
0
5,000
10,000
15,000
20,000
Adjusted underlying result Net change in cashAsset renewal Borrowings
$'00
0
Under the higher cap option, all of the key financial results with the exception of asset renewal are forecast to improve over the four-year period indicating that the overall SRP objective of financial sustainability in the medium to long term is being met. While asset renewal is declining until 2019-20 it begins to improve thereafter.
Rate cap option (no changes to key assumptions)The following table sets out the key assumptions for the rate cap option. For this option the key assumptions remain unchanged from the higher cap option other than rates.
Assumptions 2018 2019 2020 2021General rates increase (%) 2.0 2.25 2.5 2.5Operating budget savings ($’000) 0 0 0 0
Capital works expenditure ($’000) 31,220 24,140 19,857 19,136
Local Government Better Practice GuideStrategic Resource Plan, 2017
43

Borrowings ($’000) 0 0 2,000 0
Asset sales ($’000) 3,741 2,018 2,036 2,054
The following table and graph summarise the key financial outcomes for the next four years for the rate cap option with no change to key assumptions other than rates.
Result2018 2019 2020 2021 Trend
$’000 $’000 $’000 $’000 +/o/-
Adjusted underlying result (4,956) (4,528) (4,275) (4,184) o
Net (cost) of services (41,967) (43,633) (44,851) (46,551) +
Net increase/(decrease) in cash (11,772) -677 -979 -1,535 -
Asset renewal 17,454 16,326 13,927 14,847 o
Borrowings 4,887 3,726 4,565 3,275 +
Key to Forecast Trend:
+ Forecasts improvement in council's financial performance/financial position indicator o Forecasts that council's financial performance/financial position indicator will be steady - Forecasts deterioration in council's financial performance/financial position indicator
44 Local Government Better Practice GuideStrategic Resource Plan, 2017

2018 2019 2020 2021
-15,000
-10,000
-5,000
0
5,000
10,000
15,000
20,000
Adjusted underlying result Net change in cashAsset renewal Borrowings
$'00
0
Under this rate cap option, the key financial results with the exception of cash are forecast to improve or remain stable over the four-year period. However, the change in cash is forecast to be an increasing deficit over the four-year period indicating that the overall SRP objective of financial sustainability in the medium to long term is not being met.
Rate cap option (changes to key assumptions)The following table sets out the key assumptions for a second rate cap option. For this option the key assumptions of operating budget savings and capital works expenditure have been changed to achieve the overall objective of the SRP.
Assumptions 2018 2019 2020 2021General rates increase (%) 2.0 2.25 2.5 2.5Operating budget savings ($’000) 500 500 500 500
Capital works expenditure ($’000) 30,717 23,242 18,530 17,349Borrowings ($’000) 0 0 2,000 0
Asset sales ($’000) 3,741 2,018 2,036 2,054
The following table and graph summarise the key financial outcomes for the next four years for the rate cap option with changes made to the key assumptions to achieve the overall objective of the SRP.
Result2018 2019 2020 2021 Trend
$’000 $’000 $’000 $’000 +/o/-
Adjusted underlying result (4,453) (3,630) (2,948) (2,397) +
Net (cost) of services (41,967) (43,233) (44,451) (46,151) o
Net increase/(decrease) in cash (11,269) 221 348 252 o
Asset renewal 17,454 15,928 13,145 13,560 -
Borrowings 4,887 3,726 4,565 3,275 +
Local Government Better Practice GuideStrategic Resource Plan, 2017
45

Key to Forecast Trend:
+ Forecasts improvement in Council's financial performance/financial position indicator o Forecasts that Council's financial performance/financial position indicator will be steady - Forecasts deterioration in Council's financial performance/financial position indicator
2018 2019 2020 2021
-15,000-10,000
-5,0000
5,00010,00015,00020,000
Adjusted underlying result Net change in cashAsset renewal Borrowings
$'00
0
Under this rate cap option, all of the key financial results with the exception of asset renewal are forecast to remain stable or improve over the four-year period indicating that the overall SRP objective of financial sustainability in the medium to long term is being met. While asset renewal is declining until 2019-20 it begins to improve thereafter.
OutcomesBased on the option analysis in the previous section, council has decided to select as its preferred option, the rate cap option with changes made to the key assumptions to achieve the overall objective of the SRP. The following is a detailed analysis of this preferred option which is the SRP adopted by council for the 2017-21 years.
FinancialThe following financial results, graph and indicators summarise the key financial outcomes for the next four years as set out in the SRP for the 2017-21 years. The attached Appendix includes the financial statements and other financial disclosures required by the Act and regulations.
Result2018 2019 2020 2021 Trend
$’000 $’000 $’000 $’000 +/o/-
Adjusted underlying result (4,453) (3,630) (2,948) (2,397) +
Net (cost) of services (41,967) (43,233) (44,451) (46,151) o
Net increase/(decrease) in cash (11,269) 221 348 252 o
Asset renewal 17,454 15,928 13,145 13,560 -
Borrowings 4,887 3,726 4,565 3,275 +Key to Forecast Trend:
+ Forecasts improvement in council's financial performance/financial position indicator o Forecasts that council's financial performance/financial position indicator will be steady - Forecasts deterioration in council's financial performance/financial position indicator
46 Local Government Better Practice GuideStrategic Resource Plan, 2017

2018 2019 2020 2021
-15,000
-10,000
-5,000
0
5,000
10,000
15,000
20,000
Adjusted underlying result Net change in cashAsset renewal Borrowings
$'00
0
Local Government Better Practice GuideStrategic Resource Plan, 2017
47

Indicator / Measure / [Computation] 2018 2019 2020 2021Trend +/o/-
Operating position
Adjusted underlying result[Adjusted underlying surplus (deficit) / Adjusted underlying income]
(6.2%) (4.9%) (3.8%) (3.0%) +
Liquidity
Working capital[Current assets / current liabilities]
139.4% 139.7% 139.6% 139.7% o
Unrestricted cash[Unrestricted cash / current liabilities]
88.7% 95.9% 96.1% 96.3% o
Obligations
Loans and borrowings[Interest bearing loans and borrowings / rate revenue]
11.2% 8.1% 9.4% 6.4% +
Loans and borrowings[Interest and principal repayments on interest bearing loans and borrowings / rate revenue]
3.4% 3.0% 3.2% 3.2% +
Indebtedness[Non-current liabilities / own source revenue]
8.2% 6.0% 6.9% 4.7% +
Asset renewal[Asset renewal expenses / asset depreciation]
120.4% 104.9% 83.5% 83.3% -
Stability
Rates concentration[Rate revenue / adjusted underlying revenue]
60.3% 62.0% 63.0% 63.7% -
Rates effort[Rate revenue / CIV of rateable properties in the municipality]
0.4% 0.4% 0.4% 0.5% o
Efficiency
Expenditure level[Total expenses/ no. of property assessments]
$1,340 $1,355 $1,377 $1,406 +
Revenue level[Residential rate revenue / No. of residential property assessments]
$650 $678 $706 $735 +
Workforce turnover[No. of permanent staff resignations & terminations / average no. of permanent staff for the financial year]
8.8% 8.4% 8.0% 7.6% +
Key to Forecast Trend:
+ Forecasts improvement in council's financial performance/financial position indicator o Forecasts that council's financial performance/financial position indicator will be steady - Forecasts deterioration in council's financial performance/financial position indicator
48 Local Government Better Practice GuideStrategic Resource Plan, 2017
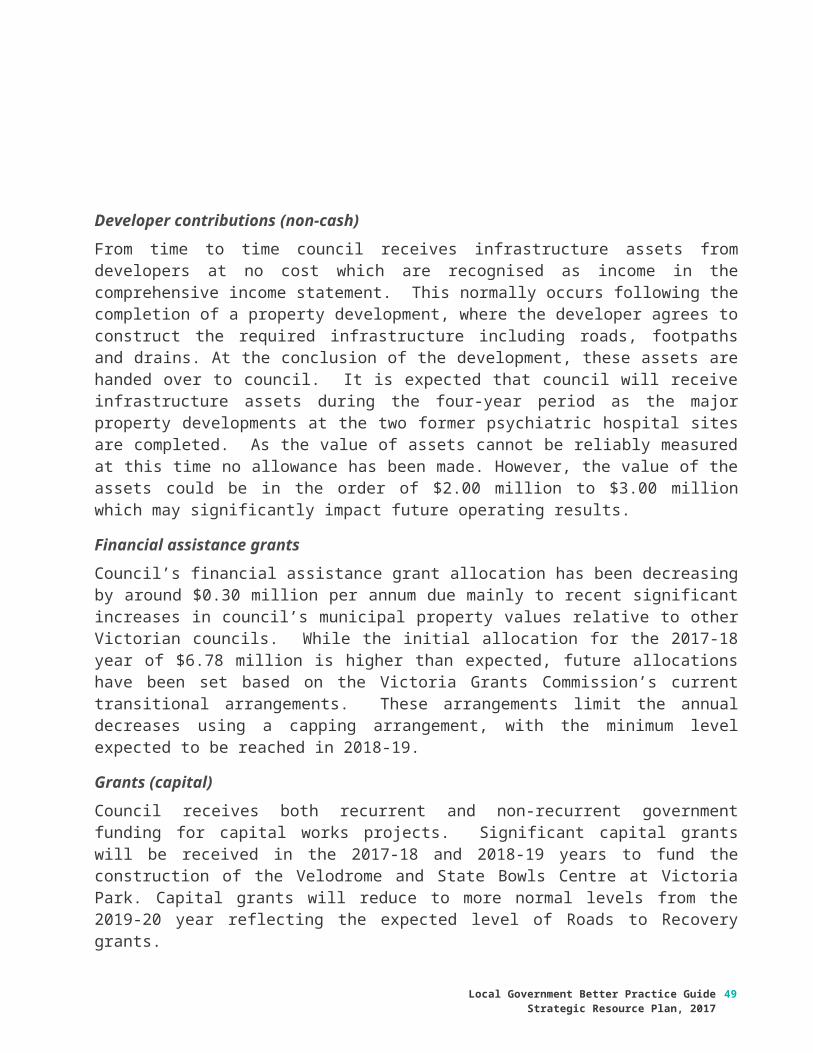
Non-financialThe following table summarises the key non-financial outcomes for the next four years as set out in the SRP for years 2017-21 years. The attached Appendix includes the non-financial statements and other non-financial disclosures required by the Act and Local Government (Planning and Reporting) Regulations 2014.
Result 2018 2019 2020 2021 Trend +/o/-
Employee costs - Operating ($’000) 34,091 35,367 36,655 37,711 -
Employee numbers (FTE) 568.3 570.2 573.4 575.0 o
Key to Forecast Trend:
+ Forecasts improvement in council's financial performance/financial position indicator o Forecasts that council's financial performance/financial position indicator will be steady - Forecasts deterioration in council's financial performance/financial position indicator
Achievement of SRP objectivesThe overall objective of the SRP is financial sustainability in the medium to long term, while still providing sufficient resources to achieve the council plan strategic objectives. The financial outcomes of the SRP are set out below under each of the key objectives which underpin the SRP over the next four years.
1. Achieve a breakeven adjusted underlying result (objective: not achieved)The adjusted underlying result is a deficit reducing over the four-year period. A breakeven result is not expected until 2022-23 (measure: adjusted underlying result).
2. Maintain existing service levels (objective: achieved)Service levels have been maintained throughout the four-year period after allowing for the impact of inflation and other cost indexation (measure: net cost of services and expenditure level).
3. Achieve a balanced budget on a cash basis (objective: achieved)The net change in cash is forecast to be marginally positive in years two to four, which indicates a balanced budget on a cash basis in those years (measure: net change in cash and unrestricted cash).
4. Meet council’s asset renewal requirements (objective: not achieved)Asset renewal remains below the target of 100 percent of depreciation in years three and four but at a stable level. The 100% target is not expected to be reached until 2025-26. (measure: asset renewal).
Local Government Better Practice GuideStrategic Resource Plan, 2017
49

5. Reduce debt to a low to moderate level to allow capacity to fund future infrastructure (objective: achieved)A small amount of debt is forecast to be drawn down in 2019-20 however, the level of debt is declining over the four-year period with total debt at just over 6 percent of rates and charges (Measure: loans and borrowings).
Overall the SRP shows that council is financially sustainable in the medium to long term, while still providing sufficient resources to achieve the council plan strategic objectives.
NOTE: Strategic Resource Plan (Model) are to be included in this appendix.
Term Definition
Act means the Local Government Act 1989
Annual report means a report of the council’s operations of the previous financial year and contains a report of operations, audited financial statements and an audited performance statement
Asset expansion expenditure
means expenditure that extends the capacity of an existing asset to provide benefits to new users at the same standard as is provided to existing beneficiaries
Asset expenditure type
means the following types of asset expenditure:(a) asset renewal expenditure;(b) new asset expenditure;(c) asset upgrade expenditure;(d) asset expansion expenditure
Asset renewal expenditure
means expenditure on an existing asset or on replacing an existing asset that returns the service capability of the asset to its original capability
Asset upgrade expenditure
means expenditure that:(a) enhances an existing asset to provide a higher level of service; or(b) increases the life of the asset beyond its original life
Australian Accounting Standards (AASB)
means the accounting standards published by the Australian Accounting Standards Board
Average rate cap means an amount expressed as a percentage amount, based on the change to CPI over the financial year to which the cap relates, plus or minus any adjustment
Budget means a plan setting out the services and initiatives to be funded for the financial year and how they will contribute to achieving the strategic objectives specified in the council plan
50 Local Government Better Practice GuideStrategic Resource Plan, 2017
Appendix
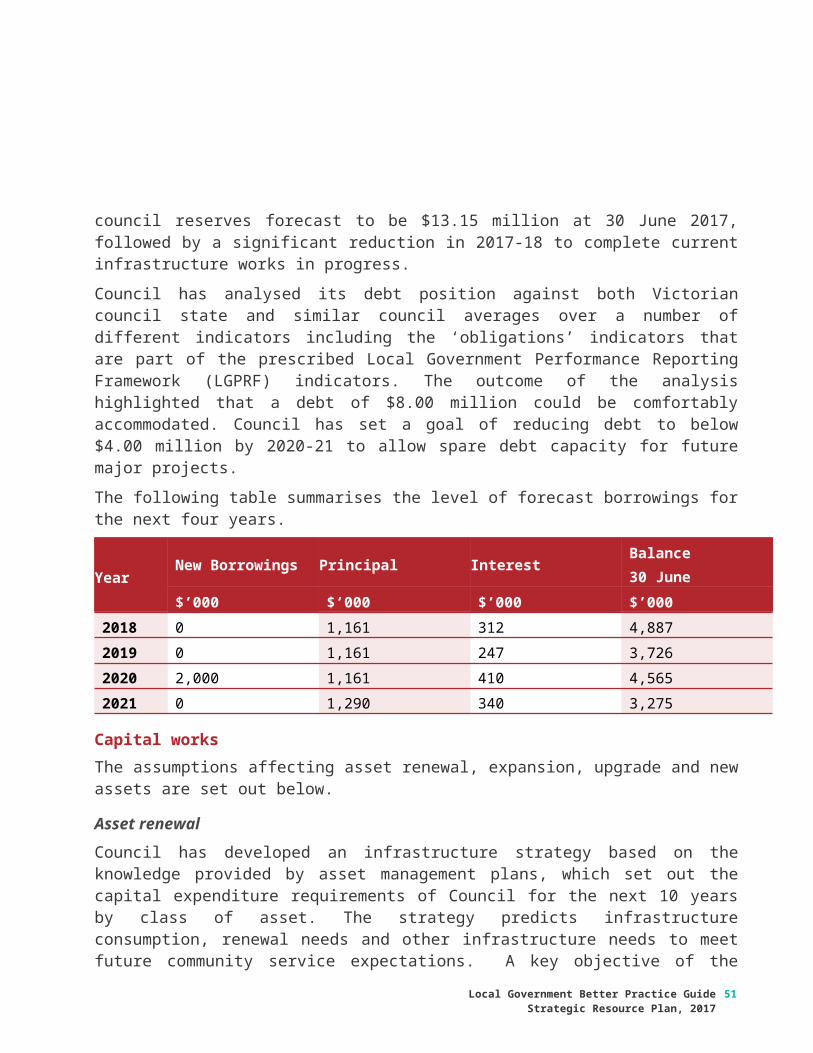
Capital works expenditure
means expenditure on non-current assets and includes new assets, asset renewal, asset expansion and asset upgrade
Council plan means a plan setting out the medium-term strategic objectives, strategies, strategic indicators and resources reflecting vision and aspirations of the community for the next four years
Financial resources means income, expenditure, assets, liabilities, equity, cash and capital works required to deliver the services and initiatives in the budget
Financial statements
means the financial statements and notes prepared in accordance with the Local Government Model Financial Report, Australian Accounting Standards and other applicable standards as they apply to the general purpose financial reports and a statement of capital works and included in the annual report
Financial year means the period of 12 months ending on 30 June each year
General order means an order made by the Minister under section 185D of the Act
Higher cap means an amount expressed as the average rate cap specified in a general order plus an additional percentage amount in respect of that financial year
Human resources means the staff employed by a council
Indicator means what will be measured to assess performance
Initiatives means actions that are one-off in nature and/or lead to improvements in service
Local Government Model Financial Report
means the model report published by the Department of Environment, Land, Water and Planning
Major initiatives means significant initiatives that will directly contribute to the achievement of the council plan during the current year and have a major focus in the budget
Minister means the Minister for Local Government
Model budget means the Victorian City Council Model Budget prepared annually by the Chartered Accountants in Australia and New Zealand
New asset expenditure
means expenditure that creates a new asset that provides a service that does not currently exist
Non-financial resources
means the resources other than financial resources required to deliver the services and initiatives in the budget
Local Government Better Practice GuideStrategic Resource Plan, 2017
51

Non-recurrent grant means a grant obtained on the condition that it be expended in a specified manner and is not expected to be received again during the period covered by a council’s strategic resource plan
Planning and accountability framework
means the key statutory planning and reporting documents that are required to be prepared by councils to ensure accountability to local communities in the performance of functions and exercise of powers under the Act
Performance statement
means a statement including the results of the prescribed service outcome indicators, financial performance indicators and sustainable capacity indicators for the financial year and included in the annual report
Recurrent grant means a grant other than a non-recurrent grant
Regulations means the Local Government (Planning and Reporting) Regulations 2014
Report of operations means a report containing a description of the operations of the council during the financial year and included in the annual report
Services means assistance, support, advice and other actions undertaken by a council for the benefit of the local community
Special order means an order made by the ESC under section 185E of the Act
Statement of capital works
means a statement which shows all capital expenditure of a council in relation to non-current assets and asset expenditure type prepared in accordance to the model statement of capital works in the Local Government Model Financial Report
Strategic objectives means the outcomes a council is seeking to achieve over the next four years and included in the council plan
Strategic resource plan
means a plan of the financial and non-financial resources for at least the next four years required to achieve the strategic objectives in the council plan. Is also referred to as a long term financial plan
Strategies means high level actions directed at achieving the strategic objectives in the council plan
Statement of human resources
means a statement which shows all council staff expenditure and numbers of full time equivalent council staff
Statements of non-financial resources
means a statement which describes the non-financial resources including human resources
Summary of planned capital works expenditure
means a summary of capital works expenditure in relation to non-current assets classified according to the model statement of capital works in the Local Government Model Financial Report, by asset expenditure type and funding source
Summary of planned human resources expenditure
means a summary of permanent council staff expenditure and numbers of full time equivalent council staff categorised according to the organisational structure of the council
52 Local Government Better Practice GuideStrategic Resource Plan, 2017

Chartered Accountants Australia and New Zealand (2017), Victorian City Council Model Budget 2017-2018, http://www.finpro.org.au/2017/02/model-budget-201718/
Department of Environment, Land, Water and Planning (2017), Local Government Better Practice Guide 2016-17 Model Financial Report, State of Victoria, http://www.localgovernment.vic.gov.au/strengthening-councils/sector-guidance-planning-and-reporting
Department of Environment, Land, Water and Planning (2017), Local Government Better Practice Guide 2016-17 Performance Reporting Framework Indicator Workbook, State of Victoria, http://www.localgovernment.vic.gov.au/strengthening-councils/sector-guidance-planning-and-reporting
Department of Environment, Land, Water & Planning (2017), Local Government Better Practice Guide 2017 Strategic Resource Plan Template, http://www.localgovernment.vic.gov.au/strengthening-councils/sector-guidance-planning-and-reporting
Department of Victorian Communities (2006), Local Government: Accounting for non-current physical assets under AASB 116: A Guide, http://www.localgovernment.vic.gov.au/strengthening-councils/procurement/financial-and-asset-management
i Victorian Auditor-General’s Office (2016), Local Government: 2015-16 Audit Snapshotii Section 3C(1) of the Local Government Act 1989iii Section 1(1) of the Local Government Act 1989iv Section 1(4) of the Local Government Act 1989v Section 1(5) of the Local Government Act 1989vi Section 125 of the Local Government Act 1989vii Section 126 of the Local Government Act 1989viii Section 127 of the Local Government Act 1989ix Section 131 of the Local Government Act 1989x Section 126(1) of the Local Government Act 1989xi Section 126(2)(a) of the Local Government Act 1989xii Section 126(2)(b) of the Local Government Act 1989xiii Section 126(2A) and (2B) of the Local Government Act 1989xiv Section 126(3)(a) of the Local Government Act 1989xv Section 126(3)(b) and 126(4)(a) of the Local Government Act 1989xvi Section 136 of the Local Government Act 1989xvii Regulation 7(a) and 7(b) of the Local Government (Planning and Reporting) Regulations 2014xviii Regulation 6, 7 and 8 of the Local Government (Planning and Reporting) Regulations 2014
Local Government Better Practice GuideStrategic Resource Plan, 2017
53
EndnotesReferences

54 Local Government Better Practice GuideStrategic Resource Plan, 2017

delwp.vic.gov.au
Local Government Better Practice GuideStrategic Resource Plan, 2017
55

i
ii Section 3(91) of the Local Government Act 1989iii Section 1(1) of the Local Government Act 1989iv Section 1(4) of the Local Government Act 1989v Section 1(5) of the Local Government Act 1989vi Section 125 of the Local Government Act 1989vii Section 126 of the Local Government Act 1989viii Section 127 of the Local Government Act 1989ix Section 131 of the Local Government Act 1989x Section 126(1) of the Local Government Act 1989xi Section 126(2)(a) of the Local Government Act 1989xii Section 126(2)(b) of the Local Government Act 1989xiii Section 126(2A) and (2B) of the Local Government Act 1989xiv Section 126(3)(a) of the Local Government Act 1989xv Section 126(3)(b) and 126(4)(a) of the Local Government Act 1989xvi Section 136 of the Local Government Act 1989xvii Regulation 3(2) of the Local Government (Planning and Reporting) Regulations 2014xviii Regulation 6, 7 and 8 of the Local Government (Planning and Reporting) Regulations 2014


