
1
Field Testing of Activated Carbon Field Testing of Activated Carbon Injection Options for Mercury Control Injection Options for Mercury Control
at at TXUTXU’’ss Big Brown StationBig Brown Station
Project Kickoff Meeting
DOE NETL Headquarters DOE NETL Headquarters –– Morgantown, West VirginiaMorgantown, West Virginia
John H. PavlishJohn H. PavlishEnergy & Environmental Research CenterEnergy & Environmental Research Center
April 19, 2005

Agenda for KickAgenda for Kick--Off MeetingOff Meeting
1:00 Welcome and Introductions Sara Pletcher (DOE/NETL)
1:15 Overview of TXU Bob Wiemuth (TXU)
1:30 Project Overview and Scope John Pavlish (EERC)Project BackgroundProject ObjectivesProject TasksTest Matrix
2:15 Project Schedule John Pavlish (EERC)
2:30 Project Team John Pavlish (EERC)
2:45 Budget and Funding John Pavlish (EERC)Overall BudgetCost SharingIn-kind Costs
3:00 Reporting John Pavlish (EERC)Routine ReportingTechnical Data Reporting
3:15 Closing Remarks and Discussion Sara Pletcher (DOE/NETL)

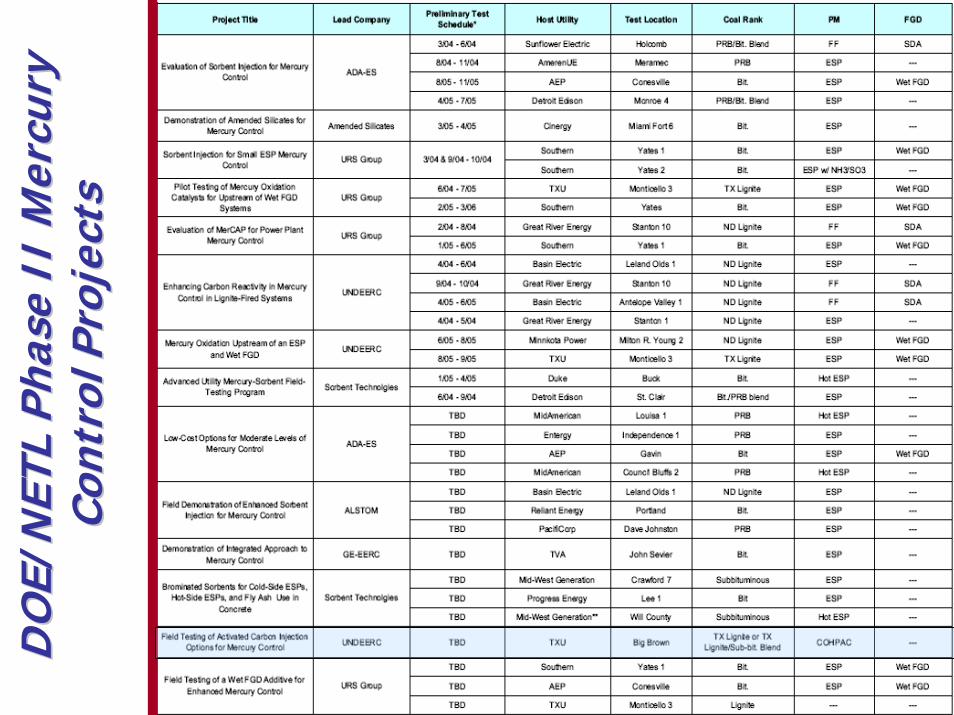
Project OverviewProject Overview
DO
E/N
ETL
Phas
e II
Mer
cury
D
OE/
NET
L Ph
ase
II M
ercu
ry
Cont
rol P
roje
cts
Cont
rol P
roje
cts

Project BackgroundProject Background

Texas LigniteTexas Lignite––Mercury ChallengeMercury Challenge
6
• Texas lignite is among the U.S. coals with the highest mercury content.
• Texas lignite, in particular, can emit relatively high levels of Hg, with up to 80% Hg0.
• Month-long monitoring by the EERC has shown an unusually high degree of variability in mercury concentrations.
• High mercury concentration and variability coupled with very low Cl levels in the flue gas make control of Hg from plants burning TXlignite perhaps the most difficult of any coal type burned within the United States.
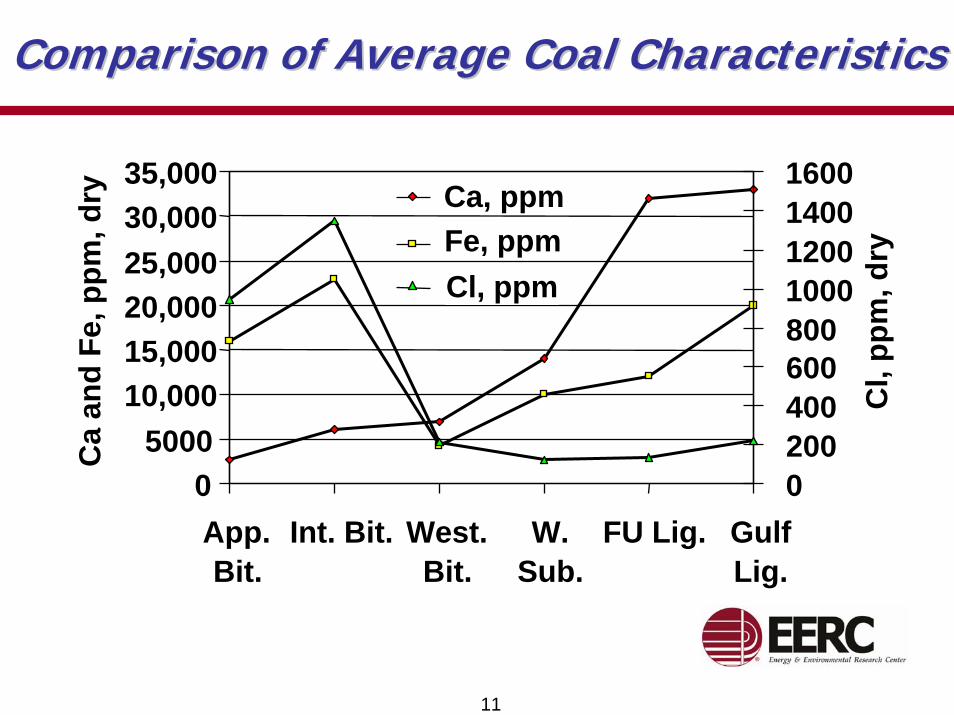
• Lignite coals are also distinguished by much higher Ca contents.Unique to TX lignite coal are relatively higher Fe and Se concentrations
7
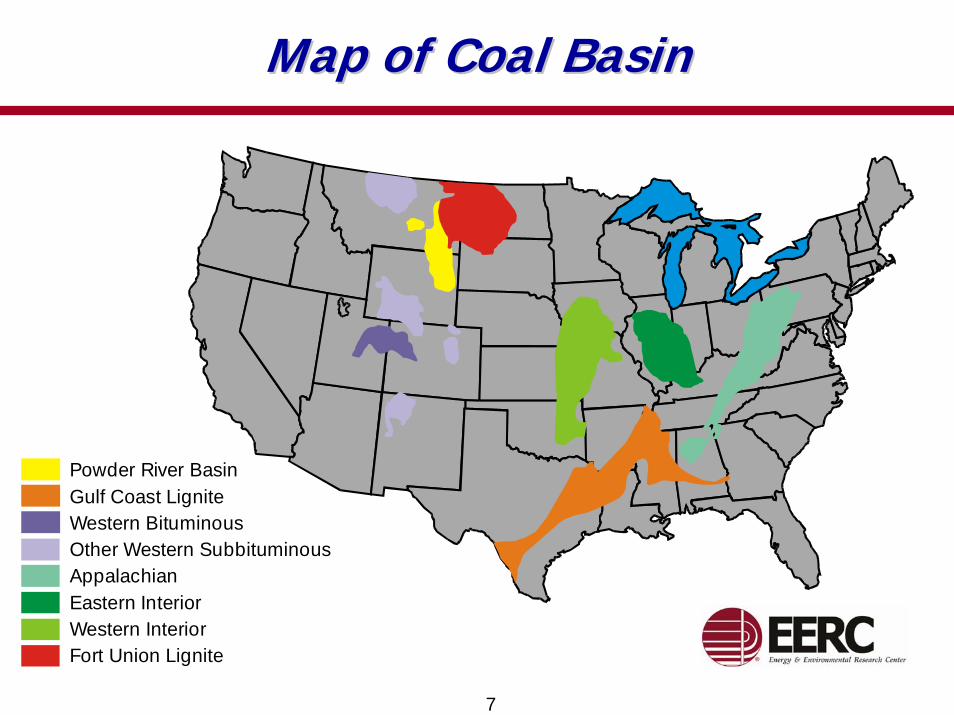
Map of Coal BasinMap of Coal Basin
Powder River BasinGulf Coast LigniteWestern BituminousOther Western SubbituminousAppalachianEastern InteriorWestern InteriorFort Union Lignite
8
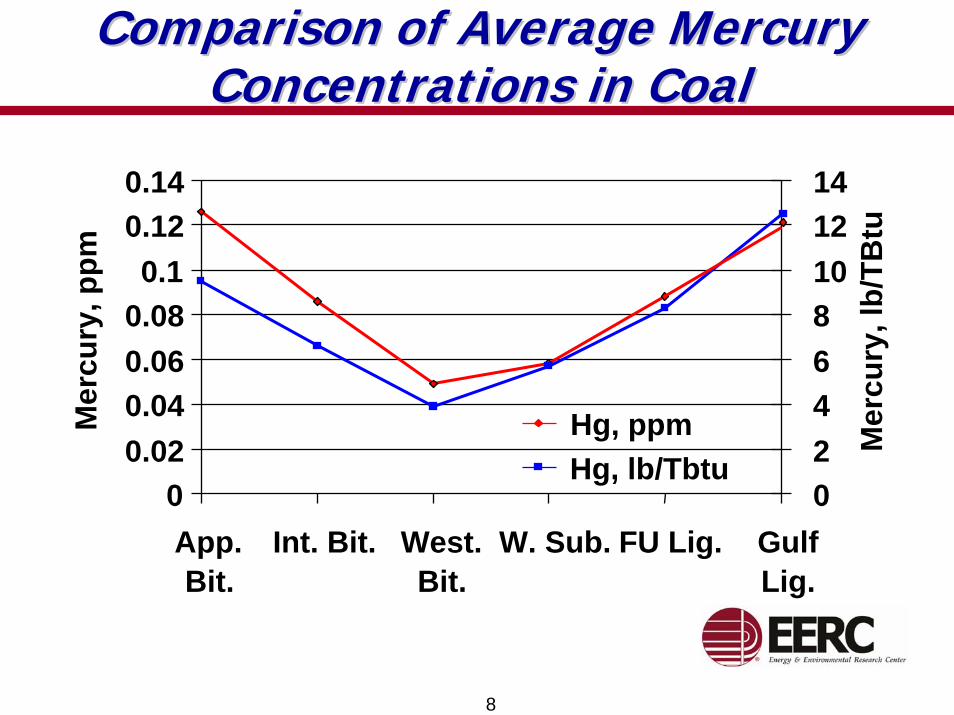
Comparison of Average Mercury Comparison of Average Mercury Concentrations in CoalConcentrations in Coal
00.020.040.060.080.1
0.120.14
App.Bit.
Int. Bit. West.Bit.
W. Sub. FU Lig. GulfLig.
Mer
cury
, ppm
02468101214
Mer
cury
, lb/
TBtu
Hg, ppmHg, lb/Tbtu

Results of ICR Coal Analysis by RegionResults of ICR Coal Analysis by Region
9
Reported on Dry Basis
Region and Rank
No. of Samples Hg, ppm Cl, ppm S, % Ash, % Btu/lb
Moisture,%
Hg,lb/TBtu
AppalachianBituminous
19,530 0.126 948 1.67 11.65 13,275 2.5 9.5
Interior Bituminous
3763 0.086 1348 2.45 10.43 13,001 6.6 6.6
WesternBituminous
1471 0.049 215 0.57 10.51 12,614 4.2 3.9
WesternSubbituminous
7989 0.068 124 0.48 7.92 11,971 19.4 5.7
Fort Union Lignite
424 0.088 139 1.15 13.37 10,585 37.3 8.3
Gulf CoastLignite
623 0.119 221 1.39 23.56 9646 34.5 12.5

10
Fort Union Lignite Compared toFort Union Lignite Compared toGulf Coast Lignite *Gulf Coast Lignite *
Fort Union Lignite
Gulf Coast Lignite
0
20
40
60
80
100
0–10 10–20 20–30 30–40 40+
lb Hg /1012Btu
Perc
enta
ge
* Based on ICR Data
11
Comparison of Average Coal CharacteristicsComparison of Average Coal Characteristics
05000
10,00015,00020,00025,00030,00035,000
App.Bit.
Int. Bit. West.Bit.
W.Sub.
FU Lig. GulfLig.
Ca
and
Fe, p
pm, d
ry
02004006008001000120014001600
Cl,
ppm
, dry
Ca, ppmFe, ppmCl, ppm

PilotPilot--Scale TestingScale Testing
12
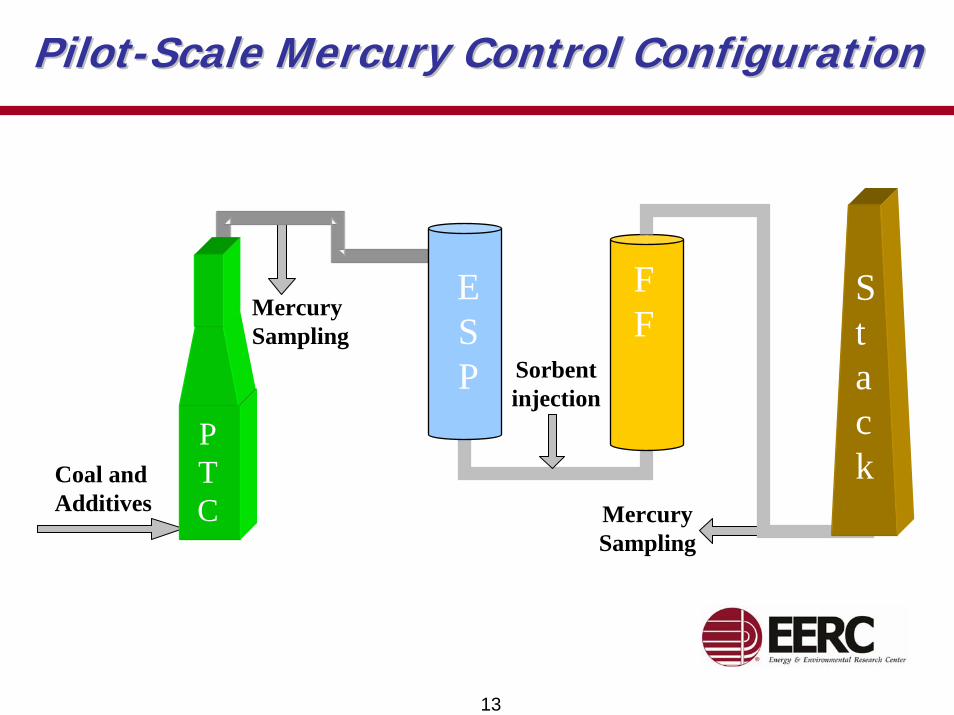
• March 2004 – the EERC conducted pilot-scale testing to evaluate the effectiveness of ACI upstream of an FF operated at an air-to-cloth ratio (A/C) of 12, combusting 70% TX lignite–30% subbituminous—the same A/C at which Big Brown operates.
13
PilotPilot--Scale Mercury Control Configuration Scale Mercury Control Configuration
ESP
StackCoal and
Additives
MercurySampling
Sorbent injection
FF
Stack
Mercury Sampling
PTC
14
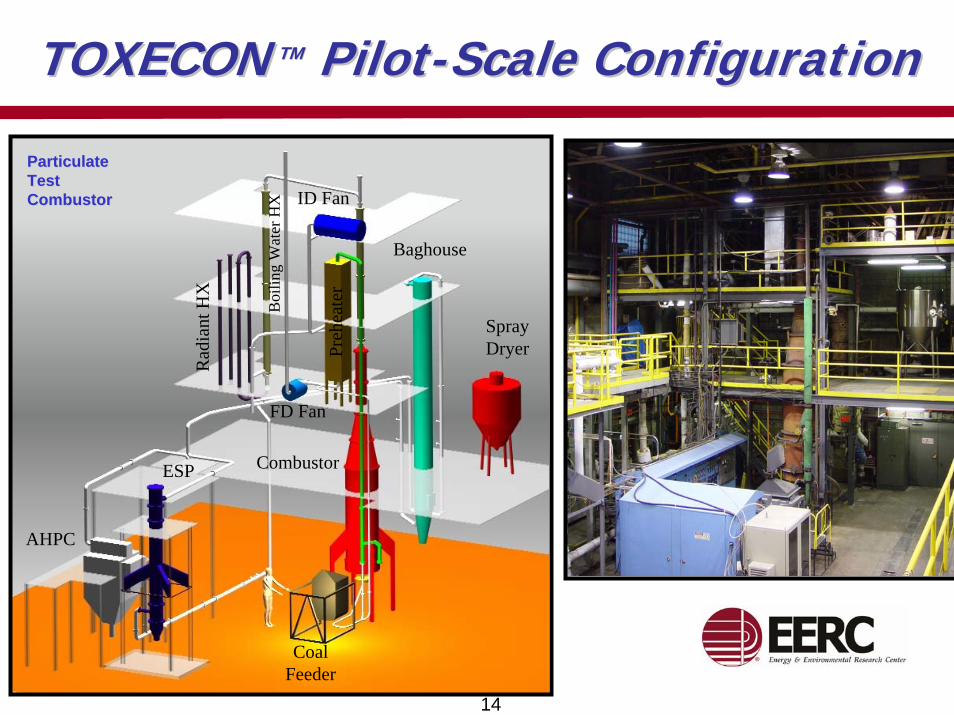
TOXECONTOXECON TMTM PilotPilot--Scale ConfigurationScale Configuration
Spray Dryer
Baghouse
Coal Feeder
AHPC
ESP Combustor
ID Fan
FD Fan
Preh
eate
r
Rad
iant
HX
Boi
ling
Wat
er H
X
ParticulateParticulateTest Test CombustorCombustor

PilotPilot--Scale Test ParametersScale Test Parameters
15
Coal: 70% TX Lignite–30% PRB Blend
ESP Inlet Temperature: 177°C, (350°F)
ESP Outlet/FF Inlet Temperature: 177°C, (350°F)
FF Outlet Temperature: 177°C, (350°F)
Filtration Velocity: 12 ft/min
ESP: 4mA, 40-60 kV
Bag Type: 1 Ryton® bag
Sorbents: 1) Norit FGD2) Norit FGD + Additive3) EERC-Treated
Additives: NaCl and CaCl2
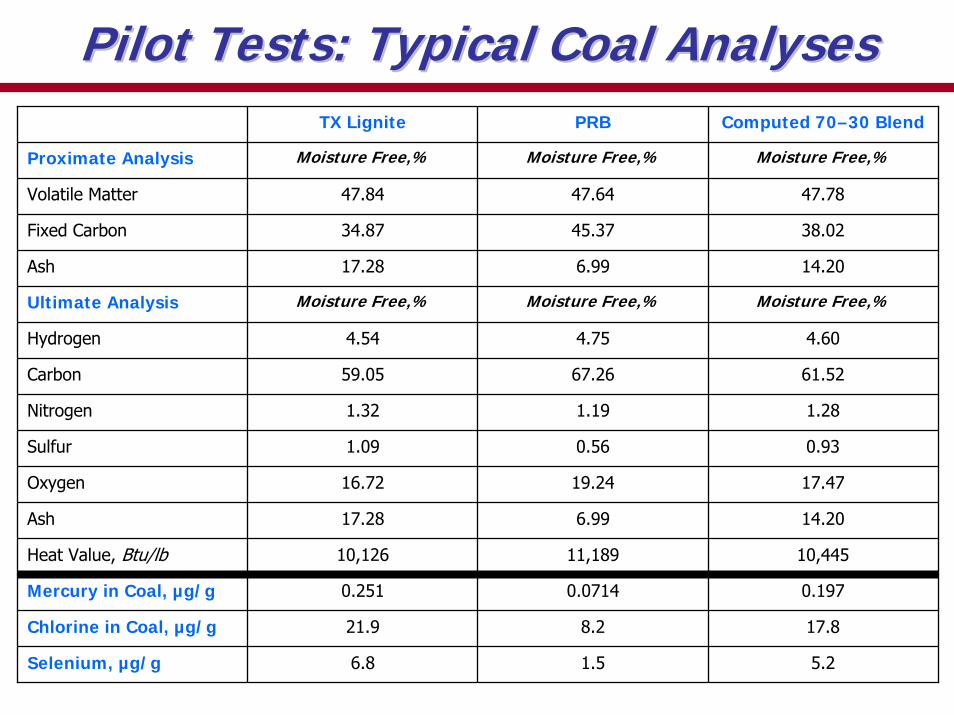
Pilot Tests: Typical Coal AnalysesPilot Tests: Typical Coal AnalysesTX Lignite PRB Computed 70–30 Blend
Proximate Analysis Moisture Free,% Moisture Free,% Moisture Free,%
Volatile Matter 47.84
34.87
17.28
Moisture Free,%
4.54
59.05
1.32
1.09
16.72
17.28
10,126
0.251
21.9
6.8
47.64 47.78
Fixed Carbon 45.37 38.02
Ash 6.99 14.20
Ultimate Analysis Moisture Free,% Moisture Free,%
Hydrogen 4.75 4.60
Carbon 67.26 61.52
Nitrogen 1.19 1.28
Sulfur 0.56 0.93
Oxygen 19.24 17.47
Ash 6.99 14.20
Heat Value, Btu/lb 11,189 10,445
Mercury in Coal, µg/g 0.0714 0.197
Chlorine in Coal, µg/g 8.2 17.8
Selenium, µg/g 1.5 5.2

Coal Mercury, Big Brown FullCoal Mercury, Big Brown Full--ScaleScale
17

18
Coal Analysis for Big Brown at FullCoal Analysis for Big Brown at Full--Scale,Scale,70% Lignite70% Lignite––30% PRB Blend30% PRB Blend
Date 2/23/2004 2/24/2004 2/25/2004 Average Std. Dev.
Mercury, ppm (dry) 0.421 0.170 0.183 0.176 0.232 0.202 0.182 0.124 0.193 0.209 0.084
Chlorine, ppm (dry) 24.1 22.3 21.6 21.8 18.7 17.5 19.6 19.1 20.2 20.5 2.1
Short Proximate Analysis
Moisture, % 31.0 31.3 31.2 31.1 30.5 31.5 31.6 31.5 31.4 31.2 0.3
Ash, % 11.0 11.6 9.7 9.8 9.4 8.1 10.2 10.5 11.6 10.2 1.1
Sulfur, % 1.4 0.7 0.8 0.6 0.7 0.6 0.7 0.7 0.7 0.8 0.2
Heating Value, Btu/lb 7528 7265 7483 7531 7694 7664 7440 7302 7101 7445 193
Ultimate Analysis
Hydrogen, % 6.7 6.7 6.6 6.4 6.8 6.8 6.5 6.6 6.3 6.6 0.2
Carbon, % 39.1 41.7 39.1 39.4 44.1 40.0 37.8 41.1 36.4 39.9 2.2
Nitrogen, % 0.9 0.9 0.8 0.8 0.9 0.8 0.8 0.9 0.7 0.8 0.1
Sulfur, % 1.4 0.7 0.8 0.6 0.7 0.6 0.7 0.7 0.7 0.8 0.2
Oxygen, % 41.1 38.4 43.1 42.9 38.1 43.6 44.0 40.3 44.2 41.7 2.4
Fd, dscf/106 Btu 8784 9783 8620 8557 9784 8648 8305 9438 8306 8914 595
Sulfur (dry), % 1.97 1.03 1.09 0.89 1.01 0.93 1.02 1.04 1.08 1.12 0.33
Heating Value (dry), Btu/lb 10,910 10,575 10,876 10,930 11,071 11,188 10,877 10,660 10,351 10,827 257
* Results are on an as-received basis, except where noted.

Coal Analysis for Big Brown Coal Analysis for Big Brown at Fullat Full--Scale, 100% LigniteScale, 100% Lignite
Sample 1 Sample 2 Sample 3 Average Std. Dev.
Mercury, ppm (dry) 0.170 0.308 0.212 0.230 0.071
Chlorine, ppm (dry) 37.1 17.8 18.4 24.4 11.0
Short Proximate Analysis
Moisture, % 28.3 28.6 29.4 28.8 0.6
Ash, % 9.7 9.4 12.0 10.4 1.4
Sulfur, % 1.2 0.8 0.6 0.9 0.3
Heating Value, Btu/lb 7749 7837 7369 7652 249
Ultimate Analysis
Hydrogen, % 6.4 6.6 6.4 6.5 0.1
Carbon, % 41.7 42.2 39.5 41.2 1.4
Nitrogen, % 1.0 0.9 0.8 0.9 0.1
Sulfur, % 1.2 0.8 0.6 0.9 0.3
Oxygen, % 39.9 40.1 40.6 40.2 0.4
Fd, dscf/106 Btu 8994 9022 8882 8966 74
Sulfur (dry), % 1.73 1.05 0.89 1.22 0.4
Heating value (dry), Btu/lb 10,808 10,975 10,438 10,740 275
* Results are on an as-received basis, except where noted.
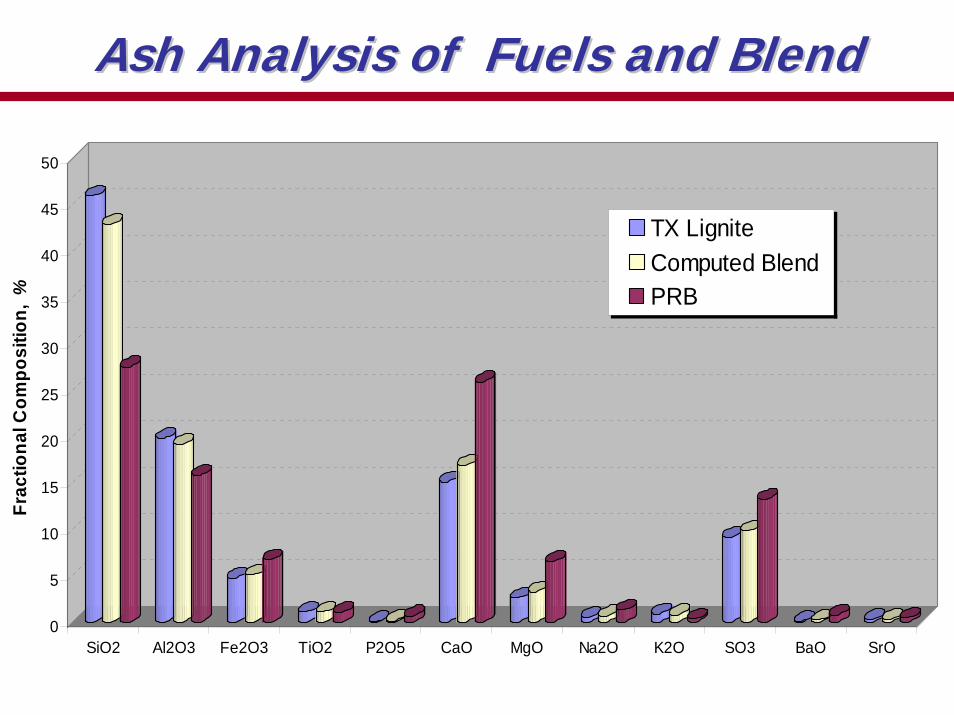
Ash Analysis of Fuels and BlendAsh Analysis of Fuels and Blend
0
5
10
15
20
25
30
35
40
45
50
Frac
tiona
l Com
posi
tion,
%
SiO2 Al2O3 Fe2O3 TiO2 P2O5 CaO MgO Na2O K2O SO3 BaO SrO
TX LigniteComputed BlendPRB

21
PilotPilot--Scale Mercury Emissions SpeciationScale Mercury Emissions Speciation70% TX Lignite70% TX Lignite––30% PRB Blend30% PRB Blend
0
5
10
15
20
25
30
35
40
ESP inlet FF Outlet
Mer
cury
Con
cent
ratio
n, µ
g/dN
m3
(dry
flue
gas
, 3%
O2)
O.H. Hg(p) O.H. Hg++ O.H. Hg0
CMM Hg0 CMM Hg++ Calc. HgTot
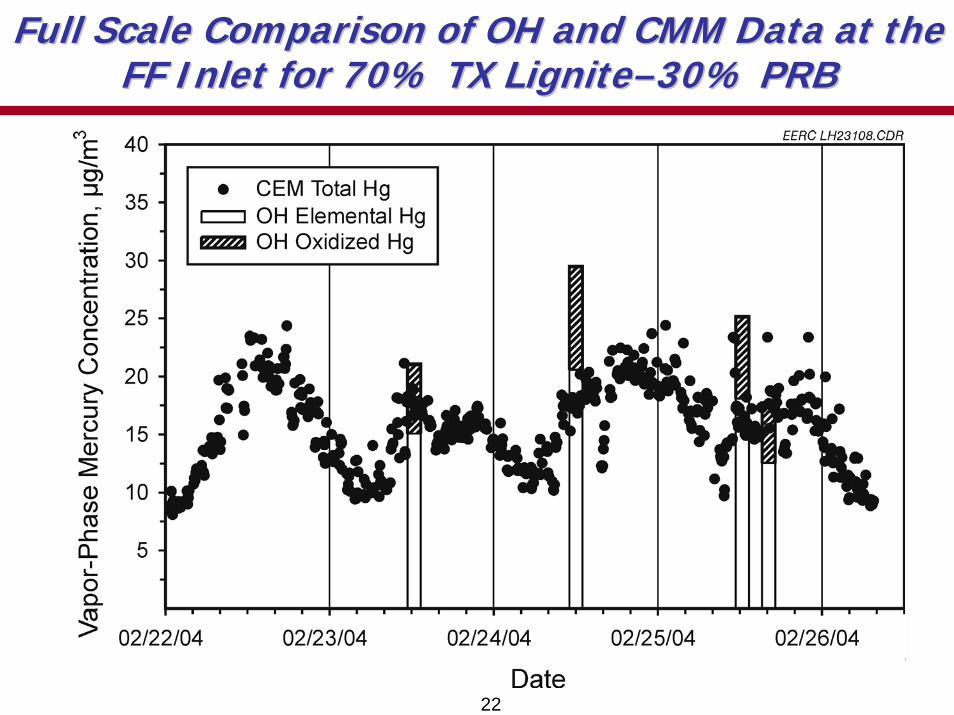
22
Full Scale Comparison of OH and CMM Data at the Full Scale Comparison of OH and CMM Data at the FF Inlet for 70% TX LigniteFF Inlet for 70% TX Lignite––30% PRB30% PRB
•Figure 4.

23
Full Scale Comparison of OH and CMM data at the Full Scale Comparison of OH and CMM data at the FF Outlet for 70% TX LigniteFF Outlet for 70% TX Lignite––30% PRB30% PRB

24
Comparison of EERC PilotComparison of EERC Pilot--Scale to Scale to FullFull--Scale DOE DataScale DOE Data

Mercury Removal as a Function of Carbon Mercury Removal as a Function of Carbon Injection Rate Injection Rate (based on pilot(based on pilot--scale data)scale data)
0%
10%
20%
30%
40%
50%
60%
70%
80%
90%
100%
0 1 2 3 4 5 6 7 8 9 10
Carbon Injection Rate (lb/Macf)
Mer
cury
Rem
oval
Standard ACI with AdditiveEERC Treated CarbonStandard ACI
Standard ACI with Additive is plotted as a function of carbon feed rate. The carbon feed rate was 25% of the total additive blend feed rate.
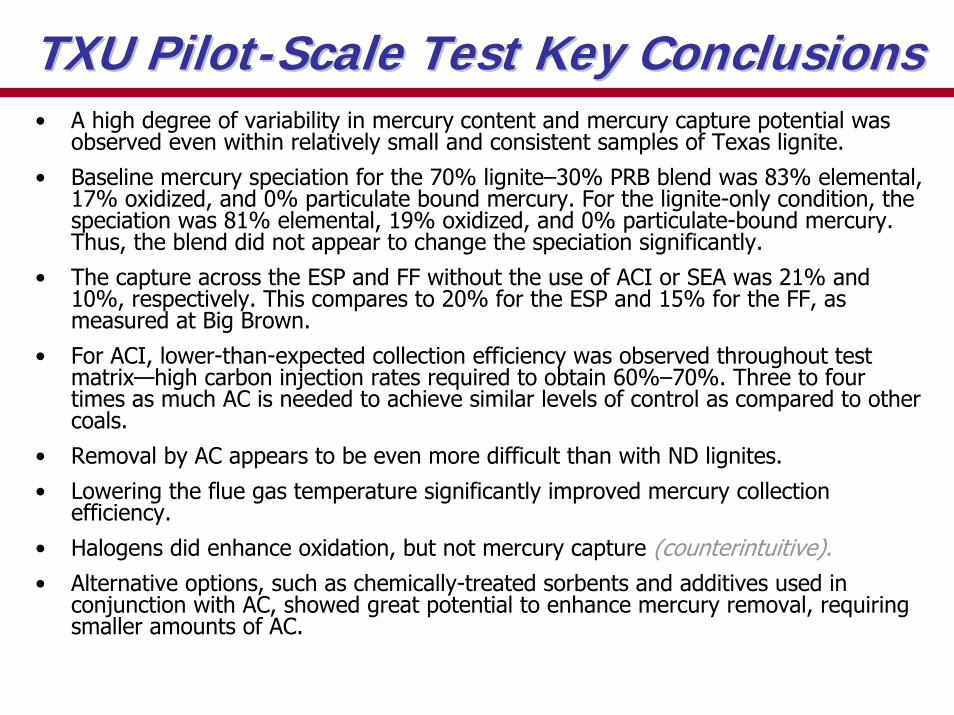
TXU PilotTXU Pilot--Scale Test Key ConclusionsScale Test Key Conclusions• A high degree of variability in mercury content and mercury capture potential was
observed even within relatively small and consistent samples of Texas lignite.
• Baseline mercury speciation for the 70% lignite–30% PRB blend was 83% elemental, 17% oxidized, and 0% particulate bound mercury. For the lignite-only condition, the speciation was 81% elemental, 19% oxidized, and 0% particulate-bound mercury. Thus, the blend did not appear to change the speciation significantly.
• The capture across the ESP and FF without the use of ACI or SEA was 21% and 10%, respectively. This compares to 20% for the ESP and 15% for the FF, as measured at Big Brown.
• For ACI, lower-than-expected collection efficiency was observed throughout test matrix—high carbon injection rates required to obtain 60%–70%. Three to four times as much AC is needed to achieve similar levels of control as compared to other coals.
• Removal by AC appears to be even more difficult than with ND lignites.
• Lowering the flue gas temperature significantly improved mercury collection efficiency.
• Halogens did enhance oxidation, but not mercury capture (counterintuitive).• Alternative options, such as chemically-treated sorbents and additives used in
conjunction with AC, showed great potential to enhance mercury removal, requiring smaller amounts of AC.

Project ScopeProject Scope

28
Overall Project ObjectivesOverall Project Objectives
• Investigate the long-term feasibility of cost-effective mercury removal from Texas lignite at TXU’s Big Brown Steam Electric Station using activated carbon injection, with and without additives.
• Two identical 600-MW units, each equipped with two parallel sets of electrostatic precipitators (ESPs) and COHPAC baghouses allows for injection of AC (and possible additives) with simultaneous comparison of untreated flue gas on the opposing set.
29
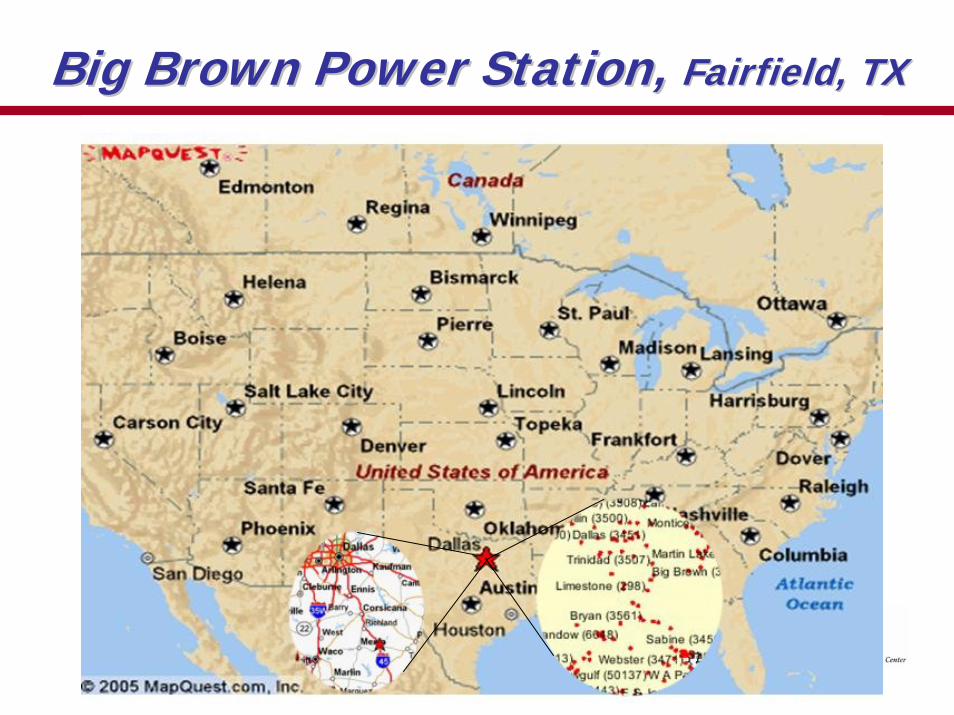
Big Brown Power Station, Big Brown Power Station, Fairfield, TXFairfield, TX

30
Big Brown Station near Fairfield, TexasBig Brown Station near Fairfield, Texas
Source: U.S. Environmental Protection Agency at http://cfpub.epa.gov/gdm/

Big Brown Power Station, Big Brown Power Station, Fairfield, TXFairfield, TX

32
Big Brown Power Station, Big Brown Power Station, Fairfield, TXFairfield, TX
Possible Possible test test
locationlocation

Big Brown SpecificationsBig Brown Specifications
33
• Plant capacity: Approximately 1200 MW, two 600-MW units
• Boiler type: Tangentially fired with eight coal feeders per unit
• Typical fuel: 70% TX lignite–30% PRB blend• SO2 control: None• NOx control: Low-NOx burners• PM control: COHPAC™ configuration on each of the A
and B sides of the unit. Each side has two ESPs (in parallel) followed by four baghouses (two per side) operating at an A/C ratio of 12:1 and operated in parallel. Each ESP has two fields, two rows, and a total of eight hoppers (two hoppers per box); each baghouse has eight hoppers.

34
Specific ObjectivesSpecific Objectives
• Conduct testing to determine if sorbent technology can be applied at Big Brown to achieve a mercury reduction of greater than 55%.– Establish values for baseline Hg speciation and removal.
– Determine effectiveness of injecting AC
– Determine effectiveness of using AC with an additive
– Determine effectiveness of a treated AC
• Quantify Hg emissions variability over 1 month period.
• Determine capital and operating costs and assess balance of plant impacts. – Determine the impact of sorbents on baghouse cleaning cycle,
pressure, etc.

Scope of WorkScope of Work
35
• Perform baseline, parametric, and month-long field tests to evaluate effectiveness of several promising mercury control options.
• Identify balance-of-plant impacts
• Perform a preliminary economic evaluation of the commercial application of the most promising technology
• Report results at meetings, conferences, and a final comprehensive report

36
Project Tasks for ACI Testing at Big BrownProject Tasks for ACI Testing at Big Brown
Task 1 – Testing and Sampling Activities at Big Brown
Subtask 1.1 – Field Sampling Activities
Subtask 1.2 – Data Analysis
Task 2 – Site Planning, Reporting, and Management
Subtask 2.1 – Field Test Planning and Site Preparation
Subtask 2.2 – Program Planning and Management
Project Activities
37
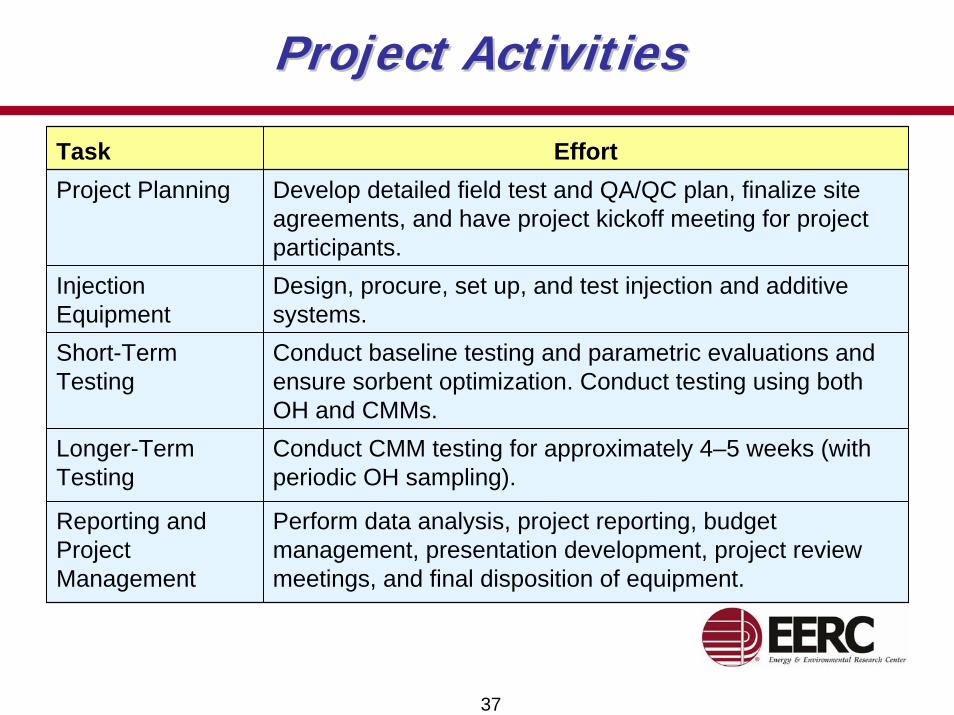
Project Activities
Task EffortProject Planning Develop detailed field test and QA/QC plan, finalize site
agreements, and have project kickoff meeting for project participants.
Injection Equipment
Design, procure, set up, and test injection and additive systems.
Short-Term Testing
Conduct baseline testing and parametric evaluations and ensure sorbent optimization. Conduct testing using both OH and CMMs.
Longer-Term Testing
Conduct CMM testing for approximately 4–5 weeks (with periodic OH sampling).
Reporting and Project Management
Perform data analysis, project reporting, budget management, presentation development, project review meetings, and final disposition of equipment.
38
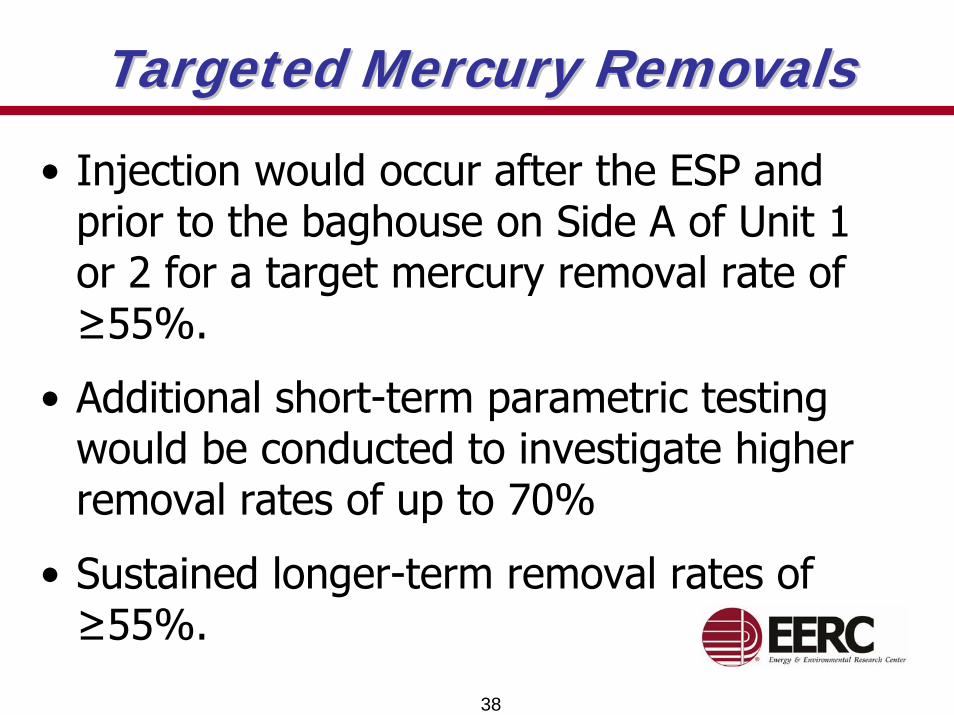
Targeted Mercury RemovalsTargeted Mercury Removals
• Injection would occur after the ESP and prior to the baghouse on Side A of Unit 1 or 2 for a target mercury removal rate of ≥55%.
• Additional short-term parametric testing would be conducted to investigate higher removal rates of up to 70%
• Sustained longer-term removal rates of ≥55%.

39
Test Schedule for Big BrownTest Schedule for Big Brown
Week Activities OH Sampling
1 Setup and Baseline Sampling 3 Setsa
2–4 Parametric Testing Limited
5–9 Month-Long Testing 3 × 3 Setsb
a- Airpreheater Outlet (ESP Inlet), ESP outlet - upstream of injection, FF Outletb- ESP outlet - upstream of injection, FF Outlet

Sorbent Injection Options at Big BrownSorbent Injection Options at Big Brown
40
For a targeted sustainable Hg removal rate of ≥55%, testing will include:
• A commercially available AC sorbent DARCO Hg
• An AC sorbent (DARCO Hg) enhanced with an additive
• An EERC proprietary chemically-treated AC sorbent

Parametric Tests
41
Parametric Tests
Test No. Time Frame Hg Control Technology Objective – Hg Removal
1 Week 2 Standard ACI Baseline
2 Week 2 Standard ACI 55%
3 Week 2 Standard ACI 70%
4 Week 2 Standard ACI Maximum reduction
5 Week 3 ACI with additive Baseline
6 Week 3 ACI with additive 55%
7 Week 3 ACI with additive 70%
8 Week 3 ACI with additive Maximum reduction
9 Week 4 Treated ACI Baseline
10 Week 4 Treated ACI 55%
11 Week 4 Treated ACI 70%
12 Week 4 Treated ACI Maximum reduction
*Preceded by 1 week of setup and baseline testing.

42
Mercury Control Options for TXUMercury Control Options for TXUBig Brown ConfigurationBig Brown Configuration
TXU’s Big Brown UnitSampling Points
1) Coal: Hg, Cl, Prox./Ult..., BTU2) Ash: Hg, Cl, LOI, C, Hg Stability3) Air Heater Outlet Flue Gas: OH, Hg CEM4) Baghouse Inlet Flue Gas: OH, Hg CEM5) Baghouse Outlet Flue Gas: OH, Hg CEM6) ACI and Additive Injection
CoalBunker
Feeders(8)
Stack
Boiler
Fabric Filters
ID Fans
Pulverizers(8)
AirHeaters
ESPs
1
3
4
2
5
6
AdditiveAdditive
Standard ACTreated AC
BoosterFans

43
AC Storage Silo and Control PanelAC Storage Silo and Control Panel
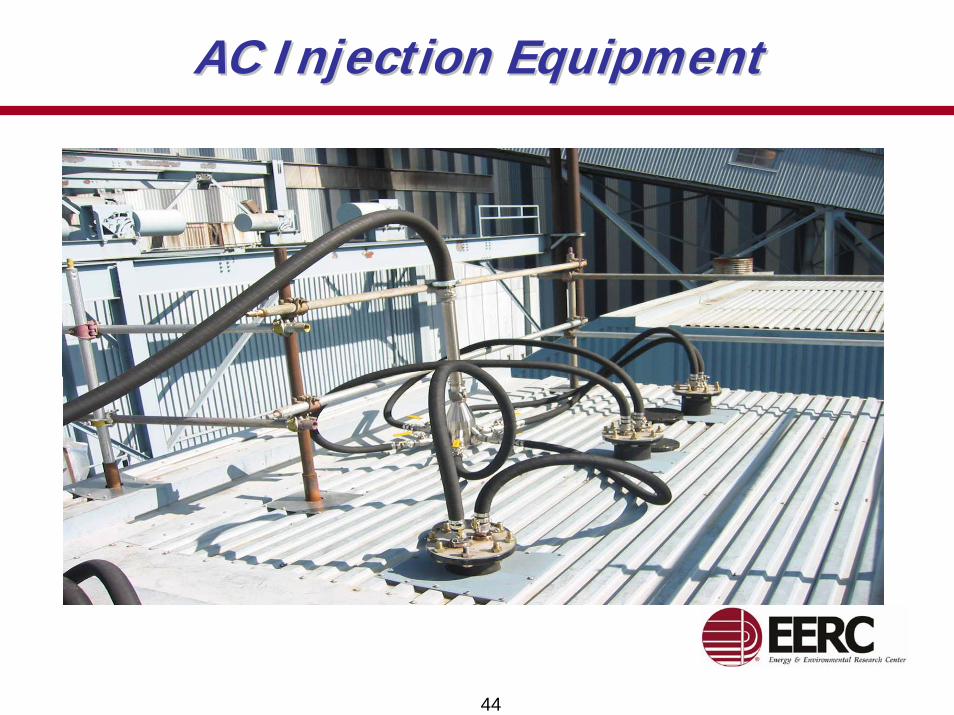
AC Injection EquipmentAC Injection Equipment
44

Preliminary ACI EconomicsPreliminary ACI Economics
45
• Preliminary economic costs for Big Brown using ACI are estimated to be less than $10,000 per pound of Hg removed. Note, balance-of-plant impacts are not accounted for in this estimate.
• This assumes ACI rates for 50%–70% removal.
• This cost is approximately in the mid-range of the cost of 0.03–1.903 mils/kWh, which EPA recently estimated for Hg control.

Preliminary Additive Economics Preliminary Additive Economics
46
• Sorbent additives that have been tested to date show great promise for improving Hg capture and reducing cost as compared to standard ACI.
• Those tested to date are much less expensive than AC and, when used in conjunction with ACI, have improved sorbent effectiveness
• Pilot tests indicate a reduction in ACI rates of up to 70%.
• Thus, on this basis, the cost of control is estimated to be over 50% lower as compared to standard ACI.

Preliminary TreatedPreliminary Treated--AC Economics AC Economics
47
• Proprietary EERC pretreated sorbent at pilot-scale tests shows Hg capture rates greater than 80%
• Cost of the pretreated AC is expected to be higher, but the amount required for similar levels of reduction is lower.
• Based on pilot-scale results, the trade-off of lower rates vs. higher cost is expected to result in an overall lower cost compared to standard ACI.

Project ScheduleProject Schedule
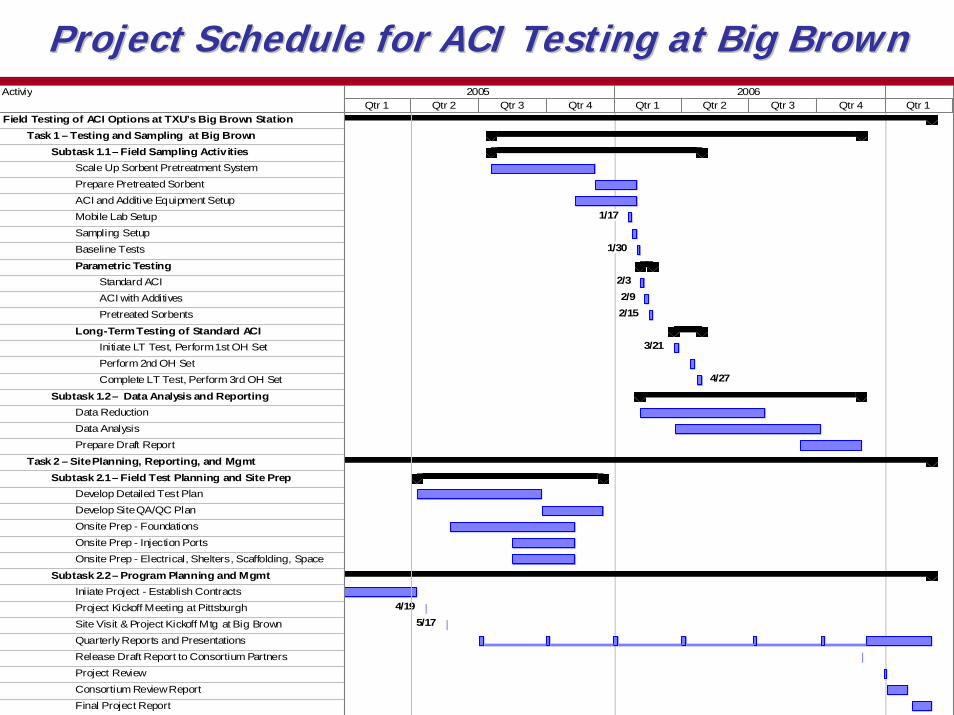
Project Schedule for ACI Testing at Big BrownProject Schedule for ACI Testing at Big BrownActiviy
Field Testing of ACI Options at TXU’s Big Brown StationTask 1 – Testing and Sampling at Big Brown
Subtask 1.1 – Field Sampling Activities Scale Up Sorbent Pretreatment SystemPrepare Pretreated SorbentACI and Additive Equipment SetupMobile Lab SetupSampling SetupBaseline Tests
Parametric TestingStandard ACIACI with AdditivesPretreated Sorbents
Long-Term Testing of Standard ACIInitiate LT Test, Perform 1st OH SetPerform 2nd OH SetComplete LT Test, Perform 3rd OH Set
Subtask 1.2 – Data Analysis and ReportingData ReductionData AnalysisPrepare Draft Report
Task 2 – Site Planning, Reporting, and MgmtSubtask 2.1 – Field Test Planning and Site Prep
Develop Detailed Test PlanDevelop Site QA/QC PlanOnsite Prep - FoundationsOnsite Prep - Injection PortsOnsite Prep - Electrical, Shelters, Scaffolding, Space
Subtask 2.2 – Program Planning and MgmtIniiate Project - Establish ContractsProject Kickoff Meeting at PittsburghSite Visit & Project Kickoff Mtg at Big BrownQuarterly Reports and PresentationsRelease Draft Report to Consortium PartnersProject ReviewConsortium Review ReportFinal Project Report
1/17
1/30
2/32/92/15
3/21
4/27
4/195/17
Qtr 1 Qtr 2 Qtr 3 Qtr 4 Qtr 1 Qtr 2 Qtr 3 Qtr 4 Qtr 12005 2006

Schedule MilestonesSchedule Milestones
• 2005 Q1: Complete rescheduling of testing to address DOE’sbudget timeline.
• 2005 Q2: Conduct project kickoff meeting at DOE. • 2005 Q2/Q3: Conduct combined project kickoff and site visit
at TXU Big Brown Station in Fairfield, Texas.• 2005 Q3: Develop project test plan with host site.• 2005 Q3/Q4: Initiate on-site preparation for baseline testing.• 2005 Q4: Begin installation of test equipment and prepare for
field testing of AC options. • 2006 Q1: Begin field testing of sorbent options. • 2006 Q2: Complete field testing and begin data reduction.• 2006 Q2/Q3: Perform data reduction and analysis.• 2006 Q3/Q4: Initiate draft final report development.• 2006 Q4: Submit draft final report for review by project team• 2007 Q1: Issue final report.

Project TeamProject Team
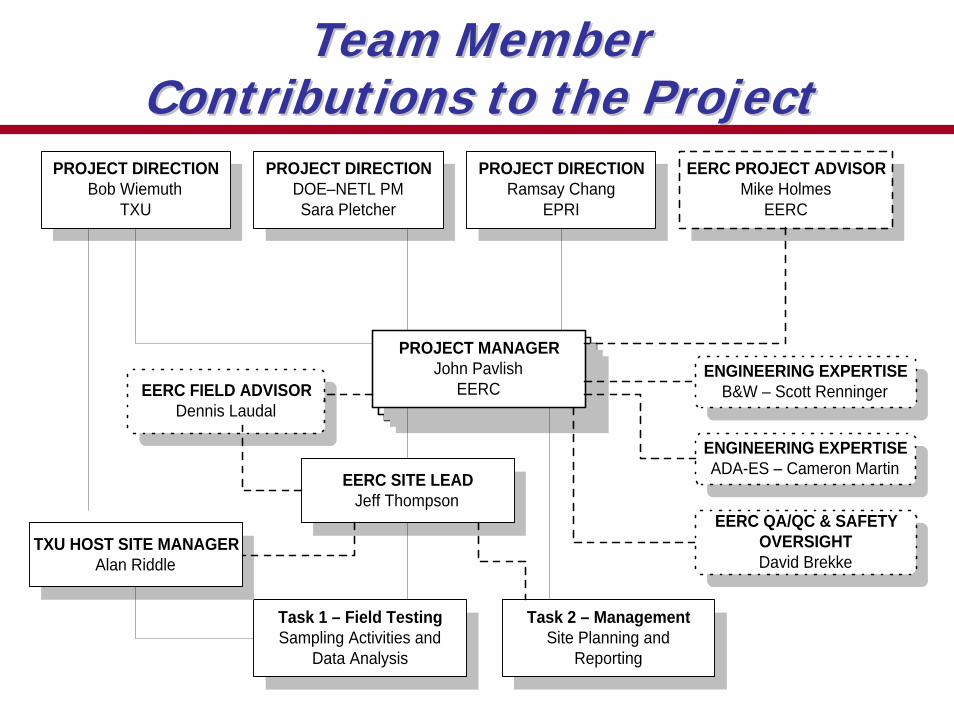
Team Member Team Member Contributions to the ProjectContributions to the Project
PROJECT DIRECTIONBob Wiemuth
TXU
PROJECT DIRECTIONDOE–NETL PMSara Pletcher
PROJECT DIRECTIONRamsay Chang
EPRI
EERC PROJECT ADVISORMike Holmes
EERC
PROJECT MANAGERJohn Pavlish
EERCENGINEERING EXPERTISE
B&W – Scott Renninger
EERC QA/QC & SAFETYOVERSIGHTDavid Brekke
EERC SITE LEADJeff Thompson
Task 1 – Field TestingSampling Activities and
Data Analysis
Task 2 – ManagementSite Planning and
Reporting
TXU HOST SITE MANAGERAlan Riddle
ENGINEERING EXPERTISEADA-ES – Cameron Martin
EERC FIELD ADVISORDennis Laudal
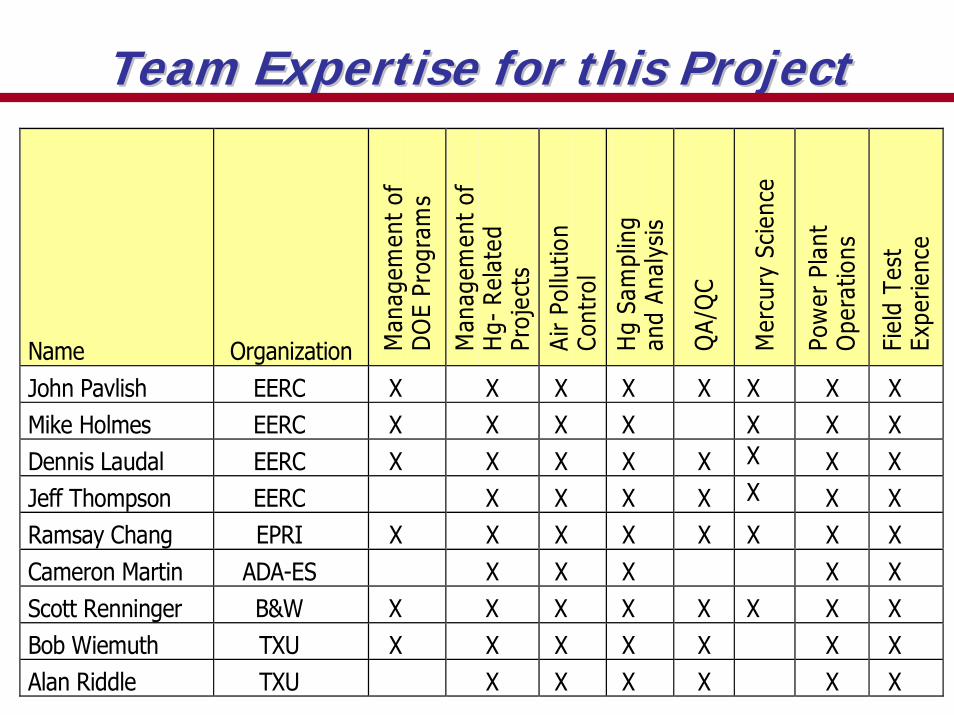
Team Expertise for this ProjectTeam Expertise for this Project
Name
Organization Man
agem
ent
of
DO
E Pr
ogra
ms
Man
agem
ent
of
Hg-
Rel
ated
Pr
ojec
ts
Air
Pollu
tion
Cont
rol
Hg
Sam
plin
g an
d An
alys
is
QA/
QC
Mer
cury
Sci
ence
Pow
er P
lant
O
pera
tions
Fiel
d Te
st
Expe
rienc
e
John Pavlish EERC X X X X X X X X Mike Holmes EERC X X X X X X X Dennis Laudal EERC X X X X X X X X Jeff Thompson EERC X X X X X X X Ramsay Chang EPRI X X X X X X X X Cameron Martin ADA-ES X X X X X Scott Renninger B&W X X X X X X X X Bob Wiemuth TXU X X X X X X X Alan Riddle TXU X X X X X X
54
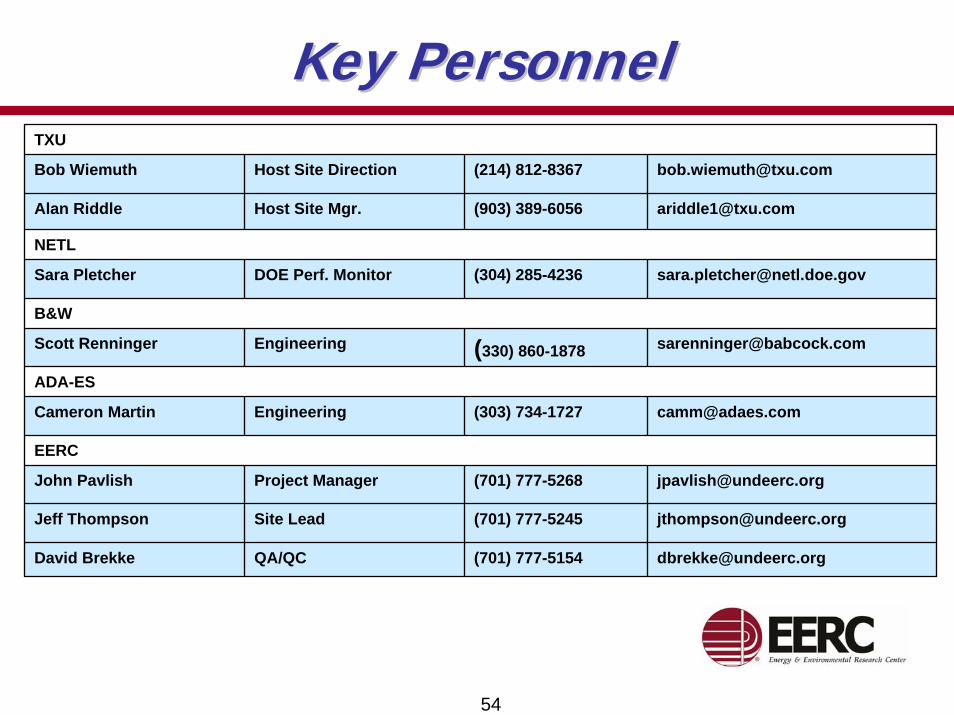
Key PersonnelKey PersonnelTXU
Bob Wiemuth Host Site Direction (214) 812-8367 [email protected]
Alan Riddle Host Site Mgr. (903) 389-6056 [email protected]
NETL
Sara Pletcher DOE Perf. Monitor (304) 285-4236 [email protected]
B&W
Scott Renninger Engineering (330) 860-1878 [email protected]
ADA-ES
Cameron Martin Engineering (303) 734-1727 [email protected]
EERC
John Pavlish Project Manager (701) 777-5268 [email protected]
Jeff Thompson Site Lead (701) 777-5245 [email protected]
David Brekke QA/QC (701) 777-5154 [email protected]

Project InterestProject Interest

Members of the LigniteMembers of the Lignite--Based ConsortiumBased Consortium
North Dakota Industrial Commission
Westmoreland Coal
THE NORTH AMERICAN COAL CORPORATION
Apogee Scientific

Texas InterestsTexas Interests
57
• Texas Association of Business
• The Governor's Clean Coal Technology Council
• The Association of Electric Companies of Texas
• The Texas Mining and Reclamation Association
• The Texas Lignite Coalition

Project BudgetProject Budget

Team Member Contributions Team Member Contributions to the Projectto the Project
SOURCE TYPEIN-KIND
COST SHARECASH
COST SHARE DOE TOTAL
PROJECT TXU/EPRI Cash through EPRI TC
credits
$123,210
$75,000
$30,000
$228,210
$475,000 $475,000
B&W/EPRI Cash through EPRI TC credits
$18,000 $18,000
ADA-ES In-kind – discount of sorbent, materials and shipping
$123,210
TXU In-kind – services and material
$75,000
EPRI In-kind – services, travel and overhead
$30,000
DOE Cash $1,500,000 $1,500,000
Total $493,000 $1,500,000 $2,221,210
PERCENT COST SHARE 32.5 67.5

Data Reduction and Data Reduction and ReportingReporting

Data ReductionData Reduction
61
Plant operating and technology performance data will be collected and logged carefully such that effectiveness can be accurately assessed relative to both short- and long-term Hg capture/reduction. Data generated throughout the test program will be reduced, interpreted, and summarized to determine overall conclusions related to performance and costs.
Project ReportingProject Reporting
62
• Conference calls as needed, or quarterly• Project review meetings, annually• Monthly informal updates, conference calls,
e-mails, project highlights• Presentation of results at various conferences• Detailed site-specific field test plan• QA/QC plan• Final report


