
FEASIBILITYSTUDY
C I T Y O F S A N D I E G O
FOR A COMMUNITY CHOICE AGGREGATE
JULY 2017 | FINAL DRAFT

This page intentionally left blank.
DRAFT FOR REVIEW
C I T Y O F S A N D I E G O
FEASIBILITY STUDY
FOR A COMMUNITY CHOICE AGGREGATE
JULY 2017 | FINAL DRAFT
DRAFT FOR REVIEW

City of San Diego Community Choice Aggregate Feasibility Study i | P a g e
DRAFT FOR REVIEW

City of San Diego Community Choice Aggregate Feasibility Study i | P a g e
TABLE OF CONTENTS
GLOSSARY & LIST OF ACRONYMS ......................................................................................................... i
EXECUTIVE SUMMARY ..................................................................................................................... ES-1
WHAT IS COMMUNITY CHOICE AGGREGATION? ....................................................................... ES-2
COMMUNITY CHOICE AGGREGATION IN CALIFORNIA .......................................................... ES-2
SCENARIOS .................................................................................................................................. ES-4
LOAD FORECAST ......................................................................................................................... ES-6
CONSUMPTION FORECAST USED IN STUDY .......................................................................... ES-6
COST OF POWER SUPPLY BY SCENARIO .................................................................................... ES-8
REVENUE REQUIREMENT ............................................................................................................ ES-9
CUSTOMER PARTICIPATION ...................................................................................................... ES-11
BASE CASE RESULTS .................................................................................................................. ES-12
BENEFITS .................................................................................................................................... ES-17
GHG REDUCTIONS .................................................................................................................. ES-17
ECONOMIC BENEFITS ............................................................................................................. ES-18
CONCLUSIONS & RECOMMENDATIONS ................................................................................... ES-20
PRIMARY STUDY CONCLUSIONS ........................................................................................... ES-20
RECOMMENDATIONS ............................................................................................................ ES-21
I. INTRODUCTION ............................................................................................................................. 1
BACKGROUND ................................................................................................................................... 1
GOALS ................................................................................................................................................ 2
WHAT IS COMMUNITY CHOICE AGGREGATION? ............................................................................. 3
COMMUNITY CHOICE AGGREGATION IN CALIFORNIA ................................................................ 3
STUDY APPROACH ............................................................................................................................ 4
TIMELINE AND PHASES ................................................................................................................. 5
SCENARIOS .................................................................................................................................... 5
SENSITIVITIES ................................................................................................................................ 7
II. METHODOLOGY AND ASSUMPTIONS .......................................................................................... 9
LOAD FORECAST ............................................................................................................................... 9

CONTENTS
July 2017 ii | P a g e
ANALYSIS OF HISTORICAL DATA ................................................................................................ 10
FORECASTING FUTURE ENERGY REQUIREMENTS ..................................................................... 14
ADJUSTMENTS ............................................................................................................................. 16
CONSUMPTION FORECAST USED IN STUDY .............................................................................. 22
POWER PROCUREMENT CONSIDERATIONS .................................................................................. 25
PORTFOLIO REQUIREMENTS ...................................................................................................... 26
POWER PURCHASING OPTIONS .................................................................................................. 28
POWER COST ESTIMATES ........................................................................................................... 33
RESOURCE ADEQUACY ............................................................................................................... 41
STORAGE...................................................................................................................................... 43
COST OF POWER SUPPLY BY SCENARIO .................................................................................... 43
COST OF SERVICE ANALYSIS .......................................................................................................... 45
PRO FORMA CCA FINANCIAL FEASIBILITY ASSESSMENT .......................................................... 46
REVENUE REQUIREMENT ............................................................................................................ 47
CUSTOMER ASSUMPTIONS ......................................................................................................... 48
OPERATING COSTS ...................................................................................................................... 53
NON-OPERATING COSTS ............................................................................................................ 60
COST OF SERVICE RATES............................................................................................................. 63
III. RESULTS ...................................................................................................................................... 65
KEY ASSUMPTIONS FOR RATE COMPARISONS ............................................................................. 65
BASE CASE RESULTS ....................................................................................................................... 66
SENSITIVITY ANALYSES RESULTS .................................................................................................. 70
SUMMARY OF FINANCIAL ANALYSES ............................................................................................ 72
IV. BENEFITS ..................................................................................................................................... 75
GREENHOUSE GAS REDUCTIONS ................................................................................................... 75
ECONOMIC IMPACTS ....................................................................................................................... 80
PRIMARY ECONOMIC IMPACTS ................................................................................................... 81
SECONDARY ECONOMIC IMPACTS ............................................................................................. 88
THIRD TIER IMPACTS ................................................................................................................... 88
CAVEATS TO ECONOMIC IMPACT RESULTS ............................................................................... 88

CONTENTS
City of San Diego Community Choice Aggregate Feasibility Study iii | P a g e
STRATEGIC ECONOMIC DEVELOPMENT SUMMARY .................................................................. 89
OTHER PROGRAM OPPORTUNITIES ............................................................................................... 90
ENERGY EFFICIENCY .................................................................................................................... 91
DEMAND-SIDE MANAGEMENT ................................................................................................... 94
DEMAND RESPONSE ................................................................................................................... 94
INCENTIVES .................................................................................................................................. 96
V. RISKS .......................................................................................................................................... 101
POWER PROCUREMENT RISK ....................................................................................................... 101
CHANGING REGULATORY LANDSCAPE RISK ............................................................................... 102
POWER CHARGE INDIFFERENCE ADJUSTMENT, COST RESPONSIBILITY
SURCHARGE, AND PORTFOLIO ALLOCATION METHOD RISKS ............................................... 102
CREDIT RISK ................................................................................................................................... 103
OPT OUT RISK ................................................................................................................................ 105
RENEWABLE GENERATION RISK ................................................................................................... 106
VI. CCA IMPLEMENTATION ............................................................................................................. 111
OTHER PARTIES .............................................................................................................................. 111
SAN DIEGO GAS & ELECTRIC ...................................................................................................... 113
CALIFORNIA PUBLIC UTILITIES COMMISSION ........................................................................... 113
CALIFORNIA INDEPENDENT SYSTEM OPERATOR .................................................................... 114
SET UP ............................................................................................................................................ 114
OPEN SEASON ........................................................................................................................... 114
CUSTOMER NOTIFICATIONS, OPT OUT AND ENROLLMENT .................................................... 115
ELECTRONIC COMMUNICATIONS AND COMPLIANCE TESTING ............................................... 115
STRUCTURE .................................................................................................................................... 115
OPERATING STRUCTURE ............................................................................................................ 115
GOVERNANCE STRUCTURE ........................................................................................................ 117
VII. CONCLUSIONS & RECOMMENDATIONS .............................................................................. 121
CCA PROJECTED OUTCOMES AGAINST MINIMUM PERFORMANCE CRITERIA TARGETS ........... 121
PRIMARY STUDY CONCLUSIONS .................................................................................................. 123
RECOMMENDATIONS .................................................................................................................... 124

CONTENTS
July 2017 iv | P a g e
APPENDICES
APPENDICES TABLE OF CONTENTS
GLOSSARY & LIST OF ACRONYMS
APPENDIX A: COMMUNITY CHOICE ENERGY IN THE CITY OF SAN DIEGO: AN INITIAL
ASSESSMENT OF PROGRAM PROSPECTS
APPENDIX B: PRIORITY GUIDING PRINCIPLES—CITY OF SAN DIEGO COMMUNITY CHOICE
AGGREGATION (CCA) FEASIBILITY STUDY
APPENDIX C: CCA REGULATORY AND TECHNICAL INFORMATION
APPENDIX D: LOAD FORECAST DEVELOPMENT
APPENDIX E: POWER COST DEVELOPMENT
APPENDIX F: CARBON DIOXIDE EMISSIONS DEVELOPMENT
APPENDIX G: SAN DIEGO GAS AND ELECTRIC RATES
APPENDIX H: REFERENCE DOCUMENTS
EXHIBITS
EXHIBITS TABLE OF CONTENTS
EXHIBIT I: PRO FORMA OUTPUTS BY SCENARIO
INDEX OF TABLES
Table ES-1: CCA Program Scenario Definitions for Study ................................................................. ES-4
Table ES-2: Sensitivity Analyses for Study ....................................................................................... ES-6
Table ES -3: CCA Test Year Revenue Requirements by Scenario ..................................................... ES-10
Table ES -4: Base Case Scenario Rate Comparison by Customer Class CCA v. SDG&E ($/kWh) ....... ES-13
Table ES - 5: Base Case Scenario Rate Comparison by Customer Class
CCA v. SDG&E EcoChoice ($/kWh) .............................................................................. ES-14
Table ES-6: Summary of Potential CCA Program Economic Impacts – Base Case Scenario............ ES-19
Table 1: CCA Program Enrollment Phases and Customer Data ............................................................... 5
Table 2: Scenario Definitions for Study .................................................................................................. 6
Table 3: Sensitivity Analyses for Study ................................................................................................... 8
Table 4: City Bundled and Direct Access Customer Electricity Consumption (2015 MWh) .................... 11

CONTENTS
City of San Diego Community Choice Aggregate Feasibility Study v | P a g e
Table 5: Assumed and Actual Opt Out Rates for CCA Programs in California ....................................... 21
Table 6: Summary of CCA Phase-in Approaches .................................................................................. 22
Table 7: California Renewable Portfolio Standard ................................................................................ 26
Table 8: Renewable Energy Certificate Portfolio Content Categories ................................................... 27
Table 9: South of Path 26 Aggregated Resource Adequacy Contract Prices (2013-14) ......................... 42
Table 10: Scenario Definitions for Study ............................................................................................... 46
Table 11: Sensitivity Analyses for Study ............................................................................................... 46
Table 12: CCA Test Year Revenue Requirements by Scenario .............................................................. 48
Table 13: CCA Test Year Revenue Requirements by Sensitivity Analysis .............................................. 48
Table 14: CCA Test Year Customer Profiles for Base Case Scenario, Scenario 5,
and Sensitivity Analyses 1-4 .................................................................................................. 52
Table 15: CCA Test Year Customer Profiles for Scenarios 2-4 ............................................................... 52
Table 16: CCA Test Year Customer Profiles for Sensitivity Analyses 5-and 6 ........................................ 53
Table 17: CCA Test Year Staffing .......................................................................................................... 54
Table 18: Power Costs by Scenario 2020-2035 ($/MWh) ....................................................................... 56
Table 19: SDG&E CCA CRS by Rate Class Effective March 1, 2017 ........................................................ 58
Table 20: Other CCA Startup Charges .................................................................................................. 59
Table 21: CCA Initial Capital Investments ............................................................................................. 60
Table 22: Debt Issuance and Annual Debt Service ................................................................................. 62
Table 23: Base Case Scenario Rate Comparison by Customer Class CCA v. SDG&E ($/kWh) ................ 68
Table 24: Base Case Scenario Rate Comparison by Customer Class
CCA v. SDG&E EcoChoice ($/kWh) ........................................................................................ 69
Table 25: Base Case Key Operating Results .......................................................................................... 70
Table 26: SDG&E Performance Against Renewable Portfolio Standard (2011-2020) ............................ 75
Table 27: Comparison of Potential Carbon Dioxide Output—SDG&E v. CCA Program
(MMT Carbon Dioxide) .......................................................................................................... 79
Table 28: Projected Rate Savings Effects on Local Economy (2026 $) .................................................. 82
Table 29: Retail Spending from Utility Rate Savings by Category, 2026 ............................................... 83
Table 30: Local Investment in Local Energy Efficiency and Renewable Energy Resources .................... 84
Table 31: Economic Impacts of Investment of Surplus Funds ............................................................... 87
Table 32: Summary of Projected CCA Program Economic Impacts ...................................................... 90

CONTENTS
July 2017 vi | P a g e
Table 33: MCE Clean Energy Net Energy Metering Rate Summary ....................................................... 98
Table 34: Risk and Mitigation Summary ............................................................................................. 109
Table 35: Sustainable Energy Advisory Board CCA Recommended
Minimum Performance Results ........................................................................................... 122
INDEX OF FIGURES
Figure ES-1: CCA Status in California ................................................................................................. ES-3
Figure ES-2: Study Renewable Portfolio Content Scenarios v. SDG&E ..............................................ES-5
Figure ES-3: Usage by Customer Class (2020-2035) ........................................................................... ES-7
Figure ES-4: CCA Customer Load by Phase ...................................................................................... ES-8
Figure ES-5: Cost of Power by Price Component and Renewable Portfolio Content (2020-2035) ..... ES-9
Figure ES-6: CCA Customers by Class by Enrollment Phase ............................................................ ES-11
Figure ES-7: Relative Size of CCA Programs .................................................................................... ES-12
Figure ES-8: Illustrative CCA Renewable Portfolio Content Progression
Based on Rate Comparisons ........................................................................................ ES-15
Figure ES-9: CCA Operating Results by Scenario & Sensitivity Analysis .......................................... ES-16
Figure ES-10 Projected Carbon Dioxide Emissions by CCA Scenario and SDG&E Forecast .............. ES-18
Figure 1: CCA Status in California ........................................................................................................... 4
Figure 2: Study Renewable Portfolio Content Scenarios v. SDG&E ........................................................ 7
Figure 3: September Weekday Minimum, Average and Maximum Demand ......................................... 10
Figure 4: Average Weekday Electricity Demand (kW) and Usage (kWh)
for Each Hour of Each Month................................................................................................. 12
Figure 5: Historical and Forecasted Energy Usage for SDG&E and the City (2001-2035) ....................... 13
Figure 6: Comparison of SDG&E Load Forecasts .................................................................................. 14
Figure 7: Weekday Estimated Demand ................................................................................................. 15
Figure 8: Weekend/Holiday Estimated Demand ................................................................................... 16
Figure 9: Customer Owned Photovoltaic Solar in the City .....................................................................17
Figure 10: Impact of Solar Photovoltaic Distributed Generation on Weekday City Load ........................17
Figure 11: Impact of Solar Photovoltaic Distributed Generation on Weekend/Holiday City Load ......... 18
Figure 12: Customer Owned Solar Distributed Generation in the City (2010 – 2035) ............................. 19
Figure 13: Load Forecast and Net Load Forecast .................................................................................. 20
Figure 14: CCA Customer Load by Phase .............................................................................................. 23

CONTENTS
City of San Diego Community Choice Aggregate Feasibility Study vii | P a g e
Figure 15: Usage by Customer Class (2020-2035) ................................................................................. 24
Figure 16: Relative Size of CCA Programs ............................................................................................ 25
Figure 17: Hierarchy of Power Procurement Sources ............................................................................ 28
Figure 18: Average CAISO Day-Ahead Market Price for SDG&E (January 2014-October 2016) ............ 30
Figure 19: CAISO SDG&E Day-Ahead Price Range by Month (January 2014-October 2016) ................. 31
Figure 20: CAISO SDG&E Real Time Price by Month (January 2014-October 2016) .............................. 32
Figure 21: CAISO SDG&E Real Time Price Range by Month (January 2014-October 2016) ................... 32
Figure 22: Relative Cost of Generation ................................................................................................. 34
Figure 23: National Renewable Energy Lab Photovoltaic System Cost Benchmark Summary .............. 35
Figure 24: Cost of Renewables for CA Investor Owned Utilities ............................................................ 36
Figure 25: 2014 California Electricity Consumption by Generation Resource ........................................ 38
Figure 26: 2015 SDG&E Power Content Label ...................................................................................... 38
Figure 27: California Natural Gas Generation Cost based on Natural Gas Price
and Heat Rate Conversion ................................................................................................... 39
Figure 28: Natural Gas Generation Supply Cost .................................................................................... 40
Figure 29: Unitized Cost of Power by Scenario ..................................................................................... 41
Figure 30: Resource Adequacy Price Forecast ...................................................................................... 42
Figure 31: Forecasted Cost of Energy Storage (2020-35) ...................................................................... 43
Figure 32: Cost of Power by Price Component and Renewable Portfolio Content (2020-2035) ............. 44
Figure 33: Monte Carlo Simulation Model Total Portfolio Power Cost Ranges
by Renewable Portfolio Content Scenario ........................................................................... 45
Figure 34: CCA Customers by Customer Class by Phase ....................................................................... 49
Figure 35: Test Year Customer Accounts by Scenario and Sensitivity Analysis ..................................... 50
Figure 36: Test Year Customer Usage by Scenario and Sensitivity Analysis (MWH) .............................. 51
Figure 37: CCA Organization Chart ....................................................................................................... 55
Figure 38: Average Annual CCA Power Procurement Costs by Scenario 2020-2035 ............................. 56
Figure 39: Illustrative CCA Renewable Portfolio Content Progression Based on Rate Comparisons ..... 67
Figure 40: Rate Comparison Summary for Base Case Scenario and All Sensitivities (50% RPC) .............71
Figure 41: Rate Comparison Summary for Base Case Scenario and All Sensitivities (100% RPC) .......... 72
Figure 42: CCA Operating Results by Scenario and Sensitivity Analysis ............................................... 74
Figure 43: SDG&E Renewable Portfolio Standard Generation (2003-2035) .......................................... 76
CONTENTS
July 2017 viii | P a g e
Figure 44: Study Forecasted Renewable Portfolio Content Scenarios v. SDG&E ................................... 77
Figure 45: Projected Carbon Dioxide Emissions by CCA Scenario and SDG&E Forecast ....................... 80
Figure 46: Demand Side Management Hierarchy Based on Program Formality ................................... 91
Figure 47: Impact of Solar Photovoltaic on CA Load Curve ................................................................... 95
Figure 48: Light Duty Vehicle Sales: Alternative-Fuel Cars .................................................................. 97
Figure 49: Simplistic Depiction of an 80% Renewable Generation Portfolio Output ............................ 107
Figure 50: Simplistic Depiction of a 100% Renewable Generation Portfolio Output ........................... 108
Figure 51: Overview of Establishing CCA Service ................................................................................ 112

City of San Diego Community Choice Aggregate Feasibility Study i | P a g e
GLOSSARY & LIST OF ACRONYMS
A
AB Assembly Bill
B
Baseline Load allowance used in rate tariffs for San Diego Gas and Electric; refer
to Special Condition 3, Sheet 5:
http://regarchive.sdge.com/tm2/pdf/ELEC_ELEC-SCHEDS_DR.pdf
Baseload The portion of CCA program customers receiving the basic power
supply portfolio based on the specific renewable content scenario: 50%
for the Base Case Scenario and Scenario 2, 80% for Scenarios 3 and 5,
and 100% for Scenario 4.
Bundled Customers Customers receiving generation, transmission, and distribution services
from the incumbent utility.
C
CA California
CAISO California Independent System Operator
CalCCA California Community Choice Association
CAP City of San Diego Climate Action Plan, Adopted by the City Council on
December 15, 2015 by Resolution Number: R-2016-309, Amended by
the City Council on July 12, 2016 by Resolution Number R-2016-762
https://www.sandiego.gov/sustainability/climate-action-plan
CARE California Alternative Rates for Energy
CCA Community Choice Aggregation
CEC California Energy Commission
CI Confidence Interval
City City of San Diego
COS Cost of Service
CPP Critical Peak Pricing
CPUC California Public Utilities Commission
CRS Cost Responsibility Surcharge
CTC Competitive Transition Charge
D
DA Direct Access—customers receiving energy from an alternative non-
Investor Owned Utility supplier.
DAM Day Ahead Market

GLOSSARY
July 2017 ii | P a g e
DG Distributed Generation
DR Demand Response
DSM Demand Side Management
DWR-BC Department of Water Resources Bond Charge
E
EDI Electronic Data Interchange
EE Energy Efficiency
EIA Energy Information Administration
EnerNex EnerNex LLC, consultant retained by the City for purposes of this Study
EPRI Electric Power Research Institute
ESP Electric Service Provider excluding Investor Owned Utilities
F
FTE Full Time Equivalent
G
GHG Greenhouse Gas
GWh Gigawatt Hour
I
IMPLAN I/O IMPLAN Group LLC’s Input-Output Multiplier Model
IOU Investor Owned Utility
J
JEDI National Renewable Energy Laboratory Jobs and Economic
Development Impact Model
JPA Joint Powers Authority
K
kW Kilowatts
kWh Kilowatt Hours

CONTENTS
City of San Diego Community Choice Aggregate Feasibility Study iii | P a g e
L
LCE Lancaster Choice Energy
LMP Locational Marginal Prices
LSE Load Serving Entity, including Investor Owned Utilities, Electric Service
Providers, and CCA programs.
LTPP Long Term Procurement Plan
M
MMBTU Million British Thermal Units
MCE MCE Clean Energy formerly Marin Clean Energy
MCSM Monte Carlo Simulation Model
MEA Marin Energy Authority, formed through a Joint Powers Agreement
among municipalities which later established MCE Clean Energy
MMT Millions of Metric Tons
MW Megawatts, represents power or capacity or demand
MWh Megawatt Hours, represents electric energy
N
NPV Net Present Value
NREL National Renewable Energy Laboratory
O
OASIS Open Access Same-time Information System
Opt Out The portion of customers declining to join the Community Choice
Aggregation program. Also referred to as opt-out.
Opt Up The portion of CCA customers selecting 100% renewable portfolio
content energy.
P
PCIA Power Charge Indifference Adjustment
Period CCA fifteen-year timeline evaluated in the study from 2020 through
2035.
PEV Plug-in Electric Vehicle
PG&E Pacific Gas & Electric
POC Report Community Choice Energy in the City of San Diego: An Initial Assessment
of Program Prospects, prepared by Protect Our Communities
Foundation, September 25, 2015.
PPA Purchase Power Agreement
PV Photovoltaic
GLOSSARY
July 2017 iv | P a g e
R
RA Resource Adequacy
REC Renewable Energy Certificate or Credit
RPC Renewable Portfolio Content
RPS Renewable Portfolio Standard
RTM Real Time Market
S
SCE Southern California Edison
Scenarios Analyses defined for the feasibility study based on levels of renewable
energy content in the CCA portfolio: Base Case - 50% renewables for
base load customers and 2% opting up to 100% renewable content;
Scenario 2 – 50% renewable content for all customers; Scenario 3 – 80%
renewable content for all customers; Scenario 4 – 100% renewable
content for all customers; and Scenario 5 - 80% renewables for base load
customers and 2% opting up to 100% renewable content.
SDG&E San Diego Gas & Electric, made up of bundled service customers
SEAB City of San Diego Sustainable Energy Advisory Board
Sensitivity Analyses What-if evaluation of the impact on study results based on changes in
the base assumptions: Sensitivity 1 – 6% increase in SDG&E rates;
Sensitivity 2 – 2% decrease in SDG&E rates; Sensitivity 3 – 10% increase
in Power Charge Indifference Adjustment; Sensitivity 4 – 2.5 % decrease
in Power Charge Indifference Adjustment; Sensitivity 5 – 25% Opt Out
Rate, Sensitivity 6 – 15% Opt Out Rate.
State The State of California
Study This City of San Diego Community Choice Aggregate Feasibility Study,
Final Draft, July 2017.
Study Team Collectively Willdan Financial Services and EnerNex LLC, consultants
retained by the City for purposes of this Study
T
TOU Time-of-Use
U
UDC Utility Distribution Company
W
Willdan Willdan Financial Services, consultant retained by the City for purposes
of this Study
I. INTRODUCTION
Community Choice Aggregation (CCA) is a program for local jurisdictions in California (CA or State) to
procure electricity supply for, and develop energy resources to serve, jurisdictional customers. According
to the Local Government Commission,15 the most common reasons for forming a CCA program are to:
• Increase use of renewable generation,
• Exert control over rate setting,
• Stimulate economic growth, and
• Lower rates.
The City of San Diego (City) seeks to understand the feasibility of CCA for meeting goals and objectives
associated with Strategy 2—Clean & Renewable Energy—of the City’s Climate Action Plan (CAP).16 This
CCA Feasibility Study (Study) provides in-depth technical, economic, and financial analyses of the
potential costs, benefits, and risks of CCA for the City under a variety of future outcomes, or scenarios.
The Study is intended to provide policy makers, stakeholders, and electricity consumers information for
assessing the feasibility of a CCA program for the City. This Study was conducted collaboratively with the
City by Willdan Financial Services (Willdan) and EnerNex (collectively, Willdan and EnerNex are referred
to herein as the Study team).
This Study is organized as follows. Section 1 provides the background for this Study including a definition
of Study goals, an explanation of what CCA is, and an overview of the Study approach. Section 2 provides
the Methodology and Assumptions and addresses the load forecast, power supply procurement, and cost
of service (COS) analysis. Section 3 presents financial feasibility Study results and rate comparisons.
Section 4 outlines CCA program benefits, including potential greenhouse gas (GHG) reductions,
economic impacts, and other program opportunities. Section 5 summarizes CCA program risks. Section
6 discusses CCA program implementation. The final section presents conclusions and recommendations.
BACKGROUND
In 2014, Protect Our Communities Foundation
(POC)—a local 501(c)(3) nonprofit advocacy
organization—conducted a preliminary CCA
feasibility report, Appendix A (POC Report), that
recommended more in-depth investigation.17
The City commissioned this follow-up Study in
2016 to provide in-depth technical, economic,
and financial information concerning a CCA
15 Community Choice Aggregation Fact Sheet, funded by the California Energy Commission and Department of Energy prepared
by the Local Government Commission. https://www.lgc.org/resources/community-design/lpu/may2015/ 16 City of San Diego Climate Action Plan, adopted December 2015, amended July 2016.
https://www.sandiego.gov/sustainability/climate-action-plan 17 Community Choice Energy in the City of San Diego: An Initial Assessment of Program Prospects, prepared by Protect Our
Communities Foundation, September 25, 2015. The technical appendices of the POC Report were created by Community
Choice Partners, Inc.
San Diego is taking the lead in
California to tackle climate change.
This CCA Feasibility Study provides
key information for policy makers,
stakeholders, and citizens as the City
acts on this progressive plan.

INTRODUCTION
July 2017 2 | P a g e
program, and to meet the CAP feasibility Study requirement. The CAP was adopted by the City in
December 2015 to “proactively address environmental concerns, strengthen the economy, and improve
San Diegan’s quality of life.” The City’s Sustainable Energy Advisory Board (SEAB), through a stakeholder
engagement process, developed CCA program Guiding Principles and Minimum Performance Criteria
(Appendix B) that were addressed for the Study.
This Study evaluates the financial and economic viability of a City CCA program by:
• Forecasting the electricity load requirements and potential customers by class;
• Estimating the costs of procuring the necessary electricity supply;
• Projecting the costs of starting up and administering the program;
• Assessing the level of revenue by rate class necessary to make the CCA program solvent; and
• Evaluating the impacts of changes in Study assumption on the projected feasibility outcomes by
running five scenarios based on renewable portfolio content (RPC) and six sensitivity analyses.
The Study enumerates the potential benefits and associated risks of a CCA program and discusses
implementation requirements.
GOALS
The CAP identifies a CCA program as a potential mechanism to reach the City’s goal of 100% renewable
energy City wide by 2035. The CAP identifies five bold strategies to reduce GHG emissions to achieve the
2020 and 2035 targets:
1. Energy & Water Efficient Buildings;
2. Clean & Renewable Energy;
3. Bicycling, Walking, and Public Transit and
Land Use;
4. Zero Waste (Gas & Waste Management); and
5. Climate Resiliency.
This Study also considers SEAB CCA Priority Guiding Principles, included as Appendix B:
• Model CCA launch as an opt-out program to optimize the purchasing power of the CCA program.
• Consider available information including the third party sponsored CCA feasibility study funded
by the Protect Our Communities Foundation (the POC Report), included as Appendix A.
• Evaluate the economic development potential of CCA.
• Evaluate the ability of CCA to achieve GHG emission reduction targets.
• Evaluate a resource plan that follows the state loading order with an emphasis on local
implementation.
• Evaluate the ability to achieve 100% local renewables by 2035.
• Evaluate a business and implementation phase-in plan to achieve targets identified in the SEAB
Recommended Minimum Performance Table, included in Appendix B.
Cost competitiveness, GHG reduction, economic benefits, local control, increasing renewable
generation, among other considerations, factor into determination of CCA feasibility. The Study team
The CAP identifies a CCA
program as a potential
mechanism to reach its goal
of 100% renewable energy
City wide by 2035.
INTRODUCTION
City of San Diego Community Choice Aggregate Feasibility Study 3 | P a g e
and City staff prioritized feasibility based on the Request for Proposals’ scope of services, the SEAB
Guiding Principles and Criteria, and professional recommendations from the Study team. The Study
complied with all SEAB Guiding Principle requirements.
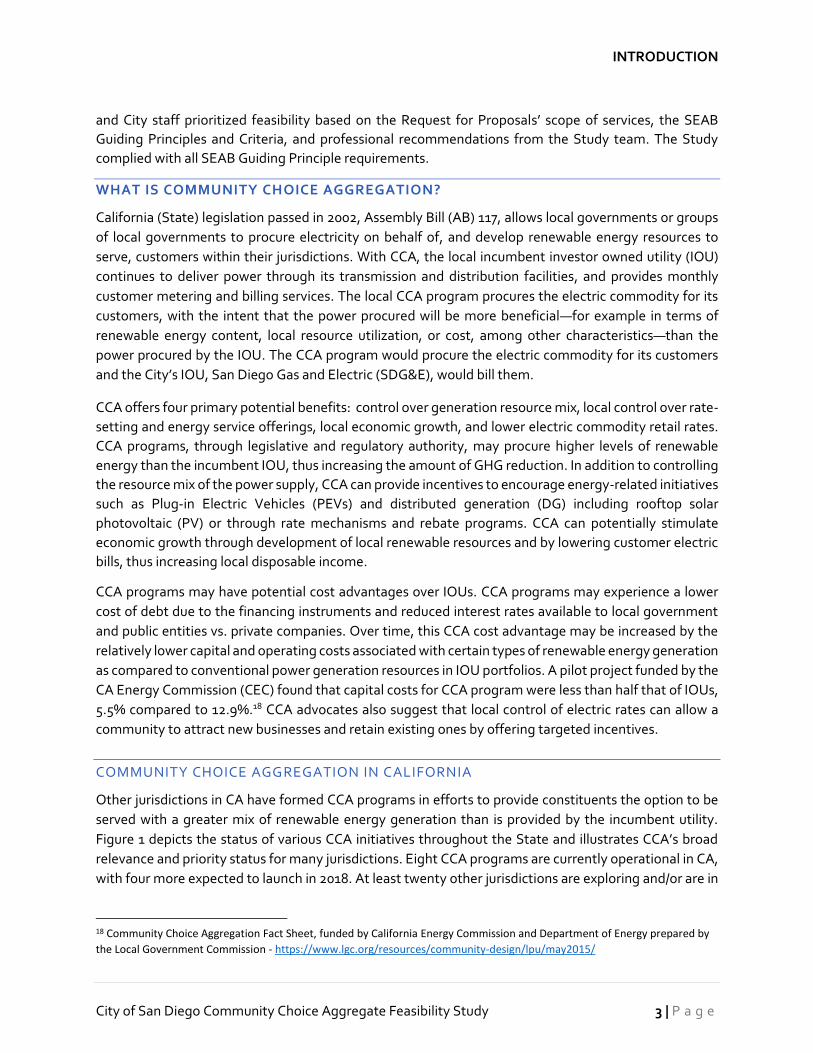
WHAT IS COMMUNITY CHOICE AGGREGATION?
California (State) legislation passed in 2002, Assembly Bill (AB) 117, allows local governments or groups
of local governments to procure electricity on behalf of, and develop renewable energy resources to
serve, customers within their jurisdictions. With CCA, the local incumbent investor owned utility (IOU)
continues to deliver power through its transmission and distribution facilities, and provides monthly
customer metering and billing services. The local CCA program procures the electric commodity for its
customers, with the intent that the power procured will be more beneficial—for example in terms of
renewable energy content, local resource utilization, or cost, among other characteristics—than the
power procured by the IOU. The CCA program would procure the electric commodity for its customers
and the City’s IOU, San Diego Gas and Electric (SDG&E), would bill them.
CCA offers four primary potential benefits: control over generation resource mix, local control over rate-
setting and energy service offerings, local economic growth, and lower electric commodity retail rates.
CCA programs, through legislative and regulatory authority, may procure higher levels of renewable
energy than the incumbent IOU, thus increasing the amount of GHG reduction. In addition to controlling
the resource mix of the power supply, CCA can provide incentives to encourage energy-related initiatives
such as Plug-in Electric Vehicles (PEVs) and distributed generation (DG) including rooftop solar
photovoltaic (PV) or through rate mechanisms and rebate programs. CCA can potentially stimulate
economic growth through development of local renewable resources and by lowering customer electric
bills, thus increasing local disposable income.
CCA programs may have potential cost advantages over IOUs. CCA programs may experience a lower
cost of debt due to the financing instruments and reduced interest rates available to local government
and public entities vs. private companies. Over time, this CCA cost advantage may be increased by the
relatively lower capital and operating costs associated with certain types of renewable energy generation
as compared to conventional power generation resources in IOU portfolios. A pilot project funded by the
CA Energy Commission (CEC) found that capital costs for CCA program were less than half that of IOUs,
5.5% compared to 12.9%.18 CCA advocates also suggest that local control of electric rates can allow a
community to attract new businesses and retain existing ones by offering targeted incentives.
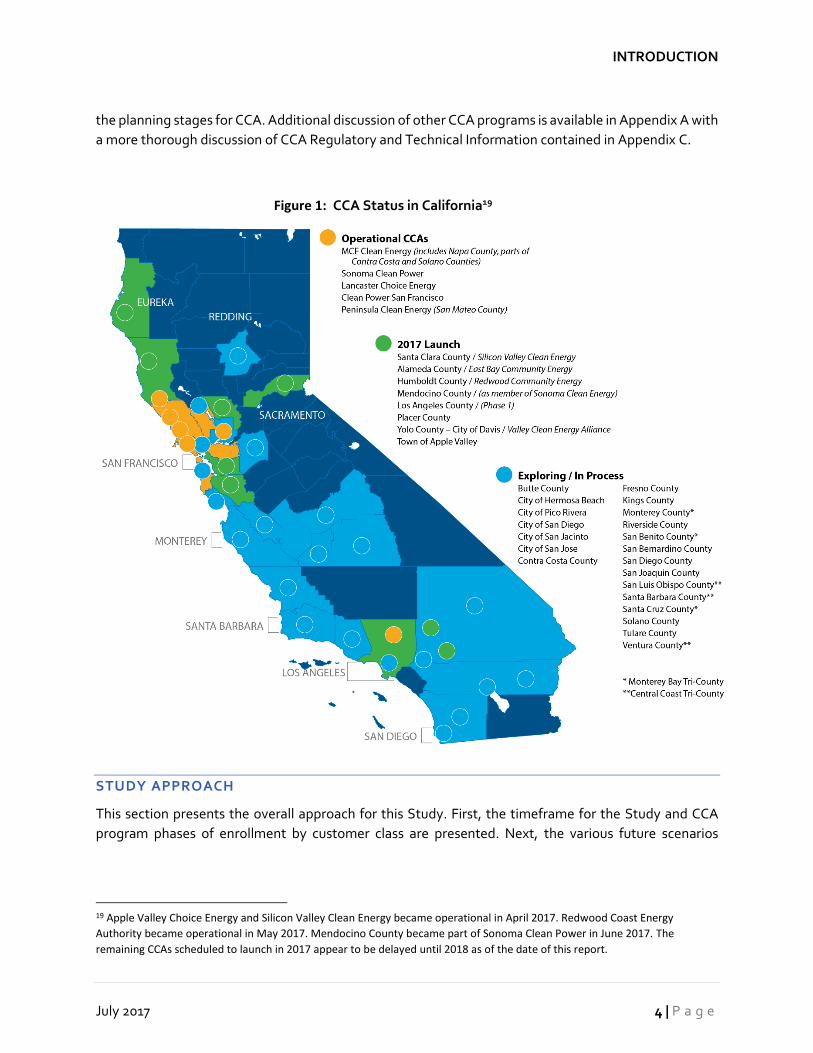
COMMUNITY CHOICE AGGREGATION IN CALIFORNIA
Other jurisdictions in CA have formed CCA programs in efforts to provide constituents the option to be
served with a greater mix of renewable energy generation than is provided by the incumbent utility.
Figure 1 depicts the status of various CCA initiatives throughout the State and illustrates CCA’s broad
relevance and priority status for many jurisdictions. Eight CCA programs are currently operational in CA,
with four more expected to launch in 2018. At least twenty other jurisdictions are exploring and/or are in
18 Community Choice Aggregation Fact Sheet, funded by California Energy Commission and Department of Energy prepared by
the Local Government Commission - https://www.lgc.org/resources/community-design/lpu/may2015/
INTRODUCTION
July 2017 4 | P a g e
the planning stages for CCA. Additional discussion of other CCA programs is available in Appendix A with
a more thorough discussion of CCA Regulatory and Technical Information contained in Appendix C.
Figure 1: CCA Status in California19
STUDY APPROACH
This section presents the overall approach for this Study. First, the timeframe for the Study and CCA
program phases of enrollment by customer class are presented. Next, the various future scenarios
19 Apple Valley Choice Energy and Silicon Valley Clean Energy became operational in April 2017. Redwood Coast Energy
Authority became operational in May 2017. Mendocino County became part of Sonoma Clean Power in June 2017. The
remaining CCAs scheduled to launch in 2017 appear to be delayed until 2018 as of the date of this report.

INTRODUCTION
City of San Diego Community Choice Aggregate Feasibility Study 5 | P a g e
analyzed as part of this Study are defined. Finally, additional sensitivity analyses conducted for this Study
are explained.
TIMELINE AND PHASES
The Study examined a timeframe corresponding to the City’s CAP goals: May 2020 through 2035. Based
on research of other CCA programs and professional experience, customer phase-in offers the best
opportunity for the CCA program to work through initial startup operations while generating sufficient
startup revenues. For this reason, the Study assumed the CCA program would include three enrollment
periods for different groups of customer classes, as detailed in Table 1. Additional details regarding the
phase in assumptions are provided in Section II: Methodology and Assumptions under the heading
“Launch Phases.”
Table 1: CCA Program Enrollment Phases and Customer Data
Phase
Assumed Enrollment
Date
Customer Classification
I May 2020
Large Commercial and Industrial Customers, Agriculture and Pumping, Outdoor Lighting
II Nov 2020 Small Commercial Customers
III May 2021 Residential Customers
SCENARIOS
Working collaboratively, the City and its consultants defined five CCA scenarios that best capture the
range of possible CCA program operating outcomes. The City seeks to achieve a goal of a 100%
renewable electric supply City wide by 2035. For
financial and practical reasons, attainment of this
goal cannot be achieved immediately and instead
must be phased in over time. The City has the goal of
procuring a higher renewable generation content
portfolio more quickly relative to SDG&E, its
incumbent IOU, and, potentially, other competing
Electric Service Providers (ESPs). However, the
increased cost of renewable energy resources above
conventional, natural gas-fired generation resources
may disadvantage the CCA program for years. Based
on current industry expectations should: SDG&E and competing ESPs increase renewable portfolio
percentages, the CCA program develop additional local renewables, and the cost of renewables decline
due to economic factors and technological advances, the CCA program would become more cost
competitive.
The Study includes a Base Case
Scenario of 50% RPC and 2% of
customers opting up to 100%
RPC. In addition, four Scenarios
and six Sensitivity Analyses were
evaluated against Base Case
Scenario results.

INTRODUCTION
July 2017 6 | P a g e
For purposes of this Study, the City and Study team defined five scenarios and six sensitivity analyses to
capture a reasonable range of possible outcomes and to test the feasibility of the CCA program. The
cases examined different levels of RPC within the CCA program power supply mix and different
percentages of customers opting to purchase 100% renewable power from the CCA program.
Throughout the Study, this customer option to purchase 100% renewable power is termed “opting up,”
or “opt up” and is separate from the concept of “opting out” of CCA program service, which refers to
eligible customers choosing not to purchase power from the CCA. These scenarios bound the effect of
renewable generation content on costs and potential carbon dioxide (CO2) emission reductions. While
the Base Case and alternate scenarios can be considered reasonable for the purposes of this Study, they
are not intended to capture all possible future outcomes. Actual future circumstances could vary
significantly from the assumptions, inputs, and forecasts used within this Study.
Table 2 summarizes the scenarios analyzed for this Study. The Base Case Scenario consists of 50% RPC
with 2% of CCA customers opting up to 100% RPC, best capturing likely conditions for the first five years
of CCA operations. The remaining 98% of CCA customers are assumed to stay in the 50% RPC program.
Against this Base Case Scenario, an additional four scenarios were examined, Scenarios 2 through 5.
Scenario 2, includes a 50% RPC but does not include customers opting up to 100% RPC. Scenario 3
includes an 80% RPC with no customer opt up. Scenario 4 includes a 100% RPC, and no customers opting
up. Finally, Scenario 5 includes an 80% RPC with 2% of customers opting up to 100% renewable
resources. The opt up to 100% RPC option is voluntary for CCA customers and similar to programs offered
by all currently operating CCAs and SDG&E’s EcoChoice program. The 80% RPC (Scenarios 3 and 5) and
the 100% RPC Scenario 4 are designed to show the impact of increasing renewables content on costs.
The amount of CCA program customers assumed to opt up to 100% RPC, 2%, was chosen based on opt
up rates experienced by other CCAs across the state, notably MCE Clean Energy (MCE) as referenced in
its 2017 Integrated Resource Plan.20 Unless otherwise noted, all Study results reflect the Base Case
Scenario. In reality, the CCA program would likely gradually ramp up RPC over time to attain 100% RPC
by 2035 to achieve CAP goals, if proven economically viable.
Table 2: Scenario Definitions for Study
Scenario Description
Base Case
Scenario:
50% Renewable Portfolio Content power supply for 98% of CCA customers with
the remaining 2% of CCA customers opting up to the 100% Renewable Portfolio
Content optional program
Scenario 2: 50% Renewable Portfolio Content power supply for all customers
Scenario 3: 80% Renewable Portfolio Content power supply for all customers
Scenario 4: 100% Renewable Portfolio Content power supply for all customers
Scenario 5:
80% Renewable Portfolio Content power supply for 98% of CCA customers with
the remaining 2% of CCA customers opting up to the 100% Renewable Portfolio
Content optional program
20 Refer to: https://www.mcecleanenergy.org/key-documents

INTRODUCTION
City of San Diego Community Choice Aggregate Feasibility Study 7 | P a g e
Figure 2 illustrates the CCA program RPC for Scenarios 2, 3, and 4 (defined in Table 2) over the Study horizon compared to two SDG&E RPC forecasts. The first SDG&E RPC forecast is based on SDG&E complying with the State-mandated Renewable Portfolio Standard (RPS) and attaining 50% by 2030 from its 45.2% level in 2020.21 The second forecast demonstrates the current trend for SDG&E’s RPC solely for illustrative purposes; absent increased RPS mandates or other market factors, SDG&E has not indicated that it would exceed the 50% RPS-mandated RPC. Finally, a fourth line has been included that models an increasing CCA RPC trend from 50% to 100% over the Study term, labeled the Progressive CCA RPC. This last trend line illustrates how the CCA program could potentially transition to higher levels of RPC over time. Additionally, Figure 39 on page 67 illustrates how the CCA program could competitively increase RPC based on its rates relative to those of SDG&E.
Figure 2: Study Renewable Portfolio Content Scenarios v. SDG&E
SENSITIVITIES
Six additional sensitivity analyses were run around the Base Case Scenario to examine the impact of
changes in key CCA program cost drivers to operating performance and feasibility outcomes. The first
21 California Public Utilities Commission Renewable Portfolio Standard Homepage accessed March, 2017:
http://www.cpuc.ca.gov/RPS_Homepage/
INTRODUCTION
July 2017 8 | P a g e
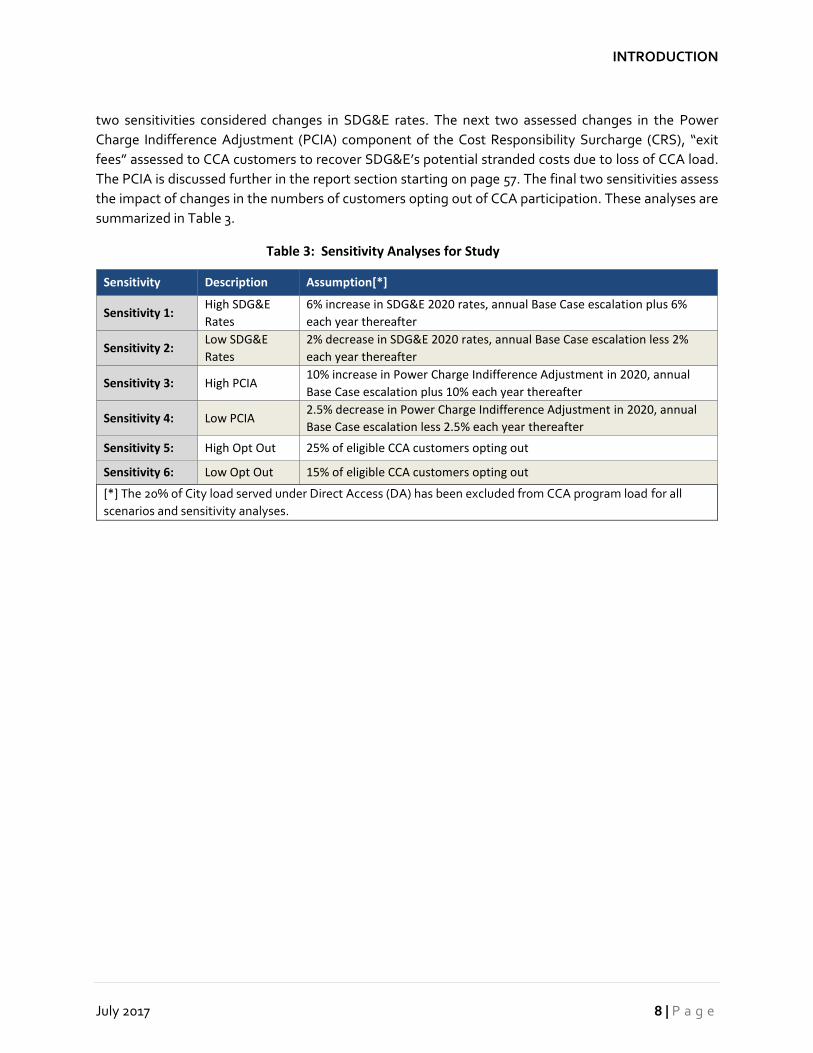
two sensitivities considered changes in SDG&E rates. The next two assessed changes in the Power
Charge Indifference Adjustment (PCIA) component of the Cost Responsibility Surcharge (CRS), “exit
fees” assessed to CCA customers to recover SDG&E’s potential stranded costs due to loss of CCA load.
The PCIA is discussed further in the report section starting on page 57. The final two sensitivities assess
the impact of changes in the numbers of customers opting out of CCA participation. These analyses are
summarized in Table 3.
Table 3: Sensitivity Analyses for Study
Sensitivity Description Assumption[*]
Sensitivity 1: High SDG&E
Rates
6% increase in SDG&E 2020 rates, annual Base Case escalation plus 6%
each year thereafter
Sensitivity 2: Low SDG&E
Rates
2% decrease in SDG&E 2020 rates, annual Base Case escalation less 2%
each year thereafter
Sensitivity 3: High PCIA 10% increase in Power Charge Indifference Adjustment in 2020, annual
Base Case escalation plus 10% each year thereafter
Sensitivity 4: Low PCIA 2.5% decrease in Power Charge Indifference Adjustment in 2020, annual
Base Case escalation less 2.5% each year thereafter
Sensitivity 5: High Opt Out 25% of eligible CCA customers opting out
Sensitivity 6: Low Opt Out 15% of eligible CCA customers opting out
[*] The 20% of City load served under Direct Access (DA) has been excluded from CCA program load for all
scenarios and sensitivity analyses.

II. METHODOLOGY AND ASSUMPTIONS
This section of the report provides the methodologies and assumptions for the three foundational Study
analyses: load forecast, power procurement, and COS. Section III, Results, presents results for the
scenarios and sensitivity analyses defined above.
LOAD FORECAST
The fundamental operational role of a CCA is to procure
energy and associated energy related services to meet
these needs. Forecasting and risk management are primary
tasks conducted for power procurement. Power
procurement planning and day-to-day decision-making
rely heavily on short-term and long-term forecasts of
consumer demand for power. The procurement function
must also evaluate and assess the inherent risks associated
with demand forecasting and develop appropriate risk mitigation strategies. Though no one can predict
future energy demand with 100% certainty, logical, data-driven, industry-standard forecasting
methodologies are available to provide a realistic outlook of energy demand under a variety of future
scenarios.
Electricity supply consists of two components: energy measured in kilowatt hours (kWh) or Megawatt
hours (MWh); and capacity or demand measured in kilowatts (kW) or Megawatts (MW). In typical
parlance, energy represents a flow, or volume, of power over some period, typically expressed in terms
of hours. For example, a customer using an average of 1 kW over the course of a month uses 730 kWh (1
kW times 730 average monthly hours). A 100 MW power plant running at full production for a day
produces 2,400 MWh of energy (100 MW times 24 hours). Capacity refers to the capability of available
generation resources and, sometimes, demand-side resources to meet the system’s requirement for
power. In the power plant example, 100 MW is the capacity of the plant. Capacity and demand represent
the amount of power available, or required to be served, at a particular instant. Unlike other
commodities, electricity cannot be stored:22 electricity supply must instantaneously serve demand in real
time. When planning for energy supply requirements, both the amount of energy consumed and
precisely when that energy is consumed must therefore be considered. Consumption data must be
analyzed by hour on a daily, weekly, and seasonal basis to create effective load profiles and power
forecasts. A CCA program must purchase both energy to meet the consumption needs of its customers
and capacity to meet customer demand, and therefore must forecast both.
For this Study, the amount of energy that CCA customers would use is based on historical consumption data obtained from SDG&E as well as consideration of other forward-looking variables including the load growth forecast and the proliferation and variable output of customer-owned solar PV DG. The load forecasting methodology for this Study included three activities: analysis of historic customer data, forecasting future requirements, and incorporating adjustments for anticipated changes. The following
22 Electricity storage technologies actually convert electricity into other forms. For example, battery storage is really the use of
electricity to charge batteries.
The fundamental operational
role of a CCA is to procure
energy and associated
energy related services.
METHODOLOGY AND ASSUMPTIONS
July 2017 10 | P a g e
sections discuss these methodological components and present the resulting load forecast by customer class.
ANALYSIS OF HISTORICAL DATA
This section describes how historical City data were analyzed for purposes of the Study and includes
2013-15 SDG&E load data and SDG&E data reported to the Energy Information Administration (EIA) for
2001-15.
SDG&E 2013-15 LOAD DATA
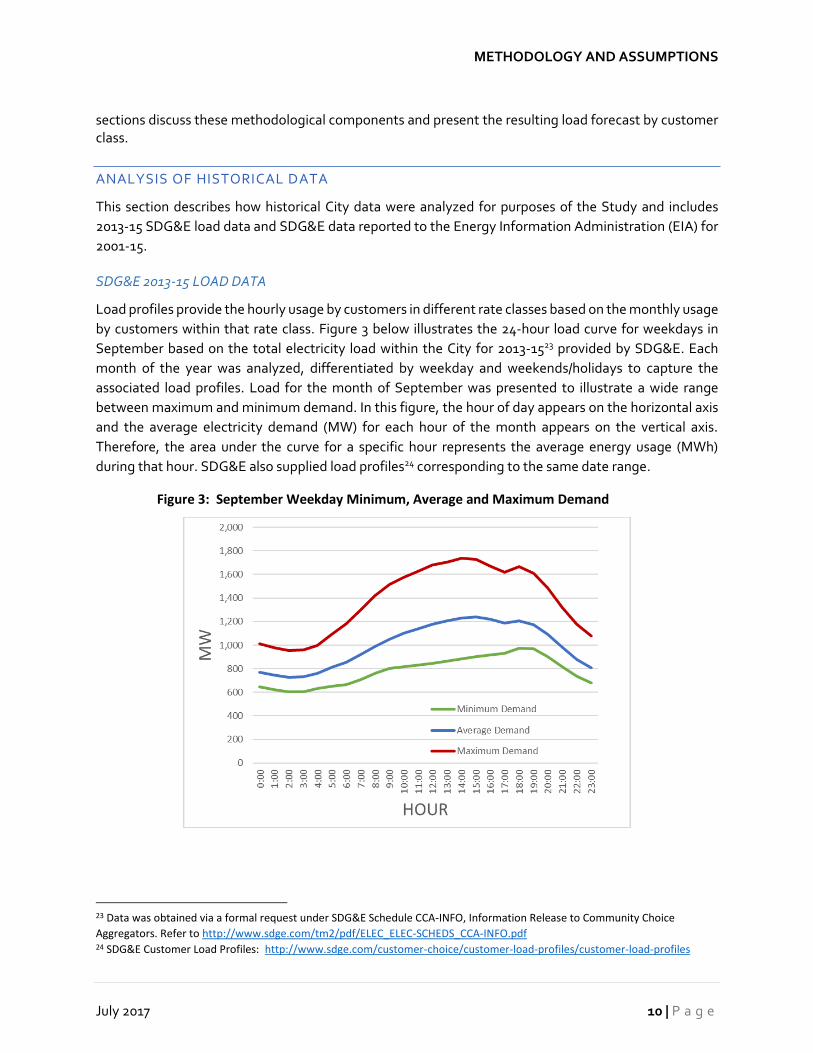
Load profiles provide the hourly usage by customers in different rate classes based on the monthly usage
by customers within that rate class. Figure 3 below illustrates the 24-hour load curve for weekdays in
September based on the total electricity load within the City for 2013-1523 provided by SDG&E. Each
month of the year was analyzed, differentiated by weekday and weekends/holidays to capture the
associated load profiles. Load for the month of September was presented to illustrate a wide range
between maximum and minimum demand. In this figure, the hour of day appears on the horizontal axis
and the average electricity demand (MW) for each hour of the month appears on the vertical axis.
Therefore, the area under the curve for a specific hour represents the average energy usage (MWh)
during that hour. SDG&E also supplied load profiles24 corresponding to the same date range.
Figure 3: September Weekday Minimum, Average and Maximum Demand
23 Data was obtained via a formal request under SDG&E Schedule CCA-INFO, Information Release to Community Choice
Aggregators. Refer to http://www.sdge.com/tm2/pdf/ELEC_ELEC-SCHEDS_CCA-INFO.pdf 24 SDG&E Customer Load Profiles: http://www.sdge.com/customer-choice/customer-load-profiles/customer-load-profiles

METHODOLOGY AND ASSUMPTIONS
City of San Diego Community Choice Aggregate Feasibility Study 11 | P a g e
Currently, in the City, electric customers have the option of
purchasing electric supply from SDG&E (bundled service
customers) or via Direct Access (DA) service from an ESP.25
While most DA customers are larger commercial customers,
residential customers currently on DA are still eligible for DA
service. New residential customers are not eligible for DA
service. ESPs currently provide 20% of the electricity used in
the City.26 SDG&E declined to provide the number of DA
customers and load by customer class; therefore, the data
presented in Table 4 could only be analyzed on an annual
energy basis. Since DA customers are not likely to join a CCA
due to an existing contract with an ESP, for purposes of this
Study DA customers have been excluded from the load
forecast. Except for purposes of creating the long-term load
profile, as discussed on Page 12 , the Study considers only bundled customer data. The actual historical
electricity usage detailed in the data provided by SDG&E for all customers in the City versus bundled
customers is shown in Table 4.
Table 4: City Bundled and Direct Access Customer Electricity Consumption (2015 MWh)
Customer Type Bundled Direct Access
Total Non-Residential
Usage
Direct Access Portion
Non-Residential 4,451,557 1,773,469 6,225,026 28.5%
Residential 2,467,694 3,115 2,470,809 0.1%
Total 6,919,251 1,776,584 8,695,835 20.4%
Using this bundled City data, load profiles by customer class were created as illustrated in Figure 4. These
profiles illustrate the load requirements by time of day to provide a basis for forecasts and CCA program
power procurement decisions. Detailed profiles for all months for weekdays and weekends are included
in Appendix D: Load Forecast Development.
25 Electric Service Provider - List and Registration Information http://www.cpuc.ca.gov/esp/ 26 SDG&E Limited Reopening of Direct Access: http://www.sdge.com/customer-choice/customer-choice/limited-reopening-
direct-access
Direct Access customers
purchase electricity from
an Electricity Service
Provider. Existing Direct
Access customers in the
City represent
approximately 20% of
load and have been
excluded from the Study.

METHODOLOGY AND ASSUMPTIONS
July 2017 12 | P a g e
Figure 4: Average Weekday Electricity Demand (kW) and Usage (kWh) for Each Hour of Each
Month
SDG&E 2001-15 ENERGY INFORMATION ADMINISTRATION REPORTED DATA
Two years of historic data is insufficient to support a long-term load forecast. Therefore, these data were
augmented by Form EIA-82627 data for SDG&E’s service territory from 2001 to 2015. Form EIA-826 data
includes DA customers and therefore was adjusted to obtain bundled customer data. Using both the two-
year historic and the Form EIA-826 data sets, the load growth shape (slope of the curve) was extrapolated
to the subset of bundled City data as shown in Figure 5. The green curve labeled “CCA Usage Forecast”
provides the load growth basis for the 2020-2035 load forecast used in the Study.
27 Department of Energy’s Information Administration, Form EIA-826, Monthly SDG&E Delivery & Sales 2010-2015:
http://www.eia.gov/electricity/data/eia826/
METHODOLOGY AND ASSUMPTIONS
City of San Diego Community Choice Aggregate Feasibility Study 13 | P a g e
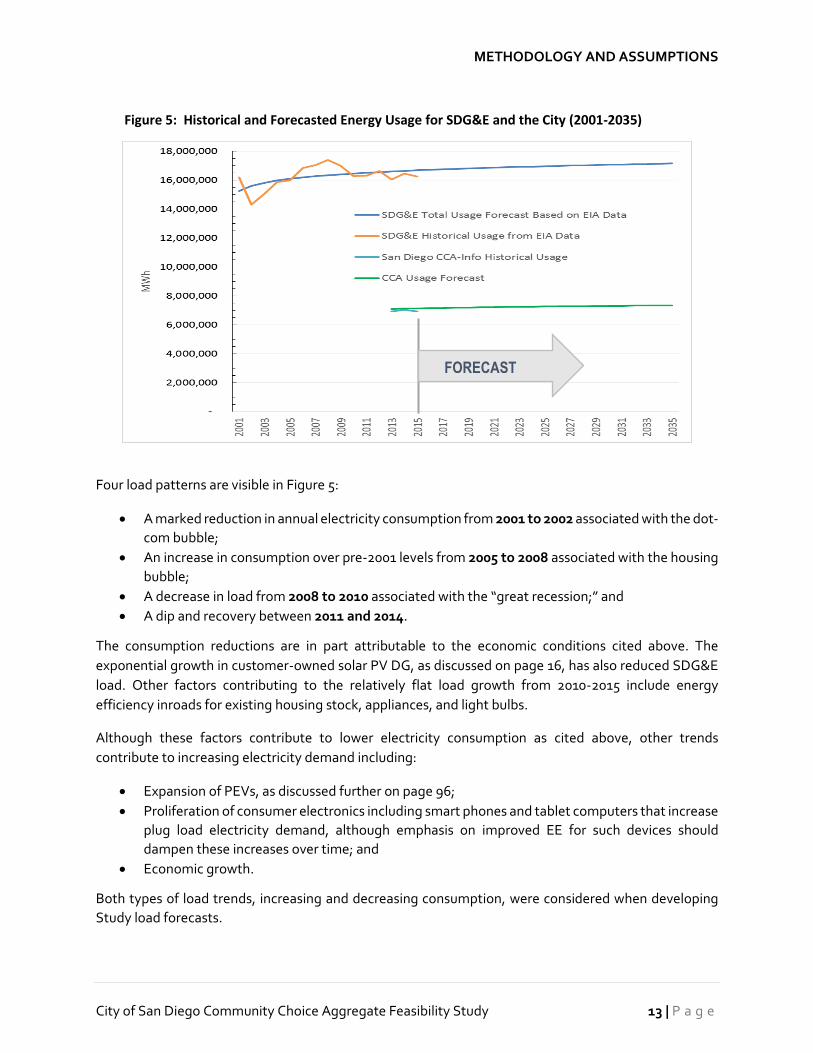
Figure 5: Historical and Forecasted Energy Usage for SDG&E and the City (2001-2035)
Four load patterns are visible in Figure 5:
• A marked reduction in annual electricity consumption from 2001 to 2002 associated with the dot-
com bubble;
• An increase in consumption over pre-2001 levels from 2005 to 2008 associated with the housing
bubble;
• A decrease in load from 2008 to 2010 associated with the “great recession;” and
• A dip and recovery between 2011 and 2014.
The consumption reductions are in part attributable to the economic conditions cited above. The
exponential growth in customer-owned solar PV DG, as discussed on page 16, has also reduced SDG&E
load. Other factors contributing to the relatively flat load growth from 2010-2015 include energy
efficiency inroads for existing housing stock, appliances, and light bulbs.
Although these factors contribute to lower electricity consumption as cited above, other trends
contribute to increasing electricity demand including:
• Expansion of PEVs, as discussed further on page 96;
• Proliferation of consumer electronics including smart phones and tablet computers that increase
plug load electricity demand, although emphasis on improved EE for such devices should
dampen these increases over time; and
• Economic growth.
Both types of load trends, increasing and decreasing consumption, were considered when developing
Study load forecasts.
FORECAST
METHODOLOGY AND ASSUMPTIONS
July 2017 14 | P a g e
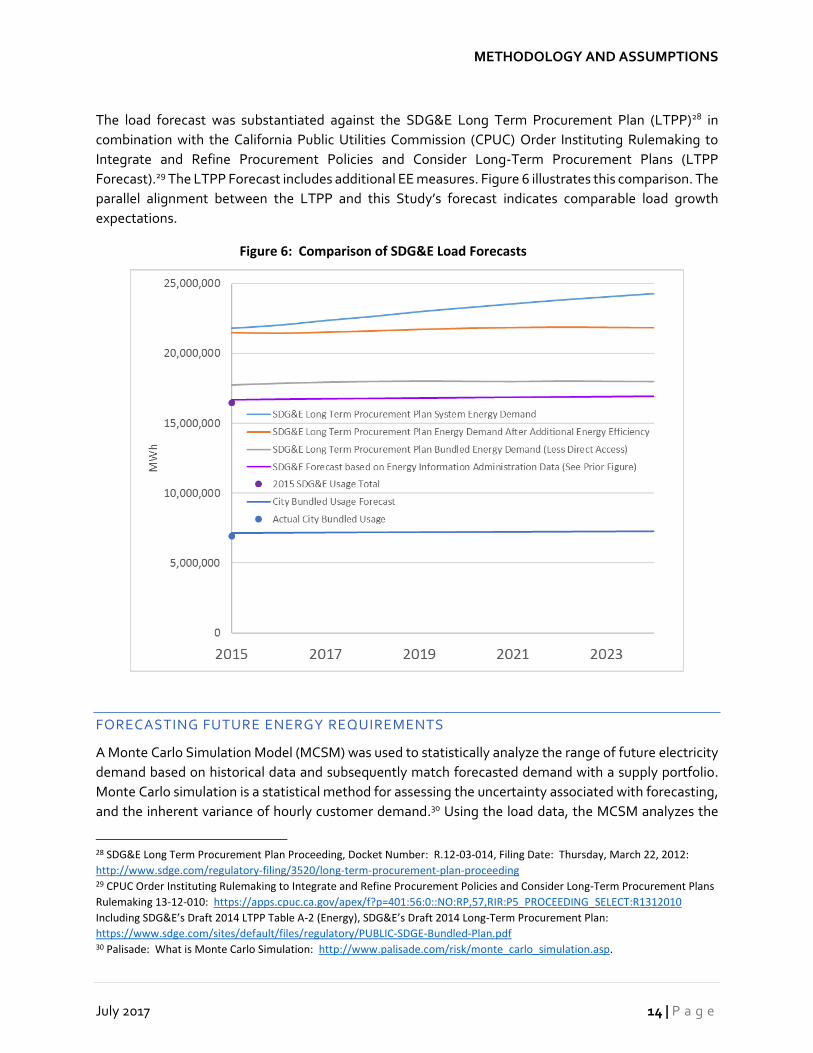
The load forecast was substantiated against the SDG&E Long Term Procurement Plan (LTPP)28 in
combination with the California Public Utilities Commission (CPUC) Order Instituting Rulemaking to
Integrate and Refine Procurement Policies and Consider Long-Term Procurement Plans (LTPP
Forecast).29 The LTPP Forecast includes additional EE measures. Figure 6 illustrates this comparison. The
parallel alignment between the LTPP and this Study’s forecast indicates comparable load growth
expectations.
Figure 6: Comparison of SDG&E Load Forecasts
FORECASTING FUTURE ENERGY REQUIREMENTS
A Monte Carlo Simulation Model (MCSM) was used to statistically analyze the range of future electricity
demand based on historical data and subsequently match forecasted demand with a supply portfolio.
Monte Carlo simulation is a statistical method for assessing the uncertainty associated with forecasting,
and the inherent variance of hourly customer demand.30 Using the load data, the MCSM analyzes the
28 SDG&E Long Term Procurement Plan Proceeding, Docket Number: R.12-03-014, Filing Date: Thursday, March 22, 2012:
http://www.sdge.com/regulatory-filing/3520/long-term-procurement-plan-proceeding 29 CPUC Order Instituting Rulemaking to Integrate and Refine Procurement Policies and Consider Long-Term Procurement Plans
Rulemaking 13-12-010: https://apps.cpuc.ca.gov/apex/f?p=401:56:0::NO:RP,57,RIR:P5_PROCEEDING_SELECT:R1312010
Including SDG&E’s Draft 2014 LTPP Table A-2 (Energy), SDG&E’s Draft 2014 Long-Term Procurement Plan:
https://www.sdge.com/sites/default/files/regulatory/PUBLIC-SDGE-Bundled-Plan.pdf 30 Palisade: What is Monte Carlo Simulation: http://www.palisade.com/risk/monte_carlo_simulation.asp.

METHODOLOGY AND ASSUMPTIONS
City of San Diego Community Choice Aggregate Feasibility Study 15 | P a g e
statistical range of possible outcomes and develops “confidence intervals” (CI) for the expected range of
electricity demand and power supply costs for each hour of each month for the fifteen-year Study period.
Additional information on the MCSM and forecasting methodology appears in Appendix E.
The Study uses the 95% CI load forecast, which represents a 95% statistical probability that the demand
will be equal to or less than the prediction and a 5% chance demand would be outside of this range. The
following figures illustrate the maximum, minimum and average electricity demand for each hour of each
month for weekdays (Figure 7) and for weekends/holidays (Figure 8) for all rate classes combined. The
statistically-based load profile represents the range of the likeliest outcomes within a defined level of
probability. In addition to minimum, average, and maximum usage, the charts illustrate the 95% CI band
(+95% CI and -95% CI) around the average derived from the MCSM. These data indicate that, for both
data series, significant demand variability exists from May through October, with less variability during
winter and early spring.
Figure 7: Weekday Estimated Demand

METHODOLOGY AND ASSUMPTIONS
July 2017 16 | P a g e
Figure 8: Weekend/Holiday Estimated Demand
ADJUSTMENTS
The load forecast developed for the Study was then adjusted to reflect expected changes arising over the
Study horizon (2020-2035) including those related to DG, opt out rates, and launch phases as discussed
in the following sections.
DISTRIBUTED ENERGY RESOURCES
With emerging customer-owned DG and DSM, customers are more actively engaged with their
electricity supply than historically and such trends potentially impact load forecasts for the CCA program
as discussed in this section.
The majority of DG in San Diego is solar PV.31 Solar PV impacts the Study in two ways: (1) due to its uncontrollable or variable output; and (2) due to its impact on customer usage served by the Load Serving Entity (LSE). Solar PV is known as a variable energy resource because its output is not directly controllable.32 The intermittent nature of solar PV contrasts with the controllable nature of traditional fossil-fueled generation resources, the output of which can be controlled incrementally. The output of variable energy resources, like solar PV, varies depending on time of day, time of year, and other factors such as cloud cover. From the CCA program’s perspective, customer-owned solar PV DG has the effect of lowering a customer’s electricity demand or usage. Data from the CA Solar Initiative “currently
31 California Distributed Generation Statistics: http://www.californiadgstats.ca.gov/ 32 California is considering “Smart” inverters as part of the Title 21 interconnection requirements to install DG.
http://www.energy.ca.gov/electricity_analysis/rule21/

METHODOLOGY AND ASSUMPTIONS
City of San Diego Community Choice Aggregate Feasibility Study 17 | P a g e
connected” data set33 demonstrate the nearly exponential growth in customer-owned solar PV DG within the City since 1999 as illustrated in Figure 9.
To analyze the daily and seasonal
variability of customer-owned
solar PV DG in the City, a
generation profile was developed
using the National Renewable
Energy Laboratory’s (NREL’s)
PVWatts calculator.34 Figures 10
and 11 illustrate the customer-
owned solar PV DG-served load,
over and above the bundled
electric load currently served by
SDG&E for weekdays and
weekends/holidays, respectively.
In other words, the red curve on
top of the green curve represents
the level of electricity demand
without customer solar PV
generation. This output has been
incorporated in the determination
of power supply requirements for the CCA program as discussed below.
Figure 10: Impact of Solar Photovoltaic Distributed Generation on Weekday City Load
33 Ibid. Current as of Aug. 30, 2016.34 National Renewable Energy Laboratory (NREL) PVWatts® Calculator. http://pvwatts.nrel.gov/
Figure 9: Customer Owned Photovoltaic Solar in the
City

METHODOLOGY AND ASSUMPTIONS
July 2017 18 | P a g e
Figure 11: Impact of Solar Photovoltaic Distributed Generation on Weekend/Holiday City Load
Over the load forecast horizon, expansion of customer-owned solar PV DG is expected to continue,
reducing the amount of power to be procured and served by SDG&E or the CCA program. To assess how
DG penetration (assumed to be predominately solar PV) will impact future loads, historical City-specific
solar PV installation data from California DG Statistics35 was extrapolated into the forecast illustrated in
Figure 12. The MCSM analysis also accounts for the variability of the DG PV output and the resulting need
for the CCA program to increase or decrease the amount of California Independent System Operator
(CAISO) energy supplied to customers in real time to meet this increasingly dynamic load.
35 California Distributed Generation Statistics: http://www.californiadgstats.ca.gov/. Formerly California Solar Statistics.

METHODOLOGY AND ASSUMPTIONS
City of San Diego Community Choice Aggregate Feasibility Study 19 | P a g e
Figure 12: Customer Owned Solar Distributed Generation in the City (2010 – 2035)
The Net Forecast lines in Figure 13 illustrate the effect of customer-owned DG solar PV on the forecasted
amount of energy sold by the CCA program for the Study. While the overall demand within the City is
expected to increase slowly across the forecast period (the Load Forecast Trend lines), DG reduces the
amount of energy sold by the CCA program, a trend affecting all LSEs in the State. PEV proliferation,
economic expansion, and other factors could offset some portion of this load reduction from PV DG
deployment.
FORECAST

METHODOLOGY AND ASSUMPTIONS
July 2017 20 | P a g e
Figure 13: Load Forecast and Net Load Forecast
OPT OUT RATES
Another important Study assumption is the level of load that will opt out of joining the CCA program. As
discussed previously, the Study assumes that all DA customers will opt out of CCA participation. To
assess the level of additional bundled customer opt out, the actual experience of other State CCAs was
reviewed. Implementation planning and feasibility studies for other CCA programs use opt-out
percentages ranging from 15% to 20%. However, actual opt-out rates experienced by the CCA programs
have been lower, ranging from 1% to 23% as summarized in Table 5.
METHODOLOGY AND ASSUMPTIONS
City of San Diego Community Choice Aggregate Feasibility Study 21 | P a g e
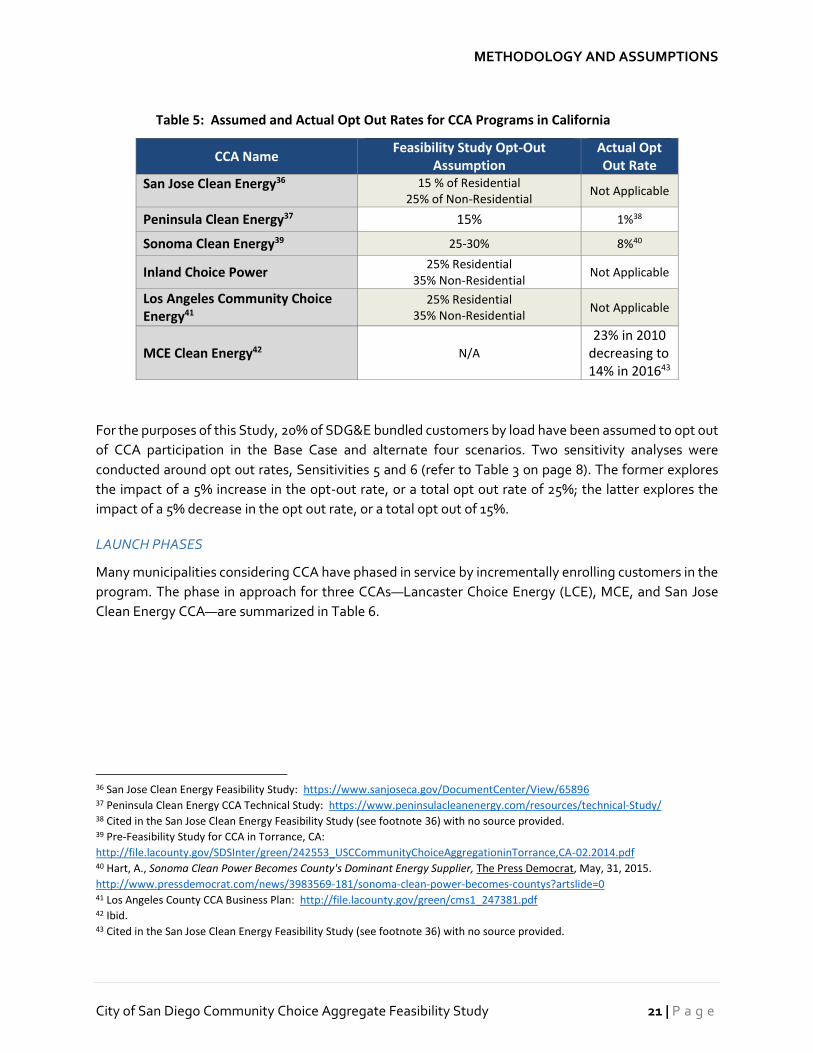
Table 5: Assumed and Actual Opt Out Rates for CCA Programs in California
CCA Name Feasibility Study Opt-Out
Assumption Actual Opt Out Rate
San Jose Clean Energy36 15 % of Residential 25% of Non-Residential
Not Applicable
Peninsula Clean Energy37 15% 1%38
Sonoma Clean Energy39 25-30% 8%40
Inland Choice Power 25% Residential
35% Non-Residential Not Applicable
Los Angeles Community Choice Energy41
25% Residential 35% Non-Residential
Not Applicable
MCE Clean Energy42 N/A
23% in 2010 decreasing to 14% in 201643
For the purposes of this Study, 20% of SDG&E bundled customers by load have been assumed to opt out
of CCA participation in the Base Case and alternate four scenarios. Two sensitivity analyses were
conducted around opt out rates, Sensitivities 5 and 6 (refer to Table 3 on page 8). The former explores
the impact of a 5% increase in the opt-out rate, or a total opt out rate of 25%; the latter explores the
impact of a 5% decrease in the opt out rate, or a total opt out of 15%.
LAUNCH PHASES
Many municipalities considering CCA have phased in service by incrementally enrolling customers in the
program. The phase in approach for three CCAs—Lancaster Choice Energy (LCE), MCE, and San Jose
Clean Energy CCA—are summarized in Table 6.
36 San Jose Clean Energy Feasibility Study: https://www.sanjoseca.gov/DocumentCenter/View/65896 37 Peninsula Clean Energy CCA Technical Study: https://www.peninsulacleanenergy.com/resources/technical-Study/ 38 Cited in the San Jose Clean Energy Feasibility Study (see footnote 36) with no source provided. 39 Pre-Feasibility Study for CCA in Torrance, CA:
http://file.lacounty.gov/SDSInter/green/242553_USCCommunityChoiceAggregationinTorrance,CA-02.2014.pdf 40 Hart, A., Sonoma Clean Power Becomes County's Dominant Energy Supplier, The Press Democrat, May, 31, 2015.
http://www.pressdemocrat.com/news/3983569-181/sonoma-clean-power-becomes-countys?artslide=0 41 Los Angeles County CCA Business Plan: http://file.lacounty.gov/green/cms1_247381.pdf 42 Ibid. 43 Cited in the San Jose Clean Energy Feasibility Study (see footnote 36) with no source provided.

METHODOLOGY AND ASSUMPTIONS
July 2017 22 | P a g e
Table 6: Summary of CCA Phase-in Approaches
Phase Lancaster Choice Energy 44 MCE Clean Energy45 San Jose Clean Energy
CCA Business Plan46
I May 2015:
Municipal Service Accounts
2010:
Municipal and Commercial
Accounts
January 2018:
Municipal Facilities
II November 2015:
Commercial and Industrial
Accounts
2011-2012:
Commercial and
Residential Accounts
June 2018:
Residential and Small
Commercial
III May-November 2016:
Residential Accounts
2013:
Remaining Customers
November 2018:
Remaining Customers
For the purposes of this Study, three phases of customer enrollment have been assumed as summarized
in Figure 14, reproduced from Table 1: CCA Program Enrollment Phases and Customer Data, in Section
I on page 5. Launching the CCA program with large commercial and industrial customers results in an
appreciable amount of energy sales and fewer customers, creating initial cash flows with lower customer
service requirements. Additional customers are gradually added over time as the CCA program gains
operating experience. Residential customers, that will likely require the highest level of customer support
and also have the lowest per-account usage, are enrolled during the final phase, after one full year of CCA
program operation.
May and November enrollments are assumed to avoid periods of volatile energy consumption and prices
and reduce the risk that a customer may attribute a bill increase or decrease to the CCA program rather
than normal seasonal changes in electricity consumption.
CONSUMPTION FORECAST USED IN STUDY
Based on the analyses discussed above, a normalized forecast of net load by customer account was
generated over the Study horizon. Figure 14 presents usage by customer class by phase. Figure 15
summarizes usage by customer class over the Study horizon.
44 http://www.cityoflancasterca.org/home/showdocument?id=24349 45 http://file.lacounty.gov/SDSInter/green/242553_USCCommunityChoiceAggregationinTorrance,CA-02.2014.pdf 46 https://www.sanjoseca.gov/DocumentCenter/View/65896

METHODOLOGY AND ASSUMPTIONS
City of San Diego Community Choice Aggregate Feasibility Study 23 | P a g e
Figure 14: CCA Customer Load by Phase
Phase 1:May 2020
Phase 2:November 2020
Phase 3:May 2021
Total
Opt-up to 100% Renewable, All Classes 2.98 3.61 9.73 16
Residential Outdoor Lighting - - 0.15 0
Outdoor Lighting Small <20kW 1.83 2.16 1.90 6
Agricultural 5.27 4.04 5.02 14
Commercial/Industrial Large >20kW 253.16 227.21 247.43 728
Commercial/Industrial Small <20kW - 52.39 55.13 108
Residential CARE - - 37.11 37
Residential - - 129.82 130
-
200
400
600
800
1,000
1,200
Average Retail Load
(GWh/ month)

METHODOLOGY AND ASSUMPTIONS
July 2017 24 | P a g e
Figure 15: Usage by Customer Class (2020-2035)
Figure 16 compares the City CCA program’s annual load and customer count to eight operating CCAs,
including several recently launched, and two larger CCAs—San Jose Clean Energy and Los Angeles
Community Choice Energy—which are still in planning stages. As can be seen in this graphic the sheer
size of the City CCA would be materially larger than all CCA programs in existence. In fact, based on
annual load, the City CCA would be over twice the size of all the other currently operating CCAs, except
Peninsula Clean Energy, and nearly ten times bigger than half of the operating CCAs. The magnitude of
this proposed venture could significantly impact operations and risk exposure in ways not yet
experienced by other CCA programs. Further, the impact on SDG&E of departing load represented by
the City CCA program would be difficult to predict given lack of comparable examples.

METHODOLOGY AND ASSUMPTIONS
City of San Diego Community Choice Aggregate Feasibility Study 25 | P a g e
Figure 16: Relative Size of CCA Programs47
POWER PROCUREMENT CONSIDERATIONS
In addition to creating an accurate load forecast for
meeting its customer’s needs, a CCA must determine the
types of resources to procure (i.e., renewable generation,
conventional fossil-fueled generation, capacity
resources, and energy storage). This section discusses the
CCA program’s portfolio requirements and power
procurement options. The forecasted power supply cost
based on these assumptions for the Base Case and each
scenario is then presented.
47 Source: California CCA Quarterly Update April 2017 and as reported in CPUC staff presentation at the Community Choice
Aggregation En Banc February 1, 2017. http://cal-cca.org/wp-content/uploads/2017/01/CalCCA-Quarterly-Update-April-
2017.pdf and S. Casazza, Energy Division, FinalStaffEnBancPresentation2.1.17.pptx. County of Los Angeles Community Choice
Energy Business Plan, July 2016. http://file.lacounty.gov/SDSInter/green/247381_BoardMotionofSept152016ItemNo6-
FinalReport.pdf; San Jose Clean Energy Feaasibility Study, February 2017.
http://www.sanjoseca.gov/DocumentCenter/View/65896
0
50
100
150
200
250
300
350
400
450
500
0
1,000
2,000
3,000
4,000
5,000
6,000
Apple ValleyChoiceEnergy
Clean PowerSan
Francisco
LancasterChoiceEnergy
RedwoodCoast Energy
Authority
SonomaClean Power
Silicon ValleyClean Energy
MCE CleanEnergy
Los AngelesCommunity
ChoiceEnergy
PeninsulaClean Energy
San JoseClean Energy
City of SanDiego
Customer Accounts
(000s)
Annual Load(GWh)
CustomerAccounts
State law, California
Independent System Operator
requirements, and California
Public Utilities Commission
regulations impact power supply
decisions for the CCA program.

METHODOLOGY AND ASSUMPTIONS
July 2017 26 | P a g e
PORTFOLIO REQUIREMENTS
In addition to the CAP and SEAB Guiding Principles, regulatory requirements impact the power supply
the CCA program would procure. The CAISO has established capacity requirements known as resource
adequacy (RA) and the CPUC has established storage requirements. This section discusses these
requirements factoring into CCA power supply decisions.
STATE RENEWABLE PORTFOLIO STANDARD REQUIREMENTS
Under CA law outlining the statewide RPS,48 CCA programs, like other LSEs, will be required to procure at least 33% renewable energy resources for their customers by 2020 and 50% by 2030.49 Table 7 summarizes RPS requirements in CA. RPS requirements are minimum levels, CCAs and IOUs can exceed these targets. However, unlike CCA programs that can unilaterally set higher RPC targets, IOUs require CPUC approval to exceed minimum RPS levels, unless such resources offer the lowest cost generation option. Customer-owned DG, predominately solar PV, does not count toward the RPS;50 only renewable generation supply procured by the LSE contributes toward meeting the RPS.
Table 7: California Renewable Portfolio Standard51
Compliance Period
Procurement Quantity
Requirement
Compliance Period 2
(2014-16)
2014 Retail Sales x 21.7%
2015 Retail Sales x 23.3%
2016 Retail Sales x 25%
Compliance Period 3
(2017-20)
2017 Retail Sales x 27%
2018 Retail Sales x 29%
2019 Retail Sales x 31%
2020-2029 Annual Retail Sales x 33%
2030+ Annual Retail Sales x 50%
RPS includes three categories of Renewable Energy Certificates or Credits (RECs), summarized in Table
8, that define how different renewable energy sources count toward fulfillment of RPS requirements.
RECs are certificates of proof associated with specific renewable energy sources. RECs can be sold
together with the actual energy commodity on a bundled basis or separately. In the latter case, the
underlying energy commodity is no longer eligible to count toward RPS. Category 1 RECs must be kept
bundled with the energy commodity and physically delivered to a California Balancing Authority, which
means the renewable energy supply must be connected to the State grid. Category 2 RECs offer more
flexibility by separating the RECs from the associated energy commodity and allowing substitution of
48 California Public Utilities Commission Renewable Portfolio Standard Homepage: http://www.cpuc.ca.gov/rps_homepage/
California Energy Commission Renewable Portfolio Standard: http://www.energy.ca.gov/portfolio/ 49 Ibid. 50 However, if the net energy metering customer exceeds their annual usage with DG output, that excess is eligible to provide
Renewable Energy Credits to the utility: http://www.cpuc.ca.gov/General.aspx?id=3800 51 CPUC 33% RPS Procurement Rules: http://www.cpuc.ca.gov/RPS_Procurement_Rules_33/

METHODOLOGY AND ASSUMPTIONS
City of San Diego Community Choice Aggregate Feasibility Study 27 | P a g e
alternate energy delivered to the California Balancing Authority; for example, purchasing RECs from a
remote generator not directly connected to the grid. Category 3 RECs are “unbundled,” i.e., not
associated with the actual purchase of the renewable energy commodity and are being phased out from
RPS qualification. SDG&E RPS resources are comprised of Category Zero RECs (associated with
renewable resources owned by SDG&E) and Category 1 RECs procured through Purchase Power
Agreements (PPAs).52
Table 8: Renewable Energy Certificate Portfolio Content Categories
Category Description Requirements
Category 1
Procurement of energy and Renewable Energy Certificates delivered
to a California Balancing Authority without substituting electricity
from another source.
2017-2020 Minimum
75% of quantity
requirement
Category 2
Procurement of energy and Renewable Energy Certificates that
cannot be delivered to a California Balancing Authority without
substituting electricity from another source.
Category 3
Procurement of unbundled Renewable Energy Certificates only, or
Renewable Energy Certificates that do not meet the conditions for
Category 1 and 2.
2017-2020 Maximum of
10% of quantity
requirement
For purposes of this Study, no RECs were used to meet RPS requirements in accord with the SEAB CCA
Minimum Performance Target of minimizing RECs through the first ten years of CCA program operation
and eliminating RECs by 2035.
RESOURCE ADEQUACY
Two primary commodities comprise power transactions in CA: energy and capacity. Energy is the
commodity consumed. Capacity or demand is the ability of system resources to meet load requirements.
The RA program is a mandatory planning and procurement process to verify that adequate capacity is
available to serve all customers in real time, including a Planning Reserve Margin. The RA program
establishes deliverability criteria as well as system and local capacity requirements. The RA program also
establishes rules for "counting" resources to meet RA obligations. The key RA obligation is that a resource
counted as “RA capacity” must either deliver energy to the LSE or CCA program, bid into the CAISO
energy markets, or be available to produce electricity when needed.
To ensure reliable grid operation, all LSEs must meet the reserve capacity requirements of the RA
program, impacting CCA program procurement decisions. RA requirements are set equal to a minimum
of 115% of forecasted monthly peak demand,53 90% of which must be contracted one year ahead of time
(due October 31) and the balance within one month prior. RA requirements and associated costs were
explicitly modeled in the Study.
52 SDG&E has not utilized Category 3 RECs since 2012: http://www.cpuc.ca.gov/General.aspx?id=3856 53 The RA requirement is equivalent to 1.15 times the peak coincident load times .9 which is equivalent to 1.035 of the peak
coincident demand.

METHODOLOGY AND ASSUMPTIONS
July 2017 28 | P a g e
ENERGY STORAGE
AB 2514 and the CPUC Storage Rulemaking (R.10-12-007),54 require LSEs, including CCA programs, to
acquire energy storage. The CPUC Storage Rulemaking sets a target for energy storage equal to 1% of
2020 annual peak load operational by 2024. Beginning in January 2016, LSEs were required to
demonstrate compliance and describe methodologies for cost-effective storage projects. Storage may
count toward RA requirements. For purposes of this Study, the CCA program was assumed to maintain
energy storage capacity equivalent to the annual peak load. Storage requirements and associated costs
were modeled in the Study.
POWER PURCHASING OPTIONS
The energy supply portfolio for an LSE in CA is typically comprised of three sources:
1. Self-supplied generation;
2. Generation procured through bilateral contracts or PPAs with independent power producers for
conventional fossil fuel generation as well as renewable generation; and
3. CAISO market purchases—day-ahead and real-time.
Figure 17 illustrates a typical power
procurement strategy where the bulk
of capacity and energy needed to
serve customer load is either self-
supplied or procured through
bilateral contracts. Self-supplied
generation represents those
resources owned, and typically
operated, by the utility. CCA
programs do not generally have self-
supplied generation, which
differentiates them from IOUs.
Smaller amounts of incremental
capacity and/or energy needed to
exactly match actual customer load
are transacted in the Day-Ahead
Market (DAM) and Real Time Market
(RTM) operated by the CAISO. This procurement approach was used in the MCSM modeling of the power
procurement portfolio for the Study. Each of these supply portfolio sources and current cost trends are
discussed in this section.
54 CPUC Order Instituting Rulemaking R.10-12-007 Pursuant to Assembly Bill 2514 to Consider the Adoption of Procurement
Targets for Viable and Cost-Effective Energy Storage Systems: Systems:
http://docs.cpuc.ca.gov/PublishedDocs/Published/G000/M079/K533/79533378.PDF
Figure 17: Hierarchy of Power Procurement
Sources
Real Time Market
Day Ahead Market
Power Purchase Agreements
Self Supplied Generation

METHODOLOGY AND ASSUMPTIONS
City of San Diego Community Choice Aggregate Feasibility Study 29 | P a g e
POWER PURCHASE AGREEMENTS
PPAs are long term bilateral contracts to purchase energy from independent power producers.
Independent power producers will typically enter contractual agreements for approximately 80% of
capacity, to cover operations and maintenance costs, and trade the remaining 20% in the CAISO market
to achieve profit margin. PPAs are used to meet load requirements that are predictable (e.g., base load
for a portfolio) at a known price or a price that is tied, indexed, to another market pricing indicator such
as the price of natural gas. Terms for longer supply contracts tend to be fixed volume and fixed price,
providing cost certainty. Shorter term supply contracts (e.g., quarterly or monthly) are used when load
can be more accurately forecasted and market conditions better known. Such shorter-term supply
contracts are used to “shape” the supply profile to better match forecasted load behavior.
For solar PV, NREL’s Power Purchase Agreement Checklist for State and Local Governments,55 identifies
the following advantages of PPAs as a financing mechanism to acquire renewable energy applicable to
CCA programs:
• No/low up-front cost;56
• Ability for tax-exempt entity, like the City, to enjoy lower electricity prices thanks to savings
passed on from federal tax incentives to the system owner; and
• A reasonably-predictable cost of electricity over fifteen to twenty-five years.
CALIFORNIA INDEPENDENT SYSTEM OPERATOR MARKET PURCHASES
As discussed previously, CCA supply requirements will vary based on weather, economy, and other
random factors, for example a local PEV rally that could result in an unplanned and atypical spike in
demand related to simultaneous charging. PPAs are typically used to lock in pricing and supply to cover
approximately 80% to 90% of anticipated load. The remaining 10% to 20% is transacted through the
CAISO markets. In addition to its role as grid administrator, CAISO performs as a market exchange and
clearing house. Near term requirements within the month or week are transacted in the DAM; the RTM
is used for day-of and hourly transactions. The CCA program would transact a portion of its supply
portfolio through the CAISO DAM and RTM, at times buying to cover shortfalls and at times selling to
offload excess supply.
DAY-AHEAD MARKET PURCHASES
Pricing within the CAISO markets is determined by Locational Marginal Prices (LMP) that define the cost
of delivery to specific grid locations. LMPs reflect the cost of generation, distance from generation
resources, and congestion of transmission to that location. Energy bids are made hourly for the DAM.
CAISO DAM pricing is posted on a web-based platform known as the Open Access Same-time
55 Power Purchase Agreement Checklist for State and Local Governments http://www.nrel.gov/docs/fy10osti/46668.pdf 56 The no/low up-front cost advantage assumes a solid credit capacity. Depending on how the CCA program is structured, credit
instruments may be required for the CCA program to actually execute Power Purchase Agreements and participate in California
Independent System Operator markets.

METHODOLOGY AND ASSUMPTIONS
July 2017 30 | P a g e
Information System (OASIS).57 CAISO DAM prices obtained from OASIS show significant volatility as
illustrated in Figure 18.58 A variety of factors contribute to these price patterns, including the growing
percentage of load served by solar PV DG that can go offline quickly as the sun sets, or clouds pass
overhead.
Figure 18: Average CAISO Day-Ahead Market Price for SDG&E (January 2014-October 2016)
Figure 19 shows the maximum, average and minimum range for the CAISO SDG&E DAM price by month for January 2014-October 2016.59 Prices in the CAISO DAM demonstrate basic economic principles of supply and demand. When prices are negative, the market administered by CAISO has more supply than demand and will pay market participants to reduce generation or increase load. Since electric supply must always balance demand in real time, the negative price signal sent by CAISO is meant to restore system balance. Conversely, in times of scarcity or excess demand, price signals rise to encourage generators to produce more and consumers to curtail usage.
57 California Independent System Operator Open Access Same-time Information System (OASIS) http://oasis.caiso.com/mrioasis 58 Ibid. 59 As part of this Study, SDG&E California Independent System Operator pricing was compared to City-specific LMPs and were
shown to be statistically equivalent.

METHODOLOGY AND ASSUMPTIONS
City of San Diego Community Choice Aggregate Feasibility Study 31 | P a g e
Figure 19: CAISO SDG&E Day-Ahead Price Range by Month (January 2014-October 2016)
REAL-TIME MARKET PURCHASES
The CCA program would rely on the CAISO RTM to balance the day-of supply and demand. RTM costs
for the CCA program were estimated utilizing the real-time 5-minute interval LMP data from CAISO
OASIS.60 Figure 20 shows that the volatility and price magnitude of the RTM is significantly greater than
that of the DAM. Such volatility must be considered when planning power supply portfolios.
60 California Independent System Operator Open Access Same-time Information System: http://oasis.caiso.com/mrioasis

METHODOLOGY AND ASSUMPTIONS
July 2017 32 | P a g e
Figure 20: CAISO SDG&E Real Time Price by Month (January 2014-October 2016)
Figure 21: CAISO SDG&E Real Time Price Range by Month (January 2014-October 2016)
METHODOLOGY AND ASSUMPTIONS
City of San Diego Community Choice Aggregate Feasibility Study 33 | P a g e
POWER COST ESTIMATES
The methodology outlined in earlier sections forms the basis for constructing the CCA program’s
resource purchasing plan. The MCSM was used to combine the variability in load, growth forecast,
customer-owned solar PV DG forecast, and other variables to estimate short-, medium-, and long-term
electric supply requirements for the CCA program. This section provides the assumptions for estimating
the cost of: renewable and natural gas generation, capacity, and storage. The estimated cost forecast
provides the basis for Study results.
RENEWABLE GENERATION
The Levelized Cost of Electricity, also known as Levelized Energy
Cost, is the net present value (NPV) of the unit-cost of electricity over
the lifetime of a generating asset and can be used as a proxy for the
market cost for that resource. Based on actual market data and
corroborated by Lazard’s Levelized Cost of Energy Analysis,61
depending on region, the installed cost of US Solar PV Systems (excluding subsidies) is now in the $1.00
per Watt-Direct Current to $1.39 per Watt-Direct Current for fixed tilt ground mounted systems larger
than 2MW, equating to $0.04/kWh to $0.06/kWh.62 Figure 22 illustrates the Levelized Cost of Energy for
natural gas, solar and wind energy.
61 Lazard’s Levelized Cost of Energy Analysis Version 10.0, December 15, 2016, https://www.lazard.com/perspective/levelized-
cost-of-energy-analysis-100/ 62 Dave P. Buemi, Senior Vice President, Clean Energy Programs, Willdan Group, Inc.
$60/MWH equals 6Ȼ/KWH

METHODOLOGY AND ASSUMPTIONS
July 2017 34 | P a g e
Figure 22: Relative Cost of Generation63
Comparing these data points to the 2016 NREL U.S. Solar PV System Cost Benchmark Report,64
illustrates how quickly costs are changing. The historic PV system trend from 2004 to the first quarter of
2016, as compiled by NREL, appears in Figure 23 and demonstrates that the lowest data points from early
2016 are higher than December of the same year.
63 Lazard LCOE 10.0, 2016. 64 NREL U.S. Solar Photovoltaic System Cost Benchmark: Q1 2016 http://www.nrel.gov/docs/fy16osti/66532.pdf

METHODOLOGY AND ASSUMPTIONS
City of San Diego Community Choice Aggregate Feasibility Study 35 | P a g e
Figure 23: National Renewable Energy Lab Photovoltaic System Cost Benchmark Summary65
Yet, according to the CPUC Q1 2016: Biennial RPS Program Update, IOU RPS procurement costs have been increasing since 2011 as shown in Figure 24. The Padilla Report to the California Legislature66 is another source that tracks California price of renewable procurement. For the Study, both sources were considered to develop CCA program price forecasts that balance the larger trends in the industry with the modest price changes reported in CA.
65 Ibid., September 28, 2016, http://www.nrel.gov/news/press/2016/37745 66 The basis of the renewable RPS cost analysis included data from the May 2016: Report on 2015 Renewable Procurement
Costs in Compliance with Senate Bill 836 (Padilla, 2011):
http://www.cpuc.ca.gov/uploadedFiles/CPUC_Website/Content/Utilities_and_Industries/Energy/Reports_and_White_Papers/
Padilla%20Report%202016%20-Final%20-%20Print.pdf; Subsequent to the analysis an updated report was produced and the
data was consistent with the forecast analysis previously performed: May 2017: Report on 2015 Renewable Procurement Costs
in Compliance with Senate Bill 836 (Padilla, 2011):
http://www.cpuc.ca.gov/uploadedFiles/CPUCWebsite/Content/About_Us/Organization/Divisions/Office_of_Governmental_Aff
airs/Legislation/2017/Final%20-%20Padilla%20Report%20-%20RPS%20Costs%202017.pdf

METHODOLOGY AND ASSUMPTIONS
July 2017 36 | P a g e
Figure 24: Cost of Renewables for CA Investor Owned Utilities 67
This disconnect between national trends and actual RPS procurement costs in CA may be in part due to
the RPS program itself.68 The initial 2002 RPS applied only to CA IOUs and RPS procurement costs
initially increased until 2008, at which point prices declined until 2011. In 2011, Senate Bill X1-2 expanded
RPS to municipal utilities, ESPs and CCAs.69 Prior to Senate Bill X1-2, many of these LSEs had not been
aggressively pursuing renewable generation portfolios. Expansion of CA’s RPS mandate in 2011, appears
to have resulted in a classic supply and demand dichotomy: increased regulatory-driven demand for
RPS-compliant resources may have increased cost due to supply constraints.
67 California Public Utilities Commission Renewable Portfolio Standard Reports, Presentations and Charts
http://www.cpuc.ca.gov/RPS_Reports_Docs/ ; Biennial RPS Program Update In Compliance with Public Utilities Code Section
913.6, January, 2016 http://www.cpuc.ca.gov/WorkArea/DownloadAsset.aspx?id=8323 68 California Public Utilities Commission Renewable Portfolio Standard Program Overview
http://www.cpuc.ca.gov/RPS_Overview/ 69 California Energy Commission Renewable Portfolio Standard Reports and Notices from Publicly Owned Utilities:
http://www.energy.ca.gov/portfolio/rps_pou_reports.html ; California Public Utilities Commission Renewable Portfolio
Standard Program Overview: http://www.cpuc.ca.gov/RPS_Overview/

METHODOLOGY AND ASSUMPTIONS
City of San Diego Community Choice Aggregate Feasibility Study 37 | P a g e
An AB 67 legislative report70 confirms this belief:
“From 2003 to 2014, the average TOD-adjusted price of contracts approved by the CPUC
has increased from 5.4 cents to 7.6 cents/kWh in nominal dollars, and decreased from
8.2 cents to 7.6 cents/kWh in real dollars. One reason for this increase in nominal pricing
is that the IOUs contracted with existing renewable facilities at the beginning of the RPS
program and with mostly new facilities in more recent years in order to meet the 20%
and 33% RPS targets. These new facilities typically result in higher contract costs in order
to recover the capital needed to develop new facilities. Having said that, the decrease in
RPS contract prices in terms of real dollars indicates that the renewable market in
California is robust and competitive and has matured since the start of the RPS
program.”
Over time however, economic theory would indicate that renewable resource supplies would be
developed to eliminate this market disequilibrium.
NATURAL GAS
Contractual pricing for natural gas generation is not publicly available. Therefore, the Study relied on
alternative sources of information to determine the likely range of bilateral PPA prices for natural gas
generation as discussed in this section.
Natural gas provides a large portion of the annual electricity supply in the State, shown in Figure 25, and
within the SDG&E service territory, shown in Figure 26.71
70 California Public Utilities Commission Electric and Gas Utility Cost Report, April 2016:
http://www.cpuc.ca.gov/uploadedFiles/CPUC_Website/Content/Utilities_and_Industries/Energy/Reports_and_White_Papers/
AB67_Leg_Report_3-28.pdf, pg. 23-24 71 California Energy Commission, Utility Annual Power Content Labels for 2015.
http://www.energy.ca.gov/pcl/labels/2015_labels/San_Diego_Gas_and_Electric_(SDGandE).pdf

METHODOLOGY AND ASSUMPTIONS
July 2017 38 | P a g e
Figure 25: 2014 California Electricity Consumption by Generation Resource72
Figure 26: 2015 SDG&E Power Content Label

METHODOLOGY AND ASSUMPTIONS
City of San Diego Community Choice Aggregate Feasibility Study 39 | P a g e
Analyzing the price of natural gas sold to the electric power industry can help derive the natural gas
generation supply cost and forecast future natural gas generation pricing for the CCA program. The EIA
tracks the monthly price of natural gas sold to the electric power industry73 in dollars per thousand cubic
feet, which is roughly equivalent to dollars per million British Thermal Units (MMBTU).74 A “heat rate”
measures the efficiency of converting the fuel to energy. The CEC 2015 Update of the Thermal Efficiency
of Gas-Fired Generation in California75 estimates the 2014 heat rate to be 7.76 MMBTU per kWh.
Combining these data results in an approximate natural gas supply electricity cost per MWh as shown
Figure 27.
Figure 27: California Natural Gas Generation Cost based on Natural Gas Price and Heat Rate
Conversion
73 Energy Information Administration California Natural Gas Price Sold to Electric Power Customers:
http://www.eia.gov/opendata/qb.php?sdid=NG.N3045CA3.M 74 How Natural Gas is Measured http://www.tulsagastech.com/measure.html 75 California Energy Commission 2015 Update of the Thermal Efficiency of Gas-Fired Generation in California:
http://www.energy.ca.gov/2016publications/CEC-200-2016-002/CEC-200-2016-002.pdf
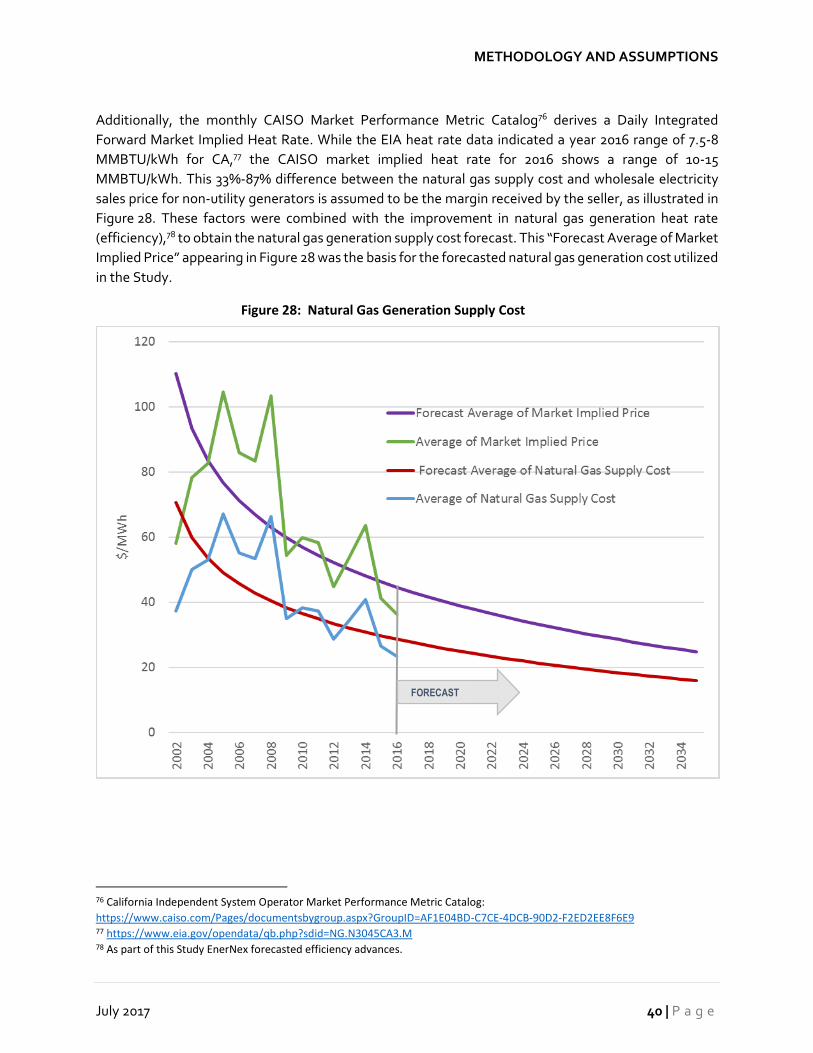
METHODOLOGY AND ASSUMPTIONS
July 2017 40 | P a g e
Additionally, the monthly CAISO Market Performance Metric Catalog76 derives a Daily Integrated
Forward Market Implied Heat Rate. While the EIA heat rate data indicated a year 2016 range of 7.5-8
MMBTU/kWh for CA,77 the CAISO market implied heat rate for 2016 shows a range of 10-15
MMBTU/kWh. This 33%-87% difference between the natural gas supply cost and wholesale electricity
sales price for non-utility generators is assumed to be the margin received by the seller, as illustrated in
Figure 28. These factors were combined with the improvement in natural gas generation heat rate
(efficiency),78 to obtain the natural gas generation supply cost forecast. This “Forecast Average of Market
Implied Price” appearing in Figure 28 was the basis for the forecasted natural gas generation cost utilized
in the Study.
Figure 28: Natural Gas Generation Supply Cost
76 California Independent System Operator Market Performance Metric Catalog:
https://www.caiso.com/Pages/documentsbygroup.aspx?GroupID=AF1E04BD-C7CE-4DCB-90D2-F2ED2EE8F6E9 77 https://www.eia.gov/opendata/qb.php?sdid=NG.N3045CA3.M 78 As part of this Study EnerNex forecasted efficiency advances.
FORECAST

METHODOLOGY AND ASSUMPTIONS
City of San Diego Community Choice Aggregate Feasibility Study 41 | P a g e
UNITIZED WHOLESALE COST OF POWER
Figure 29 summarizes the wholesale
cost of power for the CCA program
for the three RPC contents modeled
in the Study: 50%, 80%, and 100 %.
RESOURCE ADEQUACY
LSEs can procure RA capacity through various processes, but no liquid market for capacity products
currently exists in CA. All RA transactions occur in the bilateral marketplace.79 The most straight-forward
way to purchase RA is the use of “full requirements load following” power supply contracts. Such
arrangements provide all power (both renewable and conventional, including base load and shaped load
requirements), capacity (system and local RA), distribution losses, uplift and any ancillary services. LSEs
can issue Request for Proposals to procure RA capacity. State IOUs go through a Request for Proposals
process annually to procure RA capacity for bundled service customers. Because the RA capacity market
is illiquid, price discovery is difficult. However, the 2013 – 2014 Resource Adequacy Report80 estimates a
range of monthly capacity pricing for South of Path 26, applicable to the City, as shown in Table 9.
79 The California Public Utilities Commission is considering a Demand Response Auction Mechanism for demand response
resources after categorizing such resources as either “load modifying” or “supply side.” Thus, certain RA transactions could
potentially be transacted through an auction process in the future. 80 California Public Utilities Commission 2013 – 2014 Resource Adequacy Report, August 2015
www.cpuc.ca.gov/WorkArea/DownloadAsset.aspx?id=6325
Figure 29: Unitized Cost of Power by
Scenario

METHODOLOGY AND ASSUMPTIONS
July 2017 42 | P a g e
Table 9: South of Path 26 Aggregated Resource Adequacy Contract Prices (2013-14)
Contract Prices
$/kW
Month
Weighted Average Price $3.60
Average Price $3.61
Minimum Price $0.09
Maximum Price $26.54
85th Percentile $8.20
This historical data cited above was used to develop the forecasted RA cost utilized in the MCSM analysis that appears in Figure 30. This decreasing trend in RA capacity cost is consistent with the increase in proliferation of DG PV. In fact, a decade ago the peak demand and most expensive RA resources were required slightly before the solar PV output peak. As DG PV penetration has increased, this daytime peak capacity requirement has decreased, bringing down the cost of RA.
Figure 30: Resource Adequacy Price Forecast
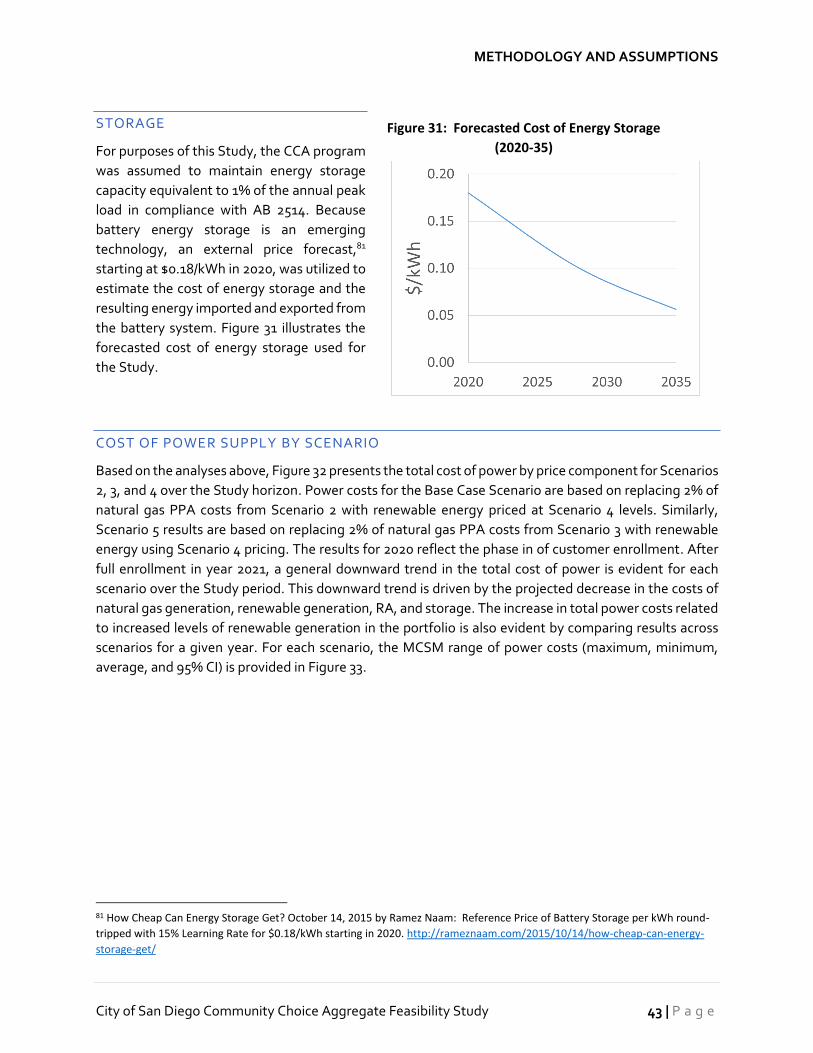
METHODOLOGY AND ASSUMPTIONS
City of San Diego Community Choice Aggregate Feasibility Study 43 | P a g e
STORAGE
For purposes of this Study, the CCA program
was assumed to maintain energy storage
capacity equivalent to 1% of the annual peak
load in compliance with AB 2514. Because
battery energy storage is an emerging
technology, an external price forecast,81
starting at $0.18/kWh in 2020, was utilized to
estimate the cost of energy storage and the
resulting energy imported and exported from
the battery system. Figure 31 illustrates the
forecasted cost of energy storage used for
the Study.
COST OF POWER SUPPLY BY SCENARIO
Based on the analyses above, Figure 32 presents the total cost of power by price component for Scenarios
2, 3, and 4 over the Study horizon. Power costs for the Base Case Scenario are based on replacing 2% of
natural gas PPA costs from Scenario 2 with renewable energy priced at Scenario 4 levels. Similarly,
Scenario 5 results are based on replacing 2% of natural gas PPA costs from Scenario 3 with renewable
energy using Scenario 4 pricing. The results for 2020 reflect the phase in of customer enrollment. After
full enrollment in year 2021, a general downward trend in the total cost of power is evident for each
scenario over the Study period. This downward trend is driven by the projected decrease in the costs of
natural gas generation, renewable generation, RA, and storage. The increase in total power costs related
to increased levels of renewable generation in the portfolio is also evident by comparing results across
scenarios for a given year. For each scenario, the MCSM range of power costs (maximum, minimum,
average, and 95% CI) is provided in Figure 33.
81 How Cheap Can Energy Storage Get? October 14, 2015 by Ramez Naam: Reference Price of Battery Storage per kWh round-
tripped with 15% Learning Rate for $0.18/kWh starting in 2020. http://rameznaam.com/2015/10/14/how-cheap-can-energy-
storage-get/
Figure 31: Forecasted Cost of Energy Storage
(2020-35)

METHODOLOGY AND ASSUMPTIONS
July 2017 44 | P a g e
Figure 32: Cost of Power by Price Component and Renewable Portfolio Content (2020-2035)

METHODOLOGY AND ASSUMPTIONS
City of San Diego Community Choice Aggregate Feasibility Study 45 | P a g e
Figure 33: Monte Carlo Simulation Model Total Portfolio Power Cost Ranges by Renewable
Portfolio Content Scenario
COST OF SERVICE ANALYSIS
To assess the financial feasibility of a CCA program, a Financial Pro Forma COS analysis was used. This
Study section describes the methodology and assumptions used in the COS analysis model, its primary
components, and functionality. The next section provides an explanation of the individual cost
components used to establish the overall CCA Revenue Requirement. Tabular and graphic depictions for
various customer classes and cost components by scenario and sensitivity are examined. Next, the
methodology used to translate CCA Revenue Requirements into unitized needs by customer class (CCA
rate proxies)82 is presented. COS analysis model outputs were used to develop CCA rate proxies based
on the cost to serve the customers within each class. Key input assumptions by scenario and sensitivity
are then defined to provide an understanding of the development of the Base Case and other scenarios
and sensitivities examined. Detailed input assumptions and outputs for each scenario and sensitivity are
provided in Exhibit I.
82 The term rate proxy is used to emphasize that the Study did not design CCA rates. Rather, the Study identifies the unitized
CCA revenue requirement or cost to serve by customer class and uses this value as a rate proxy based on COS assumptions.
Actual CCA rates have not been designed as part of this Study.
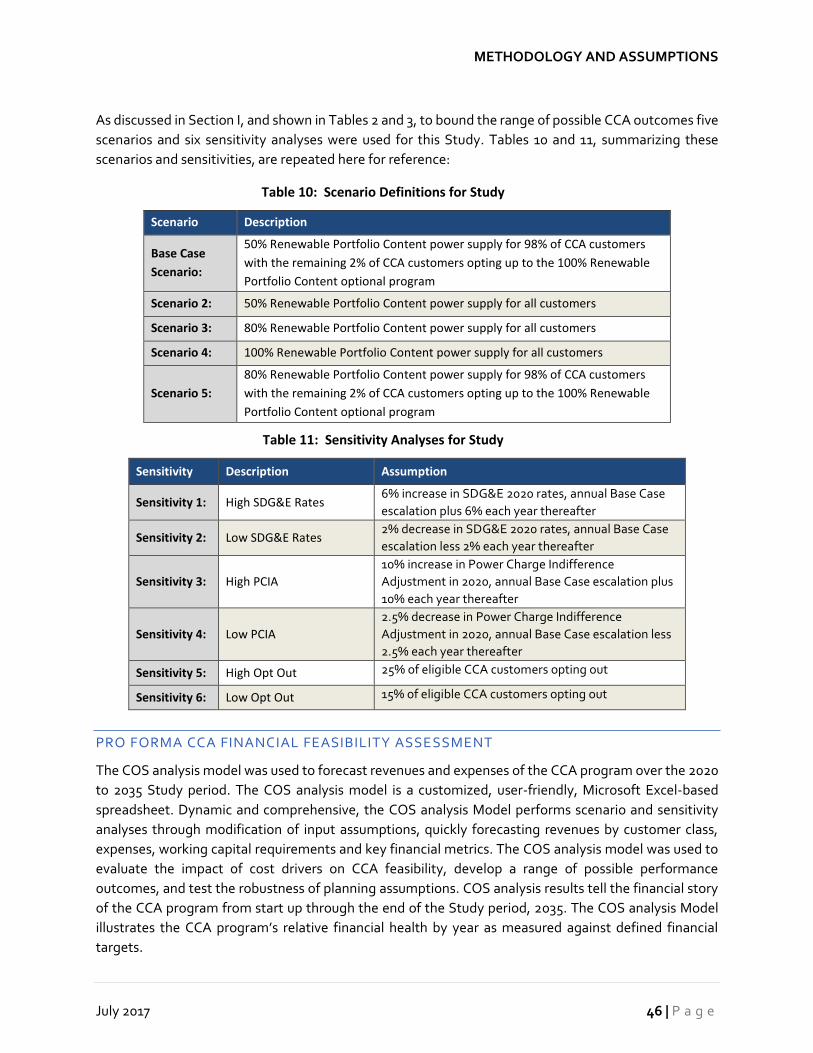
METHODOLOGY AND ASSUMPTIONS
July 2017 46 | P a g e
As discussed in Section I, and shown in Tables 2 and 3, to bound the range of possible CCA outcomes five
scenarios and six sensitivity analyses were used for this Study. Tables 10 and 11, summarizing these
scenarios and sensitivities, are repeated here for reference:
Table 10: Scenario Definitions for Study
Scenario Description
Base Case
Scenario:
50% Renewable Portfolio Content power supply for 98% of CCA customers
with the remaining 2% of CCA customers opting up to the 100% Renewable
Portfolio Content optional program
Scenario 2: 50% Renewable Portfolio Content power supply for all customers
Scenario 3: 80% Renewable Portfolio Content power supply for all customers
Scenario 4: 100% Renewable Portfolio Content power supply for all customers
Scenario 5:
80% Renewable Portfolio Content power supply for 98% of CCA customers
with the remaining 2% of CCA customers opting up to the 100% Renewable
Portfolio Content optional program
Table 11: Sensitivity Analyses for Study
Sensitivity Description Assumption
Sensitivity 1: High SDG&E Rates 6% increase in SDG&E 2020 rates, annual Base Case
escalation plus 6% each year thereafter
Sensitivity 2: Low SDG&E Rates 2% decrease in SDG&E 2020 rates, annual Base Case
escalation less 2% each year thereafter
Sensitivity 3: High PCIA
10% increase in Power Charge Indifference
Adjustment in 2020, annual Base Case escalation plus
10% each year thereafter
Sensitivity 4: Low PCIA
2.5% decrease in Power Charge Indifference
Adjustment in 2020, annual Base Case escalation less
2.5% each year thereafter
Sensitivity 5: High Opt Out 25% of eligible CCA customers opting out
Sensitivity 6: Low Opt Out 15% of eligible CCA customers opting out
PRO FORMA CCA FINANCIAL FEASIBILITY ASSESSMENT
The COS analysis model was used to forecast revenues and expenses of the CCA program over the 2020
to 2035 Study period. The COS analysis model is a customized, user-friendly, Microsoft Excel-based
spreadsheet. Dynamic and comprehensive, the COS analysis Model performs scenario and sensitivity
analyses through modification of input assumptions, quickly forecasting revenues by customer class,
expenses, working capital requirements and key financial metrics. The COS analysis model was used to
evaluate the impact of cost drivers on CCA feasibility, develop a range of possible performance
outcomes, and test the robustness of planning assumptions. COS analysis results tell the financial story
of the CCA program from start up through the end of the Study period, 2035. The COS analysis Model
illustrates the CCA program’s relative financial health by year as measured against defined financial
targets.

METHODOLOGY AND ASSUMPTIONS
City of San Diego Community Choice Aggregate Feasibility Study 47 | P a g e
The COS analysis considers pertinent cost drivers and performance results impacting the long-term
financial feasibility of the CCA program. Costs are the readily-monetized expenses and capital outlays
required to get the CCA program up and running and provide reliable, ongoing service over the Study
period. CCA costs include power purchases, staff salaries and benefits, SDG&E service fees/charges,
facilities expenses, information technology costs, rate stabilization and reserve funding, and required
debt service, among others. In determining financial feasibility, the COS analysis does not include other
benefits, tangible or intangible, such as the value of reducing CO2 emissions, community engagement in
decision-making, the benefits of local control and accountability for generation choices, and local job
creation, among others. These benefits are considered outside of the COS analysis model within this
Study, and may impact overall conclusions and recommendations.
Financial feasibility is assessed in terms of the ability of the CCA program to realistically deliver
competitive costs for customers while paying its substantial up-front and ongoing operating costs. In
particular, the COS analysis assessed CCA capital and cash-on-hand requirements. The impacts of debt
service and reserves, changes in power prices, levels and customer participation were evaluated. These
financial analyses were performed to assess the CCA program’s financial ability to remain solvent and
serve customers over the short- and long-term.
REVENUE REQUIREMENT
The COS analysis relied on traditional utility ratemaking principles and followed an industry standard
methodology for creation of a financial pro forma to forecast the future economic and financial
performance of the CCA program. The first step in the COS analysis was developing the projected CCA
Revenue Requirement, the amount of revenues required to cover the costs of the CCA program, including
all operating and non-operating expenses, debt-service payments, a contingency allotment, a working
capital reserve, and rate stabilization fund. The Revenue Requirement was based on a comprehensive
accounting of all pertinent costs and projections of customer participation; input development is
described later in this section. Cost assumptions relied on historical publicly-available information, power
cost forecasts conducted for this Study, data provided by SDG&E, and subject matter expertise gained
working with a host of public utilities and similar organizations.
To develop the Revenue Requirement, a Test Year was created using expected assumptions around key
drivers and resulting performance for a typical year. The Test Year is designed to project the amount of
revenues needed to cover anticipated costs based on a normalized year of operation. For this Study, the
Test Year Revenue Requirement equals the average projected operating costs for the first three full years
of operation. Table 12 summarizes the CCA program Test Year Revenue Requirement by scenario. Table
13 summarizes the CCA program Test Year Revenue Requirement by sensitivity, all sensitivity analyses
were conducted against the Base Case Scenario. Changes in the total Revenue Requirement between
scenarios drive corresponding changes in customer rate proxies by class. The Revenue Requirement
provided here is a high-level summation of detailed individual cost component of the COS analysis.
Detailed COS analysis pro forma results are included in Exhibit I.
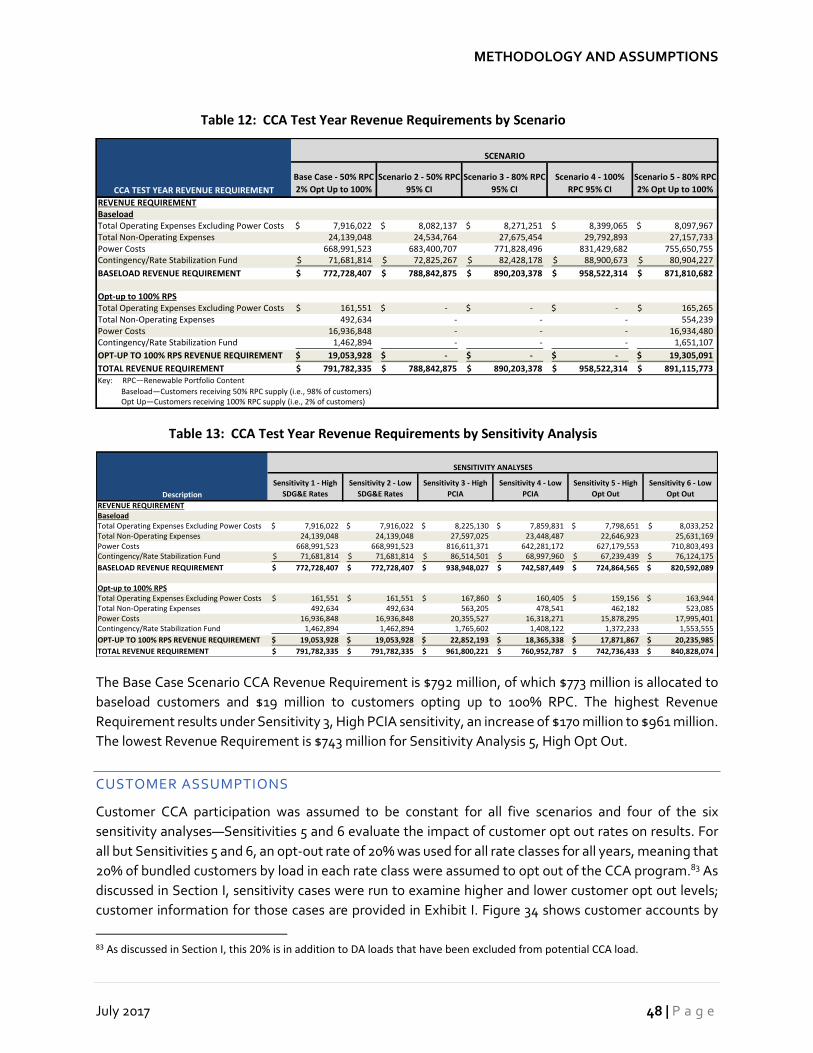
METHODOLOGY AND ASSUMPTIONS
July 2017 48 | P a g e
Table 12: CCA Test Year Revenue Requirements by Scenario
Table 13: CCA Test Year Revenue Requirements by Sensitivity Analysis
The Base Case Scenario CCA Revenue Requirement is $792 million, of which $773 million is allocated to
baseload customers and $19 million to customers opting up to 100% RPC. The highest Revenue
Requirement results under Sensitivity 3, High PCIA sensitivity, an increase of $170 million to $961 million.
The lowest Revenue Requirement is $743 million for Sensitivity Analysis 5, High Opt Out.
CUSTOMER ASSUMPTIONS
Customer CCA participation was assumed to be constant for all five scenarios and four of the six
sensitivity analyses—Sensitivities 5 and 6 evaluate the impact of customer opt out rates on results. For
all but Sensitivities 5 and 6, an opt-out rate of 20% was used for all rate classes for all years, meaning that
20% of bundled customers by load in each rate class were assumed to opt out of the CCA program.83 As
discussed in Section I, sensitivity cases were run to examine higher and lower customer opt out levels;
customer information for those cases are provided in Exhibit I. Figure 34 shows customer accounts by
83 As discussed in Section I, this 20% is in addition to DA loads that have been excluded from potential CCA load.
CCA TEST YEAR REVENUE REQUIREMENT
Base Case - 50% RPC
2% Opt Up to 100%
Scenario 2 - 50% RPC
95% CI
Scenario 3 - 80% RPC
95% CI
Scenario 4 - 100%
RPC 95% CI
Scenario 5 - 80% RPC
2% Opt Up to 100%
REVENUE REQUIREMENTBaseloadTotal Operating Expenses Excluding Power Costs 7,916,022$ 8,082,137$ 8,271,251$ 8,399,065$ 8,097,967$ Total Non-Operating Expenses 24,139,048 24,534,764 27,675,454 29,792,893 27,157,733 Power Costs 668,991,523 683,400,707 771,828,496 831,429,682 755,650,755 Contingency/Rate Stabilization Fund 71,681,814$ 72,825,267$ 82,428,178$ 88,900,673$ 80,904,227$
BASELOAD REVENUE REQUIREMENT 772,728,407$ 788,842,875$ 890,203,378$ 958,522,314$ 871,810,682$
Opt-up to 100% RPSTotal Operating Expenses Excluding Power Costs 161,551$ -$ -$ -$ 165,265$ Total Non-Operating Expenses 492,634 - - - 554,239 Power Costs 16,936,848 - - - 16,934,480 Contingency/Rate Stabilization Fund 1,462,894 - - - 1,651,107
OPT-UP TO 100% RPS REVENUE REQUIREMENT 19,053,928$ -$ -$ -$ 19,305,091$
TOTAL REVENUE REQUIREMENT 791,782,335$ 788,842,875$ 890,203,378$ 958,522,314$ 891,115,773$ Key: RPC—Renewable Portfolio Content
Baseload—Customers receiving 50% RPC supply (i.e., 98% of customers) Opt Up—Customers receiving 100% RPC supply (i.e., 2% of customers)
SCENARIO
Description
Sensitivity 1 - High
SDG&E Rates
Sensitivity 2 - Low
SDG&E Rates
Sensitivity 3 - High
PCIA
Sensitivity 4 - Low
PCIA
Sensitivity 5 - High
Opt Out
Sensitivity 6 - Low
Opt Out
REVENUE REQUIREMENTBaseloadTotal Operating Expenses Excluding Power Costs 7,916,022$ 7,916,022$ 8,225,130$ 7,859,831$ 7,798,651$ 8,033,252$ Total Non-Operating Expenses 24,139,048 24,139,048 27,597,025 23,448,487 22,646,923 25,631,169 Power Costs 668,991,523 668,991,523 816,611,371 642,281,172 627,179,553 710,803,493 Contingency/Rate Stabilization Fund 71,681,814$ 71,681,814$ 86,514,501$ 68,997,960$ 67,239,439$ 76,124,175$
BASELOAD REVENUE REQUIREMENT 772,728,407$ 772,728,407$ 938,948,027$ 742,587,449$ 724,864,565$ 820,592,089$
Opt-up to 100% RPSTotal Operating Expenses Excluding Power Costs 161,551$ 161,551$ 167,860$ 160,405$ 159,156$ 163,944$ Total Non-Operating Expenses 492,634 492,634 563,205 478,541 462,182 523,085 Power Costs 16,936,848 16,936,848 20,355,527 16,318,271 15,878,295 17,995,401 Contingency/Rate Stabilization Fund 1,462,894 1,462,894 1,765,602 1,408,122 1,372,233 1,553,555
OPT-UP TO 100% RPS REVENUE REQUIREMENT 19,053,928$ 19,053,928$ 22,852,193$ 18,365,338$ 17,871,867$ 20,235,985$
TOTAL REVENUE REQUIREMENT 791,782,335$ 791,782,335$ 961,800,221$ 760,952,787$ 742,736,433$ 840,828,074$
SENSITIVITY ANALYSES

METHODOLOGY AND ASSUMPTIONS
City of San Diego Community Choice Aggregate Feasibility Study 49 | P a g e
phase-in and class. Figure 35 summarizes Test Year customer accounts by scenario and sensitivity
analysis. Figure 36 summarizes Test Year customer usage by scenario and sensitivity analysis.
Figure 34: CCA Customers by Customer Class by Phase
Phase 1:May 2020
Phase 2:November 2020
Phase 3:May 2021
Total
Opt-up to 100% Renewable, All Classes 91 717 15,799 16,607
Residential Outdoor Lighting - - 950 950
Outdoor Lighting Small <20kW 304 358 315 977
Agricultural 168 129 160 457
Commercial/Industrial Large >20kW 7,751 6,957 7,576 22,284
Commercial/Industrial Small <20kW - 36,840 38,771 75,611
Residential CARE - - 90,575 90,575
Residential - - 334,270 334,270
-
100
200
300
400
500
600
Number of Customers
(000s)

METHODOLOGY AND ASSUMPTIONS
July 2017 50 | P a g e
Figure 35: Test Year Customer Accounts by Scenario and Sensitivity Analysis
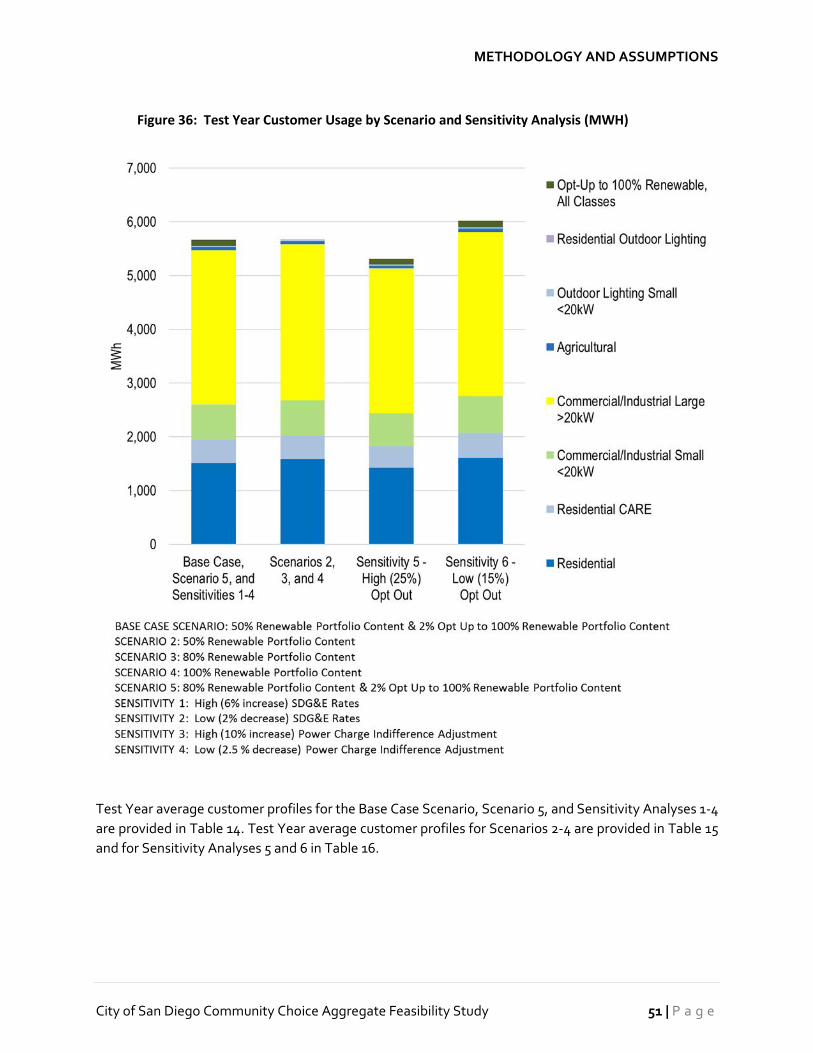
METHODOLOGY AND ASSUMPTIONS
City of San Diego Community Choice Aggregate Feasibility Study 51 | P a g e
Figure 36: Test Year Customer Usage by Scenario and Sensitivity Analysis (MWH)
Test Year average customer profiles for the Base Case Scenario, Scenario 5, and Sensitivity Analyses 1-4
are provided in Table 14. Test Year average customer profiles for Scenarios 2-4 are provided in Table 15
and for Sensitivity Analyses 5 and 6 in Table 16.
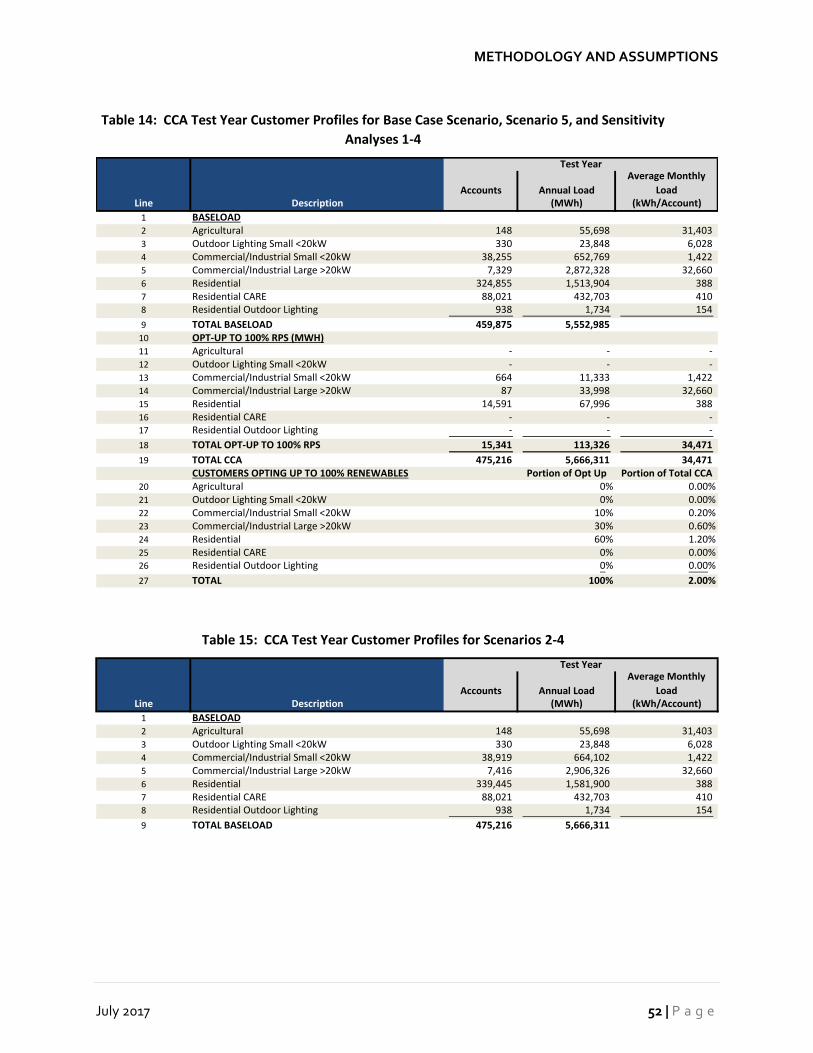
METHODOLOGY AND ASSUMPTIONS
July 2017 52 | P a g e
Table 14: CCA Test Year Customer Profiles for Base Case Scenario, Scenario 5, and Sensitivity
Analyses 1-4
Table 15: CCA Test Year Customer Profiles for Scenarios 2-4
Accounts Annual Load
Average Monthly
LoadLine Description (MWh) (kWh/Account)
1 BASELOAD2 Agricultural 148 55,698 31,403 3 Outdoor Lighting Small <20kW 330 23,848 6,028 4 Commercial/Industrial Small <20kW 38,255 652,769 1,422 5 Commercial/Industrial Large >20kW 7,329 2,872,328 32,660 6 Residential 324,855 1,513,904 388 7 Residential CARE 88,021 432,703 410 8 Residential Outdoor Lighting 938 1,734 154
9 TOTAL BASELOAD 459,875 5,552,985 10 OPT-UP TO 100% RPS (MWH)11 Agricultural - - - 12 Outdoor Lighting Small <20kW - - - 13 Commercial/Industrial Small <20kW 664 11,333 1,422 14 Commercial/Industrial Large >20kW 87 33,998 32,660 15 Residential 14,591 67,996 388 16 Residential CARE - - - 17 Residential Outdoor Lighting - - -
18 TOTAL OPT-UP TO 100% RPS 15,341 113,326 34,471
19 TOTAL CCA 475,216 5,666,311 34,471 CUSTOMERS OPTING UP TO 100% RENEWABLES Portion of Opt Up Portion of Total CCA
20 Agricultural 0% 0.00%21 Outdoor Lighting Small <20kW 0% 0.00%22 Commercial/Industrial Small <20kW 10% 0.20%23 Commercial/Industrial Large >20kW 30% 0.60%24 Residential 60% 1.20%25 Residential CARE 0% 0.00%26 Residential Outdoor Lighting 0% 0.00%
27 TOTAL 100% 2.00%
Test Year
Accounts Annual Load
Average Monthly
LoadLine Description (MWh) (kWh/Account)
1 BASELOAD2 Agricultural 148 55,698 31,403 3 Outdoor Lighting Small <20kW 330 23,848 6,028 4 Commercial/Industrial Small <20kW 38,919 664,102 1,422 5 Commercial/Industrial Large >20kW 7,416 2,906,326 32,660 6 Residential 339,445 1,581,900 388 7 Residential CARE 88,021 432,703 410 8 Residential Outdoor Lighting 938 1,734 154
9 TOTAL BASELOAD 475,216 5,666,311
Test Year

METHODOLOGY AND ASSUMPTIONS
City of San Diego Community Choice Aggregate Feasibility Study 53 | P a g e
Table 16: CCA Test Year Customer Profiles for Sensitivity Analyses 5-and 6
OPERATING COSTS
Operating costs consist of all costs directly associated with provision of the business services and
activities of the CCA program—namely procuring and providing power to customers. The COS analysis
model includes the following operating costs:
• Staffing Costs;
• Power Procurement;
• SDG&E Service Charges;
• SDG&E CRS Charges;
• SDG&E Franchise Charges;
• ESP Charges;
• Other Startup Charges;
• Professional Services;
• City Administration;
• Other Operating Expenses; and
• Uncollectable Accounts.
STAFFING COSTS
As discussed in Section VI: CCA Implementation, the COS analysis assumes the CCA program will be an
independent entity. Staffing cost assumptions were based on publicly available salary and benefit data
for the region. In support of the Study, specific operating functions, duties, and resources required to
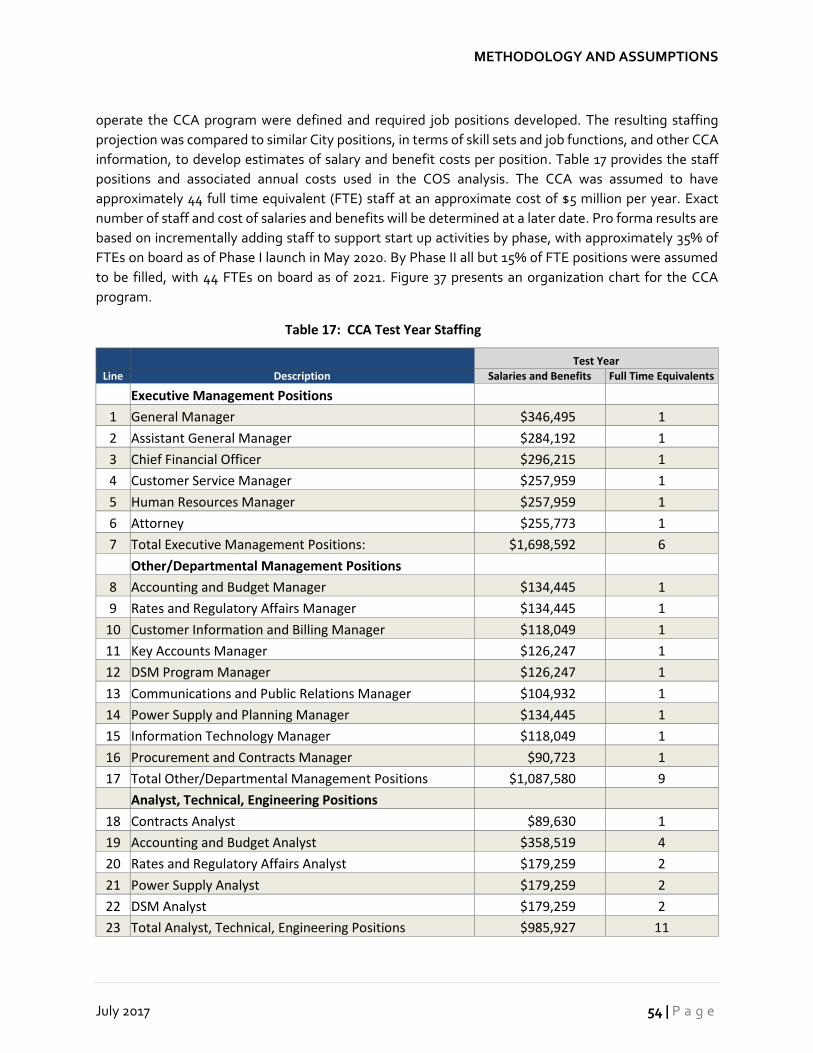
METHODOLOGY AND ASSUMPTIONS
July 2017 54 | P a g e
operate the CCA program were defined and required job positions developed. The resulting staffing
projection was compared to similar City positions, in terms of skill sets and job functions, and other CCA
information, to develop estimates of salary and benefit costs per position. Table 17 provides the staff
positions and associated annual costs used in the COS analysis. The CCA was assumed to have
approximately 44 full time equivalent (FTE) staff at an approximate cost of $5 million per year. Exact
number of staff and cost of salaries and benefits will be determined at a later date. Pro forma results are
based on incrementally adding staff to support start up activities by phase, with approximately 35% of
FTEs on board as of Phase I launch in May 2020. By Phase II all but 15% of FTE positions were assumed
to be filled, with 44 FTEs on board as of 2021. Figure 37 presents an organization chart for the CCA
program.
Table 17: CCA Test Year Staffing
Test Year
Line Description Salaries and Benefits Full Time Equivalents
Executive Management Positions
1 General Manager $346,495 1
2 Assistant General Manager $284,192 1
3 Chief Financial Officer $296,215 1
4 Customer Service Manager $257,959 1
5 Human Resources Manager $257,959 1
6 Attorney $255,773 1
7 Total Executive Management Positions: $1,698,592 6
Other/Departmental Management Positions 8 Accounting and Budget Manager $134,445 1
9 Rates and Regulatory Affairs Manager $134,445 1
10 Customer Information and Billing Manager $118,049 1
11 Key Accounts Manager $126,247 1
12 DSM Program Manager $126,247 1
13 Communications and Public Relations Manager $104,932 1
14 Power Supply and Planning Manager $134,445 1
15 Information Technology Manager $118,049 1
16 Procurement and Contracts Manager $90,723 1
17 Total Other/Departmental Management Positions $1,087,580 9
Analyst, Technical, Engineering Positions 18 Contracts Analyst $89,630 1
19 Accounting and Budget Analyst $358,519 4
20 Rates and Regulatory Affairs Analyst $179,259 2
21 Power Supply Analyst $179,259 2
22 DSM Analyst $179,259 2
23 Total Analyst, Technical, Engineering Positions $985,927 11
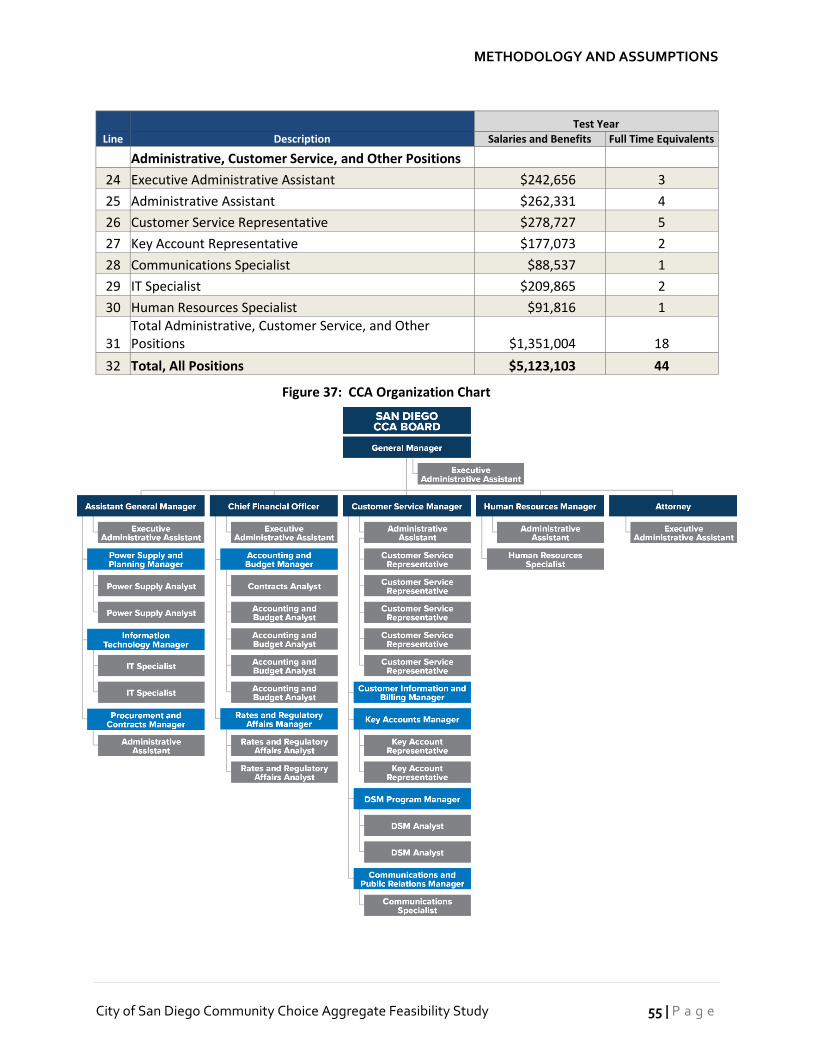
METHODOLOGY AND ASSUMPTIONS
City of San Diego Community Choice Aggregate Feasibility Study 55 | P a g e
Test Year
Line Description Salaries and Benefits Full Time Equivalents
Administrative, Customer Service, and Other Positions 24 Executive Administrative Assistant $242,656 3
25 Administrative Assistant $262,331 4
26 Customer Service Representative $278,727 5
27 Key Account Representative $177,073 2
28 Communications Specialist $88,537 1
29 IT Specialist $209,865 2
30 Human Resources Specialist $91,816 1
31 Total Administrative, Customer Service, and Other Positions $1,351,004 18
32 Total, All Positions $5,123,103 44
Figure 37: CCA Organization Chart
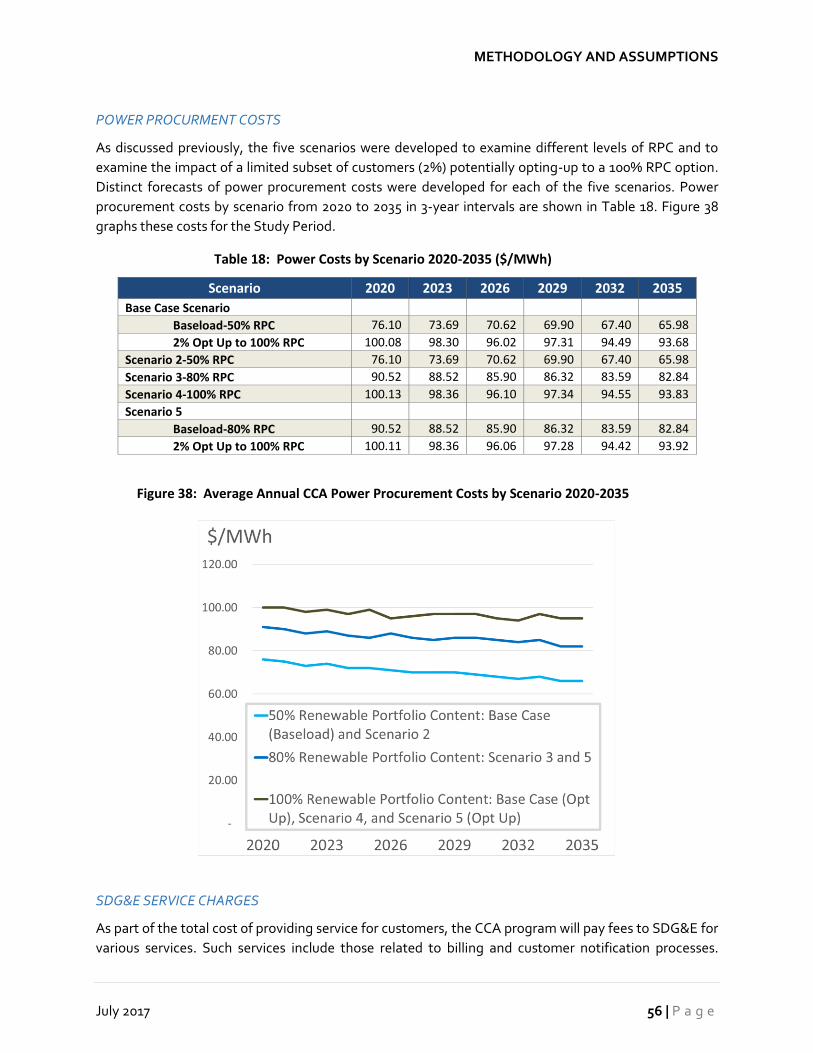
METHODOLOGY AND ASSUMPTIONS
July 2017 56 | P a g e
POWER PROCURMENT COSTS
As discussed previously, the five scenarios were developed to examine different levels of RPC and to
examine the impact of a limited subset of customers (2%) potentially opting-up to a 100% RPC option.
Distinct forecasts of power procurement costs were developed for each of the five scenarios. Power
procurement costs by scenario from 2020 to 2035 in 3-year intervals are shown in Table 18. Figure 38
graphs these costs for the Study Period.
Table 18: Power Costs by Scenario 2020-2035 ($/MWh)
Scenario 2020 2023 2026 2029 2032 2035
Base Case Scenario
Baseload-50% RPC 76.10 73.69 70.62 69.90 67.40 65.98
2% Opt Up to 100% RPC 100.08 98.30 96.02 97.31 94.49 93.68
Scenario 2-50% RPC 76.10 73.69 70.62 69.90 67.40 65.98
Scenario 3-80% RPC 90.52 88.52 85.90 86.32 83.59 82.84
Scenario 4-100% RPC 100.13 98.36 96.10 97.34 94.55 93.83
Scenario 5
Baseload-80% RPC 90.52 88.52 85.90 86.32 83.59 82.84
2% Opt Up to 100% RPC 100.11 98.36 96.06 97.28 94.42 93.92
Figure 38: Average Annual CCA Power Procurement Costs by Scenario 2020-2035
SDG&E SERVICE CHARGES
As part of the total cost of providing service for customers, the CCA program will pay fees to SDG&E for
various services. Such services include those related to billing and customer notification processes.

METHODOLOGY AND ASSUMPTIONS
City of San Diego Community Choice Aggregate Feasibility Study 57 | P a g e
SDG&E uses an incremental costing methodology for these services and includes the following
categories, among others:
• CCA Service Establishment;
• Customer Notification (Optional Service);
• Mass Enrollment;
• Opt-out Services;
• CCA Service Request;
• Consolidated Bill Ready Billing Services;
• Other Billing Services;
• CCA Termination of Service; and
• Miscellaneous.
Costs for these SDG&E CCA service fee charges are detailed in SDG&E Schedule CCA, Transportation of
Electric Power for CCA Customers.84 Applicable fees estimated in the Study were assumed to be $10 per
year or $0.83 per month per account, based on review of available information.
SDG&E COST RESPONSIBILITY SURCHARGE CHARGES
CCA customers must also pay the SDG&E CRS which is comprised of the Department of Water Resources
Bond Charge (DWR-BC), the Competitive Transition Charge (CTC), and the PCIA. The CRS, as
determined by the CPUC, is intended to protect remaining bundled service customers from incurring
additional costs arising from customers leaving the IOU system to join a CCA. The CRS is a mechanism
to repay the IOU for investments previously made on behalf of CCA program customers. Table 19
provides the most recent SDG&E filed CRS rates (2017 Vintage as effective March 2017). Appendix G
includes SDG&E Rate Schedules. Should the CCA program go forward, however, the PCIA would likely
increase, perhaps materially, and has been examined as part of Sensitivity Analysis 3, where the PCIA has
been assumed to increase by 10% over Base Case Scenario levels. A reduction of 2.5% relative to Base
Case Scenario levels was evaluated, in Sensitivity Analysis 4. Additional discussion of the risks
surrounding the PCIA is included in Section V.
84 Schedule CCA, Transportation of Electric Power for Community Choice Aggregation Customers:
http://regarchive.sdge.com/tm2/pdf/ELEC_ELEC-SCHEDS_CCA.pdf

METHODOLOGY AND ASSUMPTIONS
July 2017 58 | P a g e
Table 19: SDG&E CCA CRS by Rate Class Effective March 1, 2017
SDG&E FRANCHISE FEE CHARGES
SDG&E’s current rates include franchise fees that are in turn paid to a city or county for the nonexclusive
right to install and maintain SDG&E equipment on streets and public rights of way. Franchise fees of 1.1%
are included in its rates and collected through customer’s bills. These franchise fees are calculated as a
percentage of total billings. For customers located within City limits, there is an additional surcharge
Franchise Fee of 5.78%. This differential recovers the franchise fee imposed by the City on SDG&E. The
Revenue Requirement includes the base franchise fee (1.1%) and City Franchise Fee surcharge (5.78%).
ELECTRIC SERVICE PROVIDER CHARGES
The COS analysis assumed that an ESP would provide energy procurement services as well as the
required Scheduling Coordinator interface to the CAISO. Fees charged were assumed to be $1.50 per
customer account per month in year 2020, escalating at 1% per year over the Study period.
OTHER STARTUP CHARGES
Other startup charges include those costs required to get the CCA program up and running and not
attributable to startup capital expenditures and investments in longer-lived assets, as described in more
detail under the heading “Capital Expenditures.” These other startup costs include CCA establishment
fees, costs for communications and notifications, opt-out expenses, and enrollment fees. The other
startup charges are assumed to take place in a phased manner beginning in May of 2020 and continuing
for one year. As shown in Table 20, Total Startup Charges are estimated to be approximately $4.3 million.
Line Description DWR-BCi CTCii PCIAiii
TOTAL CRSiv
(a) (b) (c) (d)
1 Agricultural $- $0.00099 $0.01173 $0.01272
2 Outdoor Lighting Small<20kW - - - -
3 Commercial/Industrial Small <20kW $0.00549 $0.00184 $0.01805 $0.02538
4 Commercial/Industrial Large >20kW $0.00549 $0.00152 $0.01594 $0.02295
5 Residential $0.00549 $0.00177 $0.02095 $0.02821
6 Residential CARE - $0.00177 $0.02095 $0.02272
7 Residential Outdoor Lighting - - - - i Department of Water Resources Bond Charge ii Competitive Transition Charge iii Power Charge Indifference Adjustment iv Cost Responsibility Surcharge which equals the sum of Columns (a), (b), and (c).

METHODOLOGY AND ASSUMPTIONS
City of San Diego Community Choice Aggregate Feasibility Study 59 | P a g e
Table 20: Other CCA Startup Charges85
PROFESSIONAL SERVICES
Professional services include engineering, technical, and management consulting; legal and regulatory
services; and communication and public outreach services. These professional services are assumed to
occur post CCA start up and throughout the Study period. Annual fees totaling approximately $550,000
per year in 2020 have been escalated at 2% per year.
CITY ADMINISTRATION
Ongoing costs associated with the City administering the CCA program were assumed to be
approximately $188,000 per year. The fee was based on several generic FTEs supporting the program for
various amounts of time over the course of a year using staffing costs from the labor analysis. This fee is
assumed to cover City staff paid to interface with the CCA program.
OTHER OPERATING EXPENSES
Other operating expenses include miscellaneous charges for items such as rent, professional
registrations, travel and other business expenses, utilities, staff development, office supplies,
advertising, and computer software and support. These were assumed to be tied to overall expenditures
for salaries and wages and ESP charges. As such, other operating expenses were calculated as 5.28% of
total annual salaries and wages plus ESP charges. For the Test Year, other operating expenses totaled
approximately $736,000.
UNCOLLECTIBLE ACCOUNTS
Uncollectible account expense assumptions were based on the end of year 2016 SDG&E allowance for
collection of receivables of $8 million, which equated to 0.188% of SDG&E’s total electric and natural gas
85 Refer to SDG&E’s “Schedule CCA” rate tariff for more information on the CCA charges:
http://regarchive.sdge.com/tm2/pdf/ELEC_ELEC-SCHEDS_CCA.pdf
Line Description 5/1/2020
Phase I
11/1/2020 Phase II
5/1/2021 Phase III TOTAL
SDG&E CCA Setup Cost Calculations (a) (b) (c) (d)
1 CCA Establishment $9,000 $9,000
2 Standard Output Fee (Needed for the Notification Notices)
$8,640 $8,640 $8,640 $25,920
3 Estimated EDI Testing Charge $990 $990 $990 $2,970
4 Customer Notification, Initial & Follow-up
$14,928 $14,928 $14,928 $44,784
5 Customer Opt-Outs $192,832 $192,832 $192,832 $578,496
6 Mass Enrollment Fee $3,600 $5,760 $5,760 $15,120
7 Customer Notifications $1,207,681 $1,207,681 $1,207,681 $3,623,044
8 Total SDG&E CCA Setup Cost Calculations
$1,437,671 $1,430,831 $1,430,831 $4,299,334
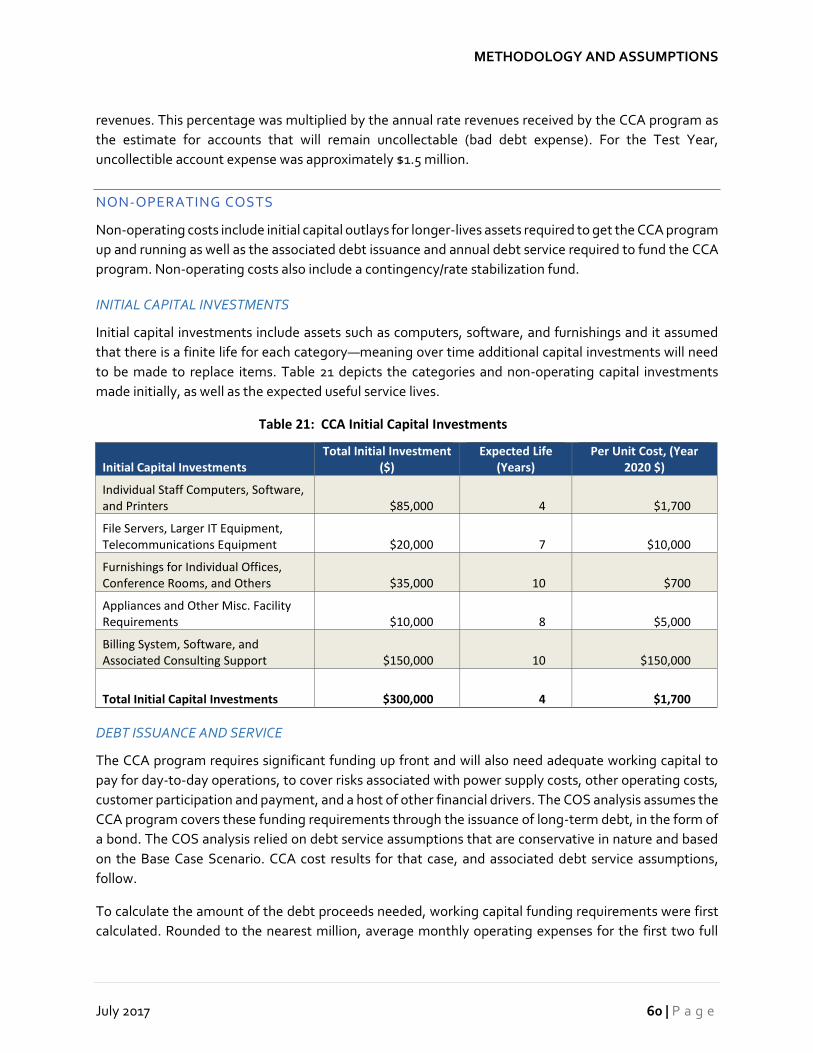
METHODOLOGY AND ASSUMPTIONS
July 2017 60 | P a g e
revenues. This percentage was multiplied by the annual rate revenues received by the CCA program as
the estimate for accounts that will remain uncollectable (bad debt expense). For the Test Year,
uncollectible account expense was approximately $1.5 million.
NON-OPERATING COSTS
Non-operating costs include initial capital outlays for longer-lives assets required to get the CCA program
up and running as well as the associated debt issuance and annual debt service required to fund the CCA
program. Non-operating costs also include a contingency/rate stabilization fund.
INITIAL CAPITAL INVESTMENTS
Initial capital investments include assets such as computers, software, and furnishings and it assumed
that there is a finite life for each category—meaning over time additional capital investments will need
to be made to replace items. Table 21 depicts the categories and non-operating capital investments
made initially, as well as the expected useful service lives.
Table 21: CCA Initial Capital Investments
Initial Capital Investments Total Initial Investment
($) Expected Life
(Years) Per Unit Cost, (Year
2020 $)
Individual Staff Computers, Software, and Printers $85,000 4 $1,700
File Servers, Larger IT Equipment, Telecommunications Equipment $20,000 7 $10,000
Furnishings for Individual Offices, Conference Rooms, and Others $35,000 10 $700
Appliances and Other Misc. Facility Requirements $10,000 8 $5,000
Billing System, Software, and Associated Consulting Support $150,000 10 $150,000
Total Initial Capital Investments $300,000 4 $1,700
DEBT ISSUANCE AND SERVICE
The CCA program requires significant funding up front and will also need adequate working capital to
pay for day-to-day operations, to cover risks associated with power supply costs, other operating costs,
customer participation and payment, and a host of other financial drivers. The COS analysis assumes the
CCA program covers these funding requirements through the issuance of long-term debt, in the form of
a bond. The COS analysis relied on debt service assumptions that are conservative in nature and based
on the Base Case Scenario. CCA cost results for that case, and associated debt service assumptions,
follow.
To calculate the amount of the debt proceeds needed, working capital funding requirements were first
calculated. Rounded to the nearest million, average monthly operating expenses for the first two full

METHODOLOGY AND ASSUMPTIONS
City of San Diego Community Choice Aggregate Feasibility Study 61 | P a g e
years of CCA operation, year 2021 and 2022, total $54 million. These operating expenses do not include
capital expenditures, debt service, or the contingency/rate stabilization fund. The costs included in this
amount cover day-to-day expenses including salaries, power costs, charges, and administrative
overhead. The COS analysis averaged the first two full years of operating expenses and then assumed
five months for funding requirements, based on our experience benchmarking the financial metrics of
other utility-type organizations. The CCA’s working capital reserve should provide enough cash on hand
to cover five months of operating costs or $272 million.
In addition, adequate cash to fund the rate stabilization fund, as described in further detail in the next
section, should be in place at the onset of operations. Again, taking the average of the first two full years
of rate stabilization fund balances (approximately $65 million for the first year and $73 million for the
second year) yields an additional $69 million cash requirement. The required working capital funding plus
the rate stabilization funding totaled $340 million.
The COS analysis assumes that the CCA program will issue a long-term (thirty year) bond to fund the
$363 million cash operating and reserve requirements plus all bond issuance costs, capitalized interest,
and a required bond reserve fund. The forecasted bond interest rate is 4%, however this number will
depend on the prevailing market interest rates as well as credit and financial metrics placed on the CCA
program by underwriters. Using conservative assumptions, the COS analysis includes a bond reserve
fund requirement—the CCA program is assumed to hold one payment of the maximum annual debt
service (principal plus interest) occurring over the life of the bond in a secured fund, approximately $25
million. Given the high level of uncertainty related to power costs, the PCIA, opt out rates for customers
and opt up rates for higher-priced renewables, the COS analysis assumed the CCA program would use
capitalized interest funding from the bond proceeds to cover the first two annual interest payments of
approximately $16.4 million per year ($33 million total for the first two years). The remaining years’
payments over the thirty-year bond term would include interest payments and outstanding principal
payments. Therefore, the CCA program would make interest payments for thirty years and principal
payments for twenty-eight years. Issuance costs totaled $12 million and were calculated using a rate of
3% of the total bond issuance, including the CCA program’s $340 million of capital requirements, $25
million of bond reserve funding, $33 million for two years of capitalized interest, and the issuance costs
of $12 million. Table 22 below shows the bond fund proceeds and uses, as well as the first year, second
year, and subsequent years of debt service payments:

METHODOLOGY AND ASSUMPTIONS
July 2017 62 | P a g e
Table 22: Debt Issuance and Annual Debt Service
Initial Funding Requirements
Operating Expenses $271,527,480
Contingency, Rate Stabilization Fund 68,715,891
Total CCA Funding $340,243,371
Bond Reserve Fund $24,601,610
Capitalized Interest 32,795,054
Issuance Costs $12,298,145
Other Bond Proceeds $69,694,810
Total Bond Issuance $409,938,180
Debt Service Payments
Year 1 Interest Payment (Dec. 31, 2020) $16,397,527
Year 2 Interest Payment (Dec. 31, 2021) $16,397,527
Year 3 through Year 30 Annual Principal Plus Interest Payments $24,601,610
RATE STABILIZATION AND CONTINGENCY FUND
A fundamental tenet of rate design should be rate stability. Rates should be stable from a revenue
perspective:
• Revenues should not change frequently and/or extremely;
• Utilities should have a stable income;
• Rates should be stable from the customer’s perspective; and
• Customers should be able to anticipate and plan for their monthly bills.
To mitigate risks associated with higher than expected operating costs, lower than expected
participation and revenues, or other deviations from expected circumstances, the COS analysis assumes
that the CCA program will set up a rate stabilization and contingency fund. This fund would be used to
cover the unexpected costs associated with shorter-term emergent issues, such as an extreme spike in
power procurement costs, or to ease the burden on ratepayers resulting from longer-term issues. For
example, if a large, long-term rate increase is somehow required, the fund would enable a more gradual
increase of rates over time. The rate stabilization and contingency fund was assumed to include adequate
cash resources to cover a 10% increase above expected annual non-power operating costs (10% times
the total operating costs less power procurement costs) plus an 11% increase in expected power
procurement prices. For the Test Year, this funding expense equated to $73 million. Rate stabilization
and contingency fund forecasts for the other scenarios and sensitivity cases can be found in Exhibit I.
METHODOLOGY AND ASSUMPTIONS
City of San Diego Community Choice Aggregate Feasibility Study 63 | P a g e
COST OF SERVICE RATES
The Revenue Requirement was allocated to individual rate classes based on COS principles. The COS
analysis followed long-held ratemaking principles grounded in the concept of charging customers cost
based rates; recovering service costs from customers based on the costs imposed on the system by that
customer. Cost based rates are intended to ensure that the prices paid by customers are fair and
reasonable and that there are no intra- or inter-class subsidies, i.e., one group of customers bearing the
cost burden caused by another group of customers.
Because the CCA program’s primary function is to procure power, the cost to serve each customer class
was based on how much power supply the customers within the class required. COS-based rates for each
class were then adjusted upward or downward across the board to generate revenues sufficient to meet
the Revenue Requirement. Rates proxies86 generated by the COS analysis model for each scenario and
sensitivity analysis compared with SDG&E rates are provided in the next section of the report “Results.”
86 Refer to Footnote 82 concerning the rate proxies presented in this Study.

This page intentionally left blank.

III. RESULTS
Results from the COS analysis model for the Base Case and other scenarios are provided in the following
segments. Where feasible, results for the Base Case are provided alongside results for the scenarios and
sensitivity cases. All detailed pro forma results for the Base Case, scenarios, and sensitivity cases are
provided in Exhibit I.
KEY ASSUMPTIONS FOR RATE COMPARISONS
This section provides additional assumptions upon which the results are based.
1. All CCA cited “rates” represent rate proxies or the unitized revenue requirement to be collected
from a customer class for the CCA program to be solvent. Rate design was not part of this Study.
2. For the Base Case Scenario and Scenario 5, the CCA program rate proxies for the 2% opting up
to 100% RPC, were compared to SDG&E’s EcoChoice tariff (Schedule GT).
3. For this Study, pure COS retail rate proxies by customer class were developed. No wholesale
energy sales were included.
4. SDG&E does not publicly release rate forecasts. For rate comparison purposes, SDG&E current
rates were escalated to 2022 by an average of 2.8% annually across all customer classes.
Escalation rates varied by individual customer class and by year, and were based on the
commodity cost adjustment forecast for SDG&E’s “Green Tariff Differential,” within its
EcoChoice rate forecast, as filed by SDG&E with the CPUC in January 2017.87 SDG&E rate
escalation beyond year 2022 was also based on the commodity cost adjustment rate of change
in this schedule, in this case, the five-year average annual change by rate class for years 2018 to
2022 was applied to years 2023 through 2026. For Sensitivity Analysis 1 and 2, a flat percentage
change by year, +6.0% for Sensitivity Analysis 1 and -2.0% for Sensitivity Analysis 2, was applied
to the escalation.
5. The Study does not incorporate SDG&E’s recently-implemented Critical Peak Pricing for the
energy component of rates.
6. Time-of-Use (TOU) rates will be implemented by SDG&E by 2020. The financial analysis in the
Study is a revenue generation/sufficiency evaluation not a rate design effort. Study results do not
account for SDG&E TOU rates.
7. The January 2017 SDG&E 20-year forecast of its EcoChoice rate included a separate line item for
the PCIA, among other items.
a. The most recent forecast from January 2017 was used to forecast the EcoChoice rate
path.
b. With respect to the PCIA, this forecast was used by rate class, but was updated with the
values for the most recent tariff, the 2017 Vintage effective as of March 2017, to which
the rate of change in the forecast was applied. This revised schedule was the Base Case
87 http://www.sdge.com/environment/connected-to-the-sun/historical-rates-and-20-year-forecasts. SDG&E’s forecast showed
negative escalation for energy commodity costs (declining costs) beginning in 2021 for several classes. For years 2021 and
2022, escalation was adjusted to reflect the average escalation by class for years 2018 through 2020.
RESULTS
July 2017 66 | P a g e
Scenario PCIA forecast. For Sensitivity Analysis 3 and 4, a flat percentage change by year
was applied to this schedule.
8. The analysis assumes all CCA customers are in the City and therefore the SDG&E Coastal Zone
was used for rate comparisons.
9. The CPUC is currently considering a Portfolio Allocation Methodology in place of the current CRS
PCIA methodology for assessing costs to departing load. This Study utilizes the existing CRS
PCIA methodology because the Portfolio Allocation Methodology approach has not been
approved and will likely change during the regulatory review process prior to implementation.
BASE CASE RESULTS
Results of the Base Case, 50% RPC Scenario with 2% opt up to 100% RPC, indicate that by year 2025, for
all rate classes except the Agricultural class, CCA program baseload customers will have all-in rates—
total rates including the cost for: CCA generation, IOU transmission, and IOU distribution—that are lower
than SDG&E. Figure 39 presents the Base Case energy commodity rate differences between the CCA
program and SDG&E for the first five years of the Study period for baseload customers. The energy
commodity portion of customers’ bills, also frequently termed “generation,” is where the CCA competes
against SDG&E, the incumbent IOU. The delivery and customer charges remain the same between CCA
customers and SDG&E bundled customers. For this simple illustration, only average energy commodity
rates are examined, no EcoChoice rates were considered. Using the overall average energy commodity
rates for the CCA program and SDG&E, as presented in Tables 23 and 24 below, Figure 39 illustrates how
the CCA program can competitively increase its RPC over time.
As can be seen in this figure, in 2023 CCA rates for the 50% RPC supply portfolio become lower that the
SDG&E average rate and baseload CCA customers experience rate savings. The amount of rate savings
is indicated by the shaded area under the SDG&E Average Rate line and above the CCA program
Scenario 2 Rate line. Around 2026, the SDG&E Average Rate line approaches the CCA program
Scenario 3 rate line, at which point the CCA program’s 80% RPC portfolio becomes competitive. Again,
the potential amount of rate savings over SDG&E Average rates for this higher RPC supply is indicated
by the shaded area between the two rate lines. The CCA’s 100% RPC portfolio remains higher than
SDG&E’s Average Rate through at least 2027.

RESULTS
City of San Diego Community Choice Aggregate Feasibility Study 67 | P a g e
Figure 39: Illustrative CCA Renewable Portfolio Content Progression Based on Rate Comparisons
The CCA rates, shown in Figure 39 for years 2022-2027, are held constant throughout the remainder of
the Study period. These unchanging rates are explained by the fact that the largest component of
operating expenses, power procurement, is not expected to increase over the Study period. In fact, for
all scenarios examined, by year 2035 power procurement costs decrease over time. CCA rates were set
initially based on COS study results for the average of three full years of “normal” operation. Over time,
the surplus generated by decreasing operational costs, driven by lower forecasted power costs, could be
used to either decrease rates or keep rates constant. With rates held constant, the surplus funds could be
used to procure higher levels of RPC power supply and/or invest in local renewables and energy
programs. For purposes of the Study, the surplus CCA program funds were assumed to be invested in
various DSM initiatives, such as conservation and EE, and local development of renewable generation
resources.
0.130
0.135
0.140
0.145
0.150
0.155
0.160
0.165
0.170
2022 2023 2024 2025 2026 2027
$/kWh
SDG&E Average Generation Rate Scenario 2 CCA Rate: 50% Renewable Portfolio Content
Scenario 4 CCA Rate: 100% Renewable Portfolio Content Scenario 3 CCA Rate: 80% Renewable Portfolio Content
Rate savings over
SDG&E Average Rate for 80%
Renewable Portfolio Content
Rate savings over
SDG&E Average Rate for 50%
Renewable Portfolio Content
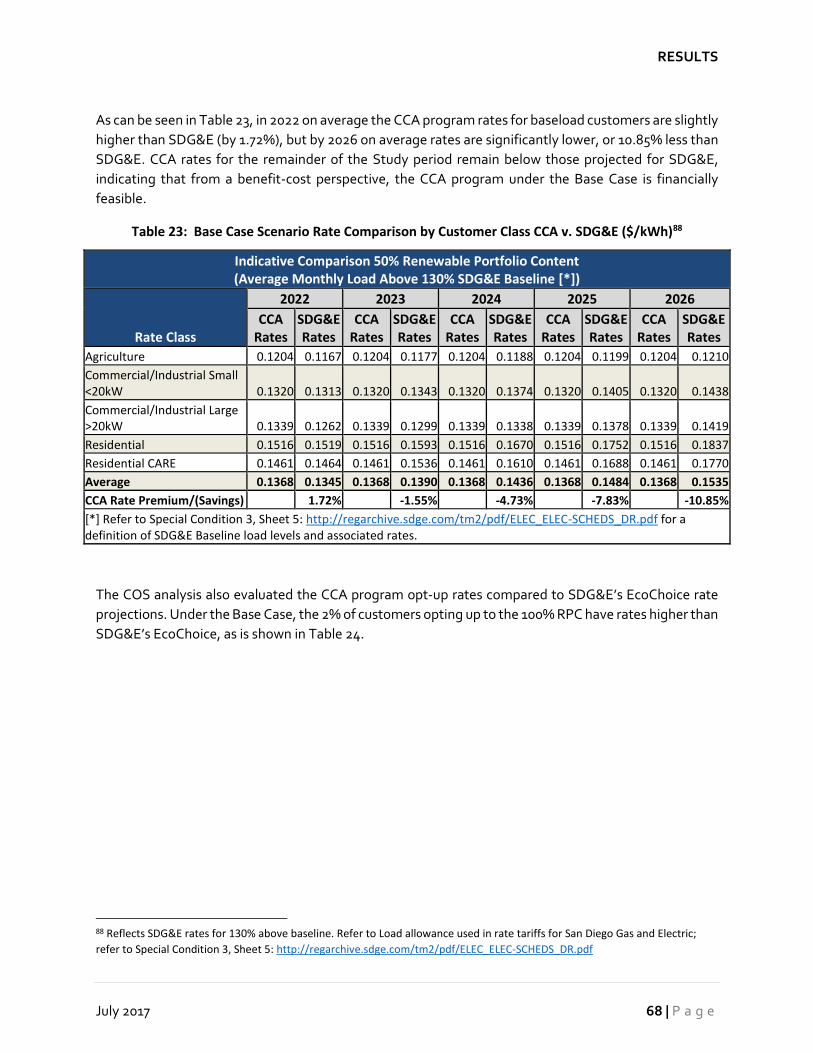
RESULTS
July 2017 68 | P a g e
As can be seen in Table 23, in 2022 on average the CCA program rates for baseload customers are slightly
higher than SDG&E (by 1.72%), but by 2026 on average rates are significantly lower, or 10.85% less than
SDG&E. CCA rates for the remainder of the Study period remain below those projected for SDG&E,
indicating that from a benefit-cost perspective, the CCA program under the Base Case is financially
feasible.
Table 23: Base Case Scenario Rate Comparison by Customer Class CCA v. SDG&E ($/kWh)88
Indicative Comparison 50% Renewable Portfolio Content (Average Monthly Load Above 130% SDG&E Baseline [*])
Rate Class
2022 2023 2024 2025 2026
CCA Rates
SDG&E Rates
CCA Rates
SDG&E Rates
CCA Rates
SDG&E Rates
CCA Rates
SDG&E Rates
CCA Rates
SDG&E Rates
Agriculture 0.1204 0.1167 0.1204 0.1177 0.1204 0.1188 0.1204 0.1199 0.1204 0.1210
Commercial/Industrial Small <20kW 0.1320 0.1313 0.1320 0.1343 0.1320 0.1374 0.1320 0.1405 0.1320 0.1438
Commercial/Industrial Large >20kW 0.1339 0.1262 0.1339 0.1299 0.1339 0.1338 0.1339 0.1378 0.1339 0.1419
Residential 0.1516 0.1519 0.1516 0.1593 0.1516 0.1670 0.1516 0.1752 0.1516 0.1837
Residential CARE 0.1461 0.1464 0.1461 0.1536 0.1461 0.1610 0.1461 0.1688 0.1461 0.1770
Average 0.1368 0.1345 0.1368 0.1390 0.1368 0.1436 0.1368 0.1484 0.1368 0.1535
CCA Rate Premium/(Savings) 1.72% -1.55% -4.73% -7.83% -10.85%
[*] Refer to Special Condition 3, Sheet 5: http://regarchive.sdge.com/tm2/pdf/ELEC_ELEC-SCHEDS_DR.pdf for a definition of SDG&E Baseline load levels and associated rates.
The COS analysis also evaluated the CCA program opt-up rates compared to SDG&E’s EcoChoice rate
projections. Under the Base Case, the 2% of customers opting up to the 100% RPC have rates higher than
SDG&E’s EcoChoice, as is shown in Table 24.
88 Reflects SDG&E rates for 130% above baseline. Refer to Load allowance used in rate tariffs for San Diego Gas and Electric;
refer to Special Condition 3, Sheet 5: http://regarchive.sdge.com/tm2/pdf/ELEC_ELEC-SCHEDS_DR.pdf

RESULTS
City of San Diego Community Choice Aggregate Feasibility Study 69 | P a g e
Table 24: Base Case Scenario Rate Comparison by Customer Class CCA v. SDG&E EcoChoice ($/kWh) 89
Indicative Comparison 100% Renewable Portfolio Content
(Average Monthly Load Above 130% SDG&E Baseline [*])
Rate Class
2022 2023 2024 2025 2026
CCA Rates
SDG&E Rates
CCA Rates
SDG&E Rates
CCA Rates
SDG&E Rates
CCA Rates
SDG&E Rates
CCA Rates
SDG&E Rates
Agriculture 0.1504 0.1315 0.1504 0.1327 0.1504 0.1339 0.1504 0.1351 0.1504 0.1363
Commercial/Industrial Small <20kW 0.1620 0.1383 0.1620 0.1415 0.1620 0.1448 0.1620 0.1481 0.1620 0.1515
Commercial/Industrial Large >20kW 0.1639 0.1190 0.1639 0.1225 0.1639 0.1262 0.1639 0.1300 0.1639 0.1338
Residential 0.1816 0.1326 0.1816 0.1391 0.1816 0.1458 0.1816 0.1529 0.1816 0.1603
Residential CARE 0.1761 0.1271 0.1761 0.1333 0.1761 0.1398 0.1761 0.1466 0.1761 0.1537
Average 0.1668 0.1297 0.1668 0.1338 0.1668 0.1381 0.1668 0.1425 0.1668 0.1471
CCA Rate Premium/(Savings) 28.60% 24.65% 20.80% 17.04% 13.38%
[*] Refer to Special Condition 3, Sheet 5: http://regarchive.sdge.com/tm2/pdf/ELEC_ELEC-SCHEDS_DR.pdf for a definition of SDG&E Baseline load levels and associated rates.
Looking at the financial operating performance of the CCA program under the Base Case, during the first
six years of operation, operating and non-operating revenues are not sufficient to cover operating
expenses (including the contingency and rate stabilization fund) plus debt service. These key operating
results are shown in Table 25 and are encapsulated in the negative net margin numbers from CCA onset
through year 2025. These negative net margins are owed to the large up front investments required to
establish the CCA program and the lag in customer participation and associated revenues. However, net
margins are shown to steadily increase year over year, becoming positive in year 2026 and growing
steadily throughout the remainder of the Study period. Also, the working capital—a measure of the CCA
program’s ability to meet its obligations with current assets—can be deemed adequate from onset of the
CCA program throughout the Study period. Working capital available deviates from the working capital
target, but only by less than 10% for five years. Given the conservative target for working capital set
within the COS analysis and the available amount of cash on hand (which always exceeds $220 million),
the CCA program under this Base Case Scenario is reliably solvent and financially feasible.
The first years of net margins are sufficiently negative to cause the NPV of the net margins over the entire
Study period to also be negative. The NPV is calculated using a discount rate of 4% (set equal to the
interest rate for the long-term debt) and shows that as of 2020, the NPV of all the net margins earned
(2020 through 2035) is –$48.3 million.
If looking at the CCA program from a traditional investment perspective, the negative NPV of net
margins would indicate the CCA program under the Base Case does not make financial sense. However,
the Study includes consideration of additional factors when assessing CCA feasibility. After 2026, the
89 Ibid.
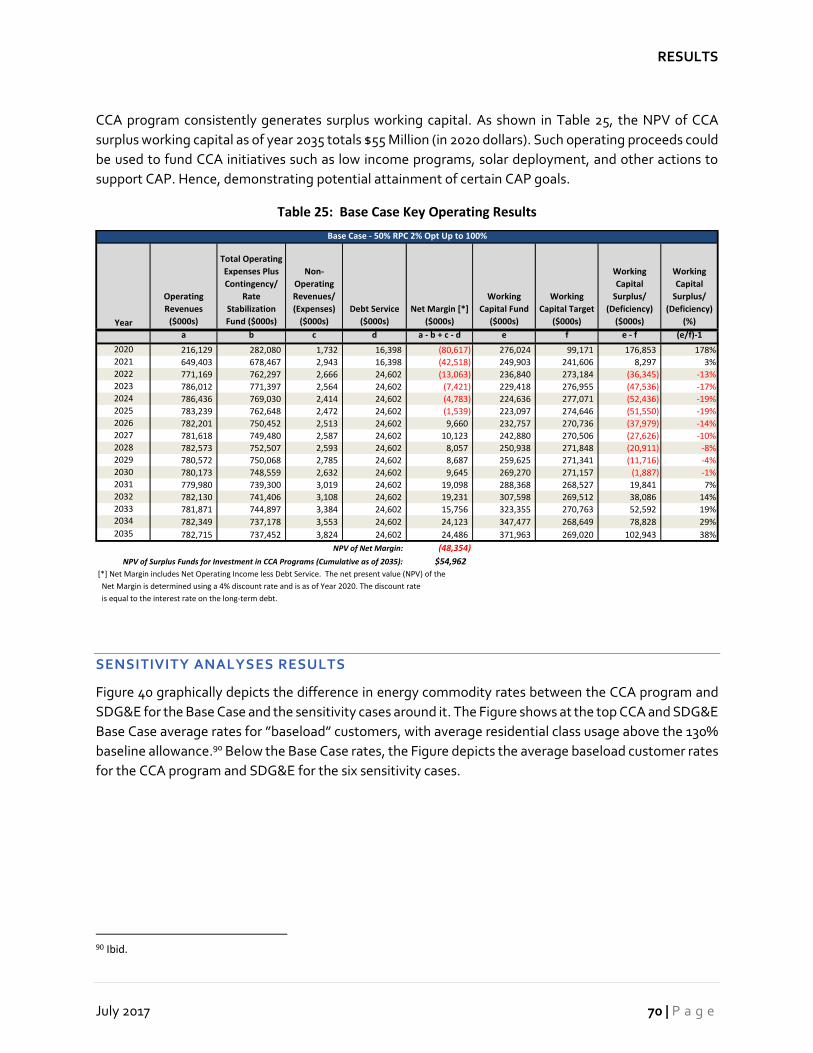
RESULTS
July 2017 70 | P a g e
CCA program consistently generates surplus working capital. As shown in Table 25, the NPV of CCA
surplus working capital as of year 2035 totals $55 Million (in 2020 dollars). Such operating proceeds could
be used to fund CCA initiatives such as low income programs, solar deployment, and other actions to
support CAP. Hence, demonstrating potential attainment of certain CAP goals.
Table 25: Base Case Key Operating Results
SENSITIVITY ANALYSES RESULTS
Figure 40 graphically depicts the difference in energy commodity rates between the CCA program and
SDG&E for the Base Case and the sensitivity cases around it. The Figure shows at the top CCA and SDG&E
Base Case average rates for ”baseload” customers, with average residential class usage above the 130%
baseline allowance.90 Below the Base Case rates, the Figure depicts the average baseload customer rates
for the CCA program and SDG&E for the six sensitivity cases.
90 Ibid.
Year
Operating
Revenues
($000s)
Total Operating
Expenses Plus
Contingency/
Rate
Stabilization
Fund ($000s)
Non-
Operating
Revenues/
(Expenses)
($000s)
Debt Service
($000s)
Net Margin [*]
($000s)
Working
Capital Fund
($000s)
Working
Capital Target
($000s)
Working
Capital
Surplus/
(Deficiency)
($000s)
Working
Capital
Surplus/
(Deficiency)
(%)
a b c d a - b + c - d e f e - f (e/f)-1
2020 216,129 282,080 1,732 16,398 (80,617) 276,024 99,171 176,853 178%2021 649,403 678,467 2,943 16,398 (42,518) 249,903 241,606 8,297 3%2022 771,169 762,297 2,666 24,602 (13,063) 236,840 273,184 (36,345) -13%2023 786,012 771,397 2,564 24,602 (7,421) 229,418 276,955 (47,536) -17%2024 786,436 769,030 2,414 24,602 (4,783) 224,636 277,071 (52,436) -19%2025 783,239 762,648 2,472 24,602 (1,539) 223,097 274,646 (51,550) -19%2026 782,201 750,452 2,513 24,602 9,660 232,757 270,736 (37,979) -14%2027 781,618 749,480 2,587 24,602 10,123 242,880 270,506 (27,626) -10%2028 782,573 752,507 2,593 24,602 8,057 250,938 271,848 (20,911) -8%2029 780,572 750,068 2,785 24,602 8,687 259,625 271,341 (11,716) -4%2030 780,173 748,559 2,632 24,602 9,645 269,270 271,157 (1,887) -1%2031 779,980 739,300 3,019 24,602 19,098 288,368 268,527 19,841 7%2032 782,130 741,406 3,108 24,602 19,231 307,598 269,512 38,086 14%2033 781,871 744,897 3,384 24,602 15,756 323,355 270,763 52,592 19%2034 782,349 737,178 3,553 24,602 24,123 347,477 268,649 78,828 29%2035 782,715 737,452 3,824 24,602 24,486 371,963 269,020 102,943 38%
NPV of Net Margin: (48,354)
NPV of Surplus Funds for Investment in CCA Programs (Cumulative as of 2035): $54,962
[*] Net Margin includes Net Operating Income less Debt Service. The net present value (NPV) of the
Net Margin is determined using a 4% discount rate and is as of Year 2020. The discount rate
is equal to the interest rate on the long-term debt.
Base Case - 50% RPC 2% Opt Up to 100%

RESULTS
City of San Diego Community Choice Aggregate Feasibility Study 71 | P a g e
Figure 40: Rate Comparison Summary for Base Case Scenario and All Sensitivities (50% RPC)
As with the previous Figure 40, Figure 41 shows CCA and SDG&E Base Case average energy commodity
rates compared with the six sensitivity cases, but this time depicting rates for those CCA customers
opting up to 100% renewables versus SDG&E’s projected EcoChoice rates. As discussed previously, the
CCA program opt up rate is higher than the SDG&E EcoChoice rate under the Base Case and six sensitivity
analyses.
Detailed results for other scenarios appear in Exhibit I.
0.0000 0.0200 0.0400 0.0600 0.0800 0.1000 0.1200 0.1400 0.1600 0.1800 0.2000
CCA
SDG&E
CCA
SDG&E
CCA
SDG&E
CCA
SDG&E
CCA
SDG&E
CCA
SDG&E
CCA
SDG&E
Hig
h S
DG
&E
Rat
esLo
w S
DG
&E
Rat
esH
igh
PCI
ALo
w P
CIA
Hig
h O
pt
Ou
tLo
w O
pt O
ut
Bas
e C
ase
-50
% R
PS 2
%O
pt
Up
to1
00
% >
13
0%
Bas
elin
e
2022-2026 Average Base Rates ($/kWh)

RESULTS
July 2017 72 | P a g e
Figure 41: Rate Comparison Summary for Base Case Scenario and All Sensitivities (100% RPC)
SUMMARY OF FINANCIAL ANALYSES
Concluding the discussion of Study Results, Figure 42 provides a summary overview of operating results
by scenario and sensitivity analysis. This Figure depicts the NPV, using a 4% discount rate, of the annual
net margins over the Study period as well as the NPV of surplus funds that are forecasted to be available
for investment beginning in year 2027, for all the scenarios and sensitivity analyses.
The net margins represent net operating income less debt service. The low, and sometimes negative,
NPVs of net margins are owed to the large up front investments required to establish the CCA program
and the lag in customer participation and associated revenues. However, annual net margins in all cases,
except Sensitivity Analysis 3 - High PCIA, are shown to steadily increase year over year, becoming
positive around year 2026 and remaining positive, on average, throughout the remainder of the Study
period.
For most of the scenarios and sensitivity analyses examined, the first years of net margins are sufficiently
negative to cause the NPV of the net margins over the entire Study period to also be negative. If looking
at the CCA program from a traditional investment perspective, the negative NPV of net margins would
indicate the CCA program under the Base Case does not make financial sense. However, the Study
includes consideration of entirely different factors when assessing CCA feasibility, including the
achievement of stated program goals and overall financial feasibility and solvency.
0.0000 0.0200 0.0400 0.0600 0.0800 0.1000 0.1200 0.1400 0.1600 0.1800 0.2000
CCA
SDG&E
CCA
SDG&E
CCA
SDG&E
CCA
SDG&E
CCA
SDG&E
CCA
SDG&E
CCA
SDG&E
Hig
h S
DG
&E
Rat
es(E
coC
hoic
e)
Low
SD
G&
ER
ate
s(E
coC
hoic
e)H
igh
PCI
A(E
coC
ho
ice
)Lo
w P
CIA
(Eco
Cho
ice)
Hig
h O
pt
Ou
t(E
coC
ho
ice
)Lo
w O
pt
Ou
t(E
coC
hoic
e)
Bas
e C
ase
-50
% R
PS 2
%O
pt
Up
to
100%
>1
30%
Bas
elin
e(E
coC
ho
ice
)2022-2026 Average EcoChoice Base Rates ($/kWh)

RESULTS
City of San Diego Community Choice Aggregate Feasibility Study 73 | P a g e
The working capital—a measure of the CCA program’s ability to meet its obligations with current assets—
can be deemed adequate from onset of the CCA program throughout the Study period, again for all cases
except Sensitivity Analysis 3 – High PCIA. Working capital available may deviate from the working capital
target for any given year, but given the conservative target for working capital set within the Study and
the available amount of cash on hand, the CCA program is reliably solvent and financially feasible.
After year 2030, the CCA program consistently accumulates surplus working capital—assumed to be
available for investment—for all cases except Sensitivity Analysis 3- High PCIA and Scenario 5- 80%
renewables for base load customers and 2% opting up to 100% renewable content. The funds available
for investment represent surplus funds that could be used for achievement of the City CCA program goals
and initiatives, such as, investment in local renewable DG; local utility-scale or community renewable
energy projects; DSM, EE, and conservation programs; low income programs; or other actions to support
the CAP.

RESULTS
July 2017 74 | P a g e
Figure 42: CCA Operating Results by Scenario and Sensitivity Analysis
$(51)
$(47)
$166
$(2,774)
$(48)
$(48)
$(132)
$(116)
$(67)
$20
$(48)
$59
$51
$257
$55
$55
$10
$44
$106
$55
Sensitivity 6 - Low Opt Out
Sensitivity 5 - High Opt Out
Sensitivity 4 - Low PCIA
Sensitivity 2 - Low SDG&E Rates
Sensitivity 1 - High SDG&E Rates
Scenario 5
Scenario 4
Scenario 3
Scenario 2
Base Case Scenario
(2020 Million Dollars)
NPV of Surplus Funds for Investment in CCAPrograms (as of 2035)
NPV of Net Margin(2020-2035)
Sensitivity 3 - High PCIA

IV. BENEFITS
This section of the Study outlines the potential benefits of establishing a CCA program in addition to
those previously addressed (i.e., competitive rates, increasing renewables content, local control, among
others). Three primary categories of benefits are addressed: GHG reductions, economic development,
and other CCA program opportunities.
GREENHOUSE GAS REDUCTIONS
A primary impetus behind exploring a CCA program is the City’s goal of reaching 100% renewable energy
supply by 2035. This section addresses the potential incremental GHG reductions that the CCA program
may achieve over SDG&E based on assumed RPC in the power supply. First, a forecast of SDG&E GHG
emissions based on RPC is provided followed by forecasts for the various CCA program scenarios
modeled in the Study. Based on these results, the potential additional GHG reductions achieved by the
CCA program are quantified.
Table 26 summarizes SDG&E RPC versus RPS requirements from 2011-2020. As can be seen from the
data, as of 2015 SDG&E had 35.2% of RPC online, exceeding RPS 2020 requirements of 33%, and
currently has a total of 45.2% under contract, within just under 5% of the 2030 RPS target.
Table 26: SDG&E Performance Against Renewable Portfolio Standard (2011-2020)
Year
CA Renewable Portfolio Standard
Requirement
SDG&E Renewable
Portfolio Content
SDG&E Performance
Against Requirement
(c)/(b)
(a) (b) (c) (d)
2011 20.0% 20.8% 104.0%
2012 20.0% 20.3% 101.5%
2013 20.0% 21.6% 108.0%
2014 21.7% 31.6% 145.6%
2015 23.3% 35.2% 151.1%
2016 25.0% Unknown Unknown
2017 27.0% Unknown Unknown
2018 29.0% Unknown Unknown
2019 31.0% Unknown Unknown
2020 33.0% 45.2% 137.0%
Figure 43 presents SDG&E’s historic (2003-15), contracted (2015-2020), and forecasted (2020-2035) RPS
generation. The first SDG&E RPC forecast is based on SDG&E complying with the RPS requirement and
attaining 50% by 2030 from its 45.2% in 2020.91 The second forecast demonstrates the current trend for
91 California Public Utilities Commission Renewable Portfolio Standard Homepage accessed March, 2017:
http://www.cpuc.ca.gov/RPS_Homepage/

BENEFITS
July 2017 76 | P a g e
SDG&E’s RPC solely for illustrative purposes; absent increased RPS mandates or other market factors,
SDG&E has not indicated that it would exceed the 50% RPS-mandated RPC.
Figure 43: SDG&E Renewable Portfolio Standard Generation (2003-2035)92
Figure 44 illustrates RPC for SDG&E and the CCA program under the various Study scenarios. The two SDG&E forecasts defined above are charted against the five CCA program Study scenarios (refer to Table 2 on page 6 for scenario definitions). Finally, an additional forecast has been included that models an increasing CCA program RPC trend from 50% to 100% over the Study term, labeled the Progressive CCA RPC. This last trend line illustrates how the CCA program could potentially transition to higher levels of RPC over time.
92 2003 to 2020 figures obtained from California Public Utilities Commission Renewable Portfolio Standard Monthly Project
Status Table for SDG&E (updated August 10, 2016) http://www.cpuc.ca.gov/WorkArea/DownloadAsset.aspx?id=12370. Post
2020 amounts are based on Study forecasts.
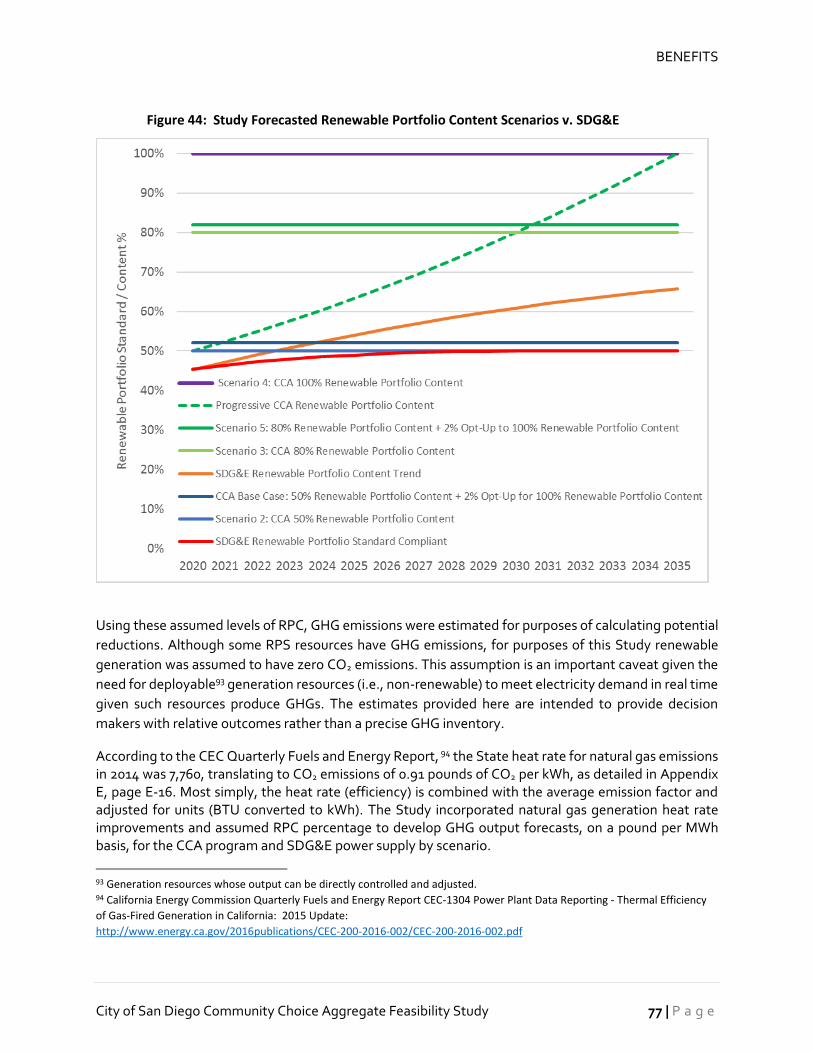
BENEFITS
City of San Diego Community Choice Aggregate Feasibility Study 77 | P a g e
Figure 44: Study Forecasted Renewable Portfolio Content Scenarios v. SDG&E
Using these assumed levels of RPC, GHG emissions were estimated for purposes of calculating potential
reductions. Although some RPS resources have GHG emissions, for purposes of this Study renewable
generation was assumed to have zero CO2 emissions. This assumption is an important caveat given the
need for deployable93 generation resources (i.e., non-renewable) to meet electricity demand in real time
given such resources produce GHGs. The estimates provided here are intended to provide decision
makers with relative outcomes rather than a precise GHG inventory.
According to the CEC Quarterly Fuels and Energy Report, 94 the State heat rate for natural gas emissions in 2014 was 7,760, translating to CO2 emissions of 0.91 pounds of CO2 per kWh, as detailed in Appendix E, page E-16. Most simply, the heat rate (efficiency) is combined with the average emission factor and adjusted for units (BTU converted to kWh). The Study incorporated natural gas generation heat rate improvements and assumed RPC percentage to develop GHG output forecasts, on a pound per MWh basis, for the CCA program and SDG&E power supply by scenario.
93 Generation resources whose output can be directly controlled and adjusted. 94 California Energy Commission Quarterly Fuels and Energy Report CEC-1304 Power Plant Data Reporting - Thermal Efficiency
of Gas-Fired Generation in California: 2015 Update:
http://www.energy.ca.gov/2016publications/CEC-200-2016-002/CEC-200-2016-002.pdf
BENEFITS
July 2017 78 | P a g e
Table 27 illustrates CO2 emissions in millions of metric tons (MMT) for two SDG&E RPC forecasts and four
CCA RPC forecasts. Column (b) presents the estimated SDG&E RPS generation based on: SDG&E’s
contracted RPS PPAs95 for 2020; a trend to the 50% RPS target for 2021 through 2030; and maintaining
the 2030 level through 2035, and column (c) presents the associated CO2 levels. SDG&E has provided no
public information on its post 2030 RPS intent; this assumption may potentially underestimate SDG&E’s
future RPS performance. Therefore, and solely for illustrative purposes, an alternative SDG&E RPS
forecast is shown in Column (d) that projects SDG&E exceeding 50% RPS by 2023 and 65% by 2035, based
on SDG&E’s current trend. However, SDG&E has not publicly indicated its post-2030 RPS goals, in
particular any plan to exceed current RPS targets, and this estimate was not used in Study results.
Columns (f), (g), and (h) of show the estimated CO2 emissions for the CCA program Study scenarios (i.e.,
50%, 80%, and 100% RPC, respectively). Column (j) presents an additional CCA forecast based on moving
from 50% RPC in 2020 to 100% RPC by 2035 (Progressive CCA RPC).
95 Obtained from the California Public Utilities Commission Renewable Portfolio Standard homepage in March, 2017:
http://cpuc.ca.gov/RPS_homepage/

BENEFITS
City of San Diego Community Choice Aggregate Feasibility Study 79 | P a g e
Table 27: Comparison of Potential Carbon Dioxide Output—SDG&E v. CCA Program (MMT Carbon
Dioxide)
Year
SDG&E RPS Compliant Content Estimate
SDG&E RPS Trend [*]
CCA 50% RPC
CCA 80% RPC
CCA 100% RPC
Progressive CCA RPC
(a) (b) (c) (d) (e) (f) (g) (h) (i) (j)
2020 45.2% 1.6 45.3% 1.6 1.4 0.6 ‐ 50% 1.4 2021 45.7% 1.5 47.2% 1.5 1.4 0.6 ‐ 52% 1.4 2022 46.2% 1.5 49.0% 1.4 1.4 0.6 ‐ 55% 1.3 2023 46.6% 1.5 50.8% 1.4 1.4 0.6 ‐ 58% 1.2 2024 47.1% 1.5 52.4% 1.3 1.4 0.6 ‐ 60% 1.1 2025 47.6% 1.5 54.0% 1.3 1.4 0.6 ‐ 63% 1.0 2026 48.1% 1.4 55.6% 1.2 1.4 0.6 ‐ 66% 0.9 2027 48.6% 1.4 57.0% 1.2 1.4 0.6 ‐ 70% 0.8 2028 49.0% 1.4 58.4% 1.1 1.4 0.6 ‐ 73% 0.7 2029 49.5% 1.4 59.7% 1.1 1.4 0.5 ‐ 76% 0.6 2030 50.0% 1.4 60.9% 1.1 1.4 0.5 ‐ 80% 0.5 2031 50.0% 1.4 62.0% 1.0 1.4 0.5 ‐ 84% 0.4 2032 50.0% 1.4 63.1% 1.0 1.4 0.5 ‐ 88% 0.3 2033 50.0% 1.4 64.0% 1.0 1.4 0.5 ‐ 92% 0.2 2034 50.0% 1.3 64.9% 0.9 1.3 0.5 ‐ 96% 0.1 2035 50.0% 1.3 65.7% 0.9 1.3 0.5 ‐ 100% ‐
TOTAL 22.9 19.0 [*] 22.2 8.9 ‐ 11.9 CO2 Reduction over (c) 3% 61% 100% 48% CO2 Reduction over (c) (MMT) 0.7 14.0 22.9 11.0 [*] For Illustrative purposes only; SDG&E has not indicated it would exceed RPS mandates. Key: RPS—California Renewable Portfolio Standard MMT—Million Metric Tons CO2—Carbon Dioxide CCA—Community Choice Aggregation RPC—Renewable Portfolio Content

BENEFITS
July 2017 80 | P a g e
In the following Figure 45, the emissions reductions are depicted for the different SDG&E and CCA RPC
scenarios.
Figure 45: Projected Carbon Dioxide Emissions by CCA Scenario and SDG&E Forecast
ECONOMIC IMPACTS
Establishing a CCA program is expected to result in three levels of economic impact. The first or primary
level includes two economic impacts: lower energy bills for customers; and development of local
renewable resources to support increased levels of CCA program supply portfolios. The second level of
economic impacts includes those resulting from customer-incentive programs created by the CCA
program. The third level of economic impacts includes environmental and health impacts related to air
quality or improved human health due to the increased use of renewable energy sources.
This section provides: the rationale for quantifying each of these economic impacts, including key
assumptions and underlying methodology; and a summary of the results in terms of retail and
construction spending, jobs, labor income, output and total value-added activity within the San Diego
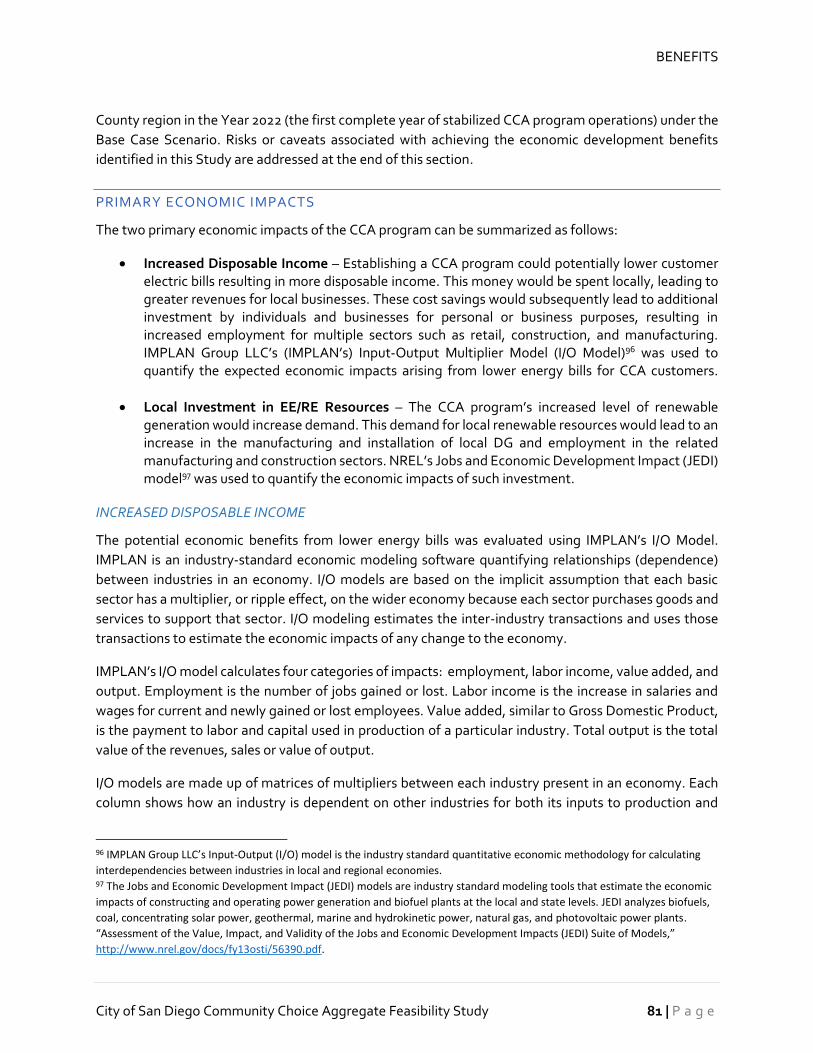
BENEFITS
City of San Diego Community Choice Aggregate Feasibility Study 81 | P a g e
County region in the Year 2022 (the first complete year of stabilized CCA program operations) under the
Base Case Scenario. Risks or caveats associated with achieving the economic development benefits
identified in this Study are addressed at the end of this section.
PRIMARY ECONOMIC IMPACTS
The two primary economic impacts of the CCA program can be summarized as follows:
• Increased Disposable Income – Establishing a CCA program could potentially lower customer electric bills resulting in more disposable income. This money would be spent locally, leading to greater revenues for local businesses. These cost savings would subsequently lead to additional investment by individuals and businesses for personal or business purposes, resulting in increased employment for multiple sectors such as retail, construction, and manufacturing. IMPLAN Group LLC’s (IMPLAN’s) Input-Output Multiplier Model (I/O Model)96 was used to quantify the expected economic impacts arising from lower energy bills for CCA customers.
• Local Investment in EE/RE Resources – The CCA program’s increased level of renewable generation would increase demand. This demand for local renewable resources would lead to an increase in the manufacturing and installation of local DG and employment in the related manufacturing and construction sectors. NREL’s Jobs and Economic Development Impact (JEDI) model97 was used to quantify the economic impacts of such investment.
INCREASED DISPOSABLE INCOME
The potential economic benefits from lower energy bills was evaluated using IMPLAN’s I/O Model.
IMPLAN is an industry-standard economic modeling software quantifying relationships (dependence)
between industries in an economy. I/O models are based on the implicit assumption that each basic
sector has a multiplier, or ripple effect, on the wider economy because each sector purchases goods and
services to support that sector. I/O modeling estimates the inter-industry transactions and uses those
transactions to estimate the economic impacts of any change to the economy.
IMPLAN’s I/O model calculates four categories of impacts: employment, labor income, value added, and
output. Employment is the number of jobs gained or lost. Labor income is the increase in salaries and
wages for current and newly gained or lost employees. Value added, similar to Gross Domestic Product,
is the payment to labor and capital used in production of a particular industry. Total output is the total
value of the revenues, sales or value of output.
I/O models are made up of matrices of multipliers between each industry present in an economy. Each
column shows how an industry is dependent on other industries for both its inputs to production and
96 IMPLAN Group LLC’s Input-Output (I/O) model is the industry standard quantitative economic methodology for calculating
interdependencies between industries in local and regional economies. 97 The Jobs and Economic Development Impact (JEDI) models are industry standard modeling tools that estimate the economic
impacts of constructing and operating power generation and biofuel plants at the local and state levels. JEDI analyzes biofuels,
coal, concentrating solar power, geothermal, marine and hydrokinetic power, natural gas, and photovoltaic power plants.
“Assessment of the Value, Impact, and Validity of the Jobs and Economic Development Impacts (JEDI) Suite of Models,”
http://www.nrel.gov/docs/fy13osti/56390.pdf.

BENEFITS
July 2017 82 | P a g e
outputs. The tables of multipliers can be used to estimate the effects in changes in spending for various
industries, household consumption, or labor income. Both positive and negative impacts can be
measured. I/O modeling produces results in the following categories:
• Direct Effects – Increased purchases of inputs used to produce final goods and services purchased by residents. Direct effects are the input values in an I/O model, or first-round effects.
• Indirect Effects – Value of inputs used by firms affected by direct effects (inputs). Economic activity that supports direct effects.
• Induced Effects – Results of Direct and Indirect effects (calculated using multipliers). Represents economic activity from household spending.
• Total Effects – Sum of Direct, Indirect, and Induced effects.
• Total Output – Value of all goods and services produced by industries.
• Value Added – Total Output less value of inputs, or the Net Benefit/Impact to an economy.
• Employment – Number of additional/reduced full time employment resulting from direct effects.
Table 28 shows the effect that $59.2 million in rate savings will have on the San Diego County regional economy. This rate savings represents the average annual minimum bill savings achievable by the CCA program once fully operational under the Base Case Scenario in year 2026. In total, approximately 544.7 jobs are expected to be created. Regional labor income impact of over $18.9 million, a total value added impact of approximately $30.8 million, and an output impact over $48.8 million, are also projected.
Table 28: Projected Rate Savings Effects on Local Economy (2026 $)
Impact Type Jobs
(Full Time Equivalents)
Labor Income Total Value
Addedi Outputii
Direct Effect 435.2 $12,838,821 $20,069,498 $31,116,656
Indirect Effect 42.8 $2,687,672 $4,633,454 $7,772,725
Induced Effect 66.6 $3,379,934 $6,047,777 $9,932,081
Total Effect 544.7 $18,906,427 $30,750,730 $48,821,462
i In the context of IMPLAN Group LLC’s Input-Output Multiplier Model, value added is very similar to gross domestic product and includes four components: wages, business income, other income, and indirect business taxes. Value added, therefore, accounts for the value of work, land, and capital but excludes the costs of generating the additional value.
ii Output is an approximate measure of the money that the estimated rate decrease introduces to the local economy through spending on local goods, services, and wages. Output equals the sum of the value of intermediate goods and services, wages, business income, other income, and indirect business taxes.
Source: National Renewable Energy Laboratory Jobs and Economic Development Impact Model; IMPLAN Group LLC Multipliers; EnerNex; and Willdan, 2017.
These utility savings assume that households will spend some share of the increased disposable income on more local retail goods and services. This increased spending on goods and services will then lead to
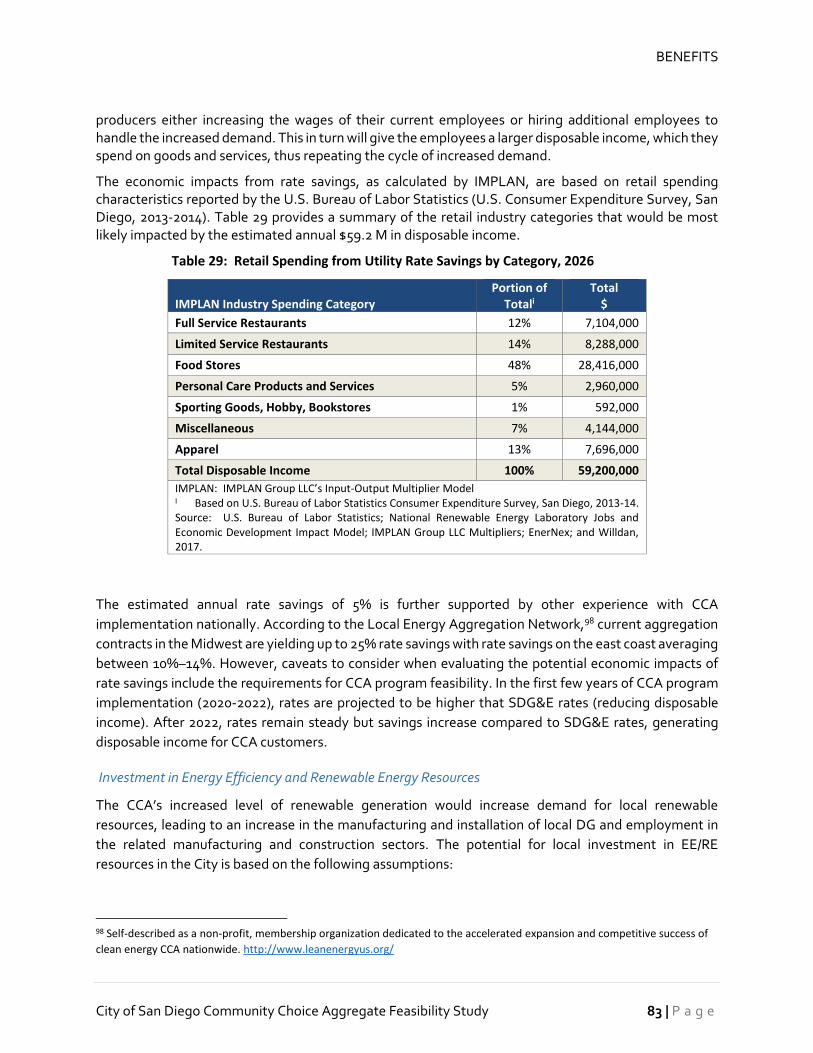
BENEFITS
City of San Diego Community Choice Aggregate Feasibility Study 83 | P a g e
producers either increasing the wages of their current employees or hiring additional employees to handle the increased demand. This in turn will give the employees a larger disposable income, which they spend on goods and services, thus repeating the cycle of increased demand.
The economic impacts from rate savings, as calculated by IMPLAN, are based on retail spending characteristics reported by the U.S. Bureau of Labor Statistics (U.S. Consumer Expenditure Survey, San Diego, 2013-2014). Table 29 provides a summary of the retail industry categories that would be most likely impacted by the estimated annual $59.2 M in disposable income.
Table 29: Retail Spending from Utility Rate Savings by Category, 2026
IMPLAN Industry Spending Category Portion of
Totali
Total $
Full Service Restaurants 12% 7,104,000
Limited Service Restaurants 14% 8,288,000
Food Stores 48% 28,416,000
Personal Care Products and Services 5% 2,960,000
Sporting Goods, Hobby, Bookstores 1% 592,000
Miscellaneous 7% 4,144,000
Apparel 13% 7,696,000
Total Disposable Income 100% 59,200,000
IMPLAN: IMPLAN Group LLC’s Input-Output Multiplier Model I Based on U.S. Bureau of Labor Statistics Consumer Expenditure Survey, San Diego, 2013-14. Source: U.S. Bureau of Labor Statistics; National Renewable Energy Laboratory Jobs and Economic Development Impact Model; IMPLAN Group LLC Multipliers; EnerNex; and Willdan, 2017.
The estimated annual rate savings of 5% is further supported by other experience with CCA
implementation nationally. According to the Local Energy Aggregation Network,98 current aggregation
contracts in the Midwest are yielding up to 25% rate savings with rate savings on the east coast averaging
between 10%–14%. However, caveats to consider when evaluating the potential economic impacts of
rate savings include the requirements for CCA program feasibility. In the first few years of CCA program
implementation (2020-2022), rates are projected to be higher that SDG&E rates (reducing disposable
income). After 2022, rates remain steady but savings increase compared to SDG&E rates, generating
disposable income for CCA customers.
Investment in Energy Efficiency and Renewable Energy Resources
The CCA’s increased level of renewable generation would increase demand for local renewable
resources, leading to an increase in the manufacturing and installation of local DG and employment in
the related manufacturing and construction sectors. The potential for local investment in EE/RE
resources in the City is based on the following assumptions:
98 Self-described as a non-profit, membership organization dedicated to the accelerated expansion and competitive success of
clean energy CCA nationwide. http://www.leanenergyus.org/
BENEFITS
July 2017 84 | P a g e
• The City is land-constrained both in terms of capacity and due to high land values. A 10-MW solar
project is estimated to require between sixty to seventy acres of horizontal space (ground level
or rooftop). A 10 MW PV project is used herein for illustrative purposes to analyze economic
impact. This project is not analyzed as part of the pro forma modeling.
• Given siting and other requirements, a utility-scale solar opportunity does not appear to be
feasible within the City.
• Base Case Scenario pro forma results are based on 98% of CCA customers receiving power with
50% RPC and the remaining 2% receiving 100% RPC from 2020 through 2035. SDG&E’s power
portfolio is assumed to have 42.8% RPC in 2020 increasing to 50% by 2030 and remaining at this
level through 2035.99
• San Diego’s offshore and onshore site conditions are not supportive of Wind Farm development
(weather patterns, topography, etc.).
• The City is first in the nation for solar installations and the City’s cleantech industry is focused on
solar as a primary target for EE/RE resources development.100.
• Comparatively, the cost of geothermal operations is prohibitively expensive and has therefore
been excluded from consideration.
Based on these considerations, CCA implementation was assumed to result in installation of ten
crystalline silicon, fixed mount solar systems with nameplate capacities of 1 MW each for a total capacity
of 10 MW. Wind and other renewable generation were excluded from consideration, resulting in a
conservative assessment of the potential for local renewables. Table 30 below summarizes the model
inputs used for this analysis.
Table 30: Local Investment in Local Energy Efficiency and Renewable Energy Resources
JEDI Model Inputs Change in Local Economic
Activity
Investment of surplus funds to develop local energy efficiency and renewable energy resources
Ten 1 MW Solar Projects
Solar Project Construction Costs $15.65 Million
Solar Project Annual Operating Costs $1.84 Million
JEDI: National Renewable Energy Laboratory’s Jobs and Economic Development Impact Model Source: National Renewable Energy Laboratory Jobs and Economic Development Impact Model; IMPLAN Group LLC Multipliers; EnerNex; and Willdan, 2017
The JEDI model classifies results in three categories:
• On-site labor and professional services results: dollars spent on labor from companies engaged
in development and on-site construction and operation of power generation and transmission.
99 Refer to Table 27 on page 79. 100 http://www.environmentcalifornia.org/news/cae/san-diego-earns-1-ranking-nationwide-installed-solar-power

BENEFITS
City of San Diego Community Choice Aggregate Feasibility Study 85 | P a g e
These results include labor only—no materials. Companies or businesses that fall into this
category of results include project developers, environmental and permitting consultants, road
builders, concrete-pouring companies, construction companies, tower erection crews, crane
operators, and operations and maintenance (O&M) personnel.101
• Local revenues and supply chain results: the increase in demand for goods and services in
supporting industries from direct on-site project spending. Businesses and companies included
in this category include construction material and component suppliers, analysts and attorneys
who assess project feasibility and negotiate contract agreements, banks financing the projects,
all equipment manufacturers, and manufacturers of replacement and repair parts.
• Induced results: reinvestment and spending of earnings by direct and indirect beneficiaries.
Induced results are often associated with increased business at local restaurants, hotels, and
retail establishments, but also include child care providers and any other entity affected by
increased economic activity and spending occurring at the first two categories.
JEDI model results are displayed in two different time periods: construction and operations.
Construction-period results are inherently short term. Construction jobs are defined as FTEs, or 2,080
hour-units of labor (one construction period job equates to one full-time job for one year or forty hours
times fifty-two weeks). Although the JEDI models are based on IMPLAN methodology, which does not
explicitly distinguish full- and part-time jobs, JEDI results are converted to FTEs using supplementary
conversion data provided by IMPLAN.
A part-time or temporary job may be considered one job by other models, but would constitute only a
fraction of one job according to the JEDI models. For example, if an engineer worked only three months
on a solar PV project (assuming no overtime), that would be considered one-quarter of one job by the
JEDI model. Equipment manufacturing jobs, such as tower manufacturing, are included in construction-
period jobs, as new construction drives equipment manufacturing. Operations-period results are long
term, for the life of the project, and are reported as annual FTE jobs and annual economic activity, which
continue to occur throughout the operating life of the facility.
JEDI results are not intended to be a precise forecast; they are an estimate of potential activity resulting
from a specific set of projects and scenarios. In addition, JEDI results presuppose that projects are
financially viable and can be justified independent of their economic development value. Table 31 shows
101 Most other input-output models (such as IMPLAN) and methodologies calculate the first category of economic activity as
"direct impacts" and the second category as "indirect" impacts. Direct impacts refer to changes in jobs, economic activity and
earnings associated with the on-site or immediate impacts created by the investment, and would include the equipment
installed onsite, the concrete used onsite, etc. Indirect impacts refer to economic impacts associated with linked sectors in the
economy that are upstream of the direct impacts, such as suppliers of hardware used to make the equipment installed onsite or
the concrete used onsite. However, the economic impacts of the physical items used onsite, normally included in direct
impacts, typically occur at some geographic distance from the project itself. Because of JEDI's focus on the local impacts of a
project, only the labor associated with the on-site location is counted in the first category. All equipment and supply chain
effects are included in the second category. Typically, the sum of the direct plus indirect impacts from other input-output
models can be reasonably compared to the sum of on-site plus supply chain impacts as calculated by JEDI models. Induced
impacts in JEDI are calculated similarly to induced impacts in other input-output models.

BENEFITS
July 2017 86 | P a g e
the construction and ongoing effects of building ten 1 MW solar power systems. Roughly 24.2 jobs would
be created during construction and installation. Of this total, about 8.8 jobs would be directly involved in
construction and installation while roughly 15.5 jobs would be indirectly involved with the building of the
project. Module and supply chain activity would be expected to generate 22.0 jobs.

BENEFITS
City of San Diego Community Choice Aggregate Feasibility Study 87 | P a g e
Table 31: Economic Impacts of Investment of Surplus Funds
Resource Development Year 2022
During Construction and Installation Period Annual
Jobs
Annual Earningsi
($000)
Annual Outputi ($000)
Project Development and Onsite Labor Impacts
Construction and Installation Labor 8.8 $683.4 Not
applicable
Construction and Installation Related Services 15.5 $911.5 Not
applicable
Subtotal 24.2 $1,594.8 $2,108.5
Module and Supply Chain Impacts
Manufacturing 0.0 $0.0 $0.0
Trade (Wholesale and Retail) 2.5 $163.0 $460.1
Finance, Insurance and Real Estate 0.0 $0.0 $0.0
Professional Services 2.3 $134.9 $355.1
Other Services 5.4 $599.5 $1,434.9
Other Sectors 11.8 $442.2 $861.0
Subtotal 22.0 $1,339.5 $3,111.1
Induced Impacts 12.2 $616.1 $1,788.0
Total Impacts 58.4 $3,550.5 $7,007.6
During Operating Years Annual
Jobs
Annual Earnings i
($000)
Annual Output i ($000)
Onsite Labor Impacts
PV Project Labor Only 0.5 $2,286.1 $2,286.1
Local Revenue and Supply Chain Impacts 5.0 $290.6 $849.0
Induced Impacts 5.4 $271.1 $786.8
Total Impacts 10.8 $2,847.7 $3,921.8
i Earnings and Output values are thousands of dollars in year 2015 dollars. Construction and operating period jobs are full-time equivalents for one year (2,080 hours). Economic impacts "during operating years" represent impacts that occur from system/plant operations/expenditures. Totals may not add up due to independent rounding.
Source: National Renewable Energy Laboratory Jobs and Economic Development Impact Model; IMPLAN Group LLC Multipliers; EnerNex; and Willdan, 2017
BENEFITS
July 2017 88 | P a g e
Induced impacts of the construction and installation would create approximately 12.2 jobs. These
induced effects may include anything from increased employment in restaurants, retail, education, and
others. Overall, the building of this solar project would be projected to generate a total of 58.4 one-time
jobs, $3.6 M in earnings and $7.0 M in output in the local economy during construction. During operating
years, this activity would be expected to create approximately 10.8 annual FTE jobs, $2.9 M in annual
labor income and $3.9 M in annual output.
SECONDARY ECONOMIC IMPACTS
According to the International Economic Development Council,102 utility-related business incentives are
considered one of the primary tools in any business attraction and retention program. SDG&E offers a
wide range of rebates to businesses across different sectors, including EE Business Rebates.103 One
benefit of a CCA program is that it does not need CPUC approval to offer such incentives. While these
rebates would still be available to SDG&E customers, the CCA program could offer similar rebate
programs better targeted to the business sectors of interest in the service area.
This Study also explores six program categories that the CCA program could develop to support
customers, stimulate its economy, and encourage investment in renewable energy. These energy- or
GHG-related programs include Net Energy Metering, feed-in tariffs, electric vehicle and charging station
programs, low income programs, local generation resource development, and general energy- or GHG-
related economic development programs. These initiatives are discussed in the segment titled “Other
Program Opportunities” later in this section of the report.
THIRD TIER IMPACTS
A third type of socioeconomic benefit expected to result from implementation of the CCA program is
environmental and health impacts largely related to air quality or improved human health due to the CCA
program utilizing mainly renewable energy sources. This resource strategy has the potential to
significantly reduce GHG emissions over time compared with SDG&E’s current resource mix and to reach
the lower level of GHG emissions more rapidly. While the change in GHG emissions is not modeled
directly in economic development models used in this Study, the benefits to quality of life factors are
considered highly valuable from an economic development perspective.
CAVEATS TO ECONOMIC IMPACT RESULTS
Economic development results cited here are subject to the following four major caveats. First, all macro-
economic I/O models are based on key assumptions and include corresponding built-in uncertainties. The
resulting forecasts provide “order-of-magnitude” impacts rather than precise estimates of future
benefits.
102 The International Economic Development Council is a non-profit, non-partisan membership organization serving economic
developers. http://www.iedconline.org/index.php 103 http://www.sdge.com/rebates-finder/business
BENEFITS
City of San Diego Community Choice Aggregate Feasibility Study 89 | P a g e
Second, the CCA program economic impact model analyzed the regional economy (defined as within the
City jurisdictional boundaries). IMPLAN models are generally structured to analyze larger geographic
areas (county-level or larger regional economies). Attempting to apply these models to a smaller area,
greatly increases uncertainty due to the impact of “spillover” into adjacent areas (i.e., workers on City
projects living and spending money outside of the City). Actual economic impacts are anticipated to be
greater outside of City boundaries based on the geographic location of employment activity, materials
purchases and other retail spending patterns.
Third, the JEDI model estimates the direct, indirect and induced effects associated with new power
projects, but does not take into consideration any negative “ripple” effect associated with higher rates
necessary to pay for these projects over time. In other words, higher rates could reduce disposable
income, resulting in less money injected into the local economy, and diminishing economic impacts. Such
negative indirect and induced effects are not expected to exceed the benefits of the construction and
operations of the hypothetical proposed local renewable energy resource projects.
Finally, launching the CCA program could result in a reduction in workforce at SDG&E, as fewer resources
might be required to perform the functions that the CCA program is providing. SDG&E’s customer service
function generally address issues unrelated to power procurement, such as new accounts, address
changes and outages; SDG&E would not be expected to reduce customer service staffing positions due
to CCA program formation. Outsourcing customer service and power procurement functions to an ESP
could have a net negative impact on employment in the City.
STRATEGIC ECONOMIC DEVELOPMENT SUMMARY
Based on projected Base Case Scenario results, the CCA program could potentially support a wide range
of job creation, business investment and RE/EE resource development goals targeted by the City’s
Economic Development Strategy104 and CAP.
The City could achieve economic synergies through scaling the CCA program through existing local
businesses and materials suppliers. Per the CAP, the City had almost 340,000 green jobs as of 2011. These
numbers are consistent with the City’s transformation into a hub of green technology innovation, and
the location of approximately 840 cluster companies in 2013.105 Over 20% of these companies are solar
power focused. These firms offer a variety of job opportunities ranging from installation and project
management, to finance and research. Climate action planning and implementation have created, and
will continue to create “green jobs.”
In sum, under Base Case Scenario assumptions, implementation of the CCA program could generate job
creation and local investment benefits while also achieving targeted sustainability goals. The economic
impact analysis illustrates the potential for the CCA to leverage the economic development impact of
related EE and renewable energy activities at the local level. Based on this evaluation, as summarized in
Table 32, a total of 544.7 jobs, $18.9 M in labor income and $48.8 M in annual ongoing economic output
104 City of San Diego Economic Development Strategy (2014-2016), 2.3 Manufacturing & Innovation, Action 7, page 10. 105 Cleantech San Diego 2014 Annual Report: Year in Review; Regional Rankings, page 1.
http://cleantechsandiego.org/annual_report/2014/index.htm

BENEFITS
July 2017 90 | P a g e
from utility savings were identified. One-time construction from EE and renewable energy resources
could generate approximately 58.4 jobs, $3.6 M in labor income and $7.0 M in regional output, followed
by 10.8 jobs, $2.9 M in labor income and $3.9 M in annual economic output from operating expenditures.
These initiatives are expected to generate job creation and local investment benefits while also achieving
targeted sustainability goals.
Table 32: Summary of Projected CCA Program Economic Impacts
Impact Typei Jobs Labor Income
($)
Total Output
($)
Increased Disposable Income - Ongoing Operations
Direct Effect 435.2 $12,838,821 $31,116,656
Indirect Effect 42.8 $2,687,672 $7,772,725
Induced Effect 66.6 $3,379,934 $9,932,081
Total Effect 544.7 $18,906,427 $48,821,462
Local Investment - During Construction and Installation Period
Project Development and Onsite Labor Impacts 24.2 $1,594,800 $2,108,500
Module and Supply Chain Impacts 22.0 $1,339,000 $3,111,100
Induced Impacts 12.2 $616,100 $1,788,000
Total Impacts 58.4 $3,549,500 $7,007,600
Local Investment - Ongoing Operations
Onsite Labor Impacts 0.5 $2,286,100 $2,286,100
Local Revenue and Supply Chain Impacts 5.0 $290,600 $849,000
Induced Impacts 5.4 $271,100 $786,800
Total Impacts 10.8 $2,847,800 $3,921,900
i Earnings and Output values are in year 2015 dollars. Construction and operating period jobs are full-time equivalent for one year (2,080 hours). Economic impacts "During operating years" represent impacts that occur from system/plant operations/expenditures.
Source: National Renewable Energy Laboratory Jobs and Economic Development Impact Model; IMPLAN Group LLC Multipliers; EnerNex; and Willdan, 2017.
OTHER PROGRAM OPPORTUNITIES
As part of the City’s overall plan to achieve CAP goals, in addition to procuring renewable energy, a CCA
could encourage other DSM activities through programs and rebates. Figure 46 depicts the hierarchy of
DSM programs by level of formality or structure. The hierarchy ranges from voluntary conservation
activities, such as turning off lights when leaving a room, to the apex of highly structured Demand

BENEFITS
City of San Diego Community Choice Aggregate Feasibility Study 91 | P a g e
Response (DR) activities that include payments for interactive participation. This section describes
potential benefits associated with other program opportunities for the CCA program and includes the
three non-conservation levels of the hierarchy and potential incentive programs.
Figure 46: Demand Side Management Hierarchy Based on Program Formality
ENERGY EFFICIENCY
CCA customers will continue to be eligible for SDG&E’s EE programs after CCA enrollment. Additionally,
CCA programs can use other funding sources from agencies such as the CEC as well as funds collected
through the Public Purpose Program surcharge on electricity bills. To access Public Purpose Program
funds, the CCA program must apply to and meet CPUC requirements that EE programs be cost effective
and lead to direct energy savings. The CPUC provides funding only for unique CCA programs; therefore,
the CCA program must not duplicate programs currently offered by SDG&E.
Use of EE funds is authorized under Public Utilities Code Section 381.1(a)–(d).106 The only distinction for
CCAs, as opposed to other entities, is in Section 381.1(d), which states:
“The commission shall establish an impartial process for making the determination of
whether a third party, including a community choice aggregator, may become
administrators for cost-effective EE and conservation programs pursuant to subdivision
(a), and shall not delegate or otherwise transfer the commission's authority to make this
determination for a community choice aggregator to an electrical corporation.”
106 California Public Utilities Code - Section 381.1 : http://codes.lp.findlaw.com/cacode/PUC/1/d1/1/2.3/7/s381.1
•Interactive load (kW) adjustment triggered by price or event triggers
•Compensation for participation or performance
Demand Response
•Customer awareness and administration of electricity demand (kW)
Demand Management
•Permanent energy reductions often associated with equipment replacement
•Getting the most utilization for every kWh consumed
Energy Efficiency
•Voluntarily discretionary energy reductionConservation

BENEFITS
July 2017 92 | P a g e
The Commission concluded that
“Thus it appears the Commission itself must handle the selection of the CCA programs.
In this way, the administrative structure for CCA programs is exactly the same as for the
RENs [Regional Energy Networks] described above. Therefore, even though MEA’s
proposal for 2013-2014 is not defined as a REN, we treat it, for administrative purposes
for this portfolio period, as if it were a REN. If MEA had elected to administer funds only
from its own customers under Section 381.1(e) and (f), our conclusion would likely have
mirrored our resolution on MEA’s 2012 energy efficiency plan.”107
Additionally, EE programs that are not dependent upon CPUC funding could utilize money collected from
CCA customers. For example, MEA’s energy savings programs have evolved over time.108 In 2012 MEA
elected to access only the EE funds collected from its own customers. For 2013 and 2014, MEA requested
authority to administer not only EE funds collected from MCE’s customers, but also EE funds collected
by Pacific Gas & Electric (PG&E). CPUC Decision 12-11-015,109 dated November 8, 2012, authorized MEA
to spend over $4 million dollars on four EE programs:
• The Multifamily Energy Efficiency Program provides incentives for multifamily residential
buildings with incentives of up to $50 per unit, with a goal of a 15% total energy savings goal.
The program also proposes to provide financing for the remainder of costs via an on-bill
repayment mechanism. Approved Budget: $861,781.
• The Single-Family Utility Demand Reduction Program targets high-energy-consuming
single-family homes within its service area. The program offers targeted marketing and on-
line software to present options for high-energy-consuming users for both EE and renewable
energy projects. The program does not propose to offer incentives, but rather is aimed at
awareness and information which would lead to behavior and retrofit enhancements.
Approved Budget: $851,400.
• The Small Commercial Program offers incentives for multi-measure retrofits, initiated
through targeted outreach. It provides technical support to small commercial property
owners in high energy use segments which include, but are not limited to, restaurants, retail,
and professional services. The program proposes three main sub-programs: convenience
store and small grocer EE development; restaurant EE project; and professional services EE
project. Approved Budget: $1,380,024.
• The Financing Pilot Programs proposes both an On-Bill Repayment program and a Standard
Offer program to enable financing for underserved markets. MEA states that the On-Bill
Repayment program will 1) streamline the loan application and enrollment processes; 2) offer
customers and contractors support for wider and deeper retrofits; and 3) will leverage other
MEA programs and services. The On-Bill Repayment program plans to partner with private
107 MEA refers to Marin Energy Authority, formed through a Joint Powers Agreement among municipalities which later
established MCE Clean Energy. 108 https://www.mcecleanenergy.org/energy-savings/ 109 California Public Utilities Commission Decision 12-11-015 Approving 2013-2014 Energy Efficiency Programs and Budgets,
November 15, 2012: http://docs.cpuc.ca.gov/PublishedDocs/Published/G000/M034/K299/34299795.PDF
BENEFITS
City of San Diego Community Choice Aggregate Feasibility Study 93 | P a g e
banks or financing entities to provide financing to building owners, with the repayment
charge placed as a line item on the bill. MEA is somewhat unique in that it relies on PG&E for
its billing, but controls certain line items related to its services. Approved Budget: $1,192,000.
The 2017 SDG&E program currently includes:
• An Energy Efficiency Business Rebates Product Catalog110
• A marketplace for residential customers to shop and save with energy efficient products111
Possible programs for the CCA program to consider include:
• Small commercial program targeting specific segments underserved by SDG&E. To
determine segments further analysis will need to be completed. Existing resources in the
City’s Environmental Services Department could be used to market to these customers and
drive implementation of projects.
• Financing for smaller commercial customers that do not meet the minimum loan
requirements of SDG&E’s On Bill Financing program.
• Financing for targeted technologies that exceed the payback criteria, which may vary
depending on the details of SDG&E’s comparable program.
Coordinating CCA program EE outreach material with any existing energy programs such as Smart City112
and PEV Charging113 would ensure that City residents and businesses understand the complete range of
available programs. Additionally, coordination of CCA projects with existing City incentive programs
would leverage other funding mechanisms and increase the total benefits for CCA customers. CCA
marketing materials can and should list all programs available to City CCA program customers. Current
San Diego incentive programs114 include:
• Sustainable Buildings;115
• Residential Solar PV Systems;116 and
• Residential rebates for specified appliances.117
While the CCA program opt-out materials provided to customers prior to CCA enrollment should not be
used as marketing for EE programs, such materials should ensure that potential CCA customers
110 Energy Efficiency Business Rebates Product Catalog:
https://www.sdge.com/sites/default/files/documents/1919956662/Energy%20Efficiency%20Business%20Rebates%20Product
%20Catalog_3_6_%20FINAL%203.6.17.pdf?nid=18776 111 SDG&E Marketplace:
https://marketplace.sdge.com/?utm_source=sdge&utm_medium=banner&utm_campaign=rebate_web_promo_homepage 112 San Diego Smart City Program: https://www.sandiego.gov/sustainability/smart-city 113 San Diego Electric Vehicle Charging Program: https://www.sandiego.gov/sustainability/clean-and-renewable-
energy/evcharging 114 City of San Diego Incentive Programs: https://www.sandiego.gov/development-services/industry/incentive 115 City of San Diego Sustainable Building Expedite Program: https://www.sandiego.gov/development-
services/industry/incentive/sustainable 116 City of San Diego Residential Solar Photovoltaic Systems: https://www.sandiego.gov/development-
services/homeownr/residentialsolar 117 SDG&E Rebates Guide: http://www.sdge.com/buyers-guide/399

BENEFITS
July 2017 94 | P a g e
understand that by choosing the CCA program, they would not be foregoing EE, solar, or other programs
sponsored by SDG&E. CCA opt-out notifications must include the terms and conditions of the services
offered, and should indicate the nature of future EE programs.
DEMAND-SIDE MANAGEMENT
DSM is the modification of load to assist the system, for example by turning off appliances during peak
load periods. Such activities can assist a CCA mitigate cost exposure during times of high energy prices
and create usage for energy during slack demand periods when the CCA program may be in an over-
supply situation. As described in the load forecasting section as well as the risk analysis section, an
emerging challenge for LSEs is to manage the variance in customer demand due to the variable output
of customer-owned DG. A DSM program could result in customers proactively managing coincident load,
smoothing their load profile, and potentially saving money.
A recent pilot program called On Demand Savings118 in Wisconsin, under the statewide Focus on Energy
program, enrolled commercial customers with building automation and control systems. The system was
utilized to co-optimize both energy and demand. Modern building automation and control systems are
capable of this co-optimization, but typical system programming focuses solely on minimizing energy
consumption. By co-optimizing both, customers reduced peak demand by 10% and not only benefited
from the program incentives but also saved money by reducing utility demand charges.
DEMAND RESPONSE
DR is the modification of energy consumption by customers after receiving either a price signal or a
dispatch instruction. The CCA could use rate signals like TOU and Critical Peak Pricing to shift customer
load away from periods of high prices. TOU and Critical Peak Pricing rate mechanisms have time varying
structures intended to incentivize customers to use less electricity during the more expensive times and
to use energy when it is least expensive. Additionally, customers can participate in DR programs designed
to treat electricity like a commodity: when prices are high, demand decreases; and when prices are low,
demand increases. These programs often look at CAISO prices or other load forecast data to trigger
Critical Peak Pricing days or DR program events. DR programs can also be utilized as a contingency
resource for reliability when a generation resource, or the transmission or distribution infrastructure has
a problem and cannot perform as expected.
For example, Figure 47 illustrates the impact of solar PV penetration on the daily load curve, known as
the “duck curve” because of its shape. The “belly of the duck” results from solar generation while the
“neck” is caused as the sun sets and other generating resources must make up the difference in a short
amount of time. The CCA will be operating under this potential situation. DR could be an effective tool
to optimize CCA resources.
118 Wisconsin Focus on Energy – On Demand Savings: https://focusonenergy.com/business/on-demand-savings
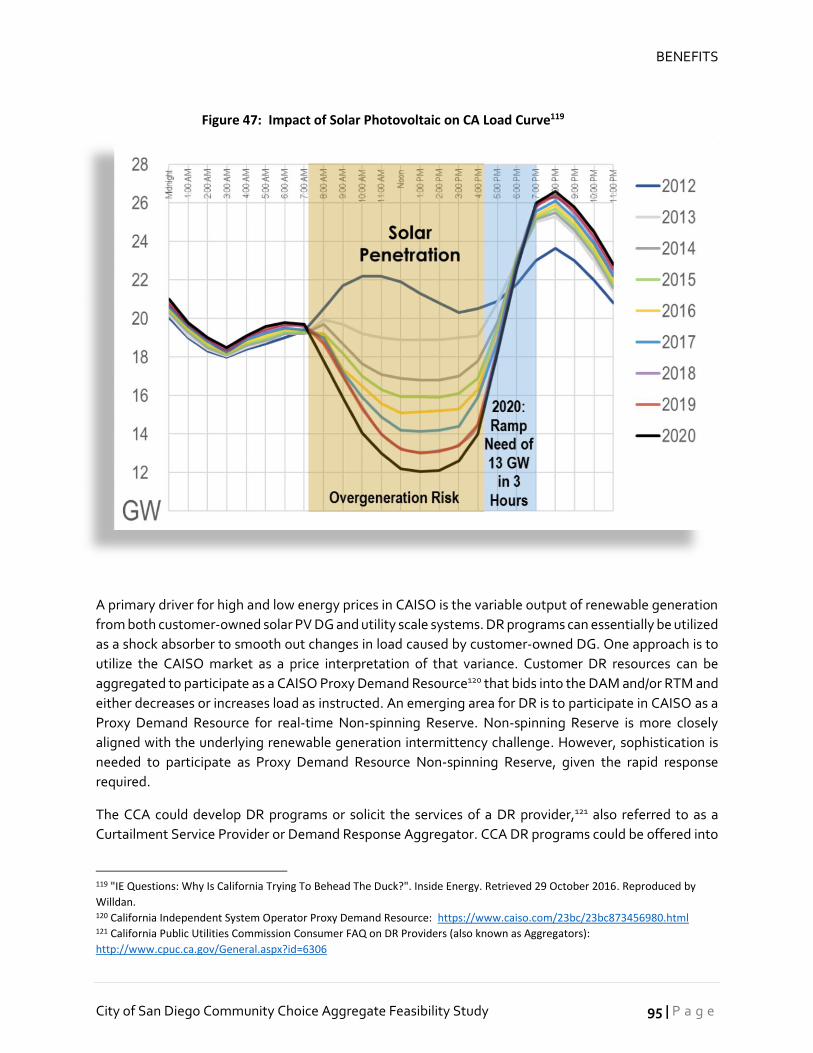
BENEFITS
City of San Diego Community Choice Aggregate Feasibility Study 95 | P a g e
Figure 47: Impact of Solar Photovoltaic on CA Load Curve119
A primary driver for high and low energy prices in CAISO is the variable output of renewable generation
from both customer-owned solar PV DG and utility scale systems. DR programs can essentially be utilized
as a shock absorber to smooth out changes in load caused by customer-owned DG. One approach is to
utilize the CAISO market as a price interpretation of that variance. Customer DR resources can be
aggregated to participate as a CAISO Proxy Demand Resource120 that bids into the DAM and/or RTM and
either decreases or increases load as instructed. An emerging area for DR is to participate in CAISO as a
Proxy Demand Resource for real-time Non-spinning Reserve. Non-spinning Reserve is more closely
aligned with the underlying renewable generation intermittency challenge. However, sophistication is
needed to participate as Proxy Demand Resource Non-spinning Reserve, given the rapid response
required.
The CCA could develop DR programs or solicit the services of a DR provider,121 also referred to as a
Curtailment Service Provider or Demand Response Aggregator. CCA DR programs could be offered into
119 "IE Questions: Why Is California Trying To Behead The Duck?". Inside Energy. Retrieved 29 October 2016. Reproduced by
Willdan. 120 California Independent System Operator Proxy Demand Resource: https://www.caiso.com/23bc/23bc873456980.html 121 California Public Utilities Commission Consumer FAQ on DR Providers (also known as Aggregators):
http://www.cpuc.ca.gov/General.aspx?id=6306

BENEFITS
July 2017 96 | P a g e
CAISO markets as a Proxy Demand Resource and/or conducted outside of the CAISO market. However,
should the CCA DR program function outside of the CAISO market, the associated capacity would not be
eligible for credit towards the RA requirement.
Additionally, under current rules, a CCA could use a portion of the SDG&E DR programs paid for by
SDG&E ratepayers to meet CCA RA requirements. For example, MEA receives DR capacity credits that
are allocated by the CPUC, and which reduce MEA’s need to procure RA capacity. Currently, DR programs
provide 2% of MEA’s RA requirements.122
Approximate DR program startup costs can be estimated at $200/kW of DR capacity and ongoing
operational cost of approximately $20/kW of DR capacity.
INCENTIVES
The CCA has the ability to offer incentives to encourage behaviors that assist the City in attaining its CAP
goals. Such incentives could be used to expand PEVs, deployment of solar DG, and assist low income
customers or attract businesses as discussed below.
Plug-in Electric Vehicles
The electrification of vehicles represents a significant variable for the electric utility industry. Projections
for PEV as illustrated in Figure 48. Figure 48 displays significant growth over the next few years. This
significant growth could assist in replacing the load displaced by solar DG. The City’s CAP includes a goal
of transitioning all municipal fleet vehicles to electric by 2035. This initiative in combination with the
State’s aggressive CO2 emission reduction requirements, may result in even more drastic growth in PEVs
than illustrated in Figure 48.
122 MCE comments to the California Energy Commission Lead Commissioner Workshop on Evaluation of Electricity System
Needs in 2030, held as part of the 2013 Integrated Energy Policy Report (“IEPR”) Proceeding. Page 9,
http://www.energy.ca.gov/2013_energypolicy/documents/2013-08-
19_workshop/comments/Marin_Energy_Authority_Comments_2013-09-04_TN-71951.pdf

BENEFITS
City of San Diego Community Choice Aggregate Feasibility Study 97 | P a g e
Figure 48: Light Duty Vehicle Sales: Alternative-Fuel Cars
PEVs represent a potential significant new load for the CCA program. However, charging times must be
managed to avoid negative impacts such as exacerbating load during peak pricing periods. A typical PEV
has a peak demand roughly equivalent to a single family residential home.123 Special rate designs can
strategically incentivize charging behavior, turning this potentially troublesome new load into an asset
to assist in solving the problems created by intermittent renewable energy generation.
The concept of Vehicle to Grid has been discussed for many years. The Vehicle-to-Grid vision is that
vehicle charging will become interactive with the electric grid needs in a similar way that DR works.
Emerging smart inverters for battery energy storage124 accommodate either providing energy to or
drawing charging energy from the grid. Despite significant work, Vehicle-to-Grid125 programs have not
caught on. Reasons include potentially voiding the battery warranty and reducing the overall battery life
due to additional charging and discharging cycles. Therefore, current PEV programs have focused on rate
structures to encourage vehicle charging during non-peak usage periods.
Net Energy Metering
Net Energy Metering programs allow DG resources to feed excess production into the grid in return for
an on-bill credit or offset. Such programs have been extremely successful in encouraging adoption of DG,
123 Plug In America - Understanding Electric Vehicle Charging: https://pluginamerica.org/understanding-electric-vehicle-
charging/ 124 California Energy Commission Rule 21 Smart Inverter Working Group Technical Reference Materials:
http://www.energy.ca.gov/electricity_analysis/rule21/
California Public Utilities Commission Smart Inverter Working Group: http://www.cpuc.ca.gov/General.aspx?id=4154 125 Reference Smart Grid Interoperability Panel Catalog of Standards listing for SAE J1772-2010, SAE J2836 Use Cases (1-3), and
SAE J2847-1: http://www.gridstandardsmap.com/

BENEFITS
July 2017 98 | P a g e
in particular solar PV, throughout the country. Based on the terms of the Net Energy Metering program,
the CCA program could encourage deployment of DG in furtherance of CAP goals.
Every operating CCA in the State offers Net Energy Metering options. For example:
• CleanPower SF compensates DG energy at $0.0693/kWh and $0.0893/kWh with and without
RECS, respectively;
• LCE’s Personal Choice Energy Rate is a flat $0.06/kWh; and
• Sonoma Clean Power and PCE offer NetGreen Net Energy Metering at $0.01/kWh.
CCAs have the power to set their own rates, including those for net energy metering customers. MCE has
the most advanced net energy metering rate structures that include both seasonal and TOU
mechanisms. As can be seen by comparing the pricing spread between on and off peak summer charges
and credits in Table 33, credits offer the largest compensation to DG owners on-peak in summer.
However, power charges during those periods are high, sending signals intended to reduce demand.
Table 33: MCE Clean Energy Net Energy Metering Rate Summary
MCE Clean Energy Net Energy Metering Tariff
Summer Winter
Peak Part Peak
Off Peak Peak
Part Peak
Off Peak
Charge
Residential
Basic $0.072
TOU-A $0.157 $0.082 $0.070 $0.056
TOU-B $0.174 $0.072 $0.073 $0.054
EM-TOU* $0.186 $0.078 $0.053 $0.073 $0.054
Small Commercial
General Service $0.093 $0.062
TOU-A1X $0.109 $0.103 $0.081 $0.070 $0.055
TOU-A6 $0.302 $0.108 $0.051 $0.084 $0.051
Credit
Residential
Basic $0.082
TOU-A $0.167 $0.092 $0.080 $0.066
TOU-B $0.184 $0.082 $0.083 $0.064
EM-TOU* $0.196 $0.088 $0.063 $0.063 $0.064
Small Commercial
General Service $0.103 $0.072
TOU-A1X $0.119 $0.113 $0.091 $0.080 $0.065
TOU-A6 $0.312 $0.118 $0.061 $0.094 $0.061
BENEFITS
City of San Diego Community Choice Aggregate Feasibility Study 99 | P a g e
LOW INCOME
CCA programs can offer many customized and effective incentives to low income customers who often
cannot afford DG or renewable energy. Options include development of community solar projects
specifically for low-income areas, renewable loan programs, and direct financial incentives such as
rebates or discounts for the installation of renewable energy technologies. Energy audits, weatherization
programs, and targeted EE initiatives can also be used to help low income customers reduce energy
usage and power bills.
LARGE CUSTOMER PROGRAMS
CCAs can also work directly with large customers to determine the best way to employ renewable
generation technology and improve energy conservation and efficiency within their operations. Using
on-site energy audits combined with evaluations of the potential for installation of renewable technology
can be the first step in helping large customers understand their energy options and potential savings.
The CCA would likely have designated key account managers to work with large customers to provide
these types of energy services. Customized programs could be created and deployed according to
customer type, for example, a program for all large retail stores, or solutions could be created specifically
on a customer-by-customer basis. Generally speaking, the CCA program would have the flexibility to
design progressive, customer-focused solutions for these customers.

This page intentionally left blank.

V. RISKS
This section provides a summary discussion of certain primary risks facing the economic and financial
feasibility of the CCA program and presents, in broad terms, possible risk mitigation strategies. It is not
intended to be a comprehensive risk analysis and does not attempt to quantify risk. Risks topics discussed
herein are limited to those surrounding the following set of primary drivers: power procurement, the
regulatory landscape, the CRS and PCIA rate mechanisms, credit and finance issues, customer opt-out,
and renewable generation.
POWER PROCUREMENT RISK
Managing a portfolio of power supply is an exercise in forecasting dynamic and often unpredictable
consumer demand under various scenarios and identifying the types of energy supply contracts that
meet the load requirements in the most cost-effective and reliable manner. In the case of the power
supply portfolios explored in this Study, renewable energy provides between half and all of the energy
supply. While geothermal generation has predictable output like fossil fuel generation, solar and wind
generation is intermittent. The forecast accuracy for wind and solar generation is improving;126 however
output variation for these resources results in both the extremely high and low CAISO prices. LSEs
(including CCAs) with high adoption rates for customer-owned solar PV DG as well as significant
renewable supplies have an increased exposure to such CAISO price spikes:
• An overabundance or over-generation condition from renewable resources can force CAISO
market prices negative, potentially creating a loss for the CCA program when compared to
the premium price paid for that renewable supply.
• Under production or scarcity conditions resulting from failure of intermittent resources to
produce or other resource outages can force CAISO market prices to spike at a time when
the CCA program may potentially be required to buy power to make up for supply shortfalls.
Customer adoption of DG PV also increases variability within the load forecast. Developing an actual load
forecast and the associated procurement and resource management responsibility for a CCA becomes
more difficult and less predictable as the amount of DG increases. Over-procuring or under-procuring
resources are both risks facing the CCA program.
Several strategies can assist in mitigating such risk. First, maintaining up-to-date forecasting technology,
understanding market dynamics and market rules, and having codified power procurement processes
and procedures are all important means to managing power procurement risk. Having a robust power
supply plan, diversifying supply portfolios by production type, generation size and location, contract
length, timing of contract purchases, and the use of hedging instruments are also useful risk mitigation
practices. Perhaps most importantly, however, is working with an experienced, reliable team of
professionals who understand power risk management, power supply planning and procurement,
scheduling and coordination, demand forecasting, and regulatory issues. This team will be necessary to
126 For purposes of this study, utility scale renewable generation output is predictable within +/- 6%. North American Electric
Reliability Corporation (NERC) Variable Generation Power Forecasting for Operations:
http://www.nerc.com/files/Varialbe%20Generationn%20Power%20Forecasting%20for%20Operations.pdf

RISKS
July 2017 102 | P a g e
help the CCA program form a robust and responsive risk management plan and institute appropriate risk
evaluation techniques and mitigation mechanisms/programs, as necessary.
CHANGING REGULATORY LANDSCAPE RISK
As CCA gains traction, and more load transfers out of IOU supply, concerns over IOU cost recovery are
mounting. The CPUC issued a Background Paper outlining the basic roles of CCAs and certain future
issues associated with continued proliferation. From that Background Paper:
“A future in which CCAs procure electricity for a significant portion – perhaps even the
majority – of IOU customers would present a number of questions that the CPUC must
consider, including whether the current short- and long-term approach to procurement
would need to be revisited, who would ensure reliability, cost allocation for reliability
procurement and what entity or entities would be the ‘provider of last resort.’”
The CPUC is exploring the associated issues through the reopened Order Instituting Rulemaking to
Implement Portions of AB 117 concerning CCA proceeding 03-01-003.127 The perspective of the three
IOUs (SDG&E, Southern California Edison (SCE), & PG&E) is summarized in a presentation titled “Update
on Customer Choice in California and Portfolio Allocation” from January 2017.128
A CCA program for the City would potentially serve a significant portion of SDG&E’s current load.
Weighing the potentially changing CCA landscape would be important as the City considers further
pursuit of a CCA. CCA success would be predicated on the CCA program remaining informed about and
actively engaged in such developments. The California CCAs have formed an association called California
Community Choice Association (CalCCA)129 to represent CCAs in the legislature and at the relevant
regulatory agencies (e.g. CPUC, CEC, and the California Air Resources Board). One possible mitigation
measure is to join the association for both advocacy and insight into what other CCAs are doing. Member
Dues would be $75,000 per year given retail energy sales exceeding $500 million.
POWER CHARGE INDIFFERENCE ADJUSTMENT, COST RESPONSIBILITY SURCHARGE,
AND PORTFOLIO ALLOCATION METHOD RISKS
CCA programs are evolving from relatively small communities to the metropolitan areas within the State,
including potentially San Francisco and San Diego, as well as large geographic areas like Los Angeles
County and the tri-county region of Ventura, Santa Barbara, and San Luis Obispo, all of which are
exploring the feasibility of CCA. In response, the CPUC is examining the impacts to IOU stranded cost
recovery through the CRS, in particular, the PCIA component.
Concerns over potential cost transfer from departing IOU customers to bundled service customers
remaining with SDG&E create risks over escalation of these charges, especially in light of the size of a
City CCA program relative to SDG&E’s total load. IOUs have entered into long and medium term PPAs
127 California Public Utilities Commission Order Instituting Rulemaking to Implement Portions of AB117 concerning Community
Choice Aggregation https://apps.cpuc.ca.gov/apex/f?p=401:56:0::NO:RP,57,RIR:P5_PROCEEDING_SELECT:R0310003 128 Southern California Edison Company’s (U 338-E) Notice Of Ex Parte Communication, January 27, 2017:
http://docs.cpuc.ca.gov/PublishedDocs/Efile/G000/M175/K252/175252576.PDF 129 California Community Choice Association: http://cal-cca.org/

RISKS
City of San Diego Community Choice Aggregate Feasibility Study 103 | P a g e
to meet the needs of customers. As discussed previously, in the case of the City, roughly half of SDG&E’s
energy sales could transition to the CCA program. As a result, certain costs related to the existing SDG&E
PPAs could become recoverable from CCA customers through the CRS mechanism. Should the CCA
program go forward, the PCIA would likely increase, perhaps materially. Thus, although the CCA
program’s primary power supply portfolio might be cost competitive to the existing SDG&E supply costs,
the CRS could increase CCA costs materially, resulting in a non-competitive offering from the CCA
program as illustrated in Sensitivity Analysis 3.
As other municipalities have proven, it is possible to launch a successful CCA to the benefit of local
residents and customers. However, the scale of potential stranded costs and associated PCIA and CRS
cost risk is larger for the City CCA program than prior CCAs due to its size. The City accounts for 50% of
SDG&E’s electricity sales. All prior CCAs have been a significantly smaller percentage of the incumbent
IOU’s overall load. Even Los Angeles County Community Choice Energy,130 with 82 eligible cities and
County unincorporated areas, represents only 30% of SCE’s overall load. Therefore, the scale of stranded
assets and impact to SDG&E power procurement operations cannot be estimated.
Mitigation efforts might include acquiring a portion of SDG&E “stranded” contracts for the CCA program
portfolio. This potential risk should be further evaluated in the implementation stage of the CCA program
effort, with a focus on better understanding the potential stranded contract volume/cost as well as the
potential for restructuring those supply contracts.131
CREDIT RISK
How the newly formed CCA will cover the upfront fixed and variable operating costs is a complex issue
that must be carefully examined and expertly informed by a trusted, experienced Financial Advisor,
preferably one that has worked with other newly formed CCAs in California and elsewhere. For some of
the CCA program costs, the amount of initial funding required will depend on expenses that are
somewhat easier to quantify, such as:
• Initial real estate, facilities, and office equipment costs;
• Staff salaries and benefits from onset ramping up to full operation;
• The purchase of required telecommunications, software, and information systems and
cybersecurity technologies;
• Regulatory filings, environmental, and compliance services;
• Consulting and contractor costs; and
• Utilities, insurance, etc.
However, a large portion of potential costs will be more difficult to quantify and to assess in terms of risk,
as they relate directly to the pace and magnitude of customers opting out of the CCA program at its onset
and over time.
130 County of Los Angeles Community Choice Energy Business Plan: http://file.lacounty.gov/green/cms1_247381.pdf 131 The cost of decommissioning the San Onofre Nuclear Generation Station will be shared by all customers, bundled SDG&E
and CCA and is therefore not an additional CCA risk. Such decommissioning costs will apply equally to SDG&E and CCA
customers and therefore is not explicitly included in the pro forma financial results.
RISKS
July 2017 104 | P a g e
• How much power will the CCA program need to procure and how will it change over time?
• What will be the desired level of renewable energy versus conventional generation resources
ultimately demanded by customers and how much are the differences in cost?
• What portion of power will be purchased on the market or through long-term power purchase
agreements?
• How will market power purchases be transacted and by whom?
• What will be the costs and terms of long-term PPAs?
The answers to these and other questions will have significant impact on the appropriate financing
strategies and resulting liquidity requirements for the CCA program, both up front and on an ongoing
basis.
An experienced Financial Advisor will need to examine the financing options available and the relative
costs and benefits of each in consideration of the CCA program’s risk tolerance. Financing options for
power costs (both market purchases and long-term PPAs) could include:
• Initial cash fund: Setting up an initial cash fund to cover operating costs, or at a minimum
provide a rate stabilization component, if available, is advisable. However, it is unclear the
potential source(s) of this type of funding.
• Short-term commercial paper: Short-term commercial paper (less than nine months maturity
typically) is usually not backed by any form of collateral and as such it is a form of unsecured
debt—however only large entities with high-quality debt ratings will find issuers without having
a much higher cost for the debt issue. The CCA is a new entity and does not have an established
credit history or recognized debt rating and as such access to this instrument may be difficult.
• Letters of credit: These typically would be letters of credit required by the power
producers/marketers, with the required level of extreme specificity and additional complexity
and rigidity associated with these instruments. Typically, a letter of credit is issued by the entity’s
existing Banker; as a new entity, the CCA program would need to explore this option with their
Financial Advisor and potential Banker(s).
• Long-term bonds: Bond issuances have a number of advantages in the sense they may secure
an adequate (large) pool of cash that could sustain the CCA program for a significant period of
time and provide a cushion for swings in demand and power prices. There are also significant
disadvantages. Bond issuances may be difficult to achieve given there is no recognized credit
rating for the CCA program. There are likely acceptable workarounds for these issues, but again,
an experienced Financial Advisor should be on board to identify the types of information,
verifiable metrics, and assurances required by lenders to carry through with a bond issuance.
Another risk with bond issuance is it may result in the CCA program incurring an unnecessarily
high level of debt or a shortage of funds depending on the accuracy of the opt-out forecast and
power cost forecast. All else being equal, bonds make more sense when the expenditures they
are being used for are known over the life of the bond; for example, when annual power costs (or
at least a large portion of them) are contracted and fixed through a long-term power purchase

RISKS
City of San Diego Community Choice Aggregate Feasibility Study 105 | P a g e
agreement—the CCA program knows what it will be paying each year and the minimum amount
of energy received each year, whether the cost for this power is escalating by a fixed amount or
not. Bond issuances can also be expensive and the CCA program could incur significant
issuance/underwriting costs. There is also risk around the interest rates ultimately to be paid. The
prevailing market interest rates of course depend on the appetite and views of investors at the
time of issuance and are subject to change, sometimes quickly and unpredictably. There is always
the risk that the stated bond interest rate will not be sufficient in terms of the prevailing market
interest rate to attract investors and the bonds will need to be issued at a discount (issued at a
price below face (par) value); which means the actual interest cost could be higher than
desired/expected. Of course, large bond issuances also may commit the CCA program to
burdensome, fixed, inflexible debt payments over a long period of time; particularly if the CCA
program is unable to retire the bonds early (does not have callable bonds) and/or at a price that
is acceptable.
• Joint Powers Authority (JPA) or some other cooperative arrangement. Another option or set
of options is forming a JPA with a power project developer, entering into a build-own-transfer
arrangement for a power project with the CCA program taking ownership of the turnkey project
upon completion, or some other financial/contractual arrangement for power supply perhaps
with another CCA or group of CCAs. Again, an experienced Financial Advisor can inform the CCA
program about the costs and benefits of financing options and business arrangements available
to them.
OPT OUT RISK
The risk of large numbers of customers opting-out after the CCA program is operational represents a
primary concern for a CCA. MCE’s actual opt-out percentages have changed over time, from 17.3% to
14%.132 As illustrated in this Study, higher renewable generation content results in higher supply costs.
While customers may desire a lower carbon footprint, and be willing to pay a premium for a more
environmentally friendly source of electricity, the magnitude of such premium is unknown. Therefore, a
future CCA rate increase could trigger an increase in opt-out rates. Similarly, a decrease in SDG&E’s rates
could have a similar result.
Customer-owned solar PV DG has the effect of reducing total energy served by the CCA program
as customers self-generate. The Study load forecast suggests that the net load served by the LSE (CCA
or SDG&E) will decrease over time. A CCA must make enough margin on energy sales to cover the cost
of operations while maintaining rate competitiveness with the IOU. As energy sales decrease, the
administrative and operational costs could become a larger portion of the rates paid by customers,
absent other revenue sources.
132 Please see the segment “Opt Out Rates” beginning on page 20 for additional detail regarding opt out rates. Within this
segment, Table 5 on page 21 provides comparison opt out rates for CCAs in California.

RISKS
July 2017 106 | P a g e
Mitigation strategies could include focusing on customer service, offering highly-valued product(s) and
services,133 and providing an economic advantage to keep customers engaged and loyal to the CCA. CCA
implementation and operational plans should prioritize these objectives. Innovative rate mechanisms
could also play a role in customer attraction and retention.
RENEWABLE GENERATION RISK
Power procurement cost estimates used in the Study assume that current economics for natural gas and
utility scale renewable generation apply to 50%, 80%, and 100% renewable generation portfolios. This
assumption, while useful for cost comparison and illustration, could be unlikely to hold true in real-world
application due to the unique characteristics of these variable energy or intermittent resources.
With the exception of geothermal generation, renewable generation in general has been an intermittent
and variable source for utility scale bulk generation. Although wind generation in California possesses
enough geographical diversity to deliver relatively predictable and constant generation supply during a
24-hour period, this output can still be highly variable. Utilizing the CCA Load Profile from Section II and
applying NREL PV Watts solar output estimates,134 Figure 49 depicts a demand curve for an 80%
renewable generation portfolio. The red line represents renewable output. Geothermal and wind
generation are assumed to provide “base” generation, meeting the minimum monthly need on a
consistent basis. In this scenario, natural gas generation would provide 20% of the demand during the
“shoulder period,” after the sun sets and when demand exceeds the solar output.
133 Highly Valued products and services refer not only to the various “green” products offered, but the overall tone, objective
and longer term strategies of the CCA program, including successful development of economic local renewables, innovative
energy efficiency programs and opportunities and evidence of local direct and indirect job growth. 134 National Renewable Energy Laboratory – PV Watts: http://pvwatts.nrel.gov/
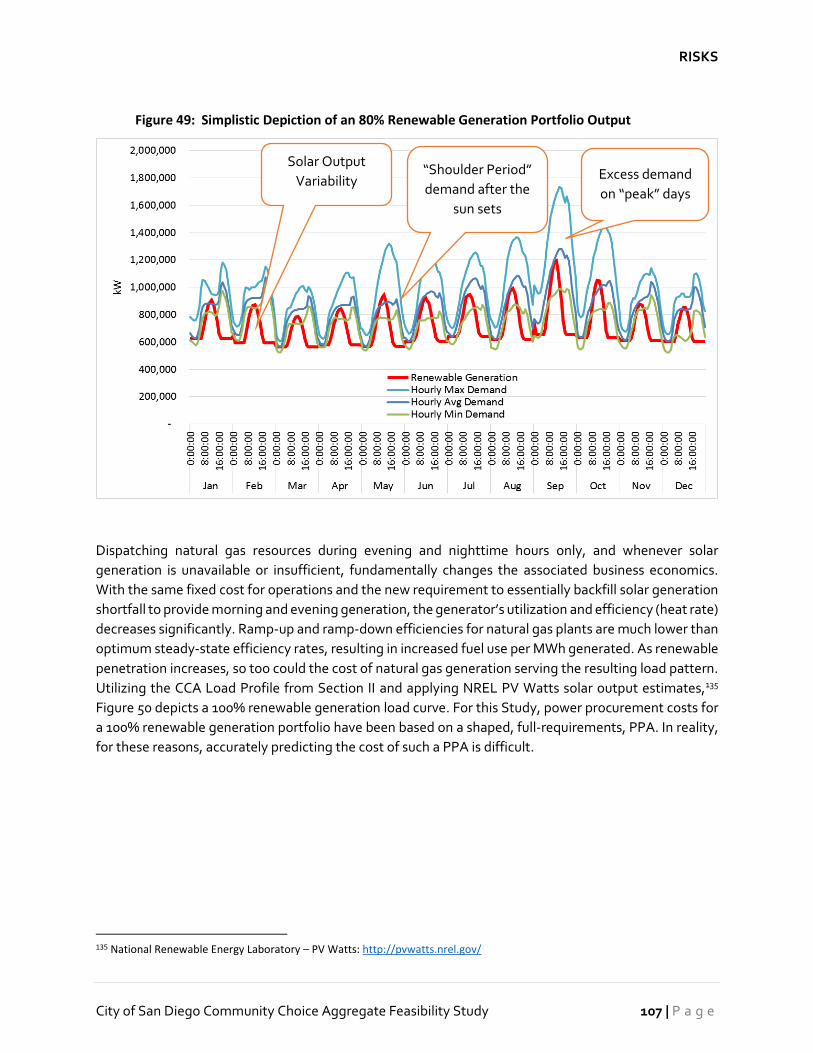
RISKS
City of San Diego Community Choice Aggregate Feasibility Study 107 | P a g e
Figure 49: Simplistic Depiction of an 80% Renewable Generation Portfolio Output
Dispatching natural gas resources during evening and nighttime hours only, and whenever solar
generation is unavailable or insufficient, fundamentally changes the associated business economics.
With the same fixed cost for operations and the new requirement to essentially backfill solar generation
shortfall to provide morning and evening generation, the generator’s utilization and efficiency (heat rate)
decreases significantly. Ramp-up and ramp-down efficiencies for natural gas plants are much lower than
optimum steady-state efficiency rates, resulting in increased fuel use per MWh generated. As renewable
penetration increases, so too could the cost of natural gas generation serving the resulting load pattern.
Utilizing the CCA Load Profile from Section II and applying NREL PV Watts solar output estimates,135
Figure 50 depicts a 100% renewable generation load curve. For this Study, power procurement costs for
a 100% renewable generation portfolio have been based on a shaped, full-requirements, PPA. In reality,
for these reasons, accurately predicting the cost of such a PPA is difficult.
135 National Renewable Energy Laboratory – PV Watts: http://pvwatts.nrel.gov/
Solar Output
Variability
“Shoulder Period”
demand after the
sun sets
Excess demand
on “peak” days

RISKS
July 2017 108 | P a g e
Figure 50: Simplistic Depiction of a 100% Renewable Generation Portfolio Output
RISK MITIGATION RESOURCE
The CEC CCA Pilot Project Guidebook136 is a helpful resource for entities exploring CCA. The guidebook
references the “experiences of the IOUs during the energy crisis of 2000‐2001” to illustrate “what can
happen when risks are not properly managed.” According to this resource, “A CCA will not be subject to
these types of constraints on its procurement practices.” Because a CCA program does not have rates
approved by the CPUC, a CCA would exercise authority over resource planning and ratemaking decisions.
A professionally managed electricity procurement program, using sound risk management practices,
would manage risks like those faced by IOUs during the energy crisis.
The CEC CCA Pilot Project Guidebook contains a Risk Mitigation section including the recommendations
in Table 34.
136 Community Choice Aggregation Pilot Project Guidebook Appendix G: http://www.energy.ca.gov/2009publications/CEC-500-
2009-003/CEC-500-2009-003.PDF
Solar Output
Overproduction
“Shoulder
Period”
demand
after
sunset
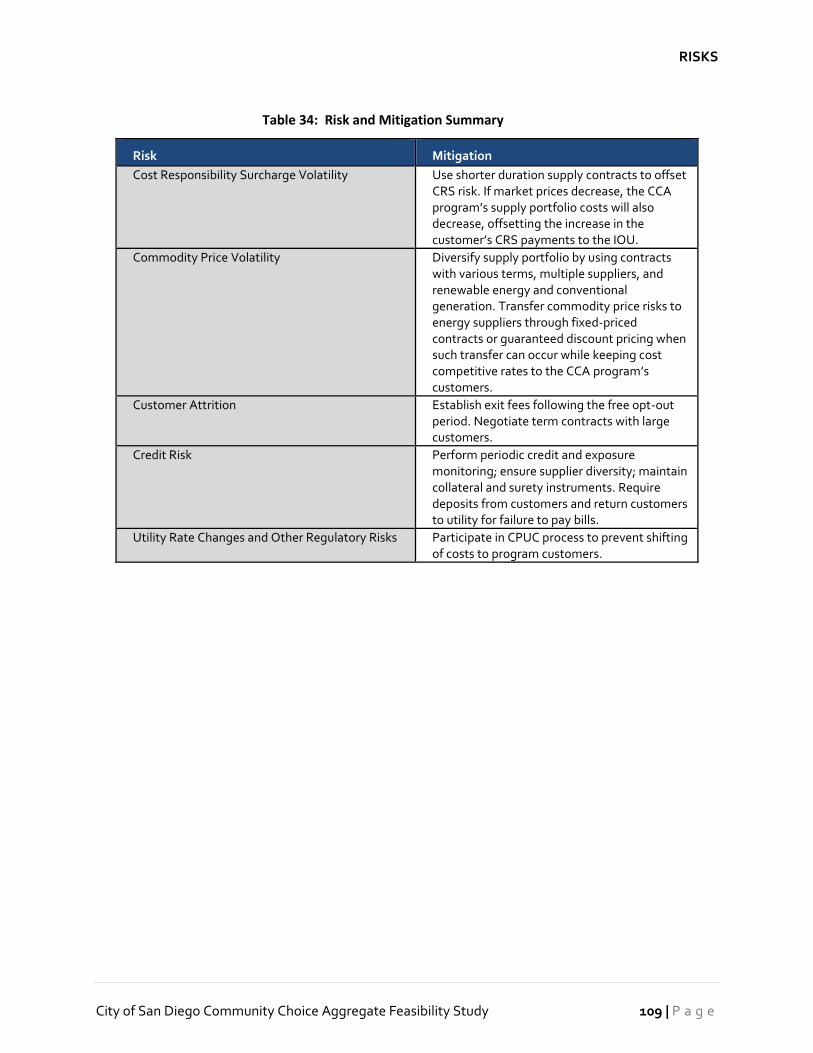
RISKS
City of San Diego Community Choice Aggregate Feasibility Study 109 | P a g e
Table 34: Risk and Mitigation Summary
Risk Mitigation
Cost Responsibility Surcharge Volatility Use shorter duration supply contracts to offset CRS risk. If market prices decrease, the CCA program’s supply portfolio costs will also decrease, offsetting the increase in the customer’s CRS payments to the IOU.
Commodity Price Volatility Diversify supply portfolio by using contracts with various terms, multiple suppliers, and renewable energy and conventional generation. Transfer commodity price risks to energy suppliers through fixed-priced contracts or guaranteed discount pricing when such transfer can occur while keeping cost competitive rates to the CCA program’s customers.
Customer Attrition Establish exit fees following the free opt-out period. Negotiate term contracts with large customers.
Credit Risk Perform periodic credit and exposure monitoring; ensure supplier diversity; maintain collateral and surety instruments. Require deposits from customers and return customers to utility for failure to pay bills.
Utility Rate Changes and Other Regulatory Risks Participate in CPUC process to prevent shifting of costs to program customers.

This page intentionally left blank.
VI. CCA IMPLEMENTATION
This section provides a general overview of the main implementation requirements for establishing a
CCA and discusses the main parties with which the CCA program interacts, set up requirements, and CCA
structure.
OTHER PARTIES
The CCA must routinely interact with other parties to fulfill its role. The three main parties are discussed
here: the CPUC, SDG&E, and CAISO. A CCA must conform to the rules and regulations of the State of
CA, including registration with the CPUC, meeting credit requirements, and becoming a CAISO market
participant. This section discusses the CCA program’s business to business relationship with SDG&E, the
regulatory interface with CPUC, and the need to participate in CAISO. A high-level overview of
establishing a CCA Service is illustrated in Figure 51.
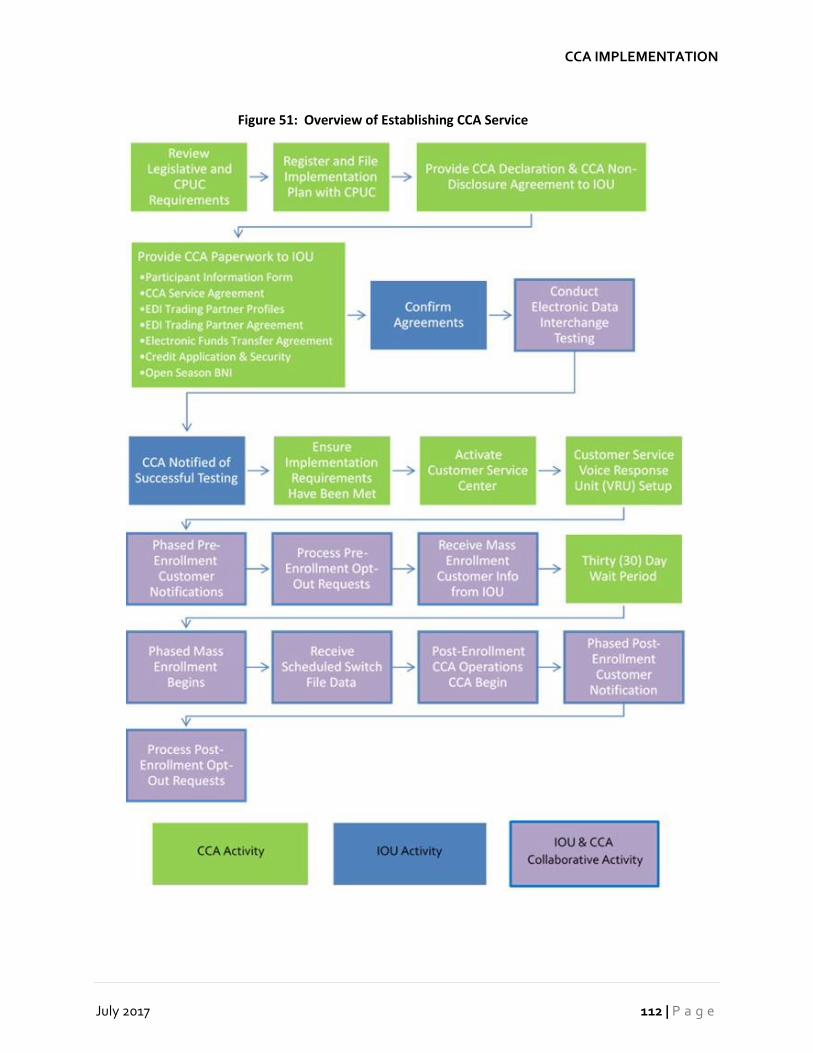
CCA IMPLEMENTATION
July 2017 112 | P a g e
Figure 51: Overview of Establishing CCA Service

CCA IMPLEMENTATION
City of San Diego Community Choice Aggregate Feasibility Study 113 | P a g e
SAN DIEGO GAS & ELECTRIC
SDG&E will deliver electricity to CCA customers. Through both legislation137 and regulation,138 IOUs are required to work cooperatively with a CCA during exploration, implementation, and operation of the CCA program. SDG&E will provide electricity meter data to the CCA program and bill customers. Furthermore, SDG&E serves as the provider of last resort. In other words, if the CCA program fails to satisfy the electric power needs of its customers, the IOU must still deliver electricity to the CCA program customers.
CALIFORNIA PUBLIC UTILITIES COMMISSION
The CPUC has a limited role in overseeing a CCA, primarily to ensure that regulated IOUs provide required
services to both the CCA program and customers. In addition, the CPUC ensures that costs incurred for
CCA customers are not passed along to the “bundled” customers.
The CPUC requires CCAs to:
• Register;
• File an Implementation Plan;
• Issue a Statement of Intent; and
• Provide Evidence of Bond Insurance.
The CPUC certifies the CCA program implementation plan prior to initialization of CCA service. This
process may include an informal review process to ensure compliance with AB117 provisions and utility
tariffs.
The CPUC has a CCA public advisor who can work with a CCA to ensure that public notices regarding the
CCA program are clear, complete, and easy to understand. SDG&E is required to include customer
notices with the utility billing statements. Other CCAs in CA did not use IOU bill inserts, instead using
direct-mail notices to provide requisite information about enrollment and opt out.
Additionally, the CPUC has extended privacy protections to CCA customers,139 including requirements
for a CCA program to:
• Comply with the privacy rules contained in the decision;
• Abide by non-disclosure requirements concerning customer data gathered through
advanced metering technology; and
137 Assembly Bill No. 117, CHAPTER 838 Electrical restructuring: aggregation. An act to amend Sections 218.3, 366, 394, and
394.25 of, and to add Sections 331.1, 366.2, and 381.1 to, the Public Utilities Code, relating to public utilities.
http://www.leginfo.ca.gov/pub/01-02/bill/asm/ab_0101-0150/ab_117_bill_20020924_chaptered.pdf 138 California Public Utilities Commission Community Choice Aggregation: http://www.cpuc.ca.gov/general.aspx?id=2567 139 D1208045 Extending Privacy Protections to Customers of Gas Corporations and Community Choice Aggregators, and to
Residential and Small Commercial Customers of Electric Service Providers:
http://docs.cpuc.ca.gov/PublishedDocs/Published/G000/M026/K531/26531585.PDF

CCA IMPLEMENTATION
July 2017 114 | P a g e
• Comply with data security measures contained in Decision 11-07-056140 concerning online
access to customer information.
CALIFORNIA INDEPENDENT SYSTEM OPERATOR
CAISO operates the CA wholesale power system through which the CCA program transacts a portion of
its power supply. The CCA must, therefore, become a CAISO market participant by:
• Assigning a certified Scheduling Coordinator to manage bids in the CAISO ancillary service and
energy markets. The Scheduling Coordinator must both be specially trained in CAISO procedures
and must have access to a secure communications link to the CAISO system through either the
Internet or through the Energy Communications Network;
• Developing and implement processes and systems to support resource interconnection;
• Utilizing appropriate metering and telemetry where required;141 and
• Participating in CAISO energy markets and related market products.142
The CCA could hire a Scheduling Coordinator or an ESP to serve in this role.
SET UP
The three main CCA set up actions for a CCA program include participating in the Open Season (optional),
providing certain customer notifications, and undergoing electronic communications compliance testing
as described below.
OPEN SEASON
CCA Open Season143 is a specific calendar period within which a CCA can voluntarily notify SDG&E of the
planned implementation date of its program. This notification limits the CCA program’s exposure to
additional stranded cost charges or exit fees. During Open Season, a CCA may submit a Binding Notice
of Intent informing SDG&E of the number of customers by class and date that the CCA program would
serve, including arrangements for phased service. SDG&E utilizes the Binding Notice of Intent to modify
power procurement forecasts to reflect loss of the CCA program load, thus limiting the CRS. While Open
Season participation is optional, it is an important tool for a CCA to limit customer cost exposure. Open
Season occurs annually from January 1 through February 15 or as late as March 1 when the CEC LSE Load
Forecasts are due on or after May 1.
140 California Public Utilities Commission Proceeding Rulemaking 08-12-009 Decision 11-07-056 Adopting Rules to Protect the
Privacy and Security of the Electricity Usage Data of the Customers of Pacific Gas and Electric Company, Southern California
Edison Company, and San Diego Gas & Electric Company
http://docs.cpuc.ca.gov/PublishedDocs/WORD_PDF/FINAL_DECISION/140369.PDF and Attachments A-E
http://docs.cpuc.ca.gov/PublishedDocs/PUBLISHED/GRAPHICS/140370.PDF 141 Metering and telemetry ensure operational accuracy:
http://www.caiso.com/market/Pages/MeteringTelemetry/Default.aspx 142 California Independent System Operator market processes and products:
http://www.caiso.com/market/Pages/MarketProcesses.aspx 143 SDG&E Rule 27.2 Community Choice Aggregation Open Season: http://regarchive.sdge.com/tm2/pdf/ELEC_ELEC-
RULES_ERULE_27_2.pdf

CCA IMPLEMENTATION
City of San Diego Community Choice Aggregate Feasibility Study 115 | P a g e
CUSTOMER NOTIFICATIONS, OPT OUT AND ENROLLMENT
CPUC Section 366.2(c)(3) contains several requirements regarding CCA customer notifications,
enrollment, and opt-out rights.
A CCA must inform potential customers at least twice within two months (sixty days) prior to the
customers’ designated date of CCA enrollment that:
• The customer is to be automatically enrolled in the CCA program;
• The customer has the right to opt out of the CCA program without penalty; and
• The terms and conditions of the services offered.
A similar notification must be made twice within two billing cycles after a customer’s enrollment in the
CCA program. The CCA must pay SDG&E for providing these notices or can opt for direct mail
notification.
MCE followed the required notification policy during initial roll out, but revised its approach when CCA
of Richmond joined the MCE program. Based on earlier customer feedback, MCE issued a third
notification 90 days prior to the date of enrollment, using both postcard and letter forms. MCE’s policy is
to provide five notices to customers during the statutory opt-out period: three within ninety days before
enrollment; and two within the first sixty days after enrollment.
ELECTRONIC COMMUNICATIONS AND COMPLIANCE TESTING
Communications with SDG&E will be vital to ensuring successful CCA transactions related to electric
meter reading and billing. SDG&E uses the Electronic Data Interchange standard to facilitate the
electronic communications and data exchange with CCAs. As part of the process of working with SDG&E
to establish the CCA program, SDG&E will conduct Electronic Data Interchange testing to ensure that
operational data exchange is functioning prior to the CCA program commencing service.
STRUCTURE
As part of CCA program exploration, the City must weigh two key organizational considerations: CCA
operating structure and governance. The first relates to deciding which CCA program startup and
operation functions to retain in-house with direct staffing, and which to outsource to third party vendors.
The second relates to choosing whether to govern and operate the CCA program on a standalone basis
as the sole jurisdiction or agency, or form a JPA with other jurisdictions, and share responsibility.
OPERATING STRUCTURE
Two principal options, and scaled combinations between the two, exist for CCA program operating
structure: full in-house operation with existing or added City Staff, and full outsourcing with City
involvement to let and administer contracts and manage vendors. The likely outcome would be a
combination of the two, with highly technical functions outsourced, and other public-facing functions
like communication, customer service, and billing, maintained in house. As noted in the feasibility reports
for Inland Choice Power and San Jose Clean Energy, many existing and proposed CCAs are selecting a
CCA IMPLEMENTATION
July 2017 116 | P a g e
high degree of internal staffing and control, with only certain highly specialized and non-public facing
functions outsourced. The range of options depends upon the degree of operating control the City wishes
to maintain, the costs associated with maintaining those functions, and the degree of risk it is willing to
accept on its own, or delegate to (and pay) third-party providers to assume. Within the pro forma
modeling, it was assumed that the CCA will be running day-to-day operations, only outsourcing market
trading activities.
Examples of CCA program operating activities include:
• Power procurement, scheduling;
• Finance, budgeting, and accounting;
• Billing and customer service;
• Communications, outreach and public relations;
• Specific programs such as DR and EE; and
• Regulatory monitoring and compliance, CPUC filings, etc.
The City would need to determine which aspects of the CCA program would be operated and managed
by City staff and which aspects are candidates for outsourcing. The City could break up the various
services required to operate the CCA program, and select vendors for certain specialized functions where
specific expertise or experience is necessary, for instance power procurement and/or CAISO scheduling.
Multiple ESPs could provide energy procurement services as well as the required Schedule Coordinator
interface to the CAISO. In addition, SDG&E provides services for any CCAs within their service territory
including billing, and offers additional support services which can be used by CCAs for a fee.144 Utilization
of these types of contracted services has been explored during the feasibility analysis, and is assumed as
the basis for many aspects of the City’s possible future CCA operation.
Outsourcing services to an ESP could reduce initial startup and operational costs; such cost over time
would likely be greater than in-house services. Additionally, outsourcing to an ESP could have less local
economic benefit than having CCA staff perform these functions. SDG&E has offices in the City.
Launching the CCA program would potentially reduce SDG&E workforce, as fewer resources might be
required to perform the functions that the CCA program would provide to customers. Therefore,
outsourcing customer service and power procurement functions to an ESP could have a net negative
impact on employment in the City.
This option involves less direct control, where an ESP could provide most of the key functions of the
program, including power procurement and rate development, and even scheduling, billing, and
customer service. The CCA’s role would be providing higher level administrative and management
functions, and serving as the connection between the vendor(s) and the customers. Under this model,
the CCA program could transfer certain risk to the ESP by obtaining guarantees for cost savings, rate
certainty, and renewable content, among others. However the ESP would likely require a greater
premium in return. Also, both downside risk and potential upside rewards, such as financial savings or
144 Schedule CCA Transportation of Electric Power for Community Choice Aggregation Customers:
http://regarchive.sdge.com/tm2/pdf/ELEC_ELEC-SCHEDS_CCA.pdf

CCA IMPLEMENTATION
City of San Diego Community Choice Aggregate Feasibility Study 117 | P a g e
return should the CCA program negotiate advantageous power purchase terms on its own, would be
transferred. A detailed procurement process could provide detailed information defining which
components of CCA operation could be cost-effectively outsourced, an indication of the terms that
vendors may be willing to accept, and specific information upon which to base this decision.
Other services such as billing, accounting, outreach, and customer service could be maintained in-house,
either because the City already has similar experience or resources with the necessary skills, or the
visibility of these critical functions requires greater local control and management. This type of structure
requires more commitment of local resources, staffing and management time than the strict outsourcing
model, but allows more control. In the direct control model, the City (or JPA) would be responsible for
hiring and monitoring vendors, and would develop its own program policies and specific customer rates,
which could incorporate specific local policy objectives.
In either case, the City should establish the CCA program as an enterprise fund. Enterprise funds are
commonly used for public utilities such as electric, water, and wastewater, or other city functions where
a public service is operated and provided in a manner similar to a business enterprise, where fees and
charges are collected for services provided, and accounting and budgeting are separate from a city’s
general fund. Setting the CCA program up as an enterprise fund provides a structure where the revenues
and expenditures are separated into distinct funds, and budgeted, reported, and tracked on unique
financial statements. In an enterprise, financial transactions are reported like business activity
accounting; revenues are recognized when earned and expenses are recognized when incurred.
Establishing an enterprise fund provides management and CCA customers with more transparency and
accountability, and the ability to more easily separate and measure performance, analyze the impact of
management decisions, determine the cost of providing electric service, and use this information to
develop COS electric rates. Enterprise accounting would allow the City to demonstrate to customers, the
public and other stakeholders, that the cost of power is being recovered through rates, and not being
subsidized or comingled with other City funds or functions.
GOVERNANCE STRUCTURE
In addition to selecting an operating structure, the City would decide between two primary governance
options for the CCA program: the City as the sole government agency responsible for the CCA program’s
creation and operation; or participation with other agencies in a JPA, where multiple agencies share
these responsibilities.
In a sole jurisdiction approach, the City has all say in development of policies and procedures for the CCA
program, meaning these can be tailored to and responsive to the City’s stakeholders and constituents
only, and based upon their own objectives. The City would be responsible for setting policy priorities in
general, and making specific decisions about RPC or local power generation, staffing policies, local
economic development activities and strategies, formulation of financial and debt policies, and
development of EE and/or DR programs. Along with greater autonomy, the City would assume all risk,
liability, and costs associated with operating the CCA program. In this case, it is anticipated that the City
would establish the CCA program as an enterprise fund, as discussed above, and work with appropriate

CCA IMPLEMENTATION
July 2017 118 | P a g e
legal counsel to explore options for controls and structural safeguards to insulate it and minimize risk to
the City’s general fund.
The second option would be the formation of a JPA, an independent agency that operates on behalf of
the public agencies which are party to its creation. In this approach, the City effectively shares
responsibility with the other agencies participating in the JPA. The divisions of these responsibilities and
the sharing of decision making authority would be determined at the time the JPA is created. Other
critical “ground rules” would also need to be negotiated and memorialized, such as financial and possibly
staffing commitments of each participating agency, and the composition of the Board and voting
procedures.
Sections 6500 to 6536 of the California Government Code constitutes the enabling legislation for JPAs,
and the Public Utilities Code allows a CCA program to be carried out under a joint powers agreement
between entities that each have the capacity to implement a CCA program individually.
A JPA may be formed when it is to the advantage of two or more public entities with common powers to
combine resources, or when local public entities wish to pool with other public entities to save costs
and/or gain economies. It can also be employed to provide the JPA with powers and authority that
participating entities might not have on their own. A JPA is a legal and separate public entity with the
ability to enter contracts, issue debt, and provide public services, among other things, and like the City,
it would have broad powers related to the operation and management of the CCA program, and the
Study, promotion, development, and conduct of electricity-related projects and programs.
The JPA structure may reduce the risks of implementing a CCA program to the City by immunizing the
financial assets of the City and the other participating agencies, and distributing the risks and costs
associated with the CCA program among the participating entities. It could also provide the benefits of
scale and economy for certain aspects of CCA program operation, such as power procurement or back
office billing and accounting functions.
A CCA operated under a JPA could enjoy increased negotiating and buying power for power purchases,
access to better financing terms for borrowing, and operating efficiencies gained by combining back-
office functions such as billing and accounting. These benefits would accrue to customers through better
pricing for power and debt, and ultimately more competitive electric rates. A larger JPA could also wield
more political influence, which could be beneficial when participating in CPUC or other regional or state
regulatory, legislative or policy making activities.
Key tradeoffs to the benefits of a JPA are that decision making is divided and management independence
is diminished. Objectives of participating agencies will likely differ, and reduced autonomy can manifest
when setting priorities for local generation, economic development activities and importance of support
programs. When the JPA is formed, a Board must be appointed to set policy and make decisions. The
makeup of this Board is subject to negotiation among the participating entities, but would likely be made
up of elected officials from each participating agency. The process of determining the makeup of the
Board, and each respective members’ voting weight can be based on several factors, for instance
percentage of customers or load or relative financial contribution, but in any case, decision making is
certainly more complicated. The number of stakeholder interests and priorities are multiplied, and in

CCA IMPLEMENTATION
City of San Diego Community Choice Aggregate Feasibility Study 119 | P a g e
many cases, reaching consensus on key decisions is more complex and time-consuming than if only one
agency were involved.
A quantitative analysis of whether a JPA would benefit or reduce the financial prospects of the CCA
program, based upon the addition of specific agencies and their associated energy load, is beyond the
scope of this report. Additional analysis would be necessary to determine if adding the load of other
agencies to the load served by the City CCA program would create different demand patterns and peaks,
or compound existing peaks, either of which might adversely impact City CCA program customers, or the
customers of the other prospective JPA members.
MCE, Sonoma Clean Power, and Peninsula Clean Energy are examples of CCAs currently using a JPA
approach. In addition, LCE is employing a structure whereby it provides certain operation and power
procurement resources that can be utilized by other cities who join their JPA. Lancaster and the other
participating cities benefit from the aggregation of these functions.

This page intentionally left blank.

VII. CONCLUSIONS & RECOMMENDATIONS
This section of the report presents the findings and conclusions of the Study and provides
recommendations based on Study results, including potential next steps and actions associated with the
CCA program.
CCA PROJECTED OUTCOMES AGAINST MINIMUM PERFORMANCE CRITERIA
TARGETS
As noted in the SEAB Guiding Principles appearing in Appendix B:
“The table of CCA Recommended Minimum Performance Criteria below is an evaluative
tool. It does not set up a rigid pass fail criteria, but rather establishes recommended
minimum performance criteria. We propose that the table below can be used as a
guidance document in defining potential CCA scenarios for evaluation. Each criterion
shall be assessed for likelihood of feasibility and associated risk while showing
compliance with state laws.
If the goals set forth in the table are not considered achievable at the benchmark points
noted, then the feasibility Study should indicate when or under what circumstances they
would be able to be achieved in relation to the other goals. The primary function assigned
the CCA program in the CAP is to achieve 100% renewable energy by 2035. The Guiding
Principles qualify the 100% renewables and greenhouse gas goal achievement with a
number of additional economic and environmental goals.”
Table 35 provides assessment results of the feasibility that the CCA program will be able to meet the
recommended minimum performance criteria. Green indicates that it is feasible for the CCA program to
meet the criteria, yellow indicates that feasibility was not addressed within this Study (outside of study
scope), and red indicates that meeting the criteria is not feasible. Study results indicate that it is feasible
for the CCA program to meet all recommended performance criteria, with the exception of the Local DG
and EE/DR deployment criteria. While the results indicate the CCA program would have funds available
to invest in these initiatives, the Study did not specifically address the feasibility of meeting the targets
embedded in the criteria. As such, the Study cannot make a conclusion whether it is feasible or not
feasible to have 50% local DG by 2035 and meet CAP targets and the CA Long Term EE Strategic Plan in
the five to ten-year timeframe.

CONCLUSIONS & RECOMMENDATIONS
July 2017 122 | P a g e
Table 35: Sustainable Energy Advisory Board CCA Recommended Minimum Performance
Results
CATEGORY 1-3 YEARS 3-5 YEARS 5-10 YEARS 10+ YEARS RESULT
ENVIRONMENTAL
GHG Reductions Meet Climate Action Plan thresholds
Meet Climate Action Plan thresholds
Renewables Percentage
Minimize Non-Local Renewable Energy Certificates
Minimize Non- Local Renewable Energy Certificates
Minimize Non- Local Renewable Energy Certificates, On- track to have no RECs by 2035
100% Renewable Energy by 2035 not from Renewable Energy Certificates
Local DG
50% of energy from local Distributed Generation by 2035
Energy Efficiency / Demand Response Deployment
Establish program(s) to meet Climate Action Plan targets and the CA Long Term Energy Efficiency Strategic Plan
FINANCIAL
Operating Reserve Sufficient to establish operations
Enough capital to invest in local projects/ programs
Cost of Purchased Energy (Power Charge Indifference Adjustment and Electricity)
Not substantially different than SDG&E
Not substantially different than SDG&E
Not substantially different than SDG&E
Not substantially different than SDG&E
ECONOMIC
Impact on Markets and Jobs (Labor, Home Builders, Solar - Big & Small, Energy Storage)
No negative effect on local jobs
Positive impact on local jobs
Substantial positive impact local jobs by 2035
Substantial positive impact local jobs by 2035
Rates to Consumer (Social Cost)
Baseline offering not more than SDG&E
Baseline offering not more than SDG&E
Program should show high likelihood of reduced rates for baseline offering
Program should show high likelihood of reduced rates for baseline offering
Results Key: Feasible to Meet Criteria
Feasibility Not Addressed within this Study (outside of Study Scope)
Not Feasible to Meet Criteria
CONCLUSIONS & RECOMMENDATIONS
City of San Diego Community Choice Aggregate Feasibility Study 123 | P a g e
PRIMARY STUDY CONCLUSIONS
Following are the primary Study conclusions, which are based on the considerations, assumptions, and
analyses conducted as described within this report:
• As noted in the previous discussion, it is feasible that the CCA program will be able to meet the
majority of the SEAB’s recommended minimum performance criteria, including GHG reductions to
meet CAP targets and having an energy supply that is 100% from renewables (not RECs).
• It is feasible that the CCA program will have electric rates that are competitive with the incumbent
utility. Under the various scenarios examined, by and large the CCA program rates for most of the
Study period remain below those projected for SDG&E; indicating that from ratepayers’ perspective
the CCA program is beneficial. The rate competitiveness is driven by several key assumptions,
including:
• The persistence throughout the Study period of relatively high SDG&E generation rates
which are above other IOUs in California and are some of the highest rates in the nation;
• The forecast of the City CCA program’s all-in energy supply procurement costs (including
renewable and natural gas-fired generation, CAISO energy and capacity costs, and other
market charges) remaining less than the forecasted SDG&E generation rates; and
• The forecast of the CCA programs set-up and operational costs, not directly related to power
procurement costs, remaining relatively flat and a small portion of total costs over the Study
period.
• It is feasible that the CCA program will be reliably solvent and financially feasible. Although initially
net margins are negative in the majority of scenarios examined, net margins are shown to steadily
increase year over year, become positive after the first five to seven-year period and remain positive
and growing throughout the remainder of the Study period. Working capital is also deemed adequate
from onset of the CCA program throughout the Study period.
• Although not during the initial five to seven-year period, it is feasible that the CCA program
eventually will generate enough net margins to make substantial investments in high priority energy
initiatives, such as increasing local DG as well as EE, DR, and other DSM-related initiatives.
• It is feasible that the CCA program will have a positive economic impact in terms of increased
disposable income and local jobs creation.
• Risks are associated with many aspects of the CCA program and would need to be evaluated, and
prioritized, and appropriate risk mitigation strategies developed.
• The sheer size of the City CCA would be materially larger than all CCA programs in existence. In fact,
based on annual load, the City CCA would be over twice the size of all the other operating CCAs,
except for Peninsula Clean Energy, and nearly ten times bigger than half of the operating CCAs. The
magnitude of this proposed venture could significantly impact operations and risk exposure in ways
not yet experienced by other CCA programs. Further, the impact on SDG&E of departing load

CONCLUSIONS & RECOMMENDATIONS
July 2017 124 | P a g e
represented by the City CCA program would be difficult to predict given lack of comparable
examples. Similar risks are faced by Los Angeles Community Choice Energy and San Jose Clean
Energy CCAs.
RECOMMENDATIONS
Following are the primary Study recommendations, which are based on the considerations, assumptions,
and analyses conducted as described within this report:
1. The effect of the CCA program customers, which represent a substantial portion of SDG&E’s
customer base, no longer purchasing the energy commodity from SDG&E may have a significant
impact on the PCIA and SDG&E power procurement strategies going forward. Given the nature
of the PCIA and attendant risk to the CCA program, the City should
a. Prioritize this issue,
b. Create a strategic plan for addressing this risk,
c. Mobilize internal resources to monitor and to support the strategic plan, and
d. Engage with the CPUC, SDG&E, and other stakeholders to inform the strategic plan and
to move the plan forward.
2. The State CCAs have formed an association called CalCCA to represent CCAs in the legislature
and at the relevant regulatory agencies (CPUC, CEC and California Air Resources Board). It is
recommended for the City CCA program to join CalCCA145 to engage with other CCAs and learn
from their experiences, understand the changing CCA landscape, and for advocacy. Member
dues would be $75,000 per year assuming projected CCA retail energy sales exceeding $500
million.
3. Should the City continue to pursue CCA, it should engage appropriate industry professionals to
vet pro forma assumptions and results. Such professionals would likely include a registered
Financial Advisor, a power supply risk management expert, renewable energy generators and
developers, and other industry professionals.
4. The primary economic development policies and priorities that that the City should explore to
fully leverage the potential local job creation and business investment of the CCA program
detailed in this Study include:
• Target partnerships with local cleantech companies in the early years through existing
economic development marketing and branding activities and the proposed “Buy San
Diego” campaign.146
• Target locally sourced materials, supplies, services when possible - adhere to Department of
Defense “Buy American” guidelines for materials and supplies where and when possible.
145 California Community Choice Association: http://cal-cca.org/ 146 City of San Diego Economic Development Strategy (2014-2016), 2.3 Manufacturing & Innovation, Action 7, page 10.

CONCLUSIONS & RECOMMENDATIONS
City of San Diego Community Choice Aggregate Feasibility Study 125 | P a g e
• Shift acquisition of materials, supplies and services from external to local sources as the
program is implemented over time.
• Explore establishing procurement targets for construction/operations with preference for
retrained veterans, agricultural workers, returning offenders (Work Opportunity Tax Credits
available for retraining costs).
• A major motive for the development of a CCA is to bolster local economic development.
CCAs can offer special economic development rate to encourage manufacturers to site in
San Diego thus supporting the City’s strategy to stimulate manufacturing jobs.
• Lower utility costs would serve to enhance the City’s economic competitiveness, particularly
for large power users such as the military, aerospace/defense, biotech/medical device
electronics/ telecommunications, and international trade/logistics manufacturers.

27368 Via Industria, Suite 200Temecula, California 92590-4856
800.755.6864 | 951.587.3500 | Fax: 951.587.3510www.willdan.com


![[Part 15] 1/24 Discrete Choice Modeling Aggregate Share Data - BLP Discrete Choice Modeling William Greene Stern School of Business New York University](https://cdn.vdocuments.net/doc/165x107/56649dd45503460f94acc8d8/part-15-124-discrete-choice-modeling-aggregate-share-data-blp-discrete.jpg)


