
FIN639Vicentiu Covrig
11
Asset Pricing TheoryAsset Pricing Theory(chapter 5)(chapter 5)

FIN639Vicentiu Covrig
22
Capital Asset Pricing Model (CAPM)Capital Asset Pricing Model (CAPM)
Elegant theory of the relationship between risk and return- Used for the calculation of cost of equity and required
return
- Incorporates the risk-return trade off
- Very used in practice
- Developed by William Sharpe in 1963, who won the Nobel Prize in Economics in 1990

FIN639Vicentiu Covrig
33
CAPM Basic AssumptionsCAPM Basic Assumptions
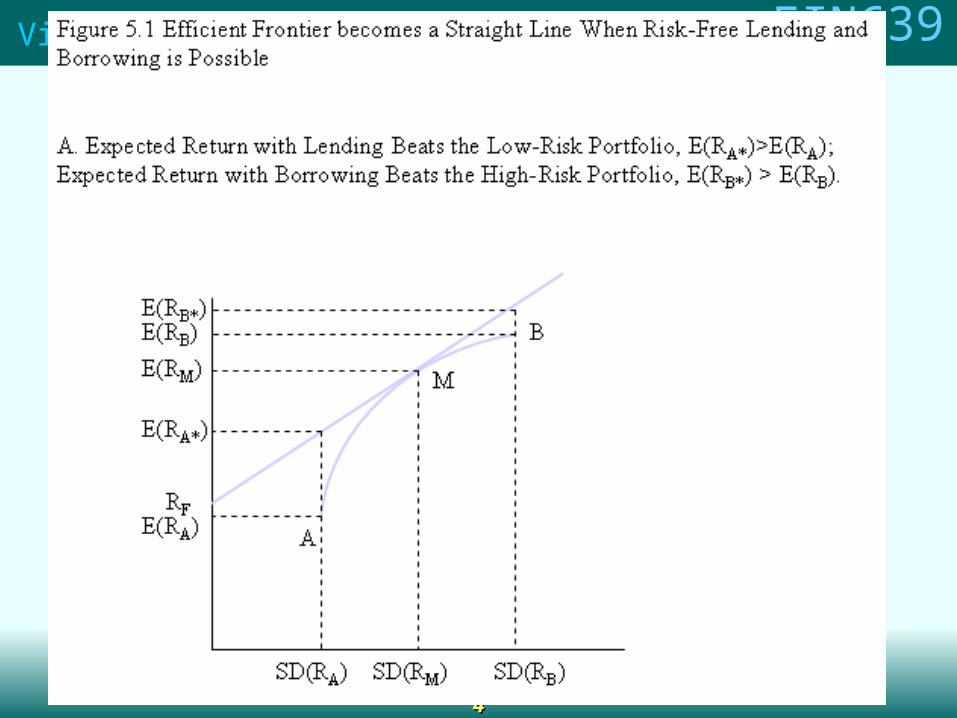
Investors hold efficient portfolios—higher expected returns involve higher risk.
Unlimited borrowing and lending is possible at the risk-free rate.
Investors have homogenous expectations. There is a one-period time horizon. Investments are infinitely divisible. No taxes or transaction costs exist. Inflation is fully anticipated. Capital markets are in equilibrium.
Examine CAPM as an extension to portfolio theory:
FIN639Vicentiu Covrig
44

FIN639Vicentiu Covrig
55
FIN639Vicentiu Covrig
66
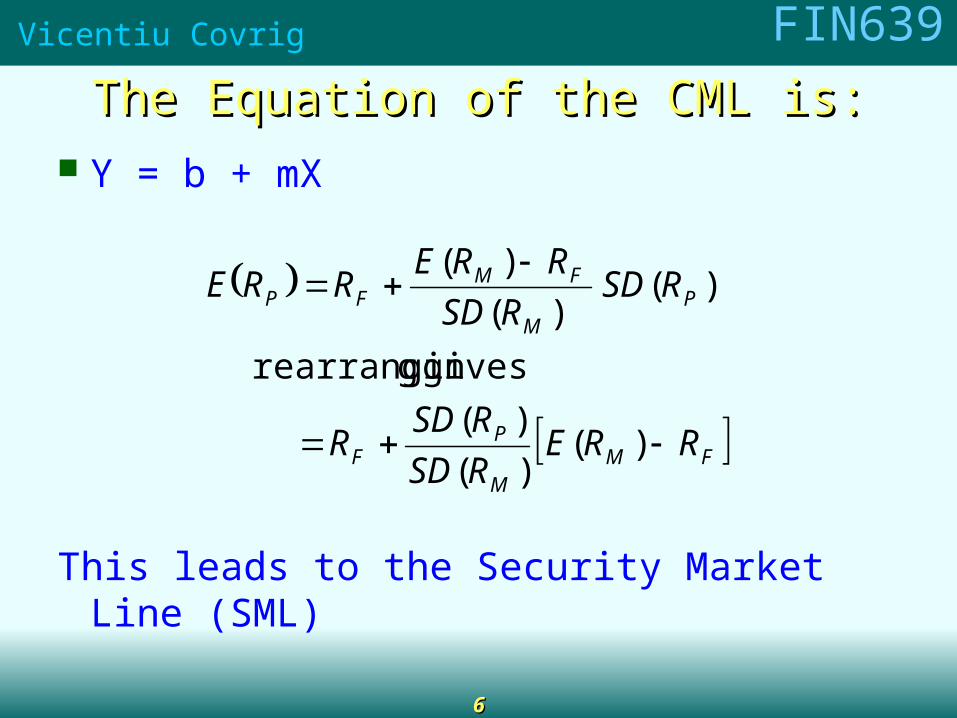
The Equation of the CML is:The Equation of the CML is:
Y = b + mX
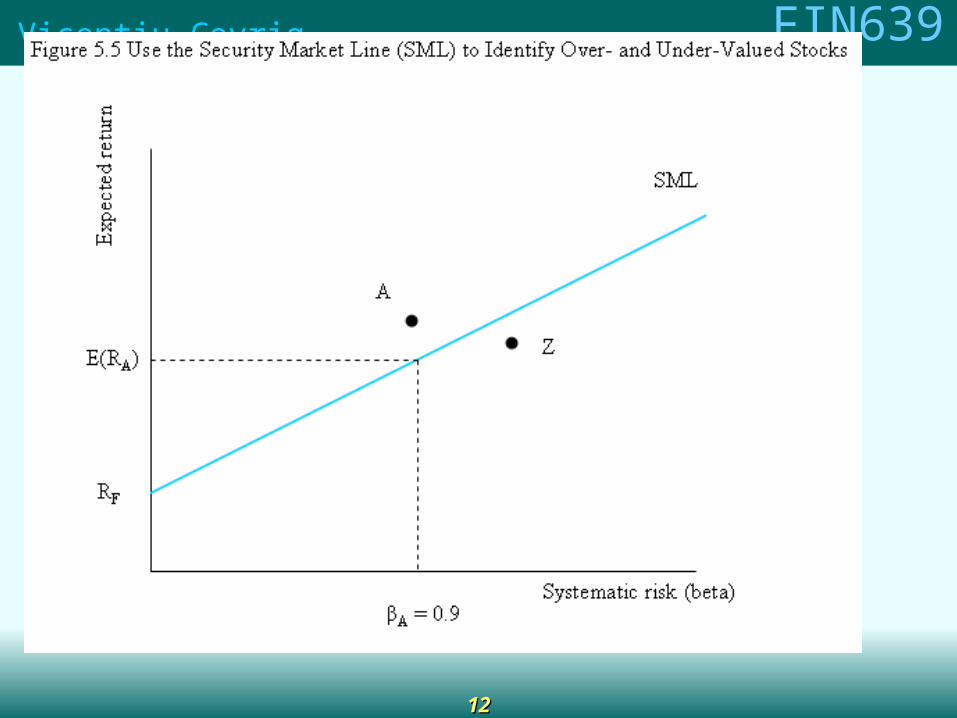
This leads to the Security Market Line (SML)
FMM
PF
PM
FMFP
RRERSD
RSDR
RSDRSD
RRERRE
)()(
)(
gives grearrangin
)()(
)(

FIN639Vicentiu Covrig
77
SML: SML: risk-return trade-off for individual securitiesrisk-return trade-off for individual securities
Individual securities have- Unsystematic risk
Volatility due to firm-specific eventsCan be eliminated through diversificationAlso called firm-specific risk and diversifiable risk
- Systematic riskVolatility due to the overall stock marketSince this risk cannot be eliminated through diversification,
this is often called nondiversifiable risk.

FIN639Vicentiu Covrig
88
FIN639Vicentiu Covrig
99
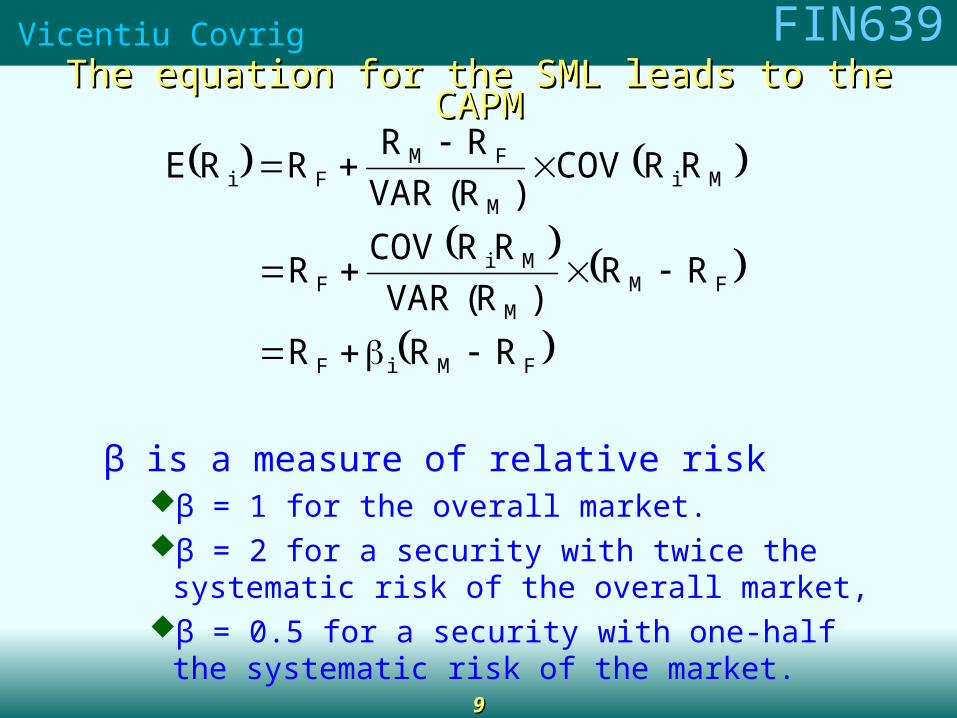
The equation for the SML leads to the CAPMThe equation for the SML leads to the CAPM
FMiF
FMM
MiF
MiM
FMFi
RRR
RR)R(VAR
RRCOVR
RRCOV)R(VAR
RRRRE
β is a measure of relative riskβ = 1 for the overall market. β = 2 for a security with twice the systematic risk of the
overall market, β = 0.5 for a security with one-half the systematic risk
of the market.

FIN639Vicentiu Covrig
1010
FIN639Vicentiu Covrig
1111
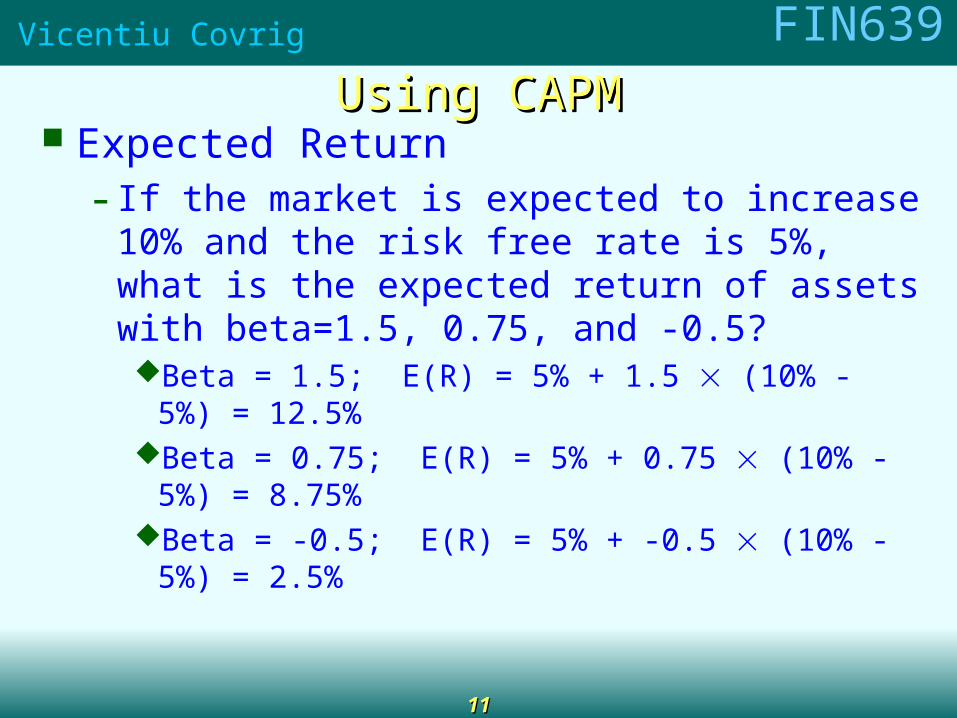
Using CAPMUsing CAPM Expected Return
- If the market is expected to increase 10% and the risk free rate is 5%, what is the expected return of assets with beta=1.5, 0.75, and -0.5?Beta = 1.5; E(R) = 5% + 1.5 (10% - 5%) = 12.5%Beta = 0.75; E(R) = 5% + 0.75 (10% - 5%) = 8.75%Beta = -0.5; E(R) = 5% + -0.5 (10% - 5%) = 2.5%
FIN639Vicentiu Covrig
1212

FIN639Vicentiu Covrig
1313
CAPM and PortfoliosCAPM and Portfolios How does adding a stock to an existing portfolio
change the risk of the portfolio?- Standard Deviation as risk
Correlation of new stock to every other stock
- BetaSimple weighted average:
Existing portfolio has a beta of 1.1 New stock has a beta of 1.5. The new portfolio would consist of 90% of the old portfolio and
10% of the new stock New portfolio’s beta would be 1.14 (=0.9×1.1 + 0.1×1.5)
n
iiiP w
1

FIN639Vicentiu Covrig
1414
Estimating BetaEstimating Beta Need
- Risk free rate data
- Market portfolio dataS&P 500, DJIA, NASDAQ, etc.
- Stock return dataInterval
Daily, monthly, annual, etc.
LengthOne year, five years, ten years, etc.
- Use linear regression R=a+b(Rm-Rf)
FIN639Vicentiu Covrig
1515
Problems using BetaProblems using Beta
Which market index? Which time intervals? Time length of data? Non-stationary
- Beta estimates of a company change over time.
- How useful is the beta you estimate now for thinking about the future?
Beta is calculated and sold by specialized companies

FIN639Vicentiu Covrig
1616
CAPM used in the industryCAPM used in the industry CAPM plus extra risk premiums
RuRiRsRRbaRR fmiifi )(1
Rs= size premium Ri= industry premium Ru= firm specific risk premium

FIN639Vicentiu Covrig
1717
Multifactor modelsMultifactor models Fama-French Three Factor Model
- Beta, size, and B/M
SMB, difference in returns of portfolio of small stocks and portfolio of large stocks
HML, difference in return between low B/M portfolio and high B/M portfolio
- Kenneth French keeps a web site where you can obtain historical values of the Fama-French factors,
mba.tuck.dartmouth.edu/pages/faculty/ken.french/data_library.html
iiifmiifi HMLbSMBbRRbaRR )()()( 321

FIN639Vicentiu Covrig
1818
Sharpe RatioSharpe Ratio Reward-to-variability measure
- Risk premium earned per unit of total risk:
- Higher Sharpe ratio is better.
- Use as a relative measure.Portfolios are ranked by the Sharpe measure.
P
P
RSD
RR
P
FP
portfoliofor Risk Total
portfolioon return Excess
)(ratio Sharpe

FIN639Vicentiu Covrig
1919
Treynor RatioTreynor Ratio
Reward-to-volatility measure- Risk premium earned per unit of systematic risk:
- Higher Treynor Index is better.
- Use as a relative measure.
P
PRR
P
FP
portfoliofor risk Systematic
portfolioon return ExcessIndexTreynor
FIN639Vicentiu Covrig
2020
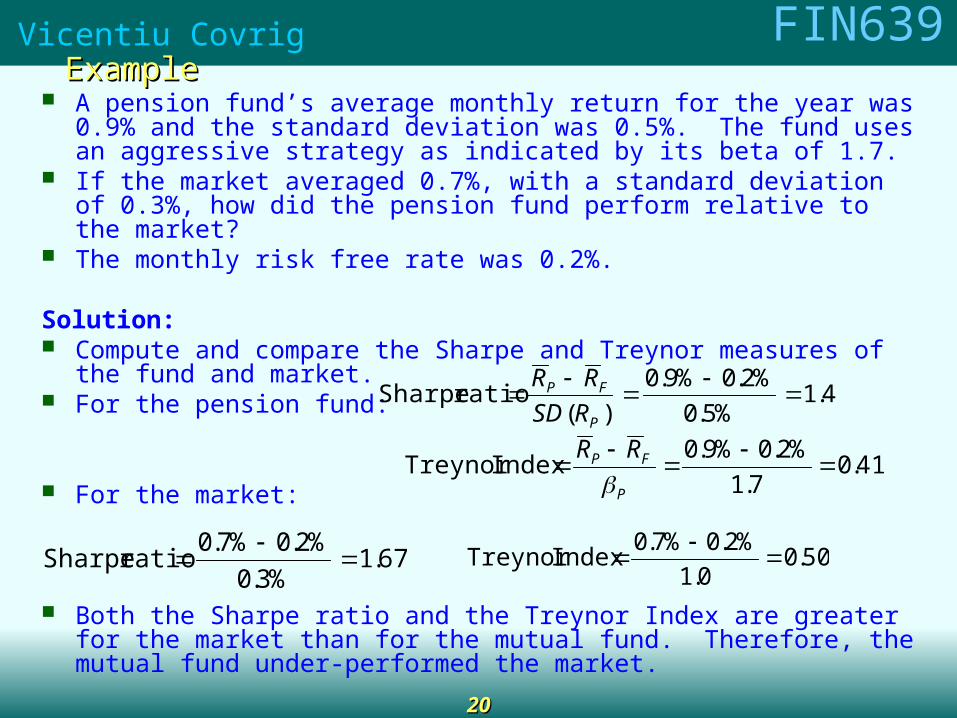
ExampleExample A pension fund’s average monthly return for the year was 0.9% and the
standard deviation was 0.5%. The fund uses an aggressive strategy as indicated by its beta of 1.7.
If the market averaged 0.7%, with a standard deviation of 0.3%, how did the pension fund perform relative to the market?
The monthly risk free rate was 0.2%.
Solution: Compute and compare the Sharpe and Treynor measures of the fund and
market. For the pension fund:
For the market:
Both the Sharpe ratio and the Treynor Index are greater for the market than for the mutual fund. Therefore, the mutual fund under-performed the market.
4.1%5.0
%2.0%9.0
)(ratio Sharpe
P
FP
RSD
RR
41.07.1
%2.0%9.0IndexTreynor
P
FP RR
67.1%3.0
%2.0%7.0ratio Sharpe
50.0
0.1
%2.0%7.0IndexTreynor
FIN639Vicentiu Covrig
2121
Learning objectivesLearning objectives
Discuss the CAPM assumptions and model; Discuss the CML and SMLDiscuss the firm specific versus market riskDiscuss the concepts of correlation and its relation with diversificationKnow Alpha and BetaKnow how to calculate the require return; portfolio betaDiscuss the industry CAPM model (slide 16) and Fama-French modelDiscuss how Beta is estimated and the problems with BetaDiscuss and know how to calculate Sharpe and Treynor ratiosEnd of chapter problems 5.1, 5.9, 5.15, 5.16,5.1, 5.19, CFA problems 5.1, 5.3


