
| i |
cg';"rL ! –s_
Business Plan (2016/17‐2019/2020) Submitted to Town Development Fund
Business Plan for Leading TDF towards a Visible and Sustainable Financial Intermediary Institution of Nepal
Submitted by Maniram Singh Mahat 30th March 2016 (Reviewed on 25 July 2016)

| ii |
TABLE OF CONTENTS
Chapter 1 ............................................................................................................................... 1
1. Introduction ..................................................................................................................... 1
1.1. Background .................................................................................................................................... 1
1.2. Objectives of TDF ......................................................................................................................... 1
1.3. Board Composition ...................................................................................................................... 1
1.4. System and Process ..................................................................................................................... 1
1.5. Human Resource Management ................................................................................................ 1 Chapter 2 .............................................................................................................................. 2
2. Local Borrowing Assessment and Positioning of TDF ..................................................... 2
2.1 Business Area ................................................................................................................................ 2
2.1.1 TDF's Mandate, Functions, Duties and Powers of the Fund ............................................... 2
2.1.2 Municipal Infrastructure Sectors and Loan Products ........................................................... 2
2.1.3 Positioning of TDF in the Municipal Finance System ............................................................ 3
2.2 Demand for TDF Debt Financing ............................................................................................... 3 2.2.1. Pace of Urbanization ................................................................................................................................ 3 2.2.2. Analysis of Infrastructure Financing Need ........................................................................................... 4 2.2.3 Opportunities for Public Private Partnership ...................................................................................... 5
2.3. Urban Infrastructure Finance in Federal Polity ..................................................................... 5
2.4. Functional Assignment in the Constitution ............................................................................ 5
2.5. Urban Financing Framework ..................................................................................................... 5 Chapter 3 .............................................................................................................................. 6
3. Key Component of 4 Year Business Plan ......................................................................... 6
3.1. TDF Strategic Planning: Foundation for the proposed Business Plan ............................... 6
3.2. Rationale of the Proposed Business Plan ................................................................................ 7
3.3. Methodology and Process .......................................................................................................... 7
3.4. Assessment of Municipal (borrower's) Revenue Base ......................................................... 8 3.4.1. Own Source Revenue‐ OSR ...................................................................................................................... 8 3.4.2. Inter Government Fiscal Transfers (IGFT) ............................................................................................ 8
3.5. Investment Gap Analysis ............................................................................................................ 9 3.5.2 Net Infrastructure Financing Requirement ........................................................................................... 9
3.8. Key Issues, Challenges and Prospects : SWOT Analysis ..................................................... 10 3.8.1. Strengths ................................................................................................................................................... 10 3.8.2. Weaknesses .............................................................................................................................................. 10 3.8.3. Opportunities ............................................................................................................................................ 11 3.8.4. Threats ....................................................................................................................................................... 11
3.9. Strategies ..................................................................................................................................... 11
3.9.1. External Strategies for the Creation of Enabling Environment.................................... 11
3.9.2. Internal Strategies for Institutional Development ......................................................... 12 3.9.1. Strategic Direction ................................................................................................................................... 13

| iii |
3.9.2 Capacity Development ........................................................................................................................... 13 3.9.3. Organisation Structure ........................................................................................................................... 13 3.9.4 Performance Orientation ....................................................................................................................... 13 3.9.5. Reward Framework for Higher Results ............................................................................................... 13
Chapter 4 ............................................................................................................................. 14
4. Business Plan in Logical Framework .............................................................................. 14
4. Logical Framework ..................................................................................................................... 14
4.1. Mission ......................................................................................................................................... 14
4.2. Vision ............................................................................................................................................ 14
4.3. Goal ............................................................................................................................................... 14
4.4. Core Values of the TDF .............................................................................................................. 14
4.5. Key Result Areas –KRA and Action Plan ................................................................................ 14
4.8. Transformation of TDF into a strong Financial Intermediary ........................................... 17
4.9. Capital Structure ......................................................................................................................... 17
Annex I: Business Restructuring Plan –BRAP II (2016/17‐2019/20) ................................... 18
Annex II: Investment Plan (2016/17‐2019/20) ........................................................................ 21
Annex III: Loan Recovery Plan (2016/17‐2019/20) ................................................................. 23
Annex IV: TDF's Capital Restructure Plan (2016/17‐2019/20) ............................................. 24
Contingent plan: ................................................................................................................................... 24
| 1 |
Chapter 1
1. INTRODUCTION
1.1. Background
Town Development Fund (TDF) was established as TDF Board, by Formation Order 1988 under Development Board Act 1956 and it was made autonomous under TDF Act 1997. Initially, TDF was funded by loans from the World Bank, grants and technical assistance from German Technical Cooperation (GTZ) and equity fund from the then HMG/N until July 1997 and technical assistance from United Nations Centre for Human Settlements (UNCHS) until December 1993. These funds were pooled as a capital of TDF for providing loans including soft loans and grants for social infrastructure projects, urban utility projects and revenue revenue generating projects.
1.2. Objectives of TDF
The main objectives of TDF are to a) provide financial support to municipalities to implement social and income‐generating projects, and b) strengthen the technical, managerial and financial capabilities of municipalities in formulation, implementation and evaluation of urban development plans and programs.
1.3. Board Composition
TDF Board is chaired by the Secretary of the Ministry of Urban Development (MoUD); two Joint Secretary level members from Ministry of Finance (MoF) and Ministry of Federal Affairs and Local Development (MoFALD), two technical and financial expert members nominated by the board, 5 Mayors from five development regions nominated by GoN and the Executive Director of TDF as member secretary.
1.4. System and Process TDF's system and process has been designed and is in place which includes loan grant policy, comprehensive manuals, and guidelines, for its operations. TDF's legal mandate, legal authority and processes are comprehensive. TDF has adopted Standard Operating Procedures (SOPs) to ensure the quality of its business process and complete it in the stipulate time.
1.5. Human Resource Management Though TDF has approved 64 positions, only 42 positions have been fulfilled on both permanent and contract basis at present. TDF often faced high turnover of technical staffs in the past years.
| 2 |
Chapter 2
2. LOCAL BORROWING ASSESSMENT AND POSITIONING OF TDF
2.1 Business Area 2.1.1 TDF's Mandate, Functions, Duties and Powers of the Fund1
TDF aims to alleviate economic and social poverty in urban sectors through long term financing in social infrastructure and revenue generating projects with functions, duties and powers of the fund as follows: formulate the policy relating to operation and management of the Fund and
implement and cause to implement, approve the annual and periodic programmes and budget of the Fund and to
manage or cause to manage the required amount, provide financial and technical support to institutions related to town
development to conduct revenue generating and basic social infrastructure projects, and to carry out extension, development and construction of the town, city infrastructure,
build‐up technical and financial bases required for the construction, development and expansion of the Towns and implement or cause to implement programmes related to the town development and encourage the participation of institutions relating to town development to the maximum extent in such programmes,
provide training and consulting services to institutions relating to town development in the field of town development,
do or cause to do activities according to an agreement made by the Government of Nepal (GoN) with any international organisation or foreign government in relation to the fund,
invest resources of the Fund in shares, debentures or any other types of bond‐paper of any other corporate body established under the prevailing laws without making any negative impact in the benefit of the Fund,
make available annual report and audit report in relation to the annual activities of the Fund to GoN,
approve the organisational structure of the Fund and create necessary posts accordingly.
2.1.2 Municipal Infrastructure Sectors and Loan Products TDF’s major financing sectors are as below2:
i. Social infrastructure projects (drainage, public toilet, slum area improvement...)
ii. Basic utility infrastructure projects (drinking water and sanitation, roads, bridges, public/municipal buildings...)
iii. Economic or revenue generating infrastructure projects (bus park, touristic place development, market place development...)
1 TDF Act 2053 2 TDF, Lending and Grant Policy

| 3 |
Type of Loan Products and terms are as follows:
i. Infrastructure loan for Social Service for up to 25 year payback period at 5‐9.5% interest rates and loan grant ratio from 20 loan : 80 grant to 90 loan : 0 grant and 10% matching from client.
ii. Infrastructure loan for the urban basic services projects for 20 years payback period at 5‐12% interest rate and loan grant ratio up to 60:10 and 10% matching from client.
iii. Income generating infrastructure loan for 20 years payback period at 5‐12% interest rate (100% loan/no grant)
2.1.3 Positioning of TDF in the Municipal Finance System Municipal financing in Nepal is mainly based on a non‐commercial source i.e. from bilateral (giz) and multilateral (ADB, IDA) grant and loan contributions. TDF loans have triggered urban infrastructure development and growth, which are supplemented by grants in appropriate situation and composition. Municipalities have focused on need‐specific capital projects compatible with their technical and financial capabilities. Municipal borrowing capacity and revenue generating capacity of individual projects are the determinants, which make project bankable to be financed by TDF. Other commercial banks are not in the position to finance municipal infrastructures for long term. Given the narrow revenue base and limited capacity of government to perpetually finance capital expenditures without corresponding returns, the capacity of municipalities to finance their development from effective use of loans, and supported by grants, has become an imperative condition to meet the longer term goal of improvement in basic services. Urban centres with poor infrastructure can not function as "engines of economic Growth". To meet the Sustainable Development Goals (SDGs), and reach Nepal's national objective of sustainable inclusive growth, it is estimated that Nepal must invest $40 billion in infrastructure over the 2009 ‐2025 period. TDF has also financed social development projects in several municipalities, which have helped to improve the living conditions of urban poor.
2.2 Demand for TDF Debt Financing
2.2.1. Pace of Urbanization Nepal’s urban population, as elsewhere in the region, has grown, making up 23% in 2011 and 42% in 2015 in 217 municipalities. These are encouraging trends of urbanization and economic development. Despite its relative strength, the urban economy operates under severe constraints in Nepal, with limited urban infrastructure in key cities and towns. Urban areas have mostly grown haphazardly, and expanding over flood‐prone areas. Urban growth has not adequately transformed potential production sectors in the hinterlands.3.
3 ADB, 2010; Unleashing Economic Growth: Region Based Urban Development Strategy for Nepal

| 4 |
These facts suggest the need for multiyear investments in environmental and urban physical/logistic infrastructures based on systemic access to long term financing.
2.2.2. Analysis of Infrastructure Financing Need The NUDS and Urban Infrastructure Financing Strategy (draft) are based on four premises; first that municipal infrastructure is best created locally as envisioned under the LSGA, second, the fiscal transfer system must be rational, predictable and untied so that municipalities can leverage capital grants with debt, third municipal own source revenues, such as Integrated Property Tax (IPT), must be modernized and simplified so that municipalities can capture the benefits of rising land values, and fourth enable TDF to evolve into a strong financial intermediary that functions as an open‐access criteria‐based lender for municipal infrastructure development. To move towards designing a financing system, rather than the current situation of financing projects, reforms in all the three components of the municipal financing system, namely the Own Source Revenue‐ OSR, the Inter Government Fiscal Transfer‐IGFT and the local borrowing framework are needed. The current municipal finance system operates under several operational and framework constraints. First, OSR has yet to establish billing systems and valuations that are updated regularly. These facts result in systemic inefficiency and an inability to judge standard performance measures/metrics such as tax base, tax rate, collection ratios and so forth. Second, various components of the capital grants are often tied to specific sectoral targets (Annual Road Fund), sometimes delayed. These characteristics add to unpredictability of municipal revenue streams and disincentives multi‐ year planning. Third, a clear borrowing framework is lacking, and municipalities have no access to debt on a repeated and demand driven basis. TDF was set up to provide long term finance for municipal infrastructure, but has limited capital, stressed loan assets, and low earnings. TDF functions more as an agent for on‐lending multilateral loans for pre‐selected municipalities and projects rather than a lender of significance ‐ accounting for less than 5% of the annual municipal capital spending. Hence the need for reforms on all three aspects, namely the OSR, Inter Government Fiscal Regulation ‐IGFR and the borrowing framework so that the National Urban Development Strategy could be implemented over the medium term. At present, the total number of municipalities accounts to 217 including 12 Sub‐Metropolitan and one Metropolitan city. The infrastructure status of these municipalities is pathetic; and this requires quick response from the government and TDF to create basic infrastructures in the newly constituted municipalities. Consequently, the future demand for adequate infrastructure and public services will be immense, particularly, as poverty increasingly displays urban characteristics and challenges all actors to improve the quality of life in poor urban communities. The Business Plan also analyses the borrowing capacity of the municipalities during 2008/09‐2010/11 and estimates total borrowing capacity4 of the 58 municipalities at
4 Measured in terms of debt servicing to be about 25 percent of net operating surplus of municipalities.

| 5 |
only Rs 795 million. Out of 58, only 24 municipalities had the capacity to borrow more than Rs 10 million.
2.2.3 Opportunities for Public Private Partnership Public Private Partnership (PPP) as an alternative approach of public procurement for the planning and implementation of physical infrastructure and services. TDF can structure PPP as a fee based activity, it does not appear necessary for standalone commercial complexes to be provided with scarce longer term finance which TDF has access to. In the medium run TDF might like to develop a PPP financing policy especially for real estate projects including Land Pooling projects. This refers to establishing a sound appraisal system with adequate contractual arrangements and security mechanisms to cover intrinsic risk of PPPs. Even more important is to build up awareness and know‐how about the managing of PPP contracts by the public authorities.5
2.3. Urban Infrastructure Finance in Federal Polity
Federal government can provide an environment to promote marketability of municipalities' financial resource mobilization from non‐government sources through (i) appropriate macroeconomic and regulatory policies – especially those which are conducive to the accumulation of resources to invest through long‐term savings pools ‐ to help municipalities have access to borrowing; and (ii) devolving sufficient powers to local government.
2.4. Functional Assignment in the Constitution
Nepal's new constitution describes the assignment of expenditure and revenue functions to the federal, provincial and local governments. The new federal Act will have a strong impact on how urban infrastructure could and should be financed in Nepal.
2.5. Urban Financing Framework
Urban infrastructure investments can be sustainably financed through a mix of local revenue, transfers from central and provincial levels of the government, borrowing from dedicated financial intermediaries like TDF, by forging partnership with private sector, NGOs and community organizations, and opting for commercial borrowing for financially viable projects. The infrastructure‐financing gap is less likely to be met with conventional sources of funding, nor could TDF at its current business policies and practices, meet the gap. While evolving TDF as the most responsible financial intermediary for financing urban infrastructure, enhancement of its institutional capacity through legal and regulatory reform and organizational restructuring is crucial. Exploring all other complementary and sustainable ways of financing for urban infrastructure along with enhancing the financial intermediary role of TDF is the strategic orientation of the municipal financing framework.
5 ADB, In the frame of the Institutional Development Component to TDF a concept for planning and implementing PPPs shall be elaborated and tested with TA support from ADB. For details see Chapter 3.8.

| 6 |
Chapter 3
3. KEY COMPONENT OF 4 YEAR BUSINESS PLAN
3.1. TDF Strategic Planning: Foundation for the proposed Business Plan
It is high time that TDF need to be transformed into a visible and sustainable Financial Intermediary Institution by implementing BRAP II (2016/17‐2019/20). BRAP II will focus on some crucial strategic actions, which help TDF to graduate towards its long cherished goal. TDF will approve and implement a time bound Business Plan (2016/17‐2019/20) with specific business targets, strategic action plans and institutional development package. Annual program and budget will be based on targets sent in the four year Business Plan.

| 7 |
Figure 1: Strategic Plan, Business Plan and Annual Plan
3.2. Rationale of the Proposed Business Plan
This business plan has major focus on transforming TDF into a full fledged urban financing intermediary. TDF's BRAP II will be a broad guiding framework, which is visionary, conceptual and directional. On the other hand, TDF's annual budget and program can be taken as an operational plan, which is a bundle of specific activities, budget line, timeline and responsibility allocation for individual fiscal year/s only, this is why, it has limited horizon. Hence, the proposed business plan will be the road map for TDF management for four years.
3.3. Methodology and Process This business plan came up through institutional analysis of TDF, analysis of borrowing capacity of municipalities (borrowers), SWOT analysis, analysis of funding

| 8 |
sources and recommendation of strategic action plans in logical framework. The projection of business scenario is based on the following components: a) Funding trend of the last 5 years b) Investment areas and disbursement trend of last 5 years c) Repayment/recovery trend of the last 5 years d) Assessment and extrapolation of investment of existing 217 municipalities in
coming 4 years now (investment need assessment) e) Projection/extrapolation of borrowing capacity of municipalities/towns f) Assessment of Financing Gap g) Demand for debt financing and possible debt financing through TDF h) TDF's capital restructuring i) Business targets (funding, disbursement, repayment, profitability,...)
3.4. Assessment of Municipal (borrower's) Revenue Base 3.4.1. Own Source Revenue‐ OSR
Main areas of OSR are taxes, service charges/fees, fines/penalties, rental income from municipal properties and other income. However, the municipalities have not been able to mobilize adequate OSR for meeting the ever‐increasing spending requirement, particularly in the infrastructure.
3.4.2. Inter Government Fiscal Transfers (IGFT) Average percentage of municipal IGFT to the GDP is 0.42 percent only. The Constitution of Nepal, 2072 embodies three tiers of government ‐ Federal, provincial and Local. The Constitution refers to spheres of competence as ‐ federal functions, provincial functions, local functions, and concurrent functions of federal and provincial governments, and concurrent functions of federal, provincial and local governments6. GON's initial vision of the country's intergovernmental transfer is laid down in the Constitution of Nepal, 2072 and Local Self‐Governance Act, 1999 (LSGA). The distribution of revenue between the federal, provincial and the local level entity shall be transparent7.
6 As functions have not been defined, the constitutional arrangement needs to be carefully detailed in order to avoid confusion, overlaps and duplication in the allocation of functions.
7 Clause 60, Constitution of Nepal, 2072

| 9 |
3.5. Investment Gap Analysis 3.5.2 Net Infrastructure Financing Requirement
The net financing requirement could be partly met through innovative and special financing vehicles. The investment requirement of TDF is calculated after making some assumptions about the contribution of those innovative financing vehicles for urban infrastructure.
Table: Infrastructure Financing Gap in 217 municipalities (NRs in billions)
Source and Use of Municipal Fund Base Year
Business Plan Period (FY)
Year I Year II Year III Year IV
2016/17 2017/18 2018/19 2019/20 2020/21
1) Own Source Revenue 9.49 10.55 11.74 13.08 15.13
2) Recurrent Expenditure 8.18 9.40 10.81 12.44 14.30
3) Previous Debt Services 0.11 0.19 0.20 0.30 0.34
4) Revenue Surplus (1‐2‐3) 1.20 0.96 0.72 0.34 0.48
5) Unconditional Grant (IGFT) 10.95 12.31 13.85 15.58 17.53
6) Revenue Sharing (IGFT) 1.48 1.67 1.90 2.16 2.47
7) Conditional Grant (IGFT) 9.82 10.10 10.39 10.68 13.51
8) Amount Available for Capital Investment (4+5+6+7)
23.45 25.04 26.86 28.77 34.00
Total Investment Need (Scenario 1: meeting 60% of physical target)
69.90 72.68 75.58 78.59 81.72
Total Investment Need (Scenario 1: meeting 75% of physical target)
87.37 90.85 94.47 98.24 102.15
Total Investment Need (Scenario 1: meeting 90% of physical target)
104.85 109.02 113.37 117.88 122.58
Financing
Revenue Surplus 1.20 0.96 0.72 0.34 0.48
Total IGFT 22.24 24.08 26.14 28.42 33.52
Market Borrowing (Capacity Constraints as 25% of Revenue Surplus)
0.30 0.24 0.18 0.09 0.12
Net Financing Requirement (Scenario 1) 46.15 47.40 48.54 49.74 47.60
Net Financing Requirement (Scenario 2) 63.63 65.57 67.44 69.38 68.03
Net Financing Requirement (Scenario 3) 81.10 83.74 86.33 89.03 88.46
Cost Sharing (3%) 1.38 1.42 1.46 1.49 1.43
PPP (3%) 1.38 1.42 1.46 1.49 1.43
PCP (included NGO) (2%) 0.92 0.95 0.97 0.99 0.95
TDF Financing Requirement (Scenario 1) 42.46 43.61 44.66 45.76 43.79
Cost Sharing (3%) 1.91 1.97 2.02 2.08 2.04
PPP (3%) 1.91 1.97 2.02 2.08 2.04
PCP (included NGO) (2%) 1.27 1.31 1.35 1.39 1.36
TDF Financing Requirement (Scenario 2) 58.54 60.33 62.04 63.83 62.59
Cost Sharing (3%) 4.05 4.19 4.32 4.45 4.42
PPP (3%) 2.43 2.51 2.59 2.67 2.65
PCP (included NGO) (2%) 1.62 1.67 1.73 1.78 1.77
TDF Financing Requirement (Scenario 3) 72.99 75.37 77.70 80.13 79.61
i) The projected financing gap has been arrived at by assuming 15% growth of recurrent expenditure, 16% growth of OSR, and 12.5% growth of IGFT based on estimated amount for 2015/16. Average recurrent expenditure growth of 35 municipalities (except Metro and Sub Metro) has been taken for the projection of recurrent expenditure of remaining all 170 municipalities (which is 15% and derived by adding up 3% to the 12% actual growth rate). Own Source Revenue assumed to be increased by 16% for old 58 municipalities but for the remaining new 159 municipalities, it is assumed to grow by 8% (half the rate of old municipalities) for first three years and then by 16% throughout the projection period..

| 10 |
ii) The Investment Need Target is set as 60% for scenario 1, 75% for scenario 2 & 90% for scenario 3 for 217 municipalities on the basis of amount estimated by NUDs for 58 municipalities
iii) Market Borrowing (Capacity Constraints) is considered as 25% of Revenue Surplus that means constraints of market borrowing with potential municipal revenue for capital investment
3.8. Key Issues, Challenges and Prospects : SWOT Analysis
TDF's key issues, challenges and prospects are analyzed using SWOT tool and key points of analysis are as given below:
3.8.1. Strengths
i. Twenty seven years of experience in urban infrastructure financing and having its
own ACT to make it an autonomous fund.
ii. Adoption of common loan and grant financing policy.
iii. Standard Operating Procedures (SoPs) and clearly defined job descriptions for all
departments, divisions and units in place at least for current level of functions.
iv. Market oriented remuneration and benefits have been provided for the contract
based experts and the long term benefit to permanent staffs has been
conceptualized.
v. Key Performance Indicators (KPIs) is introduced for performance orientation of
organization.
vi. New Employees' Service Conditions Bye‐Laws in place.
vii. Strong equity base (NRs 3 billion now).
viii. A systematic approach of clients credit worthiness assessment and project
appraisal on the basis of defined "Project Appraisal Manual' is under testing
phase.
ix. Increasing trend of revenue and profitability in last three years.
x. Wide scope of tasks provisioned through the Act and Regulation ‐ urban local
bodies (municipalities & urbanizing VDCs‐small towns), TDCs, corporations,
boards, authorities, NGOs, users committees related to urban development as its
clients; and all infrastructure development sectors provisioned under LSGA as the
sectors of financing.
xi. Provision in the act to raise fund through the government, international donors
and other national & international financial institutions.
xii. Provision of fund‐raising through the issue of shares, bonds, debentures, and also
through consortium and bridge financing approach.
3.8.2. Weaknesses
i. No legally defined equity structure and its long term vision.
ii. No clearly defined legal basis for financing to private sector under PPP approach.
iii. High turnover of experts and the staffs and thereby loss of institutional
memories & experiences; no institutional mechanism in place to retain the
memory.
| 11 |
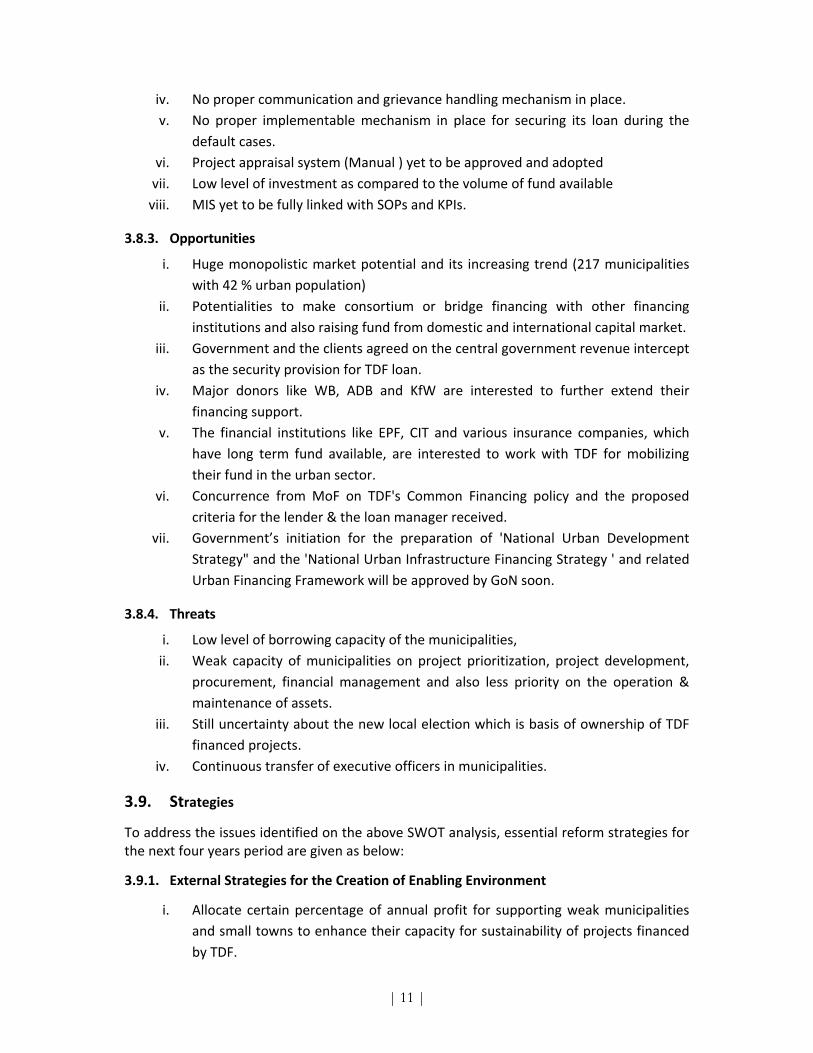
iv. No proper communication and grievance handling mechanism in place.
v. No proper implementable mechanism in place for securing its loan during the
default cases.
vi. Project appraisal system (Manual ) yet to be approved and adopted
vii. Low level of investment as compared to the volume of fund available
viii. MIS yet to be fully linked with SOPs and KPIs.
3.8.3. Opportunities
i. Huge monopolistic market potential and its increasing trend (217 municipalities
with 42 % urban population)
ii. Potentialities to make consortium or bridge financing with other financing
institutions and also raising fund from domestic and international capital market.
iii. Government and the clients agreed on the central government revenue intercept
as the security provision for TDF loan.
iv. Major donors like WB, ADB and KfW are interested to further extend their
financing support.
v. The financial institutions like EPF, CIT and various insurance companies, which
have long term fund available, are interested to work with TDF for mobilizing
their fund in the urban sector.
vi. Concurrence from MoF on TDF's Common Financing policy and the proposed
criteria for the lender & the loan manager received.
vii. Government’s initiation for the preparation of 'National Urban Development
Strategy" and the 'National Urban Infrastructure Financing Strategy ' and related
Urban Financing Framework will be approved by GoN soon.
3.8.4. Threats
i. Low level of borrowing capacity of the municipalities,
ii. Weak capacity of municipalities on project prioritization, project development,
procurement, financial management and also less priority on the operation &
maintenance of assets.
iii. Still uncertainty about the new local election which is basis of ownership of TDF
financed projects.
iv. Continuous transfer of executive officers in municipalities.
3.9. Strategies
To address the issues identified on the above SWOT analysis, essential reform strategies for the next four years period are given as below:
3.9.1. External Strategies for the Creation of Enabling Environment
i. Allocate certain percentage of annual profit for supporting weak municipalities
and small towns to enhance their capacity for sustainability of projects financed
by TDF.

| 12 |
ii. Work with government for the preparation of proposed 'National Urban
Development Strategy' and 'National Urban Infrastructure Financing Policy' for
Nepal.
iii. Work with government and donors for participation in PPP projects.
iv. Work together with Local Body Fiscal Commission to incorporated debt financing
criteria as an integral part of municipal finance system and MCPM.
v. Establish the information system about the borrowing capacity of all the
potential clients on annual basis.
vi. Work with the governments and the donors to include the technical assistance
packages, as an integral component of the loan investment, especially for the
financial reform and the service delivery improvement of the municipalities.
vii. Ensure the beneficiary/public commitment on the proposed tariffs, fees & taxes
before taking decision on any investment.
viii. Establish an open access ‐ criteria based fund in TDF (at least targeting for the
Business Plan period).
ix. Work together with the CIT, EPF and the insurance companies for mobilizing
their long term fund in urban infrastructure development.
x. As provisioned in the foreign aid policy of Nepal, work together with the
government and donors for establishing a pooled fund in TDF under a joint
framework agreement (JFA).
3.9.2. Internal Strategies for Institutional Development
i. Development and implement BRAP II along with Business Plan as essential
instruments for transforming TDF into Urban Financing Intermediary Institution.
ii. Approve and adopt the project appraisal manual 2017.
iii. Apply fully the TDF's Common Financing Policy and the criteria for TDF as a lender
and a loan manager during negotiation with new loans.
iv. Further enhance the system automation – i.e. integrate SOPs, KPIs and micro‐
banking system with MIS.
v. Fully adopt performance based monitoring system, SOPs and KPIs for all of the
business units and thereby link the performance based incentive mechanism.
vi. Make work‐out study of all the problematic projects & clients in a regular basis and
restructure or reschedule its loan installment payment as necessary.
vii. Develop TDF as a prudential financial institution by adopting internationally
standardized key financial indicators.
viii. Optimize the operational costs.
ix. Establish an appropriate communication and grievance handling system and
institutional mechanism.
x. Increase the equity capital of TDF (NRs 20 billion) by 4 years time frame.
xi. Apply the market based interest rates and initiate alternative ways of fund raising
like PPP and bond market along with some pilot projects.

| 13 |
3.9.1. Strategic Direction Realising only a long‐term perspective would enable TDF to justify needed and suggested changes in policies, procedures, organisation and institutional development, the outline of “Business Restructuring Action Plan –BRAP II of TDF" will be further developed (see annex I), approved and implemented to transform existing TDF into an Urban Development Bank/Urban Financing Intermediary Institution. Municipalities should be considered as long term partners and should include the component of technical assistance and capacity building while designing the project for them.
3.9.2 Capacity Development
Being the techno‐finance institution, the current organisation capacity of TDF is still weak and lacks the adequate expertise in technical as well as financial aspects to meet its objectives, mandates and also ever growing demand for debt financing.
TDF will further utilize inputs of senior professional staff such as urban planning expert, sanitation expert, construction management expert, contract management expert, fund management expert, banking expert, social scientists, and economists. In order to provide expert‐ advice to its clients on urban infrastructure planning, detail feasibility processes and relevant technical subjects and guide the consultants working for urban infrastructure development projects funded by TDF, it will have a pool of technical and financial experts on updated roster.
3.9.3. Organisation Structure
The existing organisation structure and the section’s functions will be further reviewed as per upcoming challenges and demands. TDF's regional offices will be opened in the provincial capitals/regions. The present structure will be restructured as per TDF's new transformation into Financial Intermediary Institution.
3.9.4 Performance Orientation Performance (KPI) based system for promotion will be followed up in the days to come. Each department/divisions and individuals will be performing to achieved the annual targets of agreed KPIs, which will be closely monitored on trimester basis and evaluated on yearly basis.
3.9.5. Reward Framework for Higher Results Reward (in the form of pay and benefits) will be a inbuilt tool for TDF to achieve the mandate through the development, recruitment and retention of the quality staff. To work well, staff will be given special coaching, mentoring, training and exposures to different working environment. Putting energy into creating and implementing a training and staff development strategy will set TDF aside as an excellent employer, committed to the development of staff.

| 14 |
Chapter 4
4. BUSINESS PLAN IN LOGICAL FRAMEWORK
4. Logical Framework
TDF's vision, mission, core values, goals, key results and action plan are framed as below:
4.1. Mission
TDF aims to alleviate economic and social poverty in urban sector through long term financing in social infrastructure and revenue generating projects.
4.2. Vision TDF envisions to be a leading financial intermediary institution for promoting the sustainable urban infrastructure financing in Nepal.
4.3. Goal
The specific goals of TDF are as below: Transform TDF into a visible and sustainable financial intermediary by 2020 Ensure replacement of donor based funding by extension of donor support prior
to 2018. Achieve target of NRs 25 billion of investment as on 2020.
4.4. Core Values of the TDF
Core values of the institution will be as following: Improving the living condition of people especially the poor through enhanced
debt financing for urban infrastructure development projects, Economic development of country through sustainable urban infrastructure
financing and
4.5. Key Result Areas –KRA and Action Plan To lead the organization towards it vision and achieve the goal, the following KRA, task and activities will be the determinants:
Table 5: Key Result Areas‐KRA, Tasks and Action Plan
Key Result Area‐KRA Result Indicators Activity/Action Timeframe Responsibility
1. TDF as a financial intermediary institution restructured and evolved
TDF Act drafted and approved by GoN
Bring TDF under the umbrella of MoF from MoUD
Draft special legislation for the operation of TDF as an autonomous institution
Get the new TDF act approved
Enact bylaws of financial procedures and business operations
July 2016 Aug 2016 Dec 2017 Dec 2017
MoUD, MoF, TDF TDF, MoF, Molly Legislative parliament TDF, MoF

| 15 |
Key Result Area‐KRA Result Indicators Activity/Action Timeframe Responsibility
2. TDF's capital base restructured
Consolidated existing sources of capital Increased capital to Rs 5 billion Increased capital to Rs 10 billion Increased capital to Rs 20 billion including by public share offerings Under Plan B: Total capital will be NRS 7 Billion by 4th year.
Conduct study of TDF's new capital structure
Agree on new capital structure with owners of equity and TDF Board
Approve the capital structure
July 2016 July 2017 July 2018
TDF TDF TDF TDF
3. Municipal/ Client's borrowing capacity assessment mechanism enhanced
Establish system for assessment of borrowing capacity of clients for entity financing
Frame work borrowing capacity assessment approved
Establish mechanism for updating of financing data of clients
Establish system for authentication of borrowing capacity assessment report
Feb 2017 March 2017 Dec 2017
4. Tariff system for municipal utilities designed and enhanced
Established a functional system for recommending/fixing tariff system at central/local level
Develop guidelines for setting tariff for municipal utilities/ sectors (water, waste management, sewerage...)
Establish legal/institutional mechanism for setting tariff
July 2017 Dec 2017
5. Appraisal system enhanced
Approved entity appraisal system/borrowing capacity assessment Approve project appraisal manual
Draft borrowing capacity assessment guidelines
Draft project appraisal manual
July 2017 July 2017
6. Financial operations of TDF strengthened
Enhance loan portfolio by raising disbursements 1.5 billing in FY 2017/18
Improved loan recovery (90% by 2018/19)
Open offices in provinces to widen financial services
Restructure staffing and develop specialized cadre in project appraisal
Establish EESCROW Accounts in selected projects
July 2018 July 2018 July 2017
TDF TDF TDF
7. Borrowing capacity of TDF strengthened
Enhanced borrowing capacity of TDF
Adopted borrowing tools
Maintained TDF balance sheet clean
Undertake credit rating of TDF
Strengthen staffing and business model
Innovate proper instruments for borrowing (bonds, certificates, etc.)
Approach international financial institutions for soft loans
July 2017 July 2017 July 2018 Dec 2017
TDF TDF MoF, TDF
| 16 |
Key Result Area‐KRA Result Indicators Activity/Action Timeframe Responsibility
8. New sectors identified and financed
Promoted PPP model of financing commercial projects
Get PPP law enacted Set proper operational
guidelines for PPP projects
Set proper operational guidelines for PCP
July 2017 Oct 2017 Oct 2017
TDF TDF, MoFALD
Promoted PCP model of financing community infrastructure projects
Develop cost recovery mechanism of PCP projects Enhance transparency through credible people's participation in projects
July 2017
TDF, MoF
Promoted Land Pooling Projects
Support to develop/finance at least 4 land pooling projects
2017‐2019 TDF/MoF/NPC
Joined consortium with other financial institutions for financing mega projects
Set proper rules and guidelines for consortium financing
Develop capacity for undertaking consortium projects
Get first right to loan recovery from sales of collateralized assets
July 2018 Jan 2019 July 2018
TDF, MoF TDF TDF, MoF
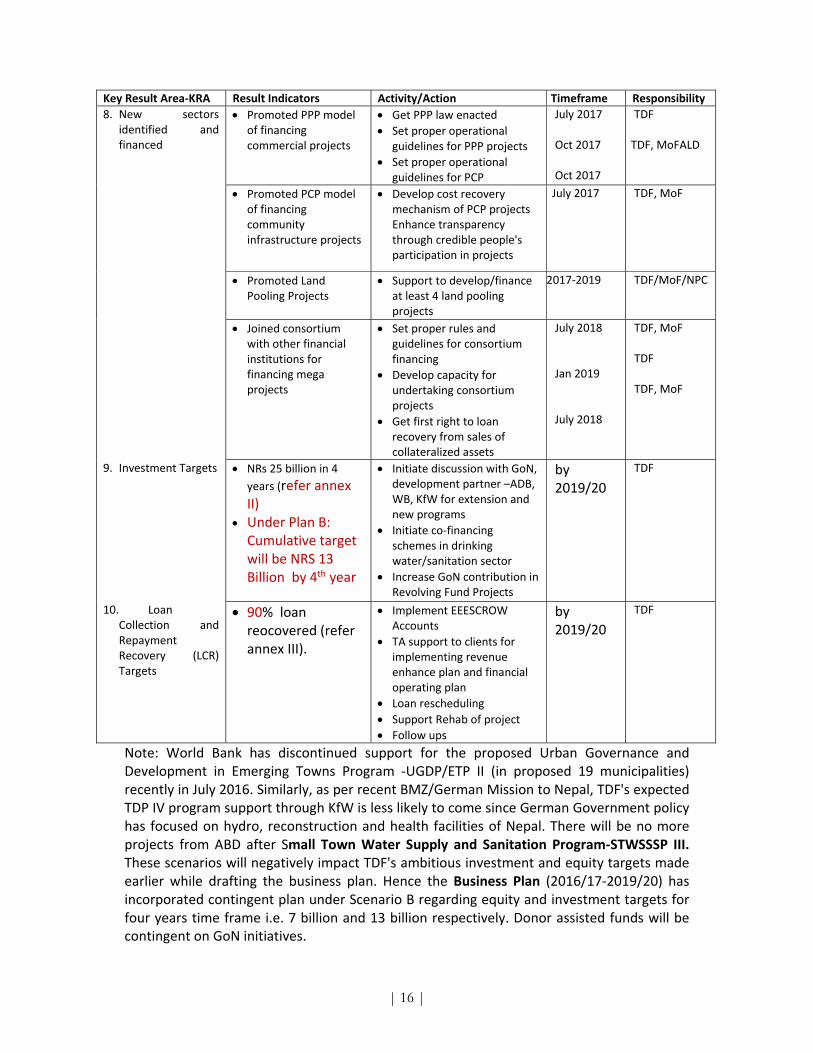
9. Investment Targets NRs 25 billion in 4 years (refer annex II)
Under Plan B: Cumulative target will be NRS 13 Billion by 4th year
Initiate discussion with GoN, development partner –ADB, WB, KfW for extension and new programs
Initiate co‐financing schemes in drinking water/sanitation sector
Increase GoN contribution in Revolving Fund Projects
by 2019/20
TDF
10. Loan Collection and Repayment Recovery (LCR) Targets
90% loan reocovered (refer annex III).
Implement EEESCROW Accounts
TA support to clients for implementing revenue enhance plan and financial operating plan
Loan rescheduling Support Rehab of project Follow ups
by 2019/20
TDF
Note: World Bank has discontinued support for the proposed Urban Governance and Development in Emerging Towns Program ‐UGDP/ETP II (in proposed 19 municipalities) recently in July 2016. Similarly, as per recent BMZ/German Mission to Nepal, TDF's expected TDP IV program support through KfW is less likely to come since German Government policy has focused on hydro, reconstruction and health facilities of Nepal. There will be no more projects from ABD after Small Town Water Supply and Sanitation Program‐STWSSSP III. These scenarios will negatively impact TDF's ambitious investment and equity targets made earlier while drafting the business plan. Hence the Business Plan (2016/17‐2019/20) has incorporated contingent plan under Scenario B regarding equity and investment targets for four years time frame i.e. 7 billion and 13 billion respectively. Donor assisted funds will be contingent on GoN initiatives.

| 17 |
4.8. Transformation of TDF into a strong Financial Intermediary
It is obvious that (i) existing banks and financial institutions can not cater the demand for large borrowings for infrastructure projects; (Ii) they can not serve investment demand in infrastructure projects of long term nature (25 years and of low rate of return (below the cost of capital); (iii) they cannot finance social infrastructure projects without supporting viability gap funding by other agencies like the government, municipality or the TDF; (iv) they are not interested in public sector or even PPP projects because of the political risk of the project; and (v) banks feel that financing municipal infrastructure projects incurs loan recovery hassles unlike for the private sector projects whose loan collateral could be captured and auctioned to recover the loan as per the law. There is a need that a full‐fledged financial law is enacted to operationalize TDF as a fully functioning financial intermediary. TDF, as a financial intermediary will be operated within a special Act formulated for municipal financing as the existing laws on banks and financial institutions will not serve the special purpose of this institution. The intermediary will have a strong capital base mostly owned by the government institutions and development partners. The intermediary will be a specialized agency to infrastructure financing and will co‐work with other financial institutions to finance large municipal infrastructure projects. The intermediary will be able to raise its equity capital through public offering of the shares up to 40 per cent and also would be enabled to raise fund from the capital market by issuing bonds and certificates of deposits for institutional savers. The intermediary will come under the umbrella of the ministry of finance to better coordinate international funding agencies and mobilize resources from the domestic capital market. TDF’s operational expenses (personnel cost of NPR 19.5 million i.e. 20%, office expenses NPR 11 million i.e. 11%) have tended to range around 31% of total income, and it would be necessary to rationalize some of these costs centres under operation. TDF's operating costs is higher mainly because it has to extend technical support to its clients.
4.9. Capital Structure Given the huge investment demand for urban infrastructure, the proposed financial intermediary will have to possess at least NRs 20 billion of capital at the beginning along with an equal amount of other sources of fund. The proposed capital structure will be as below:
Table 8: Proposed Capital Restructuring
Sources Capital in NRs Billion
TDF (Existing) 4.00GoN 9.00Donors/IFIs Others
5.00 2.00
Total 20.00

| 18 |
Annex I: Business Restructuring Plan –BRAP II (2016/17‐2019/20)
Rs in million
Outcome Area Key Activities/Tasks Time
Line
Total
2016/172017/182018/192019/20
Prepare and approve BRAP II Year I 0.50 0.50 Implement BRAP II Year I‐IV 0.50 2.00 3.00 3.50 9.00
Review of existing TDF Act 2053 and new Act drafted Year I 0.50 0.50
Draft new O&M study for federal and provincial levels, Year I 1.00 1.00
Design organizational structures for each levels, Year I 0.50 0.50
TDF Board restructured as per new provisions of the
revised TDF Act,
Year I 3.00 3.00
Draft concept of establishing new branch offices at
provincial/municipal/regional levels
Year I 0.30 0.30
Draft and approve National Urban Infrastructure
Financing Framework
Year I 5.50 5.50
Defined new capital structure Year I 0.50 0.50 1.00
Draft new Act of TDF as part of BRAP II Year I 0.80 0.80
Conduct studies on issue of fixed income security
(bonds),
Year I 0.30 0.50 0.50 1.00 2.30
Initiate internal and external audits for ISO
certification of TDF's business process
Year I 1.00 0.50 0.50 0.50 2.50
Initiate extension of output based financing in solid
waste management, water supply and other possible
areas based on pilot results (prepare framework for
extension...)
Year I 1.00 1.00
Prepare model appraisal for urban transport sector
projects and initiate financing urban transport project
Year I 0.50 0.50 1.00
14.60 5.30 4.00 5.00 28.90
Establish regional/provincial offices Year III 5.00 6.00 8.00 19.00
Hire/depute key staff in regional/provincial offices Year I 0.60 0.70 0.70 2.00
Hire/depute key positions at central office as per new
organogram
Year I ‐
Business Development Specialist (Engineer) # Year I 1.50 1.50 1.50 1.50 6.00
Planning, Monitoring and Evaluation Specialist for Hire/depute
Planning Monitoring and Evolution Expert (establishing
planning, accounting, budgeting, financial reporting and
internal controls systems)#
Year I 1.50 1.50 1.50 1.50 6.00
Fund Management Specialist # Year I 1.50 1.50 1.50 1.50 6.00
Municipal Water and Sanitation Special ist # Year I 1.50 1.50 1.50 1.50 6.00
Financial Management Specialist # Year I 1.50 1.50 1.50 1.50 6.00
Project Finance and Risk Management Specialist # Year I 1.50 1.50 1.50 1.50 6.00
Year I 9.00 14.60 15.70 17.70 57.00
Business Restructuring Plan (BRAP) II Preparation and Approval
TDF Restructured to
lead towards urban
development
bank/Urban Financial
Intermediary
Institution
Budget Plan in 4 years
Town Development Fund
New organizational set up
for TDF based on the
reviewed organogram
established and
operationalized
Sub Total
Sub Total
Administration and HR Management
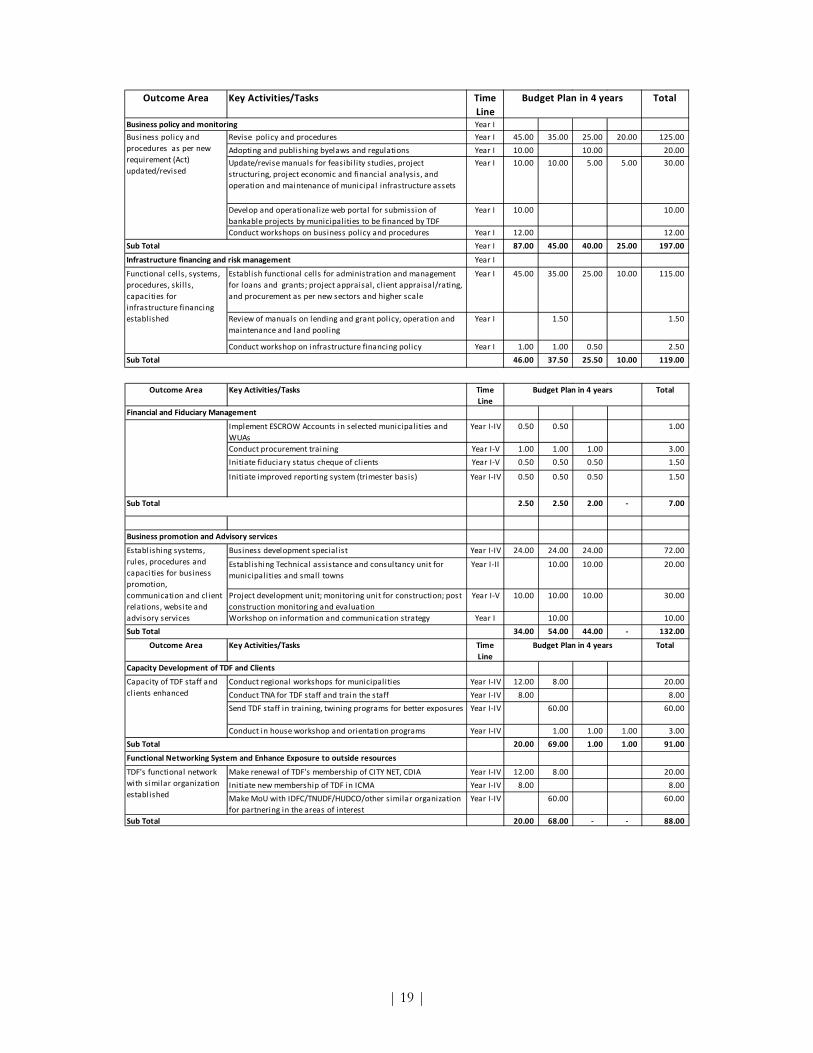
| 19 |
Outcome Area Key Activities/Tasks Time
Line
Total
Year I
Revise policy and procedures Year I 45.00 35.00 25.00 20.00 125.00
Adopting and publishing byelaws and regulations Year I 10.00 10.00 20.00
Update/revise manuals for feasibil ity studies, project
structuring, project economic and financial analysis, and
operation and maintenance of municipal infrastructure assets
Year I 10.00 10.00 5.00 5.00 30.00
Develop and operationalize web portal for submission of
bankable projects by municipalities to be financed by TDF
Year I 10.00 10.00
Conduct workshops on business policy and procedures Year I 12.00 12.00
Year I 87.00 45.00 40.00 25.00 197.00
Year I
Establish functional cells for administration and management
for loans and grants; project appraisal, client appraisal/rating,
and procurement as per new sectors and higher scale
Year I 45.00 35.00 25.00 10.00 115.00
Review of manuals on lending and grant policy, operation and
maintenance and land pooling
Year I 1.50 1.50
Conduct workshop on infrastructure financing policy Year I 1.00 1.00 0.50 2.50
46.00 37.50 25.50 10.00 119.00
Business policy and
procedures as per new
requirement (Act)
updated/revised
Functional cells, systems,
procedures, skil ls,
capacities for
infrastructure financing
established
Sub Total
Sub Total
Business policy and monitoring
Infrastructure financing and risk management
Budget Plan in 4 years
Outcome Area Key Activities/Tasks Time
Line
Total
Implement ESCROW Accounts in selected municipalities and
WUAs
Year I‐IV 0.50 0.50 1.00
Conduct procurement training Year I‐V 1.00 1.00 1.00 3.00
Initiate fiduciary status cheque of cl ients Year I‐V 0.50 0.50 0.50 1.50
Initiate improved reporting system (trimester basis) Year I‐IV 0.50 0.50 0.50 1.50
2.50 2.50 2.00 ‐ 7.00
Business development specialist Year I‐IV 24.00 24.00 24.00 72.00
Establishing Technical assistance and consultancy unit for
municipalities and small towns
Year I‐II 10.00 10.00 20.00
Project development unit; monitoring unit for construction; post
construction monitoring and evaluation
Year I‐V 10.00 10.00 10.00 30.00
Workshop on information and communication strategy Year I 10.00 10.00
34.00 54.00 44.00 ‐ 132.00
Outcome Area Key Activities/Tasks Time
Line
Total
Conduct regional workshops for municipalities Year I‐IV 12.00 8.00 20.00
Conduct TNA for TDF staff and train the staff Year I‐IV 8.00 8.00
Send TDF staff in training, twining programs for better exposures Year I‐IV 60.00 60.00
Conduct in house workshop and orientation programs Year I‐IV 1.00 1.00 1.00 3.00
20.00 69.00 1.00 1.00 91.00
Make renewal of TDF's membership of CITY NET, CDIA Year I‐IV 12.00 8.00 20.00
Initiate new membership of TDF in ICMA Year I‐IV 8.00 8.00
Make MoU with IDFC/TNUDF/HUDCO/other similar organization
for partnering in the areas of interest
Year I‐IV 60.00 60.00
20.00 68.00 ‐ ‐ 88.00
Budget Plan in 4 years
Sub Total
TDF's functional network
with similar organization
established
Sub Total
Capacity of TDF staff and
clients enhanced
Business promotion and Advisory services
Capacity Development of TDF and Clients
Functional Networking System and Enhance Exposure to outside resources
Sub Total
Financial and Fiduciary Management
Establishing systems,
rules, procedures and
capacities for business
promotion,
communication and cl ient
relations, website and
advisory services
Budget Plan in 4 years
Sub Total
| 20 |
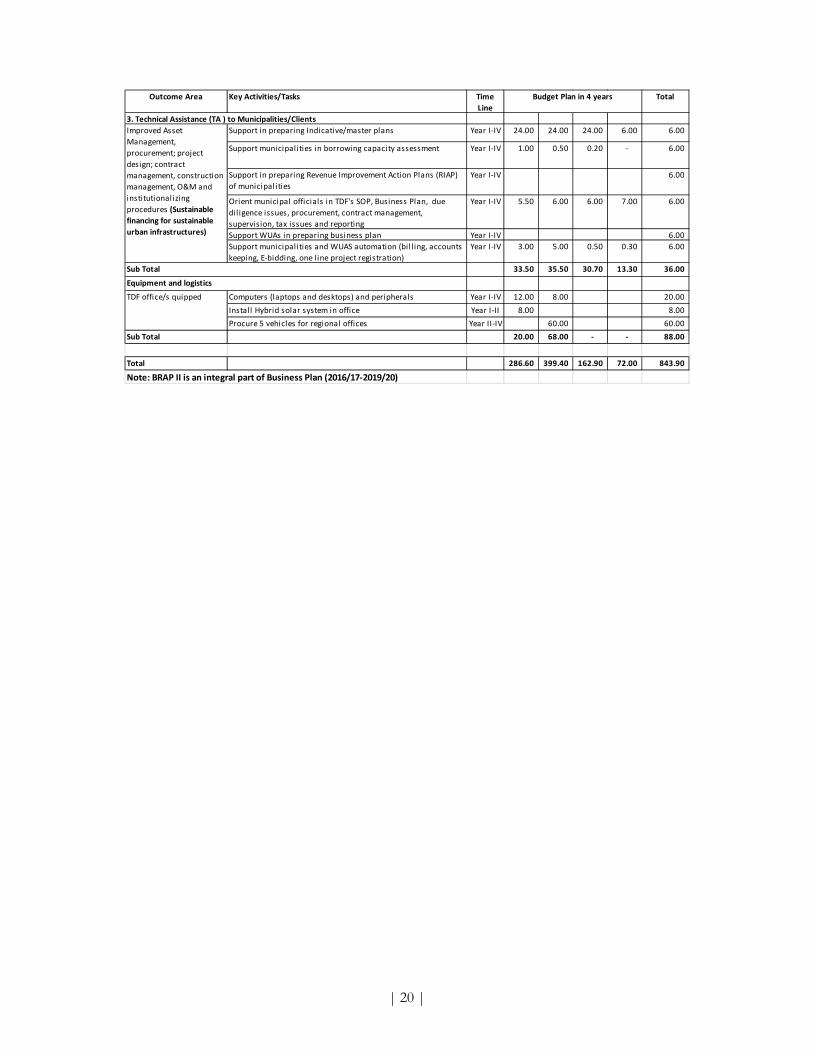
Outcome Area Key Activities/Tasks Time
Line
Total
Support in preparing Indicative/master plans Year I‐IV 24.00 24.00 24.00 6.00 6.00
Support municipalities in borrowing capacity assessment Year I‐IV 1.00 0.50 0.20 ‐ 6.00
Support in preparing Revenue Improvement Action Plans (RIAP)
of municipalities
Year I‐IV 6.00
Orient municipal officials in TDF's SOP, Business Plan, due
diligence issues, procurement, contract management,
supervision, tax issues and reporting
Year I‐IV 5.50 6.00 6.00 7.00 6.00
Support WUAs in preparing business plan Year I‐IV 6.00
Support municipalities and WUAS automation (bil l ing, accounts
keeping, E‐bidding, one l ine project registration)
Year I‐IV 3.00 5.00 0.50 0.30 6.00
33.50 35.50 30.70 13.30 36.00
Computers (laptops and desktops) and peripherals Year I‐IV 12.00 8.00 20.00
Install Hybrid solar system in office Year I‐II 8.00 8.00
Procure 5 vehicles for regional offices Year II‐IV 60.00 60.00
Sub Total 20.00 68.00 ‐ ‐ 88.00
Total 286.60 399.40 162.90 72.00 843.90
Note: BRAP II is an integral part of Business Plan (2016/17‐2019/20)
TDF office/s quipped
Equipment and logistics
Sub Total
Improved Asset
Management,
procurement; project
design; contract
management, construction
management, O&M and
institutionalizing
procedures (Sustainable
financing for sustainable
urban infrastructures)
3. Technical Assistance (TA ) to Municipalities/Clients
Budget Plan in 4 years

| 21 |
Annex II: Investment Plan (2016/17‐2019/20)
USD NRs
Total of
Based Year
Total of
Year I
Total of
Year II
Total of
Year III
Total of
Year IV
Loan
(KFW) ‐ ‐ 628.13 420.00 352.00 467.00 211.00 1,030.00 1,030.00
Grant
(KFW) ‐ 141.88 84.15 40.74 32.40 26.49 3.20 ‐ 62.09 62.09
Service
Charge ‐ ‐ 6.73 3.26 2.59 2.12 0.26 4.97 4.97
Grant with
service
Charge
‐ ‐ 90.88 44.00 34.99 28.61 3.46 ‐ 67.06 67.06
MF Grant
(GoN) ‐ ‐ 125.63 22.60 59.41 35.03 15.83 110.26 110.26
Sub Total
Sub‐total
KFW &
GoN
(L/SL/G)
‐ ‐ ‐ 844.64 486.60 446.40 530.63 230.28 ‐ 1,207.32 1,207.32
DHP(KfW)‐
Grant‐
constructio
n
8.70 34.00 46.00 80.00 80.00
DHP(KfW)‐
Grant‐Study‐
supervision
2.72 3.68 6.40 6.40
DHP(KfW)‐
service
Charge
1.30 2.11 2.85 4.96 4.96
Sub Total ‐
DHP 10.00 38.83 52.53 91.36 91.36
Gon/MG‐
Suprvsion 10.00 13.50 20.25 27.00 33.75 94.50 94.50
Gon/MG 100.00 125.00 187.50 250.00 312.50 562.50 875.00
TDP(Revolvi
ng Fund) 80.00 100.00 150.00 200.00 250.00 450.00 700.00
190.00 238.50 357.75 477.00 596.25 1,107.00 1,669.50
Loan (IDA) 368.98 0.61 308.01 130.30 96.56 218.47 114.97 430.00 430.00
Grant
(IDA)/GoN 371.15 1.76 195.62 390.01 268.54 490.84 261.61 1,021.00 1,021.00
Sub‐total
Grant: IDA
& GoN
‐ 371.15 1.76 195.62 390.01 268.54 490.84 261.61 ‐ 1,021.00 1,021.00
Sub Total ‐ 740.13 2.37 503.63 520.31 365.10 709.32 376.58 ‐ 1,451.00 1,451.00
GPOBA
(WB) ‐ Grant
Grant
(IDA/GPO
BA)
4.28 428.00 30‐Jun‐17 4.07 406.60 89.65 136.01 102.36 84.93 62.66 385.95 385.95
Sub Total 4.28 428.00 4.07 406.60 89.65 136.01 102.36 84.93 62.66 385.95 385.95
STIUEIP
(ADB) ‐ Loan
Loan
(ADB) 8.70 870.00 4.82 482.06 320.20 308.54 424.14 338.72 65.91 1,137.31 1,137.31
Sub Total 8.70 870.00 ‐ 4.82 482.06 320.20 308.54 424.14 338.72 65.91 1,137.31 1,137.31
IUDP (ADB) ‐
Loan
Loan
(ADB) 8.59 859.40 7.27 726.69 355.07 300.00 336.78 355.07 249.83 1,241.68 1,241.68
Sub Total 8.59 859.40 ‐ 7.27 726.69 355.07 300.00 336.78 355.07 249.83 1,241.68 1,241.68
STWSSSP II
(ADB) ‐ Loan
Loan
(ADB) 17.00 1,700.00 30‐Sep‐15 2.43 242.62 86.67 783.50 453.06 80.29 6.20 1,323.05 1,323.05
Sub Total 17.00 1,700.00 2.43 242.62 86.67 783.50 453.06 80.29 6.20 1,323.05 1,323.05
STWSSSP III
(ADB) ‐Loan‐ ADB 18.00 1,800.00 31‐Jan‐21 17.86 1,785.96 425.17 500.00 550.00 250.00 100.00 1,400.00 1,400.00
Sub Total 18.00 1,800.00 17.86 1,785.96 425.17 500.00 550.00 250.00 100.00 1,400.00 1,400.00
Loan
(ADB/GEF) 3.04 304.00 3.04 273.60 40.00 52.00 100.00 152.00 304.00 304.00
Grant
(ADB/GEF) 0.76 76.00 0.76 68.40 ‐ 20.00 25.00 31.00 ‐ 76.00 76.00
Sub Total 3.80 380.00 3.80 342.00 40.00 72.00 125.00 183.00 ‐ 380.00 380.00
60.37 6,777.53 42.60 5,334.20 2,523.67 3,188.88 3,641.57 2,375.87 1,080.85 9,724.67 10,287.17
UGDP/ETP
(WB)Jul‐16
KSUTP (ADB)
‐ Grant
Total oF Agreed
2073/74
(2016‐17)
2074/75
(2017‐18)
2075/76
(2018‐19)
2076/77
(2019‐20) Grand
Total for
Four
Years
TDPII/TDPIII
(KFW) ‐
Grant
Dec‐17
Ongoing Programmes: Business Plan Targets (in NRs Million)
Donor/programme
Name
Total Fund
Available
(Committed ) Project
Phase out
Date
Actual Potential
Investment
(Fund Balance) as of
Plan for Disbursement Targtes in 4 fiscal years (NRs in Millions)
Remarks
USD NRs
2072/73

| 22 |
USD NRs
Total of
Based Year
Total of
Year I
Total of
Year II
Total of
Year III
Total of
Year IV
‐
STWSSSP ‐TA‐I 198.30 46.00 115.00 69.00 230.00 230.00
Cofinanacin
g
Loan
(ADB) 800.00 80,000.00 500.00 1,000.00 3,500.00 5,000.00 10,000.00 10,000.00
Grant
(GoN) 10.00 1,000.00 100.00 200.00 700.00 1,000.00 2,000.00 2,000.00
Sub Total 810.00 81,000.00 ‐ ‐ ‐ ‐ 600.00 1,200.00 4,200.00 6,000.00 12,000.00 12,000.00
GPOBA
(WB) ‐ Grant
Grant
(IDA/GPO
BA)
10.00 1,000.00 ‐ 250.00 300.00 550.00 550.00
Sub Total 10.00 1,000.00 ‐ ‐ ‐ ‐ ‐ ‐ 250.00 300.00 550.00 550.00
Loan 15.00 185 370 370 925.93 925.93
Grant 100.00 14.81 29.63 29.63 74.07 74.07
Sub‐Total
(KFW) 115.00 200.00 400.00 400.00 1,000.00 1,000.00
MF Grant
(GoN) 200.00 30.00 60.00 60.00 150.00 150.00
Loan (IDA) 500.00 125.00 375.00 500.00 500.00
Grant
(IDA) 300.00 75.00 225.00 300.00 300.00
Grant
(GoN) 200.00 50.00 150.00 200.00 200.00
Sub‐total
Grant: IDA
& GoN
‐ 500.00 ‐ ‐ ‐ ‐ ‐ 250.00 750.00 1,000.00 1,000.00
‐ ‐
Loan 3.00 300.00 75.00 75.00 75.00
Sub Total
new 3.00 300.00 ‐ ‐ 198.30 646.00 1,515.00 5,169.00 7,450.00 14,780.00 14,780.00
Grand Total 870.37 87,777.53 ‐ 42.60 5,334.20 2,721.97 3,834.88 5,156.57 7,544.87 8,530.85 24,504.67 25,067.17
Grand
Total for
Four Years
Actual Potential
Investment
(Fund Balance) as of
Plan for Disbursement Targtes in 4 fiscal years (NRs in Millions)
Remarks
USD NRs
2072/732073/74
(2016‐17)
2074/75
(2017‐18)
2075/76
(2018‐19)
2076/77
(2019‐20)
TDP IV
(KfW)
UGDP II
(WB)Jul‐16
Fixed Income Security (Project
Proposed ProjectS (New
Donor/programme
Name
Total Fund Available
(Committed )
Project
Phase out
Date
Contingent plan B: Total investment by the end of business plan = NRS. 13 billion
Particulars Base year (2072/73) Year 1 Year 2 Year 3 Year 4
TDF (as per existing trend) NRs billion (cumulative) 3.5 4.5 8.5 13.0

| 23 |
Annex III: Loan Recovery Plan (2016/17‐2019/20)
SN Projects 2016‐2017 2017‐2018 2018‐2019 2019‐2020
KFw II
1 Principal 23.34 23.34 30.96 41.08
Interest 21.68 28.71 35.40 38.31
2 KfW III
Principal 36.80 56.26 65.05 65.05
Interest 29.36 45.22 58.83 62.24
3 KfW IV
Principal ‐ ‐ 6.17 46.96
Interest ‐ 5.41 18.53 43.63
4 STWSSSP I
Principal 54.41 54.41 54.41 54.41
Interest 37.13 33.32 29.52 25.71
5 STWSSSP II
Principal ‐ ‐ 229.14 247.15
Interest 114.35 151.81 173.66 161.32
6 STWSSSP III
Principal ‐ ‐ ‐ 115.58
Interest 25.24 52.63 76.01 88.93
7 Co‐financing STWSSSP IV
Principal ‐ ‐ ‐ ‐
Interest 11.25 48.06 156.72 373.30
8 UEIP
Principal 14.04 14.04 14.04 14.04
Interest 10.27 9.21 8.16 7.11
9 STIUEIP
Principal ‐ ‐ ‐ 58.66
Interest 50.94 71.51 94.38 109.89
10 IUDP
Principal ‐ ‐ ‐ 71.81
Interest 19.80 23.57 42.00 68.66
11 KSUTP
Principal ‐ ‐ 66.80 66.80
Interest 1.17 4.85 11.70 15.87
12 UGDP/ETP
Principal ‐ ‐ ‐ 38.20
Interest 9.33 10.21 19.32 23.44
13 UGDP IIPrincipal ‐ ‐ ‐ ‐ Interest ‐ ‐ 5.63 29.66
14 STWSSSP I ‐ TA Principal 9.47 13.30 22.89 28.64 Interest 9.61 16.15 22.17 23.27
15 GON/RF ‐ ‐ ‐ 2.941176471Principal 5.69 14.03 26.53 43.19 Interest 9.06 18.41 31.09 44.10 Total Repayment from Client (Principal Receivable)Principal 52.54 64.70 396.52 772.12 Interest 282.70 440.53 694.74 1,027.49 Total Receivable 335.23 505.23 1,091.26 1,799.61 Expected to RecoveryPrinciapl 47.28 58.23 356.87 694.91 Interest 254.43 396.48 625.27 924.74 Total Recovery 301.71 454.71 982.13 1,619.64 Recovry % 90.00% 90.00% 90.00% 90.00%

| 24 |
Annex IV: TDF's Capital Restructure Plan (2016/17‐2019/20)
Particulars Base year (2072/73) Year 1 Year 2 Year 3 Year 4
TDF (as per existing trend) 3.0
3.2
3.5 3.7
4.0
GoN ‐
2.0
4.0 6.5
9.0
Donors/IFIs ‐
1.5
2.5 3.5
5.0
Others/Province/municipalities ‐
0.5
1.0 1.5
2.0
Total
3.0
7.2
11.0 15.2
20.0
140% 53% 38% 32%
Contingent plan:
Plan B: Total Equity =NRs 7 billion Note: This business plan will be reviewed as and when found necessary as per changed scenario.


