Download - Financial Check Up

Financial Check Up
John B. Penson, Jr.Regents Professor and
Stiles Professor of AgricultureTexas A&M University

Seen the Doc Lately? Benefits from an
annual financialfinancial checkup.
Treadmill stress test your financialfinancial strength.
Get your visionvision examined.

What is the status of your…. Liquidity? Solvency? Profitability? Efficiency? Debt
repayment capacity?
Survivability?
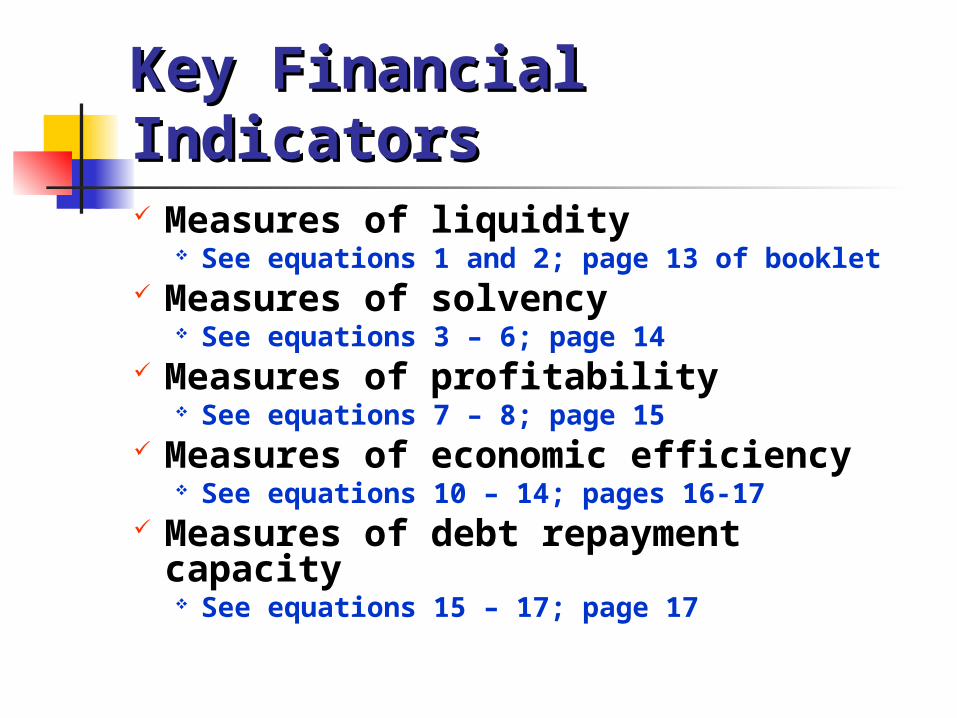
Key Financial IndicatorsKey Financial Indicators Measures of liquidity
See equations 1 and 2; page 13 of booklet Measures of solvency
See equations 3 – 6; page 14 Measures of profitability
See equations 7 – 8; page 15 Measures of economic efficiency
See equations 10 – 14; pages 16-17 Measures of debt repayment
capacity See equations 15 – 17; page 17
Measures of Liquidity
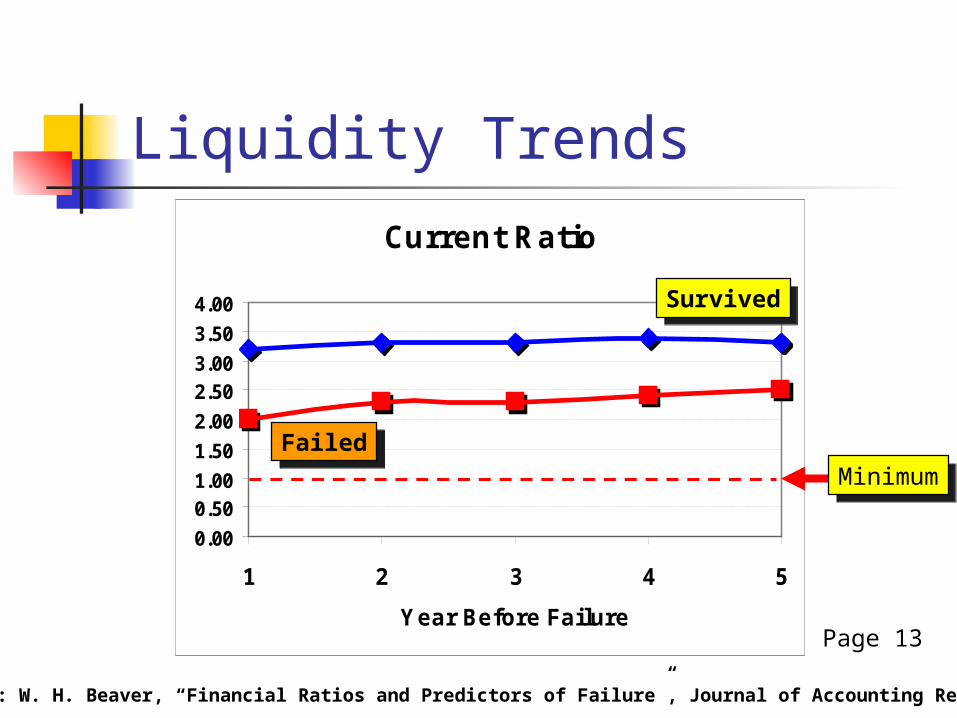
1. Current ratioCurrent ratio:• Current assets divided by current liabilities.• Demonstrates ability to cover scheduled current liabilities for the coming year out current assets and still have “cash” left over.• Should exceed 1.0exceed 1.0 to be technically liquid.• Some firms fail despite exceeding this hurdle.
Measures of Liquidity
1. Current ratioCurrent ratio:• Current assets divided by current liabilities.• Demonstrates ability to cover scheduled current liabilities for the coming year out current assets and still have “cash” left over.• Should exceed 1.0exceed 1.0 to be technically liquid.• Some firms fail despite exceeding this hurdle.
2. Working capitalWorking capital:• Current assets minus current liabilities.• Expresses liquidity in dollars rather than ratio.• Should be positive.• Cash is King!Cash is King!
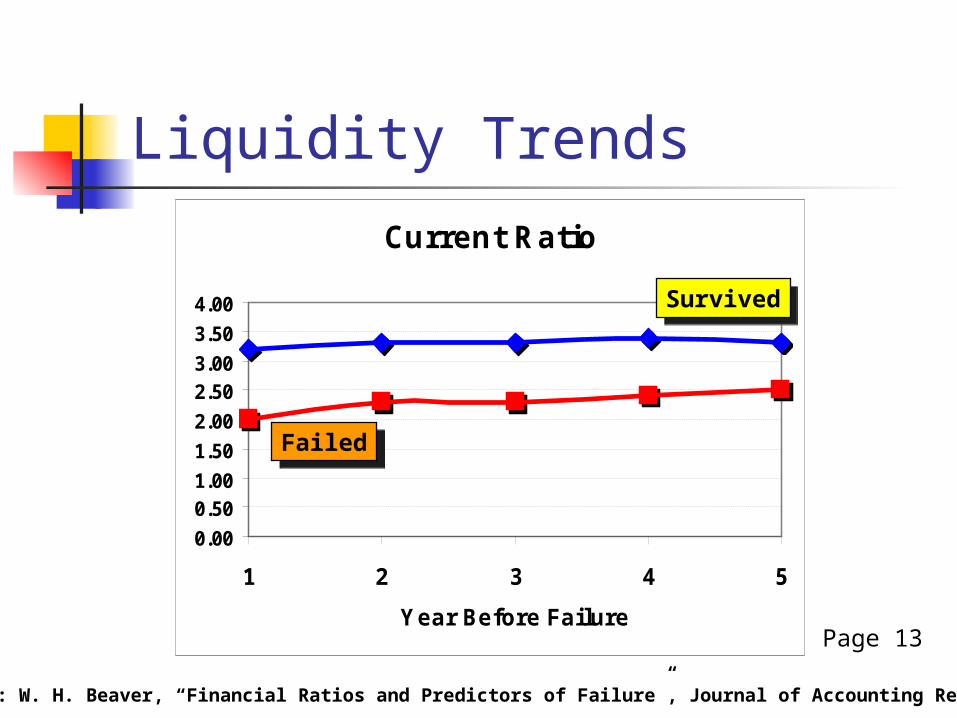
Liquidity TrendsCurrent Ratio
0.00
0.501.00
1.50
2.00
2.503.00
3.50
4.00
1 2 3 4 5
Year Before Failure
SurvivedSurvived
FailedFailed
Source: W. H. Beaver, “Financial Ratios and Predictors of Failure”, Journal of Accounting Research
Page 13
Liquidity TrendsCurrent Ratio
0.00
0.501.00
1.50
2.00
2.503.00
3.50
4.00
1 2 3 4 5
Year Before Failure
SurvivedSurvived
FailedFailed
MinimumMinimum
Source: W. H. Beaver, “Financial Ratios and Predictors of Failure”, Journal of Accounting Research
Page 13

Liquidity Trends
Working Capital-to-Total Assets
0.000.050.100.150.200.250.300.350.400.45
1 2 3 4 5
Year Before Failure
SurvivedSurvived
FailedFailed
Source: W. H. Beaver, “Financial Ratios and Predictors of Failure”, Journal of Accounting Research
Desired level varies by type of firm
Desired level varies by type of firm
Page 14
Measures of Solvency
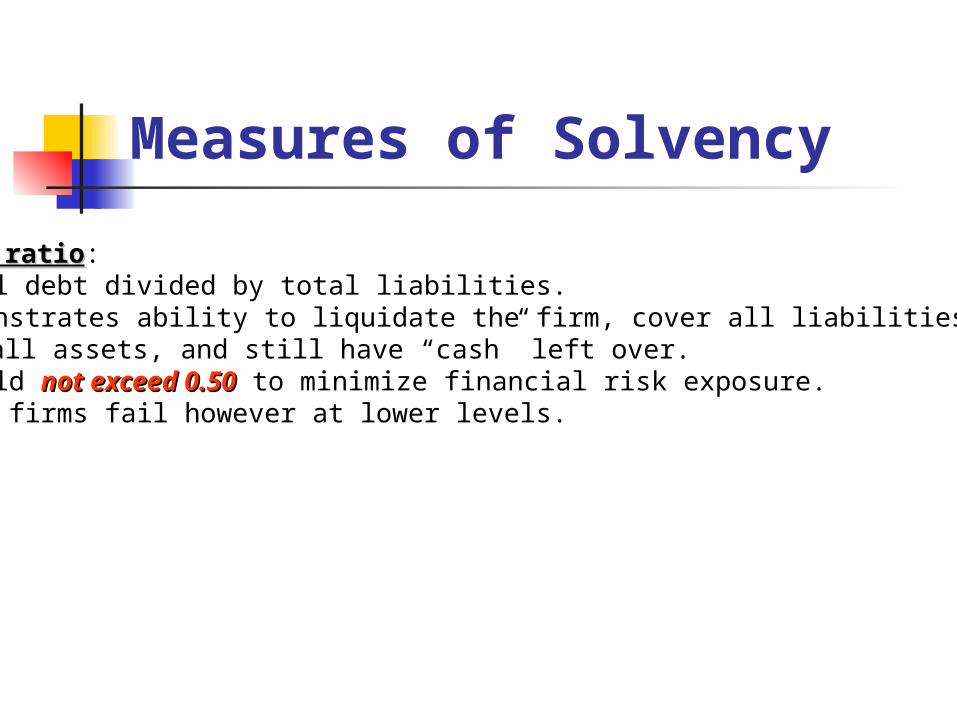
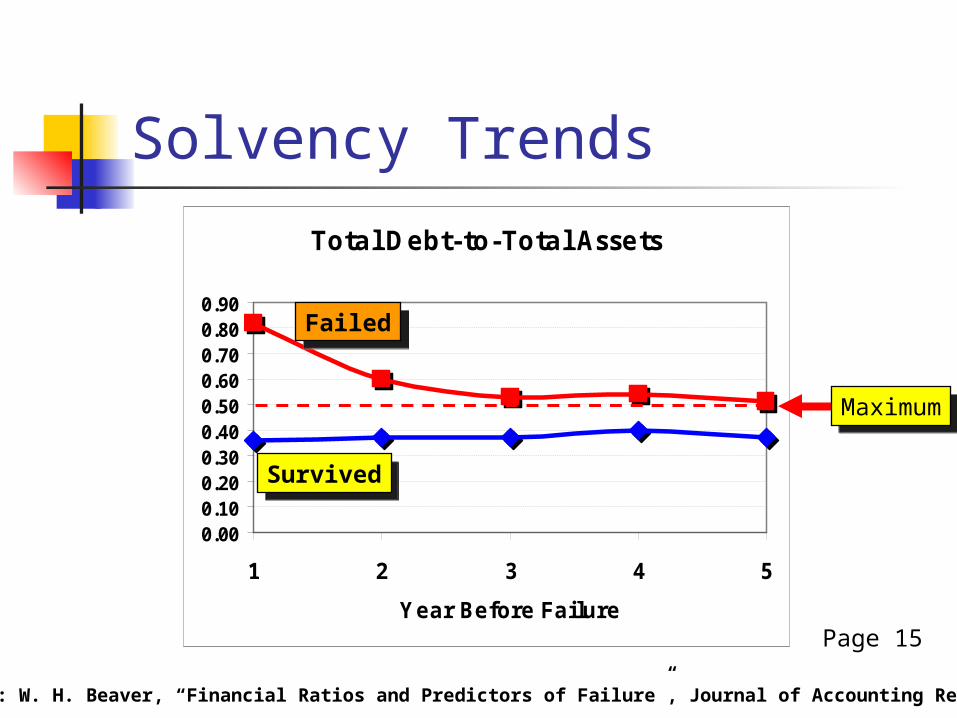
1. Debt ratioDebt ratio:• Total debt divided by total liabilities.• Demonstrates ability to liquidate the firm, cover all liabilities out of all assets, and still have “cash” left over.• Should not exceed 0.50not exceed 0.50 to minimize financial risk exposure.• Some firms fail however at lower levels.

Measures of Solvency
1. Debt ratioDebt ratio:• Total debt divided by total liabilities.• Demonstrates ability to liquidate the firm, cover all liabilities out of all assets, and still have “cash” left over.• Should not exceed 0.50not exceed 0.50 to minimize financial risk exposure.• Some firms fail however at lower levels.
2. Leverage ratioLeverage ratio:• Total debt divided by equity or net worth.• Often a credit standard in loan approval decisions.• Should not exceed 1.0not exceed 1.0 to minimize financial risk exposure.• Effects of rising interest rates.

Solvency Trends
Total Debt-to-Total Assets
0.000.100.200.300.400.500.600.700.800.90
1 2 3 4 5
Year Before Failure
SurvivedSurvived
FailedFailed
Source: W. H. Beaver, “Financial Ratios and Predictors of Failure”, Journal of Accounting Research
Page 15
Solvency Trends
Total Debt-to-Total Assets
0.000.100.200.300.400.500.600.700.800.90
1 2 3 4 5
Year Before Failure
SurvivedSurvived
FailedFailed
MaximumMaximum
Source: W. H. Beaver, “Financial Ratios and Predictors of Failure”, Journal of Accounting Research
Page 15
Measures of Profitability
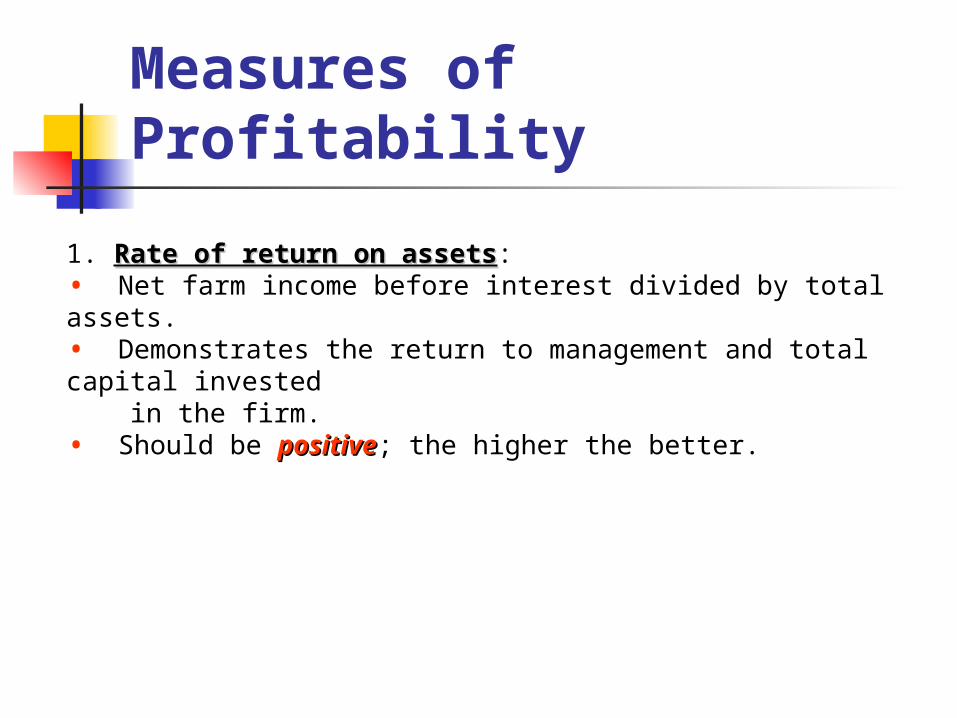
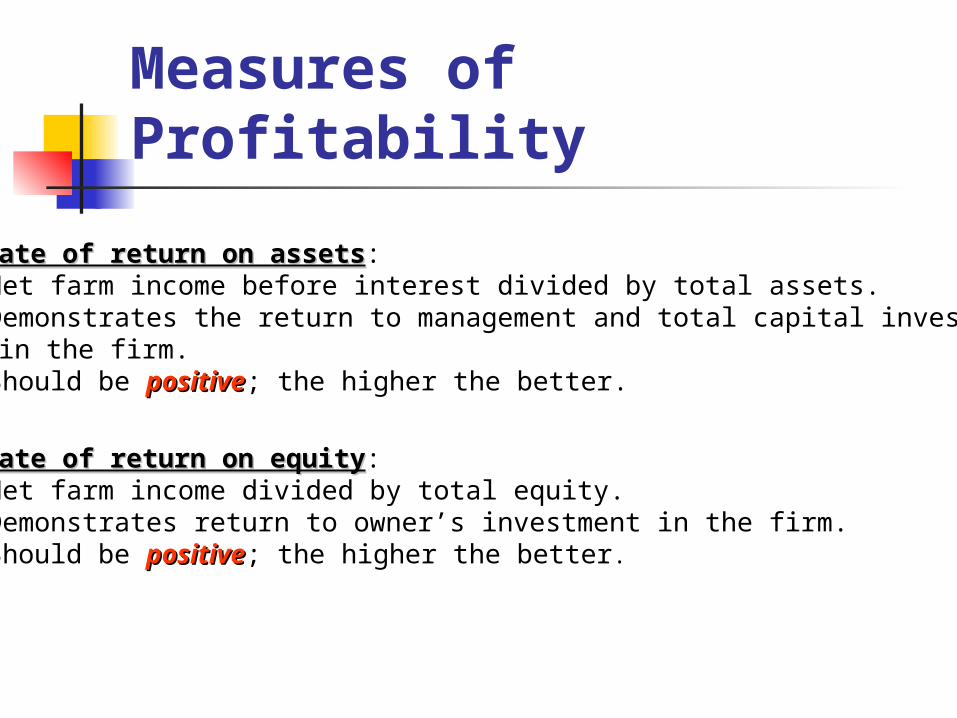
1. Rate of return on assetsRate of return on assets:• Net farm income before interest divided by total assets.• Demonstrates the return to management and total capital invested in the firm. • Should be positivepositive; the higher the better.
Measures of Profitability
1. Rate of return on assetsRate of return on assets:• Net farm income before interest divided by total assets.• Demonstrates the return to management and total capital invested in the firm. • Should be positivepositive; the higher the better.
2. Rate of return on equityRate of return on equity:• Net farm income divided by total equity.• Demonstrates return to owner’s investment in the firm.• Should be positivepositive; the higher the better.
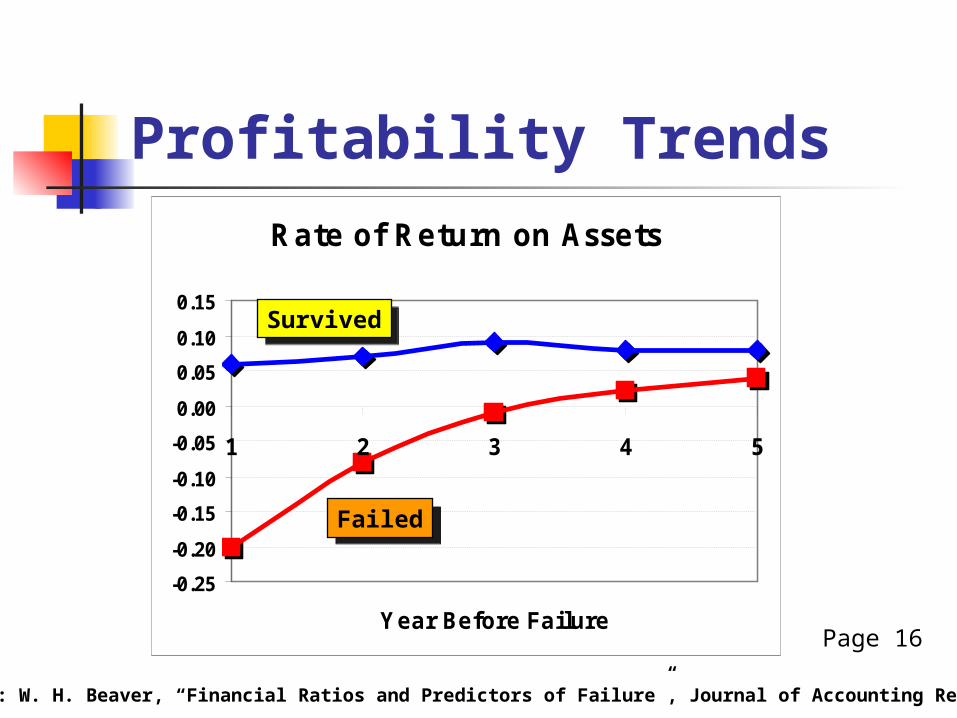
Profitability TrendsRate of Return on Assets
-0.25
-0.20
-0.15
-0.10
-0.05
0.00
0.05
0.10
0.15
1 2 3 4 5
Year Before Failure
SurvivedSurvived
FailedFailed
Source: W. H. Beaver, “Financial Ratios and Predictors of Failure”, Journal of Accounting Research
Page 16
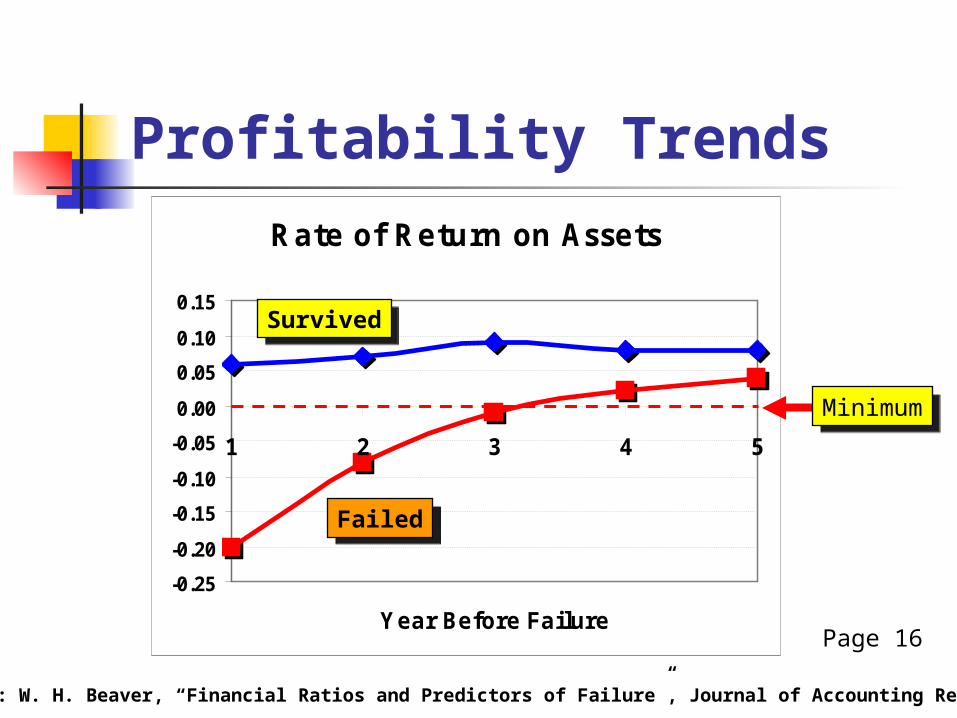
Profitability TrendsRate of Return on Assets
-0.25
-0.20
-0.15
-0.10
-0.05
0.00
0.05
0.10
0.15
1 2 3 4 5
Year Before Failure
SurvivedSurvived
FailedFailed
MinimumMinimum
Source: W. H. Beaver, “Financial Ratios and Predictors of Failure”, Journal of Accounting Research
Page 16
Measure of Debt Repayment Capacity
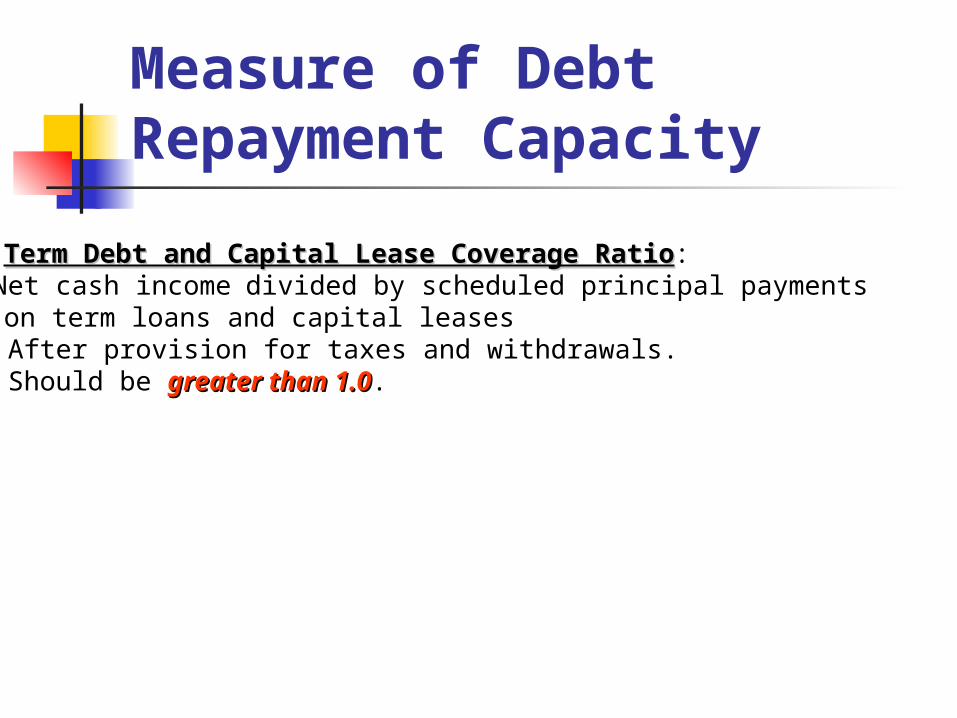
1. Term Debt and Capital Lease Coverage RatioTerm Debt and Capital Lease Coverage Ratio:• Net cash income divided by scheduled principal payments on term loans and capital leases• After provision for taxes and withdrawals. • Should be greater than 1.0greater than 1.0.
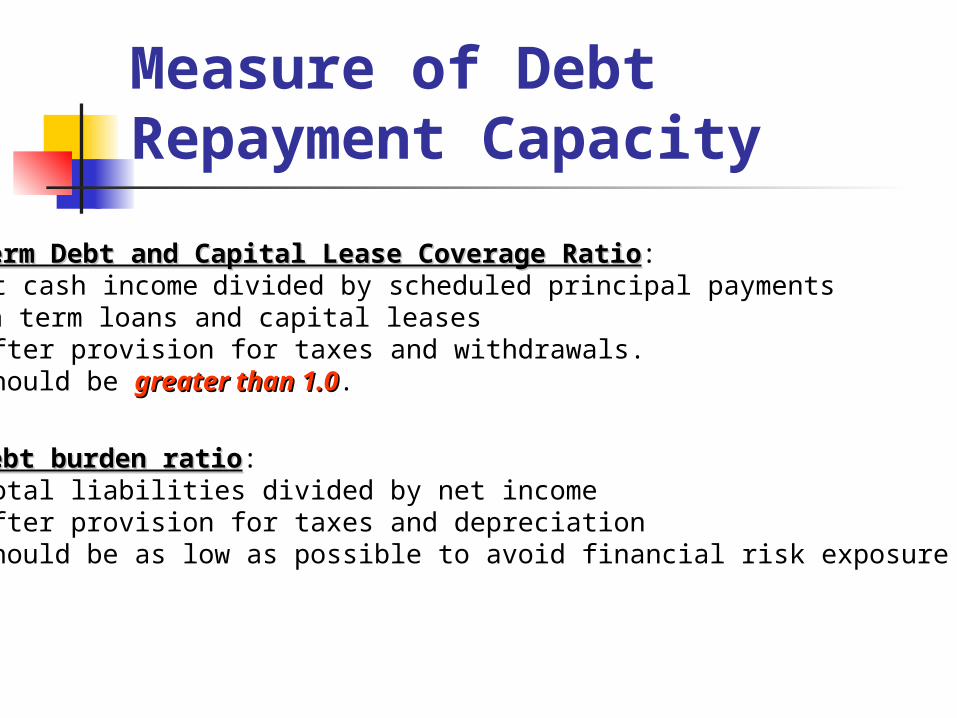
Measure of Debt Repayment Capacity
1. Term Debt and Capital Lease Coverage RatioTerm Debt and Capital Lease Coverage Ratio:• Net cash income divided by scheduled principal payments on term loans and capital leases• After provision for taxes and withdrawals. • Should be greater than 1.0greater than 1.0.
2. Debt burden ratioDebt burden ratio:• Total liabilities divided by net income• After provision for taxes and depreciation• Should be as low as possible to avoid financial risk exposure

Debt Repayment Capacity
Net Cash Income-to-Total Debt
-0.30
-0.20
-0.10
0.00
0.10
0.20
0.30
0.40
0.50
0.60
1 2 3 4 5
Year Before Failure
SurvivedSurvived
FailedFailed
Source: W. H. Beaver, “Financial Ratios and Predictors of Failure”, Journal of Accounting Research
Desired level varies by type of firm
Desired level varies by type of firm
Page 18
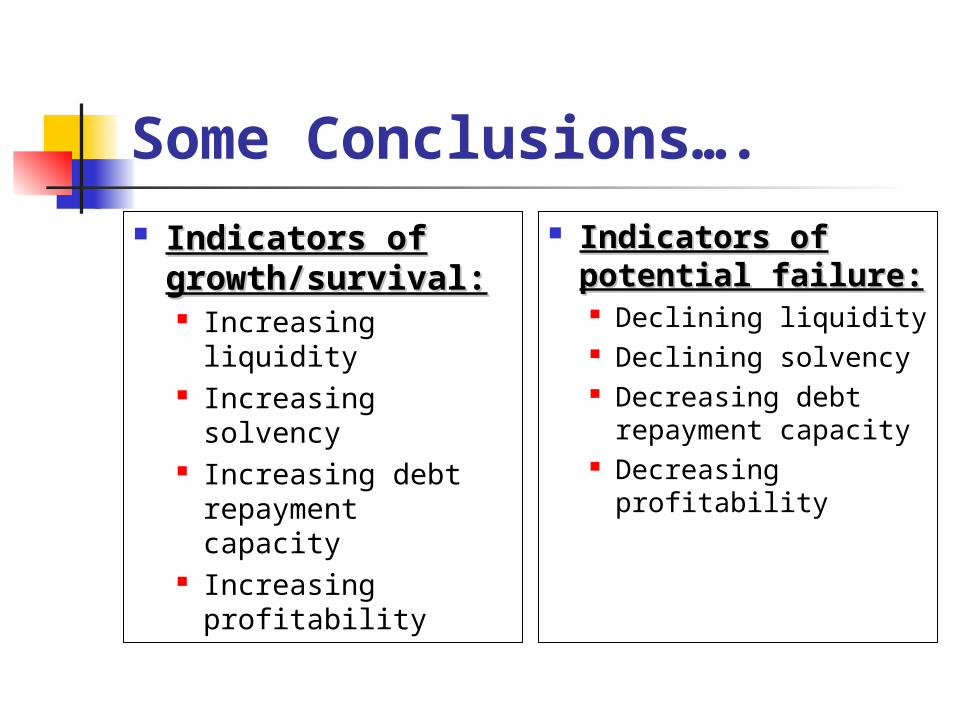
Some Conclusions…. Indicators of Indicators of
growth/survival:growth/survival: Increasing liquidity Increasing solvency Increasing debt
repayment capacity Increasing
profitability
Indicators of Indicators of potential potential failure:failure: Declining liquidity Declining solvency Decreasing debt
repayment capacity
Decreasing profitability

Tale of Two Cities…Working Capital-to-Total Assets
0.000.050.100.150.200.250.300.350.400.45
1 2 3 4 5
Year Before Failure
FailedFailed
Source: W. H. Beaver, “Financial Ratios and Predictors of Failure”, Journal of Accounting Research

Tale of Two Cities…Working Capital-to-Total Assets
0.000.050.100.150.200.250.300.350.400.45
1 2 3 4 5
Year Before Failure
Total Debt-to-Total Assets
0.000.100.200.300.400.500.600.700.800.90
1 2 3 4 5
Year Before Failure
FailedFailed
FailedFailed
Source: W. H. Beaver, “Financial Ratios and Predictors of Failure”, Journal of Accounting Research

Tale of Two Cities…
Rate of Return on Assets
-0.25
-0.20
-0.15
-0.10
-0.05
0.00
0.05
0.10
0.15
1 2 3 4 5
Year Before Failure
Working Capital-to-Total Assets
0.000.050.100.150.200.250.300.350.400.45
1 2 3 4 5
Year Before Failure
Total Debt-to-Total Assets
0.000.100.200.300.400.500.600.700.800.90
1 2 3 4 5
Year Before Failure
FailedFailed
FailedFailed
FailedFailed
Source: W. H. Beaver, “Financial Ratios and Predictors of Failure”, Journal of Accounting Research

Tale of Two Cities…
Rate of Return on Assets
-0.25
-0.20
-0.15
-0.10
-0.05
0.00
0.05
0.10
0.15
1 2 3 4 5
Year Before Failure
Net Cash Income-to-Total Debt
-0.30
-0.20
-0.10
0.00
0.10
0.20
0.30
0.40
0.50
0.60
1 2 3 4 5
Year Before Failure
Working Capital-to-Total Assets
0.000.050.100.150.200.250.300.350.400.45
1 2 3 4 5
Year Before Failure
Total Debt-to-Total Assets
0.000.100.200.300.400.500.600.700.800.90
1 2 3 4 5
Year Before Failure
FailedFailed
FailedFailed
FailedFailed
FailedFailed
Source: W. H. Beaver, “Financial Ratios and Predictors of Failure”, Journal of Accounting Research
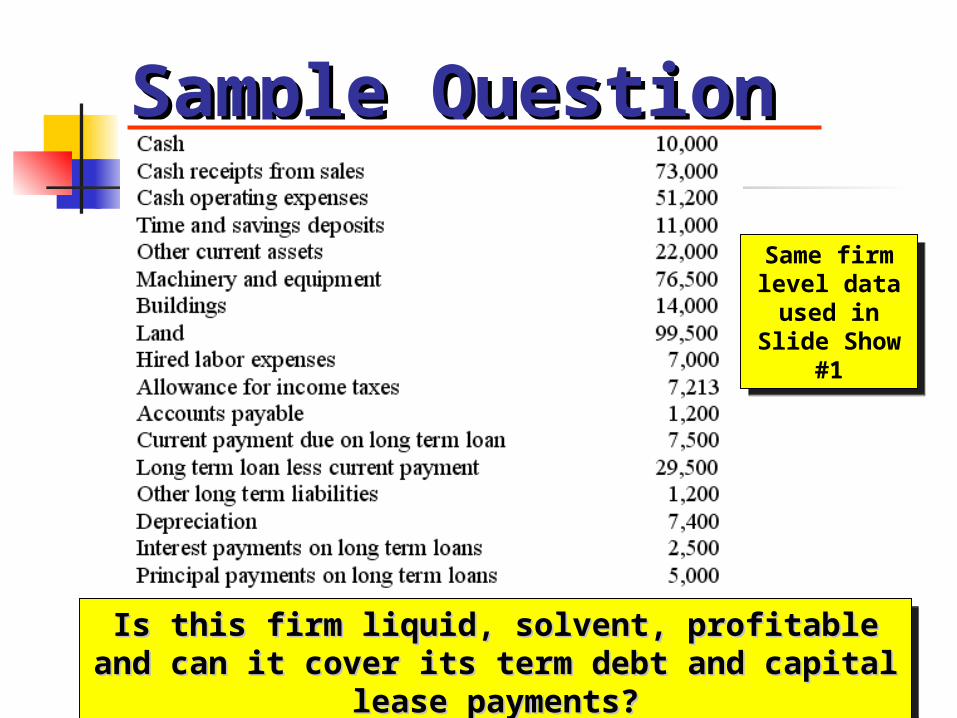
Sample QuestionSample Question
Is this firm liquid, solvent, profitable and can it cover Is this firm liquid, solvent, profitable and can it cover its term debt and capital lease payments?its term debt and capital lease payments?
Is this firm liquid, solvent, profitable and can it cover Is this firm liquid, solvent, profitable and can it cover its term debt and capital lease payments?its term debt and capital lease payments?
Same firm level data
used in Slide Show
#1
Same firm level data
used in Slide Show
#1

Step #1 Calculate the followingStep #1 Calculate the following: 1. Current assets and total assets2. Current liabilities and total liabilities3. Net income4. Equity (or net worth)
Total current assets = 10,000 + 11,000 + 22,000 = 43,000Total current liabilities = 1,200 + 7,500 + 7,213 = 15,913Total assets = total current assets + 76,500 +14,000 + 99,500 = 233,000Total liabilities = total current liabilities + 29,500 + 1,200 = 46,613Equity = 233,000 – 46,613 = 186,387 Cash receipts from product sales = 73,000Total operating expenses = 51,200 + 2,500 + 7,400 = 61,100Net income from operations = 73,000 – 61,100 = 11,900Net income before taxes = 11,900Net income = 11,900 – 7,213 = 4,687
Sample QuestionSample Question

Step #2 Calculate the followingStep #2 Calculate the following: 1. Current ratio2. Debt and leverage ratio
Asset liquidity analysisAsset liquidity analysis:Total current assets = 10,000 + 11,000 + 22,000 = 43,000Total current liabilities = 1,200 + 7,500 + 7,213 = 15,913Current ratio = 43,000/15,913 = 2.702Working capital = 43,000 – 15,913 = 27,087
Solvency analysisSolvency analysis: Total assets = total current assets + 76,500 +14,000 + 99,500 = 233,000Total liabilities = total current liabilities + 29,500 + 1,200 = 46,613Equity = 233,000 – 46,613 = 186,387Debt ratio = 46,613/233,000 = 0.20Leverage ratio = 46,613/186,387 = 0.25
Sample QuestionSample Question

Step #3 Calculate the followingStep #3 Calculate the following: 3. ROA and ROE
Total assets = 233,000Equity = 186,387 Cash receipts from product sales = 73,000Total operating expenses = 51,200 + 2,500 + 7,400 = 61,100Net income from operations = 73,000 – 61,100 = 11,900Net income before taxes = 11,900Net income = 11,900 – 7,213 = 4,687
Profitability analysisProfitability analysis:ROA = (4,687 + 2,500)/233,000 = 0.0308 or 3.1%ROE = 4,687/186,387 = 0.025 or 2.5%
Sample QuestionSample Question
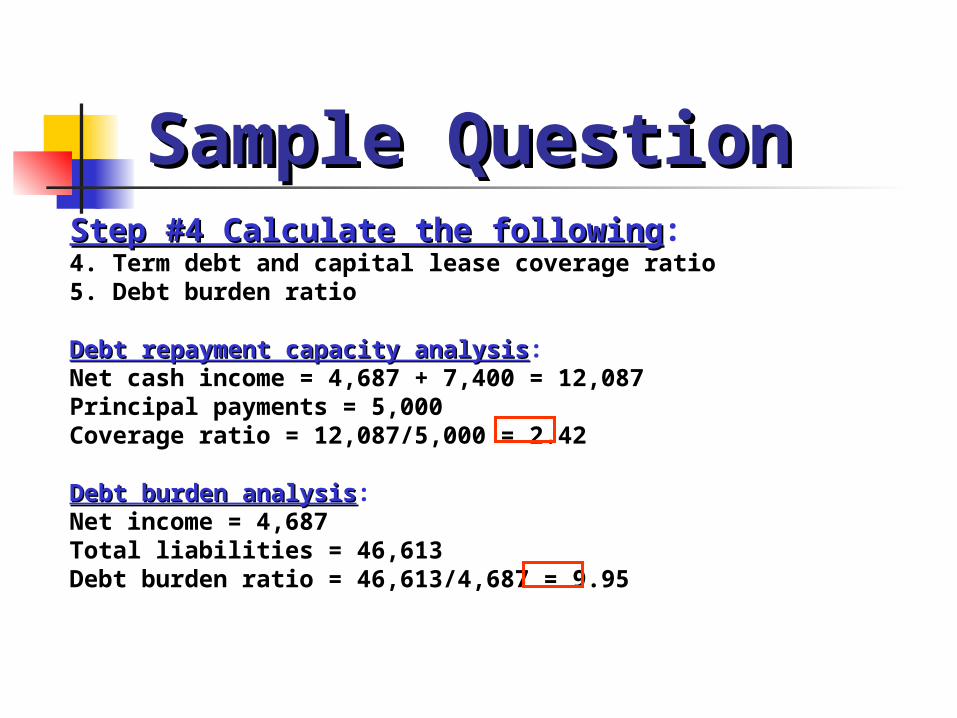
Step #4 Calculate the followingStep #4 Calculate the following: 4. Term debt and capital lease coverage ratio5. Debt burden ratio
Debt repayment capacity analysisDebt repayment capacity analysis:Net cash income = 4,687 + 7,400 = 12,087Principal payments = 5,000Coverage ratio = 12,087/5,000 = 2.42
Debt burden analysisDebt burden analysis:Net income = 4,687Total liabilities = 46,613Debt burden ratio = 46,613/4,687 = 9.95
Sample QuestionSample Question
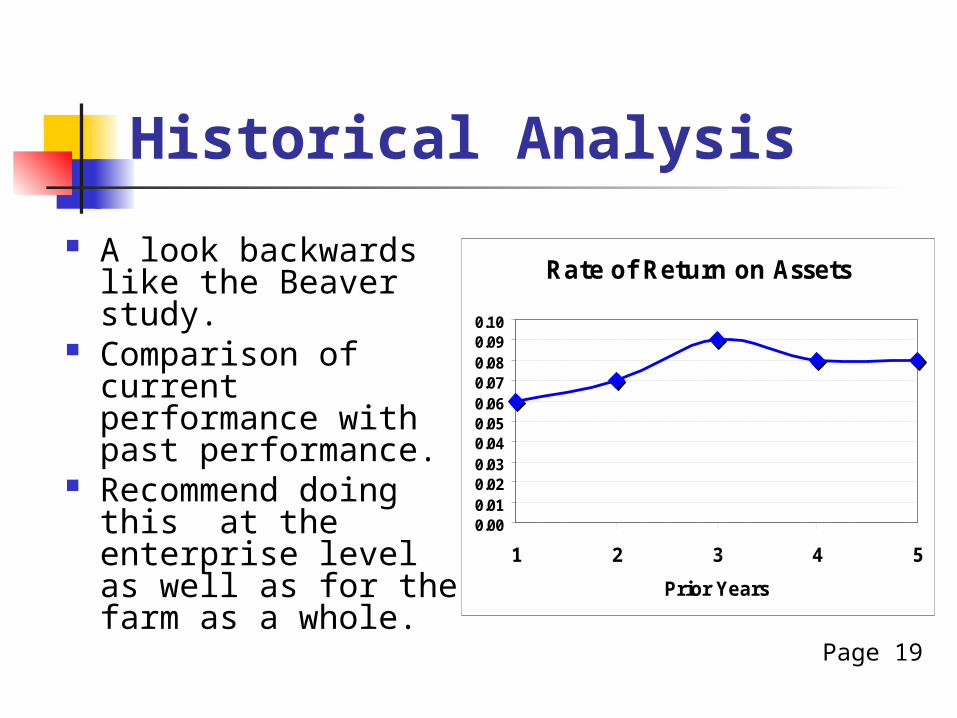
Historical Analysis
A look backwards like the Beaver study.
Comparison of current performance with past performance.
Recommend doing this at the enterprise level as well as for the farm as a whole.
Rate of Return on Assets
0.000.010.020.030.040.050.060.070.080.090.10
1 2 3 4 5
Prior Years
Page 19
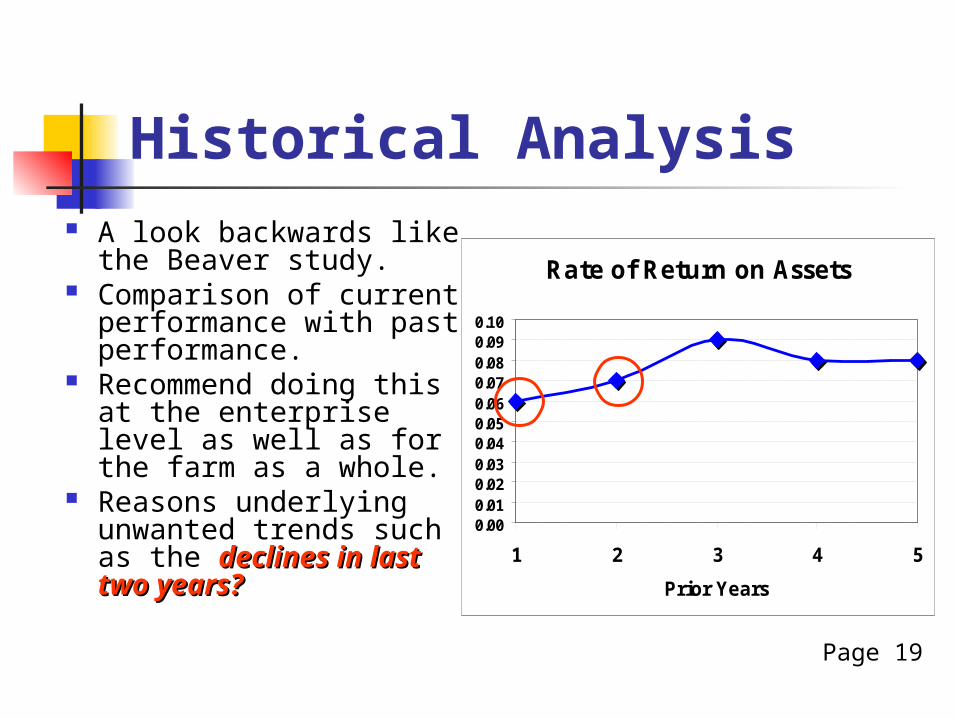
Historical Analysis A look backwards like
the Beaver study. Comparison of current
performance with past performance.
Recommend doing this at the enterprise level as well as for the farm as a whole.
Reasons underlying unwanted trends such as the declines in declines in last two years?last two years?
Rate of Return on Assets
0.000.010.020.030.040.050.060.070.080.090.10
1 2 3 4 5
Prior Years
Page 19

Comparative Analysis Compare the firm’s
current performance with the performance of similar operations like the Beaver study did.
Benchmark analysis at enterprise level should be done whenever possible.
Rate of Return on Assets
-0.25
-0.20
-0.15
-0.10
-0.05
0.00
0.05
0.10
0.15
1 2 3 4 5
Prior Years
Your firmYour firm
BenchmarkBenchmark
Page 20

Comparative Analysis Compare the firm’s
current performance with the performance of similar operations like the Beaver study did.
Benchmark analysis at enterprise level should be done whenever possible.
Address reasons why your firm is performing more poorly than other comparable operations before it is too latebefore it is too late.
Rate of Return on Assets
-0.25
-0.20
-0.15
-0.10
-0.05
0.00
0.05
0.10
0.15
1 2 3 4 5
Prior Years
Your firmYour firm
BenchmarkBenchmark
Page 20

Pro Forma Analysis Stress testingStress testing
current expected cash flows by varying prices, unit costs and yields (Slide Show #3).
Look at implications of longer run price and unit cost trends on future financial future financial healthhealth when making major decisions.

Forces of change…. Impacts of rising unit costs of
production inputs. Prices, costs and yields can all
affect the financial health of the firm.
Failure to account for the risk associated with adverse trends can lead to failure of the firm.
Sources of Uncertainty Global trends in
production and consumption
Energy prices and core inflation trends
Interest rates and exchange rates
WTO and the 2007 farm bill

Any Questions?Any Questions?


