11July 2012
Financial Statement AnalysisFinancial Statement Analysis
Earnings, dividends and growth rates are use-ful fi gures in investment analysis. However, like water to humans, there is an underlying element essential to the survival and success of any fi rm—cash fl ow.
In this installment of the fi nancial statement analysis series, I discuss the corporate cash fl ow statement, provid-ing an in-depth look at its sections and explaining what the line items mean.
The Linking Statement
Under accrual accounting (the methodology followed by publicly traded corporations), earnings and cash fl ow are two very different fi gures. The earnings fi gure, the income state-ment’s “bottom line,” is based on the principles of accrual accounting. Accrual accounting attempts to match expenses with revenues regardless of when the cash transactions that deal with the creation of the goods being sold and the receipt from the sale occurred. In essence, accrual accounting is not entirely concerned with when “cash trades hands.” This method of accounting introduces many interpretations and estimates from management that can vary from fi rm to fi rm.
For example, higher sales may not translate into higher cash fl ow if accounts receivable are allowed to rise. (Cus-tomers may not pay when goods are delivered, but rather
may be invoiced.) Furthermore, cash may be used to build up inventories, which may depreciate in value or even become obsolete if products are not sold in a timely
manner. The expenses to build up these inventories are not recorded
until products are actually sold. Even inventory recognition may vary from
fi rm to fi rm if one company uses fi rst-in-fi rst-out (FIFO) accounting and another uses last-in-fi rst-out (LIFO) accounting.
The cash fl ow statement helps alleviate many of these issues by providing a link between the income statement and the balance sheet. Think of the cash fl ow statement like your checking account. Once a transaction occurs and the cash is used, the cash is gone. There is no waiting to expense the spending throughout the life of your purchased product. The cash fl ow statement works in the same way: It allows you to see whether a company was able to generate more cash than it used during the stated period. If the company spent more cash than it was able to bring in, its cash balance is reduced. If the cash balance is depleted signifi cantly (or if there is a threat of a signifi cant depletion), the company must either take on additional debt or sell more stock—both of which may have negative fi nancial implications.
Cash fl ow statements are separated into three segments: cash fl ow from operating activities, cash fl ow from investing activities and cash fl ow from fi nancing activities. Table 1 shows an example of a sample cash fl ow statement.
The Cash Flow Statement:Tracing the Sources and Uses of CashBy Z. Joe Lan
Article Highlights• The cash fl ow statement is a link between the balance sheet and the income statement.• Though a positive change in cash is good, what really matters is how the cash was increased and spent.• Free cash fl ow measures how much cash was generated that can be spent at management’s discretion.
12 AAII Journal
Cash Flow FromOperating Activities
Cash fl ow from operating activities has a very simple objective—to show whether a fi rm’s day-to-day operations generated or depleted cash. If net cash fl ow from operations is negative, it means that the company is spend-ing more cash than it is generating in producing and selling its goods and services. If it is positive, the company is generating more cash than it is spending on its day-to-day operations.
Needless to say, cash fl ow from op-erations is vital. Negative cash fl ow from operating activities will eventually lead companies to seek funding from outside sources, either through increased debt load—which increases interest pay-ments, hinders growth and makes the company more vulnerable to business downturns—or by issuing stock, which dilutes ownership. Although a rapidly growing company may have negative operating cash fl ows as it expands its inventory and pays its increasing bills, the cash fl ow from operating activities must eventually turn positive for the fi rm to survive. Conversely, a contract-ing company may exhibit positive cash fl ows for a period of time, as spend-ing falls at a faster rate than sales and earnings. If the sales and profi ts fall far enough, however, the fi rm will have to liquidate portions of its business or declare bankruptcy.
There are two ways fi rms determine cash from operating activities: direct and indirect. The direct method of cash fl ow statement reconciliation reports major sources of cash receipts and pay-ments, starting with cash receipts from customers. Cash payments for inven-tory purchases and operating expenses are deducted from this initial balance to arrive at cash fl ow from operating activities. The premise of the indirect method is to start with net income and then adjust for non-cash expenditures to arrive at cash fl ow from operating activities. The vast majority of fi rms use the indirect method of cash fl ow reconciliation, which is the method outlined here and in Table 1.
The net income fi gure at the top of the cash fl ow statement is pulled directly from the income statement.
Typically, depreciation is the fi rst line item that is reconciled. It is a non-cash expense, meaning that depreciation does not require the expenditure of cash. Rather, it is used to reduce the value of an asset throughout its use-ful life in an effort to properly match revenues with expenses. Amortization, like depreciation, is also a non-cash expense. Unlike deprecation, however, this fi gure measures the decline in value of an intangible asset. Both these fi gures lower net income and shareholder’s equity, but since they do not affect a company’s cash balance, they are added back to net income.
In most cases, companies will break down changes in working capital accounts such as accounts receivable, inventory and accounts payable. Firms may also provide this balance as one single item; however, a breakdown offers a clearer picture. Changes in working capital must be adjusted in order to iden-tify the fl ow of cash. For example, an increase in accounts receivable increases net income and shareholder’s equity since a sale has been made and the com-pany can reasonably expect payment in the future. However, cash has yet to be received for accounts receivable. In order to adjust net income to cash fl ow, the increase in accounts receivable for the period must be subtracted from net income. Conversely, accounts payable measures payment owed to suppliers. An increase in accounts payable decreases net income, but increases the cash bal-ance when adjusting net income in the cash fl ow statement. An easy way to see this increase is to recognize that a company taking longer to pay its bills will see a rise in its cash balance as well as its accounts payable.
Several other non-cash items appear often on the cash fl ow state-ment, including prepaid expenses and unearned revenues. Prepaid expenses are assets on the balance sheet that do not reduce net income or shareholder’s equity. However, prepaid expenses do reduce cash. Adjusting for an increase
in prepaid expense is similar to adjusting for an increase in accounts receivable: they both decrease cash fl ow. Unearned revenues is a liability, so it works in the same way as accounts payable. An increase in unearned revenues does not affect net income or shareholder’s equity, but it does increase cash since payment has been received for future delivery of products or services. Again, the key is when cash was actually re-ceived or spent.
As I mentioned in previous articles in this series, fi rms often maintain two sets of accounting books—one for reporting to tax authorities and one for reporting to shareholders. It may be advantageous for a fi rm to pay a large tax bill up front and slowly deduct the expense from earnings over the next several years. As the tax expense is re-alized in subsequent periods, earnings and shareholder’s equity will decrease, but cash is not expended. A deferred tax expense on the cash fl ow statement is used to adjust net income to the cash balance.
Net operating cash fl ow is the sum of the previous line items. Expanding fi rms may have negative operating cash fl ows as they build up inventory and provide more credit to customers, but eventually this fi gure needs to turn posi-tive. For most fi rms, positive operating cash fl ow is crucial.
Cash From Investing Activities
Cash fl ow from investing activi-ties measures a company’s investment in itself. Long-term expenditures and investments in other fi rms are recorded here. These expenditures are intended to produce profi ts in the future.
Capital expenditures (also referred to simply as “capex”) represent pur-chases in fi xed assets, mainly in the form of plant, property and equipment. This fi gure is usually negative as the fi rm spends money on fi xed assets, but can also be positive if a fi rm is selling more of its assets than it is buying. Capital expenditures can be very large and are long term in nature. As previously men-tioned, in an effort to properly match
13July 2012
Financial Statement AnalysisFinancial Statement Analysis
expenses with revenues on the income statement, companies typically expense a capital expenditure over the course of its useful life. However, the effect of capital expenditures on cash fl ow works differently. In the initial purchase year, cash is used immediately, resulting in a large negative outfl ow for a single year as opposed to being expensed over a period of several years. A negative number for capital expenditures can be a good sign for a company: It means the company is spending money to expand its business by purchasing additional fi xed assets. However, be sure to ascertain whether the company is making wise investments and has good growth prospects.
When analyzing capital expendi-tures, it is important to make sure the fi gure is growing at a clip relatively similar to revenues. A fi rm that is grow-ing at a rapid pace will not be able to maintain its pace without making capital expenditures for expansion. Conversely, spending cash on capital expenditures while revenues are stalling can be problematic if the sales decline is due to competitive threats and poor man-agement decisions, instead of simply economic and industry cycles.
Furthermore, capital expenditures vary by industry. Manufacturing fi rms that require large plants typically have higher capital expenditures than fi rms with a high amount of intangible assets or intellectual property, such as invest-ment fi rms.
Other cash fl ow from investing ac-tivities arises from investments in other fi rms, acquisitions and divestitures of subsidiaries. This section also includes commodity hedges (for fi rms that de-pend heavily on commodities) or cur-rency hedges (for international fi rms). In addition, fi nancial companies make signifi cant investments in marketable securities. You’ll need to keep the com-pany’s industry in mind when examining cash fl ow from investing activities.
Net cash from investing activities is the sum of these line items. The fi gure for most healthy fi rms will be negative, as they drive cash from operations back into the fi rm for expansion to generate future profi ts.
Cash From Financing Activities
Cash fl ow from fi nancing activi-ties includes three main transactions: stock transactions, debt transactions and dividends.
Cash is received and ownership is diluted when a company issues stock. Raising capital by issuing additional shares is not necessarily a bad sign, as long as the fi rm is expanding at an acceptable rate. Keep in mind, though, that selling additional shares means that less income is attributable to each shareholder. The repurchase of shares increases the ownership of shareholders and decreases cash.
Cash fl ows from fi nancing activi-ties also include issuing debt and the repayment of debt. When debt is issued, the fi rm receives cash that needs to be paid back at a later date. In between the repayment date and the issuance date, interest is paid. The repayment of debt issued represents a cash outfl ow. [Note that interest payments are not a fi nancing activity. Rather, they are included in operating activities since these expenses are considered a part of normal business operations. However, interest expense is not broken out in the operating activities section of the cash fl ow statement since it is already calculated into net income.]
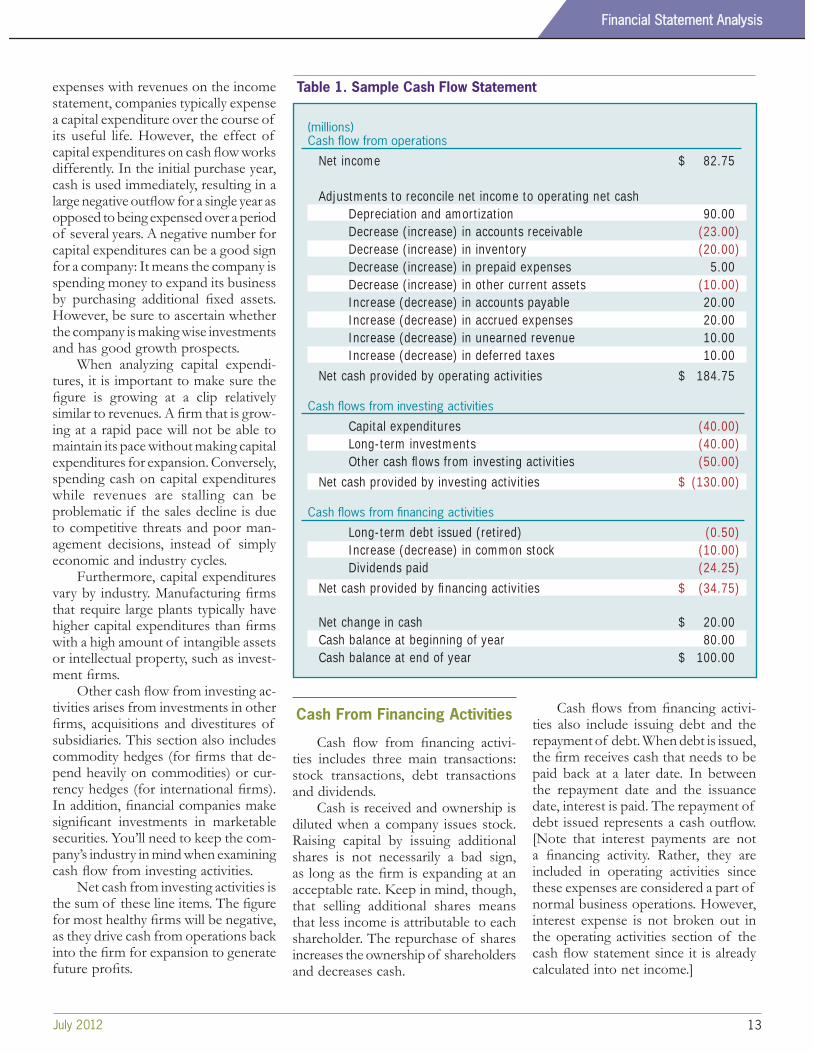
(millions)Cash fl ow from operations
Net income $ 82.75 Adjustments to reconcile net income to operating net cash Depreciation and amortization 90.00 Decrease (increase) in accounts receivable (23.00) Decrease (increase) in inventory (20.00) Decrease (increase) in prepaid expenses 5.00 Decrease (increase) in other current assets (10.00) Increase (decrease) in accounts payable 20.00 Increase (decrease) in accrued expenses 20.00 Increase (decrease) in unearned revenue 10.00 Increase (decrease) in deferred taxes 10.00Net cash provided by operating activities $ 184.75
Cash fl ows from investing activities
Capital expenditures (40.00) Long-term investments (40.00) Other cash fl ows from investing activities (50.00)Net cash provided by investing activities $ (130.00)
Cash fl ows from fi nancing activities
Long-term debt issued (retired) (0.50) Increase (decrease) in common stock (10.00) Dividends paid (24.25)Net cash provided by fi nancing activities $ (34.75)
Net change in cash $ 20.00Cash balance at beginning of year 80.00Cash balance at end of year $ 100.00
Table 1. Sample Cash Flow Statement
14 AAII Journal
Dividends are outfl ows of cash since cash is paid out to shareholders. Furthermore, the money spent on divi-dends should increase (become more negative on the cash fl ow statement) in subsequent periods. A decrease in dividends is often a sign that a company is experiencing diffi culties, especially if the decrease is greater than the corre-sponding reduction in the number of shares outstanding. A fi rm offering no dividends is not uncommon. Preferably, a fi rm with no dividends should be experiencing signifi cant growth.
The net cash from fi nancing activi-ties fi gure is helpful when gauging its overall effect on the cash fl ows of the fi rm. However, it is more important to study the individual line items to see how the fi rm is raising cash or repaying cash.
Currency Translation
The cash fl ow statement can also include a section that reconciles cur-rency translation (not shown in Table 1). Multinational fi rms with operations in several different countries will generate revenues in several different currencies.
There are accounting rules writ-ten to supervise how currency is translated. A separate line item, often called “cumulative effect of exchange rate changes,” details the effect of the currency exchange rate changes on the company’s cash fl ow.
Net Change in Cash
Net change in cash is the aggregate of cash fl ows from operating, invest-ing and fi nancing activities. This fi gure should equal the difference between cash the fi rm holds at the beginning of the reported period (e.g., one year) and the amount that it holds at the period’s end. Positive net cash fl ow means the fi rm has more cash, and negative cash fl ow means the fi rm has less, compared to the beginning of the period.
It is easy to say that a positive change in cash is good while a negative change is bad, yet what matters is how cash is increased and spent. Generally, you want cash to come from business
operations: Increasingly positive cash fl ow from operating activities is a good sign. A few periods of decreasing to-tal cash is not worrisome if a fi rm is spending on worthwhile projects, pay-ing high dividends, paying down debt, or repurchasing shares. Also, keep in mind that excess cash does not provide a return for shareholders. Firms run the risk of management making risky decisions with a stockpile of cash, such as investing in questionable acquisitions or pet projects.
Analysis of Cash Flows
Since the cash fl ow statement was fi rst required to be provided in 1987, analysts have increasingly compared net income and cash from operating activities. Each fi gure has its strengths and weaknesses for analysis. Net in-come is derived using the principles of accrual accounting, ignoring the effect of non-cash items. Increasingly lax credit standards and aggressive rev-enue recognition can all be missed by looking simply at net income. Addition-ally, non-cash items are dependent on management estimates and discretion, and treatment may vary slightly from fi rm to fi rm.
On the other hand, cash fl ow from operations fails to account for earned revenues that will be collected in the future, or accrued liabilities that will need to be paid. In addition, the fi gure is diffi cult to evaluate for young, rapidly growing fi rms. These fi rms are increas-ing inventory, increasing current assets, and extending credit to new customers to drive revenue growth. Typically, this leads to negative operating cash fl ows that are supported by debt and issuance of stock.
Free Cash Flow
Free cash fl ow represents cash that management is able to use at its discretion. Free cash fl ow is cash fl ow from operating activities less capital expenditures and dividends paid. The importance of free cash fl ow should not be underestimated. Positive cash fl ow
from operations is great, but cash must be driven back into the fi rm to upgrade obsolete machinery or buy newer build-ings or for expansion purposes. Without these capital expenditures, a fi rm cannot remain a going concern that is able to generate future revenues.
Some sources simply list free cash fl ow as cash from operating activities less capital expenditures, since dividends are paid at management’s discretion and can be cancelled if need be. It can be argued, however, that once a company starts paying a regular dividend, inves-tors expect the payments to continue. Very rarely does a fi rm decrease or cancel dividends, unless they are forced to do so.
Free cash fl ow can be put to several uses: retire debt, repurchase shares, pay additional dividends and create new products or expand current offerings. Depending on the type of company, free cash fl ows may show signifi cant trends. For fi nancial fi rms, most investments come in the form of loans, but loans are considered part of normal business operations. On the fl ip side, there are companies with extremely long and ex-pensive product cycles, such as Boeing Co. (BA) and Airbus SAS. As new planes are conceptualized, developed, manufac-tured and delivered, cash fl ows devoted to those to projects may be negative for years before profi ts are realized and net cash fl ows become positive.
Conclusion
The cash fl ow statement provides a crucial link between the income state-ment and the balance sheet. The cash flow statement helps you ascertain whether cash is coming from normal operations, whether a fi rm is reinvest-ing in itself, and if a fi rm is raising additional cash.
It is important to analyze a fi rm’s cash fl ow statement in relation to in-dustry norms. Different industries will have different trends in cash fl ows. Separately, rapidly expanding fi rms will have signifi cantly different breakdowns for each section of the cash fl ow state-ment than slower-growth companies.
15July 2012
Financial Statement AnalysisFinancial Statement Analysis
Typically, rapidly expanding fi rms have negative cash fl ows from operating and investing activities and positive cash fl ow from fi nancing activities.
The cash fl ow statement should be used as a tool to help you tie the income statement and balance sheet together.
Our next fi nancial statement analy-
sis article will cover fi nancial ratios and will appear in the September AAII Journal. This series can be accessed at AAII.com in the AAII Journal area.
Z. Joe Lan is an assistant fi nancial analyst at AAII.
survive throughout retirement.Keep in mind that this doesn’t mean
you can select a realistic withdrawal rate and then put your portfolio on “autopilot.” You still need the other elements of portfolio management: a proper asset allocation that includes commitments to all three major asset classes, and a portfolio monitoring system that includes spending adjust-ments—midcourse corrections—to ensure that you stay on track.
But setting a realistic withdrawal rate is the fi rst step toward reaching your ultimate goal of striking the fi ne line between spending the maximum amount of your retirement savings each year and being assured you will have enough savings to support you for the rest of your life.
The Withdrawal Rate Approach
These are the major points to keep in mind:
• The advantage of a withdrawal rate approach is that it allows you to separate your asset allocation decision from your immediate with-drawal needs so that they do not drive your asset allocation decision.
• This encourages you to invest for the long term, since the withdrawal rate does not depend on any income component.
• Annuity tables assume unvarying return rates each year, but your return rates will vary signifi cantly year-to-year.
• For that reason, base your with-drawal rate on studies of portfolio success rates. You can use the tables
here to help you determine an ap-propriate initial withdrawal rate. This withdrawal rate only applies to your fi rst-year withdrawal; after that, you can withdraw the same dollar amount as the prior year adjusted for infl ation. This is a pre-tax amount that does not take into consideration what type of account your withdrawals are made from (taxable or tax-deferred).
• Make sure you use a realistic spend-ing rate—not more than 4% of the initial portfolio value.
• This approach is not an “autopilot” approach. You still need to develop an appropriate asset allocation strategy and a portfolio monitoring system that allows for midcourse adjustments to ensure that your portfolio remains on track.
Maria Crawford Scott is the former editor of the AAII Journal.
Feature: Financial PlanningFeature: Financial Planning
(continued from page 10)


