
FinScope South Africa 2012 Consumer Survey
1
October 30th 2012

Banking
Credit
Savings
Insurance
Contents
2
1
3 4
Who we spoke with
And what about people’s financial lives?
What has changed since 2004?
2 What do people’s lives look like today?
Banking
Credit
Savings
Insurance
Contents
3
1
3 4
Who we spoke with
And what about people’s financial lives?
What has changed since 2004?
2 What do people’s lives look like today?

Where: 16 African countries, including South Africa.
Objective: To measure and profile levels of access to and use of financial services by all adults in South Africa, across income ranges and other demographics, in order to inform stakeholders.
FinMark Trust and FinScope SA
FinMark Trust is an independent trust with the
purpose of “Making financial markets work for
the poor” across Africa in order to increase access
to financial services for the unserved and
underserved that ultimately lead to the
development of inclusive financial systems that
can benefit all people
FinScope SA is an annual representative study of
the demand for, usage of and access to financial
services in South Africa. The FinScope SA survey is
used to better understand money matters in
South Africa, with an emphasis on the market
needs and attitudes to both informal and formal
financial offerings and usage. The FinScope SA
survey further sheds light on consumers and
behaviour by exploring individuals’ interactions
with the financial sector as a whole
4

The syndicate members
form an integral part of
the FinScope SA
questionnaire design and
offer valuable insight into
consumer demand
behaviour
The syndicate members
also use the annual
FinScope SA results to
develop new products or
processes and to enrich
the overall objective of
increasing financial
inclusion in South Africa
2012 South African syndicate members
5

Sampling and methodology
6
Respondent profile Coverage and methodology
Sample and fieldwork validation
Universe: Adult population in South Africa
South African residents 16 years and older
Fieldwork conducted from May 2012 to July 2012
Questionnaire translated into isiXhosa, isiZulu, Sesotho, Setswana, Sepedi and Afrikaans
3 900 interviews conducted by TNS
Nationally representative sample (weighted / benchmarked to
Stats SA 2011
mid-year population estimates)

Banking
Credit
Savings
Insurance
Contents
7
1
3 4
Who we spoke with
And what about people’s financial lives?
What has changed since 2004?
2 What do people’s lives look like today?

South Africa is a country of extremes…
8
LSM 1-2 LSM 3 LSM 4 LSM 5 LSM 6
LSM 7 LSM 8 LSM 9 LSM 10
LSM breakdown
1.2m 1.5m 4.5m 8.6m 9.1m 3m 1.7m 2.4m 1.8m
7
29
33
Don’t get money
Government grants
Money from others
Sources of money
29% of adults work full-time
4
37
29
18
12 16 – 17
18 – 29
30 – 44
45 – 59
60+
41% of adults in SA are younger
than 30
2012 Age
n=3900
21% in LSM 1-4 R1 000 PMI
52% in LSM 5-6 R1 800 PMI
26% in LSM 7-10 R8 000 PMI
15% work part-time

… and impoverished pockets still persist
9
TOTAL adults in SA
33.7 million
LSM 1-2 in SA (adults) 1.2 million
LSM 3-4 in SA (adults)
No tap water in home or on stand
No toilet facilities in home
No electricity in home
No tap water No toilet No electricity
4% 4% 10%
6 million
23% 27% 88%
No tap water No toilet No electricity
14% 11% 30%
Tough circumstances = 21% of South Africa (7.2m adults)
62% of this group live in tribal lands. Only 21% get salaries or wages. 45% are younger than 30.

Impoverished pockets take twice as long to access basic facilities
10
Public transport
Supermarket
ATM
Petrol station or garage
Post office
Bank branch
Social grant ID point
Insurance branch
Min.
Min.
Min.
Min.
Min.
Min.
Min.
Min.
Average South African LSM 1-4
Min.
Min.
Min.
Min.
Min.
Min.
Min.
Min.

South Africans are generally positive about their lives
11
67%
There are concerns over personal educational achievement as well as social capital.
claim they are in perfect health
expect their life to be better in 2 years’ time
60%
believe they will achieve their goals in future
61%
are happy with their current lifestyle
are happy with their level of education
53%
41%
People are positive about People are concerned about
Only
Can rely on neighbours to help out 37%
Only
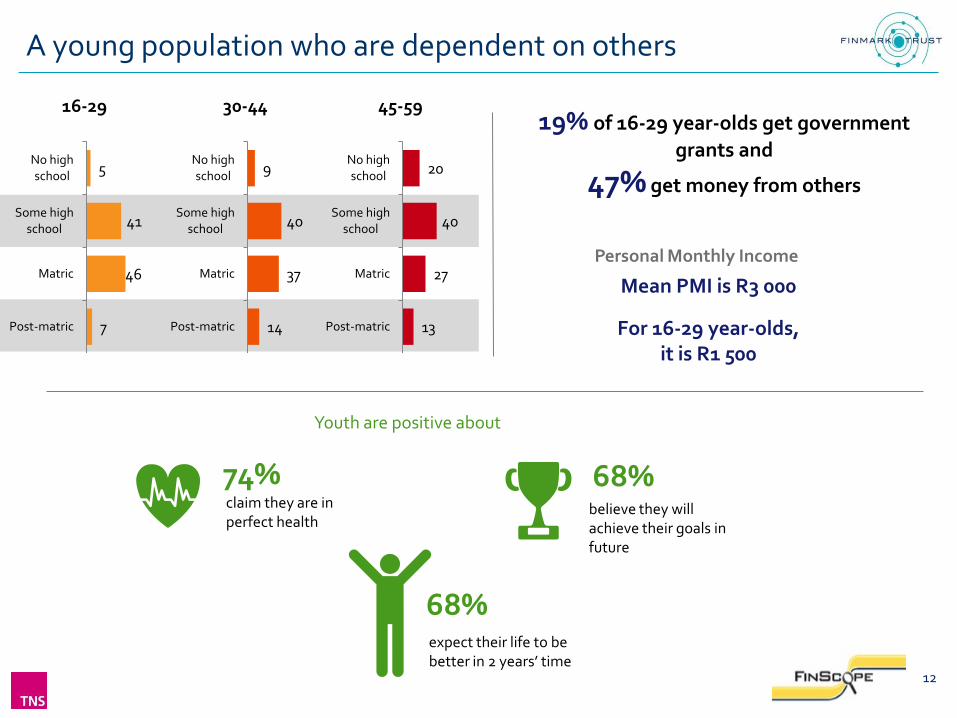
A young population who are dependent on others
12
Personal Monthly Income
19% of 16-29 year-olds get government
grants and
47% get money from others
Mean PMI is R3 000
For 16-29 year-olds, it is R1 500
74% claim they are in perfect health
expect their life to be better in 2 years’ time
68%
believe they will achieve their goals in future
68%
Youth are positive about
5
41
46
7
No high school
Some high school
Matric
Post-matric
16-29
9
40
37
14
No high school
Some high school
Matric
Post-matric
30-44
20
40
27
13
No high school
Some high school
Matric
Post-matric
45-59

Banking
Credit
Savings
Insurance
Contents
13
1
3 4
Who we spoke with
And what about people’s financial lives?
What has changed since 2004?
2 What do people’s lives look like today?

More people have been brought into banking in 2012
67
63
63
6
5
5
8
5
9
19
27
23
2012
2011
2010
Banked
Formal other (non-bank products)
Informally served only
Not served
2012 (33 739 399) 2011 (33 739 399) 2010 (33 441 893)
Banked 22 514 009 21 184 871 20 956 844
Formal other (non-bank products) 1 946 316 1 605 519 1 667 456
Informally served only 2 726 132 1 852 518 3 000 903
Not served 6 552 944 9 096 492 7 816 691
14

Almost 40% have a product portfolio stretching across the strand
15
Banked, Formal and Informal 13.1m = 39% 52% burial 34% formal funeral 22% life insurance 35% formal retirement 24% savings clubs 15% credit card
2%
3%
1%
3%
24%
8%
Banked only 0.7m = 2%
Banked and Formal 8.2m = 24% 22% store card 21% formal funeral 17% formal retirement 13% life insurance 10% asset insurance
Formal only 0.9m = 3% 8% store card 25% buy on credit from store
Informal only 2.7m = 8% 61% burial 11% stokvel 29% use loyalty points
Formal and Informal 1m = 3% 50% burial 24% stokvel 16% store card
Banked and Informal 0.5m = 1% 91% burial 10% savings club
NOT SERVED 6.5m = 19%
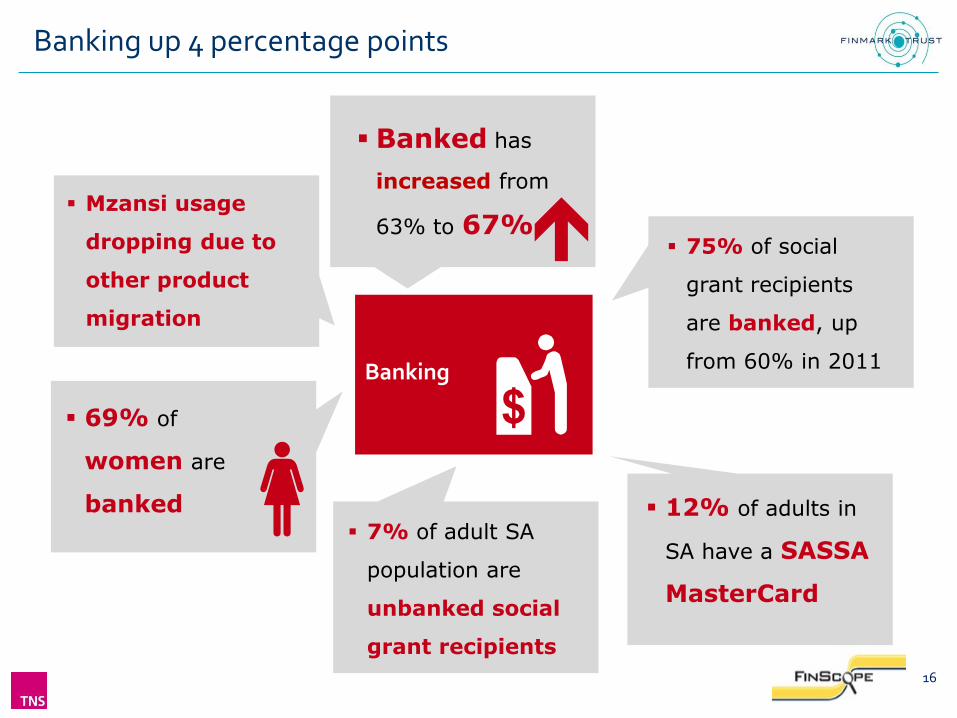
Banking up 4 percentage points
16
Banking
Banked has
increased from
63% to 67% 75% of social
grant recipients
are banked, up
from 60% in 2011
12% of adults in
SA have a SASSA
MasterCard
7% of adult SA
population are
unbanked social
grant recipients
69% of
women are
banked
Mzansi usage
dropping due to
other product
migration

We need to get people to deepen engagement with banking
Full service banking
Unbanked
Monthly cash withdrawal at store till using bank card /
Prefer bank card purchases to cash
Do NOT withdraw all at once every
month
Basic banking – withdraw all at
once every month
Size: 9.6m
Size: 11.2m
Size: 5.8m
Size: 3.4m
Size: 3.7m
Avg. personal monthly income
R7 600
R2 000
R1 900
R1 400
R 750
52% agree that it only makes sense to have bank a/c if get money regularly and reliably;
36% banking fees too expensive
43% take out all money as soon as deposited
17% unsure which bank account best
57% not enough money for bank account;
22% unsure which bank account best;
18% too complicated to open bank a/c
High
Low
Attitudes to banking
14% unsure which bank account best;
8% too complicated to open bank a/c

26% claim to be borrowing
18
don’t like borrowing money
embarrassed to borrow
would go to a mashonisa as a last resort
claim that this is to buy food - lower income skew
Of those who do borrow,
76%
43%
22%
32%
claim to borrow from formal places or have formal cards or credit facilities 26% claim to borrow from informal places 15%
claim to borrow from family or friends 12%

There is a desire to borrow to start a business
19
Avg. personal monthly income
Other borrowing
Do not borrow
Cards or overdraft
Informal borrowing
Family / friends
borrowing
Size: 22m
Size: 5.7m
Size: 1m
Size: 2.2m
R5 600
R1 800
R1 600
R1 300
High
Low
Formal secured
Size: 2m
R16 000
Borrowing attitudes
Reasons for borrowing (definitely borrow for)
19% friends or family
34% friends or family
43% embarrassed if had to borrow
20% often spend more than have 32% would borrow from mashonisa
40% house 35% car
37% start own business 35% car
39% for emergency 38% pay for friend’s funeral
Formal unsecured
Size: 1m
R5 600 52% store card 9% friends or family
74% easier to get loan if have bank account 16% considered seeking help with debt problems
45% house 41% for emergency 15% for wedding / lobola
41% start own business 34% for emergency 31% pay for friend’s funeral

Personal obstacles to saving
20
claim they have enough money to save after covering all spending needs
worried won’t have enough money for old age or retirement
of people do not own a retirement, pension or provident product
25%
83%
48%
Those without savings skew to
unbanked and under 30 years old
4 in 5 of those who had cancelled a savings product said
could no longer afford – skew 30-44 years, low education and low income
Those who cancelled savings products due to recession skew R8 000+ income

Long-term savings opportunity amongst formal savers
21
Avg. monthly savings
High
Low
Other savings products
Avg. personal monthly income
Key priorities (extremely important)
Key barriers to formal insurance for those without
Education, investment or endowment
policies
Not served savings
Retirement policies
Informally served savings
Saving with others or
keeping money at home
Size: 1.4m
Size: 22.7m
Size: 3m
Size: 2m
Size: 1.7m
R10 500
R8 500
R1 800
R2 000
R1 400
Deposit or call a/c
Size: 1.7m
R9 000
R1 200
Tradable investments (shares etc.)
Size: 0.7m
R18 000
R1 200
R1 900
R350
R80
R700
R330
43% retirement annuity
55% pension fund
10% stokvel
37% deposit a/c 59% pension fund
20% no reason for no HH insurance
50% pay school fees 34% pay back loans
43% buy house / car 52% pay funeral
22% don’t want HH insurance 21% no HH insurance because premiums too high
49% buy house / car 36% pay back loans
40% no life insurance due to affordability
45% find language used in financial paperwork confusing
11% no HH insurance because cheaper to self-replace
52% pay funeral
26% buy clothes
14% no reason for no HH insurance 14% do not want HH insurance
38% buy house 27% pay back loans 43% pay funeral

Burial and funeral cover dominates insurance
22
Reasons for no household contents insurance:
People earning R3 000+ – premiums / costs / fees are too high
1 in 5 university-educated say don’t want it
1 in 5 earning R1 000 to R3 000 say earn too little
have life cover have medical cover
covered by burial society
funeral cover through funeral parlour or undertaker
have funeral cover with bank
have funeral cover with insurance company
Reasons for no funeral cover:
Higher income or educated people say – family will look after funeral
Low LSM or income – cannot afford
60 years + – too poor
Reasons for no life insurance:
Low income – earn too little
Older people – prefer funeral or burial cover
People earning R3 000 to R8 000 – don’t believe / never thought about / don’t want
28%
12% 10%
10%
7%
8%
Note: All figures quoted for direct cover in own name. Indirect cover not included in these figures.

Low take-up of formal retirement amongst non-salaried
12
22
15
6
4
1
Life insurance
Pension fund
Retirement annuity
Salaried (n=375) Non-salaried (n=192)
23
R2 000 – R6 000 personal monthly income
34
28
40
27
41
30
41
10
Life insurance
Medical aid
Pension fund
Retirement annuity
Salaried (n=103) Non-salaried (n=33*)
R6 000 – R8 000 personal monthly income
49
41
56
47
19
45
42
29
20
35
Life insurance
Medical aid
Pension fund
Retirement annuity
Household contents
Salaried (n=238) Non-salaried (n=61)
R8 000 – R17 000 personal monthly income
26
67
63
59
49
9
76
65
19
31
Loan from a bank
Life insurance
Medical aid
Pension fund
Provident fund
Salaried (n=99) Non-salaried (n=27**)
R17 000+ personal monthly income
* Caution: small base size ** Caution: very small base size

Scope for targeted education and selling of income cover and more extensive retirement
24
High
Low
Avg. personal monthly income
Key priorities (extremely important)
Key barriers to insurance take-up
Other insurance products
Others with life
Not served
Asset
Formal funeral
Burial
Size: 1.3m
Size: 17.8m
Size: 0.6m
Size: 4.5m
Size: 5.7m
R6 000
R6 500
R2 700
R1 700
R1 200
Others with
disability
Size: 0.6m R14 500
18% don’t want HH insurance; 18% no HH insurance because fees too high
52% pay school fees 64% provide for family if pass away
Others with
medical
Size: 2.2m
R18 000 62% money for old age / retirement
61% provide for family if pass away
Others with
income
Size: 0.6m
Income, Medical ,
Disability & Life
Size: 0.4m
R9 000
R15 000
15% no HH insurance because excess too high
31% no HH insurance because don’t trust pay-out
21% no HH insurance because value of things too low; 14% no HH insurance because don’t believe in insurance; 29% no life insurance – fear missing payment and losing money paid
60% money for old age / retirement
67% burial
41% formal funeral
67% formal funeral
70% life 56% asset
66% asset 70% life
33% medical 49% life
79% asset 84% formal funeral
Note: All figures quoted for direct cover in own name. Indirect cover not included in these figures.
49% provide for family if pass away 34% old age / retirement
Banking
Credit
Savings
Insurance
Contents
25
1
3 4
Who we spoke with
And what about people’s financial lives?
What has changed since 2004?
2 What do people’s lives look like today?

Banking, funeral cover and formal retirement products are star performers
26
46%
5%
15% 20%
6% 6% 9% 7% 11%
67%
8%
26% 28%
9% 10% 12% 11% 13%
2004 % 2012 %
Banked
13m → 22.5m
Formal funeral cover
4.2m → 8.7m
Burial society membership
6m → 9.5m
Stokvel, savings or investment
club membership
2.1m → 3.6m
Retirement annuity
2.1m → 3.1m
Provident fund
1.8m → 3.5m
Pension fund
2.7m → 4m
Life insurance
3.2m → 3.9m 1.5m → 2.6m
Credit card
Another 3% of adults in South Africa claim to have life insurance through someone else
Note: All figures quoted for direct cover in own name. Indirect cover not included in these figures.
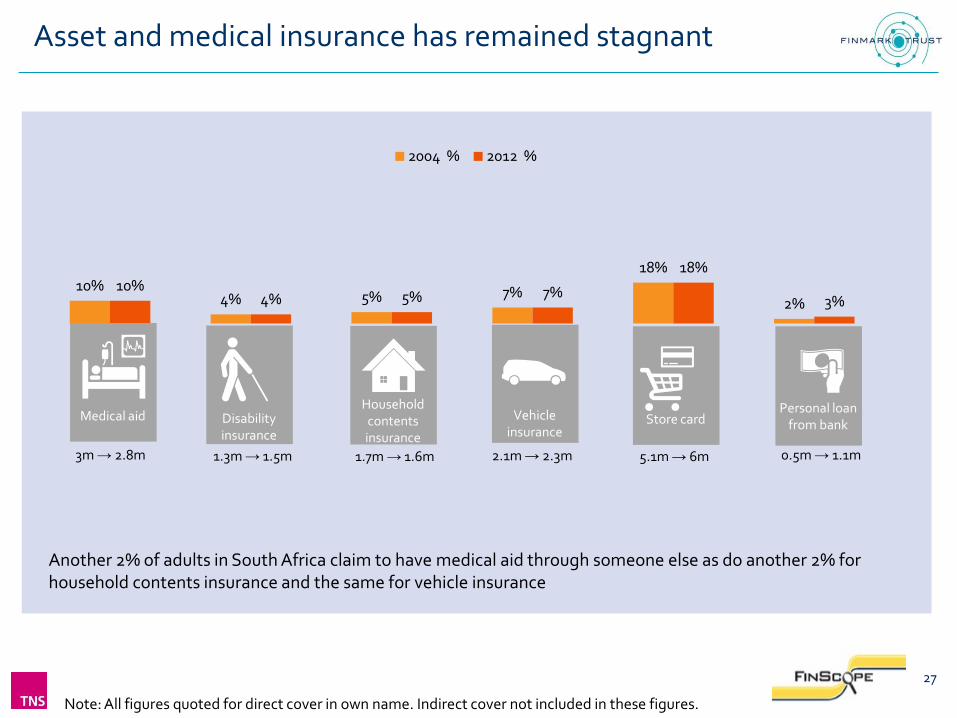
Asset and medical insurance has remained stagnant
27
10% 4% 5% 7%
18%
2% 10%
4% 5% 7%
18%
3%
2004 % 2012 %
Medical aid
3m → 2.8m
Disability insurance
1.3m → 1.5m
Household contents insurance
1.7m → 1.6m
Vehicle insurance
2.1m → 2.3m
Store card
5.1m → 6m
Personal loan from bank
0.5m → 1.1m
Another 2% of adults in South Africa claim to have medical aid through someone else as do another 2% for household contents insurance and the same for vehicle insurance
Note: All figures quoted for direct cover in own name. Indirect cover not included in these figures.
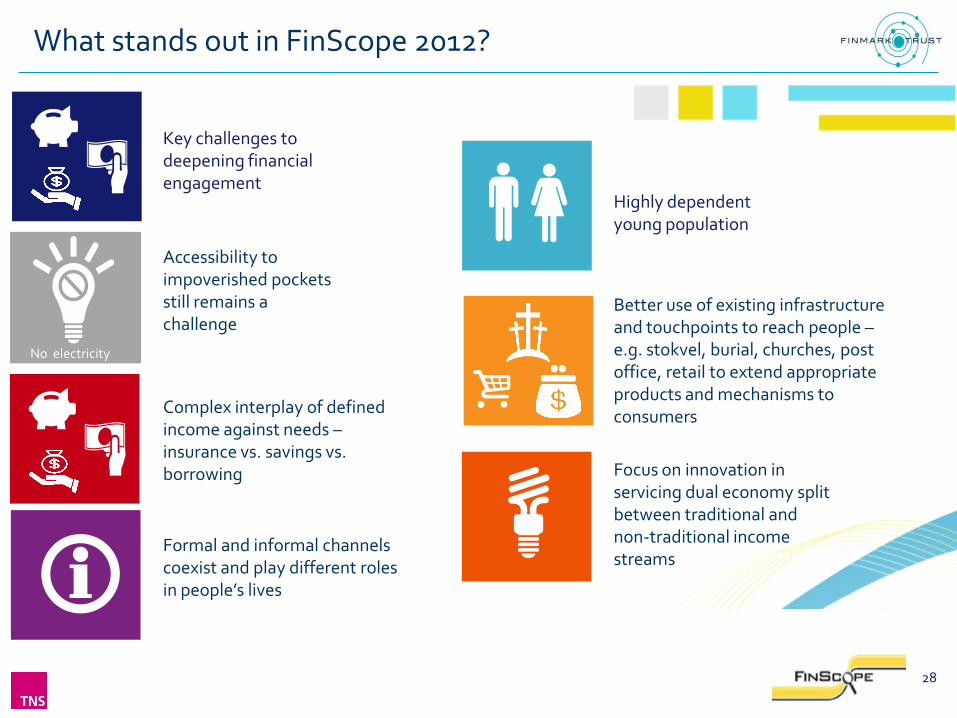
What stands out in FinScope 2012?
28
Complex interplay of defined income against needs – insurance vs. savings vs. borrowing
Better use of existing infrastructure and touchpoints to reach people – e.g. stokvel, burial, churches, post office, retail to extend appropriate products and mechanisms to consumers
Formal and informal channels coexist and play different roles in people’s lives
Focus on innovation in servicing dual economy split between traditional and non-traditional income streams
No electricity
Accessibility to impoverished pockets still remains a challenge
Highly dependent young population
Key challenges to deepening financial engagement


