
Issuer Filing Information
First Gulf Bank P.J.S.C.

ISSUER FILING INFORMATION
Type of Information: Issuer Filing Information
Date of Announcement: 30 March 2015
Company Name: First Gulf Bank P.J.S.C. (the "Issuer")
Name and Title of Representative: Christopher Wilmot Executive Vice President, Head of Treasury & Global Markets Rula Al Qadi Senior Manager, Group Funding, Treasury & Global Markets Group
Address of Head Office: P.O. Box 6316, Abu Dhabi, United Arab Emirates
Telephone: +971-2-681-6666
Contact Person: Attorney-in-Fact: Eiichi Kanda, Attorney-at-law Yu Nimura, Attorney-at-law Clifford Chance Law Office (Gaikokuho Kyodo Jigyo) Akasaka Tameike Tower, 6th Floor, 17-7, Akasaka 2-Chome, Minato-ku, Tokyo 107-0052 Telephone: 81-3-5561-6600
Financial Instruments Exchange Market: Not applicable
Address of Website for Announcement: http://www.jpx.co.jp/english/equities/products/tpbm/announcement/index.html
Notes to Investors:
1. TOKYO PRO-BOND Market is a market for professional investors, etc. (Tokutei Toushika tou) as defined in Article 2, Paragraph 3, Item 2(b)(2) of the Financial Instruments and Exchange Act of Japan (Act No. 25 of 1948, as amended, the "FIEA") (the "Professional Investors, Etc."). Notes listed on the market ("Listed Notes") may involve high investment risk. Investors should be aware of the listing eligibility and timely disclosure requirements that apply to issuers of Listed Notes on the TOKYO PRO-BOND Market and associated risks such as the fluctuation of market prices and shall bear responsibility for their investments. Prospective investors should make investment decisions after having carefully considered the contents of this document.
2. The regulatory framework for TOKYO PRO-BOND Market is different in fundamental aspects from the regulatory framework applicable to other exchange markets in Japan. Investors should be aware of the rules and regulations of the TOKYO PRO-BOND Market, which are available on Tokyo Stock Exchange, Inc. ("Tokyo Stock Exchange") website.
3. Tokyo Stock Exchange does not express opinions or issue guarantees, etc. regarding the content of this document (including but not limited to, whether this document contains (a) a false statement or (b) lacks information on: (i) important matters that should be announced or (ii) a material fact that is necessary to avoid misleading content) and shall not be liable for any damage or loss.
4. This Issuer Filing Information shall constitute and form the Issuer Filing Information (set forth in Article 27-32, Paragraph 1 of the FIEA as information set forth in Specified Exchange Regulations (as defined in Article 2, Paragraph 1, Item 1 of the Cabinet Office Ordinance on Provision and Publication of Information on Securities)).
i

5. All prospective investors who purchase the Notes should be aware that when they offer to purchase the Notes, they shall be required to enter into and agree the terms of a transfer restriction agreement with the Issuer and/or the person making a solicitation. The terms of such transfer restriction agreement provide that prospective investors agree not to sell, transfer or otherwise dispose of the Notes to be held by them to any person other than the Professional Investors, Etc., except for the transfer of the Notes to the following:
(a) the Issuer or the Officer (meaning directors, company auditors, executive officers or persons equivalent thereto) thereof who holds shares or equity pertaining to voting rights exceeding 50% of all the voting rights in the Issuer which is calculated by excluding treasury shares or any non-voting rights shares (the "Voting Rights Held by All the Shareholders, Etc." (Sou Kabunushi Tou no Giketsuken)) (as prescribed in Article 29-4, Paragraph 2 of the FIEA) of the Issuer under his/her own name or another person's name (the "Specified Officer" (Tokutei Yakuin)), or a juridical person (excluding the Issuer) whose shares or equity pertaining to voting rights exceeding 50% of the Voting Rights Held by All the Shareholders, Etc., are held by the Specified Officer (the "Controlled Juridical Person, Etc." (Hi-Shihai Houjin Tou)) including a juridical person (excluding the Issuer) whose shares or equity pertaining to voting rights exceeding 50% of the Voting Rights Held by All the Shareholders, Etc. are jointly held by the Specified Officer and the Controlled Juridical Person, Etc. (as prescribed in Article 11-2, Paragraph 1, Item 2 (c) of the Cabinet Office Ordinance on Definitions under Article 2 of the Financial Instruments and Exchange Act (MOF Ordinance No. 14 of 1993, as amended)); or
(b) a company that holds shares or equity pertaining to voting rights exceeding 50% of the Voting
Rights Held by All the Shareholders, Etc. of the Issuer in its own name or another person's name.
6. When (i) a solicitation of an offer to acquire the Notes or (ii) an offer to sell or a solicitation of an offer to purchase the Notes (collectively, "Solicitation of the Note Trade") is made, the following matters shall be notified from the person who makes such Solicitation of the Note Trade to the person to whom such Solicitation of the Note Trade is made:
(a) no securities registration statement (pursuant to Article 4, Paragraphs 1 through 3 of the FIEA) has been filed with respect to the Solicitation of the Note Trade;
(b) the Notes fall, or will fall, under the Securities for Professional Investors (Tokutei Toushika
Muke Yukashoken) (as defined in Article 4, Paragraph 3 of the FIEA); (c) any acquisition or purchase of the Notes by such person pursuant to any Solicitation of the
Note Trade is conditional upon such person entering into an agreement providing for the restriction on transfer of the Notes as set forth in 6 above, (i) with each of the Issuer and the person making such Solicitation of the Note Trade (in the case of a solicitation of an offer to acquire the Notes to be newly issued), or (ii) with the person making such Solicitation of the Note Trade (in the case of an offer to sell or a solicitation of an offer to purchase the Notes already issued);
(d) Article 4, paragraphs 3, 5 and 6 of the FIEA will be applicable to such certain solicitation,
offers and other activities with respect to the Notes as provided in Article 4, paragraph 2 of the FIEA;
(e) the Specified Securities Information, Etc. (Tokutei Shouken Tou Jouhou) (as defined in Article
27-33 of the FIEA) with respect to the Notes and the Issuer Information, Etc. (Hakkosha Tou Jouhou) (as defined in Article 27-34 of the FIEA) with respect to the Issuer have been or will be made available for the Professional Investors, Etc. by way of such information being posted on the web-site maintained by the TOKYO PRO-BOND Market (http://www.tse.or.jp/rules/probond/index.html or any successor website), in accordance with Articles 210 and 217 of the Special Regulations of Securities Listing Regulations Concerning Specified Listed Securities of the Tokyo Stock Exchange; and
(f) the Issuer Information, Etc. will be provided to the Noteholders or made public pursuant to
Article 27-32 of the FIEA.
7. In this document, unless otherwise specified, references to "Abu Dhabi" herein are to the Emirate of Abu Dhabi; references to the "Government" herein are to the government of Abu Dhabi; and references
ii

to the "UAE" herein are to the United Arab Emirates.
As used in this document, the term "billion" means one thousand million (1,000,000,000).
In this document, references to "US$" are to United States dollars being the legal currency for the time being of the United States of America; and references to "AED" are to U.A.E. dirham being the legal currency for the time being of the U.A.E. The dirham has been pegged to the U.S. dollar since 22 November 1980.
iii


His Highness Sheikh Khalifa Bin Zayed Al NahyanPresident of the United Arab Emirates

His Highness General Sheikh Mohamed Bin Zayed Al NahyanCrown Prince of Abu DhabiDeputy Supreme Commander of the UAE Armed Forces


His Highness Sheikh Tahnoon Bin Zayed Al NahyanChairman
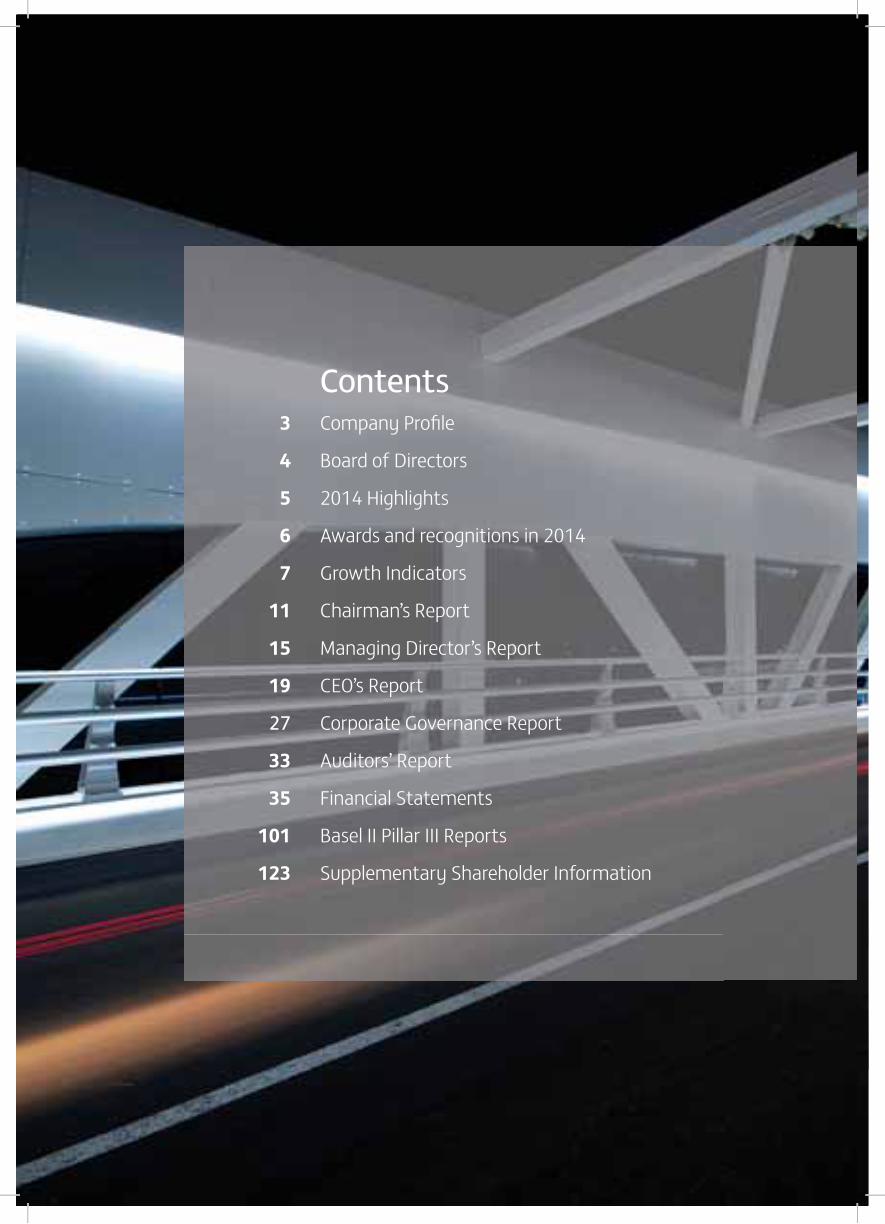
Contents 3 Company Profile
4 Board of Directors
5 2014 Highlights
6 Awards and recognitions in 2014
7 Growth Indicators
11 Chairman’s Report
15 Managing Director’s Report
19 CEO’s Report
27 Corporate Governance Report
33 Auditors’ Report
35 Financial Statements
101 Basel II Pillar III Reports
123 Supplementary Shareholder Information

2

3
The Bank offers a full range of financial products and services through its Wholesale & International, Consumer and Treasury & Global Markets businesses and is focused on achieving its mission to be the ‘First’ choice for customers.
Internationally, FGB operates through branches in Singapore and Qatar, representative offices in India, Hong Kong, South Korea and the UK, and a ea and the UK, and a a and the UK, and a subsidiary in Libysubsidiary in Libysubsidiary in Libya.
In 2014, FGB was named the ‘Best Bank in the United Arab Emirates’ and ‘Best Wealth Management Firm’ at the Banker Middle East Industry Awards. It was also ranked as the 8th most powerful company in the Arab World in Forbes’ ‘Top 500 companies in the Arab World’ list FGB was also recently recognised as anlist FGB was also recently recognised as anlist. FGB was also recently recognised as an
“Employer of Choice” at the GCC Best Employer Brand Awards 2014, and has been honoured inthe SME Banking Sector category of the inaugural Enterprise Agility Awards.
FGB is committed to the development of the UAE and its people and supports initiatives that atives that atives that have a positive and sustaia positive and sustaina positive and sustainable impact on the communities it operates in.
FGB is rated among the strongest financialinstitutions in the Middle East: A2 by Moody’s, A+ by Fitch, A+ by Capital Intelligence and AAA by RAM Ratings of Malaysia.
Established in 1979, FGB has been listed on theAbu Dhabi Securities Exchange (ADX) since 2002.)
FGB is one of the leading banks in the United Arab Emirates. It is the ading banks in the United Arab Emirates It is theeding banks in the United Arab Emirates It is thenumber one bank in the UAE in net profits for 2014, for the second year in a row, and the number three by total assets.
Company Profile

4
H.H. Sheikh Tahnoon Bin Zayed Al Nahyan Chairman
Ahmed Ali Al Sayegh Vice Chairman
Abdulhamid Mohammed Saeed Board Member & Managing Director
Khaldoon Khalifa Al Mubarak Board Member
Sultan Khalfan Al Ktebi Board Member
Mohamed Saif Al Suwaidi Board Member
Board of Directors
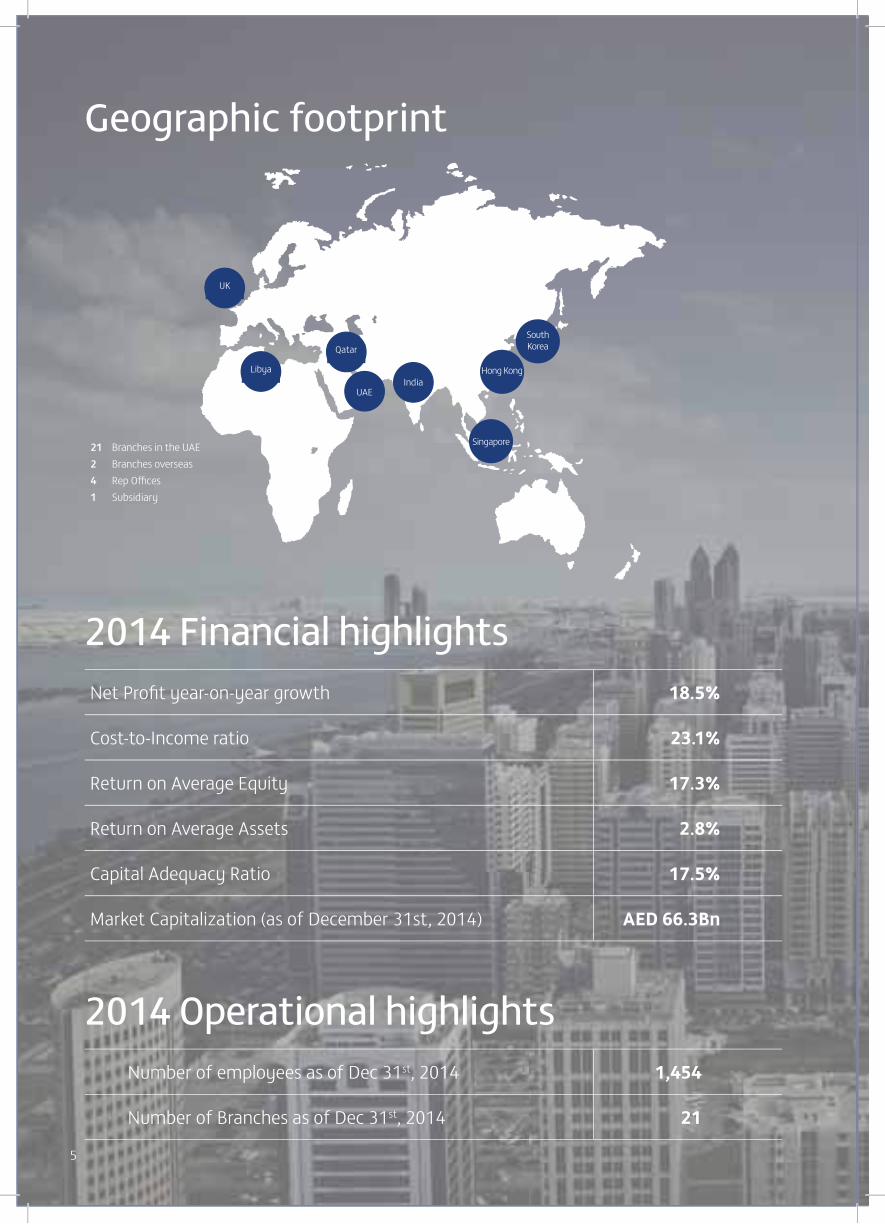
Geographic footprint
Qatar
UK
Libya
UAEIndia
Singapore
Hong Kong
SouthKorea
21 Branches in the UAE 2 Branches overseas4 Rep Offices1 Subsidiary
2014 Financial highlightsNet Profit year-on-year growth 18.5%
Cost-to-Income ratio 23.1%
Return on Average Equity 17.3%
Return on Average Assets 2.8%
Capital Adequacy Ratio 17.5%
Market Capitalization (as of December 31st, 2014) AED 66.3Bn
2014 Operational highlightsNumber of employees as of Dec 31st, 2014 1,454
Number of Branches as of Dec 31st, 2014 21
5
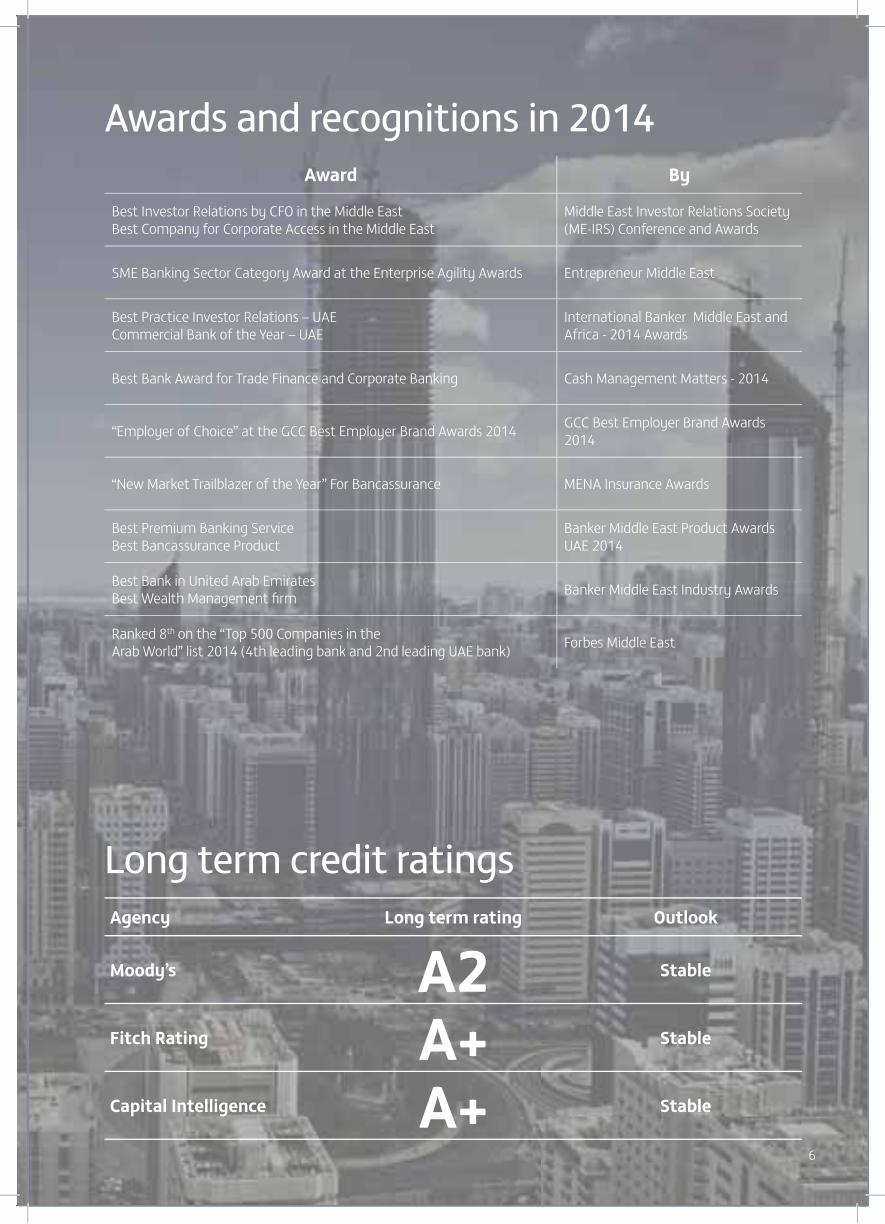
Long term credit ratingsAgency Long term rating Outlook
Moody’s A2 Stable
Fitch Rating A+ Stable
Capital Intelligence A+ Stable
Awards and recognitions in 2014Award By
Best Investor Relations by CFO in the Middle EastBest Company for Corporate Access in the Middle East
Middle East Investor Relations Society (ME-IRS) Conference and Awards
SME Banking Sector Category Award at the Enterprise Agility Awards Entrepreneur Middle East
Best Practice Investor Relations – UAECommercial Bank of the Year – UAE
International Banker Middle East and Africa - 2014 Awards
Best Bank Award for Trade Finance and Corporate Banking Cash Management Matters - 2014
“Employer of Choice” at the GCC Best Employer Brand Awards 2014 GCC Best Employer Brand Awards 2014
“New Market Trailblazer of the Year” For Bancassurance MENA Insurance Awards
Best Premium Banking ServiceBest Bancassurance Product
Banker Middle East Product Awards UAE 2014
Best Bank in United Arab EmiratesBest Wealth Management firm Banker Middle East Industry Awards
Ranked 8th on the “Top 500 Companies in the Arab World” list 2014 (4th leading bank and 2nd leading UAE bank) Forbes Middle East
6
7
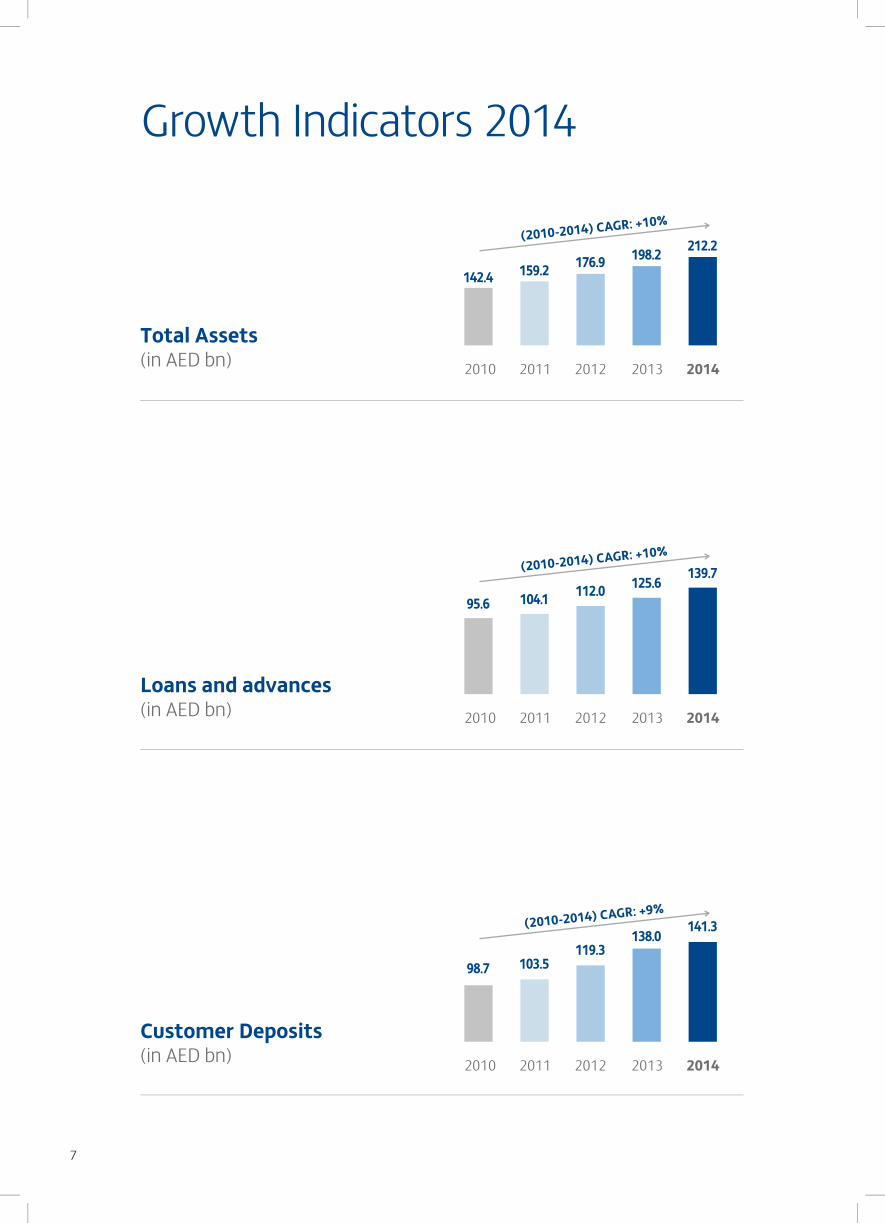
Total Assets(in AED bn) 2010 2011 2012 2013 2014
142.4 159.2 176.9 198.2 212.2(2010-2014) CAGR: +10%
Loans and advances(in AED bn) 2010 2011 2012 2013 2014
95.6 104.1 112.0 125.6 139.7(2010-2014) CAGR: +10%
Customer Deposits(in AED bn) 2010 2011 2012 2013 2014
98.7 103.5119.3
138.0 141.3(2010-2014) CAGR: +9%
Growth Indicators 2014

8
Shareholders' equity(in AED bn) 2010 2011 2012 2013 2014
24.1 26.7 29.3 31.2 34.1(2010-2014) CAGR: +9%
Net Profit(in AED mn) 2010 2011 2012 2013 2014
3,420 3,707 4,1544,774
5,656(2010-2014) CAGR: +13%
(2010-2014) CAGR: +16%
Revenues(in AED mn) 2010 2011 2012 2013 2014
(2010-2014) CAGR: +10%
6,305 6,483 7,2708,421
9,240
Earnings Per Share(in AED) 2010 2011 2012 2013 2014
0.79 0.88 1.001.16
1.42

9

“Our success is founded upon the strength of our partnerships – with our shareholders, customers and correspondent banks – and we would like to thank in particular the UAE Central Bank.”
Tahnoon Bin Zayed Al NahyanChairman
11
The nation’s favorable operating environment
again contributed to our strong performance.
The United Arab Emirates (UAE) 2014 GDP grew
by 4.7% on the back of continued government
spending and positive trends in the tourism,
transport and trade sectors. For the UAE
economy, the early part of 2014 was a period of
consolidation as core economic as core economic sas core economic sectors continued
to perform well amidst challenging regional and
global conditions. In the second half of the year,
oil prices dropped to five-year lows, creating a
testing environment that sees the UAE again
display its resilience as continued economic
diversification, comfortable reserves and a solid
regulatory framework help it carry on with its
dddddevelopment plans.
ternational Monetary Fund nternational Monetary Fund According to the International Monetary Fund
(IMF), lower oil-related revenues would translate
to real GDP growth of 3.5% in the UAE for both
2015 and 2016, driven by the sustained and
ongoing strength of non-oil economic growth.
In a global context, the UAE continues to stand out
as an unrivaled and highly competitive regional
hub, as evidenced by its poas evidenced by its poss evidenced by its position as the only Arab
country in the top 20 of the World Economic
Forum’s Global Competitiveness Index Report.
Looking at the UAE banking industry, private
sector credit growth continued to strengthen
during 2014. This, combined with ample liquidity,
robust capital levels and improving asset quality
indicators, contributed to support earnings upport earnings upport earnings pport earnings pport earnings
growth throughout the year.
Against the background of a positive UAEAgainst the backgrounAgainst the backgrou
economic outlook, FGB will remain focused
On behalf of the Board of Directors, I am pleased to present to our shareholdersthe Audited Financial Statements of FGB for the year ended 31 December2014, reflecting our continued succes2014, reflecting our continued success2014, reflecting our continued success by delivering record profits. Notably, the year 2014 marked our 35th anniversary as we continued to make significant progress towards achieving our long term strategic plans.
Chairman’s Report

12
on enhancing capabilities within core banking
businesses, optimising synergies across the FGB
group and maintaining prudent international
expansion. Our customer driven enhancements
will continue at pace, and we will maintain our
disciplined and sustainable growth focus.
I am pleased to report that FGB achieved a full
year net profit of AED 5.66 billion in 2014, an
increase of 18% compared to AED 4.77 billion in
2013. We have strengthened our position as oner position as one r position as one
of the leading baof the leading banof the leading banks in the UAE, validated by the
numerous industry awards won in 2014, including
“UAE Bank of the Year” from ‘The Banker’ for a
second year in a row.
In light of our strong financial performance, the
Board of Directors recommended the distribution
of 100% cash dividends and 15.38% bonus shares.
This implies total cash dividends of AED 3.9 billion
for the year 2014, compared with AED 3.0 billioar 2014, compared with AED 3.0 billionr 2014, compared with AED 3.0 billion th AED 3.0 billion th AED 3.0 billion th AED 3.0 billion th AED 3.0 billion
distribution i 20i 20i 20i 20 distribution in 2013. Once again, FGB’s dividend distribution
as the highest among the UAE’s leading banks as the highest amonwas the highest amo
in 2014.
I would like to express my gratitude, as well as that
of our Board, to the President of the United Arab
Emirates, Sheikh Khalifa Bin Zayed Al Nahyan for
his leadership and inspiration to our nation.his leadership and inspiration to our nation.his leadership and inspiration to our nation
We also thank His Highness Sheikh Mohammed
Bin Rashid Al Maktoum, Vice President, Prime
Minister and the Ruler of Dubai, His Highness
Sheikh Mohamed Bin Zayed Al Nahyan, Crown
Prince of Abu Dhabi and their Highnesses andhnesses andhnesses and
all members of the Smbers of the Smbers of the Supreme Council for their
support and guidance.
Our success is founded upon the strength of our
partnerships – with our shareholders, customers
and correspondent banks – and we would like to
thank in particular the UAE Central Bank.
Finally, I would like to express my gratitude to our
employees, whose dedication and contribution
were at the heart of our success, and I look cess, and I look ess, and I look s, and I look s, and I look , and I look , and I look
e achievements together.ffforward to oforward to oforward to ouforward to ou re achievementsforward to our future achievements
Tahnoon Bin Zayed Al NahyanChairman

13

“We would like to take this opportunity to thank our shareholders for their support in 2014 and we look forward to the future with excitement and optimism.”
Abdulhamid Mohammed SaeedManaging Director
15
I will start with FGB’s new brand identity and the
‘Be First’ positioning, which we proudly unveiled
last year. Beyond the identity change, we
reviewed our corporate values ensuring that our
guiding principles drive and complement our longnd complement our longd complement our long
term sterm sterm strategic ambitions.
This further demonstrates our strong
determination to take the FGB growth story to
the next level, both in the UAE and abroad. Our
solid performance in 2014 was a direct result of
a strengthened business model where greater
emphasis was put on building specialisation and
ti iti iti iti ioptimising synergies within the Group. With
this, we are able to serve our customers better,
a seamless experience across a seamless experience across offering them a seamless experience across
businesses and geographies, while supporting
the diversification of our revenue streams.
Thanks to these important initiatives and our
firm commitment to customer-centricity, FGB is
in a unique position to harness e position to harness position to harness its full potential
and compete effectively in an ever-evolving and
challenging operating environment.
Today, FGB has three solid core businesses; the
Wholesale and International Banking Group
(WBG), the Consumer Banking Group (CBG) and
the Treasury & Global Markets Group (T&GM).
Each one of these businesses has undergone Each one of these businesses has undergone Each one of these businesses has undergone
considerable changes during 2014:considerable changes during 2014:considerable changes during 2014:considerable changes during 2014:considerable changes during 2014:
nal Banking Group nal Banking Group The Wholesale & International Banking Group
adopted a new operating model by establishingadopted t
four distinct product platforms: Debt Markets,
FGB achieved a number of key milestones in 2014 that strengthen our position as one of the leading banks in the region. In this message, I am proud to highlight the progress we made in 2014 towards achieving our strategic ambitions, andto set out our plans for 2015 and beyond.
Managing Director’s Report

16
Global Transaction Services, Wholesale Islamic
Finance and Corporate Finance. Within the
Consumer Banking Group, a heightened focus on
innovation, technology and customer-centricity
were the key drivers of a strong performance,
allowing FGB to maintain its leading position as
one of the top retail banking franchises in the
UAE. The Treasury & Global Markets Group has
transitioned from a traditional treasury business,
managing the liquidity of the bank, into a
diversified revenue-generating product engine.
Today, we have a world class T&GM platform
which is being leveraged across all businesses to
ensure comprehensive client coverage. Last but
not least, we ensured seamless integration of
our new subsidiaries Dubai First and Aseel Islamic
Finance, as they perfectly complement and add
value to the FGB Group’s existing operations.
Our client-focused strategy is enabling us to play
to our strengths. While remaining deeply rooted
in the UAE, we are also selectively ee also selectively ealso selectively expanding our
franfrancfranchise internationally to service our chosen
clients in specific markets. Accordingly, during
2014 we were proud to open new representative
offices in London and Seoul and we started
offering our Global Wealth Management Services
out of our Singapore branch.
We strengthened our liquidity profile during the
year with an enhanced focus on diversifying
sources of funding. Notably, five issuances in ding. Notably, five issuances in ing. Notably, five issuances in issuances in issuances in issuances in issuances in
n werefour differenfour differenfour differentfour different bn werefour different currencies totaling AED 1.7bn were
d during 2014, and FGB was the first ed during 2014, ancompleted during 2014, an
MENA issuer on the Tokyo Pro-Bond market.
Looking to the future, we remain committed to
generating solid and sustainable growth while
on our own on our own putting customers first. This relies on our own
people to deliver the FGB brand promise and we
strive to recruit, develop and retain a talented
workforce in alignment with our values. Key to
this, our Business School continues to enhance
employee growth, and I am proud that our Nujoom
graduate programme successfully nurtured 18
talented young UAE nationals who graduated
from the course last year, adding to the new
talent joining the Bank to enhance our institutional
knowledge, experience and ambitions.
This investment in our people, coupled with
ss efficiencies ess efficiencies our continued focus on business efficiencies
through technology enhancements, is critical
to support future scalability and performance,
as well as to provide differentiation in a highly
competitive environment.
We would like to take this opportunity to thank
our shareholders for their support in 20r support in 20r support in 2014, and
we look forwwe look forwawe look forward to the future with excitement
and optimism.
Abdulhamid Mohammed SaeedManaging Director

17

“Our focus remains on continuing to grow our balance sheet in a controlled manner, diversifying our sources of income, and expanding our product and client base in addition to our geographical presence.”
André SayeghChief Executive Officer
19
2014 in Review
At the close of 2014, our net profit amounted to profit amounted to profit amounted to
AED 5 66 bAED 5 66 bAED 5.66 billion, representing an 18% increase on
2013 figures. Growth was attained for all business
groups - each of the Wholesale & International
Banking Group and the Consumer Banking Group
generated 38% of revenues, while the Treasury
& Global Markets Group contributed 13%. The
remaining 11% of revenues was generated by
subsidiaries and associates.
We were very pleased with the steady progress of
WBG’s international operations, which contributed
5.6% of our overall revenues. With plans to expand5 6% of our ov5 6% of our ov
into China in the near future, in addition to our
recent expansion activities in Souton activities in Souton activities in South Korea and
London and upgrading our presence in India, we
are expecting increased future revenue from our
overseas operations.
During 2014, revenues increased by 10% to AED
9.24 billion. Net Interest and Islamic Financing
income grew by 8% to AED 6.47 billion. As
predicted, surplus liquidity in the UAE banking gg
system and increasing competition continued to competition continued to competition continued to competition continued to competition continued to
put pressure on Net Interest Margins (NIMs) in the
Ms only IMs only last quarter of the year. Nevertheless, NIMs only
reduced by 10 basis points Year-on-Year to 3.6% reduced by 10 basisreduced by 10 basis
as of December-end 2014.
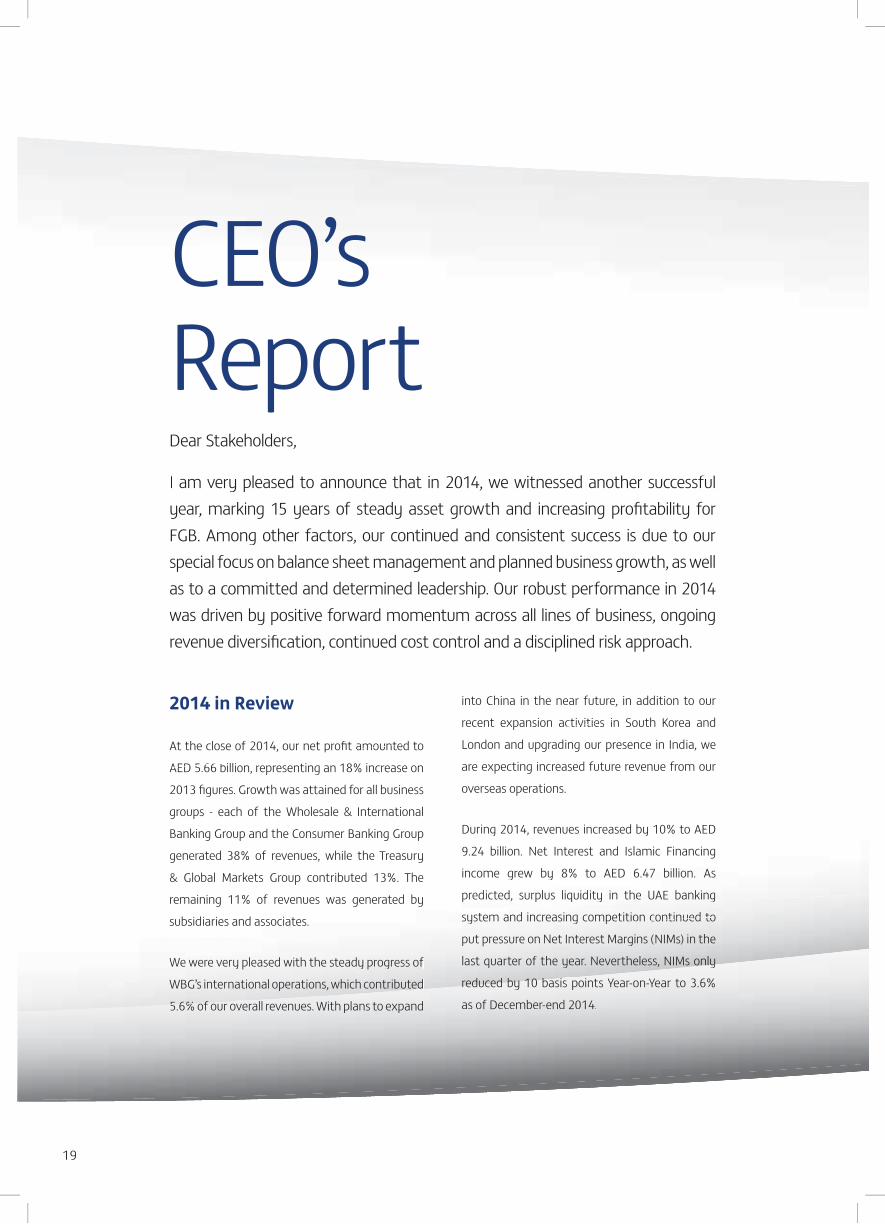
Dear Stakeholders,
I am very pleased to announce that in 2014, we witnessed another successfuld h f ld h f lyear, marking 15 years of steady asset growth and increasing profitability for FGB. Among other factors, our continued and consistent success is due to ourspecial focus on balance sheet management and planned business growth, as well as to a committed and determined leadership. Our robust performance in 2014 was driven by positive forward momentum across all lines of business, ongoing revenue diversification, continued cost control and a disciplined risk approach.
CEO’sReport

20
Total Shareholders’ Equity amounted to AED
34.1 billion as of December-end 2014, up 9%
compared to the same period last year. The bank’s
capital base remained robust, with a Capital
Adequacy Ratio of 17.5% and a Tier 1 capital of
16.2% after dividend distribution. Earnings per
Share increased by 22% Year-on-Year to AED 1.42.
Our liquidity, measured by our loan to deposit ratio,
remained strong throughout the year landing
at 98.9% as of December-end 2014. Due to FGB
policy, which is built on strong Credit and Risk
acceptance criteria, our asset quality remained acceptance criteria our asset quality racceptance criteria our asset quality r
healthy with the ratio of non-performing loans
improving to 2.5% in 2014, down from 3.3% in
2013, with an enhanced provision coverage ratio
at 126.7%.
Our success in 2014 came to confirm that the
repositioning of our businesses, which started
in 2013, focusing on three core pillars (namelyre pillars (namelye pillars (namely
Wholesale & InteWholesale & InterWholesale & International Banking, Consumer
Banking and Treasury & Global Markets), is leading
us towards attaining our stated objectives.
Furthermore, aligned with our efforts to refocus
on our core business areas, we signed a Share
Purchase Agreement with Integrated Financial
Group (IFG), a subsidiary of Abu Dhabi Financial
Group (ADFG), for the sale of the bank’s 45% stake
in the brokerage firm First Gulf Financial Services.
ivities, weWithWithWithWith tivities, weWith regards to our international activities, we
r first issuance in the Australian market r first issuance enacted our first issuance
through our debut ‘Kangaroo’ 5-year bond, which
has proven to be very successful garnering a high
level of interest from international investors. In
Singapore, we concluded a Negotiable Certificate
of Deposit (NCD) programme, the first by a
Middle Eastern bank in the Asia Pacific (APAC)
market. We had also concluded a 5-year JPY10
billion bond as part of the USD 1 billion Tokyo Pro-
Bond Market programme registered by the bank.
FGB is determined to maximise value for its client
groups, and our shareholders’ trust and confidence
over the years has led us to become the second
largest UAE bank by market capitalisation,
recorded as AED 66.3 billion as of December-end
ck is receiving even moreck is receiving even more2014. In addition, our stock is receiving even more
interest from international institutional investors
and EM portfolio managers since we were included
in the MSCI Emerging Market index in June 2014.
Reflecting our culture and drive for success, our
new ‘FGB’ brand identity and our ‘Be First’ slogan,
supported by our strong set of values, providf values, providef values, provide a
solid platform for grd platform for grd platform for growing our business. The FGB
brand supports our strategy – to focus on ensuring
that the customer sits at the heart of everything
we do, driving specialisation, diversifying product
portfolios and enhancing performance.
Our successes and innovative spirit did not go
unnoticed. In 2014, we received numerous awards
and recognitions, including securing runner-up
position in the ‘Best Trade Finance Bank in the
Middle East & North Africa’ category of the Global
wards’. FGB Trade Review’s 2014 ‘Leaders in Tw’s 2014 ‘Leaders in Trw’s 2014 ‘Leaders in Trad14 ‘Leaders in Trad14 ‘Leaders in Trade4 ‘Leaders in Trade wards’. FGB 4 ‘Leaders in Trade Awards’. FGB
d the title despite facing stiff competition d the title despitscooped the title despit
from a host of banks operating across the MENA
region, and is the top local bank in this category.
We were also named ‘New Market Trailblazer of
the Year’ at the prestigious 2014 MENA Insurance
two Banker Middle East two Banker Middletwo Banker Middletwo Banker Middlen two Banker Middlen two Banker Middlewon two Banker Middle, won two Banker MidAwards ceremony, won two Banker Mid

21
UAE Product Awards 2014 in the ‘Best Premium
Banking Service’ and ‘Best Bancassurance
Products’ categories, and two 2014 Banker
Middle East Industry Awards, including ‘Best
Bank in United Arab Emirates’, for the second
year running, and ‘Best Wealth Management
Firm’. Furthermore, Forbes Middle East magazine
ranked FGB as the 8th most powerful company in
the Arab World in its ‘Top 500 companies in the
Arab World’ rankings.
The Business Groups:
Wholesale and International Banking Group
Our success and growth this year is a clear
endorsement of our ‘client first’ strategy, and a
particular focus within our group to grow both our
expertise and breadth of operations.
The WBG group ended the year recording AED
3.48 billion in revenues, a 7% increase from last
year. Total assets recorded a 13% increase from
last year to AED 91.3 billion. We have made a ade a
number of remarkable aer of remarkable aer of remarkable achievements in several
areas. Notably, and despite growing competition
in the sector, FGB took the number one spot in the
UAE syndicated loan league table (up from 10th
in 2013). In addition, we ranked 2nd on the 2014
MENA Loan Mandated Arranger League tables,
up from 34th position last year. Also, and for
h fih fithe very first time, FGB’s Debt Markets Platform
was involved as book runner in awas involved as book runner in awas involved as book runner in awas involved as book runner in awas involved as book runner in a number of key
transactions, such as the EMAAR Malls bond and
the Mubadala GE 144A bond.
Diversification is still a key theme, and we
worked on applying it to our clients, products and
geographies, making important advances in each
of those areas, where we successfully broadened
many of our funding sources.
On the international front, we have enhanced
our global presence in two important markets,
Seoul and London, in addition to refocusing our
Financial Institutions Coverage Group so that we
can support our clients in countries where they
are active. Our international growth strategy was
validated by global locations, providing 15% to lid t d b l b l l ti pro iding 15% toalidated b global locations pro iding 15% to
WBG Revenues during 2014. We continue to seek
further expansion in the near future as we evolve
to meet clients’ needs, particularly in Asia.
We have also invested in new product capabilities
across four key streams; Global Debt, Global
Transaction Services, Wholesale Islamic Finance,
and the recently launched Corporate Finance
business. In addition, we made significant
investments in platforms necessary to deliver the
cash and trade business across foubusiness across foubusiness across four main areas;
cash management, trade finance, channels and
client services.
Another key highlight is the ongoing upgrade of
our Global Transaction Services business in order to
move from “plain vanilla”, traditional cash and trade
offerings, to include more structured trade finance
propositions to customers in the UAE and abroad.s to customers in the UAE and abroad.to customers in the UAE and abroad.
In 2014 we grew our presence in the airline
ancings related ancings related sector, most notably in aircraft financings related
to Boeing 787, Airbus A320, and Airbus A380 to Boeing 7to Boeing
deliveries for Etihad Airways, providing a funding

22
package for the acquisition of Boeing 777-300ER
aircrafts on behalf of Emirates Airlines, and
participating in a club finance lease related to
Airbus A320 deliveries for Air Arabia.
With a clear strategy in place, new talent and
expertise within the team, and greater growth
plans for the coming year, we are optimistic
that we will maintain strong results in 2015 as
we continue to work on enhancing our unique
offering and refining our competitive edge. Our
aim is to build on the key achievements of 2014
and to continue to enhance WBG offerings andand to continue to enhanceand to continue to enhance
develop further synergies and efficiencies with
the rest of the organisation to ensure the group’s
long-term competitiveness.
Consumer Banking Group
Our Consumer Banking Group continued to present
a solid performance throughout 2014, returning 2014, returning 2014, returning
positive growth revsitive growth revsitive growth revenues of AED 3.53 billion,
representing a 4% increase from 2013. Growth
was registered for both Assets, which expanded
by 7% to AED 49.9 billion, and Customer Deposits
which expanded by 10% to AED 37 billion. We
are proud to have made important achievements
across all businesses in the UAE. Our international
footprint now includes the recent establishment of
our booking centre in Singapore, to provide wealth
customers with greater access to opportunities in
the Asia Pacific region, while cothe Asia Pacific region, while conthe Asia Pacific region, while connecting customgion, while connecting customgion, while connecting customgion, while connecting customgion, while connecting customers
in Singapore to the UAE.
Our customers lead everything we do as a bank;
we always strive to put them first. We have
rolled out several customer centric products and
services across the consumer banking sector. The
diverse range of CBG’s products was recognised
by the industry with two Banker Middle East
UAE Product Awards 2014 in the ‘Best Premium
Banking Service’ and ‘Best Bancassurance
Products’ categories. For the second year in
a row, FGB was also named the ‘Best Wealth
Management Firm’ at the 2014 Banker Middle
East Industry Awards.
FGB have focused on enhancing our Customer
or the swift resolution or the swift resolution Care Unit operations for the swift resolution
of any customer issues that arise. Significant
improvements were made to our existing digital
& online capabilities and the ATM network. These
new e-services offer more channels through which
customers can reach us thereby expanding our
accessibility whilst ensuring that we keep up to date
digitally to make sure that our services are ger services are genr services are genuinely
innovative and coinnovative and coinnovative and competitive.
FGB will remain focused on driving our business
forward through our proven Consumer Centric
model, to enhance our customers’ experiences,
and broaden our products & services, with a strong
focus on Revenue, Customer Growth and Profits.
Treasury and Global Markets Group
We entered 2014 with a clear goal; growing our
ed GlobalTreasury function into a fully-fledgunction into a fully-fledgunction into a fully-fledgedn into a fully-fledgedn into a fully-fledged into a fully-fledgedged Global into a fully-fledged Global
ness. In order to achieve this, weiness. In orderMarkets business. In order
have invested in creating stronger partnerships
between the Treasury and Global Markets Group
and the bank’s other businesses. This approach
has been applied to all our operations and, even
against a backdrop of highly volatile global
we are beginning to reap we are beginning to we are beginning to we are beginning to we are beginning to we are beginning toets, we are beginning toets, we are beginningand regional markets, we are beginning

23
the benefits of a much more efficient business
approach as a result.
Our T&GM group performed solidly over the
past year. By the end of 2014, the group had
contributed AED 1,227 billion to FGB’s overall
revenue, achieving 10% year-on-year growth.
Five issuances in four different currencies totaling
AED 1.7bn were completed during 2014, and FGB
was the first MENA issuer on the Tokyo Pro-Bond
market as we continued to apply our strategy of
diversifying our income sources from the Middle
East, Europe, Australia and Asia.East Europe Australia and Asia
To enhance customer benefit, we have been
expanding our product range through adding
commodities and risk management solutions to
our offerings, and by expanding our international
reach in areas such as Singapore. We have also
increased our operating hours and launched a new
informational portal for our clients – FGB Insight.
Moving forward, we will continue to operate
in line with our successful 2014 strategy. We
will continue to sustainably expand our global
footprint, looking into new emergent marto new emergent markets
dand grow our client base, not just from other FGB
businesses, but also from sectors we have not yet
penetrated. We will ensure that we are in line with
all current and potential Central Bank regulations,
such as the forthcoming Basel III glide-path on
the Liquidity Coverage Ratio, which we are now
compliant with.
Aseel Islamic Finance
ur We welcomed Aseel Islamic Finance into our
FGB family with the acquisition of the entity asFGB famil
a fully owned subsidiary of FGB. With a strategic
direction to offer a wider range of Sharia-
compliant products in the UAE, Aseel announced
a number of product launches in 2014.
A key focus for operations was the SME segment,
where we identified a clear gap in funding
options that were being provided to this group.
We released our Business Finance Solutions for
small and medium-sized enterprises to help them
in managing their cash-flow requirements, in
addition to our Aseel Business Credit Card, which
assists SME owners in tracking their expenses. The assists SME owners in tracking their expenses The
product offers users a grace payment period up
to 51 days to support their business cycles and
operations. We continued to support the UAE’s
real estate sector, which was our core area prior
to the acquisition.
Moving into 2015, we will stay true to our
brand promise of providing fully-fledged Sharia-
complaint banking solutions to UAE residents.
We will continue to grow our product and client
portfolio, and will work towards creatinl work towards creating strategic
alliances with key parties to offer our customers
innovative services.
Dubai First
Dubai First is continually looking at ways to
incorporate Dubai’s most important trends into
its operations, such as developing products that
support the tourism, trade and real estate sectorstrade and real estate sectorstrade and real estate sectors
of the Emirate. We also believe that we need to
hich will be asupport the growing SME market, which will be a
focus during 2015.focus during 20
24
Looking forward, we aim to work towards
enhancing our corporate governance framework,
increasing our market visibility and increasing our
product suite.
Business Support:
Human Resources
Our team is at the heart of our success, and we
are committed to enhancing our employees’
capabilities to enable our business and our people
to grow together.to grow together.
The FGB Business School continues to provide
staff members with innovative banking,
managerial and functional courses and over
90% of employees enrolled in our different
programmes in 2014. We also implemented a
bank-wide education programme, Service First, to
help us in meeting our customers’ requirements equirements
and ambitions in line witons in line with our ‘Be First’ brand.
We remain committed to increasing the number
of Emiratis employed in the financial and banking
sector, and are continuing to invest in our UAE
national employees, notably via our Al Masar
programme, which focuses on preparing our junior
Emirati talent for more senior roles. Furthermore,
we are overseeing the career progress of 24
Nujoom graduates (our fast-track management
trainee programme) who are currently workingogramme) who are currently working in rrently working in rrently working in
differentdifferentdifferent divisions in the bank.
The bank’s efforts on this front have been
recognised internally and externally. Our annual
engagement survey showed, once again, that our
employees exhibited strong commitment to the
organisation. FGB also received the ‘Employer of
Choice’ title at the GCC Best Employer Awards
2014, which is organised by the Employer
Branding Institute and endorsed by the Asian
Confederation of Businesses.
Information Technology
During 2014, our Information Technology
department’s new leadership team strategically
focused on providing a work environment that is
efficient, products that meet customer needs, and
on enhancing people’s IT skills across the company.on enhancing people’s IT sk
We have developed a roadmap to transform the
current technological infrastructure and to support
the implementation of FGB’s key strategic themes.
We have also launched various tools to promote
employee productivity and multiple business
solutions to enhance customer expericustomer experience.
Moving forward, IT will continue to work on
various initiatives such as implementing our
new Customer Relationship Management (CRM)
system, and on taking active steps towards the
digital transformation of our bank’s operations.
Enterprise Risk Management
We have established a robust Enterprise Risk
Management (ERM) framework to manage and
ntegratedoptimise risks across the FGB Group in an inacross the FGB Group in an intethe FGB Group in an intethe FGB Group in an integrated
system focuses on supporting themanner. The system focuses
strategic alliance and solid co-operation of all the t
bank’s business groups, maintaining solid capital
and liquidity rates and a robust portfolio, in addition
to applying diligent risk management practices,
whilst abiding with all the Central Bank’s policies
ments.and other regulatory requirements.

25
Our ERM strategy was developed in line with
international best practices, allowing for a holistic,
unified risk management approach across the
bank’s operations.
We are proud of the key achievements that
we’ve made throughout the year. In addition to
formalising our Risk Appetite framework across
the group, we updated our Corporate Governance
policy and held a thorough review of our
Compliance and Information Security framework
by benchmarking it against global examples.
Looking ahead, we will continue to build on
our ERM framework, in all areas, whilst placing
an increased emphasis on Legal and Fraud risk
management frameworks.
Looking Ahead
Our strategy in 2014 has proven to be very
successful, and we will continue to work along the
same principles throughout 2015.
Our focus remains on continuing to grow our
balance sheet in a controlled manneeet in a controlled manneet in a controlled manner, diversifying
our sources of income, and expanding our product
and client base, in addition to our geographical
presence. Customers will continue to be at the
heart of all our operations, our values and our
brand.
Over the next three years, we will remain focusedOver the next three years, we will remain focusedOver the next three years, we will remain focused
on enhancing and specialising our core business specialising our core business specialising our core business pecialising our core business pecialising our core business
activities, in addition to capitailsing on synergies
between our business groups. The important
milestones achieved in 2014, coupled with milestones achieved in 2014,milestones achieved in 2014,
our medium term strategic roadmap, will help
ensure that FGB’s success story is a sustainable
one as the bank continues to turn challenges
into opportunities in an ever-evolving operating
environment. We will continue to be creative
and innovative in the sector, consistently setting
ourselves apart from our peers.
I would like to thank the staff and management
of FGB for their contributions and efforts in 2014,
which have placed us in the solid position we are
in today.
I would also like to thank the Central Bank for its
continued guidance and support, and to thank our
shareholders for their continued trust in their bank.
André SayeghChief Executive Officer

26

27
Corporate governance is the system by which companies are directed and controlled and its purpose is to facilitate effective and prudent management that can deliver the long-term success of a company. Goodcorporate governance is about effective management and behaviour. A well-considered and establishedcorporate governance framework provides improved decision making within an organization and also helps establish better relations with its stakeholders through improved transparency and better quality disclosures.First Gulf Bank Group (FGB) recognizes the importance of corporate governance and has implementeda clear corporate governance framework based on international best practices and applicable regulatoryguidelines, including those of the Central Bank of the UAE (CBUAE). Development of the framework isclosely aligned with FGB’s strategic objectives of international expansion, strict regulatory compliance and high levels of individual and collective accountability within the organisation. The framework also defines a code of conduct with which all the employees within the organisation must comply.
The Corporate Governance framework at FGB serves as a guide fGB serves as a guide for employees, management and theBoard for the corporate governfor the corporate governance principles and practices to be followed at FGB Group. The frameworkaims to create an organisation maximising value for shareholders and stakeholders in a fair manner and create confidence among depositors, investors and other stakeholders, ensuring FGB Group’s commitmentto work in a fair and transparent manner. It has been reviewed and approved by the Board of FGB Group and provides a clear responsibility and accountability structure for the Board, Board members, Board Committees, Management Committees and control functions within the organisation. The framework has been documented in the form of a Corporate Governance manual which is reviewed and updated on anannual basis.
FGB’s Articles of Association (AoA) set out the requirements for the numciation (AoA) set out the requirements for the numciation (AoA) set out the requirements for the numeric composition of the Board. The shareholders are responsible for electing the Board for a determined term. The Bank’s Board must have
Remuneration and Nomination at least 3 and up to 15 members as per the company’s AoA. The Board Remuneration and NominaO) identifies and nominates candidates to ensure appropriate succession planning and Committee (REMCO) identifies and nominates candidat
makes appropriate recommendations to the Board. The composition of the Board is guided by the following principles:
Corporate Governance Report

28
1. The Board should have Independent Directors so that it can exercise objective judgment on affairs l d d lrelating to FGB. The Board’s decision making should not be dominated by any particular individual or
small group of individuals. The number of Independent Directors in the Board should at least be one third of total Directors (the majority should be Non-Executive Directors) and can be raised to a majority in line with best practices;
2. The Chairman of the Board is a Non-Executive Director of the Bank. The Bank should considerappointment of one of the Independent Directors as a lead Independent Director to bring in independent leadership on the Board if the Chairman is not independent;
3. The position of the Chairman of the Board and that of the Managing Director (MD) or Chief ExecutiveOfficer (CEO) of FGB may not be held by the same person;
4. The Board comprises of Directors with a broad range of expertise, skills and experience from a diverse rangeanks business.of backgrounds including sufficient skills, knowledge and experience appropriate to the Bank’s business.
Current Board membership includes the following Board members:H.H Sheikh Tahnoon Bin Zayed Al Nahyan (Chairman of Board of Directors, Non-Executive) Ahmed Ali Al Sayegh (Vice Chairman and Board member, Non-Executive)Abdulhamid Mohammed Saeed (Managing Director and Board member, Executive)Khaldoon Khalifa Al Mubarak (Board member, Non-Executive)Sultan Khalfan Al Ketbi (Board member, Non-Executive)Mohamed Saif Al Suwaidi (Board member, Non-Executive)
In accordance with FGB’s approved Corporate Governancorate Governance framework, the Board of Directors have overallresponsibility for FGB includingfor FGB including approving and overseeing the implementation of its strategic objectives,i krisk strategy, corporate governance framework and corporate values. The Board is also responsible for
providing oversight and challenge of Senior Management across a range of matters including its executionof the agreed strategy. The following section lists the broad responsibilities of the Board of Directors and the Board Chairman at FGB Group.
Roles and responsibilities of Board of Directors:
1. Appreciation of legitimate interests of shareholders, depositors and other stakeholders;
2. Approving the overall strategy of FGB Group and safeguarding its interests;
3. Ensuring fair and timely release of material information to the market;
4. ted and approved;Ensuring that all material policieEnsuring that all material policies are duly revimaterial policies are duly revimaterial policies are duly revised, documented and approve
5. r organisation structure in terms of authority and responsibility for the BoardEnsuring there is clear organisation struMembers and Senior Management;Members a
6. Ensuring smooth succession planning for Board and Senior Management;
7. Ensuring a strong corporate governance framework for FGB;
8. nd audit, andnd audit, andand audit, andent and audit, andEnsuring a strong control framework for FGB including risk management and audit, and
9. nflict of interest in dealings with FGB.nflict of interest in dealinnflict of interest in dealinainst any conflict of interest in dealiGuarding against any conflict of interest

29
Roles and responsibilities of Board Chairman:
1. Timely distribution of relevant background information to all Directors ahead of Board meetings;
2. Ensuring effective implementation of Board decisions;
3. Ensuring effective communications with shareholders;
4. Overseeing the regular assessment of the effectiveness of the Board’s performance;
5. Ensuring constructive relations between members of the Board;
6. Addressing development needs of individual Directors and the Board as a whole;
7. Succession planning for Board appointments with the help of REMCO; and
8. Ensuring that the Board has relevant knowledge of banking along with financial and accounting expertise.
Board Committees
To implement the strategy in an efficient manner and to support the Board, specialised board committeeso implement the strategy in an efficient manner and to support the Board, specialised board committeeshave been formed to fulfill specified responsibilities. The number and nature of such committees may varyfrom time to time, depending on the nature of the activities of FGB and its risk profile. Currently, FGB Group has four Board level committees:
1. Remuneration and Nomination Committee: The Remuneration and Nomination Committee (REMCO) comprises three members of the Board, including the MD. The members of the REMCO holdoffice until the next AGM and are eligible for re-appointment. REMCO has the overall responsibility ofsetting the criteria and processes for identification of candidates for the BOD, Board level committees and Senior Management. The committee recommends the appointment or termination of any Director to the Board and ensures a smooth succession of Board and Senior Management. The committee takes care of the performance assessment of the Board and key management personnel. Along with the Board members, the REMCO also comprises CEO of FGB and Head of Human Resources. The committee mmittee approves and oversees reward design and ensures that the reward is appropriatereward is appropriate and consistent with the Bank’s culture, business and risk strategy, ness and risk strategy, performance and control environment, as well as withany legaany legal or regulatory requirements. REMCO also oversees the bank’s HR policies and rewards policy framework. The composition, guiding principles and detailed roles and responsibilities are covered in the REMCO charter.
2. Executive Committee: The Executive Committee (EC) comprises three members of the Board, including the Managing Director. The members of the EC hold office until the next AGM and are eligible for reappointment. The EC, on behalf of the Board is responsible for overseeing the regular businessof the FGB Group. Along with the Board members, the EC also comprises the CEO of FGB. The EC, the EC also comprises the CEO of FGB. The ECoversees the bank’s overall management and ensures that the bank’s business policies and practicesthe bank’s business policies and practicesthe bank’s business policies and practicesare in line with the bank’s buare in line with the bank’s buare in line with the bank’s business interests and are in alignment with sound corporate governance
n, guiding and compliance standards, including the provisions of the UAE Central Bank. The composition, guiding s are covered in the EC charter.principles and detailed roles and responsibilities are covered in the EC charter
3. Risk and Compliance Management Committee: The Risk and Compliance Management Committee (RCMC) comprises three members of the Board, including the Managing Director. The members of

30
the RCMC hold office until the next AGM and are eligible for reappointment. Along with other Board h d l dmembers, the RCMC also comprises of the Group Chief Risk Officer (GCRO). Under authority delegated
by the Board, the RCMC plays a key role in the fulfillment of corporate governance standards andoverall risk management by assisting the Board in the formulation of strategy for enterprise-wide risk management, evaluation of overall risks faced by the Group, alignment of risk policies with businessstrategies and determination of the level of risks which will be in the best interest of the bank throughrisk based capital planning. The RCMC, by virtue of powers delegated to it by the BOD, also approves changes in risk management policies as and when required. The composition, guiding principles and detailed roles and responsibilities are covered in the RCMC’s charter.
4. Audit Committee: The Audit Committee (AC) comprises 3 three members of the Board, including the Managing Director of the Bank. Along with other Board members, the AC also comprises the Headof the Internal Audit function of the bank. The members of the AC hold office until the next AGMand are eligible for reappointment. This committee is principally responsible for reviewing the internal
ings of each internal audit review, making appropriateaudit program, considering the major findings of each internal audit review, making appinvestigations and responses and ensuring coordination between the internal and external auditors, and keeping under review the effectiveness of internal control systems, and in particular reviewing the external auditor’s management letter and management’s response. The composition, guidingprinciples and detailed roles and responsibilities are covered in the Audit Committee’s charter.
The charter of each of the Board Committees is included in the Corporate Governance manual of FGB. The Committee charters provide necessary details of roles and responsibilities of each of the committees, alonges, alongwith the frequency of meetings, quorum for each committee, membership details and thip details and the Chairman, Vice Chairman and Secretary of the Committee.
The membershipThe membership details for the Board Committees are set out in the table below:
Board Committees REMCO EC RCMC AC
H. H. Sheikh Tahnoon Bin Zayed Al Nahyan Chairman
Ahmed Ali Al Sayegh Vice Chairman
Abdulhamid Mohammed Saeed Board Member & MD
Khaldoon Khalifa Al Mubarak Board Member
Sultan Khalfan Al Ketbi Board Member
Mohamed Saif Al Suwaidi Board Member
FGB Management +2 +1 +1 +1
In addition to the Board and Board Committees, FGB has ten management level committees. Theng the ng the ng the uding the committee structure drives senior level decision making within FGB across a range of matters, including the
ues affecting FGB. More details on theues affecting FGB. Mosues affecting FGB. Moonal issues affecting FGB. Mmanagement of strategic, financial, capital, risk and operational issues affecting FGven below:ven below:ven below:ttees are given below:remit of the committees are given below:

31
1. Executive Management Committee: O) is FGB’s mostThe Executive Management Committee (EMCO) is FGB’s most senior management level committee, and it operates under a delegated authority from the FGB Board.The EMCO also supports the CEO to determine and implement the Bank’s strategy, as approved by the Board. The key responsibilities of EMCO include decisions on the bank’s strategy, annual budgets, capital management and risk management and FGB’s more material policies and procedures. The composition, guiding principles and detailed roles and responsibilities of EMCO are set out in the EMCO’s charter.
2. Wholesale Banking Credit Committee: The Wholesale Banking Credit Committee (WBCC) assists the Board and Board Committees to put into operation the wholesale credit risk strategy and policiesand procedures pertaining to the wholesale banking business. The primary objective of the WBCC isto assist in the development and implementation of wholesale banking business’ credit strategy and policies and procedures. The composition, guiding principles and detailed roles and responsibilities of the WBCC are set out in the WBCC’s charter.
3. Consumer Banking Credit Committee: The Consumer Banking Credit Committee (CBCC) assists the Board and Board Committees to put into operation the consumer banking credit strategy and policies and procedures. The primary objectives of the CBCC include approving the consumer banking credit d procedures The primary objectives of the CBCC include approving the consumer banking creditcriteria, and setting portfolio level limits in line with the defined business and the credit risk strategy of the bank. The composition, guiding principles and detailed roles and responsibilities of the CBCC are set out in the CBCC’s Charter.
4. Asset and Liability Committee: The Asset and Liability Committee (ALCO) assists the Board and Board Committees in fulfilling their responsibility to oversee the bank’s asset and liability management(ALM) related responsibilities. The objective of the ALCO is to identify, manage and control FGB’s balance sheet risks in executing its business strategy while ensuring it has adequate levels of liquidity. The composition, guiding principles and detailed roles and responsibilities of the ALCO are set out in the ALCO’s charter.
5. Investment Management Committee: The Investment Management Committee (IMCO) oversees and provides guidance on the bank’s trading and investment activities. The IMCO ensures effective s effective management of market risks in accordance with the principles laid down in tnciples laid down in the FGB market riskmanagement policy. The IMCO provides approv IMCO provides approval of investment limits and individual investment proposals withproposals within those limits. Its objective is to ensure that investment decisions conform to the investment policy and are within the overall limits approved by the Board. The composition, guidingprinciples and detailed roles and responsibilities of the IMCO are set out in in the IMCO’s charter.
6. Compliance Committee: The Compliance Committee (CC) assists the Board and Board Committeesin fulfilling their objective of overseeing the Bank’s compliance responsibilities. The committee overseesthe bank’s compliance with respect to legal and regulatory requirements and relevant policies andprocedures, including a code of ethics and matters relating to operating and non-operating financial risk. It also ensures the bank’s compliance with Anti Money Laundering (AML) and otheIt also ensures the bank’s compliance with Anti Money Laundering (AML) and other relevant legislation issued by the UAE Central Bank and/or Securities and Commodities Authority annd/or Securities and Commodities Authority annd/or Securities and Commodities Authority and/or other regulatory
ththauthorities, as applicable. The composition, guiding principles and detailed roles and responsibilities of the Compliance Committee are set out in the Compliance Committee charter.
7. Operational Risk Committee: Operational Risk Committee The Operational Risk Committee (ORC) assists the Board and Board Committees in fulfilling their objective of overseeing bank’s Operational Risk Management, BusinessContinuity and Information Security responsibilities. Responsibility areas for ORC include management

32
and reporting of the bank’s operational risk profile, ratifying information security policy and procedures, p gli d b i t t f th B k Thintegrating the business continuity management policy and business recovery strategy of the Bank. The
composition, guiding principles and detailed roles and responsibilities of the ORC are set out in the ORC’scharter.
8. Technology Steering Committee: The Technology Steering Committee (TSC) assists the Board andBoard Committees in fulfilling their responsibilities related to setting Information Technology (IT) relatedstrategic goals, and for the successful implementation of the strategic IT objectives. The TSC ensures alignment of IT strategy with the bank’s business strategy and successful implementation of its ITstrategy. The composition, guiding principles and detailed roles and responsibilities of the TSC are set out in the TSC’s charter.
9. Human Resources Steering Committee: The Human Resources Steering Committee (HRSC) assists the Board in fulfilling its responsibilities related to the human resource policies applicable to the bank’sstaff. The objectives of the committee include implementation of recommendations made by the
orking environment, employee contracts, terms REMCO regarding compensation, benefits, rewards, working environment, employee contracts, termsand conditions and other issues that form part of the Human Resources (HR) strategy. HRSC also hasand conditions and oththe responsibility to put in place an appropriate whistle blowing policy to enable employees to raiseconcerns in a responsible and effective manner with a sense of protection. The composition, guiding principles and detailed roles and responsibilities of the HRSC are set out in the HRSC’s charter.
10. Real Estate Committee: The Real Estate Committee (RECO) assists the Board in its responsibilitiespertaining to overseeing and approving the bank’s real estate investment and management activities in line with effective market and liquidity risk management practices and policies. The RECO is responsRECO is responsible for providing oversight, guidance and strategic input on the action plans fhe action plans for the Group’s real estateinvestment, review real estate budgets and provide ogets and provide oversight and guidance for real estate investment limits and risk appetite. The risk appetite. The composition, guiding principles and detailed roles and responsibilities of the RRECO are set out in the RECO’s charter.
The membership and the meeting details for the Management committees have been provided in thetables given below:
Membership EMCO WBCC CBCC ALCO IMCO RECO ORMC CC TSC HRSC
Managing Director
CEO
CFO
CRO
CCO
COO
HOWBG
HOCBG
HOTGM
HOCSG
HOHR
Others +1 +2 +1 +1 +1 +2 +2 +1

33
Management’s responsibility forconsolidated financial statementsManagement is responsible for the preparsponsible for the preparsponsible for the preparation and f if ifair presentation of these consolidated financial statements in accordance with International FinancialReporting Standards and the applicable provisions of the articles of association of the Bank and the UAE Commercial Companies Law of 1984 (as amended)and for such internal control as management determines is necessary to enable the preparation of consolidated financial statements that are free fromconsolidated financial statements that are free fromconsolidated financial statements that are free from material misstatement, whether due to fraud or error.hether due to fraud or error.hether due to fraud or error.hether due to fraud or error.hether due to fraud or error.
Auditors’ responsibilityOur responsibilityOur responsibilityOur responsibility is to express an opinion on theseconsolidated financial statements based on our audit. We conducted our audit in accordance withInternational Standards on Auditing. Those standardsrequire that we comply with ethical requirementsand plan and perform the audit to obtain reasonable assurance whether the consolidated financial statements are free from material misstatement.
Report on the Consolidated Financial StatementsWe have audited the accompanying consolidated financial statements of First Gulf BankPJSC and its subsidiaries (the “Bank”), which comprise the consolidated balance sheet asat 31 December 2014 and the consolidated income statement, consolidated statement of comprehensive income, consolidated statement of changes in equity and consolidated statement of cash flows for the year then ended, and a summary of significant accounting policies and other explanatory information.
Independent Auditors’ Report to the Shareholders of First Gulf Bank PJSC

34
An audit involves performing procedures to obtainaudit evidence about the amounts and disclosures in the consolidated financial statements. The procedures selected depend on the auditors’ judgement, includingthe assessment of the risks of material misstatement of the consolidated financial statements, whether due to fraud or error. In making those risk assessments, the auditor considers internal control relevant to the entity’s preparation and fair presentation of the consolidated financial statements in order to design audit procedures that are appropriate for thed id icircumstances, but not for the purpose of expressingan opinion on the effectiveness of the entity’s internal control. An audit also includes evaluating theappropriateness of accounting policies used and thereasonableness of accounting estimates made by the management, as well as evaluating the overallpresentation of the consolidated financial statements.
We believe that the audit evidence we havidence we havidence we have obtained is sufficient andis sufficient andis sufficient and appropriate to provide a basis for our audit opinion.
OpinionIn our opinion, the consolidated financial statementspresent fairly, in all material respects, the financialposition of the Bank as of 31 December 2014 and its financial performance and its cash flows for the year then ended in accordance with International Financial Reporting Standards.
Report on Other Legal andRegulatory Requirements
We also confirm that, in our opinion, the consolidated financial statements include, in all material respects, the applicable requirements of the UAE CommercialCompanies Law of 1984 (as amended), Union Lawno.10 of 1980 and the articles of association of the
ks of account have been kept by ks of account have been kept by Bank; proper books of account have been kept by the Bank; and the contents of the Chairman’s Reportrelating to these consolidated financial statementsare consistent with the books of account. We haveobtained all the information and explanations whichwe required for the purpose of our audit and, to thebest of our knowledge and belief, no violations of the UAE Commercial Companies Law of 1984 (asamended) or the articles of association of thociation of theciation of the Bank have occurred during thcurred during thcurred during the year which would have had a material effect on the business of the Bank or on its financial position.
Signed byAndre KasparianPartnerErnst & YoungRegistration No. 365
y 2015y 201528 January 2015Abu DhabiAbAb
35
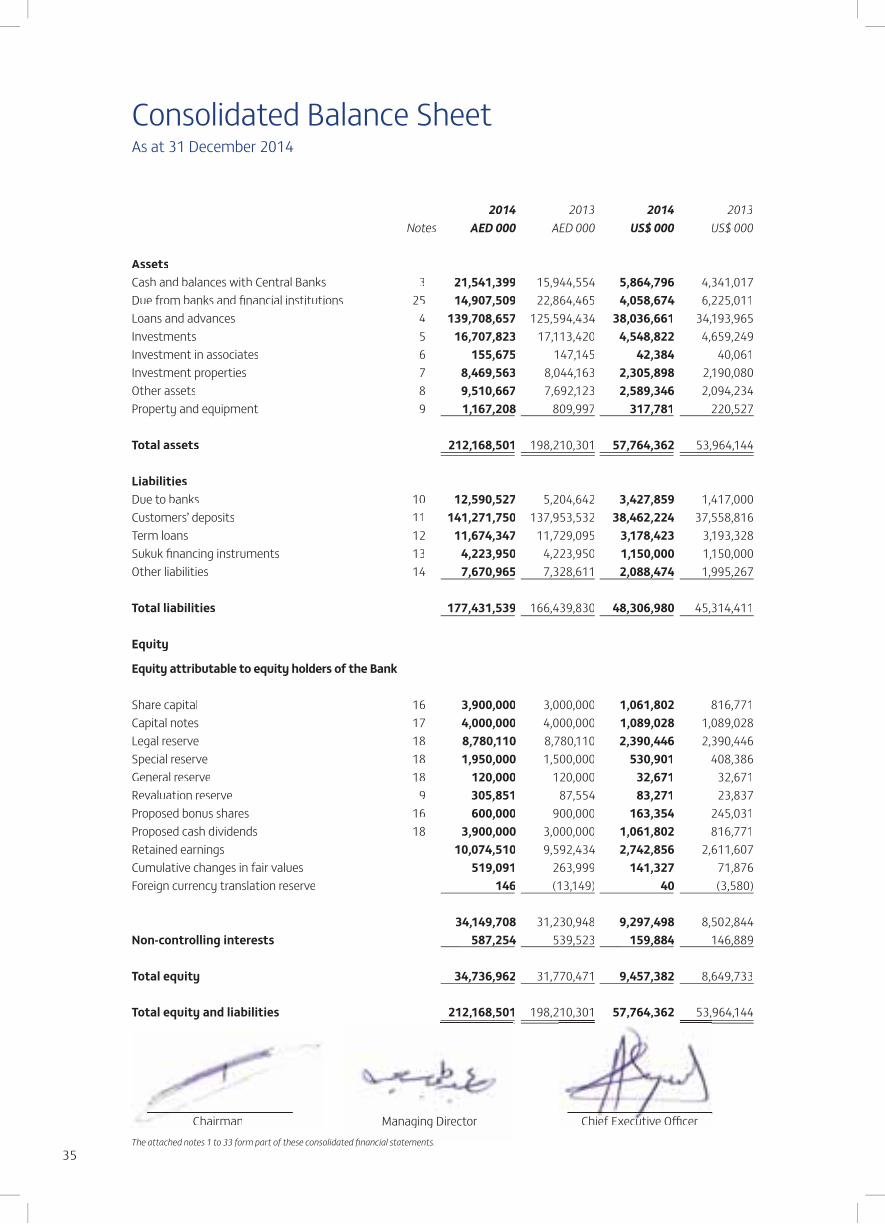
Consolidated Balance SheetAs at 31 December 2014
2014 2013 2014 2013Notes AED 000 AED 000 US$ 000 US$ 000
AssetsCash and balances with Central Banks 3 21,541,399 15,944,554 5,864,796 4,341,017Due from banks and financial institutions 25 14,907,509 22,864,465 4,058,674 6,225,011Loans and advances 4 139,708,657 125,594,434 38,036,661 34,193,965Investments 5 16,707,823 17,113,420 4,548,822 4,659,249Investment in associates 6 155,675 147,145 42,384 40,061Investment properties 7 8,469,563 8,044,163 2,305,898 2,190,080Other assets 8 9,510,667 7,692,123 2,589,346 2,094,234Property and equipment 9 1,167,208 809,997 317,781 220,527
Total assets 212,168,501 198,210,301 57,764,362 53,964,144
LiabilitiesDue to banks 10 12,590,527 5,204,642 3,427,859 1,417,000Customers’ deposits 11 141,271,750 137,953,532 38,462,224 37,558,816Term loans 12 11,674,347 11,729,095 3,178,423 3,193,328Sukuk financing instruments 13 4,223,950 4,223,950 1,150,000 1,150,000Other liabilities 14 7,670,965 7,328,611 2,088,474 1,995,267
Total liabilities 177,431,539 166,439,830 48,306,980 45,314,411
Equity
Equity attributable to equity holders of the Bank
Share capital 16 3,900,000 3,000,000 1,061,802 816,771Capital notes 17 4,000,000 4,000,000 1,089,028 1,089,028Legal reserve 18 8,780,110 8,780,110 2,390,446 2,390,446Special reserve 18 1,950,000 1,500,000 530,901 408,386General reserve 18 120,000 120,000 32,671 32,671Revaluation reserve 9 305,851 87,554 83,271 23,837Proposed bonus shares 16 600,000 900,000 163,354 245,031Proposed cash dividends 18 3,900,000 3,000,000 1,061,802 816,771Retained earnings 10,074,510 9,592,434 2,742,856 2,611,607Cumulative changes in fair values 519,091 263,999 141,327 71,876Foreign currency translation reserve 146 (13,149) 40 (3,580)
34,149,708 31,230,948 9,297,498 8,502,844Non-controlling interests 587,254 539,523 159,884 146,889
Total equity 34,736,962 31,770,471 9,457,382 8,649,733
Total equity and liabilities 212,168,501 198,210,301 57,764,362, , 53,964,144
Chairman Managing Director Chief xecutive OfficerChief Executive Officer
,,
The attached notes 1 to 33 form part of these consolidated financial statements.t d fi i l t t t
36
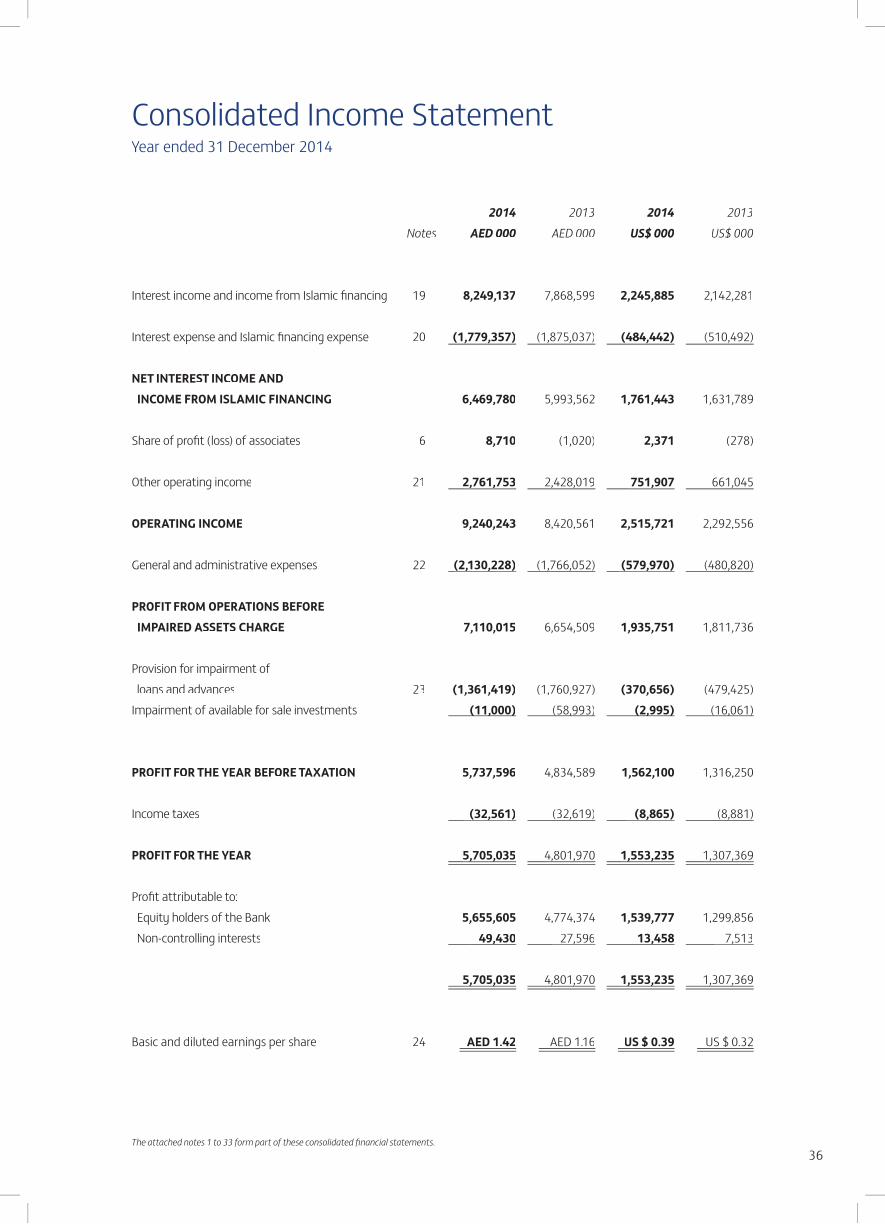
Consolidated Income StatementYear ended 31 December 2014
The attached notes 1 to 33 form part of these consolidated financial statements.
2014 2013 2014 2013Notes AED 000 AED 000 US$ 000 US$ 000
Interest income and income from Islamic financing 19 8,249,137 7,868,599 2,245,885 2,142,281
Interest expense and Islamic financing expense 20 (1,779,357) (1,875,037) (484,442) (510,492)
NET INTEREST INCOME AND INCOME FROM ISLAMIC FINANCING 6,469,780 5,993,562 1,761,443 1,631,789
Share of profit (loss) of associates 6 8,710 (1,020) 2,371 (278)
Other operating income 21 2,761,753 2,428,019 751,907 661,045
OPERATING INCOME 9,240,243 8,420,561 2,515,721 2,292,556
General and administrative expenses 22 (2,130,228) (1,766,052) (579,970) (480,820)
PROFIT FROM OPERATIONS BEFORE IMPAIRED ASSETS CHARGE 7,110,015 6,654,509 1,935,751 1,811,736
Provision for impairment of loans and advances 23 (1,361,419) (1,760,927) (370,656) (479,425)Impairment of available for sale investments (11,000) (58,993) (2,995) (16,061)
PROFIT FOR THE YEAR BEFORE TAXATION 5,737,596 4,834,589 1,562,100 1,316,250
Income taxes (32,561) (32,619) (8,865) (8,881)
PROFIT FOR THE YEAR 5,705,035 4,801,970 1,553,235 1,307,369
Profit attributable to: Equity holders of the Bank 5,655,605 4,774,374 1,539,777 1,299,856 Non-controlling interests 49,430 27,596 13,458 7,513
5,705,035 4,801,970 1,553,235 1,307,369
Basic and diluted earnings per share 24 AED 1.42 AED 1.16 US $ 0.39 US $ 0.32
,, ,
,, , ,, ,
( , )( , ) ( , )( , )
,, ,,
, ,, , , ,, ,
,, ,,
, ,, , , ,, ,
37
Consolidated Statement of Comprehensive IncomeYear ended 31 December 2014
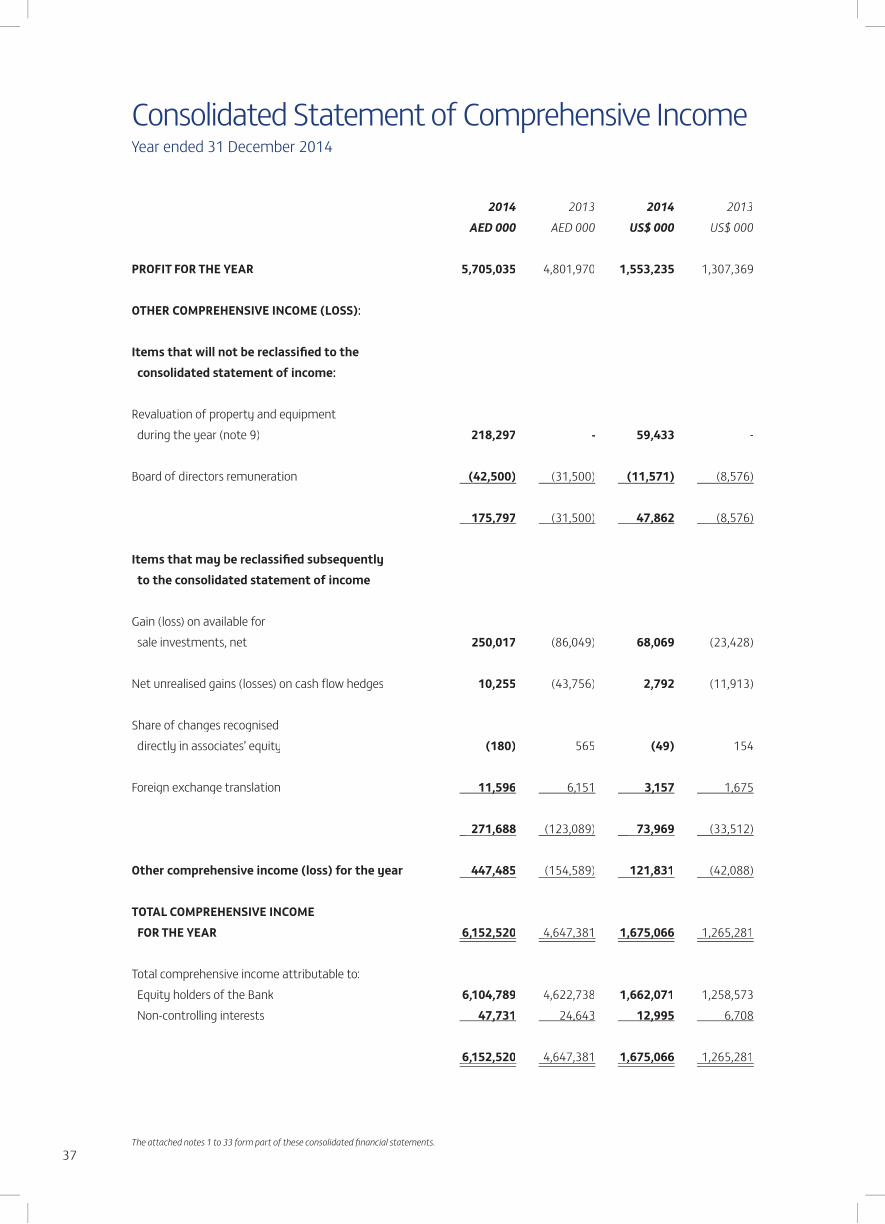
2014 2013 2014 2013AED 000 AED 000 US$ 000 US$ 000
PROFIT FOR THE YEAR 5,705,035 4,801,970 1,553,235 1,307,369
OTHER COMPREHENSIVE INCOME (LOSS):
Items that will not be reclassified to the consolidated statement of income:
Revaluation of property and equipment during the year (note 9) 218,297 - 59,433 -
Board of directors remuneration (42,500) (31,500) (11,571) (8,576)
175,797 (31,500) 47,862 (8,576)
Items that may be reclassified subsequently to the consolidated statement of income
Gain (loss) on available for sale investments, net 250,017 (86,049) 68,069 (23,428)
Net unrealised gains (losses) on cash flow hedges 10,255 (43,756) 2,792 (11,913)
Share of changes recognised directly in associates’ equity (180) 565 (49) 154
Foreign exchange translation 11,596 6,151 3,157 1,675
271,688 (123,089) 73,969 (33,512)
Other comprehensive income (loss) for the year 447,485 (154,589) 121,831 (42,088)
TOTAL COMPREHENSIVE INCOME FOR THE YEAR 6,152,520 4,647,381 1,675,066 1,265,281
Total comprehensive income attributable to: Equity holders of the Bank 6,104,789 4,622,738 1,662,071 1,258,573 Non-controlling interests 47,731 24,643 12,995 6,708
6,152,520 4,647,381 1,675,066 1,265,281
( , )( , ) ,,
,, ,,
,, ,,
, ,, , , ,, ,
,, ,,
, ,, ,
The attached notes 1 to 33 form part of these consolidated financial statements.

38
Consolidated Statement of Cash FlowsYear ended 31 December 2014
2014 2013 2014 2013Notes AED 000 AED 000 US$ 000 US$ 000
OPERATING ACTIVITIESProfit for the year before taxation 5,737,596 4,834,589 1,562,100 1,316,250Adjustments for:Depreciation 80,800 62,897 21,998 17,124Amortisation of intangible assets 32 25,433 - 6,924 -Provision for impairment of available for sale investments 11,000 58,993 2,995 16,061Gain on exchange of investment properties 21 - (185,979) - (50,634)Gain on bargain purchase arising on business combination - (628) - (171)Loss on sale of property and equipment 21 12,992 3,772 3,537 1,027Impairment of property and equipment 21 8,591 - 2,339 -Provision for impairment of loans and advances 23 1,361,419 1,760,927 370,656 479,425Gain on revaluation of investment properties 7 (113,309) (125,192) (30,849) (34,084)Gain on sale of investment properties 21 (167,521) (73,801) (45,609) (20,093)Gain from investments (153,084) (179,264) (41,678) (48,806)Share of (gain) loss from associates 6 (8,710) 1,020 (2,371) 278Operating profit before changes in operatingassets and liabilities: 6,795,207 6,157,334 1,850,042 1,676,377Deposits with banks (3,041,387) (133,396) (828,039) (36,317)Mandatory cash reserve with UAE Central Bank (1,146,728) (918,969) (312,204) (250,196)Loans and advances (15,470,387) (12,003,643) (4,211,921) (3,268,076)Other assets (1,843,975) 427,544 (502,035) 116,402Due to banks 7,385,885 938,744 2,010,859 255,580Customers’ deposits 3,318,218 18,064,961 903,408 4,918,312Other liabilities 268,620 (338,817) 73,134 (92,246)
Cash (used in) from operations (3,734,547) 12,193,758 (1,016,756) 3,319,836Directors’ remuneration paid (31,500) (28,000) (8,576) (7,623)
Net cash (used in) from operating activities (3,766,047) 12,165,758 (1,025,332) 3,312,213
INVESTING ACTIVITIESPurchase of investments (8,339,399) (6,387,127) (2,270,461) (1,738,940)Proceeds from redemption and sale of investments 9,137,095 6,586,194 2,487,638 1,793,137Purchase of property and equipment 9 (251,614) (244,517) (68,504) (66,571)Deposits with UAE Central Bank (3,570,517) - (972,098) -Capital injected in an associate 32 - (300,000) - (81,677)Acquisition of subsidiary - (915,942) - (249,372)Additions to investment properties 7 (617,182) (249,909) (168,032) (68,039)Proceeds from sale of investment properties 472,611 300,017 128,672 81,683Proceeds from sale of property and equipment 10,320 55 2,810 15
Net cash used in investing activities (3,158,686) (1,211,229) (859,975) (329,764)
FINANCING ACTIVITIESDividends paid 18 (2,964,828) (2,468,720) (807,195) (672,126)Interest on capital notes (186,029) (240,000) (50,648) (65,342)Drawdown of term loans 4,248,031 3,639,125 1,156,556 990,778Repayment of term loans (4,302,779) (5,310,801) (1,171,462) (1,445,903)
Net cash used in financing activities (3,205,605) (4,380,396) (872,749) (1,192,593)
NET (DECREASE)/ INCREASE IN CASH AND CASH EQUIVALENTS (10,130,338) 6,574,133 (2,758,056) 1,789,856
Cash and cash equivalents at 1 January 23,903,638 17,320,401 6,507,933 4,715,598Net changes in foreign currency translation reserve 11,596 9,104 3,157 2,479
CASH AND CASH EQUIVALENTS AT 31 DECEMBER 25 13,784,896 23,903,638 3,753,034 6,507,933
Operating cash flows from interest and Islamic financing
Interest and Islamic financing income received 8,072,732 7,647,316 2,197,858 2,082,035Interest and Islamic financing expense paid 1,821,713 1,715,568 495,974 467,075
, ( , )( , )
,,
,, , ,, ,
, ,, , ,, ,
,, ,,
The attached notes 1 to 33 form part of these consolidated financial statements.
39
Attri
buta
ble to
equit
y hold
ers o
f the
Bank
Shar
eca
pita
lCa
pita
lno
tes
Lega
lre
serv
eSp
ecia
lre
serv
eGe
nera
lre
serv
eRe
valu
atio
nre
serv
e
Prop
osed
bonu
ssh
ares
Prop
osed
cash
divid
ends
Reta
ined
earn
ings
Cum
ulat
ivech
ange
sin
fair
valu
es
Fore
ign
curre
ncy
trans
latio
nre
serv
eTo
tal
Non-
cont
rollin
gin
tere
sts
Tota
leq
uity
AED
000
AED
000
AED
000
AED
000
AED
000
AED
000
AED
000
AED
000
AED
000
AED
000
AED
000
AED
000
AED
000
AED
000
As of
1 Ja
nuar
y 20
133,0
00,00
04,0
00,00
08,7
80,11
01,2
62,08
312
0,000
87,55
4
-2,5
00,00
09,2
27,47
739
3,239
(22,2
53)
29,34
8,210
514,8
8029
,863,0
90
Tota
l com
preh
ensiv
e inc
ome f
or th
e yea
r-
--
--
--
-4,7
42,87
4(1
29,24
0)9,1
044,6
22,73
824
,643
4,647
,381
Tran
sfer t
o spe
cial re
serv
e (no
te 1
8)-
--
237,9
17-
--
-(2
37,91
7)-
--
--
Tran
sfer t
o divi
dend
s pay
able
--
--
--
-(2
,500,0
00)
--
-(2
,500,0
00)
-(2
,500,0
00)
Inte
rest
on ca
pital
note
s (no
te 1
7)-
--
--
--
-(2
40,00
0)-
-(2
40,00
0)-
(240
,000)
Prop
osed
cash
divi
dend
s (no
te 1
8)-
--
--
--
3,000
,000
(3,00
0,000
)-
--
--
Prop
osed
bon
us sh
ares
(not
e 18)
-
-
-
-
-
-
900,0
00
- (
900,0
00)
-
-
-
-
-
As of
1 Ja
nuar
y 20
143,
000,
000
4,00
0,00
08,
780,1
101,
500,
000
120,
000
87,5
5490
0,00
03,
000,
000
9,59
2,43
426
3,99
9(1
3,149
)31
,230
,948
539,
523
31,7
70,4
71
Tota
l com
preh
ensiv
e inc
ome f
or th
e yea
r-
--
--
218,2
97-
-5,6
18,10
525
5,092
13,29
56,1
04,78
947
,731
6,152
,520
Tran
sfer t
o spe
cial re
serv
e (no
te 1
8)-
--
450,0
00-
--
-(4
50,00
0)-
--
--
Tran
sfer t
o divi
dend
s pay
able
--
--
--
-(3
,000,0
00)
--
-(3
,000,0
00)
-(3
,000,0
00)
Inte
rest
on ca
pital
note
s (no
te 1
7)-
--
--
--
-(1
86,02
9)-
-(1
86,02
9)-
(186
,029)
Prop
osed
cash
divi
dend
s (no
te 1
8)-
--
--
--
3,900
,000
(3,90
0,000
)-
--
--
Bonu
s sha
res i
ssue
d (n
ote 1
8)90
0,000
--
--
-(9
00,00
0)-
--
--
--
Prop
osed
bon
us sh
ares
(not
e 18)
-
-
-
-
-
-
600,0
00
- (
600,0
00)
-
-
-
-
-
As of
31
Dece
mbe
r 201
43,
900,
000
4,00
0,00
08,
780,1
101,
950,
000
120,
000
305,
851
600,
000
3,90
0,00
010
,074
,510
519,
091
146
34,14
9,70
858
7,25
434
,736
,962
Cons
olid
ated
Sta
tem
ent o
f Cha
nges
in E
quity
Year
end
ed 3
1 De
cem
ber 2
014
The
atta
ched
not
es 1
to 3
3 fo
rm p
art o
f the
se co
nsol
idat
ed fi
nanc
ial s
tate
men
ts.

40
Notes to the consolidated financial statements31 December 2014
1 ACTIVITIES
First Gulf Bank PJSC is a public joint stock company with limited liability incorporated in Abu Dhabi in accordance with UAE Federal Law No. (8) of 1984 (as amended). First Gulf Bank PJSC, its branches and subsidiaries (the “Bank”) carry on commercial and retail banking, investment and real estate activities in Abu Dhabi, Dubai, Ajman, Sharjah, Fujairah, Al Ain and Ras Al Khaimah. The representative office of the Bank in Singapore has commenced operations from September 2007 and was upgraded to a wholesale bank in August 2009. The Bank has established a representative office in India in September 2009 and in Qatar in November 2009. The representative office in Qatar was upgraded to a branch in May 2011. In December 2012, the Bank established a representative office in Hong Kong. In April and June 2014, the Bank established representative offices in South Korea and United Kingdom, respectively.
The registered head office of the Bank is at PO Box 6316, Abu Dhabi, United Arab Emirates (UAE). The principal activities of the Bank are described in note 29.
The consolidated financial statements of the Bank were authorised for issue by the Board of Directors on 28 January 2015.
2 SIGNIFICANT ACCOUNTING POLICIES
Basis of preparation
The consolidated financial statements have been prepared in accordance with International Financial Reporting Standards as issued by the International Accounting Standard Board (IASB) and the applicable requirements of UAE Federal Law No.8 of 1984 (as amended).
The consolidated financial statements have been prepared under the historical cost convention except for investment securities (other than held to maturity investments), derivative financial instruments, investment properties and land included in property and equipment which have been measured at fair value. The carrying values of recognised assets and liabilities that are hedged items in fair value hedges, and otherwise carried at cost, are adjusted to record changes in fair value attributable to the risks that are being hedged.
The consolidated financial statements of the Bank are prepared in United Arab Emirates Dirhams (AED) which is the functional currency of the Bank. The consolidated balance sheet, consolidated income statement and consolidated statement of cash flows in US Dollar (US$) are presented solely for the convenience of the readers of the consolidated financial statements. The AED amounts have been translated at the rate of AED 3.673 to US$ 1 (2013: AED 3.673 to US$1) and all values are rounded to the nearest thousand AED, except where otherwise indicated.
Changes in accounting policies and disclosures
The Bank’s accounting policies and the key sources of estimation uncertainty are the same as those applied to the consolidated financial statements as at and for the year ended 31 December 2013, except for the following amendments to IFRS effective as of 1 January 2014.
Investment Entities (Amendments to IFRS 10, IFRS 12 and IAS 27) These amendments provide an exception to the consolidation requirement for entities that meet the definition of an investment entity under IFRS 10 Consolidated Financial Statements and must be applied retrospectively, subject to certain transition relief. The exception to consolidation requires investment entities to account for subsidiaries at fair value through profit or loss. These amendments have no impact on the Bank, since none of the entities in the Bank qualifies to be an investment entity under IFRS 10.
Notes to the consolidated financial statements31 December 2014
41
2 SIGNIFICANT ACCOUNTING POLICIES continued
Changes in accounting policies and disclosures continued
Offsetting Financial Assets and Financial Liabilities - Amendments to IAS 32These amendments clarify the meaning of “currently has a legally enforceable right to set-off” and the criteria for non-simultaneous settlement mechanisms of clearing houses to qualify for offsetting and is applied retrospectively. These amendments have no impact on the Bank, since none of the entities in the Bank has any offsetting arrangements.
Novation of Derivatives and Continuation of Hedge Accounting – Amendments to IAS 39These amendments provide relief from discontinuing hedge accounting when novation of a derivative designated as a hedging instrument meets certain criteria and retrospective application is required. These amendments have no impact on the Bank as the Bank has not novated its derivatives during the current or prior periods.
IFRIC 21 LeviesIFRIC 21 clarifies that an entity recognises a liability for a levy when the activity that triggers payment, as identified by the relevant legislation, occurs. For a levy that is triggered upon reaching a minimum threshold, the interpretation clarifies that no liability should be anticipated before the specified minimum threshold is reached. Retrospective application is required for IFRIC 21. This interpretation has no impact on the Bank.
AcceptancesDuring the year ended 31 December 2014, the Bank changed its policy in respect of accounting for (i) acceptances issued to clients from disclosing those as part of commitments and contingencies to recognising them within other assets and other liabilities and (ii) discounted acceptances from classifying them under loans and advances to including them under other assets. As a result of the change in accounting policy, the comparative figures as at 31 December 2013 for other assets, other liabilities and loans and advances were adjusted for consistency purposes and accordingly, other assets and other liabilities were increased by AED 4,525,016 thousand and AED 3,177,931 thousand, respectively, and loans and advances were decreased by AED 1,347,085 thousand.
New standards not yet adopted
The following new standards / amendments to standards which were issued up to 31 December 2014 and are not yeteffective for the year ended 31 December 2014 have not been applied while preparing these consolidated financial statements:
IFRS 9: Financial Instruments introduces new requirements for classification and measurement, impairment, and hedge accounting. In July 2014, the IASB issued the final version of IFRS 9 Financial Instruments which reflects all phases of the financial instruments project and replaces IAS 39 Financial Instruments: Recognition and Measurement and all previous versions of IFRS 9. IFRS 9 is effective for annual periods beginning on or after 1 January 2018, with early application permitted. Retrospective application is required, but comparative information is not compulsory. Early application of previous versions of IFRS 9 (2009, 2010 and 2013) is permitted if the date of initial application is before 1 February 2015. The adoption of IFRS 9 will have an effect on the classification and measurement of the Bank’s financial assets, but no impact on the classification and measurement of the Bank’s financial liabilities.
The Bank is yet to assess IFRS 9’s full impact.
IFRS 14: Regulatory Deferral Accounts is an optional standard that allows an entity, whose activities are subject to rate-regulation, to continue applying most of its existing accounting policies for regulatory deferral account balances upon its first-time adoption of IFRS. Entities that adopt IFRS 14 must present the regulatory deferral accounts as separate line items on the statement of financial position and present movements in these account balances as separate line items in the statement of profit or loss and other comprehensive income. The standard requires disclosures on the nature of, and risks associated with, the entity’s rate-regulation and the effects of that rate-regulation on its financial statements. IFRS 14 is effective for annual periods beginning on or after 1 January 2016. Since the Bank is an existing IFRS preparer, this standard would not apply.
Notes to the consolidated financial statements31 December 2014
42
2 SIGNIFICANT ACCOUNTING POLICIES continued
New standards not yet adopted continued
IFRS 15: Revenue from Contracts with Customers was issued in May 2014 and establishes a new five-step model that will apply to revenue arising from contracts with customers. Under IFRS 15 revenue is recognised at an amount that reflects the consideration to which an entity expects to be entitled in exchange for transferring goods or services to a customer. The principles in IFRS 15 provide a more structured approach to measuring and recognising revenue. The new revenue standard is applicable to all entities and will supersede all current revenue recognition requirements under IFRS. Either a full or modified retrospective application is required for annual periods beginning on or after 1 January 2017 with early adoption permitted. The Bank does not expect that IFRS 15 will have any significant impact on the consolidated financial statements.
IFRS 11: Joint Arrangements (Amendment) require that a joint operator accounting for the acquisition of an interest in a joint operation, in which the activity of the joint operation constitutes a business must apply the relevant IFRS 3 principles for business combinations accounting. The amendments also clarify that a previously held interest in a joint operation is not remeasured on the acquisition of an additional interest in the same joint operation while joint control is retained. In addition, a scope exclusion has been added to IFRS 11 to specify that the amendments do not apply when the parties sharing joint control, including the reporting entity, are under common control of the same ultimate controlling party. The amendments apply to both the acquisition of the initial interest in a joint operation and the acquisition of any additional interests in the same joint operation and are prospectively effective for annual periods beginning on or after 1 January 2016, with early adoption permitted. These amendments are not expected to have any impact on the Bank.
IAS 16 and IAS 38: (Amendment) clarify the principle in IAS 16 and IAS 38 that revenue reflects a pattern of economic benefits that are generated from operating a business (of which the asset is part) rather than the economic benefits that are consumed through use of the asset. As a result, a revenue-based method cannot be used to depreciate property, plant and equipment and may only be used in very limited circumstances to amortise intangible assets. The amendments are effective prospectively for annual periods beginning on or after 1 January 2016, with early adoption permitted. These amendments are not expected to have any impact on the Bank given that the Bank has not used a revenue-based method to depreciate its non-current assets.
IAS 16 and IAS 41: (Amendment) changes the accounting requirements for biological assets that meet the definition of bearer plants. Under the amendments, biological assets that meet the definition of bearer plants will no longer be within the scope of IAS 41. Instead, IAS 16 will apply. After initial recognition, bearer plants will be measured under IAS 16 at accumulated cost (before maturity) and using either the cost model or revaluation model (after maturity). The amendments also require that produce that grows on bearer plants will remain in the scope of IAS 41 measured at fair value less costs to sell. For government grants related to bearer plants, IAS 20 Accounting for Government Grants and Disclosure of Government Assistance will apply. The amendments are retrospectively effective for annual periods beginning on or after 1 January 2016, with early adoption permitted. These amendments are not expected to have any impact on the Bank as the Bank does not have any bearer plants.
IAS 27: Separate Financial Statements (Amendment) will allow entities to use the equity method to account for investments in subsidiaries, joint ventures and associates in their separate financial statements. Entities already applying IFRS and electing to change to the equity method in its separate financial statements will have to apply that change retrospectively. For first-time adopters of IFRS electing to use the equity method in their separate financial statements, they will be required to apply this method from the date of transition to IFRS. The amendments are effective for annual periods beginning on or after 1 January 2016, with early adoption permitted. These amendments will not have any impact on the Bank’s consolidated financial statements.
The International Accounting Standards Board made certain amendments to existing standards as part of its annual improvements project. The effective dates for these amendments vary by standard and most will be applicable to the Bank’s 2015 consolidated financial statements. The Bank does not expect these amendments to have any significant impact on the consolidated financial statements.

Notes to the consolidated financial statements31 December 2014
43
2 SIGNIFICANT ACCOUNTING POLICIES continued
Basis of consolidation
The consolidated financial statements comprise the financial statements of the Bank and those of its following subsidiaries:
Activity Country of incorporationPercentage of holding
2014 2013
Mismak Properties Co. LLC (Mismak) Real estate investments United Arab Emirates 100% 100%
Radman Properties Co. LLC (subsidiary of Mismak) Real estate investments United Arab Emirates 80% 80%
First Merchant International LLC Merchant banking services United Arab Emirates 100% 100%
FGB Sukuk Company Limited Special purpose vehicle Cayman Islands 100% 100%
FGB Sukuk Company II Limited Special purpose vehicle Cayman Islands 100% 100%
First Gulf Libyan Bank Banking services Libya 50% 50%
First Gulf Properties LLC Management and brokerage of realestate properties
United Arab Emirates 100% 100%
Aseel Finance PJSC Islamic finance United Arab Emirates 100% 100%
Dubai First PJSC Credit card finance United Arab Emirates 100% 100%
First Gulf Information Technology LLC* Information Technology Services United Arab Emirates 100% -
*First Gulf Information Technologies LLC (“FGIT”) was established in October 2013 as a limited liability company in accordance with the UAE Commercial Companies Law of 1984 (as amended).
The principal activities of FGIT are: information technology network services, management and operation of computer network, computer infrastructure establishment, installation and maintenance, computer system and software designing, computer software consultancy, computer devices and equipment domain consultancy and information technology consultancy including all activities as are related or ancillary thereto.
Although the Bank owns 50% of the outstanding shares of First Gulf Libyan Bank, the investment has been classified as a subsidiary as the Bank exercises control over the investee because it casts the majority of the votes on the board of directors.
The financial statements of the subsidiaries are prepared for the same reporting year as the Bank, using consistent accounting policies. All intra-group balances, transactions, income and expenses and profits and losses resulting from intra-group transactions that are recognised in assets, are eliminated in full.
Subsidiaries are fully consolidated from the date on which control is transferred to the Bank. The Bank exercises control over all of the subsidiaries listed above.
Control is achieved when the Bank is exposed, or has rights, to variable returns from its involvement with the investee and has the ability to affect those returns through its power over the investee.
Notes to the consolidated financial statements31 December 2014
44
2 SIGNIFICANT ACCOUNTING POLICIES continued
Basis of consolidation continued
Specifically, the Bank controls an investee if and only if the Bank has:
Power over the investee (i.e. existing rights that give it the current ability to direct the relevant activities of the investee);
When the Bank has less than a majority of the voting or similar rights of an investee, the Bank considers all relevant facts and circumstances in assessing whether it has power over an investee, including:
The Bank re-assesses whether or not it controls an investee if facts and circumstances indicate that there are changes to one or more of the three elements of control. Consolidation of a subsidiary begins when the Bank obtains control over the subsidiary and ceases when the Bank loses control of the subsidiary. Assets, liabilities, income and expenses of a subsidiary acquired or disposed of during the year are consolidated from the date the Bank gains control until the date the Bank ceases to control the subsidiary.
Profit or loss and each component of other comprehensive income (OCI) are attributed to the equity holders of the parent of the Bank and to the non-controlling interests, even if this results in the non-controlling interests having a deficit balance.
When necessary, adjustments are made to the financial statements of subsidiaries to bring their accounting policies in line with the Bank’s accounting policies. All intra-group assets and liabilities, equity, income, expenses and cash flows relating to transactions between members of the Bank are eliminated in full on consolidation.
Non-controlling interests represent the portion of the profit and net assets in subsidiaries not held by the Bank and are presented separately in the consolidated income statement and within equity in the consolidated balance sheet, separately from the Bank shareholders’ equity.
Due from banksDue from banks are stated at amortised cost using the effective interest rate less any amounts written off and provision for impairment.
Trading investmentsThese are initially recognised at cost, being the fair value of the consideration given and subsequently remeasured at fair value. All related realised and unrealised gains or losses are included in the consolidated income statement.

Notes to the consolidated financial statements31 December 2014
45
2 SIGNIFICANT ACCOUNTING POLICIES continued
InvestmentsThese are classified as follows:
All investments are initially recognised at cost, being the fair value of the consideration given including acquisition charges (except for investments carried at fair value through the income statement) associated with the investment. Premiums and discounts on investments (excluding those carried at fair value through income statement) are amortised using the effective interest rate method and taken to interest income.
Held to maturityInvestments which have fixed or determinable payments and are intended to be held to maturity, are carried at amortised cost, less provision for impairment in value.
Available for saleAfter initial recognition, investments which are classified “available for sale” are remeasured at fair value. Fair value changes which are not part of an effective hedging relationship are reported as a separate component of equity until the investment is derecognised or the investment is determined to be impaired. On derecognition, the cumulative gain or loss previously reported as “cumulative changes in fair value” within equity is included in the consolidated income statement.
Investments carried at fair value through income statementInvestments are classified as fair value through income statement if the fair value of the investment can be reliably measured and the classification as fair value through income statement is as per the documented strategy of the Bank. Investments classified as “Investments at fair value through income statement” upon initial recognition are subsequently remeasured at fair value with all changes in fair value being recorded in the consolidated income statement.
Investment in associates An associate is an entity over which the Bank has significant influence. Significant influence is the power to participate in the financial and operating policy decisions of the investee, but is not control or joint control over those policies.
The considerations made in determining significant influence are similar to those necessary to determine control over subsidiaries.The Bank’s investments in its associates are accounted for using the equity method. Under the equity method, the investment in an associate is initially recognised at cost. The carrying amount of the investment is adjusted to recognise changes in the Bank’s share of net assets of the associate since the acquisition date. Goodwill relating to the associate is included in the carrying amount of the investment and is neither amortised nor individually tested for impairment. The consolidated statement of income reflects the Bank’s share of the results of operations of the associates. Any change in other comprehensive income of those investees is presented as part of the Bank’s other comprehensive income. In addition, when there has been a change recognised directly in the equity of the associate, the Bank recognises its share of any changes, when applicable, in the consolidated statement of changes in equity. Unrealised gains and losses resulting from transactions between the Bank and the associate are eliminated to the extent of the interest in the associate.
Notes to the consolidated financial statements31 December 2014
46
2 SIGNIFICANT ACCOUNTING POLICIES continued
Investment in associates continuedThe aggregate of the Bank’s share of profit or loss of an associate is shown on the face of the consolidated statement of income. The financial statements of the associate are prepared for the same reporting period as the Bank. When necessary, adjustments are made to bring the accounting policies in line with those of the Bank.
After application of the equity method, the Bank determines whether it is necessary to recognise an impairment loss on its investment in its associate. At each reporting date, the Bank determines whether there is objective evidence that the investment in the associate is impaired. If there is such evidence, the Bank calculates the amount of impairment as the difference between the recoverable amount of the associate and its carrying value, then recognises the loss in the consolidated statement of income.
Upon loss of significant influence over the associate, the Bank measures and recognises any retained investment at its fair value. Any difference between the carrying amount of the associate upon loss of significant influence and the fair value of the retained investment and proceeds from disposal is recognised in the consolidated statement of income.
Repurchase and reverse repurchase agreementsAssets sold with a simultaneous commitment to repurchase at a specified future date (“Repo”) are not derecognised. The counterparty liability for amounts received under these agreements is included in due to banks, customers’ deposits and term loans in the consolidated balance sheet, as appropriate. The difference between the sale and repurchase price is treated as interest expense which is accrued over the life of the repo agreement using the effective interest rate.
Conversely, securities purchased under agreements to resell at a specified future date (“Reverse Repos”) are not recognised on the consolidated balance sheet. The corresponding cash paid, including accrued interest, is included in loans and advances. The difference between the purchase price and resale prices is treated as interest income which is accrued, using the effective interest rate, over the life of the Reverse Repos.
Loans and advancesThese are stated at amortised cost, adjusted for effective fair value hedges and stated net of interest suspended less any amounts written off and provision for impairment. Impaired loans are written off only when all possible courses of action to achieve recovery have proved unsuccessful. Amortised cost is calculated using the effective interest rate method.
Business combinations and goodwillBusiness combinations are accounted for using the acquisition method. The cost of an acquisition is measured as the aggregate of the consideration transferred measured at acquisition date fair value and the amount of any non-controlling interests in the acquiree. For each business combination, the Bank elects whether to measure the non-controlling interests in the acquiree at fair value or at the proportionate share of the acquiree’s identifiable net assets. Acquisition-related costs are expensed as incurred and included in administrative expenses.
When the Bank acquires a business, it assesses the financial assets and liabilities assumed for appropriate classification and designation in accordance with the contractual terms, economic circumstances and pertinent conditions as at the acquisition date. This includes the separation of embedded derivatives in host contracts by the acquiree.
If the business combination is achieved in stages, any previously held equity interest is re-measured at its acquisition date fair value and any resulting gain or loss is recognised in profit or loss. It is then considered in the determination of goodwill.
Notes to the consolidated financial statements31 December 2014
47
2 SIGNIFICANT ACCOUNTING POLICIES continued
Business combinations and goodwill continuedAny contingent consideration to be transferred by the acquirer will be recognised at fair value at the acquisition date. Contingent consideration classified as an asset or liability that is a financial instrument and within the scope of IAS 39 Financial Instruments: Recognition and Measurement, is measured at fair value with changes in fair value recognised either in either profit or loss or as a change to other comprehensive income. If the contingent consideration is not within the scope of IAS 39, it is measured in accordance with the appropriate standards. Contingent consideration that is classified as equity is not re-measured and subsequent settlement is accounted for within equity.
Goodwill is initially measured at cost, being the excess of the aggregate of the consideration transferred and the amount recognised for non-controlling interests, and any previous interest held, over the net identifiable assets acquired and liabilities assumed. If the fair value of the net assets acquired is in excess of the aggregate consideration transferred, the Bank re-assesses whether it has correctly identified all of the assets acquired and all of the liabilities assumed and reviews the procedures used to measure the amounts to be recognised at the acquisition date. If the re-assessment still results in an excess of the fair value of net assets acquired over the aggregate consideration transferred, then the gain is recognised in profit or loss.
After initial recognition, goodwill is measured at cost less any accumulated impairment losses. For the purpose of impairment testing, goodwill acquired in a business combination is, from the acquisition date, allocated to each of the Bank’s cash-generating units that are expected to benefit from the combination, irrespective of whether other assets or liabilities of the acquiree are assigned to those units.
Where goodwill has been allocated to a cash-generating unit and part of the operation within that unit is disposed of, the goodwill associated with the disposed operation is included in the carrying amount of the operation when determining the gain or loss on disposal. Goodwill disposed in these circumstances is measured based on the relative values of the disposed operation and the portion of the cash-generating unit retained.
Islamic financingIslamic financing comprise principally of floating profit-rate Ijara and Murabaha contracts which are stated at cost less any provisions for impairment.
IjaraA lease contract whereby the Bank (the Lessor) leases to a customer (the Lessee) a service or the usufruct of an owned or rented physical asset which either exists currently or to be constructed in future (forward lease) for a specific period of time at specific rental instalments. The lease contract could be ended by transferring the ownership of a leased physical asset through an independent mode to the lessee.
MurabahaA sale contract, in which the Bank sells to a customer a physical asset, goods, or shares already owned and possessed (either physically or constructively) at a selling price which consists of the purchasing cost plus a mark-up profit.

Notes to the consolidated financial statements31 December 2014
48
2 SIGNIFICANT ACCOUNTING POLICIES continued
Impairment and uncollectibility of financial assetsAn assessment is made at each balance sheet date to determine whether there is objective evidence that a specific financial asset may be impaired. If such evidence exists, any impairment loss is recognised in the consolidated income statement.
Impairment is determined as follows:
(a) For assets carried at amortised cost, impairment is based on estimated cash flows discounted at the original effective interest rate.
(b) For assets carried at fair value, impairment is the difference between cost and fair value.(c) For assets carried at cost, impairment is based on the present value of future cash flows discounted at the current
market rate of return for a similar financial asset.
For available for sale equity investments, reversals of impairment losses are recorded as increases in cumulative changes in fair value through equity.
In addition, a provision is made to cover collective impairment for specific groups of assets carried at amortised cost, where there is a measurable decrease in estimated future cash flows.
Government grantsGovernment grants are recognised where there is reasonable assurance that the grant will be received and all attaching conditions will be complied with. When the grant relates to an expense item, it is recognised as income over the period necessary to match the grant on a systematic basis to the costs that it is intended to compensate. Where the Bank receives non-monetary grants with no conditions attached thereto, the asset and grant are recorded at fair value and the grant is recognised in the consolidated income statement in the period in which it is received. In the case of other non-monetary grants, the grant is set up as deferred income at its fair value and is released to the consolidated income statement over the expected useful life of the relevant asset by equal annual instalments.
Investment propertiesInvestment properties are measured initially at cost, including transaction costs. Subsequent to initial recognition, investment properties are stated at fair value which reflects market conditions at the balance sheet date. Gains or losses arising from changes in the fair values of investment properties are included in the consolidated income statement in the year in which they arise.
Investment properties are derecognised when either they have been disposed of or when the investment property is permanently withdrawn from use and no future economic benefit is expected from its disposal. Any gains or losses on the retirement or disposal of an investment property are recognised in the consolidated income statement in the year of retirement or disposal.
Property and equipmentProperty and equipment are initially recorded at cost. The carrying amounts are reviewed at each balance sheet date to assess whether they are recorded in excess of their recoverable amount and, where carrying values exceed the recoverable amount, assets are written down. Land is measured at fair value based on valuations performed by independent professional valuers.
Any revaluation surplus is credited to the revaluation reserve included in the equity section of the consolidated statement of financial position, except to the extent that it reverses a revaluation decrease of the same asset previously recognised in the consolidated income statement, in which case the increase is recognised in the consolidated income statement. A revaluation deficit is recognised in the consolidated income statement, except to the extent that it offsets an existing surplus on the same asset recognised in the revaluation reserve.
Notes to the consolidated financial statements31 December 2014
49
2 SIGNIFICANT ACCOUNTING POLICIES continued
Property and equipment continuedDepreciation is provided on a straight-line basis on all property and equipment, other than freehold land which is determined to have an indefinite life.
The estimated useful lives of the assets for the calculation of depreciation are as follows:
Buildings 20 years
Motor vehicles 3 years
Furniture, fixtures and equipment 4 years
Computer hardware and software 4 years
Capital work-in progress is initially recorded at cost, and upon completion is transferred to the appropriate category of property and equipment and thereafter depreciated.
Intangible assetsThe Bank’s intangible assets other than goodwill include intangible assets acquired in business combinations. The cost of intangible assets acquired in a business combination is their fair value at the date of acquisition. Intangible assets acquiredseparately are measured on initial recognition at cost. Following initial recognition, intangible assets are carried at cost less any accumulated amortisation and accumulated impairment losses.
The useful lives of intangible assets are assessed as either finite or indefinite. Intangible assets with finite lives are amortised over the useful economic life and assessed for impairment whenever there is an indication that the intangible asset may be impaired. The amortisation period and the amortisation method for an intangible asset with a finite useful life are reviewed at least at the end of each reporting period. Changes in the expected useful life or the expected pattern of consumption of future economic benefits embodied in the asset are considered to modify the amortisation period or method, as appropriate, and are treated as changes in accounting estimates. The amortisation expense on intangible assets with finite lives is recognised in the consolidated income statement.
The estimated useful lives of the intangible assets for the calculation of amortisation are as follows:
Dubai First Brand 20 years
Credit card customer relationships – Royale Card 15 years
Other credit card customer relationships 7.5 years
Core deposit intangibles: corporate deposits 2.5 years
Core deposit intangibles: margin deposits 15 years
ProvisionsProvisions are recognised when the Bank has a present obligation (legal or constructive) arising from a past event and the costs to settle the obligation are both probable and able to be reliably measured.
DepositsAll money market and customer deposits are carried at amortised cost less amounts repaid.

Notes to the consolidated financial statements31 December 2014
50
2 SIGNIFICANT ACCOUNTING POLICIES continued
Treasury sharesOwn equity instruments which are acquired (treasury shares) are deducted from the equity and accounted for at weighted average cost. No gain or loss is recognised in the consolidated income statement on the purchase, sale, issue or cancelation of the Bank’s own equity instruments. Any difference between the carrying amount and the consideration, if reissued, is recognised in share premium. If treasury shares are distributed as part of a bonus share issue, the cost of the shares is charged against retained earnings. Voting rights relating to treasury shares are nullified for the Bank and no dividends are allocated to them respectively.
Fiduciary assetsAssets held in trust or in a fiduciary capacity are not treated as assets of the Bank and accordingly are not included in these consolidated financial statements.
Revenue recognitionRevenue is recognised to the extent that it is probable that the economic benefits will flow to the Bank and the revenue can be reliably measured. The following specific recognition criteria must also be met before revenue is recognised:
Interest income and expenseFor all financial instruments measured at amortised cost and interest bearing financial instruments classified as available for sale investments, interest income or expense is recorded at the effective interest rate, which is the rate that exactly discounts estimated future cash payments or receipts through the expected life of the financial instrument or a shorter period, where appropriate, to the net carrying amount of the financial asset or financial liability. The calculation takes into account all contractual terms of the financial instrument and includes any fees or incremental costs that are directly attributable to the instrument and are an integral part of the effective interest rate, but not future credit losses.
The carrying amount of the financial asset or financial liability is adjusted if the Bank revises its estimates of payments or receipts. The adjusted carrying amount is calculated based on the original effective interest rate and the change in carrying amount is recorded as interest income or expense.
Once the recorded value of a financial asset or a group of similar financial assets has been reduced due to an impairment loss, interest income continues to be recognised.
Fee and commission incomeThe Bank earns fee and commission income from a diverse range of services it provides to its customers. Fee income can be divided into the following two categories:
Fee income earned from services that are provided over a certain period of timeFees earned for the provision of services over a period of time are accrued over that period. These fees include commission income and asset management, custody and other management and advisory fees. Loan commitment fees for loans that are likely to be drawn down and other credit related fees are deferred (together with any incremental costs) and recognised as an adjustment to the effective interest rate on the loan.
Fee income from providing transaction servicesFees arising from negotiating or participating in the negotiation of a transaction for a third party – such as the arrangement of the acquisition of shares or other securities or the purchase or sale of businesses – are recognised on completion of the underlying transaction. Fees or components of fees that are linked to a certain performance are recognised after fulfilling the corresponding criteria.

Notes to the consolidated financial statements31 December 2014
51
2 SIGNIFICANT ACCOUNTING POLICIES continued
Revenue recognitionDividend incomeRevenue is recognised when the Bank’s right to receive the payment is established.
Net trading incomeResults arising from trading activities include all gains and losses from changes in fair value and related interest income or expense and dividends for financial assets and financial liabilities held for trading. This includes any ineffectiveness recorded in hedging transactions.
Rental incomeRental income arising on investment properties is accounted for on a straight-line basis over the lease terms on ongoing leases and is recorded in the income statement in ‘Other operating income’.
Income and expense from Islamic financingIncome and expense from Islamic financing is recognised on a time-proportion basis based on principal amounts outstanding.
Foreign currenciesMonetary assets and liabilities in foreign currencies are translated into AED at rates of exchange prevailing at the balance sheet date. Any gains and losses are taken to the consolidated income statement.
Non-monetary items that are measured in terms of historical cost in a foreign currency are translated using the exchange rates as at the dates of the initial transactions. Non-monetary items measured at fair value in a foreign currency are translated using the exchange rates at the date when the fair value was determined.
As at the reporting date, the assets and liabilities of foreign operations are translated into the Bank’s presentation currency at the rate of exchange ruling at the balance sheet date, and their income statements are translated at the weighted average exchange rates for the year. Exchange differences arising on translation are taken directly to a separate component of equity. On disposal of a foreign operation, the deferred cumulative amount recognised in the equity relating to a particular foreign operation is recognised in the consolidated income statement.
Cash and cash equivalentsCash and cash equivalents comprise cash, balances with UAE Central Bank and due from banks and other financial institutions with original maturities of less than three months.
Employees’ pension and end of service benefitsThe Bank provides end of service benefits for its employees. The entitlement to these benefits is based upon the employees’ length of service and completion of a minimum service period. The expected costs of these benefits are accrued over the period of employment.
With respect to its UAE national employees, the Bank makes contributions to the relevant government pension scheme calculated as a percentage of the employees’ salaries. The Bank’s obligations are limited to these contributions, which are expensed when due.
Notes to the consolidated financial statements31 December 2014
52
2 SIGNIFICANT ACCOUNTING POLICIES continued
LeasesFinance leases, which transfer to the Bank substantially all the risks and benefits incidental to ownership of the leased item, are capitalised at the inception of the lease at the fair value of the leased asset or, if lower, at the present value of the minimum lease payments. Lease payments are apportioned between the finance charges and reduction of the lease liability so as to achieve a constant rate of interest on the remaining balance of the liability. Finance charges are charged directly against income. Capitalised leased assets are depreciated over the shorter of the estimated useful life of the asset or the lease term.
Leases where the lessor retains substantially all the risks and benefits of ownership of the asset are classified as operating leases. Operating lease payments are recognised as an expense in the consolidated income statement on a straight line basis over the shorter of the lease term or the estimated useful life of the asset.
DerivativesThe Bank enters into derivative financial instruments including forwards, swaps, futures, options and swaptions in the foreign exchange and capital markets. Derivatives are stated at fair value. The fair value of a derivative is the equivalent of the unrealised gain or loss from marking to market the derivative using prevailing market rates or internal pricing models. Derivatives with positive market values (unrealised gains) are included in other assets and derivatives with negative market values (unrealised losses) are included in other liabilities in the consolidated balance sheet.
HedgesFor the purposes of hedge accounting, hedges are classified into two categories: (a) fair value hedges which hedge the exposure to changes in the fair value of a recognised asset or liability; and (b) cash flow hedges which hedge exposure to variability in cash flows that is either attributable to a particular risk associated with a recognised asset or liability or a forecasted transaction.
In relation to fair value hedges which meet the conditions for hedge accounting, any gain or loss from re-measuring the hedging instrument to fair value is recognised immediately in the consolidated income statement. The hedged item is adjusted for fair value changes relating to the risk being hedged and the difference is recognised in the consolidated income statement.
In relation to cash flow hedges which meet the conditions for hedge accounting, the portion of the gain or loss on the hedging instrument that is determined to be an effective hedge is recognised initially in equity and the ineffective portion is recognised in the consolidated income statement. The gains or losses on effective cash flow hedges recognised initially in equity are either transferred to the consolidated income statement in the period in which the hedged transaction impacts the consolidated income statement or included in the initial measurement of the cost of the related asset or liability.
For hedges which do not qualify for hedge accounting, any gains or losses arising from changes in the fair value of the hedging instrument are taken to the consolidated income statement.
Hedge accounting is discontinued when the hedging instrument expires or is sold, terminated or exercised, or no longer qualifies for hedge accounting. At that point in time, in the case of a cash flow hedge, any cumulative gains or losses on the hedging instrument initially recognised in equity remains in equity until the forecasted transaction occurs. Where the hedged transaction is no longer expected to occur, the net cumulative gains or losses initially recognised in equity are transferred to the consolidated income statement.
In the case of a fair value hedge, for hedged items recorded at amortised cost, using the effective interest rate method, the difference between the carrying value of the hedged item on termination and the face value is amortised over the remaining term of the original hedge. If the hedged item is derecognised, the unamortised fair value adjustment is recognised immediately in the consolidated income statement.

Notes to the consolidated financial statements31 December 2014
53
2 SIGNIFICANT ACCOUNTING POLICIES continued
Settlement date accountingPurchases and sales of financial assets are recognised on the settlement date, i.e. the date that the Bank settles the purchase or sale of an asset.
OffsettingFinancial assets and financial liabilities are only offset and the net amount reported in the consolidated balance sheet when there is a legally enforceable right to set off the recognised amounts and the Bank intends to either settle on a net basis, or to realise the asset and settle the liability simultaneously.
TaxesCurrent income tax assets and liabilities for the current period are measured at the amount expected to be recovered from or paid to the taxation authorities. The tax rates and tax laws used to compute the amount are those that are enacted or substantively enacted, at the reporting date in the countries where the Bank operates and generates taxable income. Taxable profit differs from profit as reported in the consolidated income statement because it excludes items of income or expense that are taxable or deductible in other years and it further excludes items that are never taxable or deductible.
Financial guaranteesFinancial guarantees are defined as contracts whereby an entity undertakes to make specific payments for a third party if the latter does not do so. Financial guarantees are reviewed periodically so as to determine the credit risk to which they are exposed and, if appropriate, to consider whether a provision is required. The credit risk is determined by application of criteria similar to those established for quantifying impairment losses on loans and advances. If a specific provision is required for financial guarantees, the related unearned commissions recognised under other liabilities in the consolidated balance sheet are reclassified to the appropriate provision.
De-recognition of financial assets and liabilitiesThe Bank de-recognises all or part of a financial asset when the contractual rights to the cash flows on the asset expire or when the Bank has transferred the contractual rights to receive the cash flows and substantially all of the risks and rewards linked to the ownership of the asset. The Bank derecognises all or part of a financial liability when the liability is extinguished in full or in part.
Fair value measurementThe Bank measures financial instruments and non-financial assets such as assets held for sale, at fair value at each balance sheet date. Fair values of financial instruments measured at amortised cost are disclosed in note 31.
Fair value is the price that would be received to sell an asset or paid to transfer a liability in an orderly transaction betweenmarket participants at the measurement date. The fair value measurement is based on the presumption that the transaction to sell the asset or transfer the liability takes place either:
The principal or the most advantageous market must be accessible by the Bank.
The fair value of an asset or a liability is measured using the assumptions that market participants would use when pricing the asset or liability, assuming that market participants act in their economic best interest.

Notes to the consolidated financial statements31 December 2014
54
2 SIGNIFICANT ACCOUNTING POLICIES continued
Fair value measurement continuedA fair value measurement of a non-financial asset takes into account a market participant’s ability to generate economic benefits by using the asset in its highest and best use or by selling it to another market participant that would use the asset in its highest and best use.
The Bank uses valuation techniques that are appropriate in the circumstances and for which sufficient data are available to measure fair value, maximising the use of relevant observable inputs and minimising the use of unobservable inputs.
All assets and liabilities for which fair value is measured or disclosed in the financial statements are categorized within the fair value hierarchy, described as follows, based on the lowest level input that is significant to the fair value measurement as a whole:
directly or indirectly observable
unobservable
For assets and liabilities that are recognised in the financial statements on a recurring basis, the Bank determines whether transfers have occurred between levels in the hierarchy by re-assessing categorisation (based on the lowest level input that is significant to the fair value measurement as a whole) at the end of each reporting period.
For the purpose of fair value disclosures, the Bank has determined classes of assets and liabilities on the basis of the nature, characteristics and risks of the asset or liability and the level of the fair value hierarchy as explained above.
The management determines the policies and procedures for both recurring fair value measurement and for non-recurring measurement, such as assets held for sale. External valuers are involved for valuation of significant assets, such as investment properties. Selection criteria for valuers include market knowledge, reputation, independence and whether professional standards are maintained. The management decides, after discussions with the Bank’s external valuers, which valuation techniques and inputs to use for each case.
The management, in conjunction with the Bank’s external valuers, also compares the changes in the fair value of each asset and liability with relevant external sources to determine whether the change is reasonable.
For investments and derivatives quoted in an active market, fair value is determined by reference to quoted market prices. Bid prices are used for assets and ask prices are used for liabilities. The fair value of investments in mutual funds, private equity funds or similar investment vehicles are based on the last net asset value published by the fund manager. For other investments, a reasonable estimate of the fair value is determined by reference to the price of recent market transactions involving such investments, current market value of instruments which are substantially the same, or is based on the expected discounted cash flows.
The estimated fair value of deposits with no stated maturity, which includes non-interest bearing deposits, is the amount payable on demand.
The fair value of forward exchange contracts is calculated by reference to forward exchange rates with similar maturities. For other derivatives without quoted prices in an active market, fair value is determined based on quotations received from counter party financial institutions or established third party valuation models.
The fair value of unquoted investments is determined by reference to discounted cash flows, pricing models, net asset base of investee companies or broker over-the-counter quotes.
Notes to the consolidated financial statements31 December 2014
55
2 SIGNIFICANT ACCOUNTING POLICIES continued
Repossessed collateral Repossessed collateral against settlement of customers’ debts are stated within the consolidated statement of financial position under “Other assets” at their acquisition date fair value net of allowance for impairment.
According to the instructions of the Central Bank of the UAE, the Bank should dispose of any land and properties acquired against settlement of debts within a period not exceeding three years from the date of acquiring the assets.
Significant accounting judgements and estimatesIn the process of applying the Bank’s accounting policies, management has used its judgements and made estimates in determining the amounts recognised in the financial statements. The most significant use of judgments and estimates are as follows:
Going concernThe Bank’s management has made an assessment of the Bank’s ability to continue as a going concern and is satisfied that the Bank has the resources to continue in business for the foreseeable future. Furthermore, management is not aware of any material uncertainties that may cast significant doubt upon the Bank’s ability to continue as a going concern. Therefore, the consolidated financial statements continue to be prepared on the going concern basis.
Classification of investment properties under constructionManagement decides for each property whether it should be classified as investment property, property and equipment or as properties held for sale.
Properties acquired by the Bank are recorded as investment properties if these were acquired for rental purposes or capital appreciation.
Properties held for own-use are recorded as property and equipment.
Properties are recorded as held for sale, at cost, if their carrying amounts will be recovered through a sale transaction.
Classification of investmentsManagement decides on acquisition of an investment whether it should be classified as held to maturity, held for trading, carried at fair value through income statement, or available for sale.
For those deemed to be held to maturity, management ensures that the requirements of IAS 39 are met and in particular the Bank has the intention and ability to hold these to maturity.
The Bank classifies investments as trading if they are acquired primarily for the purpose of making a short term profit by the dealers.
Classification of investments as fair value through income statement depends on how management monitors the performance of these investments. When they are not classified as held for trading but have readily available reliable fair values and the changes in fair values are reported as part of profit or loss in the management accounts, they are classified as fair value through income statement.
All other investments are classified as available for sale.

Notes to the consolidated financial statements31 December 2014
56
2 SIGNIFICANT ACCOUNTING POLICIES continued
Significant accounting judgements and estimates continuedImpairment of investmentsThe Bank treats available for sale equity investments as impaired when there has been a significant or prolonged decline in the fair value below its cost or where other objective evidence of impairment exists. The determination of what is ‘significant’ or ‘prolonged’ requires judgement for which management takes into consideration, amongst other factors, share price volatility and the underlying asset base of the investee companies.
Impairment losses on loans and advances The Bank reviews its problem loans and advances on a quarterly basis to assess whether a provision for impairment should be recorded in the consolidated income statement. In particular, considerable judgment by management is required in the estimation of the amount and timing of future cash flows when determining the level of provisions required. Such estimates are necessarily based on assumptions about several factors involving varying degrees of judgment and uncertainty, and actual results may differ resulting in future changes to such provisions.
Collective impairment provisions on loans and advancesIn addition to specific provisions against individually significant loans and advances, the Bank also makes a collective impairment provision against loans and advances which although not specifically identified as requiring a specific provision have a greater risk of default than when originally granted. The amount of the provision is based on the guidelines issued by the Central Bank of the UAE.
3 CASH AND BALANCES WITH CENTRAL BANKS
2014 2013
AED 000 AED 000
Cash on hand 427,684 370,393
Balances with Central Banks 21,113,715 15,574,161
21,541,399 15,944,554
Balances with UAE Central Bank include AED 5,529,441 thousand (2013: AED 4,382,713 thousand) representing mandatory cash reserve deposits and AED 10,570,518 thousand (2013: AED 7,000,000 thousand) representing certificates of deposit. These are not available for use in the Bank’s day-to-day operations.
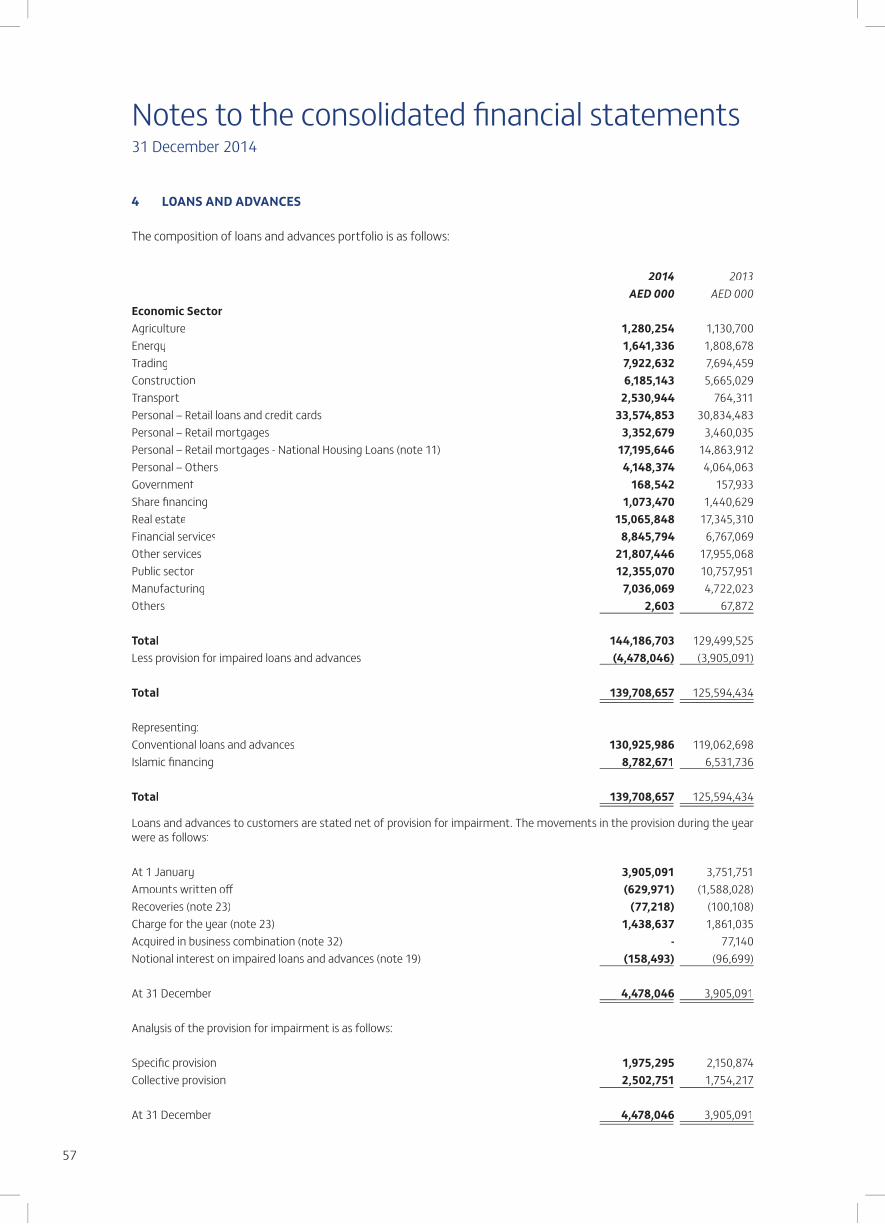
Notes to the consolidated financial statements31 December 2014
57
4 LOANS AND ADVANCES
The composition of loans and advances portfolio is as follows:
2014 2013AED 000 AED 000
Economic SectorAgriculture 1,280,254 1,130,700Energy 1,641,336 1,808,678Trading 7,922,632 7,694,459Construction 6,185,143 5,665,029Transport 2,530,944 764,311Personal – Retail loans and credit cards 33,574,853 30,834,483Personal – Retail mortgages 3,352,679 3,460,035Personal – Retail mortgages - National Housing Loans (note 11) 17,195,646 14,863,912Personal – Others 4,148,374 4,064,063Government 168,542 157,933Share financing 1,073,470 1,440,629Real estate 15,065,848 17,345,310Financial services 8,845,794 6,767,069Other services 21,807,446 17,955,068Public sector 12,355,070 10,757,951Manufacturing 7,036,069 4,722,023Others 2,603 67,872
Total 144,186,703 129,499,525Less provision for impaired loans and advances (4,478,046) (3,905,091)
Total 139,708,657 125,594,434
Representing:Conventional loans and advances 130,925,986 119,062,698Islamic financing 8,782,671 6,531,736
Total 139,708,657 125,594,434
Loans and advances to customers are stated net of provision for impairment. The movements in the provision during the year were as follows:
At 1 January 3,905,091 3,751,751Amounts written off (629,971) (1,588,028)Recoveries (note 23) (77,218) (100,108)Charge for the year (note 23) 1,438,637 1,861,035Acquired in business combination (note 32) - 77,140Notional interest on impaired loans and advances (note 19) (158,493) (96,699)
At 31 December 4,478,046 3,905,091
Analysis of the provision for impairment is as follows:
Specific provision 1,975,295 2,150,874Collective provision 2,502,751 1,754,217
At 31 December 4,478,046 3,905,091
, ,
, ,
, ,
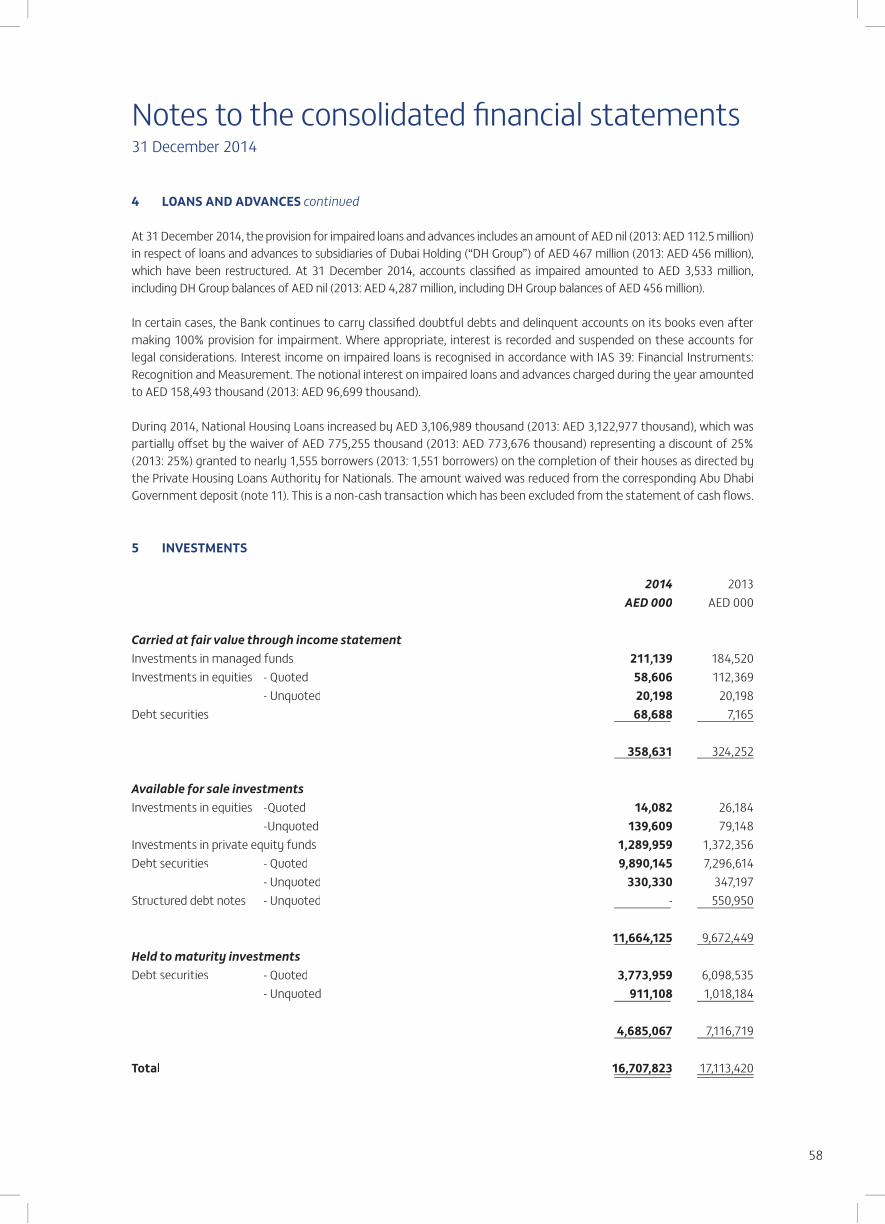
Notes to the consolidated financial statements31 December 2014
58
4 LOANS AND ADVANCES continued
At 31 December 2014, the provision for impaired loans and advances includes an amount of AED nil (2013: AED 112.5 million)in respect of loans and advances to subsidiaries of Dubai Holding (“DH Group”) of AED 467 million (2013: AED 456 million),which have been restructured. At 31 December 2014, accounts classified as impaired amounted to AED 3,533 million, including DH Group balances of AED nil (2013: AED 4,287 million, including DH Group balances of AED 456 million).
In certain cases, the Bank continues to carry classified doubtful debts and delinquent accounts on its books even after making 100% provision for impairment. Where appropriate, interest is recorded and suspended on these accounts for legal considerations. Interest income on impaired loans is recognised in accordance with IAS 39: Financial Instruments: Recognition and Measurement. The notional interest on impaired loans and advances charged during the year amounted to AED 158,493 thousand (2013: AED 96,699 thousand).
During 2014, National Housing Loans increased by AED 3,106,989 thousand (2013: AED 3,122,977 thousand), which was partially offset by the waiver of AED 775,255 thousand (2013: AED 773,676 thousand) representing a discount of 25% (2013: 25%) granted to nearly 1,555 borrowers (2013: 1,551 borrowers) on the completion of their houses as directed by the Private Housing Loans Authority for Nationals. The amount waived was reduced from the corresponding Abu Dhabi Government deposit (note 11). This is a non-cash transaction which has been excluded from the statement of cash flows.
5 INVESTMENTS
2014 2013AED 000 AED 000
Carried at fair value through income statementInvestments in managed funds 211,139 184,520Investments in equities - Quoted 58,606 112,369
- Unquoted 20,198 20,198Debt securities 68,688 7,165
358,631 324,252
Available for sale investmentsInvestments in equities -Quoted 14,082 26,184 -Unquoted 139,609 79,148Investments in private equity funds 1,289,959 1,372,356Debt securities - Quoted 9,890,145 7,296,614 - Unquoted 330,330 347,197Structured debt notes - Unquoted - 550,950
11,664,125 9,672,449Held to maturity investmentsDebt securities - Quoted 3,773,959 6,098,535
- Unquoted 911,108 1,018,184
4,685,067 7,116,719
Total 16,707,823 17,113,420
,,
, ,
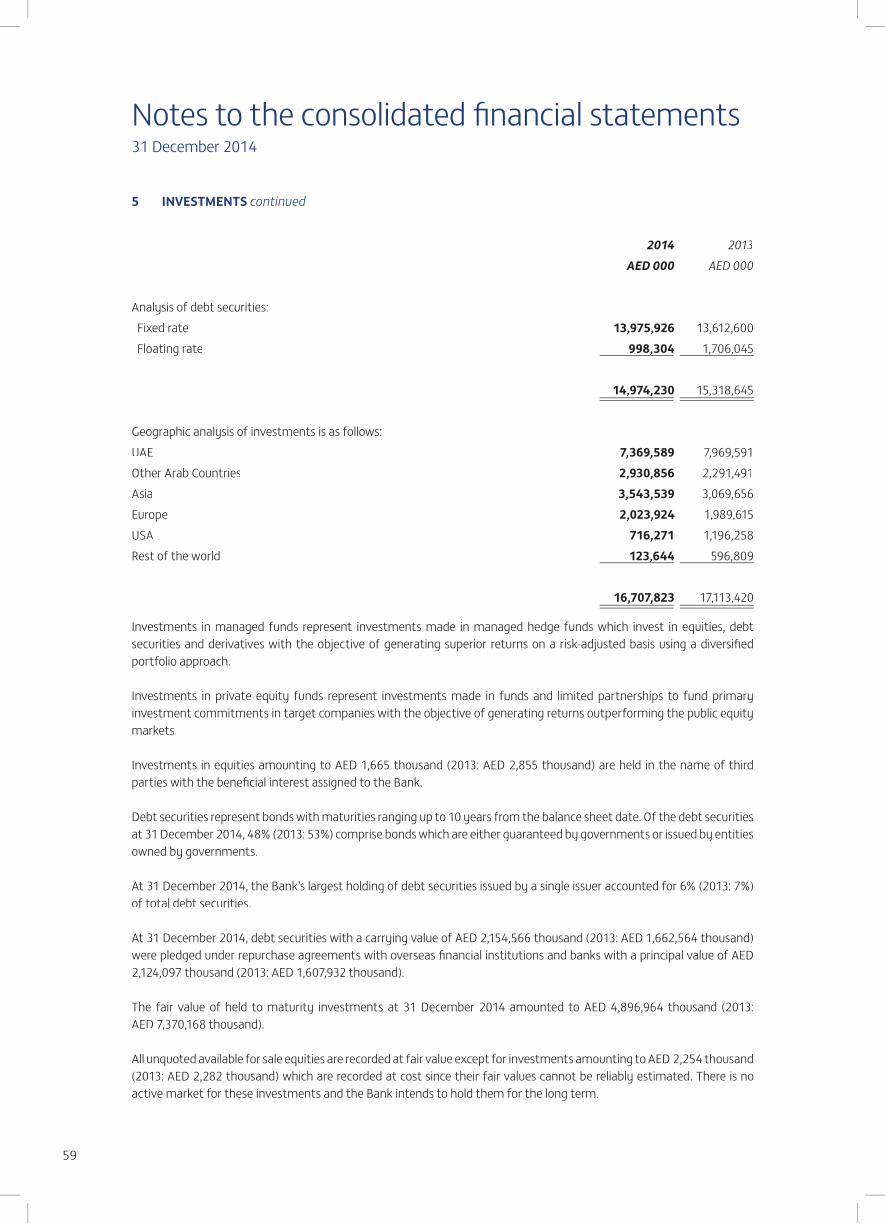
Notes to the consolidated financial statements31 December 2014
59
5 INVESTMENTS continued
2014 2013AED 000 AED 000
Analysis of debt securities: Fixed rate 13,975,926 13,612,600 Floating rate 998,304 1,706,045
14,974,230 15,318,645
Geographic analysis of investments is as follows:UAE 7,369,589 7,969,591Other Arab Countries 2,930,856 2,291,491Asia 3,543,539 3,069,656Europe 2,023,924 1,989,615USA 716,271 1,196,258Rest of the world 123,644 596,809
16,707,823 17,113,420
Investments in managed funds represent investments made in managed hedge funds which invest in equities, debt securities and derivatives with the objective of generating superior returns on a risk-adjusted basis using a diversified portfolio approach.
Investments in private equity funds represent investments made in funds and limited partnerships to fund primary investment commitments in target companies with the objective of generating returns outperforming the public equity markets.
Investments in equities amounting to AED 1,665 thousand (2013: AED 2,855 thousand) are held in the name of third parties with the beneficial interest assigned to the Bank.
Debt securities represent bonds with maturities ranging up to 10 years from the balance sheet date. Of the debt securities at 31 December 2014, 48% (2013: 53%) comprise bonds which are either guaranteed by governments or issued by entities owned by governments.
At 31 December 2014, the Bank’s largest holding of debt securities issued by a single issuer accounted for 6% (2013: 7%) of total debt securities.
At 31 December 2014, debt securities with a carrying value of AED 2,154,566 thousand (2013: AED 1,662,564 thousand) were pledged under repurchase agreements with overseas financial institutions and banks with a principal value of AED 2,124,097 thousand (2013: AED 1,607,932 thousand).
The fair value of held to maturity investments at 31 December 2014 amounted to AED 4,896,964 thousand (2013: AED 7,370,168 thousand).
All unquoted available for sale equities are recorded at fair value except for investments amounting to AED 2,254 thousand(2013: AED 2,282 thousand) which are recorded at cost since their fair values cannot be reliably estimated. There is no active market for these investments and the Bank intends to hold them for the long term.
,
,
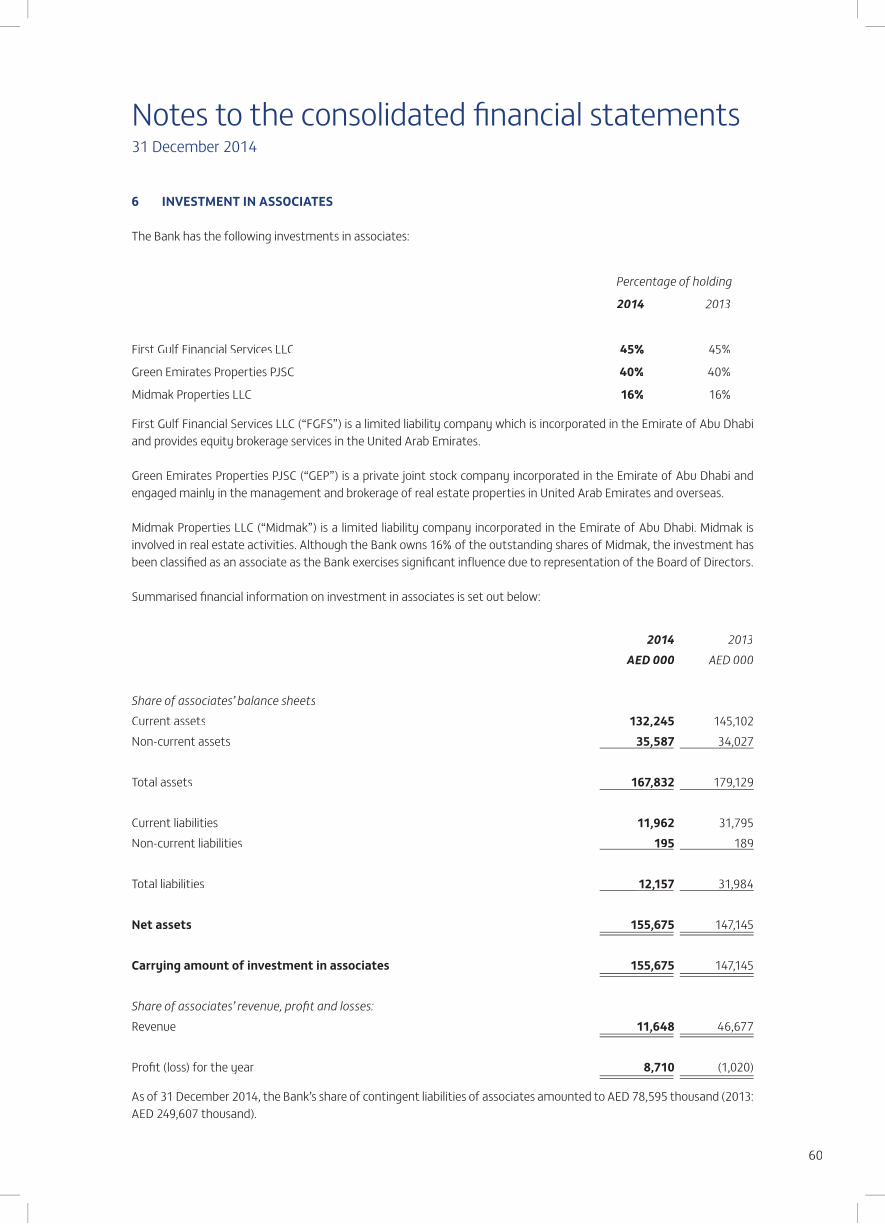
Notes to the consolidated financial statements31 December 2014
60
6 INVESTMENT IN ASSOCIATES
The Bank has the following investments in associates:
Percentage of holding
2014 2013
First Gulf Financial Services LLC 45% 45%
Green Emirates Properties PJSC 40% 40%
Midmak Properties LLC 16% 16%
First Gulf Financial Services LLC (“FGFS”) is a limited liability company which is incorporated in the Emirate of Abu Dhabi and provides equity brokerage services in the United Arab Emirates.
Green Emirates Properties PJSC (“GEP”) is a private joint stock company incorporated in the Emirate of Abu Dhabi and engaged mainly in the management and brokerage of real estate properties in United Arab Emirates and overseas.
Midmak Properties LLC (“Midmak”) is a limited liability company incorporated in the Emirate of Abu Dhabi. Midmak is involved in real estate activities. Although the Bank owns 16% of the outstanding shares of Midmak, the investment has been classified as an associate as the Bank exercises significant influence due to representation of the Board of Directors.
Summarised financial information on investment in associates is set out below:
2014 2013AED 000 AED 000
Share of associates’ balance sheetsCurrent assets 132,245 145,102Non-current assets 35,587 34,027
Total assets 167,832 179,129
Current liabilities 11,962 31,795Non-current liabilities 195 189
Total liabilities 12,157 31,984
Net assets 155,675 147,145
Carrying amount of investment in associates 155,675 147,145
Share of associates’ revenue, profit and losses:Revenue 11,648 46,677
Profit (loss) for the year 8,710 (1,020)
As of 31 December 2014, the Bank’s share of contingent liabilities of associates amounted to AED 78,595 thousand (2013: AED 249,607 thousand).
,
,
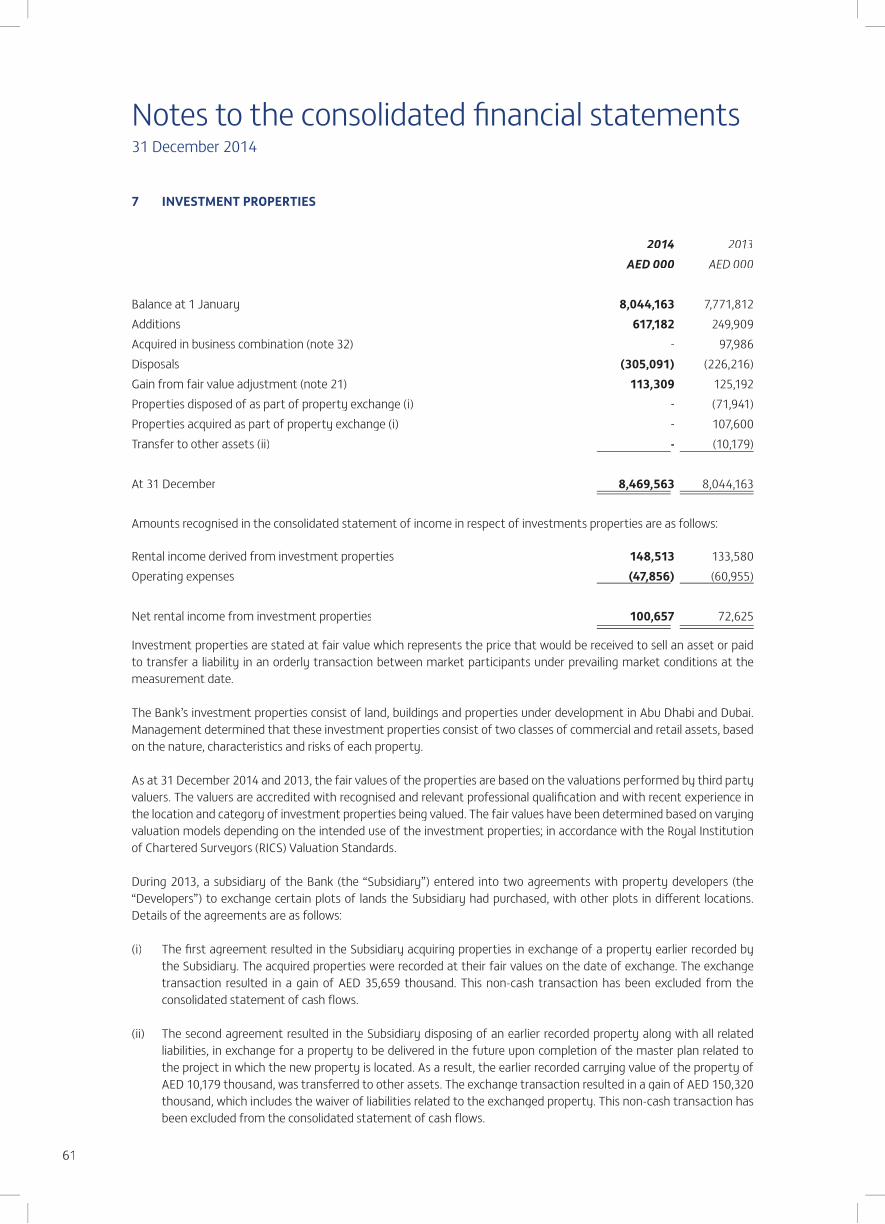
Notes to the consolidated financial statements31 December 2014
61
7 INVESTMENT PROPERTIES
2014 2013AED 000 AED 000
Balance at 1 January 8,044,163 7,771,812Additions 617,182 249,909Acquired in business combination (note 32) - 97,986Disposals (305,091) (226,216)Gain from fair value adjustment (note 21) 113,309 125,192Properties disposed of as part of property exchange (i) - (71,941)Properties acquired as part of property exchange (i) - 107,600Transfer to other assets (ii) - (10,179)
At 31 December 8,469,563 8,044,163
Amounts recognised in the consolidated statement of income in respect of investments properties are as follows:
Rental income derived from investment properties 148,513 133,580Operating expenses (47,856) (60,955)
Net rental income from investment properties 100,657 72,625
Investment properties are stated at fair value which represents the price that would be received to sell an asset or paid to transfer a liability in an orderly transaction between market participants under prevailing market conditions at the measurement date.
The Bank’s investment properties consist of land, buildings and properties under development in Abu Dhabi and Dubai. Management determined that these investment properties consist of two classes of commercial and retail assets, based on the nature, characteristics and risks of each property.
As at 31 December 2014 and 2013, the fair values of the properties are based on the valuations performed by third party valuers. The valuers are accredited with recognised and relevant professional qualification and with recent experience in the location and category of investment properties being valued. The fair values have been determined based on varying valuation models depending on the intended use of the investment properties; in accordance with the Royal Institution of Chartered Surveyors (RICS) Valuation Standards.
During 2013, a subsidiary of the Bank (the “Subsidiary”) entered into two agreements with property developers (the “Developers”) to exchange certain plots of lands the Subsidiary had purchased, with other plots in different locations. Details of the agreements are as follows:
(i) The first agreement resulted in the Subsidiary acquiring properties in exchange of a property earlier recorded by the Subsidiary. The acquired properties were recorded at their fair values on the date of exchange. The exchange transaction resulted in a gain of AED 35,659 thousand. This non-cash transaction has been excluded from the consolidated statement of cash flows.
(ii) The second agreement resulted in the Subsidiary disposing of an earlier recorded property along with all related liabilities, in exchange for a property to be delivered in the future upon completion of the master plan related to the project in which the new property is located. As a result, the earlier recorded carrying value of the property of AED 10,179 thousand, was transferred to other assets. The exchange transaction resulted in a gain of AED 150,320 thousand, which includes the waiver of liabilities related to the exchanged property. This non-cash transaction has been excluded from the consolidated statement of cash flows.

Notes to the consolidated financial statements31 December 2014
62
7 INVESTMENT PROPERTIES continued
The following table shows the analysis of investment properties recorded at fair value by level of the fair value hierarchy:
Level 1 Level 2 Level 3 TotalAED 000 AED 000 AED 000 AED 000
31 December 2014 - 130,486 8,339,077 8,469,563
31 December 2013 - 130,486 7,913,677 8,044,163
Reconciliation of fair value for investment properties is as follows:
Investment propertiesLand & Under-
buildings development TotalAED 000 AED 000 AED 000
Opening balance 4,691,199 3,352,964 8,044,163Additions 15,640 601,542 617,182Disposals (305,091) - (305,091)Fair value adjustment 159,545 (46,236) 113,309
Closing balance 4,561,293 3,908,270 8,469,563
Unrealised gains/(losses) for the year included in profit or loss (recognised in other operating income) 159,545 (46,236) 113,309
Description of valuation techniques used and key inputs to valuation on investment properties as at 31 December 2014 and 2013:
Valuation technique Significant unobservable inputs
Buildings Comparable and Residual Method Comparable transactions
Land Comparable and Residual Method Cost of construction Developer’s profit Financing cost
Properties under development Discounted cash flow method Discount rate Cash inflows Cash outflows
8 OTHER ASSETS2014 2013
AED 000 AED 000
Interest receivable 1,161,403 1,143,491Prepayments 72,385 70,522Positive fair value of derivatives (note 28) 1,526,250 628,218Receivable from sale of investment properties 36,195 21,666Goodwill on acquisition of a subsidiary (note 32) 36,869 36,869Intangible assets (note 32) 176,567 202,000Advances against purchase of properties 68,145 78,324Acceptances 4,871,345 4,525,016Others 1,561,508 986,017
Total 9,510,667 7,692,123
, ,
, ,
, ,
, ,
,
, ,
, ,
,
,
,
,
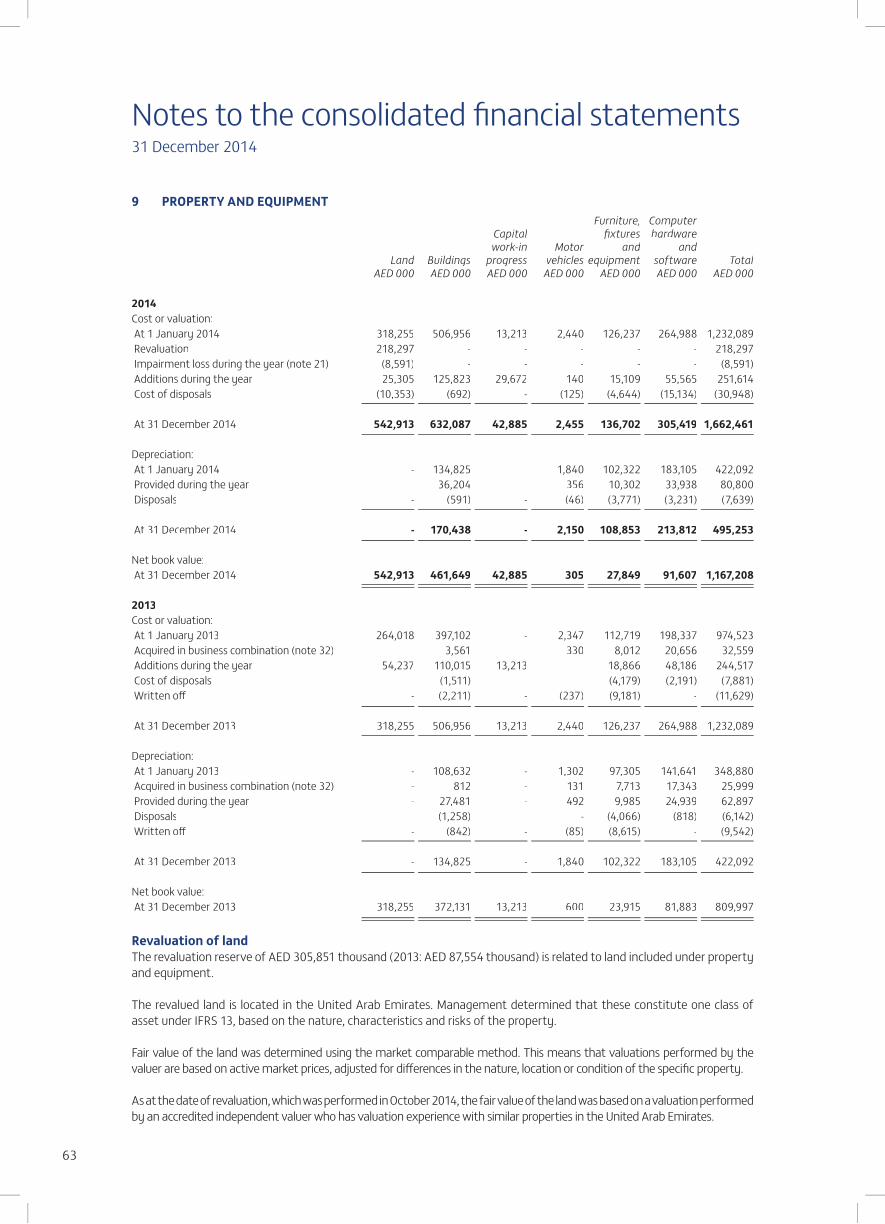
Notes to the consolidated financial statements31 December 2014
63
9 PROPERTY AND EQUIPMENTFurniture, Computer
Capital fixtures hardwarework-in Motor and and
Land Buildings progress vehicles equipment software TotalAED 000 AED 000 AED 000 AED 000 AED 000 AED 000 AED 000
2014Cost or valuation: At 1 January 2014 318,255 506,956 13,213 2,440 126,237 264,988 1,232,089 Revaluation 218,297 - - - - - 218,297 Impairment loss during the year (note 21) (8,591) - - - - - (8,591) Additions during the year 25,305 125,823 29,672 140 15,109 55,565 251,614 Cost of disposals (10,353) (692) - (125) (4,644) (15,134) (30,948)
At 31 December 2014 542,913 632,087 42,885 2,455 136,702 305,419 1,662,461
Depreciation: At 1 January 2014 - 134,825 - 1,840 102,322 183,105 422,092Provided during the year - 36,204 - 356 10,302 33,938 80,800 Disposals - (591) - (46) (3,771) (3,231) (7,639)
At 31 December 2014 - 170,438 - 2,150 108,853 213,812 495,253
Net book value: At 31 December 2014 542,913 461,649 42,885 305 27,849 91,607 1,167,208
2013Cost or valuation: At 1 January 2013 264,018 397,102 - 2,347 112,719 198,337 974,523 Acquired in business combination (note 32) - 3,561 - 330 8,012 20,656 32,559 Additions during the year 54,237 110,015 13,213 - 18,866 48,186 244,517 Cost of disposals - (1,511) - - (4,179) (2,191) (7,881)Written off - (2,211) - (237) (9,181) - (11,629)
At 31 December 2013 318,255 506,956 13,213 2,440 126,237 264,988 1,232,089
Depreciation: At 1 January 2013 - 108,632 - 1,302 97,305 141,641 348,880 Acquired in business combination (note 32) - 812 - 131 7,713 17,343 25,999 Provided during the year - 27,481 - 492 9,985 24,939 62,897 Disposals - (1,258) - - (4,066) (818) (6,142)Written off - (842) - (85) (8,615) - (9,542)
At 31 December 2013 - 134,825 - 1,840 102,322 183,105 422,092
Net book value: At 31 December 2013 318,255 372,131 13,213 600 23,915 81,883 809,997
Revaluation of landThe revaluation reserve of AED 305,851 thousand (2013: AED 87,554 thousand) is related to land included under property and equipment.
The revalued land is located in the United Arab Emirates. Management determined that these constitute one class of asset under IFRS 13, based on the nature, characteristics and risks of the property.
Fair value of the land was determined using the market comparable method. This means that valuations performed by the valuer are based on active market prices, adjusted for differences in the nature, location or condition of the specific property.
As at the date of revaluation, which was performed in October 2014, the fair value of the land was based on a valuation performed by an accredited independent valuer who has valuation experience with similar properties in the United Arab Emirates.

Notes to the consolidated financial statements31 December 2014
64
10 DUE TO BANKS
2014 2013AED 000 AED 000
Current and demand deposits 1,009,825 97,213Deposits maturing within one year 11,580,702 5,107,429
Total 12,590,527 5,204,642
As of 31 December 2014, deposits maturing within one year amounting to AED 1,891,097 thousand (2013: AED 1,115,465thousand) are held against the sale of debt securities with a carrying value of AED 1,918,249 thousand (2013: AED 1,126,282 thousand) with arrangements to repurchase them at a fixed future date.
11 CUSTOMERS’ DEPOSITS
2014 2013AED 000 AED 000
Current accounts 27,273,140 25,615,919Saving accounts 1,901,435 2,117,987Time deposits 88,066,542 89,985,412Call and other deposits 24,030,633 20,234,214
Total 141,271,750 137,953,532
As of 31 December 2014, time deposits include deposits of AED 24,741 thousand (2013: AED 32,975 thousand) from overseas financial institutions held against the sale of debt securities, with a carrying value of AED 24,556 thousand (2013: AED 32,829 thousand), with arrangements to repurchase them at a fixed future date.
In December 2006, the Bank received an initial deposit of AED 5 billion from the Government of Abu Dhabi (the “Government”) to fund an interest-free housing loans scheme for UAE Nationals, which is recorded in call and other deposits. The scheme is being administered by the Bank based on various terms and conditions agreed with the Government. As of 31 December 2014, the Government’s time deposit amounted to AED 17,688 million (2013: AED 15,067 million) and housing loans (note 4) amounted to AED 17,196 million (2013: AED 14,864 million). Interest is payable on this Government deposit at market rates based on the principal amount net of loan disbursements made.
During the year, the Abu Dhabi Government deposit increased by AED 3,106,989 thousand (2013: AED 3,122,976 thousand).The increase was partially offset by the waiver of AED 775,255 thousand (2013: AED 773,676 thousand) representing a discount of 25% (2013: 25%) granted to nearly 1,555 borrowers (2013: 1,551 borrowers) as further discussed in note 4. This is a non-cash transaction which has been excluded from the statement of cash flows.
As of 31 December 2014, the top 5 depositors accounted for 29% of total customer deposits (2013: 30%).
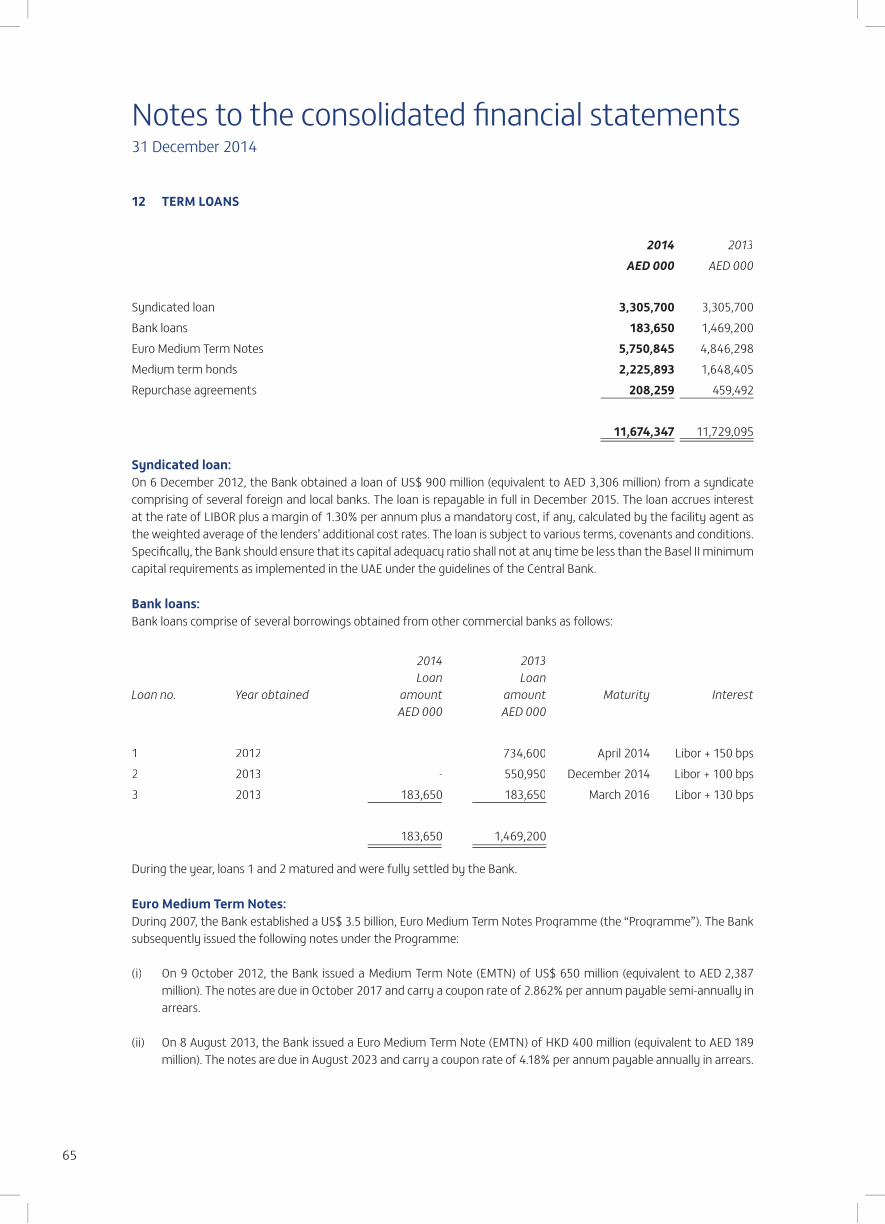
Notes to the consolidated financial statements31 December 2014
65
12 TERM LOANS
2014 2013AED 000 AED 000
Syndicated loan 3,305,700 3,305,700Bank loans 183,650 1,469,200Euro Medium Term Notes 5,750,845 4,846,298Medium term bonds 2,225,893 1,648,405Repurchase agreements 208,259 459,492
11,674,347 11,729,095
Syndicated loan:On 6 December 2012, the Bank obtained a loan of US$ 900 million (equivalent to AED 3,306 million) from a syndicate comprising of several foreign and local banks. The loan is repayable in full in December 2015. The loan accrues interest at the rate of LIBOR plus a margin of 1.30% per annum plus a mandatory cost, if any, calculated by the facility agent as the weighted average of the lenders’ additional cost rates. The loan is subject to various terms, covenants and conditions. Specifically, the Bank should ensure that its capital adequacy ratio shall not at any time be less than the Basel II minimum capital requirements as implemented in the UAE under the guidelines of the Central Bank.
Bank loans:Bank loans comprise of several borrowings obtained from other commercial banks as follows:
2014 2013Loan Loan
Loan no. Year obtained amount amount Maturity InterestAED 000 AED 000
1 2012 - 734,600 April 2014 Libor + 150 bps2 2013 - 550,950 December 2014 Libor + 100 bps3 2013 183,650 183,650 March 2016 Libor + 130 bps
183,650 1,469,200
During the year, loans 1 and 2 matured and were fully settled by the Bank.
Euro Medium Term Notes:During 2007, the Bank established a US$ 3.5 billion, Euro Medium Term Notes Programme (the “Programme”). The Bank subsequently issued the following notes under the Programme:
(i) On 9 October 2012, the Bank issued a Medium Term Note (EMTN) of US$ 650 million (equivalent to AED 2,387million). The notes are due in October 2017 and carry a coupon rate of 2.862% per annum payable semi-annually in arrears.
(ii) On 8 August 2013, the Bank issued a Euro Medium Term Note (EMTN) of HKD 400 million (equivalent to AED 189million). The notes are due in August 2023 and carry a coupon rate of 4.18% per annum payable annually in arrears.
, ,
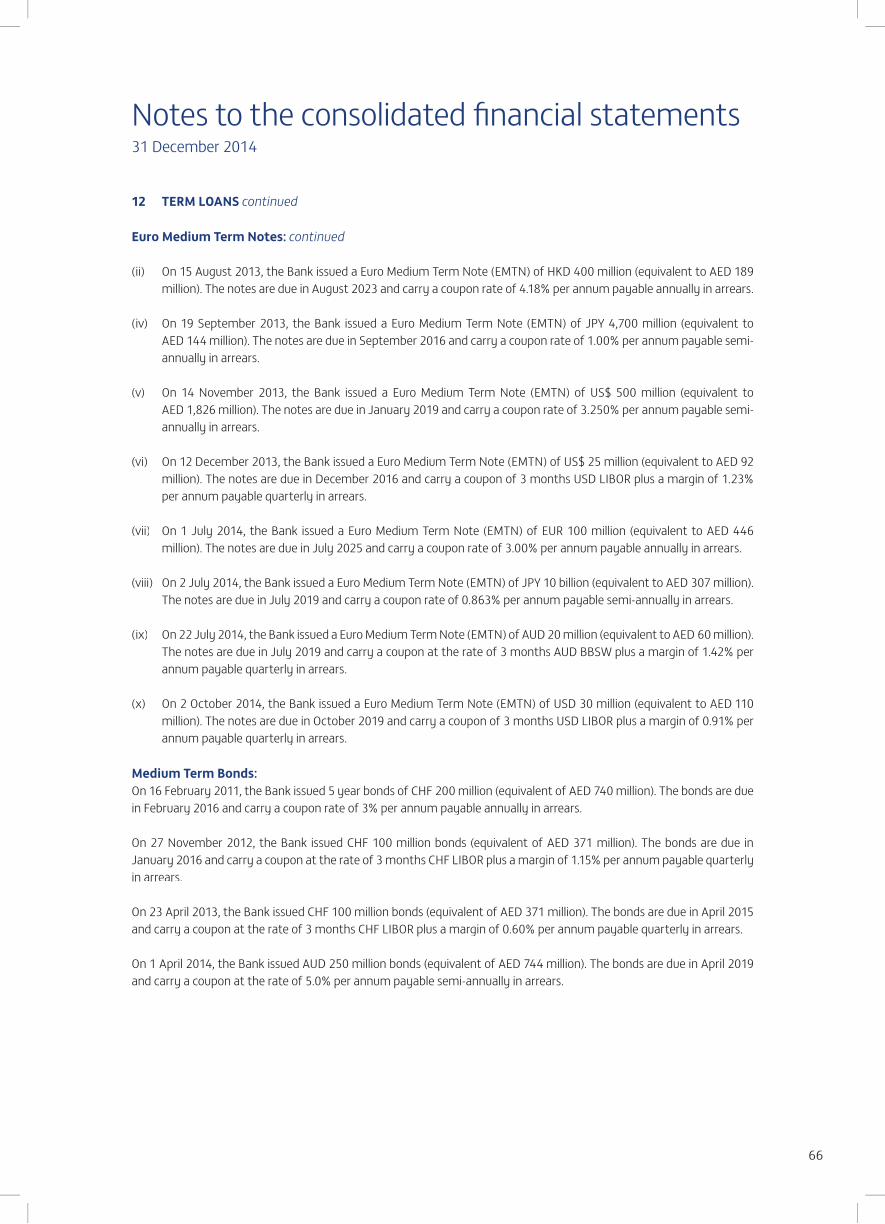
Notes to the consolidated financial statements31 December 2014
66
12 TERM LOANS continued
Euro Medium Term Notes: continued
(ii) On 15 August 2013, the Bank issued a Euro Medium Term Note (EMTN) of HKD 400 million (equivalent to AED 189million). The notes are due in August 2023 and carry a coupon rate of 4.18% per annum payable annually in arrears.
(iv) On 19 September 2013, the Bank issued a Euro Medium Term Note (EMTN) of JPY 4,700 million (equivalent to AED 144 million). The notes are due in September 2016 and carry a coupon rate of 1.00% per annum payable semi-annually in arrears.
(v) On 14 November 2013, the Bank issued a Euro Medium Term Note (EMTN) of US$ 500 million (equivalent to AED 1,826 million). The notes are due in January 2019 and carry a coupon rate of 3.250% per annum payable semi-annually in arrears.
(vi) On 12 December 2013, the Bank issued a Euro Medium Term Note (EMTN) of US$ 25 million (equivalent to AED 92 million). The notes are due in December 2016 and carry a coupon of 3 months USD LIBOR plus a margin of 1.23% per annum payable quarterly in arrears.
(vii) On 1 July 2014, the Bank issued a Euro Medium Term Note (EMTN) of EUR 100 million (equivalent to AED 446 million). The notes are due in July 2025 and carry a coupon rate of 3.00% per annum payable annually in arrears.
(viii) On 2 July 2014, the Bank issued a Euro Medium Term Note (EMTN) of JPY 10 billion (equivalent to AED 307 million). The notes are due in July 2019 and carry a coupon rate of 0.863% per annum payable semi-annually in arrears.
(ix) On 22 July 2014, the Bank issued a Euro Medium Term Note (EMTN) of AUD 20 million (equivalent to AED 60 million). The notes are due in July 2019 and carry a coupon at the rate of 3 months AUD BBSW plus a margin of 1.42% per annum payable quarterly in arrears.
(x) On 2 October 2014, the Bank issued a Euro Medium Term Note (EMTN) of USD 30 million (equivalent to AED 110million). The notes are due in October 2019 and carry a coupon of 3 months USD LIBOR plus a margin of 0.91% per annum payable quarterly in arrears.
Medium Term Bonds:On 16 February 2011, the Bank issued 5 year bonds of CHF 200 million (equivalent of AED 740 million). The bonds are due in February 2016 and carry a coupon rate of 3% per annum payable annually in arrears.
On 27 November 2012, the Bank issued CHF 100 million bonds (equivalent of AED 371 million). The bonds are due in January 2016 and carry a coupon at the rate of 3 months CHF LIBOR plus a margin of 1.15% per annum payable quarterly in arrears.
On 23 April 2013, the Bank issued CHF 100 million bonds (equivalent of AED 371 million). The bonds are due in April 2015 and carry a coupon at the rate of 3 months CHF LIBOR plus a margin of 0.60% per annum payable quarterly in arrears.
On 1 April 2014, the Bank issued AUD 250 million bonds (equivalent of AED 744 million). The bonds are due in April 2019 and carry a coupon at the rate of 5.0% per annum payable semi-annually in arrears.

Notes to the consolidated financial statements31 December 2014
67
12 TERM LOANS continued
Repurchase Agreements:During 2010, the Bank entered into several transactions with a foreign bank to obtain financing against the sale of debt securities with arrangements to repurchase them at a fixed future date. As at 31 December 2014, the carrying value of debt securities sold under these arrangements amounted to AED 236,317 thousand (2013: AED 503,453 thousand). The amount and maturity of outstanding transactions are as follows:
2014 2013No. Amount Amount Amount Amount
US$ 000 AED 000 US$ 000 AED 000 Maturity
1 - - 54,900 201,648 8-April-20142 - - 13,500 49,585 8-October-20143 40,500 148,756 40,500 148,756 25-October-20174 7,200 26,446 7,200 26,446 1-August-20185 9,000 33,057 9,000 33,057 8-April-2019
56,700 208,259 125,100 459,492
The Bank has not had any defaults of principal, interest or other breaches with regard to all borrowings during the year ended 31 December 2014 and year ended 31 December 2013.
13 SUKUK FINANCING INSTRUMENTS
In August 2011, the Bank raised financing by way of a Sukuk issued by FGB Sukuk Company Limited (a special purpose vehicle) amounting to US$ 650 million (equivalent to AED 2,387 million) and maturing in August 2016 (the “Sukuk”). The Sukuk carries a fixed profit rate of 3.797 percent per annum payable semi-annually and is listed on the London Stock Exchange. The Sukuk was the inaugural issuance under the US$ 3.5 billion trust certificate issuance programme. Pursuant to the Sukuk structure, FGB Sukuk Company Limited (as Rab-ul-Maal and Trustee) will receive certain payments from the Bank (as mudareb of certain mudaraba assets and wakeel of certain wakala assets). FGB Sukuk Company Limited will use such amounts received from the Bank to discharge its payment obligations under the Sukuk. Such payment obligations of the Bank rank pari passu with all other senior unsecured obligations of the Bank.
On 18 January 2012, the Bank issued its second tranche of trust certificates amounting to US$ 500 million (equivalent to AED 1,836 million) due in January 2017 under the same trust certificate issuance program. The Sukuk carries a fixed profit rate of 4.046 percent per annum payable semi-annually and is listed on the London Stock Exchange.
14 OTHER LIABILITIES
2014 2013AED 000 AED 000
Interest payable 483,329 518,599Accrued expenses 330,017 269,804Provisions for staff benefits (note 15) 327,653 291,660Accounts payable and sundry creditors 1,568,137 1,205,469Advances received on sale of investment properties 1,100,240 982,418Payable in respect of acquisition of investment properties 113,168 136,383Negative fair value of derivatives (note 28) 1,888,659 708,825Acceptances net of discounting 1,697,427 3,177,931Others 162,335 37,522
Total 7,670,965 7,328,611
,
,
,
,
,
,
,
,

Notes to the consolidated financial statements31 December 2014
68
15 PROVISION FOR STAFF BENEFITS
The movement in the provision was as follows:
2014 2013AED 000 AED 000
At 1 January 291,660 251,689Arising during the year 267,090 224,296Acquired in business combination (note 32) - 1,340Utilised (231,097) (185,665)
At 31 December 327,653 291,660
16 SHARE CAPITAL
Authorised,issued and fully paid
2014 2013AED 000 AED 000
Ordinary shares of AED 1 each 3,900,000 3,000,000
In its meeting held on 29 January 2014, the Board of Directors of the Bank proposed to distribute 900 million shares amounting to AED 900 million to shareholders of the Bank as bonus shares. The resolution was approved by the shareholders of the Bank in its Annual General Meeting held on 26 February 2014.
In its meeting held on 28 January 2015, the Board of Directors of the Bank proposed to distribute 600 million shares amounting to AED 600 million to shareholders of the Bank as bonus shares. The resolution is subject to the approval of the shareholders of the Bank in the forthcoming Annual General Meeting.
17 CAPITAL NOTES
Following approval of the Extraordinary General Assembly meeting held on 25 February 2009, the Board of Directors resolved on 26 February 2009 to issue capital notes (the “Notes”) to the Department of Finance, Government of Abu Dhabi amounting to AED 4 billion. The Notes are subject amongst other terms, to the following:
The Notes holder is entitled to a non-cumulative semi-annual fixed interest coupon at the rate of 6% per annum until February 2014 and floating interest rate of EIBOR plus 2.3% per annum thereafter. The Bank may at its sole discretion elect not to make an interest coupon payment. Any interest payment made will be reflected in the statement of changes in equity. During the year, interest payments amounted to AED 186 million (2013: AED 240 million).
,,

Notes to the consolidated financial statements31 December 2014
69
18 APPROPRIATIONS
Legal reserveIn accordance with the UAE Commercial Companies Law No. 8 of 1984 (as amended) and the Articles of Association of the Bank, 10% of profit for the year of the Bank shall be transferred to the legal reserve until it reaches 50% of the nominal value of the paid up share capital. The early conversion of the mandatory convertible bonds during 2011 resulted in an increase to the legal reserve by AED 3,475 million. As the legal reserve exceeds 50% of the share capital, no further transfers from the net profit are made to the legal reserve. The legal reserve is not available for distribution.
Special reserveAs required by Article 82 of Union Law No 10 of 1980, 10% of the profit for the year shall be transferred to the special reserve until the reserve equals 50% of the nominal value of the paid up share capital. As at 31 December 2014, AED 450,000 thousand was transferred to the special reserve due to an increase in share capital, which resulted from a bonus share issue amounting to AED 900,000 thousand. The special reserve is not available for distribution.
General reserveTransfers to the general reserve are made upon the recommendation of the Board of Directors. This reserve may only be used for the purposes recommended by the Board of Directors and approved by the shareholders.
No transfers are proposed by the Board of Directors from the profit for the year to the general reserve (2013: nil).
Dividends
2014 2013AED 000 AED 000
Cash dividends proposed in respect of 2014: AED 1 (2013: Declared AED 1) 3,900,000 3,000,000
Bonus shares proposed in respect of 2014: AED 0.15 (2013: AED 0.30) 600,000 900,000
Dividend on ordinary shares paid during the year 2,964,828 2,468,720
19 INTEREST INCOME AND INCOME FROM ISLAMIC FINANCING
2014 2013AED 000 AED 000
Interest incomeLoans and advances 6,987,693 6,785,675Deposits with banks and financial institutions 199,643 165,099Investment securities 561,378 539,915Notional interest on impaired loans and advances (note 4) 158,493 96,699
Total 7,907,207 7,587,388Income from Islamic financing 341,930 281,211
Interest income and income from Islamic financing 8,249,137 7,868,599

Notes to the consolidated financial statements31 December 2014
70
20 INTEREST EXPENSE AND ISLAMIC FINANCING EXPENSE
2014 2013AED 000 AED 000
Interest expenseCustomers’ deposits 1,065,065 1,217,424Bank deposits 118,059 60,151Term loans 282,857 246,292
Total 1,465,981 1,523,867Islamic financing expense 313,376 351,170
Interest expense and Islamic financing expense 1,779,357 1,875,037
21 OTHER OPERATING INCOME
2014 2013AED 000 AED 000
Investment income:Gains on disposal of available for sale investments 125,482 128,110Gains on disposal of investments carried at fair value through income statement 15,293 39,598Change in fair value of investments carried at fair value through income statement 12,310 16,556
Other investment income 16,266 6,654
Total investment income 169,351 190,918Commission income 574,767 527,053Fee income 748,536 612,522Fees and commissions on credit cards 571,524 409,458Brokerage and fund management fee income 13,724 14,862Foreign exchange income 75,768 87,475Derivatives income 118,825 54,670Gain on revaluation of investment properties (note 7) 113,309 125,192Gain on sale of investment properties 167,521 73,801Loss on sale of property and equipment (12,992) (3,772)Impairment of property and equipment (8,591) -Rental income, net 110,980 72,625Gain on exchange of investment properties (note 7) - 185,979Other income 119,031 77,236
Total 2,761,753 2,428,019
, ,
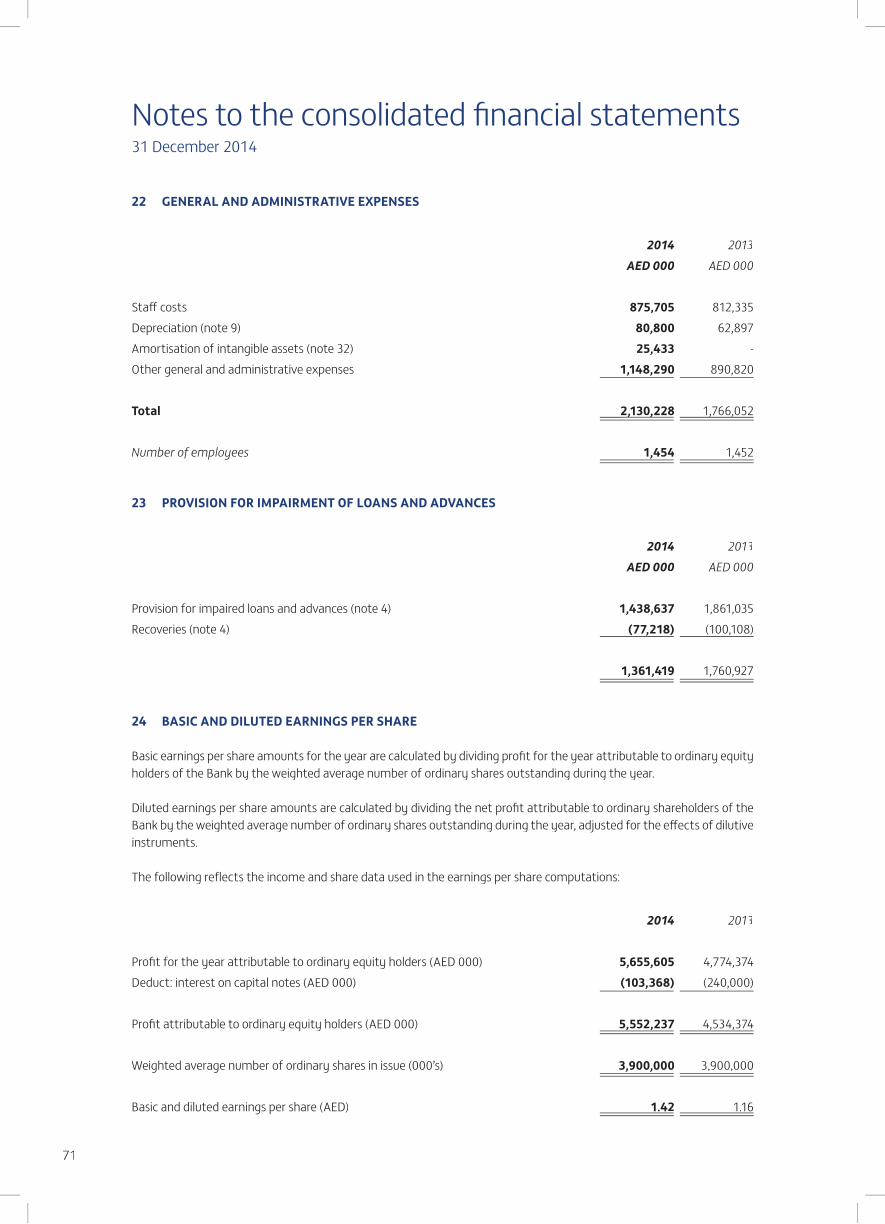
Notes to the consolidated financial statements31 December 2014
71
22 GENERAL AND ADMINISTRATIVE EXPENSES
2014 2013AED 000 AED 000
Staff costs 875,705 812,335Depreciation (note 9) 80,800 62,897Amortisation of intangible assets (note 32) 25,433 -Other general and administrative expenses 1,148,290 890,820
Total 2,130,228 1,766,052
Number of employees 1,454 1,452
23 PROVISION FOR IMPAIRMENT OF LOANS AND ADVANCES
2014 2013AED 000 AED 000
Provision for impaired loans and advances (note 4) 1,438,637 1,861,035Recoveries (note 4) (77,218) (100,108)
1,361,419 1,760,927
24 BASIC AND DILUTED EARNINGS PER SHARE
Basic earnings per share amounts for the year are calculated by dividing profit for the year attributable to ordinary equity holders of the Bank by the weighted average number of ordinary shares outstanding during the year.
Diluted earnings per share amounts are calculated by dividing the net profit attributable to ordinary shareholders of the Bank by the weighted average number of ordinary shares outstanding during the year, adjusted for the effects of dilutive instruments.
The following reflects the income and share data used in the earnings per share computations:
2014 2013
Profit for the year attributable to ordinary equity holders (AED 000) 5,655,605 4,774,374Deduct: interest on capital notes (AED 000) (103,368) (240,000)
Profit attributable to ordinary equity holders (AED 000) 5,552,237 4,534,374
Weighted average number of ordinary shares in issue (000’s) 3,900,000 3,900,000
Basic and diluted earnings per share (AED) 1.42 1.16
, ,, ,
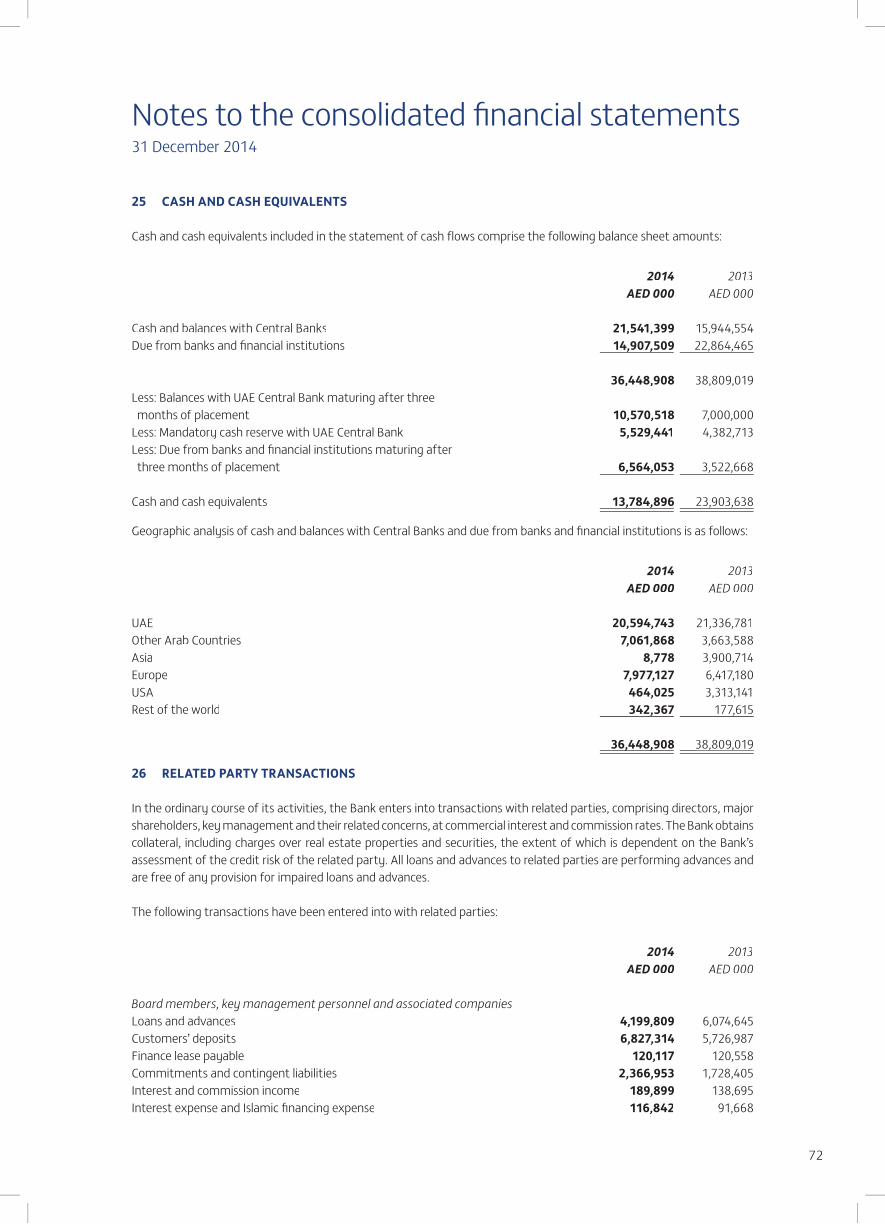
Notes to the consolidated financial statements31 December 2014
72
25 CASH AND CASH EQUIVALENTS
Cash and cash equivalents included in the statement of cash flows comprise the following balance sheet amounts:
2014 2013AED 000 AED 000
Cash and balances with Central Banks 21,541,399 15,944,554Due from banks and financial institutions 14,907,509 22,864,465
36,448,908 38,809,019Less: Balances with UAE Central Bank maturing after three months of placement 10,570,518 7,000,000Less: Mandatory cash reserve with UAE Central Bank 5,529,441 4,382,713Less: Due from banks and financial institutions maturing after three months of placement 6,564,053 3,522,668
Cash and cash equivalents 13,784,896 23,903,638
Geographic analysis of cash and balances with Central Banks and due from banks and financial institutions is as follows:
2014 2013AED 000 AED 000
UAE 20,594,743 21,336,781Other Arab Countries 7,061,868 3,663,588Asia 8,778 3,900,714Europe 7,977,127 6,417,180USA 464,025 3,313,141Rest of the world 342,367 177,615
36,448,908 38,809,019
26 RELATED PARTY TRANSACTIONS
In the ordinary course of its activities, the Bank enters into transactions with related parties, comprising directors, major shareholders, key management and their related concerns, at commercial interest and commission rates. The Bank obtains collateral, including charges over real estate properties and securities, the extent of which is dependent on the Bank’s assessment of the credit risk of the related party. All loans and advances to related parties are performing advances and are free of any provision for impaired loans and advances.
The following transactions have been entered into with related parties:
2014 2013AED 000 AED 000
Board members, key management personnel and associated companiesLoans and advances 4,199,809 6,074,645Customers’ deposits 6,827,314 5,726,987Finance lease payable 120,117 120,558Commitments and contingent liabilities 2,366,953 1,728,405Interest and commission income 189,899 138,695Interest expense and Islamic financing expense 116,842 91,668
, ,, ,
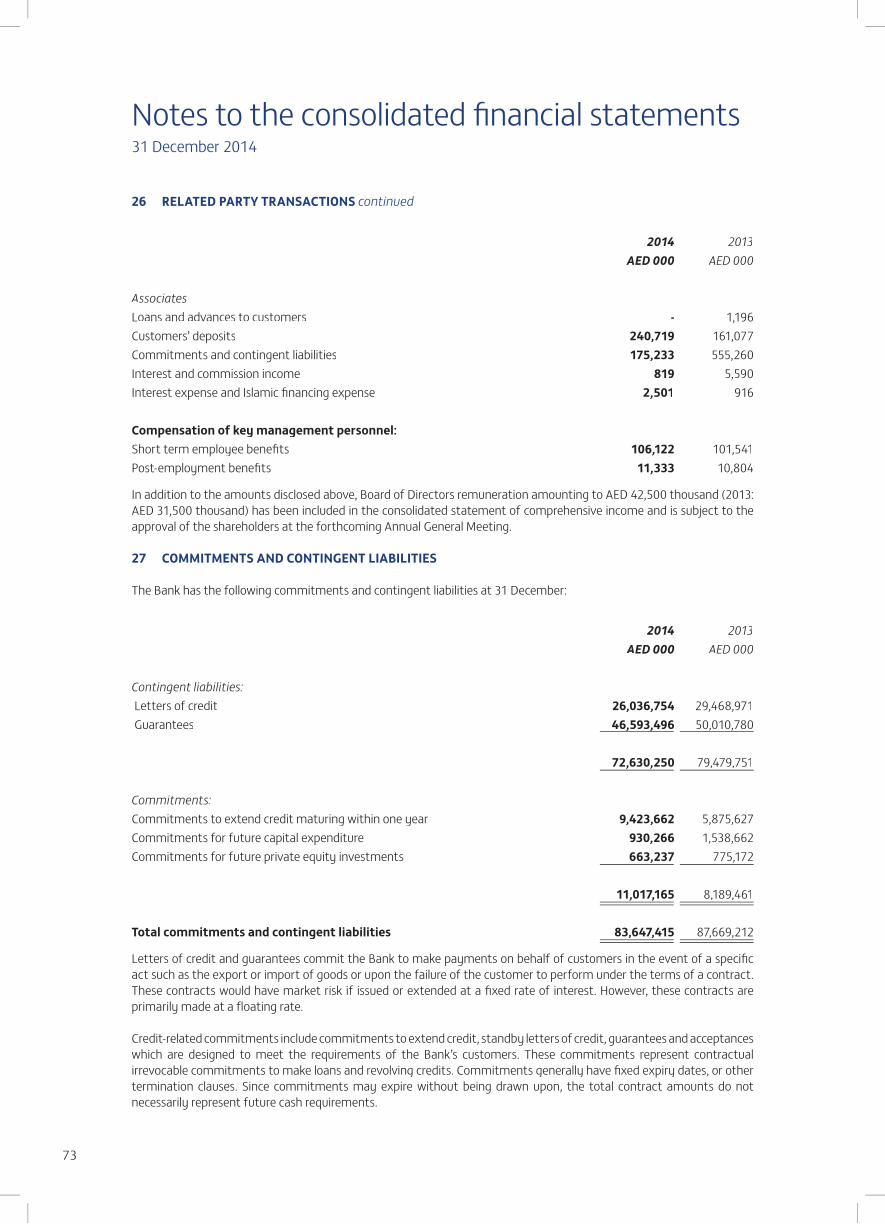
Notes to the consolidated financial statements31 December 2014
73
26 RELATED PARTY TRANSACTIONS continued
2014 2013AED 000 AED 000
AssociatesLoans and advances to customers - 1,196Customers’ deposits 240,719 161,077Commitments and contingent liabilities 175,233 555,260Interest and commission income 819 5,590Interest expense and Islamic financing expense 2,501 916
Compensation of key management personnel:Short term employee benefits 106,122 101,541Post-employment benefits 11,333 10,804
In addition to the amounts disclosed above, Board of Directors remuneration amounting to AED 42,500 thousand (2013: AED 31,500 thousand) has been included in the consolidated statement of comprehensive income and is subject to the approval of the shareholders at the forthcoming Annual General Meeting.
27 COMMITMENTS AND CONTINGENT LIABILITIES
The Bank has the following commitments and contingent liabilities at 31 December:
2014 2013AED 000 AED 000
Contingent liabilities:Letters of credit 26,036,754 29,468,971Guarantees 46,593,496 50,010,780
72,630,250 79,479,751
Commitments:Commitments to extend credit maturing within one year 9,423,662 5,875,627Commitments for future capital expenditure 930,266 1,538,662Commitments for future private equity investments 663,237 775,172
11,017,165 8,189,461
Total commitments and contingent liabilities 83,647,415 87,669,212
Letters of credit and guarantees commit the Bank to make payments on behalf of customers in the event of a specific act such as the export or import of goods or upon the failure of the customer to perform under the terms of a contract. These contracts would have market risk if issued or extended at a fixed rate of interest. However, these contracts are primarily made at a floating rate.
Credit-related commitments include commitments to extend credit, standby letters of credit, guarantees and acceptances which are designed to meet the requirements of the Bank’s customers. These commitments represent contractual irrevocable commitments to make loans and revolving credits. Commitments generally have fixed expiry dates, or other termination clauses. Since commitments may expire without being drawn upon, the total contract amounts do not necessarily represent future cash requirements.
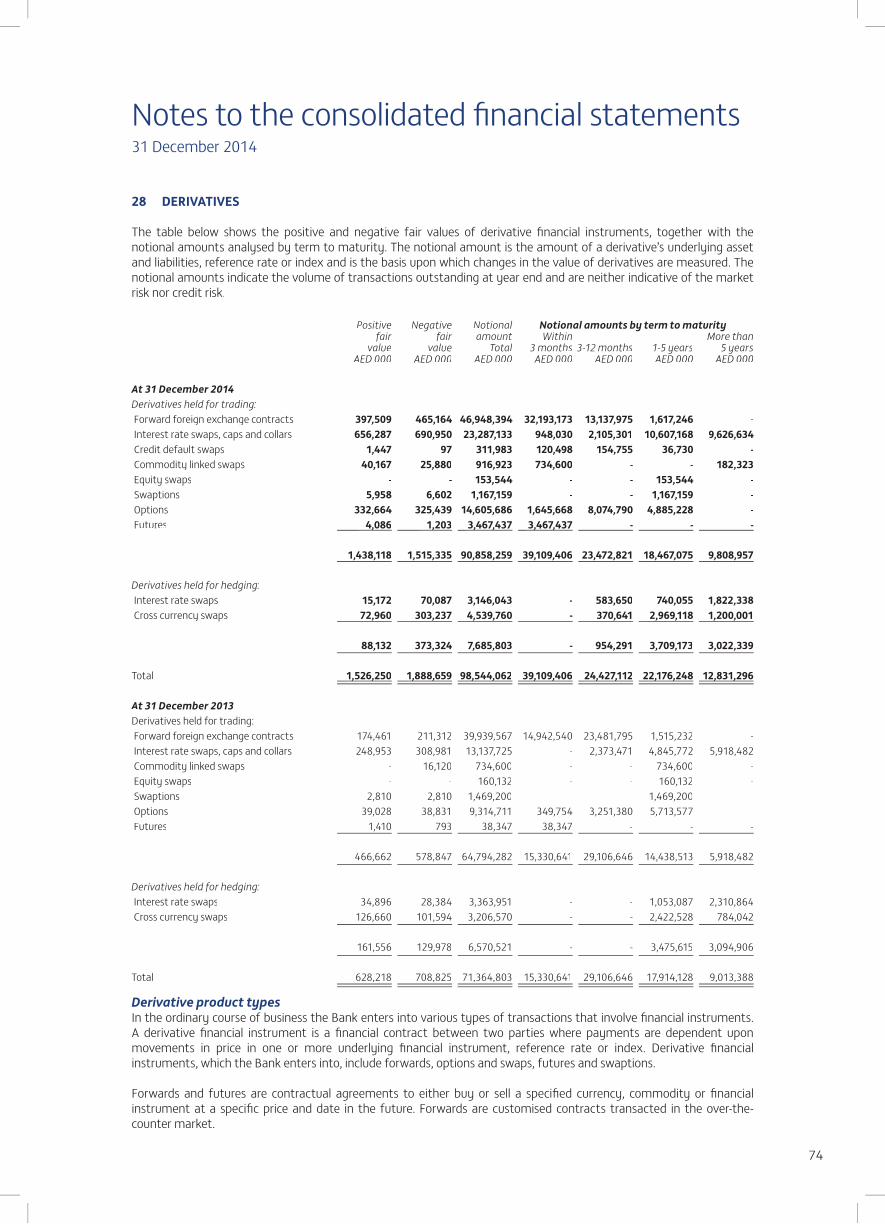
Notes to the consolidated financial statements31 December 2014
74
28 DERIVATIVES
The table below shows the positive and negative fair values of derivative financial instruments, together with the notional amounts analysed by term to maturity. The notional amount is the amount of a derivative’s underlying asset and liabilities, reference rate or index and is the basis upon which changes in the value of derivatives are measured. The notional amounts indicate the volume of transactions outstanding at year end and are neither indicative of the market risk nor credit risk.
Positive Negative Notional Notional amounts by term to maturityfair fair amount Within More than
value value Total 3 months 3-12 months 1-5 years 5 yearsAED 000 AED 000 AED 000 AED 000 AED 000 AED 000 AED 000
At 31 December 2014Derivatives held for trading: Forward foreign exchange contracts 397,509 465,164 46,948,394 32,193,173 13,137,975 1,617,246 - Interest rate swaps, caps and collars 656,287 690,950 23,287,133 948,030 2,105,301 10,607,168 9,626,634 Credit default swaps 1,447 97 311,983 120,498 154,755 36,730 - Commodity linked swaps 40,167 25,880 916,923 734,600 - - 182,323Equity swaps - - 153,544 - - 153,544 -Swaptions 5,958 6,602 1,167,159 - - 1,167,159 -
Options 332,664 325,439 14,605,686 1,645,668 8,074,790 4,885,228 - Futures 4,086 1,203 3,467,437 3,467,437 - - -
1,438,118 1,515,335 90,858,259 39,109,406 23,472,821 18,467,075 9,808,957
Derivatives held for hedging: Interest rate swaps 15,172 70,087 3,146,043 - 583,650 740,055 1,822,338 Cross currency swaps 72,960 303,237 4,539,760 - 370,641 2,969,118 1,200,001
88,132 373,324 7,685,803 - 954,291 3,709,173 3,022,339
Total 1,526,250 1,888,659 98,544,062 39,109,406 24,427,112 22,176,248 12,831,296
At 31 December 2013Derivatives held for trading:Forward foreign exchange contracts 174,461 211,312 39,939,567 14,942,540 23,481,795 1,515,232 - Interest rate swaps, caps and collars 248,953 308,981 13,137,725 - 2,373,471 4,845,772 5,918,482 Commodity linked swaps - 16,120 734,600 - - 734,600 - Equity swaps - - 160,132 - - 160,132 -Swaptions 2,810 2,810 1,469,200 - - 1,469,200 -
Options 39,028 38,831 9,314,711 349,754 3,251,380 5,713,577 - Futures 1,410 793 38,347 38,347 - - -
466,662 578,847 64,794,282 15,330,641 29,106,646 14,438,513 5,918,482
Derivatives held for hedging: Interest rate swaps 34,896 28,384 3,363,951 - - 1,053,087 2,310,864 Cross currency swaps 126,660 101,594 3,206,570 - - 2,422,528 784,042
161,556 129,978 6,570,521 - - 3,475,615 3,094,906
Total 628,218 708,825 71,364,803 15,330,641 29,106,646 17,914,128 9,013,388
Derivative product typesIn the ordinary course of business the Bank enters into various types of transactions that involve financial instruments. A derivative financial instrument is a financial contract between two parties where payments are dependent upon movements in price in one or more underlying financial instrument, reference rate or index. Derivative financial instruments, which the Bank enters into, include forwards, options and swaps, futures and swaptions.
Forwards and futures are contractual agreements to either buy or sell a specified currency, commodity or financial instrument at a specific price and date in the future. Forwards are customised contracts transacted in the over-the-counter market.
, ,, , , ,
, ,, , , ,, , , ,, , , ,
Notes to the consolidated financial statements31 December 2014
75
28 DERIVATIVES continued
Derivative product types continuedSwaps are contractual agreements between two parties to exchange interest or foreign currency differentials based on a specific notional amount. For interest rate swaps, counterparties generally exchange fixed and floating rate interest payments based on a notional value in a single currency. For currency swaps, fixed or floating interest payments as well as notional amounts are exchanged in different currencies.
Credit default swaps transfer the credit exposure of debt securities between parties. The buyer of a credit default swap receives credit protection, whereas the seller of the swap guarantees the credit worthiness of the product. Accordingly, the risk of default is transferred from the holder of the debt security to the seller of the swap.
Options are contractual agreements that convey the right, but not the obligation, to either buy or sell a specific amount of a commodity or financial instrument at a fixed price, either at a fixed future date or at any time within a specified period.
Credit risk in respect of derivative financial instruments arises from the potential for a counterparty to default on its contractual obligations and is limited to the positive fair value of instruments that are favourable to the Bank. The Bank enters into derivative contracts with a number of financial institutions of good credit rating.
Derivatives held for trading purposesMost of the Bank’s derivative trading activities relate to offering products to customers at competitive prices in order to enable them to transfer, modify or reduce current and expected risks and manage their market positions with the expectation of making profit from favourable movements in prices or rates.
Derivatives held for hedging purposesAs part of its asset and liability management the Bank uses derivatives for hedging purposes in order to reduce its exposure to interest rate risks.
Total loss on interest rate swaps held as fair value hedges amounted to AED 246,692 thousand (2013: gain of AED 75,344thousand). A corresponding amount has been adjusted against the carrying value of the related hedged item.
29 SEGMENTAL INFORMATION
A segment represents a distinguishable component of the Bank that is engaged either in providing products or services (business segment), or in providing products or services within a particular economic environment (geographical segment), which is subject to risks and rewards that are different from those of other segments.
Operating segment informationFor management purposes the Bank is organised into five operating segments:
Wholesale Banking Group (“WBG”) – Covering corporate and institutional clients, as well as high net worth individuals, through dedicated client segments. WBG offers credit facilities, Global Transaction Services, Debt Markets (loan, bond, and structured finance), Islamic Finance, Treasury and Global Markets products to both UAE and international clients.

Notes to the consolidated financial statements31 December 2014
76
29 SEGMENTAL INFORMATION continued
Operating segment information continuedTreasury and Global Markets, including investment operations - Principally providing money market, trading and treasury services, as well as the management of the Bank’s funding operations by use of government securities and placements and deposits with other banks.
Consumer banking - Principally handling individual customers’ deposits, and providing consumer type loans, overdrafts, credit cards facilities and funds transfer facilities.
Real estate activities – Principally the acquisition, leasing, brokerage, management and resale of properties carried out through its subsidiaries and associate companies.
Other operations, comprising mainly of the Head Office, include unallocated costs, subsidiaries and associates other than above categories.
Operating segmental information for the year ended 31 December 2014 was as follows:
Wholesale Banking Group
UAEOperations
International Banking
Treasury&GlobalMarkets
Consumer Banking
Real Estate
Other Operations Total
AED 000 AED 000 AED 000 AED 000 AED 000 AED 000 AED 000
Assets 73,503,360 17,844,404 48,271,979 49,869,678 10,457,456 12,221,624 212,168,501
Liabilities 114,869,376 8,155,035 9,562,319 37,037,570 1,414,671 6,392,568 177,431,539
Operating income excluding associates 2,956,654 521,932 1,227,313 3,530,780 460,367 534,487 9,231,533
Net interest income and income from Islamic financing 1,947,615 308,359 872,295 2,813,307 - 528,204 6,469,780
Share of profit from associates - - - - 7,649 1,061 8,710
Provision for impairment of loans and advances and available for sale investments (391,372) (156,567) (11,000) (609,066) - (204,414) (1,372,419)
Profit attributable to equity holders of the Bank 2,151,885 191,876 1,106,328 2,041,990 404,925 (241,399) 5,655,605
Other segment information
Investment in associates - - - - 129,940 25,735 155,675
Capital expenditure - - - - 618,456 250,340 868,796
Depreciation - - - - 985 79,815 80,800
Notes to the consolidated financial statements31 December 2014
77
29 SEGMENTAL INFORMATION continued
Operating segment information for the year ended 31 December 2013 was as follows:
Wholesale Banking Group
UAE Operations
International Banking
Treasury& Global Markets
Consumer Banking
Real Estate
Other Operations Total
AED 000 AED 000 AED 000 AED 000 AED 000 AED 000 AED 000
Assets 68,556,042 12,387,080 52,368,689 46,660,838 9,873,699 8,363,953 198,210,301
Liabilities 114,577,711 6,283,282 4,182,216 33,696,653 1,332,461 6,367,507 166,439,830
Operating income excluding associates 2,791,402 473,215 1,114,941 3,385,715 482,111 174,197 8,421,581
Net interest income and income from Islamic financing 1,955,462 219,885 782,194 2,782,180 - 253,841 5,993,562
Share of profit from associates - - - - (14,523) 13,503 (1,020)
Provision for impairment of loans and advances and available for sale investments (538,852) (70,612) (34,026) (625,619) - (550,811) (1,819,920)
Profit attributable to equity holders of the Bank 1,889,419 271,291 996,607 1,867,816 414,576 (665,335) 4,774,374
Other segment information
Investment in associates - - - - 124,805 22,340 147,145
Capital expenditure - - - - 251,799 242,627 494,426
Depreciation - - - - 1,903 60,994 62,897
The Bank’s operations in UAE contribute the majority of its revenues. Also, the Bank’s non-current assets in UAE represent a significant portion of its total non-current assets.
30 RISK MANAGEMENT
30.1 IntroductionThe core business of a bank is to manage risk and provide returns to the shareholders in line with the accepted risk profile. In the course of its regular business, the Bank gets exposed to multiple risks notably credit risk, market risk, liquidity risk, interest rate risk, operational risk and other risks like compliance risk, strategic risk and reputation risks. A well-established risk governance and ownership structure ensures oversight and accountability of the effective management of risk at the Bank. This tone is set right at the top from the Board of Directors (“BOD”) and gets implemented through a well-defined risk management structure and framework.
Composition of Board The BOD is responsible for the overall direction, supervision and control of the Bank. The day-to-day management of the Bank is conducted by the BOD committees, the Managing Director (“MD”) and the Chief Executive Officer (“CEO”). The BOD has overall responsibility for the Bank including approving and overseeing the implementation of its strategic objectives, risk strategy, corporate governance and corporate values within the agreed framework in accordance with relevant statutory and regulatory structures. The BOD currently comprises six members. Each Director holds his position for three years, which may then be renewed for a further three year term. The Board of Directors of the Bank’s subsidiaries have the same responsibilities towards their respective entities as the Bank’s Directors have towards the Bank.
,,,
Notes to the consolidated financial statements31 December 2014
78
30 RISK MANAGEMENT continued
30.1 Introduction continuedCorporate Governance Framework:The Bank has a comprehensive corporate governance framework that puts in place rules, processes, policies and practices by which the Bank is managed by its BOD and Senior Management. The BOD drives the implementation of the corporate governance standards and is the custodian of the corporate governance manual. The Bank’s corporate governance standards bind its signatories to the highest standards of professionalism and due diligence in the performance of their duties. The Group Chief Risk Officer (“GCRO”) is the custodian of the charters for the management committees. These charters are subject to annual review that is driven by the governance function and is approved by the BOD.
Risk Management StructureThe BOD approves risk management plans for the Bank, its subsidiaries, its associates and international offices including representative offices and overseas branches. Under authority delegated by the BOD, Board level risk committee - Risk and Compliance Management Committee (“RCMC”) through its separately convened risk management meetings formulates high-level enterprise risk management policy, exercises delegated risk authorities and oversees the implementation of risk management framework and controls. The GCRO functionally reports to this committee.
Board Level Committees within the FGB GroupRemuneration and Nomination Committee
The Remuneration and Nomination Committee (“REMCO”) comprises of three members of the BOD (including the MD) and some members from the Senior management. REMCO has the overall responsibility of setting the criteria and processes for identification of candidates for the BOD, Board level committees and Senior Management. The committee recommends the appointment or termination of any director to the Board and ensures a smooth succession of Board and Senior Management. The committee takes care of the performance assessment of the Board and key management personnel. The committee approves and oversees reward design and ensures that the reward is appropriate and consistent with the Bank’s culture, business and risk strategy, performance and control environment as well as with any legal or regulatory requirements. REMCO also oversees the Bank’s HR policies and rewards policy framework. The composition, guiding principles and detailed roles and responsibilities are covered in REMCO’s charter.
Executive Committee
Executive Committee (“EC”) comprises of three members of the BOD (including the MD) and the CEO. EC oversees the implementation of the Bank’s policies, BOD’s resolutions and practices the competencies granted to it by the BOD. The EC oversees the Bank’s overall management and ensures that the Bank’s business policies and practices are in line with the Bank’s business interests and are in alignment with sound corporate governance and compliance standards including provisions of the UAE Central Bank. The composition, guiding principles and detailed roles and responsibilities are covered in the EC charter.
Risk and Compliance Management Committeep g
The Risk and Compliance Management Committee (“RCMC”) comprises three members of the BOD (including MD) and the GCRO. Under authority delegated by the BOD, RCMC plays a key role in the fulfilment of corporate governance standards and overall risk management by assisting the BOD in formulation of strategy for enterprise-wide risk management, evaluation of overall risks faced by the Bank, alignment of risk policies with business strategies, determination of the level of risks which will be in the best interest of the Bank through risk based capital planning. The RCMC, by virtue of powers delegated to it by the BOD, also approves changes in risk management policies as and when required. The composition, guiding principles and detailed roles and responsibilities are covered in the RCMC’s charter.
Notes to the consolidated financial statements31 December 2014
79
30 RISK MANAGEMENT continued
30.1 Introduction continued
Audit CommitteeThis committee is principally responsible for reviewing the internal audit program, considering the major findings of each internal audit review, making appropriate investigations and responses and ensuring coordination between the internal and external auditors and keeping under review the effectiveness of internal control systems, and in particular reviewing the external auditor’s management letter and management’s response. Members of this committee include three members of the BOD including the MD along with the Head of Internal Audit. The composition, guiding principles and detailed roles and responsibilities are covered in the Audit Committee’s charter.
Management Level Committees within the BankExecutive Management Committeeg
The Executive Management Committee (“EMCO”) is a senior management level committee appointed by the EC that has been entrusted with the role of supporting the CEO to determine and implement the Bank’s strategy as approved by the BOD. The key responsibilities of EMCO include decisions on the Bank’s strategy, annual budgets, capital management and policies and procedures for the entire Bank. The composition, guiding principles and detailed roles and responsibilities of EMCO are covered in the EMCO’s charter.
Wholesale Banking Credit Committeeg
The Bank has a management level Wholesale Banking Credit Committee (“WBCC”) which assists the BOD and Board Committees to put into operation the wholesale credit risk strategy and policies and procedures pertaining to the wholesale banking business. The primary objective of the WBCC is to assist in the development and implementation of wholesale banking business credit strategy and policies and procedures. The composition, guiding principles and detailed roles and responsibilities of WBCC are covered in the WBCC’s charter.
Consumer Banking Credit Committeeg
The Bank has a management level Consumer Banking Credit Committee (“CBCC”) which assists the BOD and Board Committees to put into operation the consumer banking credit strategy and policies and procedures. The primary objective of the CBCC is to finalize the consumer banking credit criteria and set portfolio level limits, in line with the defined business and credit risk strategy of the Bank. The composition, guiding principles and detailed roles and responsibilities of CBCC are covered in the CBCC’s Charter.
Asset Liability Committeey
The Bank has a management level Asset Liability Committee (ALCO) to assist the BOD and Board Committees in fulfilling its responsibility to oversee the Bank’s asset and liability management (ALM) related responsibilities. The objective of ALCO is to maintain constant oversight of interest rate risk and liquidity risk with the primary goal of achieving optimal return while ensuring adequate levels of liquidity within an effective risk control framework. The composition, guiding principles and detailed roles and responsibilities of ALCO are covered in the ALCO’s charter.
Investment Management Committee g
The Bank has a management level Investment Management Committee (IMCO) for overseeing and providing guidance to treasury’s trading and investment activities. IMCO has to ensure effective management of market risks in accordance with the principles laid down in the market risk management policy. IMCO provides approval of investment limits and individual investment proposals within those limits. Its objective is to ensure that investment decisions conform to the investment policy and are within the overall limits approved by the BOD. The composition, guiding principles and detailed roles and responsibilities of IMCO are covered in the IMCO’s charter.
Notes to the consolidated financial statements31 December 2014
80
30 RISK MANAGEMENT continued
30.1 Introduction continued
Management Level Committees within the Bank continuedCompliance CommitteepThe Bank has a management level Compliance Committee to assist the BOD and Board Committees in fulfilling their objective of overseeing the Bank’s compliance related responsibilities. The committee oversees the Bank’s compliance with respect to legal and regulatory requirements and relevant policies and procedures including code of ethics and matters relating to operating and non-operating financial risk and also ensures the Bank’s compliance with Anti Money Laundering (“AML”) and other relevant legislation issued by UAE Central Bank and / or Securities and Commodities Authority and / or other regulatory authorities, as applicable. The composition, guiding principles and detailed roles and responsibilities of Compliance Committee are covered in the Compliance Committee charter.
Operational Risk CommitteepThe Bank has a management level Operational Risk Committee (ORC) to assist the BOD and Board Committees in fulfilling their objective of overseeing the Bank’s Operational Risk Management, Business Continuity and Information Security responsibilities. Responsibility areas for ORC include management and reporting of operational risk profile, ratifying information security policy and procedures, integrated business continuity management policy and business recovery strategy of the Bank. The composition, guiding principles and detailed roles and responsibilities of ORC are covered in the ORC’s charter.
Technology Steering Committeegy gThe Bank has a management level Technology Steering Committee (TSC) to assist the BOD and Board Committees in fulfilling their responsibilities related to setting of Information Technology (IT) related strategic goals and for successful implementation of the IT objectives. TSC ensures the alignment of the IT strategy with the Bank’s business strategy and a successful implementation of the IT strategy. The composition, guiding principles and detailed roles and responsibilities of TSC are covered in the TSC’s charter.
Human Resources Steering CommitteegThe Bank has a management level Human Resources Steering Committee (“HRSC”) to assist the BOD in fulfilling its responsibilities related to the human resource policies applicable to the Bank’s staff. The objectives of the committee include implementation of recommendations made by the REMCO regarding compensation, benefits, rewards, working environment, employee contracts’ terms and conditions and other issues that form part of the Human Resources (“HR”) strategy. HRSC also has the responsibility to put in place an appropriate whistle blowing policy to enable employees to raise concerns in a responsible and effective manner with a sense of protection. The composition, guiding principles and detailed roles and responsibilities of HRSC are covered in the HRSC’s charter.
Real Estate CommitteeThe Bank has a management level Real Estate Committee (“RECO”) to assist the BOD with overseeing and approving the Bank’s real estate investment activities in line with effective market and liquidity risk management practices in accordance with the Bank’s risk policy. RECO is responsible for providing oversight, guidance and strategic input on the action plans for the Group’s real estate investment, review real estate budgets and provide oversight and guidance for real estate investment limits and risk appetite. The composition, guiding principles and detailed roles and responsibilities of RECO are covered in the RECO’s charter.
30.2 Enterprise Risk Management Framework and Structure
Enterprise Risk Management GroupThe Bank has a centralized risk management function led by the GCRO. The Head of Enterprise Risk Management Group reports to the GCRO. The function comprises Credit Risk Management Unit (CRMU), Market Risk Management Unit (MRMU), ALM Risk Management Unit (ALMRMU), Operational Risk Management Unit (ORMU), Information Security, Business Continuity Management, Compliance unit and Basel II unit.
Notes to the consolidated financial statements31 December 2014
81
30 RISK MANAGEMENT continued
30.2 Enterprise Risk Management Framework and Structure continued
Enterprise Risk Management Policy Framework The Bank’s Enterprise Risk Management Policy (ERMP) framework aims to accomplish its core values and purpose of being a world class organization maximizing its risk adjusted returns for all stakeholders by establishing an enterprise wide risk management framework across the Bank including local and international branches, subsidiaries, associates and foreign representative offices. Core objective of ERMP is to provide a reasonable degree of assurance to the BOD that the risks threatening the Bank’s achievement of its core purpose are being identified, measured, monitored and controlled through an effective integrated risk management system. The ERMP framework consists of specific policy documents covering all material risks across the Bank; which include ERM policy, wholesale banking credit risk policy, consumer banking credit risk policy, market risk policy, operational risk policy, ALM risk policy, AML and Compliance risk policy, IT andInformation security risk policy, Internal Capital Adequacy Assessment Process (“ICAAP”) policy, new products approval policy and Model governance policy. In addition to these risk management policies, the Bank has also put in place detailed operational policies, procedures and programs wherever needed. Other relevant risks such as reputation risk and strategy risk are covered under the ERM policy.
30.3 Overview of Enterprise Risk Management Process
30.3.1 Credit RiskCredit risk is the risk that one party to a financial instrument will fail to discharge an obligation and cause the other party to incur a financial loss. Counterparty credit risk arising from derivative financial instruments is limited to those with positive fair values, as recorded in the balance sheet. Credit risk exposure also emerges from off balance sheet exposures like letters of guarantee, guarantees and committed lines of credit which may require the Bank to make payments to customers or on their behalf.
Credit risk identification and assessment at FGB Group is carried out through a comprehensive mechanism comprising three levels of defence. The first level of defence lies with the business units along with the credit analysis unit that assesses risk on a customer and facility level. The second level of defence is in the form of credit risk management unit that assesses credit risk on a portfolio basis and maintains credit risk policies and credit risk rating models up to date. Internal Audit acts as a third level of defence with regular reviews of credit analysis and the risk functions to check the compliance with policies and procedures of the Bank. The unit also reviews the policy documents on a regular basis.
As a part of credit risk monitoring and control framework, the Bank undertakes regular risk monitoring and provides senior management and BOD assurance that established controls in the form of exposure limits are functioning properly. Risk monitoring is carried out at both individual and portfolio levels by appropriate authorities along several parameters which include credit quality, provisioning levels, exposure limits across several dimensions, financial and operating performance, account conduct, end use of funds, adequacy of credit risk mitigants, adherence to financial and non-financial covenants, recovery performance, rating system performance among others.
The Bank has set up a framework for credit risk mitigation as a means towards reducing credit risk in an exposure, at facility level, by a safety net of tangible and realizable securities including approved third-party guarantees/ insurance. The types of Credit Risk Mitigation (CRM) include netting agreements, collaterals, guarantees, credit derivatives, Stand By Letter of Credit (SBLC) and Comfort Letters. The Bank ensures that all documentation used in collateralized transactions and for documenting on and off-balance sheet netting, guarantees, credit derivatives and collateral is binding on all parties and is legally enforceable in all relevant jurisdictions. The Bank also ensures that all the documents are reviewed by appropriate authority and have appropriate legal opinions to verify and ensure its enforceability.
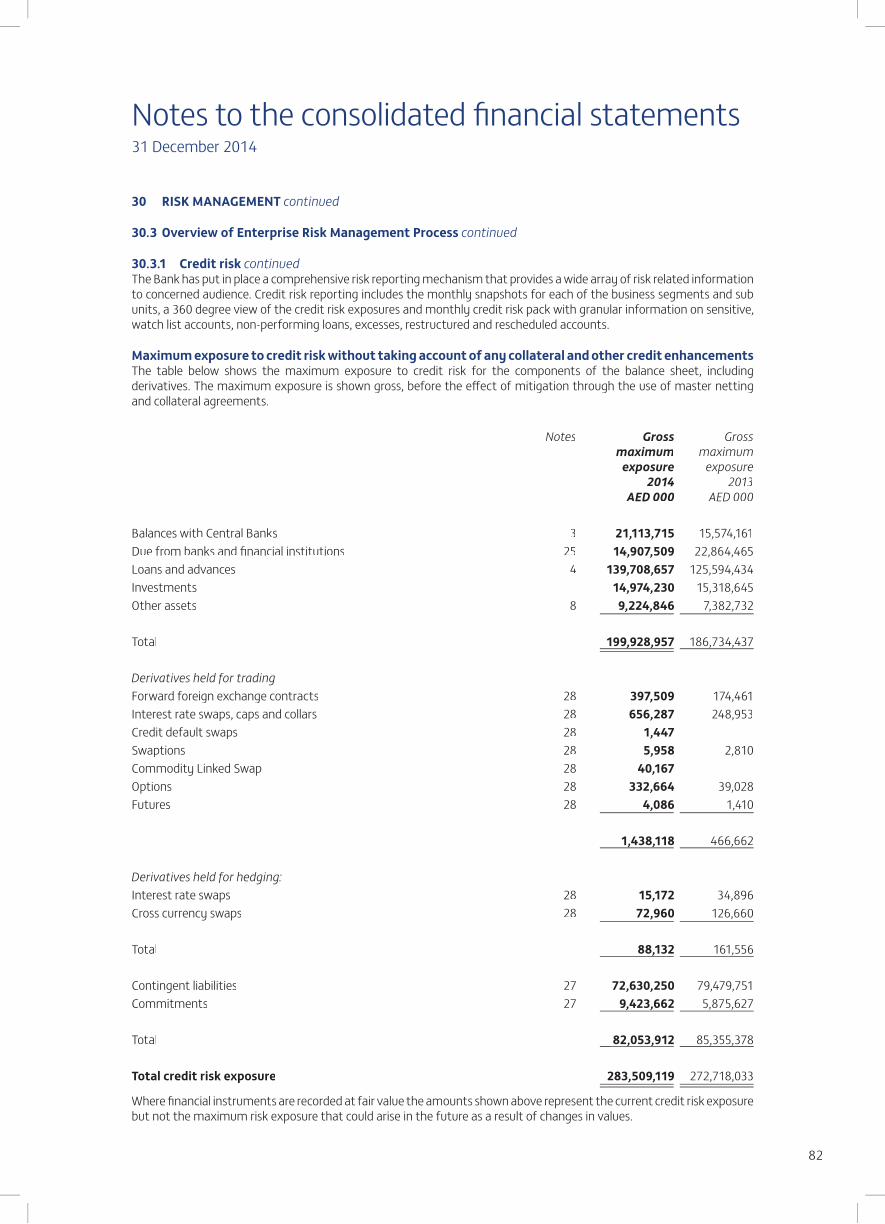
Notes to the consolidated financial statements31 December 2014
82
30 RISK MANAGEMENT continued
30.3 Overview of Enterprise Risk Management Process continued
30.3.1 Credit risk continuedThe Bank has put in place a comprehensive risk reporting mechanism that provides a wide array of risk related information to concerned audience. Credit risk reporting includes the monthly snapshots for each of the business segments and sub units, a 360 degree view of the credit risk exposures and monthly credit risk pack with granular information on sensitive, watch list accounts, non-performing loans, excesses, restructured and rescheduled accounts.
Maximum exposure to credit risk without taking account of any collateral and other credit enhancementsThe table below shows the maximum exposure to credit risk for the components of the balance sheet, including derivatives. The maximum exposure is shown gross, before the effect of mitigation through the use of master netting and collateral agreements.
Notes Gross Grossmaximum maximum
exposure exposure2014 2013
AED 000 AED 000
Balances with Central Banks 3 21,113,715 15,574,161Due from banks and financial institutions 25 14,907,509 22,864,465Loans and advances 4 139,708,657 125,594,434Investments 14,974,230 15,318,645Other assets 8 9,224,846 7,382,732
Total 199,928,957 186,734,437
Derivatives held for tradingForward foreign exchange contracts 28 397,509 174,461Interest rate swaps, caps and collars 28 656,287 248,953Credit default swaps 28 1,447 -Swaptions 28 5,958 2,810Commodity Linked Swap 28 40,167 -Options 28 332,664 39,028Futures 28 4,086 1,410
1,438,118 466,662
Derivatives held for hedging:Interest rate swaps 28 15,172 34,896Cross currency swaps 28 72,960 126,660
Total 88,132 161,556
Contingent liabilities 27 72,630,250 79,479,751Commitments 27 9,423,662 5,875,627
Total 82,053,912 85,355,378
Total credit risk exposure 283,509,119 272,718,033
Where financial instruments are recorded at fair value the amounts shown above represent the current credit risk exposure but not the maximum risk exposure that could arise in the future as a result of changes in values.
, ,
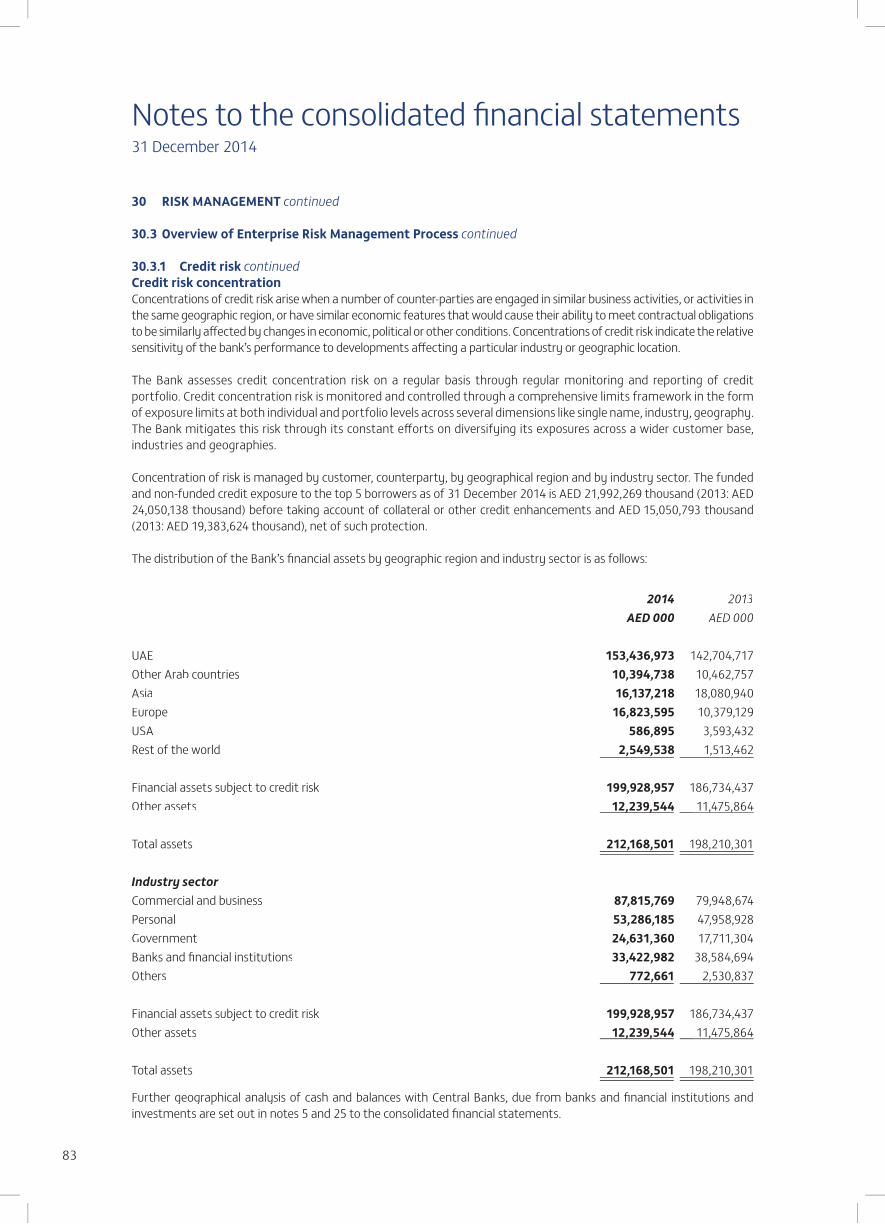
Notes to the consolidated financial statements31 December 2014
83
30 RISK MANAGEMENT continued
30.3 Overview of Enterprise Risk Management Process continued
30.3.1 Credit risk continuedCredit risk concentration Concentrations of credit risk arise when a number of counter-parties are engaged in similar business activities, or activities in the same geographic region, or have similar economic features that would cause their ability to meet contractual obligations to be similarly affected by changes in economic, political or other conditions. Concentrations of credit risk indicate the relative sensitivity of the bank’s performance to developments affecting a particular industry or geographic location.
The Bank assesses credit concentration risk on a regular basis through regular monitoring and reporting of credit portfolio. Credit concentration risk is monitored and controlled through a comprehensive limits framework in the form of exposure limits at both individual and portfolio levels across several dimensions like single name, industry, geography. The Bank mitigates this risk through its constant efforts on diversifying its exposures across a wider customer base, industries and geographies.
Concentration of risk is managed by customer, counterparty, by geographical region and by industry sector. The funded and non-funded credit exposure to the top 5 borrowers as of 31 December 2014 is AED 21,992,269 thousand (2013: AED 24,050,138 thousand) before taking account of collateral or other credit enhancements and AED 15,050,793 thousand (2013: AED 19,383,624 thousand), net of such protection.
The distribution of the Bank’s financial assets by geographic region and industry sector is as follows:
2014 2013AED 000 AED 000
UAE 153,436,973 142,704,717Other Arab countries 10,394,738 10,462,757Asia 16,137,218 18,080,940Europe 16,823,595 10,379,129USA 586,895 3,593,432Rest of the world 2,549,538 1,513,462
Financial assets subject to credit risk 199,928,957 186,734,437Other assets 12,239,544 11,475,864
Total assets 212,168,501 198,210,301
Industry sectorCommercial and business 87,815,769 79,948,674Personal 53,286,185 47,958,928Government 24,631,360 17,711,304Banks and financial institutions 33,422,982 38,584,694Others 772,661 2,530,837
Financial assets subject to credit risk 199,928,957 186,734,437Other assets 12,239,544 11,475,864
Total assets 212,168,501 198,210,301
Further geographical analysis of cash and balances with Central Banks, due from banks and financial institutions and investments are set out in notes 5 and 25 to the consolidated financial statements.
, ,, ,
, ,, ,
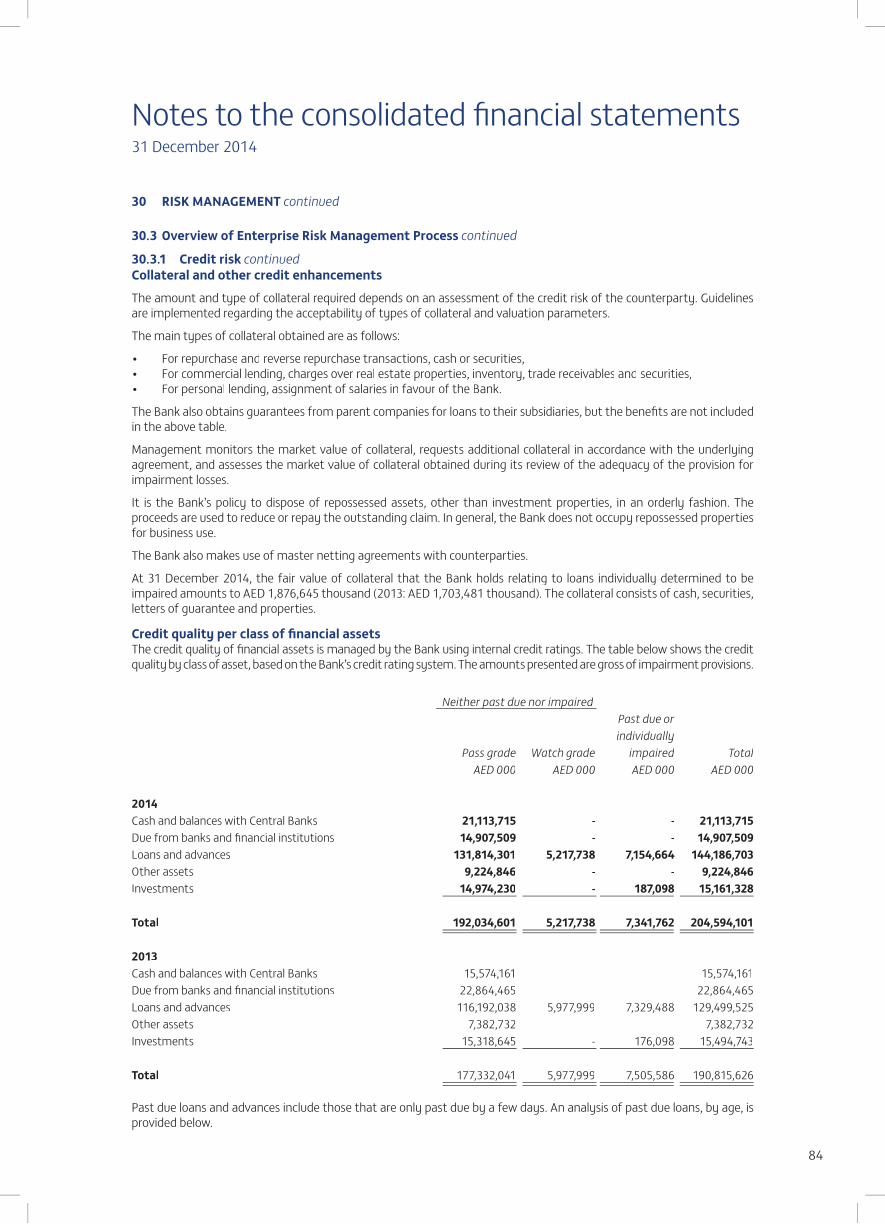
Notes to the consolidated financial statements31 December 2014
84
30 RISK MANAGEMENT continued
30.3 Overview of Enterprise Risk Management Process continued
30.3.1 Credit risk continuedCollateral and other credit enhancements
The amount and type of collateral required depends on an assessment of the credit risk of the counterparty. Guidelines are implemented regarding the acceptability of types of collateral and valuation parameters.
The main types of collateral obtained are as follows:
The Bank also obtains guarantees from parent companies for loans to their subsidiaries, but the benefits are not included in the above table.
Management monitors the market value of collateral, requests additional collateral in accordance with the underlying agreement, and assesses the market value of collateral obtained during its review of the adequacy of the provision for impairment losses.
It is the Bank’s policy to dispose of repossessed assets, other than investment properties, in an orderly fashion. The proceeds are used to reduce or repay the outstanding claim. In general, the Bank does not occupy repossessed properties for business use.
The Bank also makes use of master netting agreements with counterparties.
At 31 December 2014, the fair value of collateral that the Bank holds relating to loans individually determined to be impaired amounts to AED 1,876,645 thousand (2013: AED 1,703,481 thousand). The collateral consists of cash, securities, letters of guarantee and properties.
Credit quality per class of financial assetsThe credit quality of financial assets is managed by the Bank using internal credit ratings. The table below shows the credit quality by class of asset, based on the Bank’s credit rating system. The amounts presented are gross of impairment provisions.
Neither past due nor impairedPast due orindividually
Pass grade Watch grade impaired TotalAED 000 AED 000 AED 000 AED 000
2014Cash and balances with Central Banks 21,113,715 - - 21,113,715Due from banks and financial institutions 14,907,509 - - 14,907,509Loans and advances 131,814,301 5,217,738 7,154,664 144,186,703Other assets 9,224,846 - - 9,224,846Investments 14,974,230 - 187,098 15,161,328
Total 192,034,601 5,217,738 7,341,762 204,594,101
2013Cash and balances with Central Banks 15,574,161 - - 15,574,161Due from banks and financial institutions 22,864,465 - - 22,864,465Loans and advances 116,192,038 5,977,999 7,329,488 129,499,525Other assets 7,382,732 - - 7,382,732Investments 15,318,645 - 176,098 15,494,743
Total 177,332,041 5,977,999 7,505,586 190,815,626
Past due loans and advances include those that are only past due by a few days. An analysis of past due loans, by age, is provided below.
p p

Notes to the consolidated financial statements31 December 2014
85
30 RISK MANAGEMENT continued
30.3 Overview of Enterprise Risk Management Process continued
30.3.1 Credit risk continuedAging analysis of past due but not impaired loans
Less than 31 to 60 61-90 More than30 days days days 91 days Total
AED 000 AED 000 AED 000 AED 000 AED 000
31 December 2014Past due but not impaired loans and advances 1,709,750 612,880 628,860 670,076 3,621,566
Past due and impaired loans and advances 7,154,664Less:Past due but not impaired loans and advances (3,621,566)
Impaired loans and advances (note 4): Loans and advances under restructuring - Other loans and advances 3,533,098
Impaired loans and advances 3,533,098
31 December 2013Past due but not impaired loans and advances 1,598,592 588,707 318,853 535,943 3,042,095
Past due and impaired loans and advances 7,329,488Less:Past due but not impaired loans and advances (3,042,095)
Impaired loans and advances (note 4): Loans and advances under restructuring 456,459 Other loans and advances 3,830,934
4,287,393
Impaired loans, excluding loans and advances under restructuring 3,830,934
See note 4 for more detailed information with respect to the provision for impairment losses on loans and advances.
Renegotiated loansThe total carrying amount of loans and advances whose terms have been renegotiated as of 31 December 2014 amounted to AED 3,250,982 thousand (2013: AED 3,164,698 thousand).
Impairment assessmentThe Bank uses an incurred loss model for the recognition of losses on impaired financial assets. This means that losses can only be recognised when objective evidence of a specific loss event has been observed. Triggering events include the following:
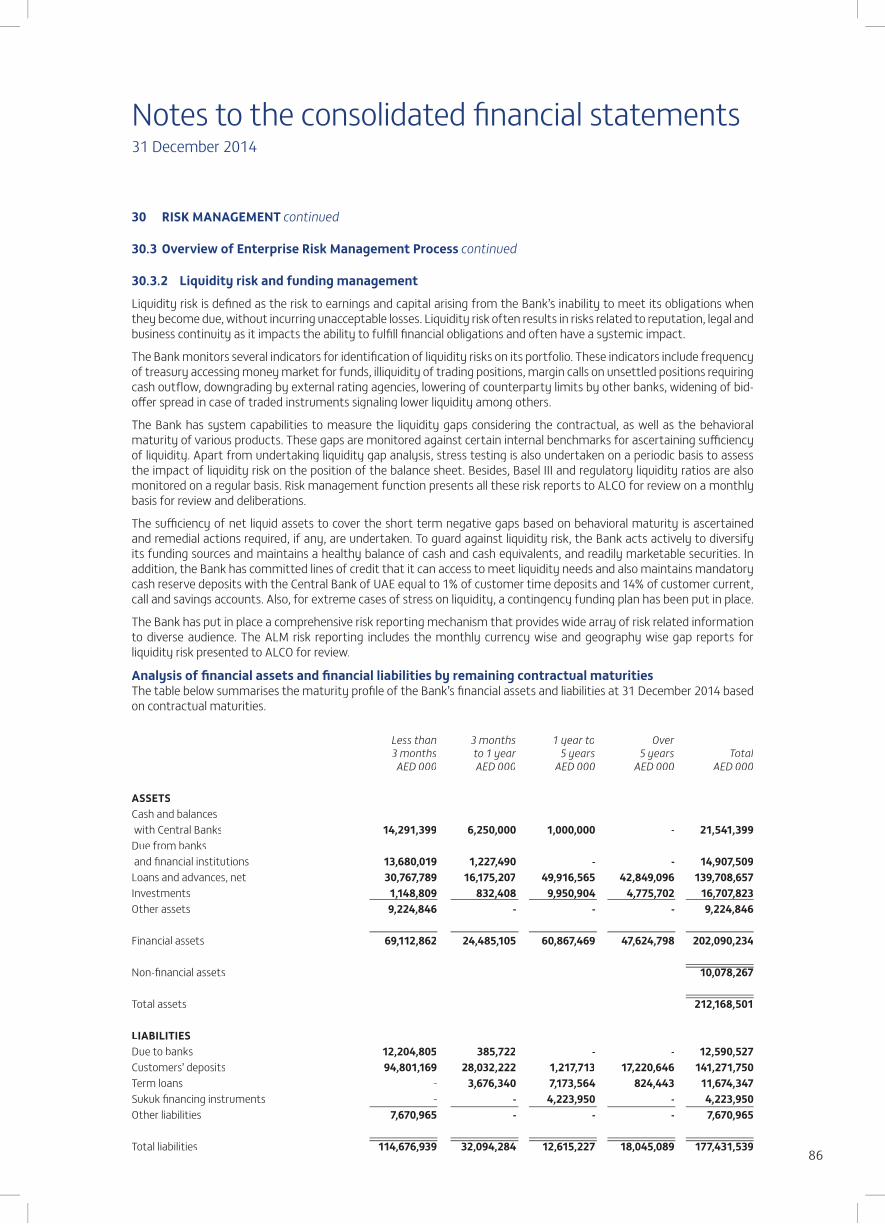
Notes to the consolidated financial statements31 December 2014
86
30 RISK MANAGEMENT continued
30.3 Overview of Enterprise Risk Management Process continued
30.3.2 Liquidity risk and funding management
Liquidity risk is defined as the risk to earnings and capital arising from the Bank’s inability to meet its obligations when they become due, without incurring unacceptable losses. Liquidity risk often results in risks related to reputation, legal and business continuity as it impacts the ability to fulfill financial obligations and often have a systemic impact.
The Bank monitors several indicators for identification of liquidity risks on its portfolio. These indicators include frequency of treasury accessing money market for funds, illiquidity of trading positions, margin calls on unsettled positions requiring cash outflow, downgrading by external rating agencies, lowering of counterparty limits by other banks, widening of bid-offer spread in case of traded instruments signaling lower liquidity among others.
The Bank has system capabilities to measure the liquidity gaps considering the contractual, as well as the behavioral maturity of various products. These gaps are monitored against certain internal benchmarks for ascertaining sufficiency of liquidity. Apart from undertaking liquidity gap analysis, stress testing is also undertaken on a periodic basis to assess the impact of liquidity risk on the position of the balance sheet. Besides, Basel III and regulatory liquidity ratios are also monitored on a regular basis. Risk management function presents all these risk reports to ALCO for review on a monthly basis for review and deliberations.
The sufficiency of net liquid assets to cover the short term negative gaps based on behavioral maturity is ascertained and remedial actions required, if any, are undertaken. To guard against liquidity risk, the Bank acts actively to diversify its funding sources and maintains a healthy balance of cash and cash equivalents, and readily marketable securities. In addition, the Bank has committed lines of credit that it can access to meet liquidity needs and also maintains mandatory cash reserve deposits with the Central Bank of UAE equal to 1% of customer time deposits and 14% of customer current, call and savings accounts. Also, for extreme cases of stress on liquidity, a contingency funding plan has been put in place.
The Bank has put in place a comprehensive risk reporting mechanism that provides wide array of risk related information to diverse audience. The ALM risk reporting includes the monthly currency wise and geography wise gap reports for liquidity risk presented to ALCO for review.
Analysis of financial assets and financial liabilities by remaining contractual maturitiesThe table below summarises the maturity profile of the Bank’s financial assets and liabilities at 31 December 2014 based on contractual maturities.
Less than 3 months 1 year to Over3 months to 1 year 5 years 5 years Total
AED 000 AED 000 AED 000 AED 000 AED 000
ASSETSCash and balances with Central Banks 14,291,399 6,250,000 1,000,000 - 21,541,399Due from banksand financial institutions 13,680,019 1,227,490 - - 14,907,509Loans and advances, net 30,767,789 16,175,207 49,916,565 42,849,096 139,708,657Investments 1,148,809 832,408 9,950,904 4,775,702 16,707,823Other assets 9,224,846 - - - 9,224,846
Financial assets 69,112,862 24,485,105 60,867,469 47,624,798 202,090,234
Non-financial assets 10,078,267
Total assets 212,168,501
LIABILITIESDue to banks 12,204,805 385,722 - - 12,590,527Customers’ deposits 94,801,169 28,032,222 1,217,713 17,220,646 141,271,750Term loans - 3,676,340 7,173,564 824,443 11,674,347Sukuk financing instruments - - 4,223,950 - 4,223,950Other liabilities 7,670,965 - - - 7,670,965
Total liabilities 114,676,939 32,094,284 12,615,227 18,045,089 177,431,539
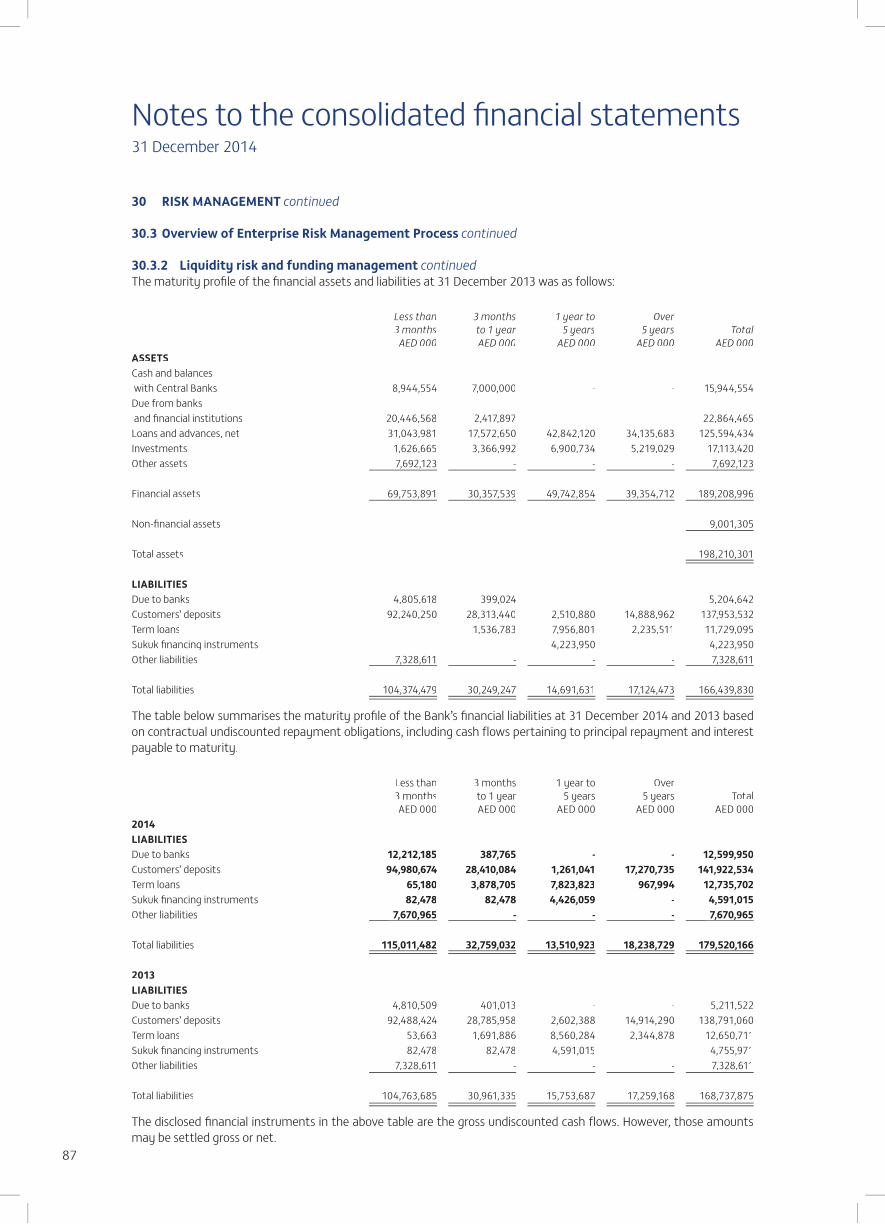
Notes to the consolidated financial statements31 December 2014
87
30 RISK MANAGEMENT continued
30.3 Overview of Enterprise Risk Management Process continued
30.3.2 Liquidity risk and funding management continuedThe maturity profile of the financial assets and liabilities at 31 December 2013 was as follows:
Less than 3 months 1 year to Over3 months to 1 year 5 years 5 years Total
AED 000 AED 000 AED 000 AED 000 AED 000ASSETSCash and balances with Central Banks 8,944,554 7,000,000 - - 15,944,554Due from banks and financial institutions 20,446,568 2,417,897 - - 22,864,465Loans and advances, net 31,043,981 17,572,650 42,842,120 34,135,683 125,594,434Investments 1,626,665 3,366,992 6,900,734 5,219,029 17,113,420Other assets 7,692,123 - - - 7,692,123
Financial assets 69,753,891 30,357,539 49,742,854 39,354,712 189,208,996
Non-financial assets 9,001,305
Total assets 198,210,301
LIABILITIESDue to banks 4,805,618 399,024 - - 5,204,642Customers’ deposits 92,240,250 28,313,440 2,510,880 14,888,962 137,953,532Term loans - 1,536,783 7,956,801 2,235,511 11,729,095Sukuk financing instruments - - 4,223,950 - 4,223,950Other liabilities 7,328,611 - - - 7,328,611
Total liabilities 104,374,479 30,249,247 14,691,631 17,124,473 166,439,830
The table below summarises the maturity profile of the Bank’s financial liabilities at 31 December 2014 and 2013 based on contractual undiscounted repayment obligations, including cash flows pertaining to principal repayment and interest payable to maturity.
Less than 3 months 1 year to Over3 months to 1 year 5 years 5 years TotalAED 000 AED 000 AED 000 AED 000 AED 000
2014LIABILITIESDue to banks 12,212,185 387,765 - - 12,599,950Customers’ deposits 94,980,674 28,410,084 1,261,041 17,270,735 141,922,534Term loans 65,180 3,878,705 7,823,823 967,994 12,735,702Sukuk financing instruments 82,478 82,478 4,426,059 - 4,591,015Other liabilities 7,670,965 - - - 7,670,965
Total liabilities 115,011,482 32,759,032 13,510,923 18,238,729 179,520,166
2013LIABILITIESDue to banks 4,810,509 401,013 - - 5,211,522Customers’ deposits 92,488,424 28,785,958 2,602,388 14,914,290 138,791,060Term loans 53,663 1,691,886 8,560,284 2,344,878 12,650,711Sukuk financing instruments 82,478 82,478 4,591,015 - 4,755,971Other liabilities 7,328,611 - - - 7,328,611
Total liabilities 104,763,685 30,961,335 15,753,687 17,259,168 168,737,875
The disclosed financial instruments in the above table are the gross undiscounted cash flows. However, those amounts may be settled gross or net.
, ,, ,

Notes to the consolidated financial statements31 December 2014
88
30 RISK MANAGEMENT continued
30.3 Overview of Enterprise Risk Management Process continued
30.3.2 Liquidity risk and funding management continued
The following table reflects the future cash flows of derivatives.
Less than 3 months 1 year to Over3 months to 1 year 5 years 5 years TotalAED 000 AED 000 AED 000 AED 000 AED 000
2014Inflows 282,593 687,256 946,798 324,000 2,240,647Outflows (382,643) (780,365) (1,052,316) (349,948) (2,565,272)
Net (100,050) (93,109) (105,518) (25,948) (324,625)
2013Inflows 93,982 252,538 767,337 441,037 1,554,894Outflows (130,849) (353,604) (774,942) (367,331) (1,626,726)
Net (36,867) (101,066) (7,605) 73,706 (71,832)
The table below shows the contractual expiry by maturity of the Bank’s contingent liabilities and commitments.
Less than 3 3 months 1 to 5 Overmonths to 1 year years 5 years Total
AED 000 AED 000 AED 000 AED 000 AED 000
2014Contingent liabilities 50,785,151 10,801,308 11,043,791 - 72,630,250Commitments 266,172 9,992,641 758,352 - 11,017,165
Total 51,051,323 20,793,949 11,802,143 - 83,647,415
2013Contingent liabilities 55,363,699 11,189,473 12,926,578 - 79,479,750Commitments 257,308 6,640,496 1,291,658 - 8,189,462
Total 55,621,006 17,829,970 14,218,236 - 87,669,212
The Bank expects that not all of the contingent liabilities or commitments will be drawn before expiry of the commitments.
30.3.3 Interest rate risk in the banking bookInterest rate risk in the banking book is defined as the risk of loss to bank’s earnings as well diminution in the value of bank’s capital due to adverse changes in interest rates.
The Bank follows a globally accepted approach of recognising all interest bearing / interest sensitive assets and liabilities - both on- and off- balance sheet in order to assess the impact of interest rate risk on its portfolio. Further, the types of interest rate risk are identified (repricing risk, basis risk, yield curve risk) for sound management of interest rate risk. Special care is taken in the identification of risk associated with interest rate derivatives or structured products, where sensitivity to interest rates are often in conjunction with some other underlying risk factors. Positions in such structured products and derivatives are broken down into underlying factors for identification of the interest rate risk type.
The Bank has system capabilities to measure the interest rate sensitive gaps across tenors considering the repricing nature of all its assets and liabilities. The sensitivity analysis i.e. the impact of a parallel shift in the interest rate curves on the NetInterest Income (NII) and Equity is ascertained and presented to ALCO for review on a monthly basis. Hedging decisions required to mitigate this risk, if any, are decided / approved by ALCO and executed by Treasury.

Notes to the consolidated financial statements31 December 2014
89
30 RISK MANAGEMENT continued
30.3 Overview of Enterprise Risk Management Process continued
30.3.3 Interest rate risk in the banking book continuedThe following table estimates the sensitivity to a reasonable possible change in interest rates on the Bank’s income statement. The sensitivity of the income statement is the effect of the assumed changes (whether increase or decrease) in interest rates on the net interest income for one year, based on the interest rate sensitive assets and financial liabilities, denominated in various currencies, held at 31 December 2014 and 2013, with all other variables held constant.
Currency AED USD EUR GBP Others
Assumed change in interest rates 0.50% 0.50% 0.50% 0.50% 0.50%
Impact on net interest income from increase in interest rates:
2014 (AED 000) 38,728 18,903 (1,581) 761 8,4462013 (AED 000) 44,079 57,581 (2,057) (368) (830)
Impact on net interest income from decrease in interest rates:
2014 (AED 000) (38,728) (18,903) 1,581 (761) (8,446)2013 (AED 000) (44,079) (57,581) 2,057 368 830
(Amounts in brackets reflect decreases in net interest income)
The sensitivity of equity is calculated by revaluing interest rate sensitive available for sale financial assets, including the effect of any associated hedges, and swaps designated as cash flow hedges, for the effects of the assumed changes in interest rates. At 31 December 2014 and 2013, the effect of the assumed changes in interest rates on equity is as follows:
Currency USD EUR KWD GBP SGD AED
Assumed change in interest rates 0.50% 0.50% 0.50% 0.50% 0.50% 0.50%
Impact on equity from increase in interest rates:
2014 (AED 000) (169,363) (955) (426) - (1,198) (111) 2013 (AED 000) (132,275) (1,350) (488) (891) (1,492) (108)
Impact on equity from decrease in interest rates:
2014 (AED 000) 169,363 955 426 - 1,198 111 2013 (AED 000) 132,275 1,350 488 891 1,492 108
30.3.4 Market riskMarket risk is the risk that the fair value and future cash flows of financial instruments will fluctuate due to changes in market variables such as foreign exchange rates (currency risk), equity, bonds and prices for other investment instruments (equity price risk).
Market risk is managed through an effective control framework with three levels of defence. The first level is the Treasury Group that carries out the business in line with comprehensive limit structure on exposures across products and desks (exposure limits), sensitivities (risk limits) as well as stop loss limits. The second level of defence is the Market Risk management unit that establishes this limits framework and monitors these limits on a daily basis. Internal Audit department forms the third level of defence and reviews both the Treasury Group and the Market Risk Management Group on a regular basis for all their functions to check the compliance with documented policies and also check whether the policies are up to date.
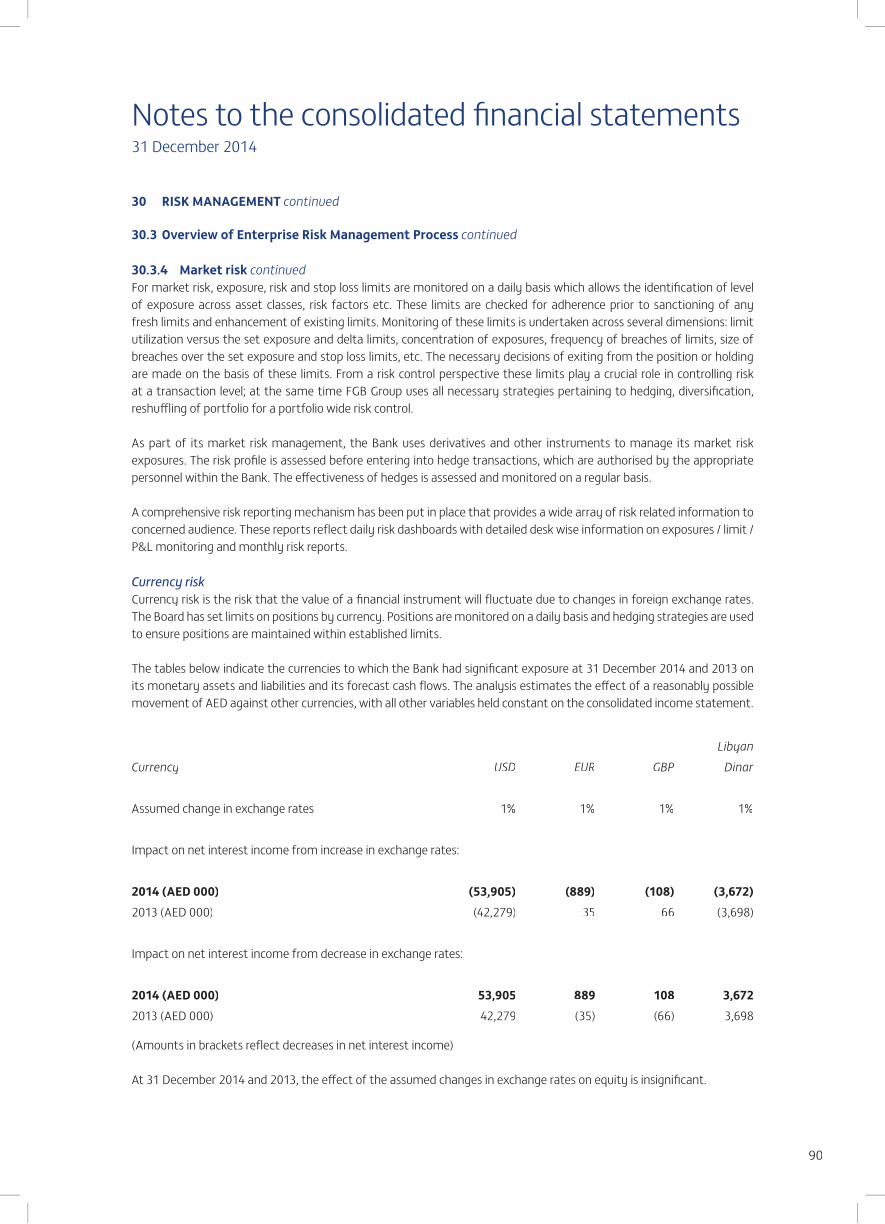
Notes to the consolidated financial statements31 December 2014
90
30 RISK MANAGEMENT continued
30.3 Overview of Enterprise Risk Management Process continued
30.3.4 Market risk continuedFor market risk, exposure, risk and stop loss limits are monitored on a daily basis which allows the identification of level of exposure across asset classes, risk factors etc. These limits are checked for adherence prior to sanctioning of any fresh limits and enhancement of existing limits. Monitoring of these limits is undertaken across several dimensions: limit utilization versus the set exposure and delta limits, concentration of exposures, frequency of breaches of limits, size of breaches over the set exposure and stop loss limits, etc. The necessary decisions of exiting from the position or holding are made on the basis of these limits. From a risk control perspective these limits play a crucial role in controlling risk at a transaction level; at the same time FGB Group uses all necessary strategies pertaining to hedging, diversification, reshuffling of portfolio for a portfolio wide risk control.
As part of its market risk management, the Bank uses derivatives and other instruments to manage its market risk exposures. The risk profile is assessed before entering into hedge transactions, which are authorised by the appropriate personnel within the Bank. The effectiveness of hedges is assessed and monitored on a regular basis.
A comprehensive risk reporting mechanism has been put in place that provides a wide array of risk related information to concerned audience. These reports reflect daily risk dashboards with detailed desk wise information on exposures / limit / P&L monitoring and monthly risk reports.
Currency riskCurrency risk is the risk that the value of a financial instrument will fluctuate due to changes in foreign exchange rates. The Board has set limits on positions by currency. Positions are monitored on a daily basis and hedging strategies are used to ensure positions are maintained within established limits.
The tables below indicate the currencies to which the Bank had significant exposure at 31 December 2014 and 2013 on its monetary assets and liabilities and its forecast cash flows. The analysis estimates the effect of a reasonably possible movement of AED against other currencies, with all other variables held constant on the consolidated income statement.
LibyanCurrency USD EUR GBP Dinar
Assumed change in exchange rates 1% 1% 1% 1%
Impact on net interest income from increase in exchange rates:
2014 (AED 000) (53,905) (889) (108) (3,672)2013 (AED 000) (42,279) 35 66 (3,698)
Impact on net interest income from decrease in exchange rates:
2014 (AED 000) 53,905 889 108 3,6722013 (AED 000) 42,279 (35) (66) 3,698
(Amounts in brackets reflect decreases in net interest income)
At 31 December 2014 and 2013, the effect of the assumed changes in exchange rates on equity is insignificant.

Notes to the consolidated financial statements31 December 2014
91
30 RISK MANAGEMENT continued
30.3 Overview of Enterprise Risk Management Process continued
30.3.4 Market risk continuedEquity price riskEquity price risk is the risk that the fair values of equities decrease as the result of changes in the levels of equity indices and the value of individual stocks. The equity price risk exposure arises from the Bank’s investment portfolio.
The following table estimates the sensitivity to a possible change in equity markets on the Bank’s income statement. The sensitivity of the income statement is the effect of the assumed change in the reference equity benchmark on the fair value of investments carried at fair value through the income statement.
Impact ImpactAssumed on net on net
level of income incomechange 2014 2013
% AED 000 AED 000
Investments carried at fair value through the income statementReference equity benchmarks: Abu Dhabi Securities Exchange Index 5% 501 373 Dubai Financial Market Index 5% 135 94 Net asset value of managed funds 5% 10,544 9,226 Other equity exchanges 5% 2,307 5,151 Unquoted 5% 1,010 1,010
The effect on equity as a result of a change in the fair value of equity instruments held as available for sale at 31 December 2014 and 2013, due to a reasonably possible change in equity indices, with all other variables held constant, is as follows:
Assumed Impact on Impact onlevel of equity equitychange 2014 2013
% AED 000 AED 000
Available for sale investments Reference equity benchmarks: Net asset value of private equity funds 5% 64,498 68,618 Other equity exchanges 5% 704 1,309 Unquoted 5% 6,980 3,957
Prepayment riskPrepayment risk is the risk that the Bank will incur a financial loss because its customers and counterparties repay or request repayment earlier or later than expected, such as fixed rate mortgages when interest rates fall.
The effect on profit for one year, assuming 10% of repayable financial instruments were to prepay at the beginning of the year, with all other variables held constant, is estimated at AED 502,030 thousand (2013: AED 417,347 thousand).

Notes to the consolidated financial statements31 December 2014
92
30 RISK MANAGEMENT continued
30.3 Overview of Enterprise Risk Management Process continued
30.3.5 Operational riskOperational risk is defined as the risk of loss resulting from inadequate or failed internal processes, people and systems or from external events. This definition includes legal risk, information technology and information security related risks but excludes strategic and reputation risk.
The Bank adopts the methodology of ‘Self-Assessment’ by various units on a bottom up approach for identification of operational risk. The assessment includes risks assessment on various processes across business and support units as well as setting of Key Risk Indicators (KRIs). The Bank is in the process of undertaking a Risk and Control Self-Assessment exercise wherein all business and support units would be assessing their risks and controls. An internal loss database that stores details pertaining to operational losses is also maintained.
The Bank monitors and controls operational risk across its processes through a framework comprising risk policies, manuals and detailed processes which serve as control points against operational risk, a proper delegation of authority and governance in the form of various committees, three lines of defence for risk management (Businesses, Risk and Audit). The Bank has adopted the “four-eye principle” that advocates the need for a maker and checker for all key transactions performed to limit and control operational risks in bank-wide activities. As a part of the operational risk mitigation process, risk mitigation plans are drawn up for every mismatch noticed in the risk assessment process as well as for breaches in the KRI thresholds.
30.3.6 Country riskCountry risk is the likelihood of economic, social, and political events in a foreign country negatively influencing the willingness or ability of state owned and/or privately owned customers in that country to pay their debts on time.
The Bank undertakes a detailed qualitative analysis pertaining to country risk as a part of the business decision process (credit risk modelling). These factors include economic, social and political stability in each country, the monetary policy, the foreign exchange control measure, the transparency of information, the financial and market structure, banking regulations and supervision, the legal system, and the accounting standards among others. Country risks are monitored and controlled using country limits set by the Bank; these limits are in accordance with overall business strategy, capital adequacy and provisions for potential risks, risk rating of each country, acceptable level of risk, and business opportunities in each country.
30.3.7 Strategic riskStrategic risk refers to the risk of current or prospective impact on the Bank’s earnings, capital, reputation or standing arising from changes in the environment the bank operates in and from adverse strategic decisions, improper implementation of decisions, or lack of responsiveness to industry, economic or technological changes. It is a function of compatibility of Bank’s strategic goals, strategies developed to achieve those goals, resources deployed to meet those goals and the quality of implementation.
The Bank uses several factors to identify and assess impact of strategic risk on its books including level of integration of risk management policies and practices in the strategic planning process, aggressiveness of strategic goals and compatibility with developed business strategies, capital support for the strategic initiatives to take care of earnings volatility, effectiveness of communication and consistency of application of strategic goals, objectives, corporate culture, and behaviour throughout the FGB Group, effectiveness of MIS to support strategic direction and initiatives among others.
Strategic risks are monitored and controlled as part of the strategic planning process wherein the Bank reviews the progress on strategic initiatives vis-à-vis the plan and considers whether the progress is in line with the plan and the external business environment. The strategic plan is periodically reviewed and updated subject to an approval process which is also a part of the strategic planning process.
Notes to the consolidated financial statements31 December 2014
93
30 RISK MANAGEMENT continued
30.3 Overview of Enterprise Risk Management Process continued
30.3.8 Compliance riskCompliance Risk refers to the risk to earnings or capital or reputation or continued business existence arising from violations of or non-conformance with laws, rules, regulations, prescribed practices, or ethical standards.
The Bank, on a continuous basis, identifies and assesses such risks inherent in all new and existing “material” products, activities, processes and systems. The assessment includes risks assessment on non-conformance with laws, rules, regulations, prescribed practices, or ethical standards. The Enterprise Risk Management function has a group wide compliance unit that develops internal controls to manage such risks and it is supported by the Internal Audit and Legal functions.
In order to monitor compliance and anti-money laundering risks, the Bank has set in place the due diligence processes, reviews of policies and procedures across the Bank, implementation of an integrated compliance and AML system which manages name clearance, transaction monitoring and payment monitoring activities, assessment through compliance check-lists etc.
Compliance risk is largely mitigated by way of focused policies and procedures, extensive checklist based and on-spot due diligence and regular training sessions.
30.3.9 Reputation riskReputation risk is the risk to earnings or capital arising from negative public opinion. This can be due to external or internal events.
The Bank identifies and assesses reputation risk by clearly defining types of risks to be captured, establishing key sources of reputation risk it may be exposed to, based on individual circumstances, describing the risks identified in terms of the nature of risk and the potential consequences that the risks may bring to its reputation. The Bank also refers to other relevant information for risk identification purposes. Such information may be sourced from media reports, stakeholder analysis reports, internal audit and compliance reports, management exception reports, or other early warning indicators.
For reputation risks, apart from the regular monitoring of external and internal events that can result in possible reputation risks the Bank also has processes to track risks that may affect its reputation. These processes allow the BOD and senior management to take prompt corrective actions to address any anticipated reputation event in advance.
In order to manage reputation risks, the Bank has set in place a mechanism that entails drawing up action plans to identify reputation risk events and facilitate subsequent monitoring of the progress made; for those risks that may be very difficult or too costly to eliminate entirely the mechanism requires development of contingency plans as response actions.
31 FAIR VALUE OF FINANCIAL INSTRUMENTS
While the Bank prepares its consolidated financial statements under the historical cost convention modified for measurement to fair value of investment securities (other than held to maturity investments and certain unquoted investments), investment properties and derivative financial instruments, in the opinion of management, the estimated carrying values and fair values of those financial assets and liabilities, other than the Government deposit referred to in note 11, that are not carried at fair value in the consolidated financial statements are not materially different, since assets and liabilities are either short term in nature or in the case of deposits and performing loans and advances, frequently re-priced. For impaired loans and advances, expected cash flows, including anticipated realisation of collateral, were discounted using the original interest rates, considering the time of collection and a provision for the uncertainty of the cash flows.
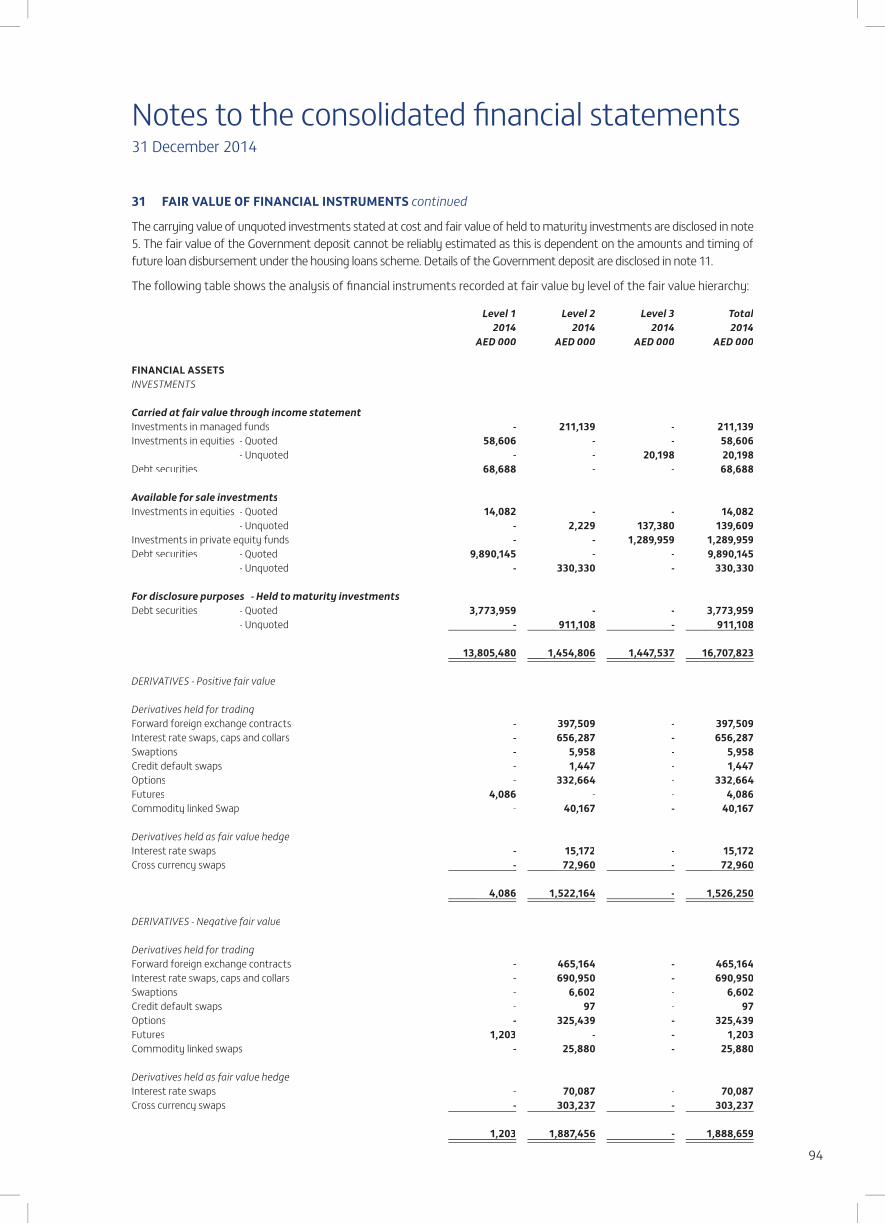
Notes to the consolidated financial statements31 December 2014
94
31 FAIR VALUE OF FINANCIAL INSTRUMENTS continued
The carrying value of unquoted investments stated at cost and fair value of held to maturity investments are disclosed in note 5. The fair value of the Government deposit cannot be reliably estimated as this is dependent on the amounts and timing of future loan disbursement under the housing loans scheme. Details of the Government deposit are disclosed in note 11.
The following table shows the analysis of financial instruments recorded at fair value by level of the fair value hierarchy:
Level 1 Level 2 Level 3 Total2014 2014 2014 2014
AED 000 AED 000 AED 000 AED 000
FINANCIAL ASSETSINVESTMENTS
Carried at fair value through income statementInvestments in managed funds - 211,139 - 211,139Investments in equities - Quoted 58,606 - - 58,606 - Unquoted - - 20,198 20,198Debt securities 68,688 - - 68,688
Available for sale investmentsInvestments in equities - Quoted 14,082 - - 14,082 - Unquoted - 2,229 137,380 139,609Investments in private equity funds - - 1,289,959 1,289,959Debt securities - Quoted 9,890,145 - - 9,890,145 - Unquoted - 330,330 - 330,330
For disclosure purposes - Held to maturity investmentsDebt securities - Quoted 3,773,959 - - 3,773,959
- Unquoted - 911,108 - 911,108
13,805,480 1,454,806 1,447,537 16,707,823
DERIVATIVES - Positive fair value
Derivatives held for tradingForward foreign exchange contracts - 397,509 - 397,509Interest rate swaps, caps and collars - 656,287 - 656,287Swaptions - 5,958 - 5,958Credit default swaps - 1,447 - 1,447Options - 332,664 - 332,664Futures 4,086 - - 4,086Commodity linked Swap - 40,167 - 40,167
Derivatives held as fair value hedgeInterest rate swaps - 15,172 - 15,172Cross currency swaps - 72,960 - 72,960
4,086 1,522,164 - 1,526,250
DERIVATIVES - Negative fair value
Derivatives held for tradingForward foreign exchange contracts - 465,164 - 465,164Interest rate swaps, caps and collars - 690,950 - 690,950Swaptions - 6,602 - 6,602Credit default swaps - 97 - 97Options - 325,439 - 325,439Futures 1,203 - - 1,203Commodity linked swaps - 25,880 - 25,880
Derivatives held as fair value hedgeInterest rate swaps - 70,087 - 70,087Cross currency swaps - 303,237 - 303,237
1,203 1,887,456 - 1,888,659
,,
,,
, ,, , , ,, ,
, ,, ,,

Notes to the consolidated financial statements31 December 2014
95
31 FAIR VALUE OF FINANCIAL INSTRUMENTS continued
The following table shows the analysis of financial instruments recorded at fair value by level of the fair value hierarchy:
Level 1 Level 2 Level 3 Total2013 2013 2013 2013
AED 000 AED 000 AED 000 AED 000
FINANCIAL ASSETSINVESTMENTS
Carried at fair value through income statementInvestments in managed funds - 184,520 - 184,520Investments in equities - Quoted 112,369 - - 112,369 - Unquoted - - 20,198 20,198Debt securities 7,165 - - 7,165
Available for sale investmentsInvestments in equities - Quoted 26,184 - - 26,184 - Unquoted - 2,256 76,892 79,148Investments in private equity funds - - 1,372,356 1,372,356Debt securities - Quoted 7,296,614 - - 7,296,614 - Unquoted - 347,197 - 347,197Structured debt notes - Unquoted - 550,950 - 550,950
For disclosure purposes - Held to maturity investmentsDebt securities - Quoted 6,098,535 - - 6,098,535 - Unquoted - 1,018,184 - 1,018,184
13,540,867 2,103,107 1,469,446 17,113,420
DERIVATIVES - Positive fair value
Derivatives held for tradingForward foreign exchange contracts - 174,461 - 174,461Interest rate swaps, caps and collars - 248,953 - 248,953Swaptions - 2,810 - 2,810Options - 39,028 - 39,028Futures 1,410 - - 1,410
Derivatives held as fair value hedgeInterest rate swaps - 34,896 - 34,896Cross currency swaps - 126,660 - 126,660
1,410 626,808 - 628,218
DERIVATIVES - Negative fair value
Derivatives held for tradingForward foreign exchange contracts - 211,312 - 211,312Interest rate swaps, caps and collars - 308,981 - 308,981Swaptions - 2,810 - 2,810Options - 38,831 - 38,831Futures 793 - - 793Commodity linked swaps - 16,120 - 16,120
Derivatives held as fair value hedgeInterest rate swaps - 28,384 - 28,384Cross currency swaps - 101,594 - 101,594
793 708,032 - 708,825
The following is a description of the determination of fair value for financial instruments which are recorded at fair value using valuation techniques. These incorporate the Bank’s estimate of assumptions that a market participant would make when valuing the instruments.
,,
,,
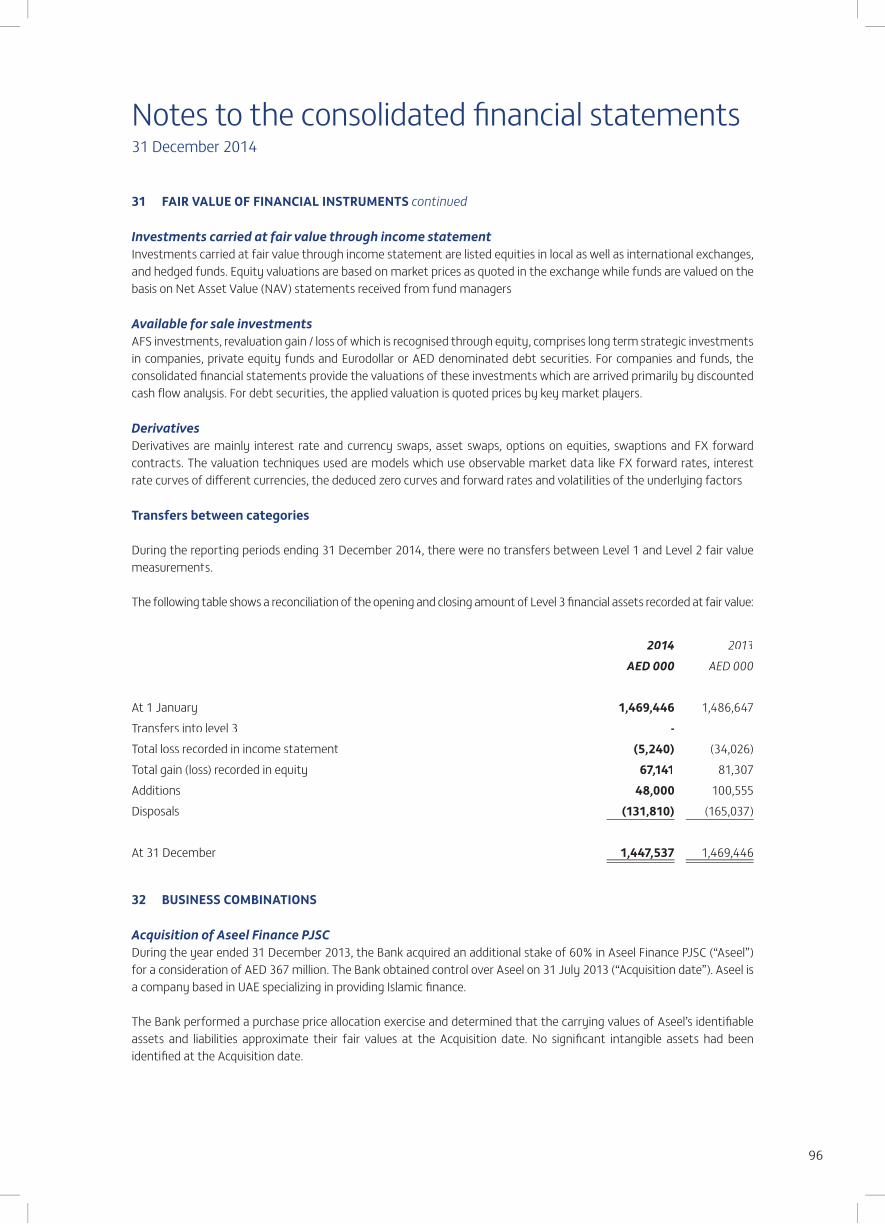
Notes to the consolidated financial statements31 December 2014
96
31 FAIR VALUE OF FINANCIAL INSTRUMENTS continued
Investments carried at fair value through income statementInvestments carried at fair value through income statement are listed equities in local as well as international exchanges, and hedged funds. Equity valuations are based on market prices as quoted in the exchange while funds are valued on the basis on Net Asset Value (NAV) statements received from fund managers
Available for sale investmentsAFS investments, revaluation gain / loss of which is recognised through equity, comprises long term strategic investments in companies, private equity funds and Eurodollar or AED denominated debt securities. For companies and funds, the consolidated financial statements provide the valuations of these investments which are arrived primarily by discounted cash flow analysis. For debt securities, the applied valuation is quoted prices by key market players.
DerivativesDerivatives are mainly interest rate and currency swaps, asset swaps, options on equities, swaptions and FX forward contracts. The valuation techniques used are models which use observable market data like FX forward rates, interest rate curves of different currencies, the deduced zero curves and forward rates and volatilities of the underlying factors
Transfers between categories
During the reporting periods ending 31 December 2014, there were no transfers between Level 1 and Level 2 fair value measurements.
The following table shows a reconciliation of the opening and closing amount of Level 3 financial assets recorded at fair value:
2014 2013AED 000 AED 000
At 1 January 1,469,446 1,486,647Transfers into level 3 - -Total loss recorded in income statement (5,240) (34,026)Total gain (loss) recorded in equity 67,141 81,307Additions 48,000 100,555Disposals (131,810) (165,037)
At 31 December 1,447,537 1,469,446
32 BUSINESS COMBINATIONS
Acquisition of Aseel Finance PJSCDuring the year ended 31 December 2013, the Bank acquired an additional stake of 60% in Aseel Finance PJSC (“Aseel”) for a consideration of AED 367 million. The Bank obtained control over Aseel on 31 July 2013 (“Acquisition date”). Aseel is a company based in UAE specializing in providing Islamic finance.
The Bank performed a purchase price allocation exercise and determined that the carrying values of Aseel’s identifiable assets and liabilities approximate their fair values at the Acquisition date. No significant intangible assets had been identified at the Acquisition date.
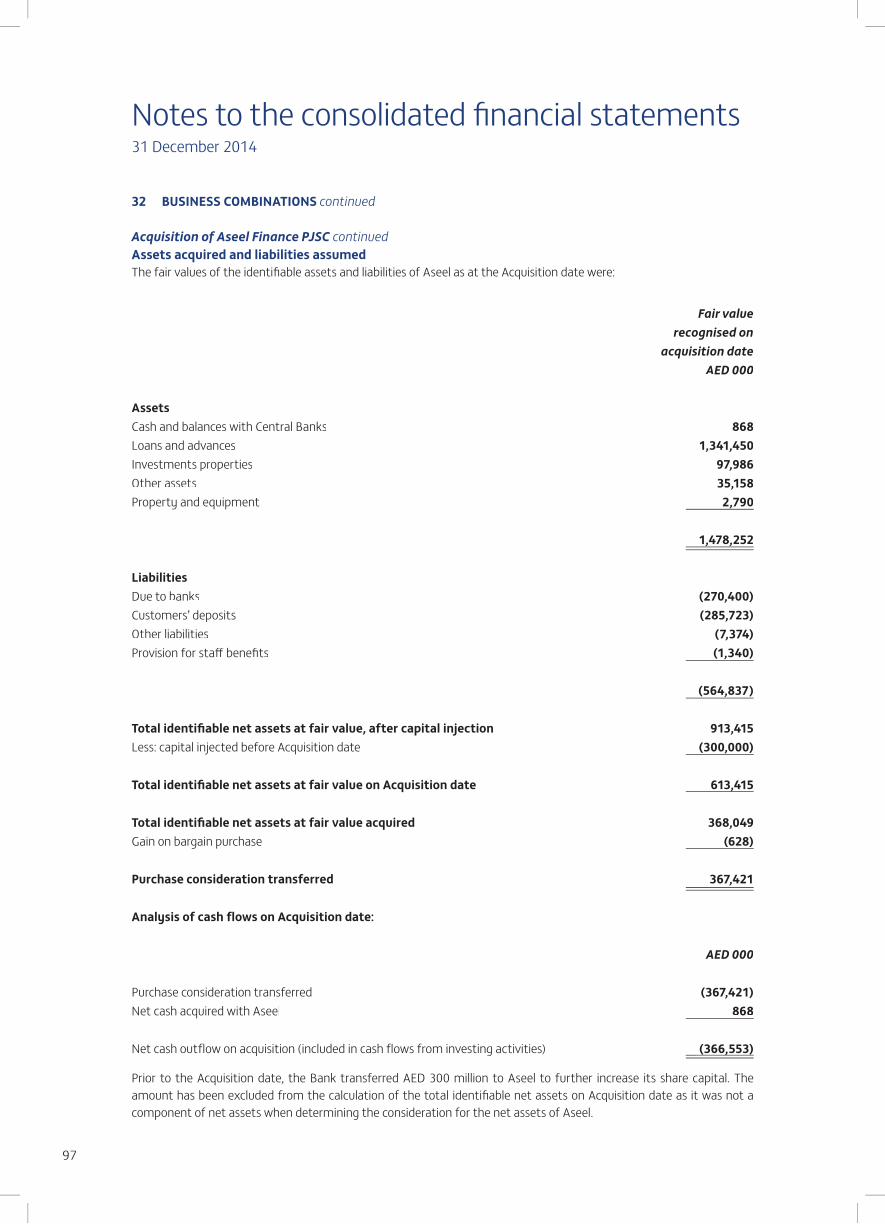
Notes to the consolidated financial statements31 December 2014
97
32 BUSINESS COMBINATIONS continued
Acquisition of Aseel Finance PJSC continuedAssets acquired and liabilities assumedThe fair values of the identifiable assets and liabilities of Aseel as at the Acquisition date were:
Fair valuerecognised on
acquisition dateAED 000
AssetsCash and balances with Central Banks 868Loans and advances 1,341,450Investments properties 97,986Other assets 35,158Property and equipment 2,790
1,478,252
LiabilitiesDue to banks (270,400)Customers’ deposits (285,723)Other liabilities (7,374)Provision for staff benefits (1,340)
(564,837)
Total identifiable net assets at fair value, after capital injection 913,415Less: capital injected before Acquisition date (300,000)
Total identifiable net assets at fair value on Acquisition date 613,415
Total identifiable net assets at fair value acquired 368,049Gain on bargain purchase (628)
Purchase consideration transferred 367,421
Analysis of cash flows on Acquisition date:
AED 000
Purchase consideration transferred (367,421)Net cash acquired with Aseel 868
Net cash outflow on acquisition (included in cash flows from investing activities) (366,553)
Prior to the Acquisition date, the Bank transferred AED 300 million to Aseel to further increase its share capital. The amount has been excluded from the calculation of the total identifiable net assets on Acquisition date as it was not a component of net assets when determining the consideration for the net assets of Aseel.
,
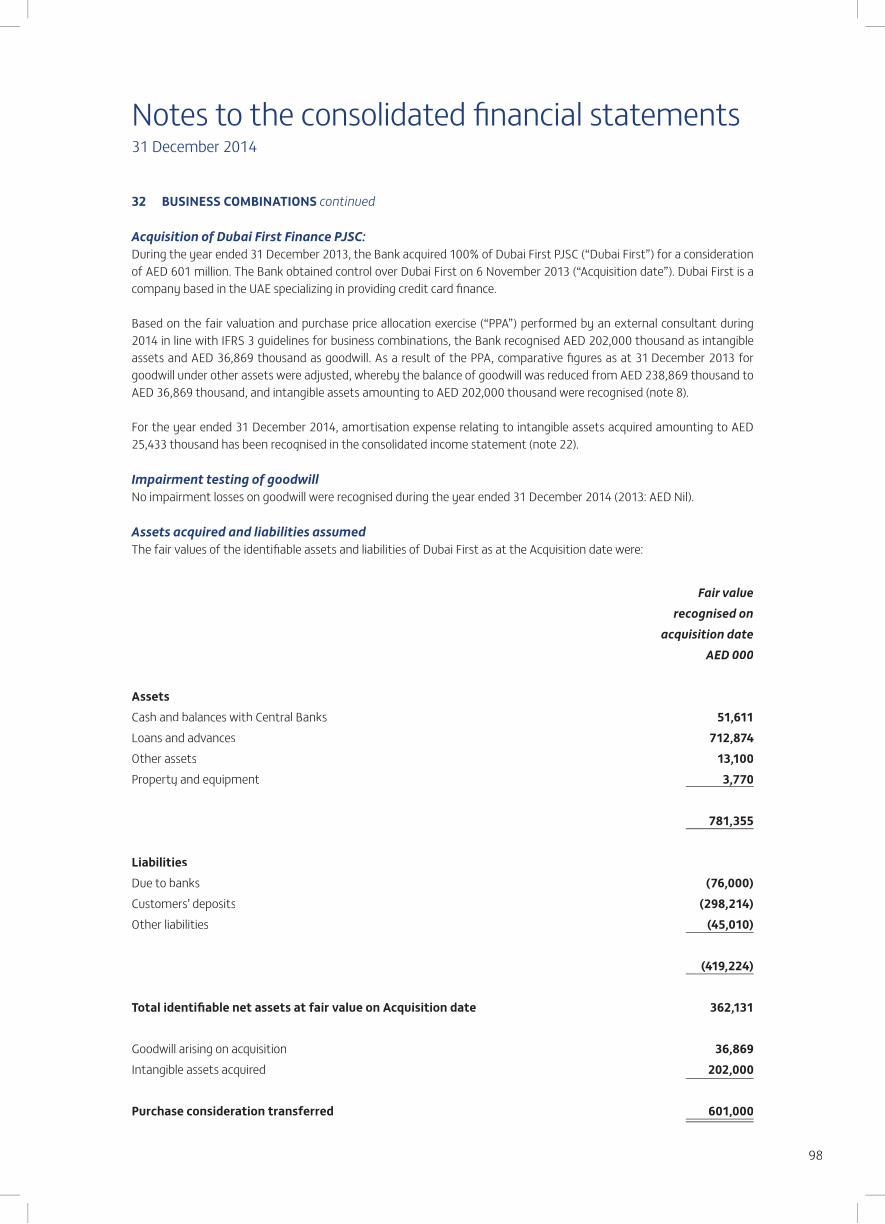
Notes to the consolidated financial statements31 December 2014
98
32 BUSINESS COMBINATIONS continued
Acquisition of Dubai First Finance PJSC:During the year ended 31 December 2013, the Bank acquired 100% of Dubai First PJSC (“Dubai First”) for a consideration of AED 601 million. The Bank obtained control over Dubai First on 6 November 2013 (“Acquisition date”). Dubai First is a company based in the UAE specializing in providing credit card finance.
Based on the fair valuation and purchase price allocation exercise (“PPA”) performed by an external consultant during 2014 in line with IFRS 3 guidelines for business combinations, the Bank recognised AED 202,000 thousand as intangible assets and AED 36,869 thousand as goodwill. As a result of the PPA, comparative figures as at 31 December 2013 for goodwill under other assets were adjusted, whereby the balance of goodwill was reduced from AED 238,869 thousand to AED 36,869 thousand, and intangible assets amounting to AED 202,000 thousand were recognised (note 8).
For the year ended 31 December 2014, amortisation expense relating to intangible assets acquired amounting to AED 25,433 thousand has been recognised in the consolidated income statement (note 22).
Impairment testing of goodwillNo impairment losses on goodwill were recognised during the year ended 31 December 2014 (2013: AED Nil).
Assets acquired and liabilities assumedThe fair values of the identifiable assets and liabilities of Dubai First as at the Acquisition date were:
Fair valuerecognised on
acquisition dateAED 000
AssetsCash and balances with Central Banks 51,611Loans and advances 712,874Other assets 13,100Property and equipment 3,770
781,355
LiabilitiesDue to banks (76,000)Customers’ deposits (298,214)Other liabilities (45,010)
(419,224)
Total identifiable net assets at fair value on Acquisition date 362,131
Goodwill arising on acquisition 36,869Intangible assets acquired 202,000
Purchase consideration transferred 601,000
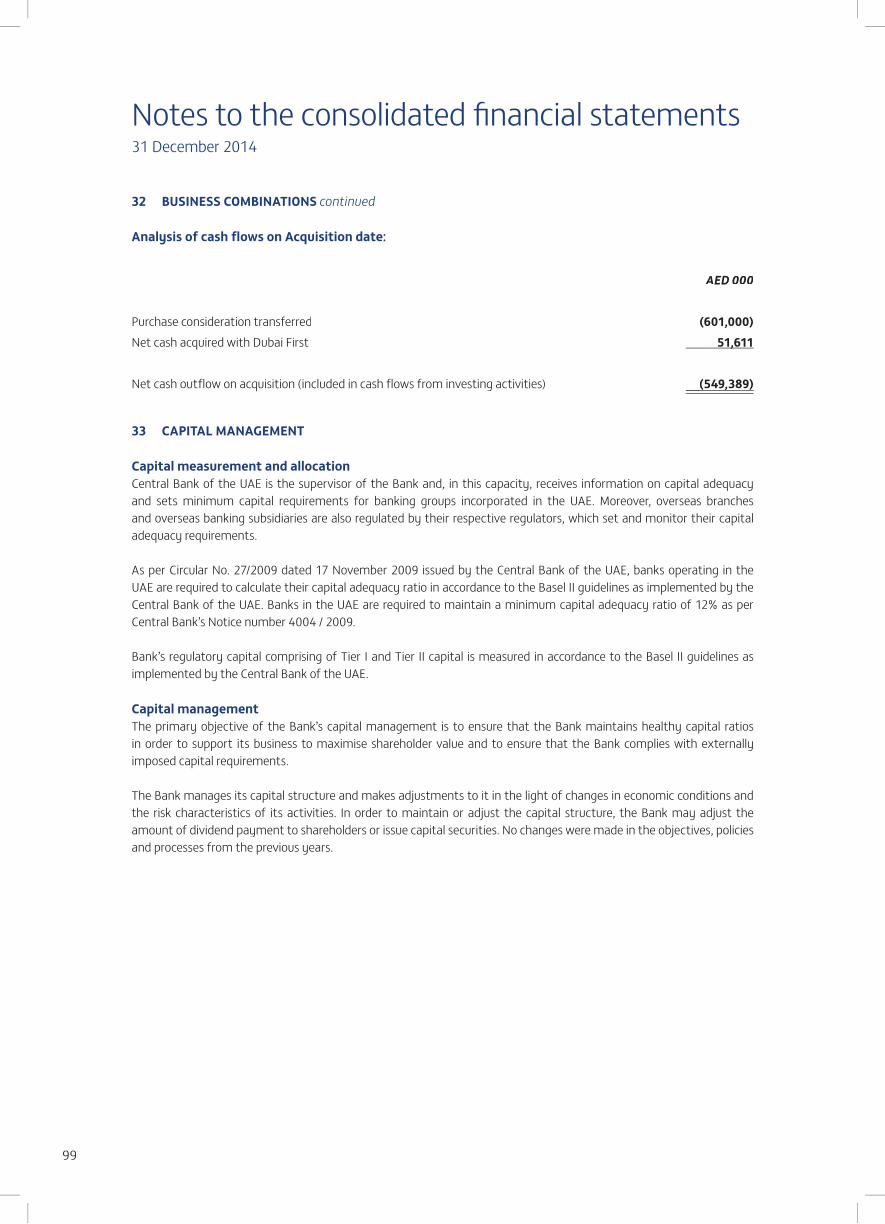
Notes to the consolidated financial statements31 December 2014
99
32 BUSINESS COMBINATIONS continued
Analysis of cash flows on Acquisition date:
AED 000
Purchase consideration transferred (601,000)Net cash acquired with Dubai First 51,611
Net cash outflow on acquisition (included in cash flows from investing activities) (549,389)
33 CAPITAL MANAGEMENT
Capital measurement and allocation Central Bank of the UAE is the supervisor of the Bank and, in this capacity, receives information on capital adequacy and sets minimum capital requirements for banking groups incorporated in the UAE. Moreover, overseas branches and overseas banking subsidiaries are also regulated by their respective regulators, which set and monitor their capital adequacy requirements.
As per Circular No. 27/2009 dated 17 November 2009 issued by the Central Bank of the UAE, banks operating in the UAE are required to calculate their capital adequacy ratio in accordance to the Basel II guidelines as implemented by the Central Bank of the UAE. Banks in the UAE are required to maintain a minimum capital adequacy ratio of 12% as per Central Bank’s Notice number 4004 / 2009.
Bank’s regulatory capital comprising of Tier I and Tier II capital is measured in accordance to the Basel II guidelines as implemented by the Central Bank of the UAE.
Capital managementThe primary objective of the Bank’s capital management is to ensure that the Bank maintains healthy capital ratios in order to support its business to maximise shareholder value and to ensure that the Bank complies with externally imposed capital requirements.
The Bank manages its capital structure and makes adjustments to it in the light of changes in economic conditions and the risk characteristics of its activities. In order to maintain or adjust the capital structure, the Bank may adjust the amount of dividend payment to shareholders or issue capital securities. No changes were made in the objectives, policies and processes from the previous years.
,
,
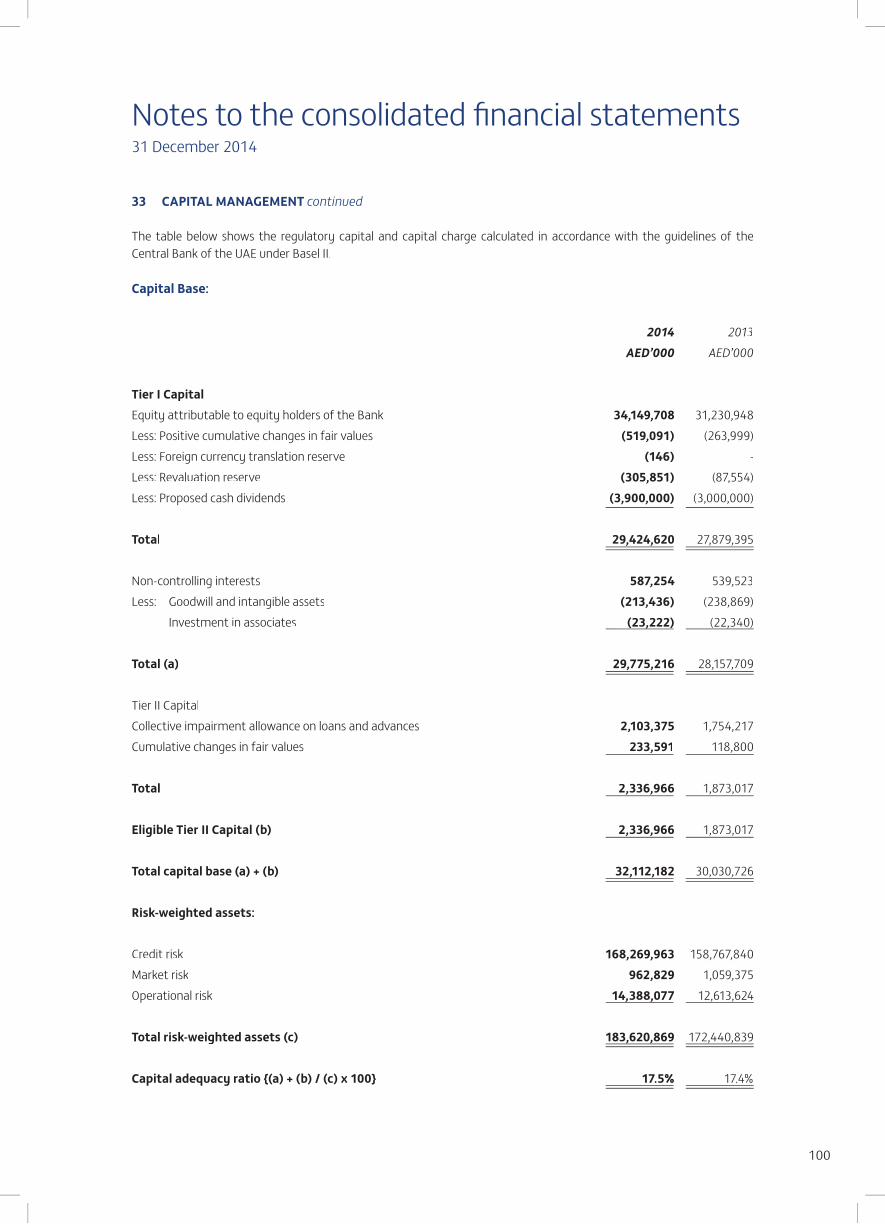
Notes to the consolidated financial statements31 December 2014
100
33 CAPITAL MANAGEMENT continued
The table below shows the regulatory capital and capital charge calculated in accordance with the guidelines of the Central Bank of the UAE under Basel II.
Capital Base:
2014 2013AED’000 AED’000
Tier I CapitalEquity attributable to equity holders of the Bank 34,149,708 31,230,948Less: Positive cumulative changes in fair values (519,091) (263,999)Less: Foreign currency translation reserve (146) -Less: Revaluation reserve (305,851) (87,554)Less: Proposed cash dividends (3,900,000) (3,000,000)
Total 29,424,620 27,879,395
Non-controlling interests 587,254 539,523Less: Goodwill and intangible assets (213,436) (238,869)
Investment in associates (23,222) (22,340)
Total (a) 29,775,216 28,157,709
Tier II CapitalCollective impairment allowance on loans and advances 2,103,375 1,754,217Cumulative changes in fair values 233,591 118,800
Total 2,336,966 1,873,017
Eligible Tier II Capital (b) 2,336,966 1,873,017
Total capital base (a) + (b) 32,112,182 30,030,726
Risk-weighted assets:
Credit risk 168,269,963 158,767,840Market risk 962,829 1,059,375Operational risk 14,388,077 12,613,624
Total risk-weighted assets (c) 183,620,869 172,440,839
Capital adequacy ratio {(a) + (b) / (c) x 100} 17.5% 17.4%
,
101
Name of the Report
1 Information on Subsidiaries & Significant Investments
2 Consolidated Capital Structure
3 Capital Adequacy
4(a) Qualitative Disclosures - Risk Management
4(b) Gross Credit Exposure by Currency
4(c) Gross Credit Exposure by Geographical Distribution
4(d) Gross Credit Exposure by Industry Segment
4(e) Gross Credit Exposure by Residual Contract Maturity
4(f) Impaired Loans by Industry Segment
4(g) Impaired Loans by Geographical Distribution
4(h) Reconciliation of changes in Provisions for Impaired Loans
4(i) Basel II Portfolio as per Standardized Approach
5 Basel II Portfolio as per Standardized Approach (Rated / Unrated)
6 Credit Risk Mitigation - Disclosures for Standardized Approach
7 Counterparty Credit Risk Exposure
8 Market Risk - Capital Requirements under Standardized Approach
9 Equity Position
10 Interest Rate Risk in the Banking Book
Basel II Pillar III Reports

102
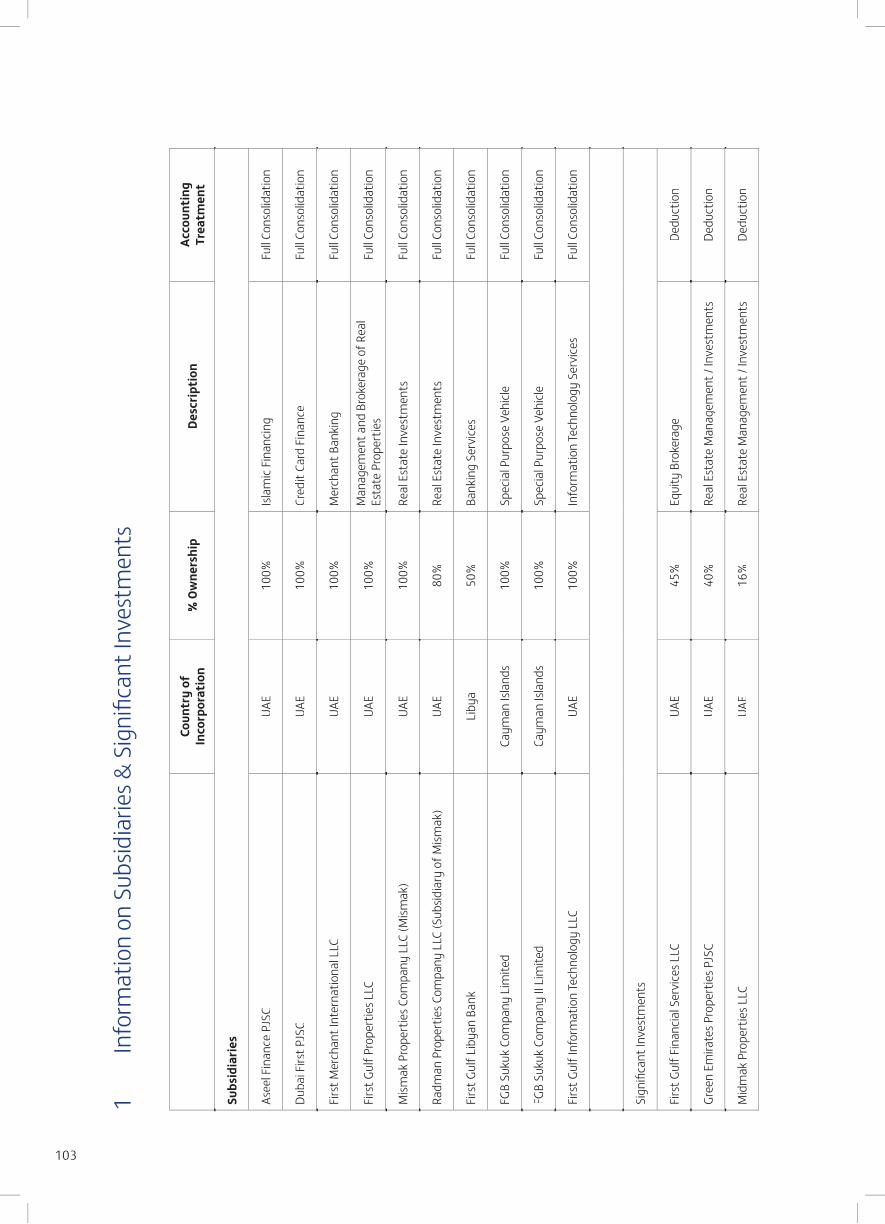
103
1 In
form
atio
n on
Sub
sidia
ries &
Sig
nific
ant I
nves
tmen
ts
Coun
try
ofIn
corp
orat
ion
% O
wne
rshi
pDe
scrip
tion
Acco
unti
n gTr
eatm
ent
Subs
idia
ries
Asee
l Fin
ance
PJSC
UAE
100%
Islam
ic Fi
nanc
ing
Full C
onso
lidat
ion
Duba
i Firs
t PJS
CUA
E10
0%Cr
edit
Card
Fin
ance
Full C
onso
lidat
ion
Firs
t Mer
chan
t Int
erna
tiona
l LLC
UAE
100%
Mer
chan
t Ban
king
Full C
onso
lidat
ion
Firs
t Gul
f Pro
pert
ies L
LCUA
E10
0%M
anag
emen
t and
Bro
kera
ge o
f Rea
l Es
tate
Pro
pert
ies
Full C
onso
lidat
ion
Mism
ak P
rope
rtie
s Com
pany
LLC
(Mism
ak)
UAE
100%
Real
Est
ate
Inve
stm
ents
Full C
onso
lidat
ion
Radm
an P
rope
rtie
s Com
pany
LLC
(Sub
sidia
ry o
f Mism
ak)
UAE
80%
Real
Est
ate
Inve
stm
ents
Full C
onso
lidat
ion
Firs
t Gul
f Lib
yan
Bank
Liby
a50
%Ba
nkin
g Se
rvice
sFu
ll Con
solid
atio
n
FGB
Suku
k Co
mpa
ny L
imite
dCa
yman
Isla
nds
100%
Spec
ial P
urpo
se V
ehicl
eFu
ll Con
solid
atio
n
FGB
Suku
k Co
mpa
ny II
Lim
ited
Caym
an Is
land
s
10
0%Sp
ecia
l Pur
pose
Veh
icle
Full C
onso
lidat
ion
Firs
t Gul
f Inf
orm
atio
n Te
chno
logy
LL C
UAE
100%
Info
rmat
ion
Tech
nolo
gy S
ervi
ces
Full C
onso
lidat
ion
Sign
i fica
nt In
vest
men
ts
Firs
t Gul
f Fin
ancia
l Ser
vice
s LLC
UAE
45%
Equi
ty B
roke
rage
Dedu
ctio
n
Gree
n Em
irate
s Pro
pert
ies P
JSC
UAE
40%
Real
Est
ate
Man
agem
ent /
Inve
stm
ents
Dedu
ctio
n
Mid
mak
Pro
pert
ies L
LCUA
E16
%Re
al E
stat
e M
anag
emen
t / In
vest
men
tsDe
duct
ion
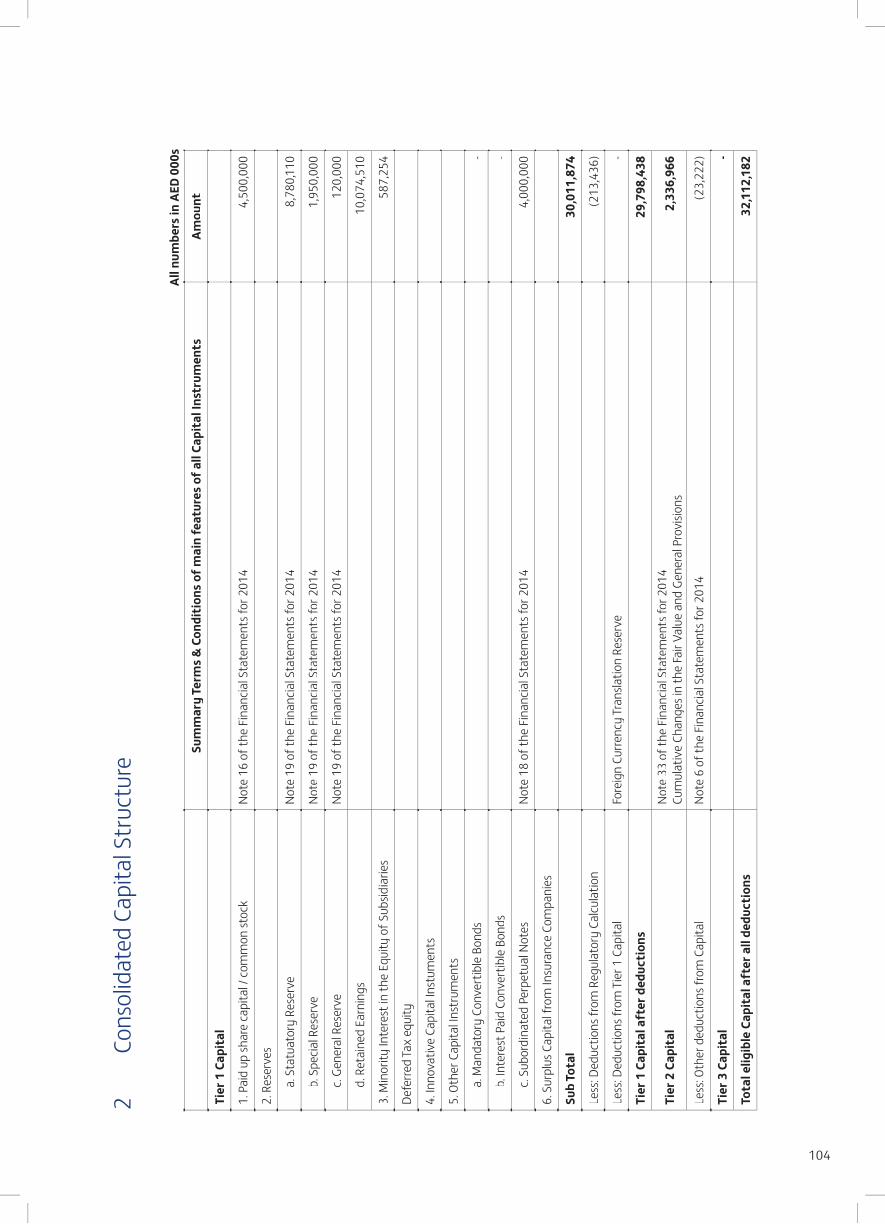
104
2 Co
nsol
idat
ed C
apita
l Str
uctu
re
All n
umbe
rs in
AED
000
s
Sum
mar
y Te
rms
& C
ondi
tion
s of
mai
n fe
atur
es o
f all
Capi
tal I
nstr
umen
tsAm
ount
Tier
1 C
apit
al
1. P
aid
up sh
are
capi
tal /
com
mon
stoc
kNo
te 1
6 of
the
Fina
ncia
l Sta
tem
ents
for 2
014
4,5
00,0
00
2. R
eser
ves
a. S
tatu
ator
y Re
serv
eNo
te 1
9 of
the
Fina
ncia
l Sta
tem
ents
for 2
014
8,7
80,11
0
b. S
pecia
l Res
erve
Note
19
of th
e Fi
nanc
ial S
tate
men
ts fo
r 201
4 1
,950
,000
c. Ge
nera
l Res
erve
Note
19
of th
e Fi
nanc
ial S
tate
men
ts fo
r 201
4 1
20,0
00
d. R
etai
ned
Earn
ings
10,
074,
510
3. M
inor
ity In
tere
st in
the
Equi
ty o
f Sub
sidia
ries
587
,254
Defe
rred
Tax
equi
ty
4. In
nova
tive
Capi
tal I
nstu
men
ts
5. O
ther
Cap
ital I
nstr
umen
ts
a. M
anda
tory
Con
vert
ible
Bon
ds -
b. In
tere
st P
aid
Conv
ertib
le B
onds
-
c. Su
bord
inat
ed P
erpe
tual
Not
esNo
te 1
8 of
the
Fina
ncia
l Sta
tem
ents
for 2
014
4,0
00,0
00
6. S
urpl
us C
apita
l fro
m In
sura
nce
Com
pani
es
Sub
Tota
l 3
0,01
1,87
4
Less
: Ded
uctio
ns fr
om R
egul
ator
y Ca
lcula
tion
(213
,436
)
Less
: Ded
uctio
ns fr
om T
ier 1
Cap
ital
Fore
ign
Curre
ncy
Tran
slatio
n Re
serv
e -
Tier
1 C
apit
al a
fter
ded
ucti
ons
29,
798,
438
Tier
2 C
apit
alNo
te 3
3 of
the
Fina
ncia
l Sta
tem
ents
for 2
014
Cum
ulat
ive
Chan
ges i
n th
e Fa
ir Va
lue
and
Gene
ral P
rovi
sions
2,3
36,9
66
Less
: Oth
er d
educ
tions
from
Cap
ital
Note
6 o
f the
Fin
ancia
l Sta
tem
ents
for 2
014
(23,
222)
Tier
3 C
apit
al-
Tota
l elig
ible
Cap
ital
aft
er a
ll de
duct
ions
32,
112,
182
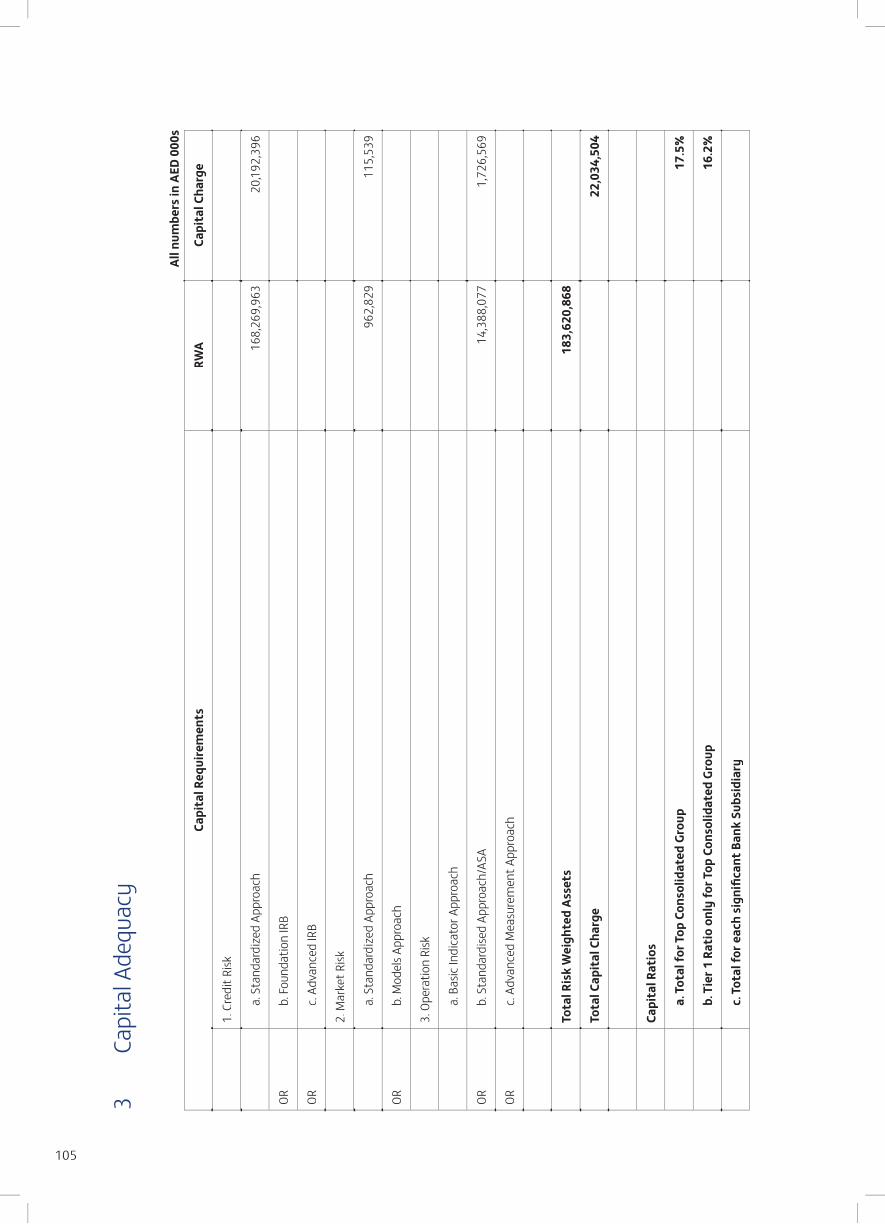
105
3 Ca
pita
l Ade
quac
y
All n
umbe
rs in
AED
000
s
Capi
tal R
equi
rem
ents
RWA
Capi
tal C
harg
e
1. C
redi
t Risk
a. S
tand
ardi
zed
Appr
oach
168
,269
,963
2
0,192
,396
ORb.
Foun
datio
n IR
B
ORc.
Adva
nced
IRB
2. M
arke
t Risk
a. S
tand
ardi
zed
Appr
oach
962
,829
1
15,5
39
ORb.
Mod
els A
ppro
ach
3. O
pera
tion
Risk
a. B
asic
Indi
cato
r App
roac
h
ORb.
Sta
ndar
dise
d Ap
proa
ch/A
SA 1
4,38
8,07
7 1
,726
,569
ORc.
Adva
nced
Mea
sure
men
t App
roac
h
Tota
l Ris
k W
eigh
ted
Asse
ts 1
83,6
20,8
68
Tota
l Cap
ital
Cha
rge
22,
034,
504
Capi
tal R
atio
s
a. To
tal f
or To
p Co
nsol
idat
ed G
roup
17.5
%
b. T
ier 1
Rat
io o
nly
for T
op C
onso
lidat
ed G
roup
16.2
%
c. To
tal f
or e
ach
sign
ifica
nt B
ank
Subs
idia
ry
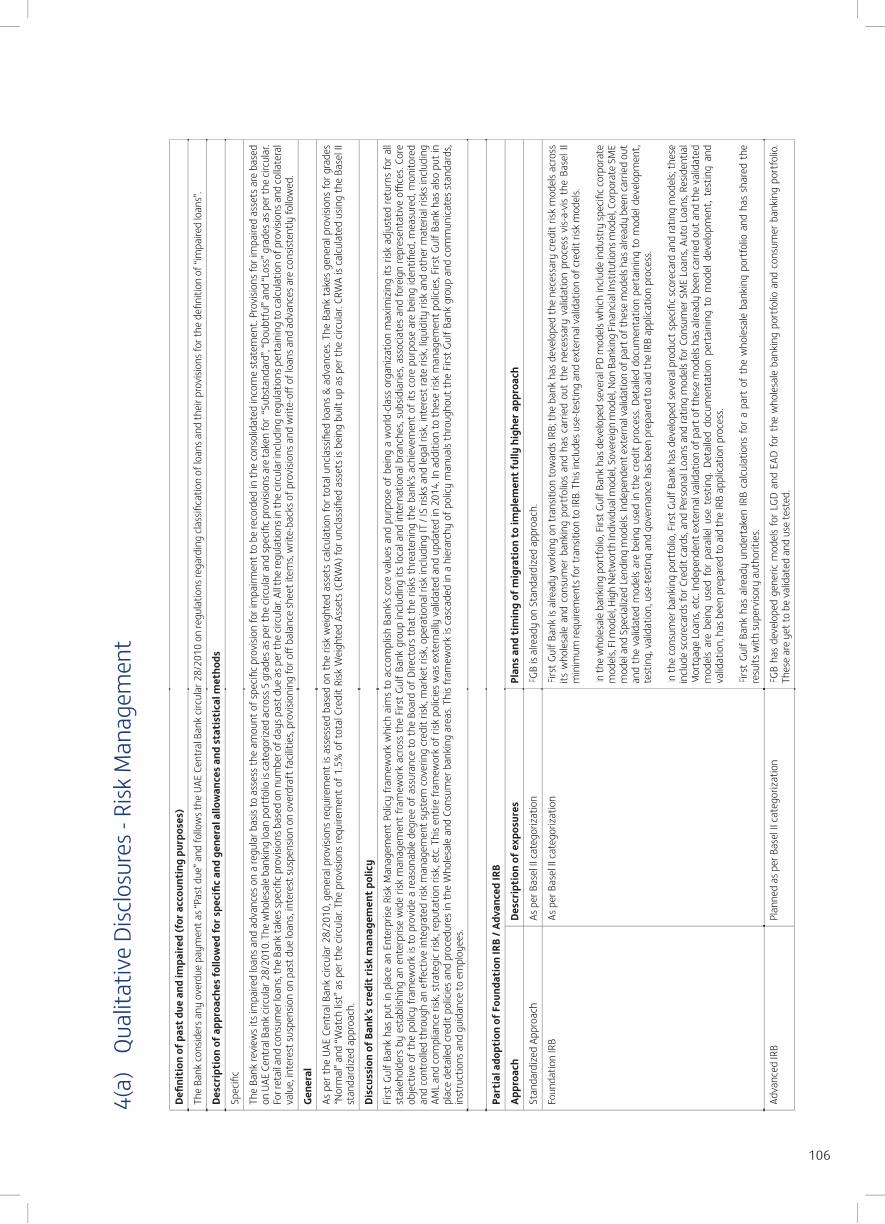
106
4(a)
Qu
alita
tive
Disc
losu
res -
Risk
Man
agem
ent
Defin
itio
n of
pas
t due
and
impa
ired
(for
acc
ount
ing
purp
oses
)
The
Bank
cons
ider
s any
ove
rdue
pay
men
t as “
Past
due
” and
follo
ws t
he U
AE C
entr
al B
ank
circu
lar 2
8/20
10 o
n re
gula
tions
rega
rdin
g cla
ssifi
catio
n of
loan
s and
thei
r pro
visio
ns fo
r the
defi
nitio
n of
“im
paire
d lo
ans”
.
Desc
ripti
on o
f app
roac
hes
follo
wed
for s
peci
fic a
nd g
ener
al a
llow
ance
s an
d st
atis
tica
l met
hods
Spec
ific
The
Bank
revi
ews i
ts im
paire
d lo
ans a
nd a
dvan
ces o
n a
regu
lar b
asis
to a
sses
s the
am
ount
of s
pecifi
c pr
ovisi
on fo
r im
pairm
ent t
o be
reco
rded
in th
e co
nsol
idat
ed in
com
e st
atem
ent.
Prov
ision
s for
impa
ired
asse
ts a
re b
ased
on
UAE
Cen
tral
Ban
k cir
cula
r 28/
2010
. The
who
lesa
le b
anki
ng lo
an p
ortf
olio
is ca
tego
rized
acr
oss 5
gra
des a
s per
the
circu
lar a
nd sp
ecifi
c pro
visio
ns a
re ta
ken
for
“Sub
stan
dard
”, “D
oubt
ful”
and
“Los
s” g
rade
s as p
er th
e cir
cula
r. Fo
r ret
ail a
nd co
nsum
er lo
ans,
the
Bank
take
s spe
cific p
rovi
sions
bas
ed o
n nu
mbe
r of d
ays p
ast d
ue a
s per
the
circu
lar. A
ll the
regu
latio
ns in
the
circu
lar i
nclu
ding
regu
latio
ns p
erta
inin
g to
calcu
latio
n of
pro
visio
ns a
nd co
llate
ral
valu
e, in
tere
st su
spen
sion
on p
ast d
ue lo
ans,
inte
rest
susp
ensio
n on
ove
rdra
ft fa
ciliti
es, p
rovi
sioni
ng fo
r off
bal
ance
shee
t ite
ms,
writ
e-ba
cks o
f pro
visio
ns a
nd w
rite-
off o
f loa
ns a
nd a
dvan
ces a
re co
nsist
ently
follo
wed
.
Gene
ral
As p
er th
e UA
E Ce
ntra
l Ban
k cir
cula
r 28/
2010
, gen
eral
pro
visio
ns re
quire
men
t is a
sses
sed
base
d on
the
risk
wei
ghte
d as
sets
cal
cula
tion
for t
otal
unc
lass
ified
loan
s & a
dvan
ces.
The
Bank
take
s gen
eral
pro
visio
ns fo
r gra
des
“Nor
mal
” and
“Wat
ch li
st” a
s per
the
circu
lar. T
he p
rovi
sions
requ
irem
ent o
f 1.5
% o
f tot
al C
redi
t Risk
Wei
ghte
d As
sets
(CRW
A) fo
r unc
lass
ified
ass
ets i
s bei
ng b
uilt
up a
s per
the
circu
lar.
CRW
A is
calcu
late
d us
ing
the
Base
l II
stan
dard
ized
appr
oach
.
Disc
ussi
on o
f Ban
k’s
cred
it ri
sk m
anag
emen
t pol
icy
Firs
t Gul
f Ban
k ha
s pu
t in
plac
e an
Ent
erpr
ise R
isk M
anag
emen
t Pol
icy fr
amew
ork
whi
ch a
ims
to a
ccom
plish
Ban
k’s c
ore
valu
es a
nd p
urpo
se o
f bei
ng a
wor
ld-c
lass
org
aniza
tion
max
imiz
ing
its ri
sk a
djus
ted
retu
rns
for a
ll st
akeh
olde
rs b
y es
tabl
ishin
g an
ent
erpr
ise w
ide
risk
man
agem
ent f
ram
ewor
k ac
ross
the
Firs
t Gul
f Ban
k gr
oup
inclu
ding
its
loca
l and
inte
rnat
iona
l bra
nche
s, su
bsid
iarie
s, as
socia
tes
and
fore
ign
repr
esen
tativ
e offi
ces.
Core
ob
ject
ive
of th
e po
licy
fram
ewor
k is
to p
rovi
de a
reas
onab
le d
egre
e of
ass
uran
ce to
the
Boar
d of
Dire
ctor
s th
at th
e ris
ks th
reat
enin
g th
e ba
nk’s
achi
evem
ent o
f its
cor
e pu
rpos
e ar
e be
ing
iden
tified
, mea
sure
d, m
onito
red
and
cont
rolle
d th
roug
h an
effe
ctiv
e in
tegr
ated
risk
man
agem
ent s
yste
m c
over
ing
cred
it ris
k, m
arke
t risk
, ope
ratio
nal r
isk in
cludi
ng IT
/ IS
risk
s and
lega
l risk
, inte
rest
rate
risk
, liqu
idity
risk
and
oth
er m
ater
ial r
isks i
nclu
ding
AM
L an
d co
mpl
ianc
e ris
k, st
rate
gic
risk,
repu
tatio
n ris
k, e
tc. T
his e
ntire
fram
ewor
k of
risk
pol
icies
was
ext
erna
lly v
alid
ated
and
upd
ated
in 2
014.
In a
dditi
on to
thes
e ris
k m
anag
emen
t pol
icies
, Firs
t Gul
f Ban
k ha
s also
put
in
plac
e de
taile
d cr
edit
polic
ies a
nd p
roce
dure
s in
the
Who
lesa
le a
nd C
onsu
mer
ban
king
are
as. T
his f
ram
ewor
k is
casc
aded
in a
hie
rarc
hy o
f pol
icy m
anua
ls th
roug
hout
the
Firs
t Gul
f Ban
k gr
oup
and
com
mun
icate
s sta
ndar
ds,
inst
ruct
ions
and
gui
danc
e to
em
ploy
ees.
Part
ial a
dopt
ion
of F
ound
atio
n IR
B / A
dvan
ced
IRB
Appr
oach
Desc
ripti
on o
f exp
osur
esPl
ans
and
tim
ing
of m
igra
tion
to im
plem
ent f
ully
hig
her a
ppro
ach
Stan
dard
ized
Appr
oach
As p
er B
asel
II ca
tego
rizat
ion
FGB
is al
read
y on
Sta
ndar
dize
d ap
proa
ch.
F oun
datio
n IR
BAs
per
Bas
el II
cate
goriz
atio
nFi
rst G
ulf B
ank
is al
read
y w
orki
ng o
n tr
ansit
ion
tow
ards
IRB;
the
bank
has
dev
elop
ed th
e ne
cess
ary
cred
it ris
k m
odel
s acr
oss
its w
hole
sale
and
con
sum
er b
anki
ng p
ortf
olio
s an
d ha
s ca
rrie
d ou
t th
e ne
cess
ary
valid
atio
n pr
oces
s vi
s-a-
vis
the
Base
l II
min
imum
requ
irem
ents
for t
rans
ition
to IR
B. T
his i
nclu
des u
se-te
stin
g an
d ex
tern
al v
alid
atio
n of
cred
it ris
k m
odel
s.
In th
e w
hole
sale
ban
king
por
tfol
io, F
irst G
ulf B
ank
has d
evel
oped
seve
ral P
D m
odel
s whi
ch in
clude
indu
stry
spec
ific c
orpo
rate
m
odel
s, FI
mod
el, H
igh
Netw
orth
Indi
vidu
al m
odel
, Sov
erei
gn m
odel
, Non
Ban
king
Fina
ncia
l Inst
itutio
ns m
odel
, Cor
pora
te S
ME
mod
el a
nd S
pecia
lized
Len
ding
mod
els.
Inde
pend
ent e
xter
nal v
alid
atio
n of
par
t of t
hese
mod
els h
as a
lread
y be
en ca
rrie
d ou
t an
d th
e va
lidat
ed m
odel
s ar
e be
ing
used
in t
he c
redi
t pr
oces
s. De
taile
d do
cum
enta
tion
pert
aini
ng to
mod
el d
evel
opm
ent,
test
ing,
val
idat
ion,
use
-test
ing
and
gove
rnan
ce h
as b
een
prep
ared
to a
id th
e IR
B ap
plica
tion
proc
ess.
In th
e co
nsum
er b
anki
ng p
ortf
olio
, Firs
t Gul
f Ban
k ha
s dev
elop
ed se
vera
l pro
duct
spec
ific
scor
ecar
d an
d ra
ting
mod
els;
thes
e in
clude
scor
ecar
ds fo
r Cre
dit c
ards
, and
Per
sona
l Loa
ns a
nd ra
ting
mod
els f
or C
onsu
mer
SM
E Lo
ans,
Auto
Loa
ns, R
esid
entia
l M
ortg
age
Loan
s, et
c. In
depe
nden
t ext
erna
l val
idat
ion
of p
art o
f the
se m
odel
s has
alre
ady
been
carr
ied
out a
nd th
e va
lidat
ed
mod
els
are
bein
g us
ed f
or p
aral
lel u
se t
estin
g. D
etai
led
docu
men
tatio
n pe
rtai
ning
to
mod
el d
evel
opm
ent,
test
ing
and
valid
atio
n, h
as b
een
prep
ared
to a
id th
e IR
B ap
plica
tion
proc
ess.
Firs
t Gu
lf Ba
nk h
as a
lread
y un
dert
aken
IRB
calcu
latio
ns fo
r a p
art
of t
he w
hole
sale
ban
king
por
tfol
io a
nd h
as s
hare
d th
e re
sults
with
supe
rviso
ry a
utho
ritie
s.
Adva
nced
IRB
Plan
ned
as p
er B
asel
II ca
tego
rizat
ion
FGB
has
deve
lope
d ge
neric
mod
els
for L
GD a
nd E
AD fo
r the
who
lesa
le b
anki
ng p
ortf
olio
and
con
sum
er b
anki
ng p
ortf
olio
. Th
ese
are
yet t
o be
val
idat
ed a
nd u
se te
sted
.

107
4(b)
Gr
oss C
redi
t Exp
osur
e by
Cur
renc
y
All n
umbe
rs in
AED
000
s
Curr
ency
Loan
sDe
bt
Secu
ritie
sOt
her
Expo
sure
sTo
tal
Fund
ed
Com
mit
men
tsOT
C De
rivat
ives
Othe
r Off
Bal
ance
She
etex
posu
res
Tota
l Non
Fu
nded
(C
redi
t Ri
skex
posu
re)
Tota
lw
itho
ut
ccf
wit
h cc
fN
otio
nal
Amou
ntPo
siti
veFa
ir Va
lue
Cred
it R
isk
Expo
sure
wit
hout
cc
fw
ith
ccf
Fore
ign
Curr
ency
60,8
59,84
1 1
4,680
,519
17,4
20,51
4 9
2,960
,874
7,73
4,819
1,54
6,963
77,5
25,35
5 1
,437,7
87
2,81
5,863
41,6
77,76
8 1
9,047
,007
23,4
09,83
3 1
16,37
0,707
AED
83,3
26,86
2 2
93,71
1 2
7,825
,556
111
,446,1
29 1
,688,8
43
337
,769
21,0
18,70
7 8
8,463
2
76,26
630
,952,4
82
14,4
26,88
6 1
5,040
,921
126
,487,0
50
Prov
ision
s (4
,478,0
46)
- -
(4,47
8,046
) -
- (4
,478,0
46)
Tota
l 13
9,70
8,65
7 14
,974
,230
45
,246
,070
19
9,92
8,95
7 9,
423,
662
1,88
4,73
2 98
,544
,062
1,52
6,25
0 3,
092,1
29 72
,630
,250
33
,473
,893
38
,450
,754
238,
379,
711

108
4(c)
Gr
oss C
redi
t Exp
osur
e by
Geo
grap
hica
l Dist
ribut
ion
All n
umbe
rs in
AED
000
s
Geog
raph
ical
Regi
onLo
ans
Debt
Se
curit
ies
Othe
r Ex
posu
res
Tota
l Fun
ded
Com
mitm
ents
OTC
Deriv
ativ
esOt
her O
ff B
alan
ce S
heet
Expo
sure
sTo
tal N
on
Fund
ed
(Cre
dit R
isk
Expo
sure
)
Tota
lw
ithou
t ccf
with
ccf
Notio
nal
Amou
ntPo
sitiv
e Fa
irVa
lue
Cred
it Ri
skex
posu
rew
ithou
t ccf
with
ccf
Unite
d Ar
ab
Emira
tes
123
,900
,692
6
,662
,954
2
7,26
5,193
1
57,8
28,8
39
5,8
36,7
76
1,16
7,35
5 4
1,60
1,88
3 1
,009
,715
1,6
67,7
83
48,
817,
044
22,
539,
337
25,
374,
475
183
,203
,314
GCC
excl
udin
g UA
E 3
,119,1
55 2
,769
,865
8
16,3
70
6,7
05,3
90
244
,385
4
8,87
7 2
,641
,745
6
1,06
5 8
5,29
7 6
57,14
4 2
79,6
14
413
,788
7
,119,1
78
Arab
Lea
gue
excl
udin
g GC
C 5
92,0
36 -
2,7
93,2
31
3,3
85,2
67
8,6
88
1,7
38
1,4
87
- 1
5 1
,918
,712
6
36,6
90
638
,443
4
,023
,710
Asia
9,3
04,10
3 3
,543
,539
3
,348
,959
16,19
6,60
1 1
,924
,744
3
84,9
49
1,4
87,11
2 2
7,71
7 4
7,101
1
7,66
3,92
28,
430,
329
8,8
62,3
79
25,
058,
980
Afric
a 1
,188,1
47
212
,873
9
,077
1
,410
,097
7
3,87
7 1
4,77
5 -
- -
202
,666
4
1,60
1 5
6,37
6 1
,466
,473
Nort
hAm
eric
a 9
2,87
2 1
18,4
03 5
59,2
06 7
70,4
81
- -
1,19
7,69
1 1
3,159
1
9,57
4 2
30,7
7512
0,70
0 1
40,2
74
910
,755
Sout
h Am
eric
a 3
67
38,1
90
652
3
9,20
9 -
- -
- -
- -
- 3
9,20
9
Carib
bean
493
,187
- 2
,462
4
95,6
49
7,0
29
1,4
05
397
,001
9
,656
1
5,61
1 2
1,59
1 8
,389
2
5,40
5 5
21,0
54
Euro
pe 5
,095
,060
1
,628
,406
1
0,102
,410
1
6,82
5,87
6 1
,145,
408
229
,082
4
9,99
5,133
3
81,7
97 1
,219
,151
2,8
85,7
58
1,2
99,6
88
2,7
47,9
21
19,
573,
797
Aust
ralia
401
,084
- 3
48,5
10 7
49,5
94
182
,755
3
6,55
1 1
,222
,010
2
3,141
3
7,59
7 2
32,6
38
117
,545
1
91,6
93
941
,287
Prov
isio
ns (4
,478
,046
) -
- (4
,478
,046
) -
- -
- -
- -
- (4
,478
,046
)
Tota
l 1
39,7
08,6
57
14,
974,
230
45,
246,
070
199
,928
,957
9
,423
,662
1
,884
,732
98,
544,
062
1,5
26,2
50
3,0
92,1
29
72,
630,
250
33,
473,
893
38,
450,
754
238
,379
,711

109
4(d)
Gr
oss C
redi
t Exp
osur
e by
Indu
stry
Seg
men
t
All n
umbe
rs in
AED
000
s
Indu
stry
Seg
men
tLo
ans
Debt
Se
curit
ies
Othe
rEx
posu
res
Tota
lFu
nded
Com
mitm
ents
OTC
Deriv
ativ
esOt
her O
ff Ba
lanc
e Sh
eet
Expo
sure
sTo
tal N
onFu
nded
(Cre
dit R
isk
Expo
sure
)
Tota
lw
ithou
t ccf
with
ccf
Notio
nal
Amou
ntPo
sitiv
e Fa
ir Va
lue
Cred
it Ri
sk
Expo
sure
with
out c
cfw
ith cc
f
Agric
ultu
re, F
ishi
ng
& R
elat
ed a
ctiv
itie
s 1,
280,2
54 -
354,7
88 1,
635,0
42 41
2,192
82,43
8 2,
394,8
17 15
6,802
254,5
87 71
7,331
297,6
25 63
4,650
2,26
9,692
Crud
e Oi
l, Ga
s, M
inin
g
& Q
uarr
ying
1,64
1,336
701,6
98 35
3,194
2,69
6,228
7,85
3 1,
571
- -
- 97
6,054
807,0
82 80
8,653
3,50
4,881
Man
ufac
turin
g 7,
036,0
69 86
,404
540,8
93 7,
663,3
66 71
9,885
143,9
77 18
3,650
2,86
6 5,
620
2,61
5,221
1,24
0,983
1,39
0,580
9,05
3,946
Elec
tric
ity
& W
ater
- -
- -
- -
- -
- -
- -
-
Real
Est
ate
& C
onst
ruct
ion
21,25
0,991
682,5
17 38
0,173
22,31
3,681
878,9
21 17
5,784
1,29
8,858
21,27
6 36
,068
28,11
0,361
13,77
1,920
13,98
3,772
36,29
7,453
Trad
e 7,
922,6
32 -
1,81
3,667
9,73
6,299
938,5
65 18
7,713
2,81
7,111
145,0
80 20
8,732
8,59
3,210
4,62
0,733
5,01
7,178
14,75
3,477
Tran
spor
t, S
tora
ge &
Co
mm
unic
atio
n 2,
530,9
44 53
,728
3,62
3 2,
588,2
95 40
0,384
80,07
7 2,
132,2
80 17
5,648
250,2
00 19
2,709
50,23
0 38
0,507
2,96
8,802
Fina
ncia
l Ser
vice
s 8,
845,7
94 6,
952,9
22 16
,036,3
75 31
,835,0
91 1,
444,2
97 28
8,859
78,64
2,406
458,7
17 1,
580,1
55 8,
774,0
32 3,
037,9
67 4,
906,9
81 36
,742,0
72
Othe
r Ser
vice
s 21
,807,4
46 2,
099,6
06 21
3,315
24,12
0,367
2,83
7,165
567,4
33 3,
988,1
58 58
,211
97,04
1 9,
321,1
90 5,
090,6
60 5,
755,1
34 29
,875,5
01
Gove
rnm
ent i
nclu
ding
Pu
blic
Sec
tor
12,52
3,613
4,39
7,355
21,54
2,328
38,46
3,296
1,78
4,400
356,8
80 6,
817,9
04 50
3,944
654,6
76 13
,042,2
00 4,
290,4
58 5,
302,0
14 43
,765,3
10
Reta
il / C
onsu
mer
Ban
king
54,12
3,178
-53
7,466
54
,660,6
44 -
-11
,166
287
343
284,4
94
264,3
45
264,6
88
54,92
5,332
All O
ther
s 5,
224,4
46 -
3,47
0,248
8,69
4,694
- -
257,7
12 3,
419
4,70
7 3,
448
1,89
0 6,
597
8,70
1,291
Prov
isio
ns (4
,478,0
46)
- -
(4,47
8,046
) -
- -
- -
- -
- (4
,478,0
46)
Tota
l 13
9,708
,657
14,97
4,230
45
,246,0
70
199,9
28,95
7 9,
423,6
62 1,
884,7
32 98
,544,0
62
1,52
6,250
3,09
2,129
72,63
0,250
33
,473,8
93
38,45
0,754
23
8,379
,711

110
4(e)
Gr
oss C
redi
t Exp
osur
e by
Res
idua
l Con
trac
t Mat
urity
All n
umbe
rs in
AED
000
s
Resid
ual M
atur
ityLo
ans
D ebt
Se
curit
ies
Othe
r Ex
posu
res
T ota
lFu
nded
Com
mitm
ents
OTC
Deriv
ativ
esOt
her O
ff Ba
lanc
e Sh
eet
Expo
sure
sTo
tal N
on
Fund
ed(C
redi
t Risk
Ex
posu
re)
Tota
l
with
out c
cfw
ith cc
fNo
tiona
l Am
ount
Posit
ive
Fair
V alu
eCr
edit
Risk
Ex
posu
rew
ithou
t ccf
with
ccf
Less
than
3 m
onth
s 30
,767,7
89
1,148
,809
36,76
8,580
68
,685,1
78 -
- 39
,109,4
06 1,
526,2
50
2,00
3,864
50,78
5,151
25,49
3,388
27
,497,2
52
96,18
2,430
3 m
onth
s to
one
year
16,17
5,207
832,4
08
7,47
7,490
24
,485,1
05 9,
423,6
62 1,
884,7
32
24,42
7,112
29
8,310
10
,801,3
08
3,61
3,409
5,79
6,451
30,28
1,556
One
to fi
ve y
ears
49,91
6,565
9,9
50,90
4 1,
000,0
00 60
,867,4
69
- -
22,17
6,248
545,9
08
11,04
3,791
4,
367,0
96 4,
913,0
04
65,78
0,473
Over
five
yea
rs 47
,327,1
42 3,
042,1
09
50,36
9,251
-
- 12
,831,2
96
244,0
47
- -
244,0
47 50
,613,2
98
Prov
ision
s (4
,478,0
46)
- (4
,478,0
46)
- -
- -
- -
(4,47
8,046
)
Gran
d Tot
al 13
9,708
,657
14,97
4,230
45
,246,0
70
199,9
28,95
7 9,
423,6
62 1,
884,7
32
98,54
4,062
1,52
6,250
3,
092,1
29 72
,630,2
50
33,47
3,893
38
,450,7
54 23
8,379
,711

111
4(f)
Im
paire
d Lo
ans b
y In
dust
ry S
egm
ent
All n
umbe
rs in
AED
000
s
Indu
stry
Seg
men
tOv
erdu
e / I
mpa
ired
Asse
tsIIS
Prov
isio
nsAd
just
men
ts
Over
due
Impa
ired
Asse
tsTo
tal F
unde
dSp
ecifi
cGe
nera
lW
rite
Offs
Writ
e Ba
cks
A gric
ultu
re, F
ishi
ng &
Rel
ated
act
ivit
ies
- -
- -
- -
--
Crud
e Oi
l, Ga
s, M
inin
g &
Qua
rryi
ng 1
00 -
100
-
- -
--
Man
ufac
turin
g16
,425
1
63,17
3 17
9,59
8 1
9,84
7 3
1,71
1 -
--
Elec
tric
ity
& W
ater
- -
- -
- -
--
Real
Est
ate
& C
onst
ruct
ion
315
,322
5
10,5
67 8
25,8
89
117
,260
112,
901
- 2
62
-
Trad
e 9
7,01
5 1
59,7
32 2
56,7
47
36,
053
44,5
66
- 9
,685
-
Tran
spor
t, S
tora
ge &
Com
mun
icat
ion
2,3
73
- 2
,373
-
- -
--
Fina
ncia
l Ser
vice
s 1
7,69
9 6
08,4
81 6
26,18
0 6
7,21
3 2
64,4
33
--
-
Othe
r Ser
vice
s 2
18,5
69
190
,397
408
,966
5
6,05
4 3
9,20
0 -
--
Gove
rnm
ent (
incl
udin
g Pu
blic
Sec
tor)
- -
- -
- -
-
Reta
il / C
onsu
mer
Ban
king
2,2
99,2
67
1,6
94,5
89
3,9
93,8
56
157
,904
1,2
64,4
43
400
,219
619
,789
-
All O
ther
s 6
54,7
95
740
,283
1,3
95,0
78
79,
790
218
,042
2
,102,
533
235
Tota
l 3
,621
,566
4,
067,
221
7,6
88,7
87
534
,122
1
,975
,295
2
,502
,752
6
29,9
71
-
The
colla
tera
l hel
d a
gain
st th
e pa
st d
ue a
nd im
paire
d lo
ans t
otal
led
AED
1,8
76,6
45 th
ousa
nd in
the
form
of u
nder
lien
fixe
d de
posit
s, ca
sh m
argi
ns, e
quiti
es, b
ank
guar
ante
es, m
achi
nery
& e
quip
men
t, m
ortg
aged
pro
pert
ies,
mot
or v
ehicl
es , s
hipp
ing
vess
els,
airc
raft
s etc
.
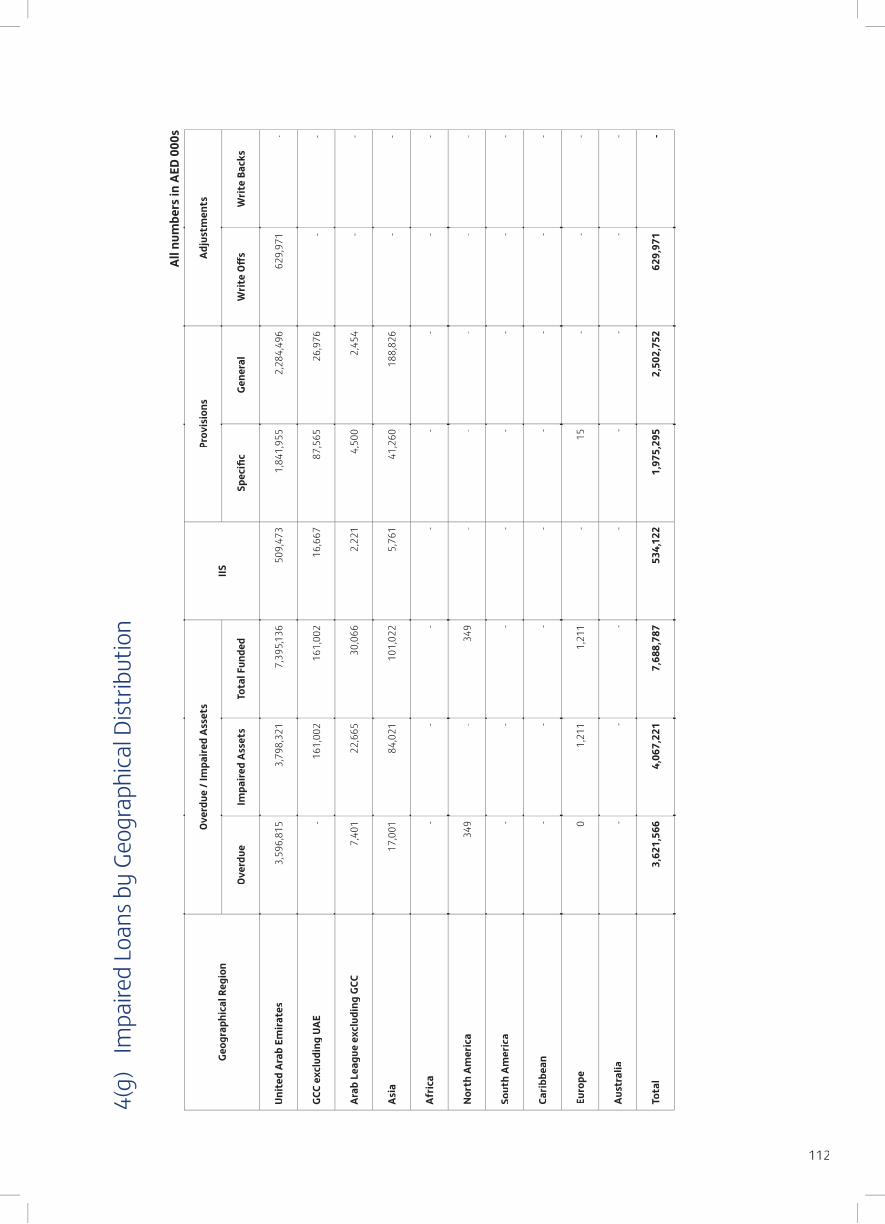
112
4(g)
Im
paire
d Lo
ans b
y Ge
ogra
phica
l Dist
ribut
ion
All n
umbe
rs in
AED
000
s
Geog
raph
ical
Reg
ion
Over
due
/ Im
paire
d As
sets
IIS
Prov
isio
nsAd
just
men
ts
Over
due
Impa
ired
Asse
tsTo
tal F
unde
dSp
ecifi
cGe
nera
lW
rite
Offs
Writ
e Ba
cks
Unit
ed A
rab
Emira
tes
3,5
96,8
15
3,7
98,3
21
7,3
95,13
6 5
09,4
73
1,8
41,9
55
2,2
84,4
96
629
,971
-
GCC
excl
udin
g UA
E -
161
,002
1
61,0
02
16,
667
87,
565
26,
976
- -
Arab
Lea
gue
excl
udin
g GC
C 7
,401
2
2,66
5 3
0,06
6 2
,221
4,5
00
2,4
54
- -
Asia
17,
001
84,0
21
101
,022
5
,761
41
,260
1
88,8
26
- -
Afric
a -
- -
- -
- -
-
Nor
th A
mer
ica
349
-
349
-
- -
- -
Sout
h Am
eric
a -
- -
- -
- -
-
Carib
bean
- -
- -
- -
- -
Euro
pe 0
1
,211
1
,211
-
15
- -
-
Aust
ralia
- -
- -
- -
- -
Tota
l 3
,621
,566
4
,067
,221
7,6
88,7
87 5
34,1
22 1
,975
,295
2,5
02,7
52 6
29,9
71 -

113
4(h)
Re
conc
iliatio
n of
chan
ges i
n Pr
ovisi
ons f
or Im
paire
d Lo
ans
All n
umbe
rs in
AED
000
s
Desc
ripti
on
Open
ing
Bala
nce
of P
rovi
sion
s fo
r Im
paire
d Lo
ans
3,90
5,09
1
Add:
Char
ge fo
r the
yea
r
796,
238
642,
399
Less
:W
rite-
off o
f im
paire
d lo
ans
(629
,971
)
Less
: Re
cove
ry o
f loa
n lo
ss p
rovi
sions
Less
:Re
cove
ry o
f loa
ns p
revi
ously
writ
ten-
off(7
7,21
8)
Less
: No
tiona
l Int
eres
t on
Impa
ired
Loan
s & A
dvan
ces
(158
,493
)
Less
: W
rite-
back
of p
rovi
sions
for l
oans
Adju
stm
ents
of l
oan
loss
pro
visio
ns (a
cqui
red
in b
usin
ess c
ombi
natio
n)
Clos
ing
Bala
nce
of P
rovi
sion
s fo
r Im
paire
d Lo
ans
4,47
8,04
6

114
4(i)
Base
l II P
ortf
olio
as p
er S
tand
ardi
zed
Appr
oach
All n
umbe
rs in
AED
000
s
ASSE
T CLA
SSON
BAL
ANCE
SHE
ETOF
F BA
LANC
E SH
EET
EXPO
SURE
BEFO
RE C
RMAF
TER
CCF*
CRED
IT R
ISK
MIT
IGAT
ION
(CRM
)
RISK
WEI
GHTE
D AS
SETS
See
Base
l II,
June
200
6, P
ara
50
to 8
1, a
nd C
entr
al B
ank
Natio
nal
Disc
retio
ns
GROS
S OU
TSTA
NDIN
G
INTE
REST
INSU
SPEN
SEAN
D SP
ECIF
ICPR
OVIS
IONS
NET
OUTS
TAND
ING
NET E
XPOS
URE
AFTE
R CR
EDIT
CONV
ERSI
ON
FACT
ORS
(CCF
)
CRM
CRM
AFT
ERCC
F
EXPO
SURE
AFTE
R CR
MAN
D CC
F
REDU
CTIO
N IN
RWA
THRO
UGH
GUAR
ANTE
ES
HELD
AS
CRM
CLAI
MS
ON S
OVER
EIGN
S 2
2,09
6,62
8 -
22,
096,
628
1,7
71,7
49
23,
868,
376
- -
23,
868,
376
- 2
,552
,644
CLAI
MS
ON N
ON-C
ENTR
AL
GOVE
RNM
ENT P
UBLI
C SE
CTOR
EN
TITI
ES (P
SEs)
385
,616
-
385
,616
4
,185
389
,801
-
- 3
89,8
01
- -
CLAI
MS
ON M
ULTI
LAT
ERAL
DEVE
LOPM
ENT B
ANKS
- -
- -
- -
- -
- -
CLAI
MS
ON B
ANKS
27,1
48,0
98
- 2
7,148
,098
2
,738
,001
2
9,88
6,09
9 1
34,8
98
76,1
29
29,
809,
969
- 1
3,83
8,90
8
CLAI
MS
ON S
ECUR
ITIE
S FI
RMS
791
,105
- 7
91,10
5 1
69,9
43
961
,048
-
- 9
61,0
48
- 8
84,16
9
CLAI
MS
ON C
ORPO
RATE
S 8
9,20
4,183
-
89,
204,1
83
31,
986,
598
121
,190,
781
11,
579,
268
8,7
98,4
75
112
,392
,306
5
20,9
03
109
,481
,478
CLAI
MS
INCL
UDED
IN TH
ERE
GULA
TORY
RET
AIL P
ORTF
OLIO
33,
010,
960
1
33,
010,
958
251
,558
3
3,26
2,51
7 3
,714
,266
3,
708,1
85
29,5
54,3
32
2,5
01,0
54
24,
635,1
40
CLAI
MS
SECU
RED
BY R
ESID
ENTI
ALPR
OPER
TY 2
0,24
3,56
4 -
20,
243,
564
- 2
0,24
3,56
4 1
7,195
,646
17
,195,
646
3,04
7,91
8 1
3,09
1,96
1 2,
004,
472
CLAI
MS
SECU
RED
BYCO
MM
ERCI
AL R
EAL E
STAT
E 3
,725
,308
-
3,7
25,3
08
- 3
,725
,308
1
87,4
99
187
,499
3
,537
,809
3
2,58
6 3
,558
,540
PAST
DUE
LOAN
S 4
,737
,297
2
,091
,816
2
,645
,481
-
2,6
45,4
81
416
,520
2
,645
,481
1
8,20
0 2
,580
,708
HIGH
ER-R
ISK
CATE
GORI
ES 1
,289
,959
-
1,2
89,9
59
663
,237
1,
953,1
96
- -
1,9
53,19
6 -
2,9
29,7
95
OTHE
R AS
SETS
14,
547,
952
417
,600
14
,130,
353
1,52
8,72
1 1
5,65
9,07
3 -
- 1
5,65
9,07
3 -
5,8
04,11
0
CLAI
MS
ON S
ECUR
ITIS
ED A
SSET
S -
- -
- -
- -
- -
-
CRED
IT D
ERIV
ATIV
ES (B
anks
Selli
ng p
rote
ctio
n) -
- -
- -
- -
- -
-
TOTA
L CLA
IMS
217
,180
,670
2,5
09,4
17 2
14,6
71,2
53 3
9,11
3,99
2 2
53,7
85,2
44 3
3,22
8,09
8 2
9,96
5,93
4 2
23,8
19,3
11 1
6,16
4,70
4 1
68,2
69,9
63
CRM
inclu
des c
olla
tera
l in th
e fo
rm o
f cas
h, e
quiti
es a
nd fi
nanc
ial g
uara
ntee
s

115
5 Ba
sel I
I Por
tfol
io a
s per
Sta
ndar
dize
d Ap
proa
ch (R
ated
/ Un
rate
d)
All n
umbe
rs in
AED
000
s
ASSE
T CLA
SS
ON BA
LANC
E SHE
ETOF
F BAL
ANCE
SHEE
T
EXPO
SURE
BEFO
RE CR
MCR
M AF
TER
CCF
EXPO
SURE
AFTE
R CRM
REDU
CTIO
NIN
RWA
THRO
UGH
GUAR
ANTE
ESHE
LD AS
CRM
RWA
GROS
SNE
TNE
T EXP
OSUR
E AFT
ER CR
EDIT
CONV
ERSIO
N FA
CTOR
S (CC
F)
Tota
lRa
ted
Unrat
edTo
tal
Rate
dUn
rated
Tota
lRa
ted
Unrat
edTo
tal
Tota
lRa
ted
Unrat
edTo
tal
Tota
lRa
ted
Unrat
edTo
tal
CLAI
MS ON
SOVE
REIG
NS22
,096,6
28
19,61
9,174
2,477
,454
22,09
6,628
1,771
,749
-1,7
71,74
921
,390,9
22
2,477
,454
23,86
8,376
-21
,390,9
222,4
77,45
423
,868,3
76-
75,19
9 2,4
77,44
5 2,5
52,64
4
CLAI
MS ON
NON
-CENT
RAL
GOVE
RNME
NT PU
BLIC
SECT
OR
ENTIT
IES (P
SEs)
385,6
1611
2,843
27
2,773
38
5,616
-
4,185
4,185
11
2,843
27
6,958
389,8
01
-11
2,843
276,9
5838
9,801
--
--
CLAI
MS ON
MUL
TI LA
TERA
L DE
VELO
PMEN
T BAN
KS-
--
--
--
--
--
--
--
--
-
CLAI
MS ON
BANK
S27
,148,0
9824
,765,0
23
2,383
,075
27,14
8,098
2,707
,898
30,10
4 2,7
38,00
127
,472,9
20
2,413
,178
29,88
6,099
76,12
9 27
,472,9
202,3
37,04
929
,809,9
69-
12,73
8,070
1,1
00,83
813
,838,9
08
CLAI
MS ON
SECU
RITIES
FIRM
S79
1,105
15
3,758
63
7,346
79
1,105
-
169,9
4316
9,943
15
3,758
80
7,290
96
1,048
-
153,7
5880
7,290
961,0
48-
76,87
9 80
7,290
88
4,169
CLAI
MS ON
CORP
ORAT
ES89
,204,1
83
11,71
0,632
77,49
3,551
89
,204,1
8337
5,273
31
,611,3
24
31,98
6,598
12,08
5,905
10
9,104
,876
121,1
90,78
1 8,7
98,47
5 12
,085,9
0510
0,306
,401
112,3
92,30
652
0,903
8,8
75,90
2 10
0,605
,577
109,4
81,47
8
CLAI
MS IN
CLUD
ED IN
TH
E REG
ULAT
ORY R
ETAI
L PO
RTFO
LIO33
,010,9
60
-33
,010,9
58
33,01
0,958
-
251,5
58
251,5
58
-33
,262,5
17
33,26
2,517
3,708
,185
-29
,554,3
3229
,554,3
322,5
01,05
4 -
24,63
5,140
24
,635,1
40
CLAI
MS SE
CURE
D BY
RESID
ENTIA
L PRO
PERT
Y20
,243,5
64
-20
,243,5
64
20,24
3,564
-
--
-20
,243,5
64
20,24
3,564
17,19
5,646
-
3,047
,918
3,047
,918
13,09
1,961
-
2,004
,472
2,004
,472
CLAI
MS SE
CURE
D BY
COMM
ERCIA
L REA
L EST
ATE
3,725
,308
-3,7
25,30
8 3,7
25,30
8-
--
-3,7
25,30
83,7
25,30
818
7,499
-
3,537
,809
3,537
,809
32,58
6-
3,558
,540
3,558
,540
PAST
DUE L
OANS
4,737
,297
-2,6
45,48
1 2,6
45,48
1-
--
-2,6
45,48
12,6
45,48
1-
-2,6
45,48
12,6
45,48
118
,200
-2,5
80,70
82,5
80,70
8
HIGH
ER-RI
SK CA
TEGO
RIES
1,289
,959
-1,2
89,95
9 1,2
89,95
9-
663,2
37
663,2
37
-1,9
53,19
6 1,9
53,19
6-
-1,9
53,19
61,9
53,19
6-
-2,9
29,79
52,9
29,79
5
OTHE
R ASS
ETS
14,54
7,952
15
5,601
13
,974,7
5114
,130,3
53
1,277
,975
250,7
461,5
28,72
1 1,4
33,57
714
,225,4
97
15,65
9,073
-
1,433
,577
14,22
5,497
15,65
9,073
- -
5,804
,110
5,804
,110
CLAI
MS ON
SECU
RITISE
D AS
SETS
- -
--
--
--
--
--
--
--
--
CRED
IT DE
RIVAT
IVES
(Ban
ks
Sellin
g pro
tect
ion)
- -
--
--
--
--
--
--
--
--
Gran
d Tot
al21
7,180
,670
56,51
7,031
15
8,154
,222
214,6
71,25
36,1
32,89
4 32
,981,0
9739
,113,9
92
62,64
9,925
19
1,135
,319
253,7
85,24
429
,965,9
3462
,649,9
2516
1,169
,385
223,8
19,31
116
,164,7
04
21,76
6,050
14
6,503
,913
168,2
69,96
3
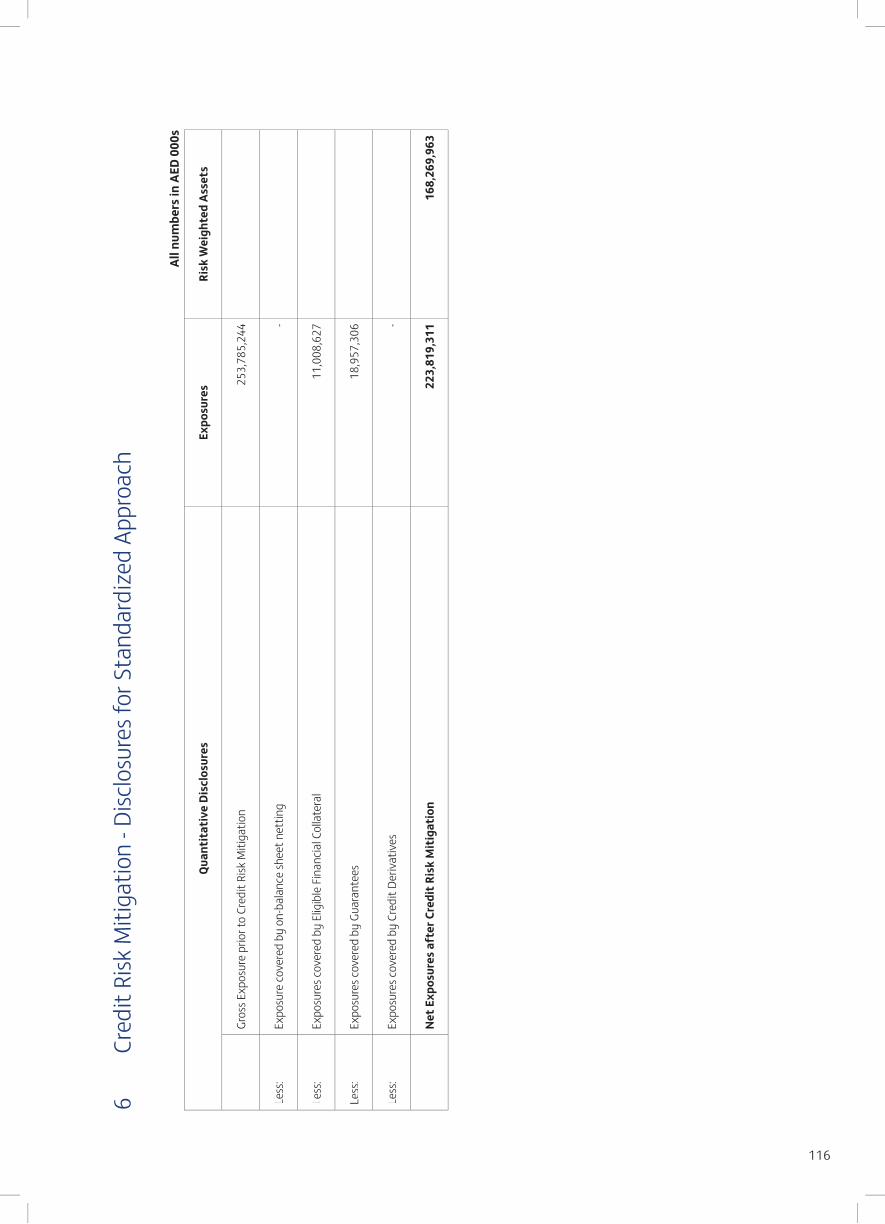
116
6 Cr
edit
Risk
Miti
gatio
n - D
isclo
sure
s for
Sta
ndar
dize
d Ap
proa
ch
All n
umbe
rs in
AED
000
s
Quan
tita
tive
Dis
clos
ures
Expo
sure
s Ri
sk W
eigh
ted
Asse
ts
Gros
s Exp
osur
e pr
ior t
o Cr
edit
Risk
Miti
gatio
n 2
53,7
85,2
44
Less
: Ex
posu
re co
vere
d by
on-
bala
nce
shee
t net
ting
-
Less
: Ex
posu
res c
over
ed b
y El
igib
le F
inan
cial C
olla
tera
l 1
1,00
8,62
7
Less
: Ex
posu
res c
over
ed b
y Gu
aran
tees
18,
957,
306
Less
: Ex
posu
res c
over
ed b
y Cr
edit
Deriv
ativ
es -
Net
Exp
osur
es a
fter
Cre
dit R
isk
Mit
igat
ion
223
,819
,311
168
,269
,963

117
7 Co
unte
rpar
ty C
redi
t Risk
Exp
osur
e
All n
umbe
rs in
AED
000
s
ASSE
T CLA
SS
FX a
nd G
old
IRS
Equi
ties
Prec
ious
Met
al ex
cept
Gol
dCo
mm
oditi
esTR
SCD
S
Gros
sM
TMGr
oss
Cred
it Ex
posu
reGr
oss
MTM
Gros
sCr
edit
Expo
sure
Gros
sM
TMGr
oss
Cred
it Ex
posu
reGr
oss
MTM
Gros
s Cr
edit
Expo
sure
Gros
sM
TMGr
oss
Cred
it Ex
posu
reGr
oss
MTM
Gros
s Cr
edit
Expo
sure
Gros
sM
TMGr
oss
Cred
it Ex
posu
re
CLAI
MS O
N SO
VERE
IGNS
- -
- -
- -
- -
- -
- -
- -
- -
- -
- -
-
CLAI
MS O
N PU
BLIC
SECT
OR
ENTI
TIES
3,28
8,179
16
8,486
217,7
84 1,
288,3
16
67,89
8 77
,376
--
--
--
663,9
76 19
6,532
26
9,018
--
--
--
CLAI
MS O
N M
ULTI
LATE
RAL
DEVE
L OPM
ENT B
ANKS
- -
- -
- -
- -
- -
- -
- -
- -
- -
- -
-
CLAI
MS O
N BA
NKS
43,85
1,610
21
8,254
757,9
80 19
,540,2
63 14
7,278
30
8,810
- -
- -
- -
655,0
07
28,12
4 98
,189
- -
- 18
,365
- 1,
837
CLAI
MS O
N SE
CURI
TIES
FI
RMS
3,20
9,991
2,
448
83,76
5 3,
849,1
08
48,18
7 86
,178
- -
- -
- -
- -
- -
- -
- -
-
CLAI
MS O
N CO
RPOR
ATE
7,61
3,812
33
2,353
501,7
45 6,
082,6
24
130,0
42
189,4
25 -
- -
- -
- 77
1,110
16
8,168
251,1
16 15
3,544
- 15
,354
- -
-
REGU
LATO
RY &
OTH
ER
RETA
IL EX
POSU
RE 54
,972
2,008
2,
558
91,90
3 47
5 91
5 -
- -
- -
- -
- -
- -
- -
- -
RESI
DENT
IAL R
ETAI
LEX
POSU
RE -
- -
- -
- -
- -
- -
- -
- -
- -
- -
- -
COM
MER
CIAL
REA
L EST
ATE
- -
- -
- -
- -
- -
- -
- -
- -
- -
- -
-
PAST
DUE
ASS
ETS
- -
- -
- -
- -
- -
- -
- -
- -
- -
- -
-
HIGH
RIS
K CA
TEGO
RY -
- -
- -
- -
- -
- -
- -
- -
- -
- -
- -
OTHE
R AS
SETS
3,53
5,650
6,
855
42,21
1 2,
182,9
45
- 1,
245
- -
- -
- -
1,39
9,069
7,
694
155,8
14 -
- -
293,6
18 1,
447
30,80
9
CLAI
MS O
N SE
CURI
TISE
DAS
SETS
- -
- -
- -
- -
- -
- -
- -
- -
- -
- -
-
CRED
IT D
ERIV
ATIV
ES
(Ban
ks Se
lling
Pro
tect
ion)
- -
- -
- -
- -
- -
- -
- -
- -
- -
- -
-
GRAN
D TO
TAL
61,5
54,2
14
730,
403
1,60
6,044
33
,035,1
60
393,
881
663,
949
- -
- -
- -
3,48
9,161
400,
519
774,1
37 15
3,54
4 -
15,3
54
311,
983
1,44
7 32
,645

118
8 M
arke
t Risk
- Ca
pita
l Req
uire
men
ts u
nder
Sta
ndar
dize
d Ap
proa
ch
All n
umbe
rs in
AED
000
s
Mar
ket R
isk
Amou
nt
Inte
rest
rate
risk
21,
615
Equi
ty p
ositi
on ri
sk 6
9,58
7
Fore
ign
exch
ange
risk
23,
851
Com
mod
ity ri
sk -
O ptio
ns R
isk 4
87
Tota
l Cap
ital
Req
uire
men
t 1
15,5
39

119
9 Eq
uity
Pos
ition
All n
umbe
rs in
AED
000
s As
at 3
1 De
cem
ber 2
014,
the
bank
›s to
tal e
quity
inve
stm
ent p
ortf
olio
am
ount
ed to
AED
1,7
34 M
, 4.2
% o
f whi
ch re
pres
ents
quo
ted
inve
stm
ents
. For
det
ails
of th
e ac
coun
ting
polic
ies
and
valu
atio
n m
etho
dolo
gy,
plea
se re
fer t
o No
te 2
to th
e co
nsol
idat
ed fi
nanc
ial s
tate
men
ts u
nder
“Sig
nific
ant A
ccou
ntin
g Po
licie
s”. D
etai
ls of
cos
t, m
arke
t and
fair
valu
e ar
e re
port
ed in
Not
e 5
to th
e co
nsol
idat
ed fi
nanc
ial s
tate
men
ts u
nder
“In
vest
men
ts”.
b) Q
uant
itativ
e Di
sclo
sure
s
1. Q
UANT
ITAT
IVE
DETA
ILS
OF E
QUIT
Y PO
SITI
ON:
Type
Curr
ent Y
ear
Prev
ious
Yea
rPu
blic
ly T
rade
dPr
ivat
ely
Held
Pu
blic
ly T
rade
d Pr
ivat
ely
Held
Equ i
ties
72,6
8815
9,80
713
8,55
399
,345
Colle
ctiv
e in
vest
men
t sch
emes
1,50
1,09
81,
556,
877
Any
othe
r inv
estm
ent
Tota
l72
,688
1,66
0,90
513
8,55
31,
656,
222
2. R
EALI
SED,
UNR
EALI
SED
AND
LATE
NT R
EVAL
UATI
ON G
AINS
(LOS
SES)
DUR
ING
THE
YEAR
:
Gain
s (Lo
sses
) Am
ount
Real
ised
gain
s (lo
sses
) fro
m sa
les a
nd liq
uida
tions
120
,556
*Unr
ealis
ed g
ains
(los
ses)
reco
gnise
d in
the
bala
nce
shee
t but
not
thro
ugh
profi
t and
loss
acc
ount
61,
393
**La
tent
reva
luat
ion
gain
s (lo
sses
) for
inve
stm
ent r
ecor
ded
at co
st b
ut n
ot re
cogn
ised
in b
alan
ce sh
eet o
r pro
fit a
nd lo
ss a
ccou
nt
Tota
l 1
81,9
49
3. IT
EMS
IN (2
) ABO
VE IN
CLUD
ED IN
TIE
R 1/
TIER
2 C
APIT
AL:
Tier
Cap
ital
Amou
ntAm
ount
inclu
ded
in T
ier I
capi
tal
120
,556
Amou
nt in
clude
d in
Tie
r II c
apita
l 2
7,62
7
Tota
l 1
48,1
83
4. C
APIT
AL R
EQUI
REM
ENTS
BY
EQUI
TY G
ROUP
INGS
:
Grou
ping
Am
ount
Stra
tegi
c inv
estm
ents
Avai
labl
e fo
r sal
e25
0,63
6
Held
for t
radi
ng46
,391
Tota
l cap
ital
requ
irem
ent
297,
026

120
10
Inte
rest
Rat
e Ri
sk in
the
Bank
ing
Book
Inte
rest
rate
risk
aris
es fr
om th
e po
ssib
ility
that
cha
nges
in in
tere
st ra
tes w
ill aff
ect f
utur
e ca
sh fl
ows o
r the
fair
valu
es o
f fina
ncia
l inst
rum
ents
. The
Ban
k is
expo
sed
to in
tere
st ra
te ri
sk a
s a
resu
lt of
mism
atch
es o
r gap
s in
the
amou
nts o
f int
eres
t rat
e se
nsiti
ve a
sset
s and
inte
rest
rate
sens
itive
liabi
litie
s and
off
bal
ance
shee
t ins
trum
ents
that
mat
ure
or re
price
in a
giv
en p
erio
d.
Inte
rest
rate
risk
s in
the
Bank
are
man
a ged
und
er a
fram
ewor
k co
mpr
ising
Risk
Gov
erna
nce
and
Risk
App
etite
. The
Risk
Gov
erna
nce
inclu
des t
he A
LM p
olicy
(app
rove
d by
the
Boar
d) w
ithin
th
e am
bit o
f ERM
pol
icy fr
amew
ork.
The
Ban
k us
es a
com
bina
tion
of d
urat
ion
gap
anal
ysis
and
scen
ario
ana
lysis
per
tain
ing
to im
pact
of c
hang
es in
inte
rest
rate
s on
Net I
nter
est I
ncom
e an
d Va
lue
of E
quity
to m
anag
e th
ese
risks
whi
ch a
re re
view
ed a
nd m
onito
red
by A
LCO.
Inte
rest
rate
risk
is a
lso a
sses
sed
by m
easu
ring
the
impa
ct o
f defi
ned
mov
emen
ts in
inte
rest
yie
ld cu
rves
on
the
Bank
’s ne
t int
eres
t inc
ome.
The
follo
win
g im
pact
on
the
net i
nter
est i
ncom
e an
d re
gula
tory
capi
tal is
for t
he y
ear i
n ca
se o
f an
imm
edia
te a
nd p
erm
anen
t mov
emen
t in
inte
rest
yie
ld cu
rves
.
All n
umbe
rs in
AED
000
s
Shif
t in
Yiel
d Cu
rves
N
et In
tere
st In
com
e Re
gula
tory
Cap
ital
+200
bas
is po
int
261
,027
(4
27,18
5)
- 200
bas
is po
int
(261
,027
) 4
27,18
5

121

122

123
A. 2014/2015 Financial Calendar
Date Event
23/04/2014 Q1’2014 Results Publication
22/07/2014 H1’2014 Results Publication
27/10/2014 9M’2014 Results Publication
19/11/2014 FGB Analyst & Investor Day 2014 (Abu Dhabi)
28/01/2015 2014 Full Year Results Publication
25/02/2015 2014 Annual General Meeting
05/03/2015 Ex-Dividend Date
B. FGB Share Information
Listing date 2002
Exchange Abu Dhabi
Symbol FGB
ISIN AEF000201010
Number of shares outstanding 3,900,000,000
Closing Price as of Dec 31st, 2014 AED 17.0
Market cap as of Dec 31st, 2014 AED 66.3Bn (USD 18.0Bn)
Foreign Ownership Limit 25%
C. Ownership Structure as of December-end 2014
As of 31 December 2014, FGB’s share capital stood at AED 3,900,000,000 divided into 3,900,000,000 shares at AED 1 each.
Supplementary Shareholder Information
UAEcompanies
andindividuals
86.4%
ForeignInvestors
9.8%
GCC (ex-UAE)3.8%
*FGB’s Foreign Ownership Limit (FOL) is at 25%
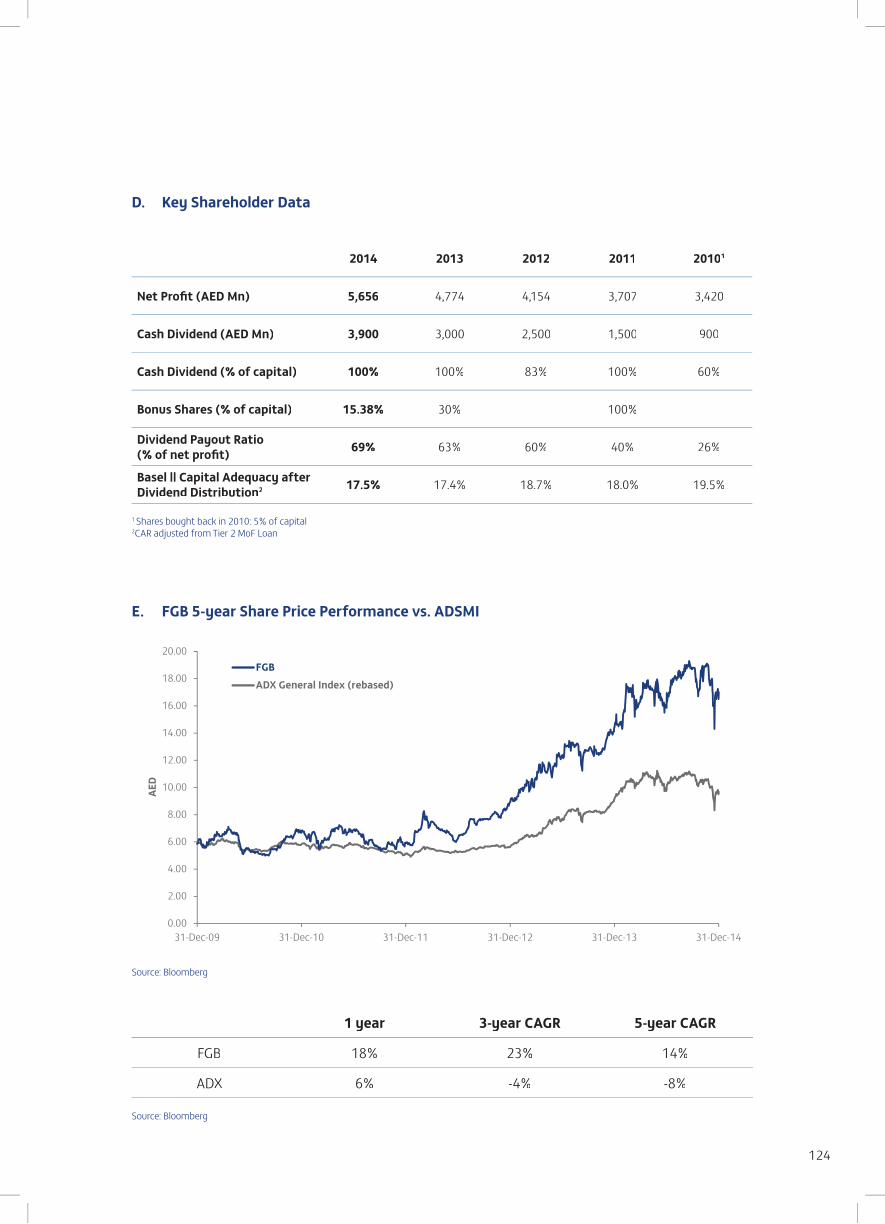
124
D. Key Shareholder Data
2014 2013 2012 2011 20101
Net Profit (AED Mn) 5,656 4,774 4,154 3,707 3,420
Cash Dividend (AED Mn) 3,900 3,000 2,500 1,500 900
Cash Dividend (% of capital) 100% 100% 83% 100% 60%
Bonus Shares (% of capital) 15.38% 30% - 100% -
Dividend Payout Ratio(% of net profit) 69% 63% 60% 40% 26%
Basel || Capital Adequacy afterDividend Distribution2 17.5% 17.4% 18.7% 18.0% 19.5%
1 Shares bought back in 2010: 5% of capital2CAR adjusted from Tier 2 MoF Loan
E. FGB 5-year Share Price Performance vs. ADSMI
0.00
2.00
4.00
6.00
8.00
10.00
12.00
14.00
16.00
18.00
20.00
31-Dec-09 31-Dec-10 31-Dec-11 31-Dec-12 31-Dec-13 31-Dec-14
AED
FGBADX General Index (rebased)
Source: Bloomberg
1 year 3-year CAGR 5-year CAGR
FGB 18% 23% 14%
ADX 6% -4% -8%
Source: Bloomberg

125


