
International Journal of Environmental Protection and Policy 2016; 4(1): 10-15 Published online February 16, 2016 (http://www.sciencepublishinggroup.com/j/ijepp) doi: 10.11648/j.ijepp.20160401.12 ISSN: 2330-7528 (Print); ISSN: 2330-7536 (Online)
Flare Gas Gathering and Utilization: A Strategic Approach to Greenhouse Gas Emission Reduction in Nigeria
Yobo Moses Tambari1, Sornaate Lucky Easy
2, Akpan Paul Paulinus
2
1Ministry of Education, Port Harcourt, Nigeria, West Africa 2Department of Civil Engineering, Ken Saro-Wiwa Polytechnic, Rivers State, Bori-Ogoni, Nigeria, West Africa
Email address: [email protected] (Y. M. Tambari), [email protected] (S. L. Easy), [email protected] (A. P. Paulinus)
To cite this article: Yobo Moses Tambari, Sornaate Lucky Easy, Akpan Paul Paulinus. Flare Gas Gathering and Utilization: A Strategic Approach to Greenhouse
Gas Emission Reduction in Nigeria. International Journal of Environmental Protection and Policy. Vol. 4, No. 1, 2016, pp. 10-15.
doi: 10.11648/j.ijepp.20160401.12
Abstract: Apart from contributing to greenhouse gas emission, flared gases create trade-off emissions such as carbon (iv)
oxide (CO2), methane (CH4), nitrogen oxides (NOX), sulphur oxides (SOX) and water vapour. The impact of such flared gases
is of both local and global concern. Therefore, the purpose of the present study is to review current literature on gas gathering
and utilization and to determine the most efficient and economic means of harnessing flared gases in order to contribute to the
attainment of the “no routine flare” policy of government and reduce greenhouse gas emission. In this paper, analysis is made
of energy and gas flaring trends in Nigeria by examining available data with a view to understanding the possible impact of the
recovered gas on gas supply in the country. A comparison of traditional gas gathering technologies to gas ejector technology is
also made. This study found that despite efforts to reduce gas flaring in Nigeria, about 81% of gas flared in the last 6 years is
from Service Contract (SC), Sole Risks/Independent (SR/I) and Marginal Fields (MF) companies most likely because of the
high cost of investment in gas gathering utilities and lack of market for gas and gas products. Thus, this paper identifies gas
ejector technology as a viable compression equipment to cut compression costs. Given the current excess gas capacity of the
country and the Nigerian power market which is currently undersupplied and generates significant greenhouse gases (GHGs),
this paper recommends the use of the recovered flare gas for power generation, which will not only directly help to reduce
Nigeria’s contribution to GHG emission from flaring, but also substantially help to cut down her overall emission level mainly
from the industrial use of fossil fuel for power generation and wood fuel for heating.
Keywords: Gas Ejector, Gas Gathering, Greenhouse Gas Emission, Flare Gas, Climate Change
1. Introduction
The emission of greenhouse gases (GHGs) especially
carbon dioxide (CO2) has been reported to be the major factor
behind recently observed changes in climate extremes such as
storms, floods, and heat waves as well as increasing global
temperatures and rising sea levels. Gas flaring impacts climate
change by adding about 400 million tons of CO2 in annual
emissions [1]. In Nigeria, gas flaring has been a major means
through which green houses gases (GHGs) are released into
the atmosphere. Carbon dioxide emissions especially in the
Niger Delta are among the highest in the world [2].
Though the emission level in Nigeria is not so significant
on a global scale, however, international cooperation is
required to effectively mitigate GHG emissions and address
other climate change issues [3]. Thus, a number of efforts
targeted at zero routine gas flaring have been made including
the Federal Government’s “no routine flare” deadline of
December 2010 (which was not achieved), expansion of the
local gas market via the National Independent Power Projects
(NIPP) and the development of Associated Gas Gathering
(AGG) Projects for gathering associated gas to a processing
and treatment facility or gas pipeline system.
Despite these efforts, flaring has continued in the country.
The main challenges amongst others include:
� The variable volume and low pressure (usually near
atmospheric) of separated associated gas due to
significant pressure reduction in the separators in order
to achieve maximum oil recovery and stabilisation.
� The cost of compression requirement for gathering
these low pressure gases for flaring reduction projects
especially for marginal fields and
International Journal of Environmental Protection and Policy 2016; 4(1): 10-15 11
� The lack of gas and gas products market given the
already surplus gas capacity of the country.
Therefore, this research work is a review of current
literature on the application of gas ejectors (claimed to be
economical for pressure recovery) to the recovery of
marginal and low pressure (LP) flared gases in order to
reduce GHG emissions, improve sustainable development
and increase revenue.
2. Literature Review of Crude Oil
Processing
Petroleum reservoirs contain natural gas formed as a gas
cap trapped between the petroleum and an impervious
capping rock layer. Under the very high pressure conditions
usually found in the reservoir, the gas is mixed with or
dissolved in the crude oil (known as associated gas) and
always accompany oil production as a by-product.
During oil production at the production platform, the
reservoir fluid (oil, gas, water and sediments) flows out into
the well-bore and is channelled into production separators
located at the flow station to remove high and low pressure
gases from the oil [4]. On leaving the production separators,
the oil and the remaining gas in solution is directed to the
surge tank where the gas remaining in oil is separated near
sea level pressure [5]. The separated gas collected from the
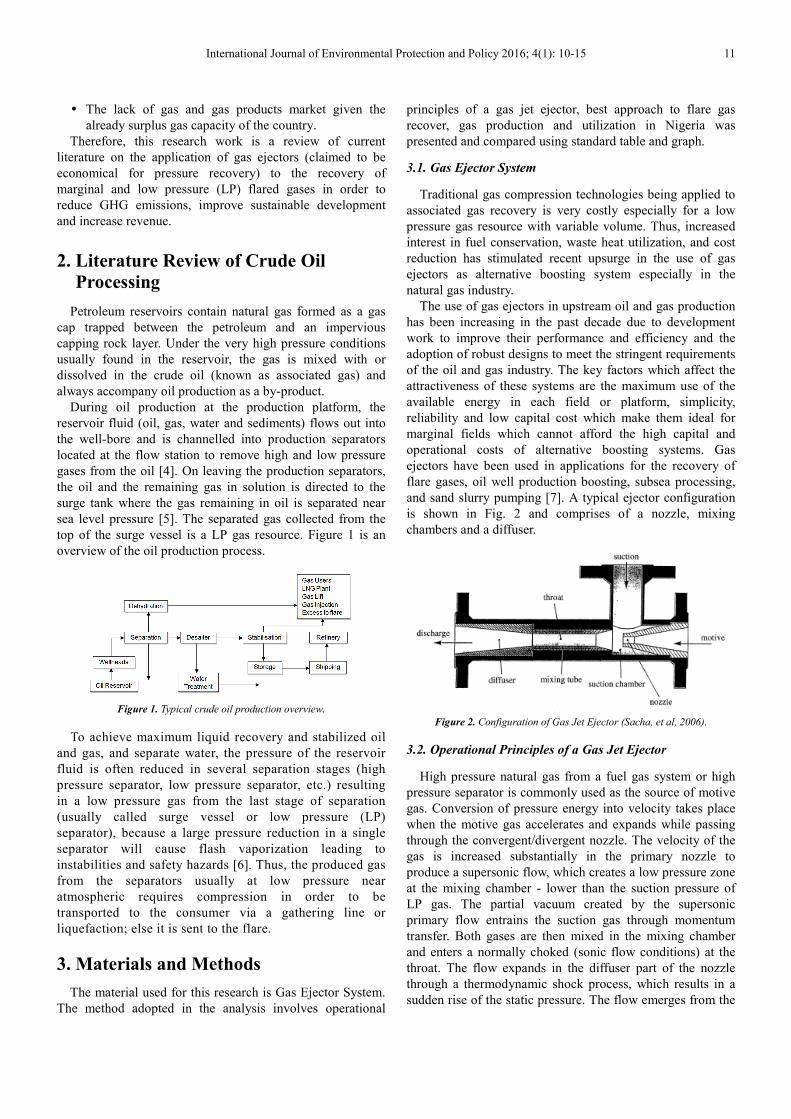
top of the surge vessel is a LP gas resource. Figure 1 is an
overview of the oil production process.
Figure 1. Typical crude oil production overview.
To achieve maximum liquid recovery and stabilized oil
and gas, and separate water, the pressure of the reservoir
fluid is often reduced in several separation stages (high
pressure separator, low pressure separator, etc.) resulting
in a low pressure gas from the last stage of separation
(usually called surge vessel or low pressure (LP)
separator), because a large pressure reduction in a single
separator will cause flash vaporization leading to
instabilities and safety hazards [6]. Thus, the produced gas
from the separators usually at low pressure near
atmospheric requires compression in order to be
transported to the consumer via a gathering line or
liquefaction; else it is sent to the flare.
3. Materials and Methods
The material used for this research is Gas Ejector System.
The method adopted in the analysis involves operational
principles of a gas jet ejector, best approach to flare gas
recover, gas production and utilization in Nigeria was
presented and compared using standard table and graph.
3.1. Gas Ejector System
Traditional gas compression technologies being applied to
associated gas recovery is very costly especially for a low
pressure gas resource with variable volume. Thus, increased
interest in fuel conservation, waste heat utilization, and cost
reduction has stimulated recent upsurge in the use of gas
ejectors as alternative boosting system especially in the
natural gas industry.
The use of gas ejectors in upstream oil and gas production
has been increasing in the past decade due to development
work to improve their performance and efficiency and the
adoption of robust designs to meet the stringent requirements
of the oil and gas industry. The key factors which affect the
attractiveness of these systems are the maximum use of the
available energy in each field or platform, simplicity,
reliability and low capital cost which make them ideal for
marginal fields which cannot afford the high capital and
operational costs of alternative boosting systems. Gas
ejectors have been used in applications for the recovery of
flare gases, oil well production boosting, subsea processing,
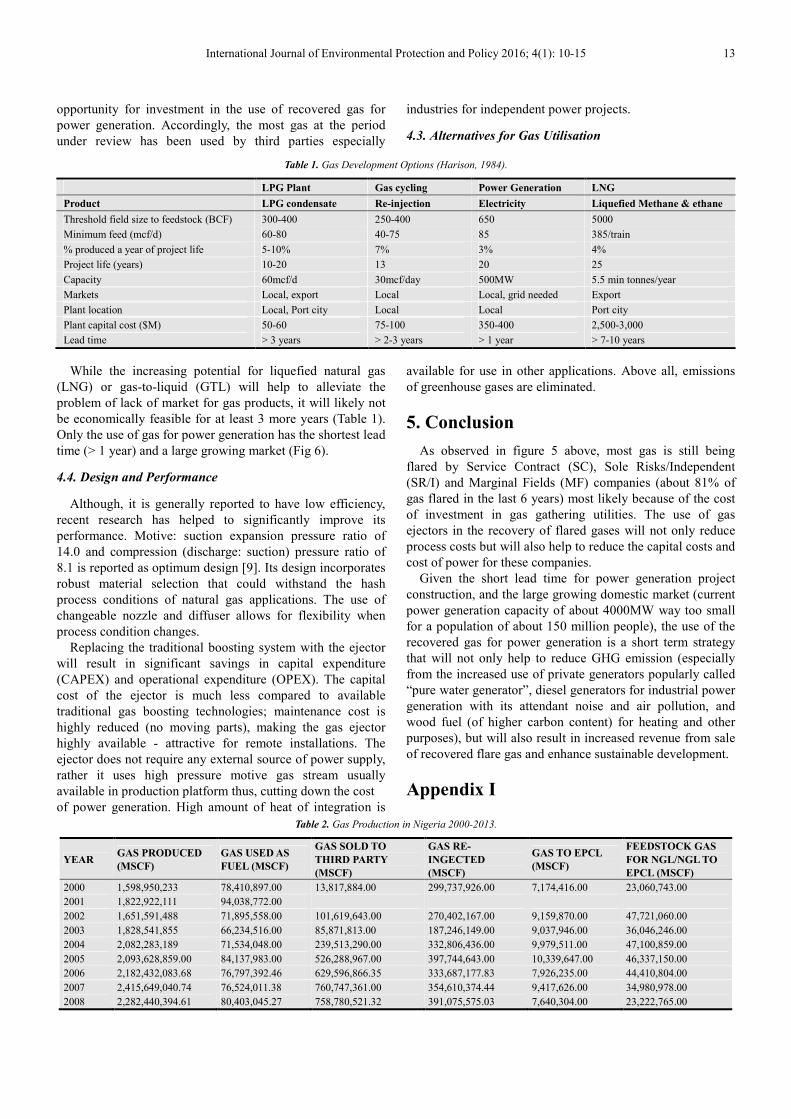
and sand slurry pumping [7]. A typical ejector configuration
is shown in Fig. 2 and comprises of a nozzle, mixing
chambers and a diffuser.
Figure 2. Configuration of Gas Jet Ejector (Sacha, et al, 2006).
3.2. Operational Principles of a Gas Jet Ejector
High pressure natural gas from a fuel gas system or high
pressure separator is commonly used as the source of motive
gas. Conversion of pressure energy into velocity takes place
when the motive gas accelerates and expands while passing
through the convergent/divergent nozzle. The velocity of the
gas is increased substantially in the primary nozzle to
produce a supersonic flow, which creates a low pressure zone
at the mixing chamber - lower than the suction pressure of
LP gas. The partial vacuum created by the supersonic
primary flow entrains the suction gas through momentum
transfer. Both gases are then mixed in the mixing chamber
and enters a normally choked (sonic flow conditions) at the
throat. The flow expands in the diffuser part of the nozzle
through a thermodynamic shock process, which results in a
sudden rise of the static pressure. The flow emerges from the

12 Yobo Moses Tambari et al.: Flare Gas Gathering and Utilization: A Strategic Approach to Greenhouse Gas Emission Reduction in Nigeria
shock wave with subsonic velocity and pressure recovery.
The mixture is further compressed in the diffuser to an
intermediate pressure level between HP and LP pressures.
3.3. Approach to Flare Gas Recovery
A 2-stage gas ejector system designed to suck the low
pressure (LP) and surge vessel (SV) gases is installed after
the LP and SV separators respectively (fig. 3) to compress
the SV gas to LP gas and LP gas to HP, which will meet the
pipeline sale gas pressure of 70 bars. The discharge gases
from the SV and LP ejector is refluxed to their respective
suction streams to help accommodate changes in process gas
condition.
Figure 3. Flare Gas recovery Scheme.
The gas ejector system uses high pressure motive gas from
the compressor turbine stream of the fuel gas system. This
ensures that the pressure of the motive gas is fairly stable.
4. Results and Discussion
Gas production and utilization in Nigeria extracted from
NNPC Annual Statistical Bulletin, 2000-2013, the Nigeria
gas market and alternatives for gas utilization are presented.
The design and performance of gas injector system is also
discussed.
4.1. Gas Production and Utilisation in Nigeria (2000-2013)
Figure 4. Gas Production in Nigeria (2000-2013)*.
When crude oil production started in 1958, the quantity of
associated gas produced along with it was considered
insignificant and apart from a small proportion used to run
some equipment and facilities, majority of the gas produced
was flared. Over the years, there has been a growing
utilisation of natural gas in the country (figure 4).
Figure 5. Trend in Gas Flaring (2000-2013)*.
Figure 6. Average Gas Flaring by Company Type (2009-2013)**.
*: Based on data extracted from NNPCAnnual Statistical Bulletin, 2000-
2013 See Appendix III.
**: Based on data extracted from NNPCAnnual Statistical Bulletin, 2000-
2013 See Appendix III.
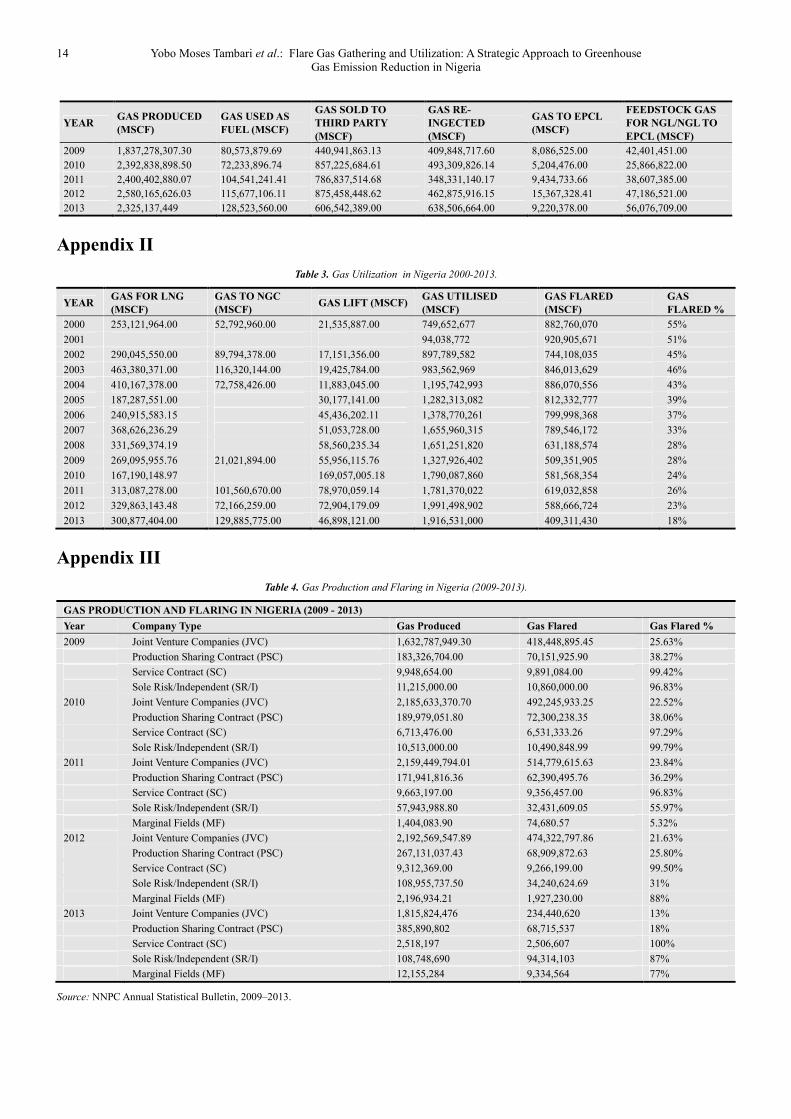
Figure 5 indicates that gas flaring in the country has
greatly reduced. However, the amount of gas flared by
service contract (SC), Sole Risk/Independent (SR/I) and
Marginal Fields (MF) companies have not changed much.
Apart from the use of produced gas for fuel, the only other
use of the produced gas by these companies was for sale to
third parties (NNPC ASB, 2009-2013). The cost of
investment in gas gathering equipment may be a big
contributing factor.
4.2. The Nigeria Gas Market
Figure 7. Percentage Gas Utilisation (2000-2013)*.
* Based on data extracted from NNPC Annual Statistical Bulletin, 2000-
2013 See Appendix I and II.
The above figure shows that there exist a significant
International Journal of Environmental Protection and Policy 2016; 4(1): 10-15 13
opportunity for investment in the use of recovered gas for
power generation. Accordingly, the most gas at the period
under review has been used by third parties especially
industries for independent power projects.
4.3. Alternatives for Gas Utilisation
Table 1. Gas Development Options (Harison, 1984).
LPG Plant Gas cycling Power Generation LNG
Product LPG condensate Re-injection Electricity Liquefied Methane & ethane
Threshold field size to feedstock (BCF) 300-400 250-400 650 5000
Minimum feed (mcf/d) 60-80 40-75 85 385/train
% produced a year of project life 5-10% 7% 3% 4%
Project life (years) 10-20 13 20 25
Capacity 60mcf/d 30mcf/day 500MW 5.5 min tonnes/year
Markets Local, export Local Local, grid needed Export
Plant location Local, Port city Local Local Port city
Plant capital cost ($M) 50-60 75-100 350-400 2,500-3,000
Lead time > 3 years > 2-3 years > 1 year > 7-10 years
While the increasing potential for liquefied natural gas
(LNG) or gas-to-liquid (GTL) will help to alleviate the
problem of lack of market for gas products, it will likely not
be economically feasible for at least 3 more years (Table 1).
Only the use of gas for power generation has the shortest lead
time (> 1 year) and a large growing market (Fig 6).
4.4. Design and Performance
Although, it is generally reported to have low efficiency,
recent research has helped to significantly improve its
performance. Motive: suction expansion pressure ratio of
14.0 and compression (discharge: suction) pressure ratio of
8.1 is reported as optimum design [9]. Its design incorporates
robust material selection that could withstand the hash
process conditions of natural gas applications. The use of
changeable nozzle and diffuser allows for flexibility when
process condition changes.
Replacing the traditional boosting system with the ejector
will result in significant savings in capital expenditure
(CAPEX) and operational expenditure (OPEX). The capital
cost of the ejector is much less compared to available
traditional gas boosting technologies; maintenance cost is
highly reduced (no moving parts), making the gas ejector
highly available - attractive for remote installations. The
ejector does not require any external source of power supply,
rather it uses high pressure motive gas stream usually
available in production platform thus, cutting down the cost
of power generation. High amount of heat of integration is
available for use in other applications. Above all, emissions
of greenhouse gases are eliminated.
5. Conclusion
As observed in figure 5 above, most gas is still being
flared by Service Contract (SC), Sole Risks/Independent
(SR/I) and Marginal Fields (MF) companies (about 81% of
gas flared in the last 6 years) most likely because of the cost
of investment in gas gathering utilities. The use of gas
ejectors in the recovery of flared gases will not only reduce
process costs but will also help to reduce the capital costs and
cost of power for these companies.
Given the short lead time for power generation project
construction, and the large growing domestic market (current
power generation capacity of about 4000MW way too small
for a population of about 150 million people), the use of the
recovered gas for power generation is a short term strategy
that will not only help to reduce GHG emission (especially
from the increased use of private generators popularly called
“pure water generator”, diesel generators for industrial power
generation with its attendant noise and air pollution, and
wood fuel (of higher carbon content) for heating and other
purposes), but will also result in increased revenue from sale
of recovered flare gas and enhance sustainable development.
Appendix I
Table 2. Gas Production in Nigeria 2000-2013.
YEAR GAS PRODUCED
(MSCF)
GAS USED AS
FUEL (MSCF)
GAS SOLD TO
THIRD PARTY
(MSCF)
GAS RE-
INGECTED
(MSCF)
GAS TO EPCL
(MSCF)
FEEDSTOCK GAS
FOR NGL/NGL TO
EPCL (MSCF)
2000 1,598,950,233 78,410,897.00 13,817,884.00 299,737,926.00 7,174,416.00 23,060,743.00
2001 1,822,922,111 94,038,772.00
2002 1,651,591,488 71,895,558.00 101,619,643.00 270,402,167.00 9,159,870.00 47,721,060.00
2003 1,828,541,855 66,234,516.00 85,871,813.00 187,246,149.00 9,037,946.00 36,046,246.00
2004 2,082,283,189 71,534,048.00 239,513,290.00 332,806,436.00 9,979,511.00 47,100,859.00
2005 2,093,628,859.00 84,137,983.00 526,288,967.00 397,744,643.00 10,339,647.00 46,337,150.00
2006 2,182,432,083.68 76,797,392.46 629,596,866.35 333,687,177.83 7,926,235.00 44,410,804.00
2007 2,415,649,040.74 76,524,011.38 760,747,361.00 354,610,374.44 9,417,626.00 34,980,978.00
2008 2,282,440,394.61 80,403,045.27 758,780,521.32 391,075,575.03 7,640,304.00 23,222,765.00
14 Yobo Moses Tambari et al.: Flare Gas Gathering and Utilization: A Strategic Approach to Greenhouse Gas Emission Reduction in Nigeria
YEAR GAS PRODUCED
(MSCF)
GAS USED AS
FUEL (MSCF)
GAS SOLD TO
THIRD PARTY
(MSCF)
GAS RE-
INGECTED
(MSCF)
GAS TO EPCL
(MSCF)
FEEDSTOCK GAS
FOR NGL/NGL TO
EPCL (MSCF)
2009 1,837,278,307.30 80,573,879.69 440,941,863.13 409,848,717.60 8,086,525.00 42,401,451.00
2010 2,392,838,898.50 72,233,896.74 857,225,684.61 493,309,826.14 5,204,476.00 25,866,822.00
2011 2,400,402,880.07 104,541,241.41 786,837,514.68 348,331,140.17 9,434,733.66 38,607,385.00
2012 2,580,165,626.03 115,677,106.11 875,458,448.62 462,875,916.15 15,367,328.41 47,186,521.00
2013 2,325,137,449 128,523,560.00 606,542,389.00 638,506,664.00 9,220,378.00 56,076,709.00
Appendix II
Table 3. Gas Utilization in Nigeria 2000-2013.
YEAR GAS FOR LNG
(MSCF)
GAS TO NGC
(MSCF) GAS LIFT (MSCF)
GAS UTILISED
(MSCF)
GAS FLARED
(MSCF)
GAS
FLARED %
2000 253,121,964.00 52,792,960.00 21,535,887.00 749,652,677 882,760,070 55%
2001 94,038,772 920,905,671 51%
2002 290,045,550.00 89,794,378.00 17,151,356.00 897,789,582 744,108,035 45%
2003 463,380,371.00 116,320,144.00 19,425,784.00 983,562,969 846,013,629 46%
2004 410,167,378.00 72,758,426.00 11,883,045.00 1,195,742,993 886,070,556 43%
2005 187,287,551.00 30,177,141.00 1,282,313,082 812,332,777 39%
2006 240,915,583.15 45,436,202.11 1,378,770,261 799,998,368 37%
2007 368,626,236.29 51,053,728.00 1,655,960,315 789,546,172 33%
2008 331,569,374.19 58,560,235.34 1,651,251,820 631,188,574 28%
2009 269,095,955.76 21,021,894.00 55,956,115.76 1,327,926,402 509,351,905 28%
2010 167,190,148.97 169,057,005.18 1,790,087,860 581,568,354 24%
2011 313,087,278.00 101,560,670.00 78,970,059.14 1,781,370,022 619,032,858 26%
2012 329,863,143.48 72,166,259.00 72,904,179.09 1,991,498,902 588,666,724 23%
2013 300,877,404.00 129,885,775.00 46,898,121.00 1,916,531,000 409,311,430 18%
Appendix III
Table 4. Gas Production and Flaring in Nigeria (2009-2013).
GAS PRODUCTION AND FLARING IN NIGERIA (2009 - 2013)
Year Company Type Gas Produced Gas Flared Gas Flared %
2009 Joint Venture Companies (JVC) 1,632,787,949.30 418,448,895.45 25.63%
Production Sharing Contract (PSC) 183,326,704.00 70,151,925.90 38.27%
Service Contract (SC) 9,948,654.00 9,891,084.00 99.42%
Sole Risk/Independent (SR/I) 11,215,000.00 10,860,000.00 96.83%
2010 Joint Venture Companies (JVC) 2,185,633,370.70 492,245,933.25 22.52%
Production Sharing Contract (PSC) 189,979,051.80 72,300,238.35 38.06%
Service Contract (SC) 6,713,476.00 6,531,333.26 97.29%
Sole Risk/Independent (SR/I) 10,513,000.00 10,490,848.99 99.79%
2011 Joint Venture Companies (JVC) 2,159,449,794.01 514,779,615.63 23.84%
Production Sharing Contract (PSC) 171,941,816.36 62,390,495.76 36.29%
Service Contract (SC) 9,663,197.00 9,356,457.00 96.83%
Sole Risk/Independent (SR/I) 57,943,988.80 32,431,609.05 55.97%
Marginal Fields (MF) 1,404,083.90 74,680.57 5.32%
2012 Joint Venture Companies (JVC) 2,192,569,547.89 474,322,797.86 21.63%
Production Sharing Contract (PSC) 267,131,037.43 68,909,872.63 25.80%
Service Contract (SC) 9,312,369.00 9,266,199.00 99.50%
Sole Risk/Independent (SR/I) 108,955,737.50 34,240,624.69 31%
Marginal Fields (MF) 2,196,934.21 1,927,230.00 88%
2013 Joint Venture Companies (JVC) 1,815,824,476 234,440,620 13%
Production Sharing Contract (PSC) 385,890,802 68,715,537 18%
Service Contract (SC) 2,518,197 2,506,607 100%
Sole Risk/Independent (SR/I) 108,748,690 94,314,103 87%
Marginal Fields (MF) 12,155,284 9,334,564 77%
Source: NNPC Annual Statistical Bulletin, 2009–2013.
International Journal of Environmental Protection and Policy 2016; 4(1): 10-15 15
References
[1] http://go.worldbank.org/016TLXI7N0.
[2] Ugwuoke P. E., Agwunobi U. C., Aliyu A. O. (2012). Renewable Energy as a Climate Change Mitigation Strategy in Nigeria. International Journal of Environmental Sciences, Volume 3, No 1, 11-19.
[3] IPCC, 2014: Summary for Policymakers, In: Climate Change 2014, Mitigation of Climate Change. Contribution of Working Group III to the Fifth Assessment Report of the Intergovernmental Panel on Climate Change [Edenhofer, O., R. Pichs-Madruga, Y. Sokona, E. Farahani, S. Kadner, K. Seyboth, A. Adler, I. Baum, S. Brunner, P. Eickemeier, B. Kriemann, J. Savolainen, S. Schlömer, C. von Stechow, T. Zwickel and J. C. Minx (eds.)]. Cambridge University Press, Cambridge, United Kingdom and New York, NY, USA
[4] Haung B. J., Jiang C. B. and Fu F. L. (1985). Ejector Performance Characteristics and Design Analysis of Jet Refrigeration System. ASME Journal of Engineering for Gas Turbines and Power, Vol. 107,* 792-802.
[5] Iamashita, E. K., Galaxe, F. and Arica, J. (April,2008). A Planning Model for Offshore Natural Gas Transmission. Pesquisa Operacional. Janeiro.
[6] Devold, H. (2006) An Introduction to Oil and Gas. Oil and Gas Production Handbook, ABB, Oslo .
[7] Kamal, B., John, G., & Hasan, I. (2008, January 14). Supersonic Ejector Captures, Reinjects Leaked Vent Gases. Oil & Gas Journal, 54.
[8] NNPC, (2000-2013). Annual Statistical Bulletin.
[9] Sarshar, M. M., (April, 1999). The Esso Energy Award Lecture, 1998, Boosting Production from Low-Pressure Oil and Gas Fields: A Revolution in Hydrocarbon Production. The Royal Society, London. Vol. 357, 921 – 941.


