Download - Florida - Manatee Clerk
Manatee CountyFlorida
Interim Financial Statements
JULY 31, 2019 & 2018
UNAUDITED
Unaudited
Clerk of the Circuit Court and Comptroller
Manatee County, Florida
Interim Financial Statements
For the Ten Month Periods
Prepared by the Office of the Clerk of the Circuit Court
Angelina "Angel" Colonneso
Ended July 31, 2019 and 2018
83% Year to Date

TABLE OF CONTENTS
Page
GOVERNMENT WIDE STATEMENTSStatement of Net Position 1Statement of Activities 2
GOVERNMENTAL ACTIVITIESBalance Sheet 3Statement of Governmental Fund Revenues, Expenditures and Changes
in Fund Balances / Statement of Activities 4General Fund Statement of Revenues, Expenditures and Changes
in Fund Balances - Budget to Actual and Prior Year Actual 5Highway Special Revenue Fund Statement of Revenues, Expenditures and
Changes in Fund Balances - Budget to Actual and Prior Year Actual 6
BUSINESS-TYPE ACTIVITIESStatement of Net Position 7Statement of Revenues, Expenses and Changes
in Fund Net Position 8Statement of Cash Flows 9Statement of Revenues, Expenses and Changes in Fund
Net Position - Budget to Actual and Prior Year Actual:Water and Sewer 10Port Authority 11Solid Waste 12Transit System 13Stormwater 14Civic Center 15
Revenue Bond Coverage - Public Utilities System and Port Authority 16
INTERNAL SERVICE FUNDSStatement of Net Position 17Statement of Revenues, Expenses and Changes
in Fund Net Position 18Statement of Cash Flows 19
UNAUDITED
MANATEE COUNTY, FLORIDAINTERIM FINANCIAL STATEMENTS
ENDED JULY 31, 2019 AND 2018FOR THE TEN MONTH PERIODS
2019 2018
Total Total (1)
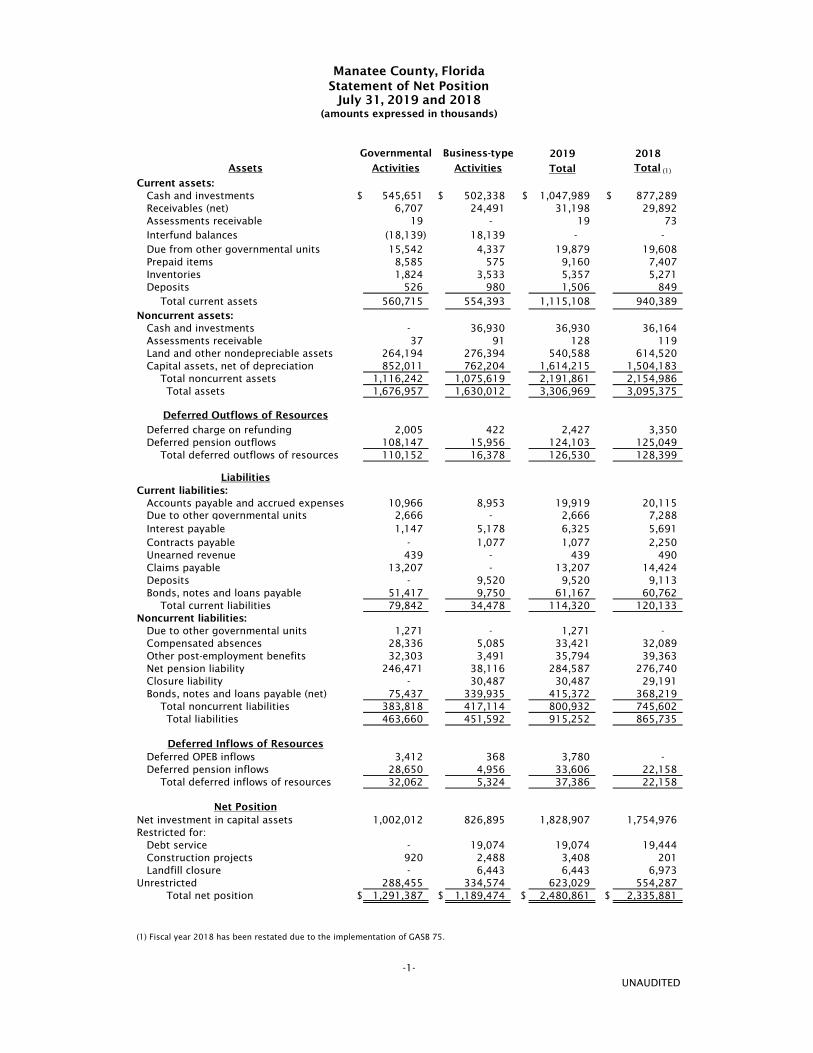
Current assets:Cash and investments $ 545,651 $ 502,338 $ 1,047,989 $ 877,289 Receivables (net) 6,707 24,491 31,198 29,892 Assessments receivable 19 - 19 73 Interfund balances (18,139) 18,139 - - Due from other governmental units 15,542 4,337 19,879 19,608 Prepaid items 8,585 575 9,160 7,407 Inventories 1,824 3,533 5,357 5,271 Deposits 526 980 1,506 849
Total current assets 560,715 554,393 1,115,108 940,389 Noncurrent assets:
Cash and investments - 36,930 36,930 36,164 Assessments receivable 37 91 128 119 Land and other nondepreciable assets 264,194 276,394 540,588 614,520 Capital assets, net of depreciation 852,011 762,204 1,614,215 1,504,183
Total noncurrent assets 1,116,242 1,075,619 2,191,861 2,154,986 Total assets 1,676,957 1,630,012 3,306,969 3,095,375
Deferred charge on refunding 2,005 422 2,427 3,350 Deferred pension outflows 108,147 15,956 124,103 125,049
Total deferred outflows of resources 110,152 16,378 126,530 128,399
Current liabilities:Accounts payable and accrued expenses 10,966 8,953 19,919 20,115 Due to other governmental units 2,666 - 2,666 7,288 Interest payable 1,147 5,178 6,325 5,691 Contracts payable - 1,077 1,077 2,250 Unearned revenue 439 - 439 490 Claims payable 13,207 - 13,207 14,424 Deposits - 9,520 9,520 9,113 Bonds, notes and loans payable 51,417 9,750 61,167 60,762
Total current liabilities 79,842 34,478 114,320 120,133 Noncurrent liabilities:
Due to other governmental units 1,271 - 1,271 - Compensated absences 28,336 5,085 33,421 32,089 Other post-employment benefits 32,303 3,491 35,794 39,363 Net pension liability 246,471 38,116 284,587 276,740 Closure liability - 30,487 30,487 29,191 Bonds, notes and loans payable (net) 75,437 339,935 415,372 368,219
Total noncurrent liabilities 383,818 417,114 800,932 745,602 Total liabilities 463,660 451,592 915,252 865,735
Deferred OPEB inflows 3,412 368 3,780 - Deferred pension inflows 28,650 4,956 33,606 22,158
Total deferred inflows of resources 32,062 5,324 37,386 22,158
Net investment in capital assets 1,002,012 826,895 1,828,907 1,754,976 Restricted for: Debt service - 19,074 19,074 19,444
Construction projects 920 2,488 3,408 201 Landfill closure - 6,443 6,443 6,973
Unrestricted 288,455 334,574 623,029 554,287 Total net position $ 1,291,387 $ 1,189,474 $ 2,480,861 $ 2,335,881
(1) Fiscal year 2018 has been restated due to the implementation of GASB 75.
UNAUDITED
Manatee County, FloridaStatement of Net Position
July 31, 2019 and 2018
Activities
Governmental Business-type
(amounts expressed in thousands)
-1-
Net Position
Liabilities
ActivitiesAssets
Deferred Outflows of Resources
Deferred Inflows of Resources
CapitalCharges for Grants and 2019 2018
Expenses Services Activities Activities Total Total (1)
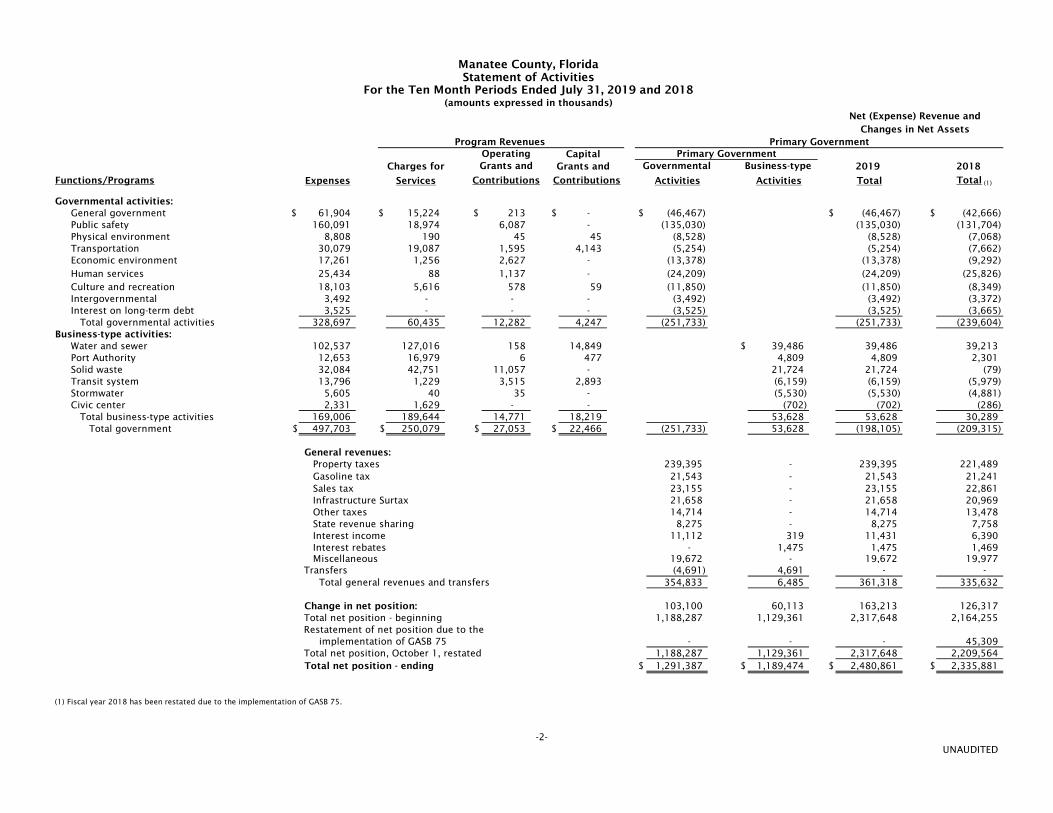
Governmental activities:General government $ 61,904 $ 15,224 $ 213 $ - $ (46,467) $ (46,467) $ (42,666) Public safety 160,091 18,974 6,087 - (135,030) (135,030) (131,704) Physical environment 8,808 190 45 45 (8,528) (8,528) (7,068) Transportation 30,079 19,087 1,595 4,143 (5,254) (5,254) (7,662) Economic environment 17,261 1,256 2,627 - (13,378) (13,378) (9,292) Human services 25,434 88 1,137 - (24,209) (24,209) (25,826) Culture and recreation 18,103 5,616 578 59 (11,850) (11,850) (8,349) Intergovernmental 3,492 - - - (3,492) (3,492) (3,372) Interest on long-term debt 3,525 - - - (3,525) (3,525) (3,665) Total governmental activities 328,697 60,435 12,282 4,247 (251,733) (251,733) (239,604)
Business-type activities:Water and sewer 102,537 127,016 158 14,849 $ 39,486 39,486 39,213 Port Authority 12,653 16,979 6 477 4,809 4,809 2,301 Solid waste 32,084 42,751 11,057 - 21,724 21,724 (79) Transit system 13,796 1,229 3,515 2,893 (6,159) (6,159) (5,979) Stormwater 5,605 40 35 - (5,530) (5,530) (4,881) Civic center 2,331 1,629 - - (702) (702) (286) Total business-type activities 169,006 189,644 14,771 18,219 53,628 53,628 30,289
Total government $ 497,703 $ 250,079 $ 27,053 $ 22,466 (251,733) 53,628 (198,105) (209,315)
General revenues: Property taxes 239,395 - 239,395 221,489 Gasoline tax 21,543 - 21,543 21,241 Sales tax 23,155 - 23,155 22,861 Infrastructure Surtax 21,658 - 21,658 20,969 Other taxes 14,714 - 14,714 13,478 State revenue sharing 8,275 - 8,275 7,758 Interest income 11,112 319 11,431 6,390 Interest rebates - 1,475 1,475 1,469 Miscellaneous 19,672 - 19,672 19,977 Transfers (4,691) 4,691 - - Total general revenues and transfers 354,833 6,485 361,318 335,632
Change in net position: 103,100 60,113 163,213 126,317 Total net position - beginning 1,188,287 1,129,361 2,317,648 2,164,255 Restatement of net position due to the implementation of GASB 75 - - - 45,309 Total net position, October 1, restated 1,188,287 1,129,361 2,317,648 2,209,564 Total net position - ending $ 1,291,387 $ 1,189,474 $ 2,480,861 $ 2,335,881
(1) Fiscal year 2018 has been restated due to the implementation of GASB 75.
UNAUDITED
Manatee County, FloridaStatement of Activities
For the Ten Month Periods Ended July 31, 2019 and 2018(amounts expressed in thousands)
Primary Government Program Revenues
Net (Expense) Revenue andChanges in Net Assets
Operating Primary Government
Functions/Programs
-2-
Grants and
Contributions Contributions
Governmental Business-type
Impact Fees 2019 2018Statement of Statement of
Fund Total Net Position Net Position (1)
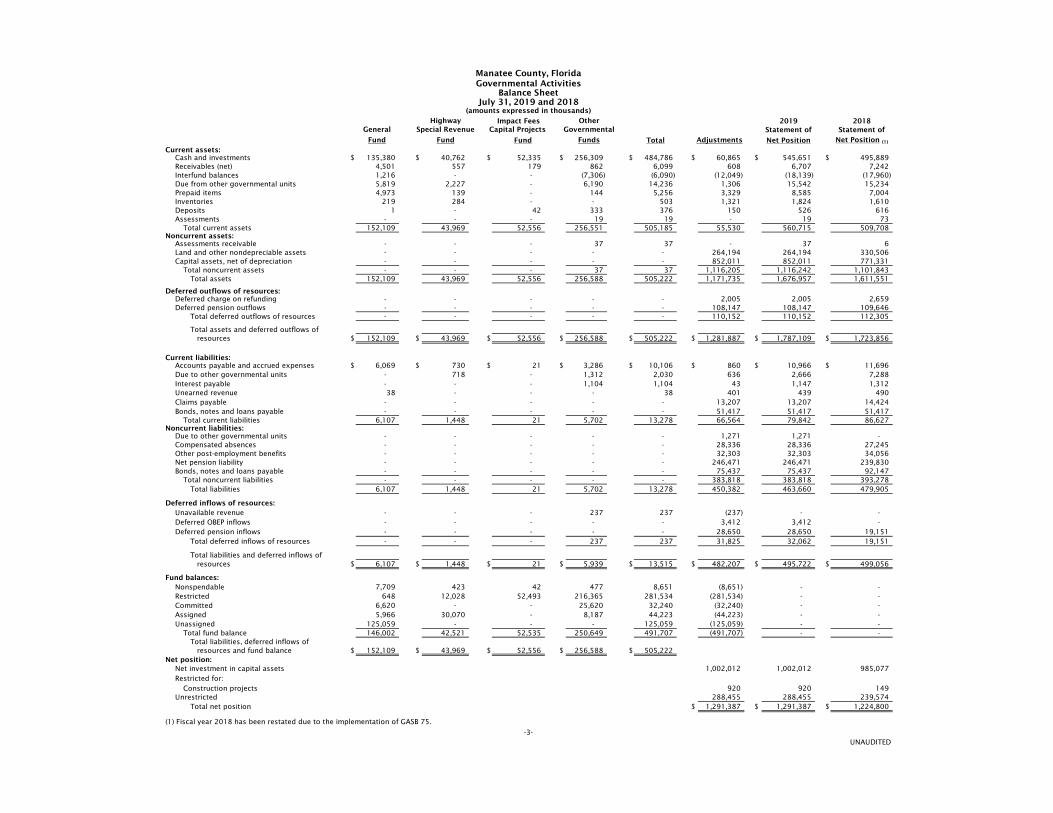
Current assets:Cash and investments $ 135,380 $ 40,762 $ 52,335 $ 256,309 $ 484,786 $ 60,865 $ 545,651 $ 495,889 Receivables (net) 4,501 557 179 862 6,099 608 6,707 7,242 Interfund balances 1,216 - - (7,306) (6,090) (12,049) (18,139) (17,960) Due from other governmental units 5,819 2,227 - 6,190 14,236 1,306 15,542 15,234 Prepaid items 4,973 139 - 144 5,256 3,329 8,585 7,004 Inventories 219 284 - - 503 1,321 1,824 1,610 Deposits 1 - 42 333 376 150 526 616 Assessments - - - 19 19 - 19 73
Total current assets 152,109 43,969 52,556 256,551 505,185 55,530 560,715 509,708 Noncurrent assets:
Assessments receivable - - - 37 37 - 37 6 Land and other nondepreciable assets - - - - - 264,194 264,194 330,506 Capital assets, net of depreciation - - - - - 852,011 852,011 771,331
Total noncurrent assets - - - 37 37 1,116,205 1,116,242 1,101,843 Total assets 152,109 43,969 52,556 256,588 505,222 1,171,735 1,676,957 1,611,551
Deferred outflows of resources:Deferred charge on refunding - - - - - 2,005 2,005 2,659 Deferred pension outflows - - - - - 108,147 108,147 109,646
Total deferred outflows of resources - - - - - 110,152 110,152 112,305
Total assets and deferred outflows of resources $ 152,109 $ 43,969 $ 52,556 $ 256,588 $ 505,222 $ 1,281,887 $ 1,787,109 $ 1,723,856
Current liabilities: Accounts payable and accrued expenses $ 6,069 $ 730 $ 21 $ 3,286 $ 10,106 $ 860 $ 10,966 $ 11,696 Due to other governmental units - 718 - 1,312 2,030 636 2,666 7,288 Interest payable - - - 1,104 1,104 43 1,147 1,312 Unearned revenue 38 - - - 38 401 439 490 Claims payable - - - - - 13,207 13,207 14,424 Bonds, notes and loans payable - - - - - 51,417 51,417 51,417
Total current liabilities 6,107 1,448 21 5,702 13,278 66,564 79,842 86,627 Noncurrent liabilities:
Due to other governmental units - - - - - 1,271 1,271 - Compensated absences - - - - - 28,336 28,336 27,245 Other post-employment benefits - - - - - 32,303 32,303 34,056 Net pension liability - - - - - 246,471 246,471 239,830 Bonds, notes and loans payable - - - - - 75,437 75,437 92,147
Total noncurrent liabilities - - - - - 383,818 383,818 393,278 Total liabilities 6,107 1,448 21 5,702 13,278 450,382 463,660 479,905
Deferred inflows of resources:Unavailable revenue - - - 237 237 (237) - - Deferred OBEP inflows - - - - - 3,412 3,412 - Deferred pension inflows - - - - - 28,650 28,650 19,151
Total deferred inflows of resources - - - 237 237 31,825 32,062 19,151
Total liabilities and deferred inflows of resources $ 6,107 $ 1,448 $ 21 $ 5,939 $ 13,515 $ 482,207 $ 495,722 $ 499,056
Fund balances:Nonspendable 7,709 423 42 477 8,651 (8,651) - - Restricted 648 12,028 52,493 216,365 281,534 (281,534) - - Committed 6,620 - - 25,620 32,240 (32,240) - - Assigned 5,966 30,070 - 8,187 44,223 (44,223) - - Unassigned 125,059 - - - 125,059 (125,059) - -
Total fund balance 146,002 42,521 52,535 250,649 491,707 (491,707) - - Total liabilities, deferred inflows of resources and fund balance $ 152,109 $ 43,969 $ 52,556 $ 256,588 $ 505,222
Net position:Net investment in capital assets 1,002,012 1,002,012 985,077 Restricted for:
Construction projects 920 920 149 Unrestricted 288,455 288,455 239,574
Total net position $ 1,291,387 $ 1,291,387 $ 1,224,800
(1) Fiscal year 2018 has been restated due to the implementation of GASB 75.
UNAUDITED
Governmental ActivitiesManatee County, Florida
Capital ProjectsGeneral Special RevenueHighway Other
July 31, 2019 and 2018
-3-
FundFund
Balance Sheet
(amounts expressed in thousands)
Funds
Governmental
Adjustments
Impact Fees 2019 2018General Capital Projects Statement Statement
Fund Fund Total of Activities of Activities (1)
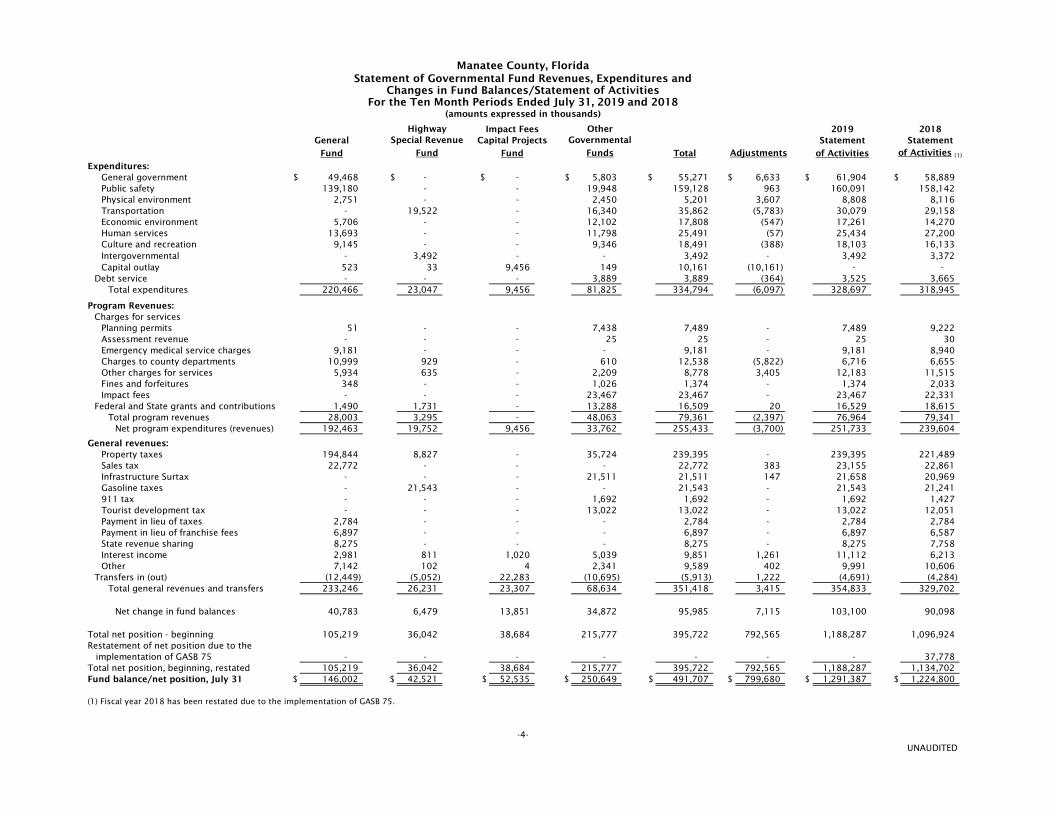
Expenditures:General government $ 49,468 $ - $ - $ 5,803 $ 55,271 $ 6,633 $ 61,904 $ 58,889 Public safety 139,180 - - 19,948 159,128 963 160,091 158,142 Physical environment 2,751 - - 2,450 5,201 3,607 8,808 8,116 Transportation - 19,522 - 16,340 35,862 (5,783) 30,079 29,158 Economic environment 5,706 - - 12,102 17,808 (547) 17,261 14,270 Human services 13,693 - - 11,798 25,491 (57) 25,434 27,200 Culture and recreation 9,145 - - 9,346 18,491 (388) 18,103 16,133 Intergovernmental - 3,492 - - 3,492 - 3,492 3,372 Capital outlay 523 33 9,456 149 10,161 (10,161) - -
Debt service - - - 3,889 3,889 (364) 3,525 3,665 Total expenditures 220,466 23,047 9,456 81,825 334,794 (6,097) 328,697 318,945
Program Revenues:Charges for services
Planning permits 51 - - 7,438 7,489 - 7,489 9,222 Assessment revenue - - - 25 25 - 25 30 Emergency medical service charges 9,181 - - - 9,181 - 9,181 8,940 Charges to county departments 10,999 929 - 610 12,538 (5,822) 6,716 6,655 Other charges for services 5,934 635 - 2,209 8,778 3,405 12,183 11,515 Fines and forfeitures 348 - - 1,026 1,374 - 1,374 2,033 Impact fees - - - 23,467 23,467 - 23,467 22,331
Federal and State grants and contributions 1,490 1,731 - 13,288 16,509 20 16,529 18,615 Total program revenues 28,003 3,295 - 48,063 79,361 (2,397) 76,964 79,341
Net program expenditures (revenues) 192,463 19,752 9,456 33,762 255,433 (3,700) 251,733 239,604
General revenues:Property taxes 194,844 8,827 - 35,724 239,395 - 239,395 221,489 Sales tax 22,772 - - - 22,772 383 23,155 22,861 Infrastructure Surtax - - - 21,511 21,511 147 21,658 20,969 Gasoline taxes - 21,543 - - 21,543 - 21,543 21,241 911 tax - - - 1,692 1,692 - 1,692 1,427 Tourist development tax - - - 13,022 13,022 - 13,022 12,051 Payment in lieu of taxes 2,784 - - - 2,784 - 2,784 2,784 Payment in lieu of franchise fees 6,897 - - - 6,897 - 6,897 6,587 State revenue sharing 8,275 - - - 8,275 - 8,275 7,758 Interest income 2,981 811 1,020 5,039 9,851 1,261 11,112 6,213 Other 7,142 102 4 2,341 9,589 402 9,991 10,606
Transfers in (out) (12,449) (5,052) 22,283 (10,695) (5,913) 1,222 (4,691) (4,284) Total general revenues and transfers 233,246 26,231 23,307 68,634 351,418 3,415 354,833 329,702
Net change in fund balances 40,783 6,479 13,851 34,872 95,985 7,115 103,100 90,098
Total net position - beginning 105,219 36,042 38,684 215,777 395,722 792,565 1,188,287 1,096,924 Restatement of net position due to the implementation of GASB 75 - - - - - - - 37,778 Total net position, beginning, restated 105,219 36,042 38,684 215,777 395,722 792,565 1,188,287 1,134,702 Fund balance/net position, July 31 $ 146,002 $ 42,521 $ 52,535 $ 250,649 $ 491,707 $ 799,680 $ 1,291,387 $ 1,224,800
(1) Fiscal year 2018 has been restated due to the implementation of GASB 75.
UNAUDITED
Manatee County, Florida
-4-
FundsFund Adjustments
For the Ten Month Periods Ended July 31, 2019 and 2018Changes in Fund Balances/Statement of Activities
(amounts expressed in thousands)
Statement of Governmental Fund Revenues, Expenditures and
GovernmentalOther
Special RevenueHighway
(Continued)% of % of
Adopted Amended Amended 2018 Adopted Amended Amended 2018Budget Budget Actual Budget Actual Budget Budget Actual Budget Actual
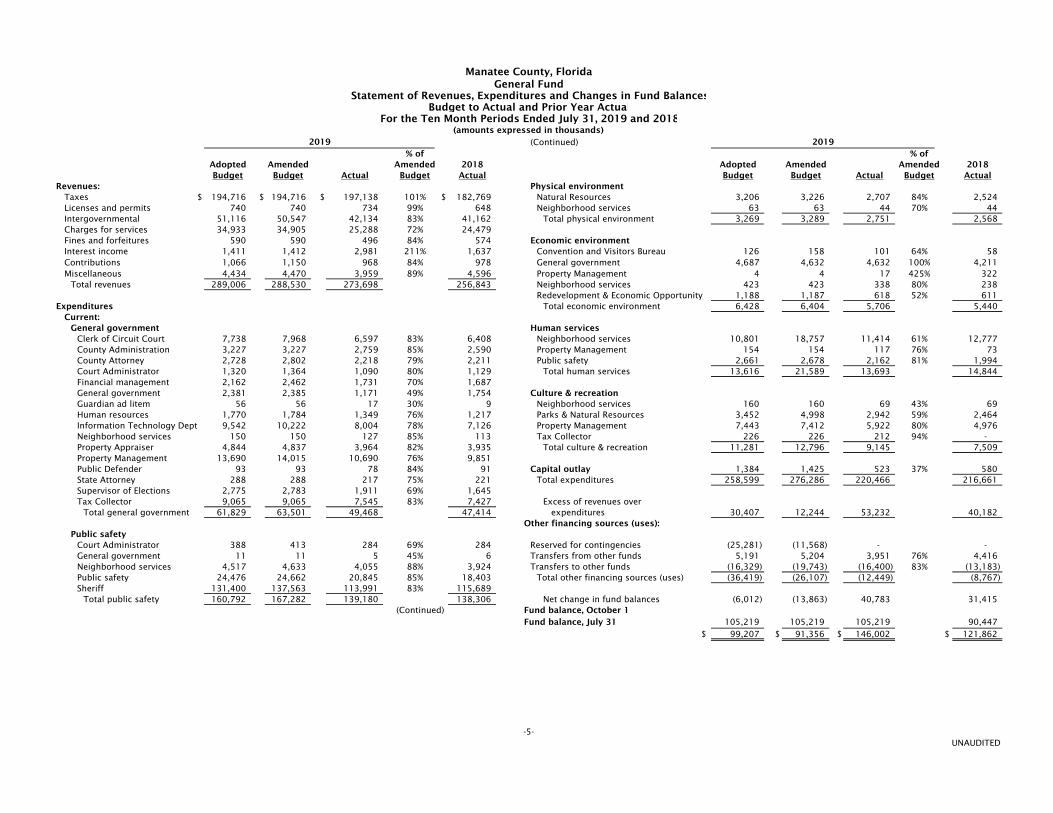
Revenues: Physical environmentTaxes $ 194,716 $ 194,716 $ 197,138 101% $ 182,769 Natural Resources 3,206 3,226 2,707 84% 2,524 Licenses and permits 740 740 734 99% 648 Neighborhood services 63 63 44 70% 44 Intergovernmental 51,116 50,547 42,134 83% 41,162 Total physical environment 3,269 3,289 2,751 2,568 Charges for services 34,933 34,905 25,288 72% 24,479 Fines and forfeitures 590 590 496 84% 574 Economic environmentInterest income 1,411 1,412 2,981 211% 1,637 Convention and Visitors Bureau 126 158 101 64% 58 Contributions 1,066 1,150 968 84% 978 General government 4,687 4,632 4,632 100% 4,211 Miscellaneous 4,434 4,470 3,959 89% 4,596 Property Management 4 4 17 425% 322
Total revenues 289,006 288,530 273,698 256,843 Neighborhood services 423 423 338 80% 238 Redevelopment & Economic Opportunity 1,188 1,187 618 52% 611
Expenditures Total economic environment 6,428 6,404 5,706 5,440 Current:
General government Human servicesClerk of Circuit Court 7,738 7,968 6,597 83% 6,408 Neighborhood services 10,801 18,757 11,414 61% 12,777 County Administration 3,227 3,227 2,759 85% 2,590 Property Management 154 154 117 76% 73 County Attorney 2,728 2,802 2,218 79% 2,211 Public safety 2,661 2,678 2,162 81% 1,994 Court Administrator 1,320 1,364 1,090 80% 1,129 Total human services 13,616 21,589 13,693 14,844 Financial management 2,162 2,462 1,731 70% 1,687 General government 2,381 2,385 1,171 49% 1,754 Culture & recreationGuardian ad litem 56 56 17 30% 9 Neighborhood services 160 160 69 43% 69 Human resources 1,770 1,784 1,349 76% 1,217 Parks & Natural Resources 3,452 4,998 2,942 59% 2,464 Information Technology Dept 9,542 10,222 8,004 78% 7,126 Property Management 7,443 7,412 5,922 80% 4,976 Neighborhood services 150 150 127 85% 113 Tax Collector 226 226 212 94% - Property Appraiser 4,844 4,837 3,964 82% 3,935 Total culture & recreation 11,281 12,796 9,145 7,509 Property Management 13,690 14,015 10,690 76% 9,851 Public Defender 93 93 78 84% 91 Capital outlay 1,384 1,425 523 37% 580 State Attorney 288 288 217 75% 221 Total expenditures 258,599 276,286 220,466 216,661 Supervisor of Elections 2,775 2,783 1,911 69% 1,645 Tax Collector 9,065 9,065 7,545 83% 7,427 Excess of revenues over
Total general government 61,829 63,501 49,468 47,414 expenditures 30,407 12,244 53,232 40,182 Other financing sources (uses):
Public safetyCourt Administrator 388 413 284 69% 284 Reserved for contingencies (25,281) (11,568) - - General government 11 11 5 45% 6 Transfers from other funds 5,191 5,204 3,951 76% 4,416 Neighborhood services 4,517 4,633 4,055 88% 3,924 Transfers to other funds (16,329) (19,743) (16,400) 83% (13,183) Public safety 24,476 24,662 20,845 85% 18,403 Total other financing sources (uses) (36,419) (26,107) (12,449) (8,767) Sheriff 131,400 137,563 113,991 83% 115,689
Total public safety 160,792 167,282 139,180 138,306 Net change in fund balances (6,012) (13,863) 40,783 31,415 (Continued) Fund balance, October 1
Fund balance, July 31 105,219 105,219 105,219 90,447 $ 99,207 $ 91,356 $ 146,002 $ 121,862
UNAUDITED
Manatee County, Florida
20192019
-5-
General FundStatement of Revenues, Expenditures and Changes in Fund Balances
Budget to Actual and Prior Year ActualFor the Ten Month Periods Ended July 31, 2019 and 2018
(amounts expressed in thousands)
% ofAdopted Amended Amended 2018Budget Budget Actual Budget Actual
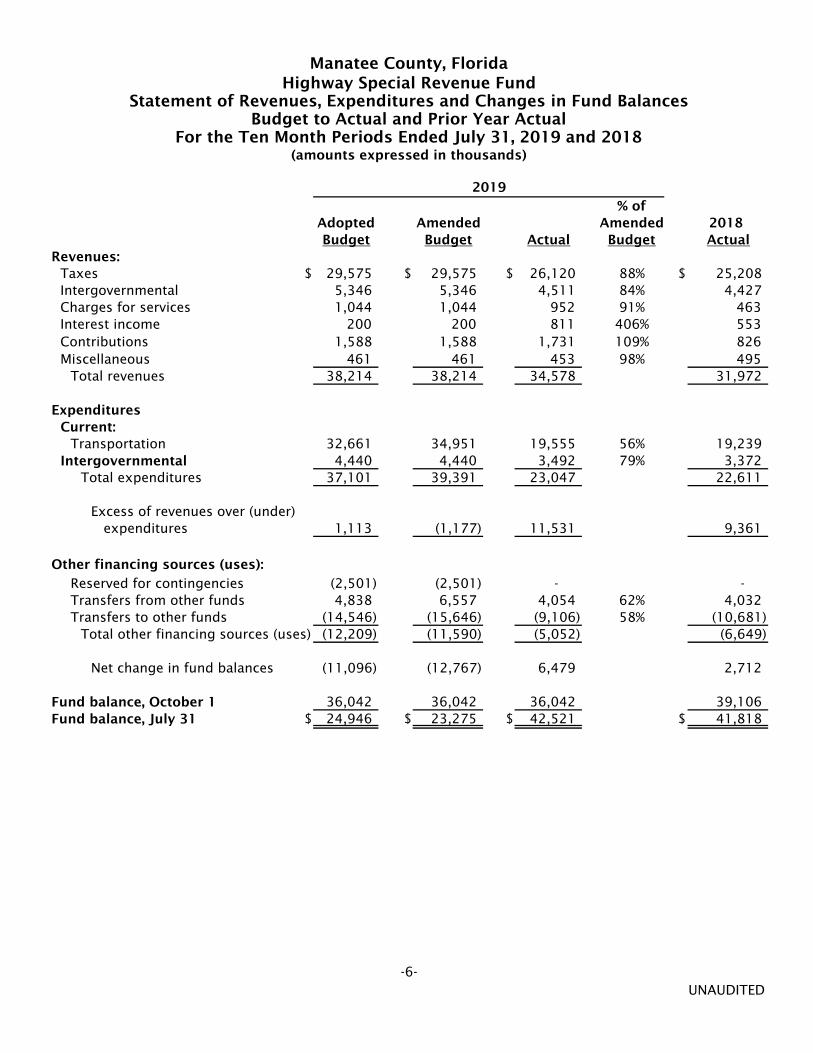
Revenues:Taxes $ 29,575 $ 29,575 $ 26,120 88% $ 25,208 Intergovernmental 5,346 5,346 4,511 84% 4,427 Charges for services 1,044 1,044 952 91% 463 Interest income 200 200 811 406% 553 Contributions 1,588 1,588 1,731 109% 826 Miscellaneous 461 461 453 98% 495
Total revenues 38,214 38,214 34,578 31,972
ExpendituresCurrent:
Transportation 32,661 34,951 19,555 56% 19,239 Intergovernmental 4,440 4,440 3,492 79% 3,372
Total expenditures 37,101 39,391 23,047 22,611
Excess of revenues over (under) expenditures 1,113 (1,177) 11,531 9,361
Other financing sources (uses):
Reserved for contingencies (2,501) (2,501) - - Transfers from other funds 4,838 6,557 4,054 62% 4,032 Transfers to other funds (14,546) (15,646) (9,106) 58% (10,681)
Total other financing sources (uses) (12,209) (11,590) (5,052) (6,649)
Net change in fund balances (11,096) (12,767) 6,479 2,712
Fund balance, October 1 36,042 36,042 36,042 39,106 Fund balance, July 31 $ 24,946 $ 23,275 $ 42,521 $ 41,818
UNAUDITED
Manatee County, Florida
-6-
Highway Special Revenue Fund
(amounts expressed in thousands)For the Ten Month Periods Ended July 31, 2019 and 2018
Budget to Actual and Prior Year ActualStatement of Revenues, Expenditures and Changes in Fund Balances
2019
2019 2018Water Port Solid Transit Civic
and Sewer Waste System Stormwater Center
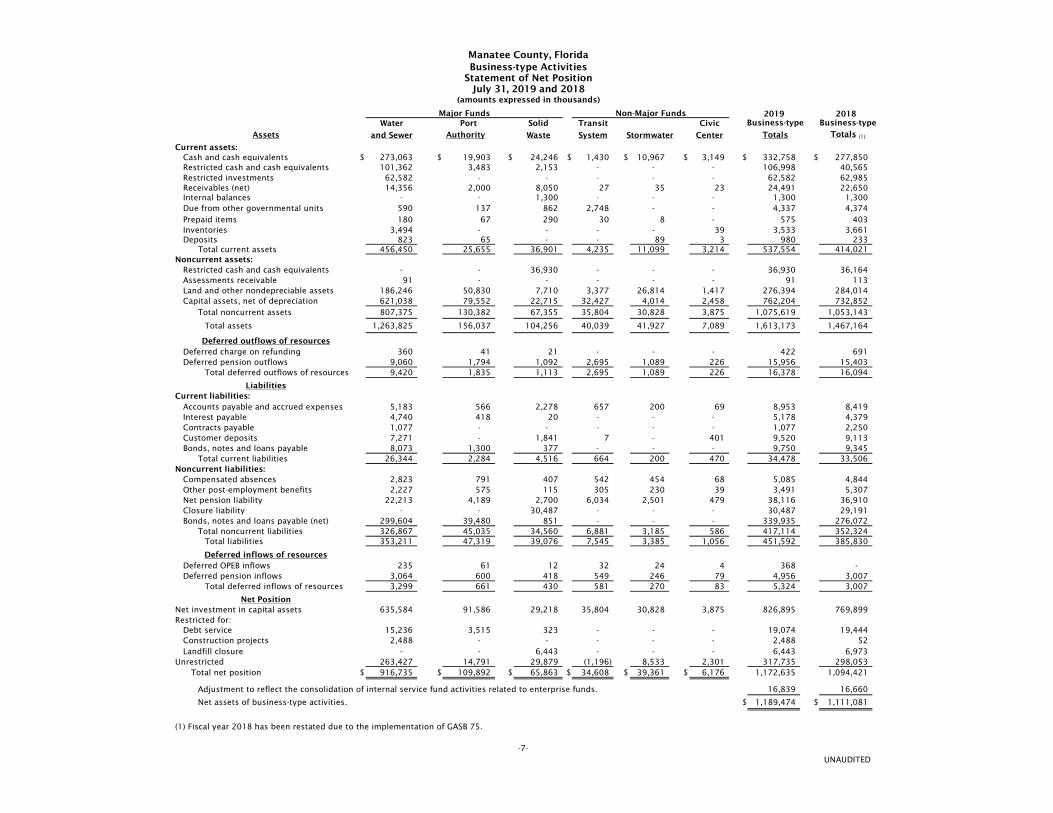
Current assets:Cash and cash equivalents $ 273,063 $ 19,903 $ 24,246 $ 1,430 $ 10,967 $ 3,149 $ 332,758 $ 277,850 Restricted cash and cash equivalents 101,362 3,483 2,153 - - - 106,998 40,565 Restricted investments 62,582 - - - - - 62,582 62,985 Receivables (net) 14,356 2,000 8,050 27 35 23 24,491 22,650 Internal balances - - 1,300 - - - 1,300 1,300 Due from other governmental units 590 137 862 2,748 - - 4,337 4,374 Prepaid items 180 67 290 30 8 - 575 403 Inventories 3,494 - - - - 39 3,533 3,661 Deposits 823 65 - - 89 3 980 233
Total current assets 456,450 25,655 36,901 4,235 11,099 3,214 537,554 414,021 Noncurrent assets:
Restricted cash and cash equivalents - - 36,930 - - - 36,930 36,164 Assessments receivable 91 - - - - - 91 113 Land and other nondepreciable assets 186,246 50,830 7,710 3,377 26,814 1,417 276,394 284,014 Capital assets, net of depreciation 621,038 79,552 22,715 32,427 4,014 2,458 762,204 732,852
Total noncurrent assets 807,375 130,382 67,355 35,804 30,828 3,875 1,075,619 1,053,143
Total assets 1,263,825 156,037 104,256 40,039 41,927 7,089 1,613,173 1,467,164
Deferred charge on refunding 360 41 21 - - - 422 691 Deferred pension outflows 9,060 1,794 1,092 2,695 1,089 226 15,956 15,403
Total deferred outflows of resources 9,420 1,835 1,113 2,695 1,089 226 16,378 16,094
Accounts payable and accrued expenses 5,183 566 2,278 657 200 69 8,953 8,419 Interest payable 4,740 418 20 - - - 5,178 4,379 Contracts payable 1,077 - - - - - 1,077 2,250 Customer deposits 7,271 - 1,841 7 - 401 9,520 9,113 Bonds, notes and loans payable 8,073 1,300 377 - - - 9,750 9,345
Total current liabilities 26,344 2,284 4,516 664 200 470 34,478 33,506 Noncurrent liabilities:
Compensated absences 2,823 791 407 542 454 68 5,085 4,844 Other post-employment benefits 2,227 575 115 305 230 39 3,491 5,307 Net pension liability 22,213 4,189 2,700 6,034 2,501 479 38,116 36,910 Closure liability - - 30,487 - - - 30,487 29,191 Bonds, notes and loans payable (net) 299,604 39,480 851 - - - 339,935 276,072
Total noncurrent liabilities 326,867 45,035 34,560 6,881 3,185 586 417,114 352,324 Total liabilities 353,211 47,319 39,076 7,545 3,385 1,056 451,592 385,830
Deferred OPEB inflows 235 61 12 32 24 4 368 - Deferred pension inflows 3,064 600 418 549 246 79 4,956 3,007
Total deferred inflows of resources 3,299 661 430 581 270 83 5,324 3,007
Net investment in capital assets 635,584 91,586 29,218 35,804 30,828 3,875 826,895 769,899 Restricted for:
Debt service 15,236 3,515 323 - - - 19,074 19,444 Construction projects 2,488 - - - - - 2,488 52 Landfill closure - - 6,443 - - - 6,443 6,973
Unrestricted 263,427 14,791 29,879 (1,196) 8,533 2,301 317,735 298,053 Total net position $ 916,735 $ 109,892 $ 65,863 $ 34,608 $ 39,361 $ 6,176 1,172,635 1,094,421
Adjustment to reflect the consolidation of internal service fund activities related to enterprise funds. 16,839 16,660
Net assets of business-type activities. $ 1,189,474 $ 1,111,081
(1) Fiscal year 2018 has been restated due to the implementation of GASB 75.
UNAUDITED
Manatee County, Florida
Non-Major FundsMajor Funds
Authority
Business-type ActivitiesStatement of Net Position
July 31, 2019 and 2018(amounts expressed in thousands)
-7-
Business-type
Assets
Liabilities
Totals
Net Position
Business-type
Current liabilities:
Deferred outflows of resources
Deferred inflows of resources
Totals (1)

Port Solid Transit Civic
Waste System Stormwater Center
Operating revenues: Charges for services $ 115,885 $ 16,207 $ 41,263 $ 1,105 $ 40 $ 1,596 $ 176,096 $ 166,575 Miscellaneous 1,388 412 314 124 - 33 2,271 2,176 Total operating revenues 117,273 16,619 41,577 1,229 40 1,629 178,367 168,751
Operating expenses: Operating expenses 69,752 7,032 30,159 11,609 5,424 2,091 126,067 125,570 Depreciation and amortization 22,596 4,402 2,149 2,313 290 241 31,991 31,092 Total operating expenses 92,348 11,434 32,308 13,922 5,714 2,332 158,058 156,662
Operating income (loss) 24,925 5,185 9,269 (12,693) (5,674) (703) 20,309 12,089
Non-operating revenues (expenses): Operating grants 158 6 11,057 3,515 35 - 14,771 5,103 Interest income 9,743 360 1,174 56 197 66 11,596 3,903 Interest expense (10,517) (1,140) (36) - - - (11,693) (9,384) Bond issue cost - - - - - - - (472) Gain (loss) on disposition of assets 40 (17) 212 (37) 15 - 213 (24) Grant administrative fees - (57) - - - - (57) - Total non-operating revenues (expenses) (576) (848) 12,407 3,534 247 66 14,830 (874) Income (loss) before contributions, rebates and transfers 24,349 4,337 21,676 (9,159) (5,427) (637) 35,139 11,215 Capital contributions 14,849 477 - 2,893 - - 18,219 18,477 Interest rebates 1,475 - - - - - 1,475 1,469 Transfers in (out) (2,735) 447 (8,648) 6,754 8,373 500 4,691 4,284 Change in net position 37,938 5,261 13,028 488 2,946 (137) 59,524 35,445
Total net position - beginning 878,797 104,631 52,835 34,120 36,415 6,313 Total net position - ending $ 916,735 $ 109,892 $ 65,863 $ 34,608 $ 39,361 $ 6,176
Adjustment to reflect the consolidation of internal service fund activities related to enterprise funds. 589 774 Change in net assets of business-type activities. $ 60,113 $ 36,219
(1) Fiscal year 2018 has been restated due to the implementation of GASB 75.
UNAUDITED
Manatee County, Florida
2018
Totals
Business-typeWater2019
-8-
and Sewer Authority
Business-type ActivitiesStatement of Revenues, Expenses and Changes in Fund Net Position
For the Ten Month Periods Ended July 31, 2019 and 2018(amounts expressed in thousands)
Major Funds Non-Major FundsBusiness-type
Totals (1)
Port Solid Transit CivicAuthority Waste System Stormwater Center
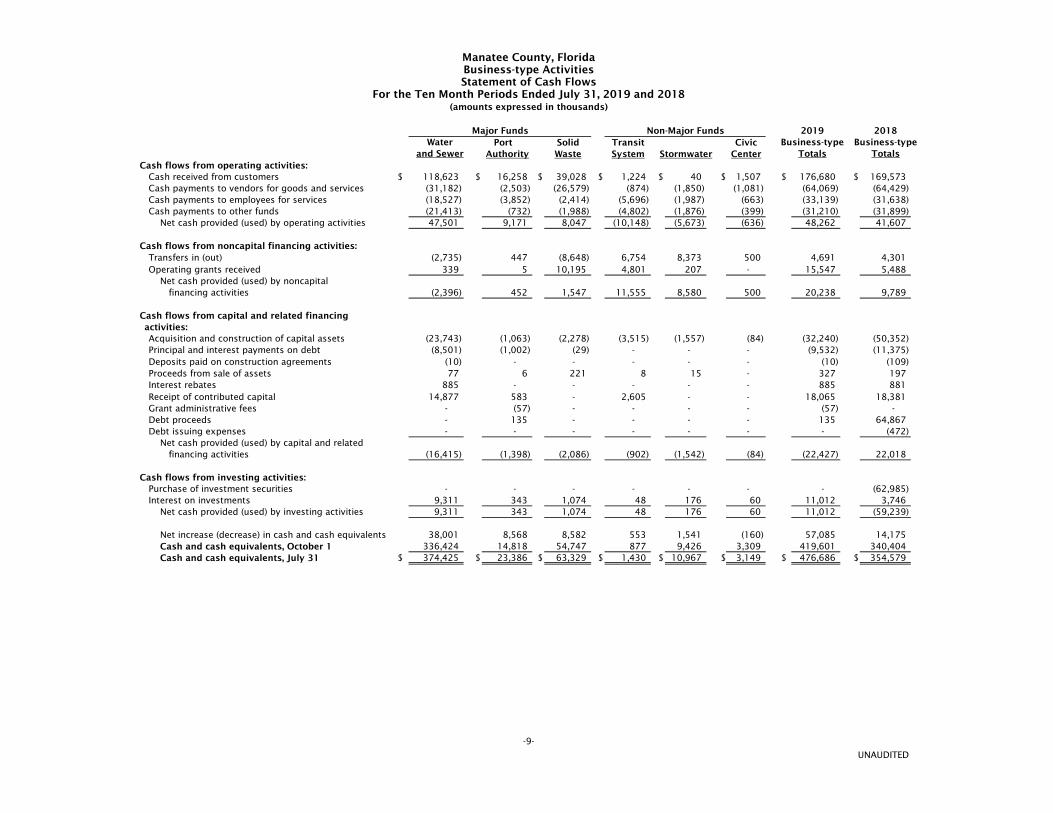
Cash flows from operating activities:Cash received from customers $ 118,623 $ 16,258 $ 39,028 $ 1,224 $ 40 $ 1,507 $ 176,680 $ 169,573 Cash payments to vendors for goods and services (31,182) (2,503) (26,579) (874) (1,850) (1,081) (64,069) (64,429) Cash payments to employees for services (18,527) (3,852) (2,414) (5,696) (1,987) (663) (33,139) (31,638) Cash payments to other funds (21,413) (732) (1,988) (4,802) (1,876) (399) (31,210) (31,899)
Net cash provided (used) by operating activities 47,501 9,171 8,047 (10,148) (5,673) (636) 48,262 41,607
Cash flows from noncapital financing activities:Transfers in (out) (2,735) 447 (8,648) 6,754 8,373 500 4,691 4,301 Operating grants received 339 5 10,195 4,801 207 - 15,547 5,488
Net cash provided (used) by noncapital financing activities (2,396) 452 1,547 11,555 8,580 500 20,238 9,789
Cash flows from capital and related financingactivities:Acquisition and construction of capital assets (23,743) (1,063) (2,278) (3,515) (1,557) (84) (32,240) (50,352) Principal and interest payments on debt (8,501) (1,002) (29) - - - (9,532) (11,375) Deposits paid on construction agreements (10) - - - - - (10) (109) Proceeds from sale of assets 77 6 221 8 15 - 327 197 Interest rebates 885 - - - - - 885 881 Receipt of contributed capital 14,877 583 - 2,605 - - 18,065 18,381 Grant administrative fees - (57) - - - - (57) - Debt proceeds - 135 - - - - 135 64,867 Debt issuing expenses - - - - - - - (472)
Net cash provided (used) by capital and related financing activities (16,415) (1,398) (2,086) (902) (1,542) (84) (22,427) 22,018
Cash flows from investing activities:Purchase of investment securities - - - - - - - (62,985) Interest on investments 9,311 343 1,074 48 176 60 11,012 3,746
Net cash provided (used) by investing activities 9,311 343 1,074 48 176 60 11,012 (59,239)
Net increase (decrease) in cash and cash equivalents 38,001 8,568 8,582 553 1,541 (160) 57,085 14,175 Cash and cash equivalents, October 1 336,424 14,818 54,747 877 9,426 3,309 419,601 340,404 Cash and cash equivalents, July 31 $ 374,425 $ 23,386 $ 63,329 $ 1,430 $ 10,967 $ 3,149 $ 476,686 $ 354,579
UNAUDITED
-9-
Business-type ActivitiesStatement of Cash Flows
For the Ten Month Periods Ended July 31, 2019 and 2018(amounts expressed in thousands)
2019
Manatee County, Florida
TotalsBusiness-type
TotalsBusiness-type
2018
and SewerWater
Major Funds Non-Major Funds
% ofAdopted Amended Amended 2018
Budget Budget Actual Budget Actual (1)
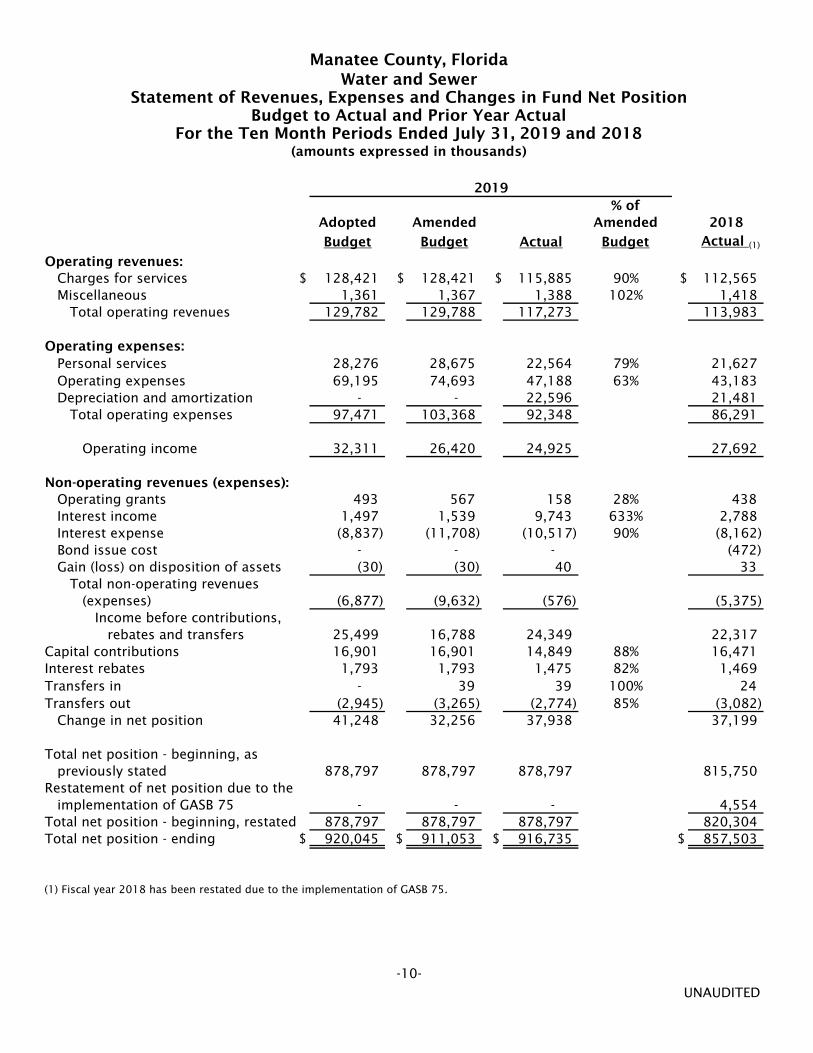
Operating revenues: Charges for services $ 128,421 $ 128,421 $ 115,885 90% $ 112,565 Miscellaneous 1,361 1,367 1,388 102% 1,418 Total operating revenues 129,782 129,788 117,273 113,983
Operating expenses: Personal services 28,276 28,675 22,564 79% 21,627 Operating expenses 69,195 74,693 47,188 63% 43,183 Depreciation and amortization - - 22,596 21,481 Total operating expenses 97,471 103,368 92,348 86,291
Operating income 32,311 26,420 24,925 27,692
Non-operating revenues (expenses): Operating grants 493 567 158 28% 438 Interest income 1,497 1,539 9,743 633% 2,788 Interest expense (8,837) (11,708) (10,517) 90% (8,162) Bond issue cost - - - (472) Gain (loss) on disposition of assets (30) (30) 40 33 Total non-operating revenues (expenses) (6,877) (9,632) (576) (5,375) Income before contributions, rebates and transfers 25,499 16,788 24,349 22,317 Capital contributions 16,901 16,901 14,849 88% 16,471 Interest rebates 1,793 1,793 1,475 82% 1,469 Transfers in - 39 39 100% 24 Transfers out (2,945) (3,265) (2,774) 85% (3,082) Change in net position 41,248 32,256 37,938 37,199
Total net position - beginning, as previously stated 878,797 878,797 878,797 815,750 Restatement of net position due to the implementation of GASB 75 - - - 4,554 Total net position - beginning, restated 878,797 878,797 878,797 820,304 Total net position - ending $ 920,045 $ 911,053 $ 916,735 $ 857,503
(1) Fiscal year 2018 has been restated due to the implementation of GASB 75.
UNAUDITED
Manatee County, FloridaWater and Sewer
Statement of Revenues, Expenses and Changes in Fund Net PositionBudget to Actual and Prior Year Actual
2019
-10-
(amounts expressed in thousands)For the Ten Month Periods Ended July 31, 2019 and 2018
% ofAdopted Amended 2018
Budget Budget Actual Budget Actual (1)
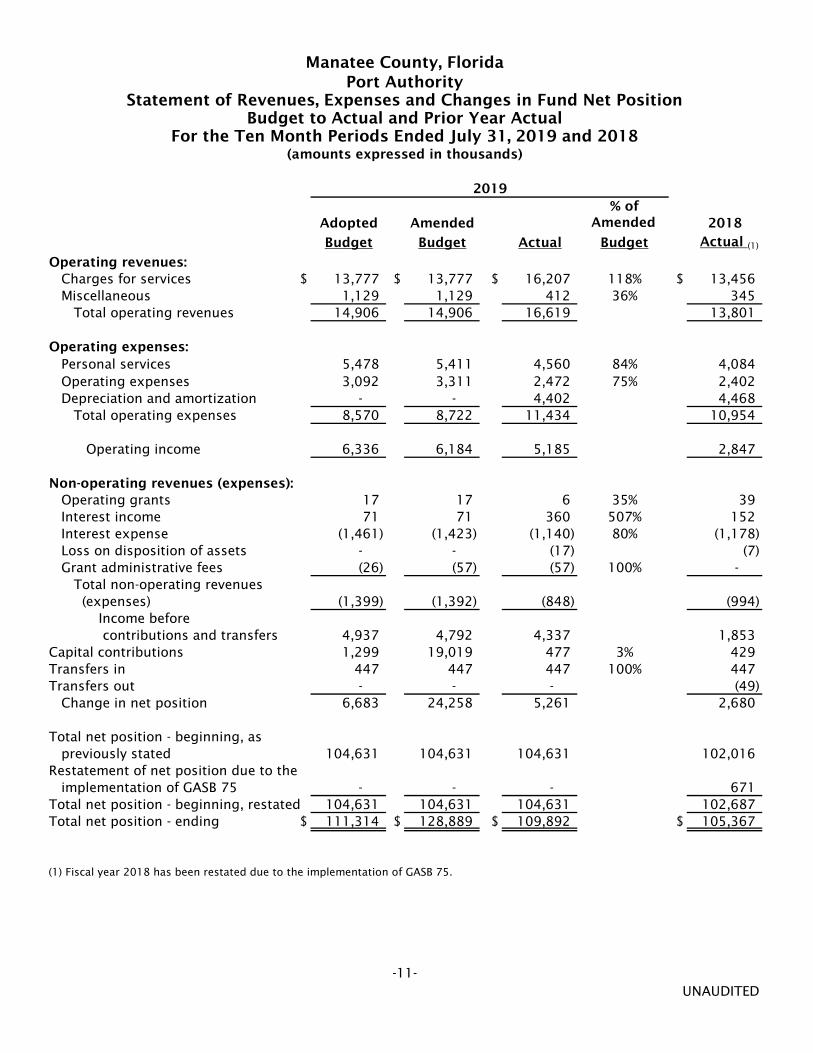
Operating revenues: Charges for services $ 13,777 $ 13,777 $ 16,207 118% $ 13,456 Miscellaneous 1,129 1,129 412 36% 345 Total operating revenues 14,906 14,906 16,619 13,801
Operating expenses: Personal services 5,478 5,411 4,560 84% 4,084 Operating expenses 3,092 3,311 2,472 75% 2,402 Depreciation and amortization - - 4,402 4,468 Total operating expenses 8,570 8,722 11,434 10,954
Operating income 6,336 6,184 5,185 2,847
Non-operating revenues (expenses): Operating grants 17 17 6 35% 39 Interest income 71 71 360 507% 152 Interest expense (1,461) (1,423) (1,140) 80% (1,178) Loss on disposition of assets - - (17) (7) Grant administrative fees (26) (57) (57) 100% - Total non-operating revenues (expenses) (1,399) (1,392) (848) (994) Income before contributions and transfers 4,937 4,792 4,337 1,853 Capital contributions 1,299 19,019 477 3% 429 Transfers in 447 447 447 100% 447 Transfers out - - - (49) Change in net position 6,683 24,258 5,261 2,680
Total net position - beginning, as previously stated 104,631 104,631 104,631 102,016 Restatement of net position due to the implementation of GASB 75 - - - 671 Total net position - beginning, restated 104,631 104,631 104,631 102,687 Total net position - ending $ 111,314 $ 128,889 $ 109,892 $ 105,367
(1) Fiscal year 2018 has been restated due to the implementation of GASB 75.
UNAUDITED
Manatee County, Florida
-11-
Amended
Port AuthorityStatement of Revenues, Expenses and Changes in Fund Net Position
2019
Budget to Actual and Prior Year Actual
(amounts expressed in thousands)For the Ten Month Periods Ended July 31, 2019 and 2018
% ofAdopted Amended Amended 2018
Budget Budget Actual Budget Actual (1)
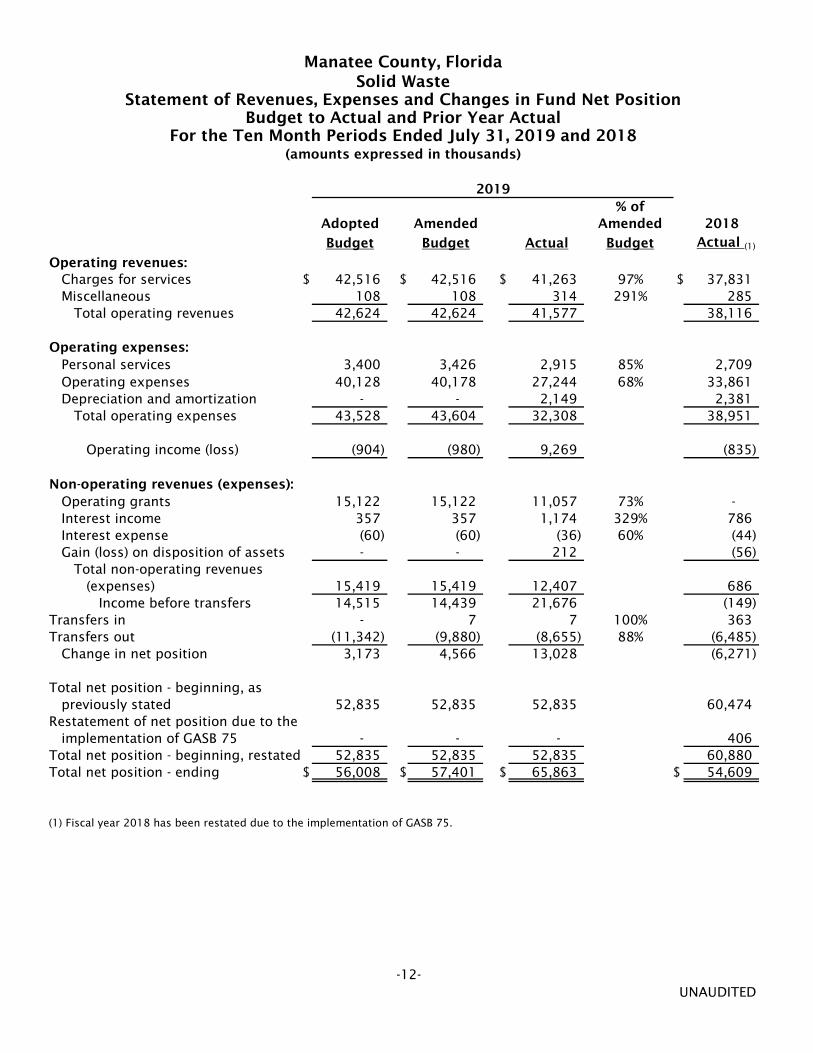
Operating revenues: Charges for services $ 42,516 $ 42,516 $ 41,263 97% $ 37,831 Miscellaneous 108 108 314 291% 285 Total operating revenues 42,624 42,624 41,577 38,116
Operating expenses: Personal services 3,400 3,426 2,915 85% 2,709 Operating expenses 40,128 40,178 27,244 68% 33,861 Depreciation and amortization - - 2,149 2,381 Total operating expenses 43,528 43,604 32,308 38,951
Operating income (loss) (904) (980) 9,269 (835)
Non-operating revenues (expenses): Operating grants 15,122 15,122 11,057 73% - Interest income 357 357 1,174 329% 786 Interest expense (60) (60) (36) 60% (44) Gain (loss) on disposition of assets - - 212 (56) Total non-operating revenues (expenses) 15,419 15,419 12,407 686 Income before transfers 14,515 14,439 21,676 (149) Transfers in - 7 7 100% 363 Transfers out (11,342) (9,880) (8,655) 88% (6,485) Change in net position 3,173 4,566 13,028 (6,271)
Total net position - beginning, as previously stated 52,835 52,835 52,835 60,474 Restatement of net position due to the implementation of GASB 75 - - - 406 Total net position - beginning, restated 52,835 52,835 52,835 60,880 Total net position - ending $ 56,008 $ 57,401 $ 65,863 $ 54,609
(1) Fiscal year 2018 has been restated due to the implementation of GASB 75.
UNAUDITED
Manatee County, Florida
-12-
2019
(amounts expressed in thousands)
Solid WasteStatement of Revenues, Expenses and Changes in Fund Net Position
Budget to Actual and Prior Year ActualFor the Ten Month Periods Ended July 31, 2019 and 2018
% ofAdopted Amended 2018
Budget Budget Actual Budget Actual (1)
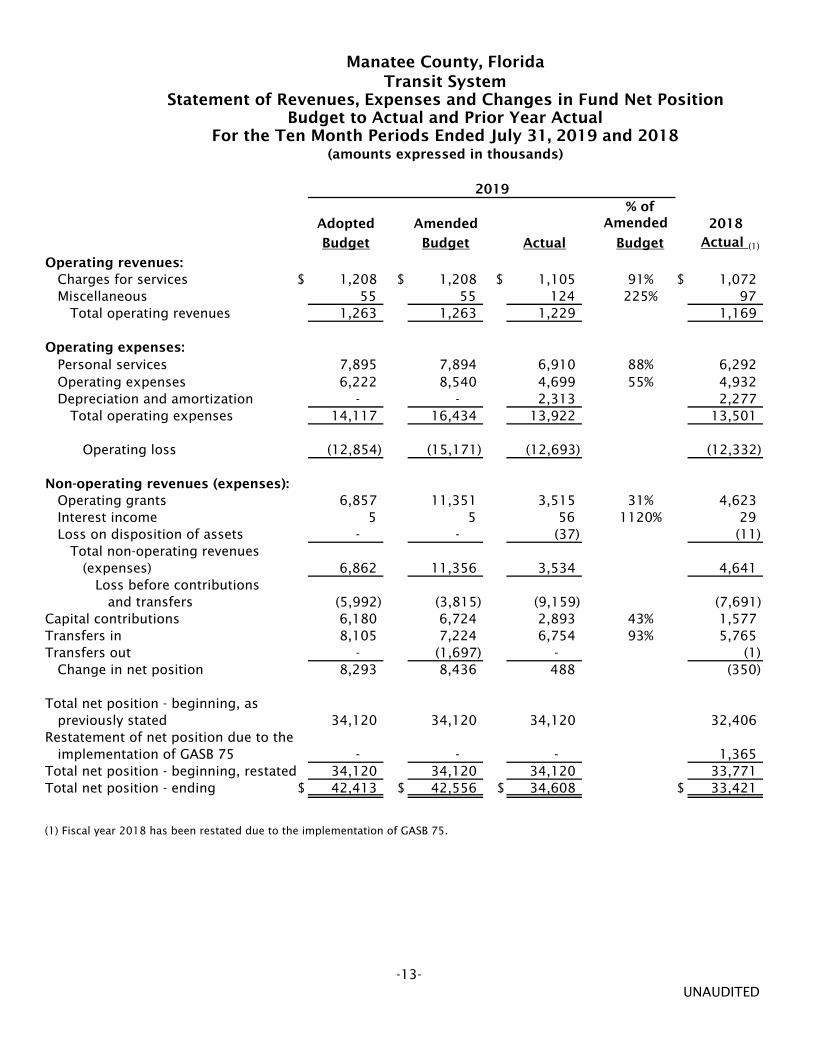
Operating revenues: Charges for services $ 1,208 $ 1,208 $ 1,105 91% $ 1,072 Miscellaneous 55 55 124 225% 97 Total operating revenues 1,263 1,263 1,229 1,169
Operating expenses: Personal services 7,895 7,894 6,910 88% 6,292 Operating expenses 6,222 8,540 4,699 55% 4,932 Depreciation and amortization - - 2,313 2,277 Total operating expenses 14,117 16,434 13,922 13,501
Operating loss (12,854) (15,171) (12,693) (12,332)
Non-operating revenues (expenses): Operating grants 6,857 11,351 3,515 31% 4,623 Interest income 5 5 56 1120% 29 Loss on disposition of assets - - (37) (11) Total non-operating revenues (expenses) 6,862 11,356 3,534 4,641 Loss before contributions and transfers (5,992) (3,815) (9,159) (7,691) Capital contributions 6,180 6,724 2,893 43% 1,577 Transfers in 8,105 7,224 6,754 93% 5,765 Transfers out - (1,697) - (1) Change in net position 8,293 8,436 488 (350)
Total net position - beginning, as previously stated 34,120 34,120 34,120 32,406 Restatement of net position due to the implementation of GASB 75 - - - 1,365 Total net position - beginning, restated 34,120 34,120 34,120 33,771 Total net position - ending $ 42,413 $ 42,556 $ 34,608 $ 33,421
(1) Fiscal year 2018 has been restated due to the implementation of GASB 75.
UNAUDITED-13-
Amended
2019
For the Ten Month Periods Ended July 31, 2019 and 2018
Manatee County, FloridaTransit System
Statement of Revenues, Expenses and Changes in Fund Net PositionBudget to Actual and Prior Year Actual
(amounts expressed in thousands)
% ofAdopted Amended Amended 2018
Budget Budget Actual Budget Actual (1)
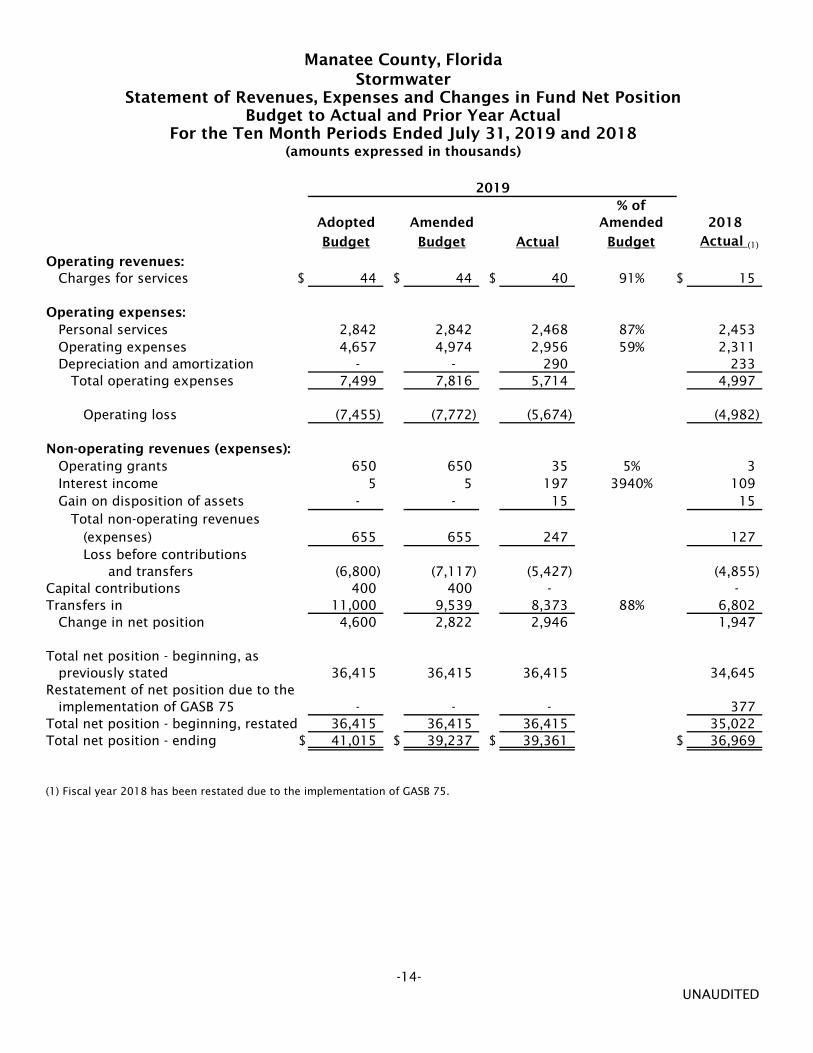
Operating revenues: Charges for services $ 44 $ 44 $ 40 91% $ 15
Operating expenses: Personal services 2,842 2,842 2,468 87% 2,453 Operating expenses 4,657 4,974 2,956 59% 2,311 Depreciation and amortization - - 290 233 Total operating expenses 7,499 7,816 5,714 4,997
Operating loss (7,455) (7,772) (5,674) (4,982)
Non-operating revenues (expenses): Operating grants 650 650 35 5% 3 Interest income 5 5 197 3940% 109 Gain on disposition of assets - - 15 15 Total non-operating revenues (expenses) 655 655 247 127 Loss before contributions and transfers (6,800) (7,117) (5,427) (4,855) Capital contributions 400 400 - - Transfers in 11,000 9,539 8,373 88% 6,802 Change in net position 4,600 2,822 2,946 1,947
Total net position - beginning, as previously stated 36,415 36,415 36,415 34,645 Restatement of net position due to the implementation of GASB 75 - - - 377 Total net position - beginning, restated 36,415 36,415 36,415 35,022 Total net position - ending $ 41,015 $ 39,237 $ 39,361 $ 36,969
(1) Fiscal year 2018 has been restated due to the implementation of GASB 75.
UNAUDITED
Manatee County, Florida
Budget to Actual and Prior Year Actual
Stormwater
For the Ten Month Periods Ended July 31, 2019 and 2018
2019
Statement of Revenues, Expenses and Changes in Fund Net Position
(amounts expressed in thousands)
-14-

% ofAdopted Amended Amended 2018
Budget Budget Actual Budget Actual (1)
Operating revenues: Charges for services $ 1,555 $ 1,636 $ 1,596 98% $ 1,636 Miscellaneous 43 43 33 77% 31 Total operating revenues 1,598 1,679 1,629 1,667
Operating expenses: Personal services 915 915 777 85% 702 Operating expenses 1,824 1,946 1,314 68% 1,014 Depreciation and amortization - - 241 252 Total operating expenses 2,739 2,861 2,332 1,968
Operating loss (1,141) (1,182) (703) (301)
Non-operating revenues (expenses): Operating Grants 22 22 - - Interest income 6 6 66 1100% 39 Gain on disposition of assets - - - 2 Total non-operating revenues (expenses) 28 28 66 41 Loss before transfers (1,113) (1,154) (637) (260) Transfers in 600 600 500 83% 500 Change in net position (513) (554) (137) 240
Total net position - beginning, as previously stated 6,313 6,313 6,313 6,154 Restatement of net position due to the implementation of GASB 75 - - - 158 Total net position - beginning, restated 6,313 6,313 6,313 6,312 Total net position - ending $ 5,800 $ 5,759 $ 6,176 $ 6,552
(1) Fiscal year 2018 has been restated due to the implementation of GASB 75.
UNAUDITED-15-
Manatee County, Florida
Budget to Actual and Prior Year Actual
Civic Center
For the Ten Month Periods Ended July 31, 2019 and 2018
2019
Statement of Revenues, Expenses and Changes in Fund Net Position
(amounts expressed in thousands)
2019 2018 (1)
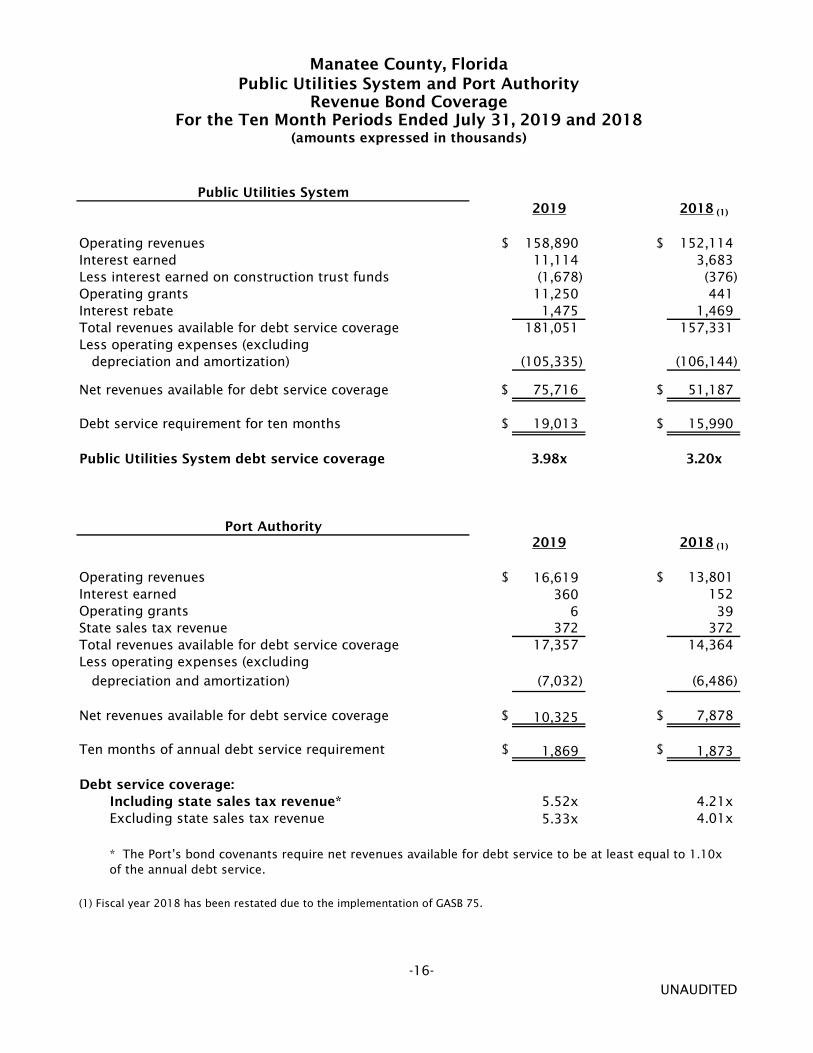
Operating revenues $ 158,890 $ 152,114 Interest earned 11,114 3,683 Less interest earned on construction trust funds (1,678) (376) Operating grants 11,250 441 Interest rebate 1,475 1,469 Total revenues available for debt service coverage 181,051 157,331 Less operating expenses (excluding depreciation and amortization) (105,335) (106,144)
Net revenues available for debt service coverage $ 75,716 $ 51,187
Debt service requirement for ten months $ 19,013 $ 15,990
Public Utilities System debt service coverage 3.98x 3.20x
2019 2018 (1)
Operating revenues $ 16,619 $ 13,801 Interest earned 360 152 Operating grants 6 39 State sales tax revenue 372 372 Total revenues available for debt service coverage 17,357 14,364 Less operating expenses (excluding depreciation and amortization) (7,032) (6,486)
Net revenues available for debt service coverage $ 10,325 $ 7,878
Ten months of annual debt service requirement $ 1,869 $ 1,873
Debt service coverage:Including state sales tax revenue* 5.52x 4.21xExcluding state sales tax revenue 5.33x 4.01x
(1) Fiscal year 2018 has been restated due to the implementation of GASB 75.
UNAUDITED-16-
Manatee County, Florida
Revenue Bond CoverageFor the Ten Month Periods Ended July 31, 2019 and 2018
(amounts expressed in thousands)
Public Utilities System
Port Authority
Public Utilities System and Port Authority
* The Port’s bond covenants require net revenues available for debt service to be at least equal to 1.10x of the annual debt service.
Motor Self Health Automated 2019 2018
Assets Pool Insurance Insurance Systems Total Total (1)
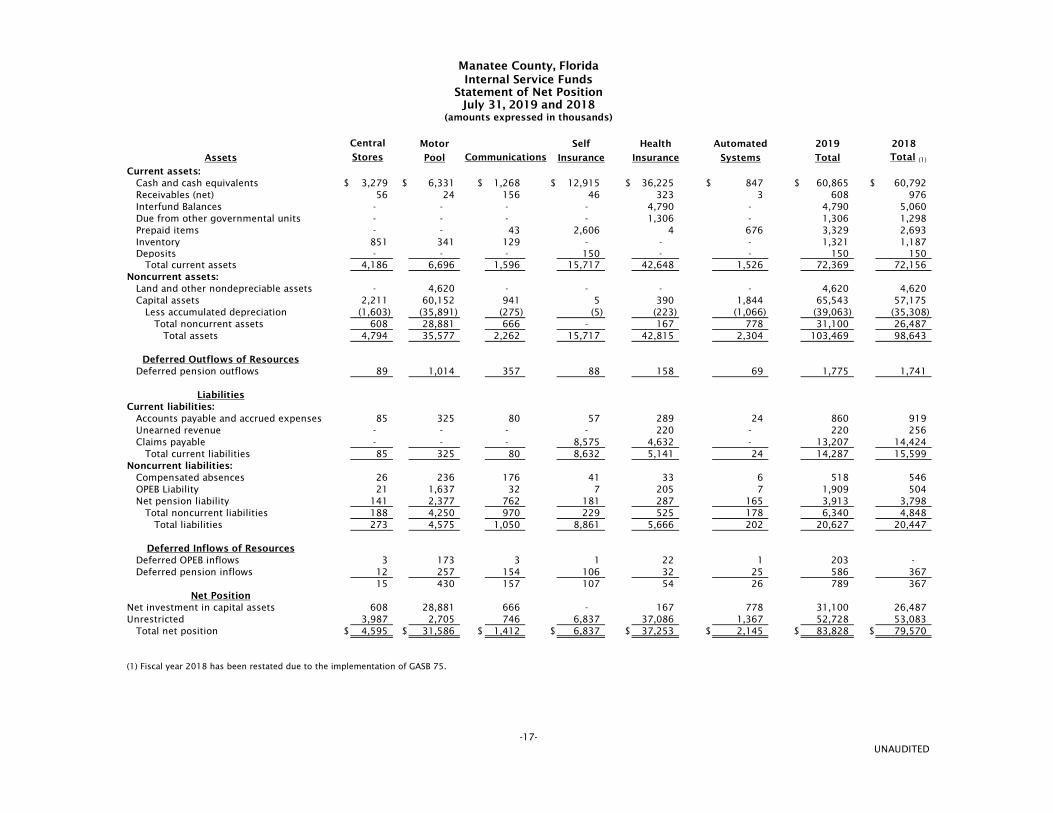
Current assets: Cash and cash equivalents $ 3,279 $ 6,331 $ 1,268 $ 12,915 $ 36,225 $ 847 $ 60,865 $ 60,792 Receivables (net) 56 24 156 46 323 3 608 976 Interfund Balances - - - - 4,790 - 4,790 5,060 Due from other governmental units - - - - 1,306 - 1,306 1,298 Prepaid items - - 43 2,606 4 676 3,329 2,693 Inventory 851 341 129 - - - 1,321 1,187 Deposits - - - 150 - - 150 150 Total current assets 4,186 6,696 1,596 15,717 42,648 1,526 72,369 72,156 Noncurrent assets: Land and other nondepreciable assets - 4,620 - - - - 4,620 4,620 Capital assets 2,211 60,152 941 5 390 1,844 65,543 57,175 Less accumulated depreciation (1,603) (35,891) (275) (5) (223) (1,066) (39,063) (35,308) Total noncurrent assets 608 28,881 666 - 167 778 31,100 26,487 Total assets 4,794 35,577 2,262 15,717 42,815 2,304 103,469 98,643
Deferred Outflows of Resources Deferred pension outflows 89 1,014 357 88 158 69 1,775 1,741
LiabilitiesCurrent liabilities: Accounts payable and accrued expenses 85 325 80 57 289 24 860 919 Unearned revenue - - - - 220 - 220 256 Claims payable - - - 8,575 4,632 - 13,207 14,424 Total current liabilities 85 325 80 8,632 5,141 24 14,287 15,599 Noncurrent liabilities: Compensated absences 26 236 176 41 33 6 518 546 OPEB Liability 21 1,637 32 7 205 7 1,909 504 Net pension liability 141 2,377 762 181 287 165 3,913 3,798 Total noncurrent liabilities 188 4,250 970 229 525 178 6,340 4,848 Total liabilities 273 4,575 1,050 8,861 5,666 202 20,627 20,447
Deferred Inflows of Resources Deferred OPEB inflows 3 173 3 1 22 1 203 - Deferred pension inflows 12 257 154 106 32 25 586 367
15 430 157 107 54 26 789 367 Net Position
Net investment in capital assets 608 28,881 666 - 167 778 31,100 26,487 Unrestricted 3,987 2,705 746 6,837 37,086 1,367 52,728 53,083 Total net position $ 4,595 $ 31,586 $ 1,412 $ 6,837 $ 37,253 $ 2,145 $ 83,828 $ 79,570
(1) Fiscal year 2018 has been restated due to the implementation of GASB 75.
UNAUDITED-17-
Manatee County, Florida
Stores
Central
Communications
Internal Service FundsStatement of Net Position
July 31, 2019 and 2018(amounts expressed in thousands)
Motor Self Health Automated 2019 2018
Pool Systems Total Total (1)
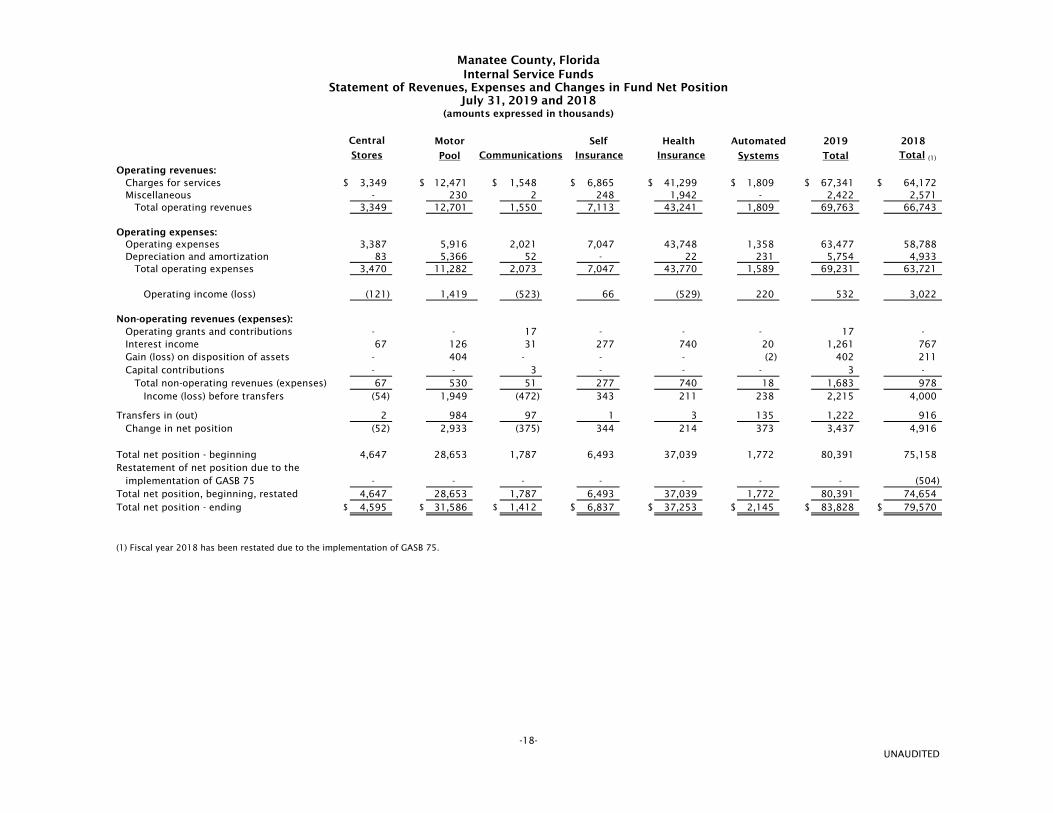
Operating revenues: Charges for services $ 3,349 $ 12,471 $ 1,548 $ 6,865 $ 41,299 $ 1,809 $ 67,341 $ 64,172 Miscellaneous - 230 2 248 1,942 - 2,422 2,571 Total operating revenues 3,349 12,701 1,550 7,113 43,241 1,809 69,763 66,743
Operating expenses: Operating expenses 3,387 5,916 2,021 7,047 43,748 1,358 63,477 58,788 Depreciation and amortization 83 5,366 52 - 22 231 5,754 4,933 Total operating expenses 3,470 11,282 2,073 7,047 43,770 1,589 69,231 63,721
Operating income (loss) (121) 1,419 (523) 66 (529) 220 532 3,022
Non-operating revenues (expenses): Operating grants and contributions - - 17 - - - 17 - Interest income 67 126 31 277 740 20 1,261 767 Gain (loss) on disposition of assets - 404 - - - (2) 402 211 Capital contributions - - 3 - - - 3 - Total non-operating revenues (expenses) 67 530 51 277 740 18 1,683 978 Income (loss) before transfers (54) 1,949 (472) 343 211 238 2,215 4,000
Transfers in (out) 2 984 97 1 3 135 1,222 916 Change in net position (52) 2,933 (375) 344 214 373 3,437 4,916
Total net position - beginning 4,647 28,653 1,787 6,493 37,039 1,772 80,391 75,158 Restatement of net position due to the implementation of GASB 75 - - - - - - - (504) Total net position, beginning, restated 4,647 28,653 1,787 6,493 37,039 1,772 80,391 74,654 Total net position - ending $ 4,595 $ 31,586 $ 1,412 $ 6,837 $ 37,253 $ 2,145 $ 83,828 $ 79,570
(1) Fiscal year 2018 has been restated due to the implementation of GASB 75.
UNAUDITED
Central
Stores Insurance InsuranceCommunications
-18-
Manatee County, FloridaInternal Service Funds
Statement of Revenues, Expenses and Changes in Fund Net PositionJuly 31, 2019 and 2018
(amounts expressed in thousands)
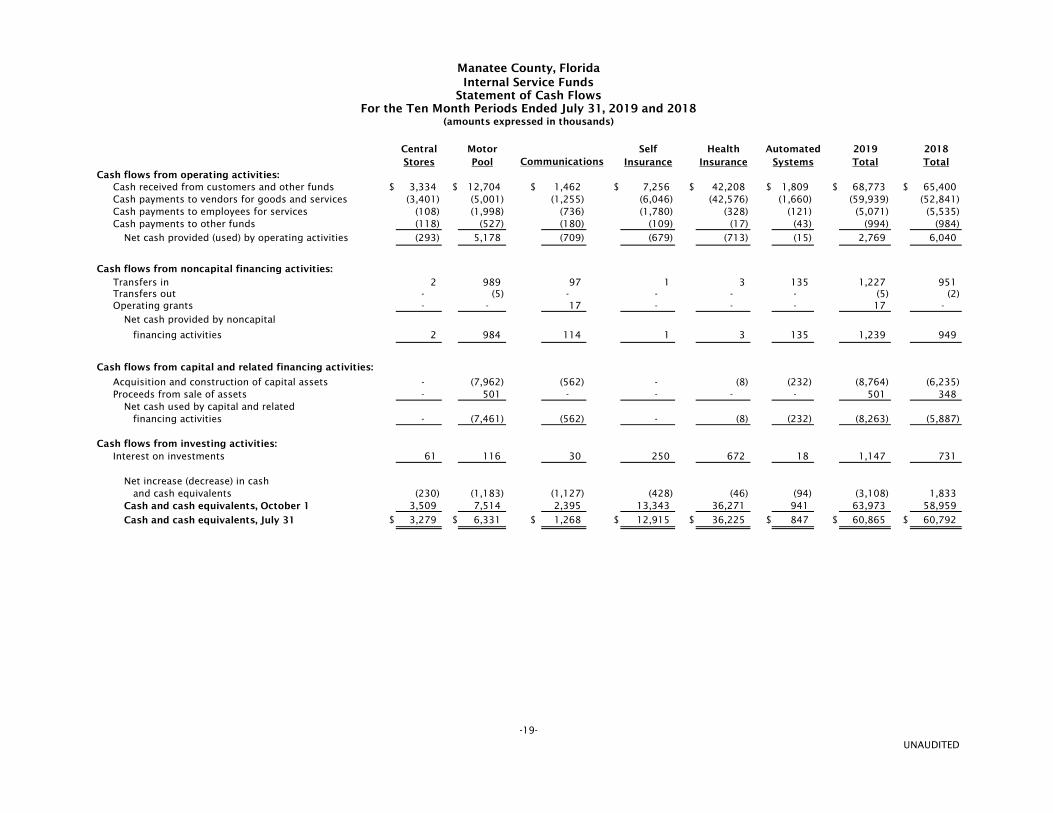
Central Motor Self Health Automated 2019 2018Stores Pool Insurance Insurance Systems Total Total
Cash flows from operating activities:Cash received from customers and other funds $ 3,334 $ 12,704 $ 1,462 $ 7,256 $ 42,208 $ 1,809 $ 68,773 $ 65,400 Cash payments to vendors for goods and services (3,401) (5,001) (1,255) (6,046) (42,576) (1,660) (59,939) (52,841) Cash payments to employees for services (108) (1,998) (736) (1,780) (328) (121) (5,071) (5,535) Cash payments to other funds (118) (527) (180) (109) (17) (43) (994) (984)
Net cash provided (used) by operating activities (293) 5,178 (709) (679) (713) (15) 2,769 6,040
Cash flows from noncapital financing activities:Transfers in 2 989 97 1 3 135 1,227 951 Transfers out - (5) - - - - (5) (2) Operating grants - - 17 - - - 17 -
Net cash provided by noncapital
financing activities 2 984 114 1 3 135 1,239 949
Cash flows from capital and related financing activities:
Acquisition and construction of capital assets - (7,962) (562) - (8) (232) (8,764) (6,235) Proceeds from sale of assets - 501 - - - - 501 348
Net cash used by capital and related financing activities - (7,461) (562) - (8) (232) (8,263) (5,887)
Cash flows from investing activities:Interest on investments 61 116 30 250 672 18 1,147 731
Net increase (decrease) in cash and cash equivalents (230) (1,183) (1,127) (428) (46) (94) (3,108) 1,833 Cash and cash equivalents, October 1 3,509 7,514 2,395 13,343 36,271 941 63,973 58,959
Cash and cash equivalents, July 31 $ 3,279 $ 6,331 $ 1,268 $ 12,915 $ 36,225 $ 847 $ 60,865 $ 60,792
UNAUDITED
Manatee County, Florida
Communications
-19-
Internal Service FundsStatement of Cash Flows
For the Ten Month Periods Ended July 31, 2019 and 2018(amounts expressed in thousands)


