
Woodward Governor Company5001 North Second Street, P.O. Box 7001
Rockford, Illinois 61125-7001 USA815-877-7441
www.woodward.com
2006 ANNUAL REPORT
Woodward Governor Company
FOCUSED ON ENERGY CONTROL
’03 ’04 ’05’02
$0.50
$1.00
$1.50
$2.00
’060.0
0.5
1.0
1.5
2.0
0
Net Earnings and Cash Dividends Per Share*
(In Dollars)
Net earnings per diluted share
Cash dividends per share
*Net earnings for 2002 included a $2.5 million reduction, or $0.07 per diluted share, for a cumulative effect of accounting change related to goodwill.
’03 ’04 ’05’02
$250
$500
$750
$1,000
’06
Net Sales (Dollars in Millions)
0
250
500
750
1000
0
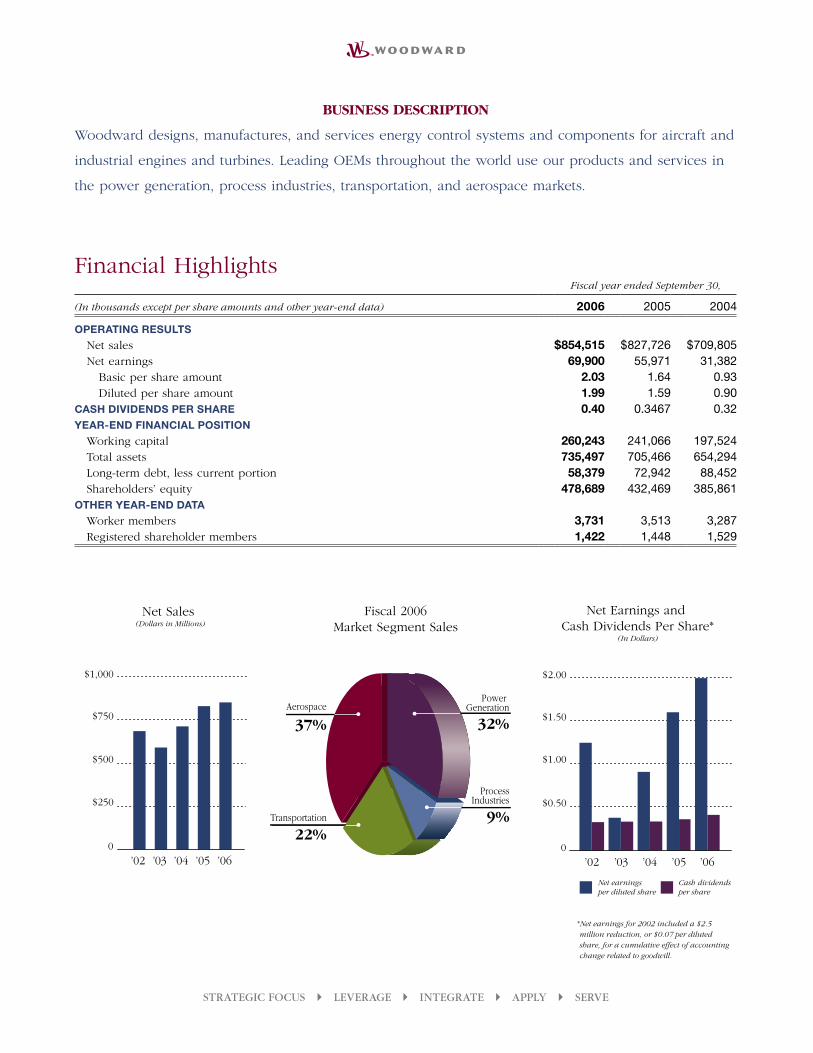
Financial HighlightsFiscal year ended September 30,
(In thousands except per share amounts and other year-end data) 2006 2005 2004
OPERATING RESULTS
Net sales $ 854,515 $ 827,726 $ 709,805 Net earnings 69,900 55,971 31,382 Basic per share amount 2.03 1.64 0.93 Diluted per share amount 1.99 1.59 0.90CASH DIVIDENDS PER SHARE 0.40 0.3467 0.32YEAR-END FINANCIAL POSITION
Working capital 260,243 241,066 197,524 Total assets 735,497 705,466 654,294 Long-term debt, less current portion 58,379 72,942 88,452 Shareholders’ equity 478,689 432,469 385,861OTHER YEAR-END DATA
Worker members 3,731 3,513 3,287 Registered shareholder members 1,422 1,448 1,529
���������
��������������
������������������
����������������
�������������������������������
��
��� ������������
�������������������
�����������������
��������������
���
BUSINESS DESCRIPTION
Woodward designs, manufactures, and services energy control systems and components for aircraft and
industrial engines and turbines. Leading OEMs throughout the world use our products and services in
the power generation, process industries, transportation, and aerospace markets.
STRATEGIC FOCUS LEVERAGE INTEGRATE APPLY SERVE

STRATEGIC FOCUS LEVERAGE INTEGRATE APPLY SERVE 1
Dear Shareholders:
ROBERT F. WEBER, JR.Chief Financial Officer and Treasurer
THOMAS A. GENDRONPresident and Chief Executive Officer
“ We completed our fiscal year 2006
with record sales and earnings. We
accomplished our overall earnings
targets and substantially improved
our operating performance in the
Industrial Controls segment.”
We completed our fiscal year 2006 with record
sales and earnings. We accomplished our overall
earnings targets and substantially improved our
operating performance in the Industrial Controls
segment. Net sales for fiscal year 2006 were $855
million, an increase of slightly over 3 percent
compared to last year. Net earnings were $70
million, or $1.99 per diluted share.
Our financial condition—our balance sheet and
cash flow—remains robust. Woodward’s Board of
Directors authorized a new three-year $50,000,000
stock repurchase program underscoring the Board’s
confidence in the strength of the company’s
prospects, in the belief that Woodward shares
represent a sound investment, and in the effort
to improve the return to our shareholders.
SEGMENT PERFORMANCE
Industrial Controls
Our Industrial Controls segment earnings increased
93 percent in fiscal year 2006, compared to fiscal
year 2005, on flat sales. We attribute the exceptional
earnings improvement to:
• Cost savings from the restructuring of our
European and Asian operations
• A favorable product mix
• Productivity improvements
In addition to the improved financial performance
in Industrial Controls, we continued the expansion
of our operations in China as well as established a
new facility in Krakow, Poland. We will be using
these operations to facilitate our growth in Asia
and Eastern Europe.

2 STRATEGIC FOCUS LEVERAGE INTEGRATE APPLY SERVE
Aircraft Engine Systems
Earnings in our Aircraft Engine Systems segment
held steady on sales growth of 8 percent. Our
investment in R&D increased substantially as we
made solid progress on the large number of new
programs under development.
Our development programs include:
• The fuel system on the GEnx™ engine for the
Boeing 787 and 747-8. The engine is expected
to be an option for the Airbus A350 XWB
• The control system on the PW600 engine family
for the Eclipse 500 and Cessna Citation Mustang
• Fuel system and combustion components on
the F135 and F136 engines for the Joint Strike
Fighter ( JSF)
• Fuel metering unit for the upgraded GE T700-
GE-701E engine for Black Hawk and Apache
helicopters
• Fuel system components on the GP7200 engine
for the Airbus A380
These engine programs will provide for increasing
sales growth in our Aircraft Engine Systems segment
in 2007 and beyond.
In the fiscal year, we secured several engine
derivative programs, established new long-
term agreements with key original equipment
manufacturers (OEMs), and won new research
programs focused on future-generation aircraft,
which further positions us for the years ahead.
STRATEGIC GROWTH
In addition to expanding our organic growth
through R&D investments, we acquired SEG
Schaltanlagen-Elektronik-Geräte GmbH & Co. KG
(SEG), which complements our power generation
product offerings. The purchase was completed
on October 31, 2006.
This acquisition accelerates Woodward’s entry
into the power distribution market by adding
depth to several related product lines. It enhances
Woodward system capabilities for reciprocating
engine OEMs and strengthens relationships with
several key customers. In addition, SEG’s inverter
technology will be used to produce systems
for wind turbines and variable-speed power
generation applications.
STRATEGIC FOCUS
Our strategic focus remains on Energy Control and
Optimization Solutions. The control of energy—
fluid energy, combustion, electrical energy, and
motion—is a growing requirement in the markets
“ We continued the expansion of our
operations in China as well as established
a new facility in Krakow, Poland. We will
be using these operations to facilitate our
growth in Asia and Eastern Europe.”

STRATEGIC FOCUS LEVERAGE INTEGRATE APPLY SERVE 3
we serve to improve the efficiency, emissions,
and operations of power equipment. We continue
to expand our product portfolio to enhance our
systems solution capabilities in fuel, combustion,
fluid, actuation, and electronic systems.
We have designed our vision, strategies, and
implementation plans to ensure Woodward sets the
global standard in Energy Control and Optimization
Solutions. We are targeting growth in our core
markets through the implementation of our systems
strategy, by adding new components to our product
offerings, and by enhancing our service business.
We are also aggressively pursuing market adjacencies
where we can apply our competencies in the power
generation, process industries, and transportation
markets. This includes the ongoing expansion of
our global footprint with increased emphasis on
growth opportunities in Asia.
LOOKING AHEAD
We look forward to higher sales growth in 2007 and
to several more years of expanding opportunities
for Woodward, although we recognize the potential
for cyclicality in our markets.
In 2007, we will concentrate on:
• Accelerating our core market growth rate
• Continued improvement in our Industrial
Controls segment margins
• Improving our return on invested capital
• Developing new market opportunities
• Completing the new development programs
in our Aircraft Engine Systems segment while
maintaining segment margins
We have renewed enthusiasm for our strategic
focus and have added depth and detail to our
strategies. I want to thank our Board of Directors
for their guidance and our members for their
dedication, creativity, and passion in making
Woodward the world leader in Energy Control
and Optimization Solutions.
Sincerely,
THOMAS A. GENDRON
President and Chief Executive Officer
“ We continue to expand our product
portfolio to enhance our systems solution
capabilities in fuel, combustion, fluid,
actuation, and electronic systems.”

4 STRATEGIC FOCUS LEVERAGE INTEGRATE APPLY SERVE
Our Strategic FocusENERGY CONTROL AND OPTIMIZATION SOLUTIONS
Woodward’s business is driven by the worldwide demand
for efficient, low emission, long life, and high performance
energy use in harsh and demanding environments. Energy
control and optimization solutions are our passion and
our strength.
We apply our expertise to the control of energy: fluid
energy, combustion, electrical energy, and motion.
Our systems and components are based on our core
technologies, which leverage well across our markets
and customer applications.
As our markets have demanded more capabilities
from energy control, we have expanded our base of
technologies to include ignition, combustion sensing,
power electronics, and pumps.
While supporting and expanding our core technologies
through development programs and acquisitions, we remain
steadfast in our objective to accurately and precisely
control energy to optimize the performance, reliability,
emissions, and efficiency of our customers’ products.
We integrate our core technologies into fuel, combustion,
fluid, actuation, and electronic systems for original
equipment manufacturers (OEMs) and equipment packagers.
Our customers use Woodward systems and components for
diesel engines, turbines, gas engines, compressors, generator
sets, switchgear, airframes, and industrial vehicles.
Ultimately, our systems and components are used in four
key markets—power generation, transportation, process
industries, and aerospace.
STRATEGIC FOCUS: Energy Control & Optimization Solutions
Fluid Energy • Combustion Control • Electrical Energy • Motion Control
LEVERAGE: Core TechnologiesValves • Servo Actuators • Combustion Sensing • Digital Electronics
Fuel Injection • Electric Actuation • Ignition • Power Electronics • Pumps • AC Measurement & Control
INTEGRATE: SystemsFuel Systems • Combustion Systems • Fluid Systems • Actuation Systems • Electronic Systems
APPLY: OEM & Equipment PackagersDiesel Engines • Turbines • Gas Engines • Compressors • Gensets • Switchgear • Airframes • Industrial Vehicles
SERVE: Market ApplicationsPower Generation • Transportation • Process Industries • Aerospace

STRATEGIC FOCUS LEVERAGE INTEGRATE APPLY SERVE 5
LEVERAGING OUR CORE TECHNOLOGIESWe use our knowledge to create marketable systems and
components that are designed to meet customer needs.
We leverage our technology and product portfolios across
the company for aircraft turbines, industrial engines and
turbines, and power equipment packages.
As a top supplier of energy control systems for on-engine
applications, we are using our core technologies and
energy control expertise to expand into adjacent off-engine
applications. One such application is auxiliary “balance of
plant” systems used in turbine power installations.
By leveraging our existing fluid energy technologies, we
introduced innovative valve systems for steam flow control
for advanced steam-cooled turbine systems. Our entire
product line of turbine auxiliary valves control the flow
of steam, water, and other fluids around power plants.
By rethinking how actuator and valve systems operate,
we were able to introduce products that are significantly
smaller, lighter, more reliable, and better performing than
previously available.
Another example of applying our broad, company-wide
expertise is in the area of combustion control technologies.
During the combustion process, pollutants are generated
as fuel is converted into energy. Precisely controlling the
combustion process in engines and turbines remains
critical to reducing emissions—a key market driver for
our customers.
Woodward has been performing advanced testing at its
combustion test facility to develop methods to further
reduce emissions and potentially provide fuel economy
benefits for diesel and natural gas engine applications.
For example, we are testing and validating our technologies
for use in engine exhaust aftertreatment systems for
on-highway diesel trucks.
Also, we are testing igniters that are integrated into our
nozzles for use on large-frame industrial gas turbines for
the power generation market. These integrated igniters
will allow customers to simplify the light-off process,
and, as a further benefit, they could eliminate complex
devices that ensure each can of the turbine can be relit
if it flames out.
Terry Roby (left) and Dan Meyer (right), Woodward test technicians, discuss running a computer-controlled test on the fuel control system for a Pratt & Whitney Canada PW615 engine.
Woodward Technician Mark Sanderson examines the digital valve positioner board for GE’s LMS100® high efficiency industrial gas turbine used in the power generation market.
Dariusz Glód, Woodward test technician, operates a test stand that checks electronic control modules (lower left) and electronic distributor modules—heavy duty (lower right). The modules are part of Woodward’s OH systems, which help reduce emissions for on-highway, heavy-duty natural gas engines.
6 STRATEGIC FOCUS LEVERAGE INTEGRATE APPLY SERVE
INTEGRATING COMPONENTS INTO SYSTEMSBy integrating our core technologies into fuel, combustion,
fluid, actuation, and electronic systems, we strengthen our
position to secure key aerospace and industrial programs.
With systems, Woodward can provide our customers
simplified architectures that offer higher reliability, weight
reductions, and lower costs with a single point of contact.
For example, as the engine control and ignition systems
provider for the Pratt & Whitney Canada (P&WC) PW615
engine, Woodward simplified the system—reducing the
number of components and weight—while enhancing
engine performance.
The four- to five-passenger Cessna Citation Mustang,
which is powered by the PW615, recently won full FAA
certification, making it the world’s first fully certified,
next-generation entry-level business jet.
According to Cessna, its production orders for the Mustang
are sold out well into 2009. This new breed of aircraft,
very light business jets (VLJs), is gaining acceptance for
several reasons—it can land on shorter runways and costs
less than its predecessors.
Since GE selected Woodward in 2004 as the fuel system
integrator for the GEnx™ turbofan engine, Woodward has
been developing and testing the individual components
as a system. Woodward’s specialized testing capabilities
lead to the best possible design among the various
functions of the fuel system.
By managing the component-to-component interaction,
Woodward optimizes system performance, validating
analytical predictions against actual test data so the fully
tested subsystem performs as expected on engine.
The GEnx engine will power the new Boeing 787.
According to Boeing, the 787 is its most successful
commercial airplane launch in history. The engine will
also be offered exclusively on the Boeing 747-8 and is
expected to be an option for the Airbus A350 XWB.
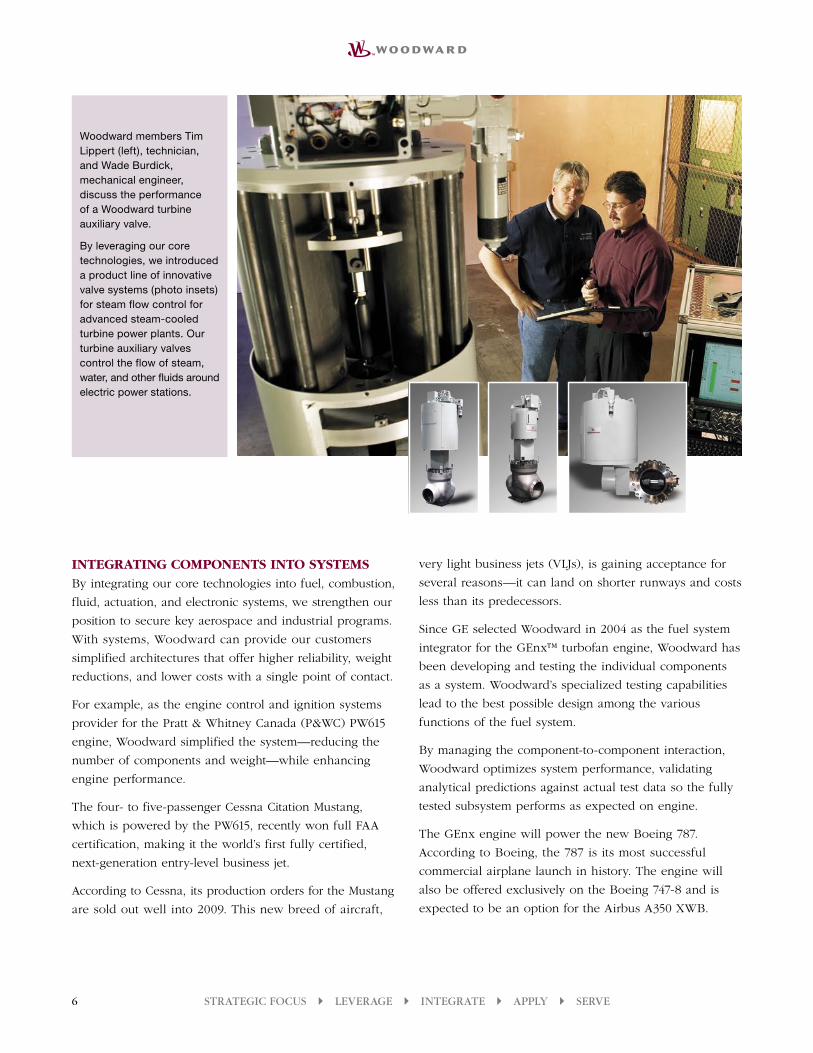
Woodward members Tim Lippert (left), technician, and Wade Burdick, mechanical engineer, discuss the performance of a Woodward turbine auxiliary valve.
By leveraging our core technologies, we introduced a product line of innovative valve systems (photo insets) for steam flow control for advanced steam-cooled turbine power plants. Our turbine auxiliary valves control the flow of steam, water, and other fluids around electric power stations.
STRATEGIC FOCUS LEVERAGE INTEGRATE APPLY SERVE 7
APPLYING OUR SYSTEMS AND COMPONENTSOEMs in the power generation, transportation,
process industries, and aerospace markets apply our
products on their diesel and gas engines, turbines,
compressors, generator sets, switchgear, airframes, and
industrial vehicles.
For example, our industrial customers have relied on
the “UG” style mechanical-hydraulic governor for several
decades to control their diesel, gas, and dual-fuel engines
and steam turbines. To meet the market demand for
a faster, more capable governor, Woodward gave the
well-established governor a high-tech update.
The new UG-25+ governor combines the hydraulic core
of the previous design with one of our integrated digital
governor products to provide faster response and key
exhaust smoke reduction features important to engine
operators in the marine and stationary power industries.
In the future, both Pratt & Whitney (P&W) and the
GE Rolls-Royce Fighter Engine Team (FET) will use
our components for their Joint Strike Fighter ( JSF)
engine programs. Woodward will provide combustion
components—fuel nozzles, augmentors, and manifolds—
for the P&W F135 engine, the lead propulsion choice.
For the JSF alternate engine being built by the GE
Rolls-Royce FET, we are providing the main fuel nozzles
as well as developing a suite of fuel system components.
Both engines will be used to power Lockheed’s JSF
aircraft, the frontline fighter of the future.
SERVING OUR MARKETSAs we focus on energy control, we continue to create
new component and system opportunities for our
customers’ applications. We work to gain market share
within our current base and to develop new customers
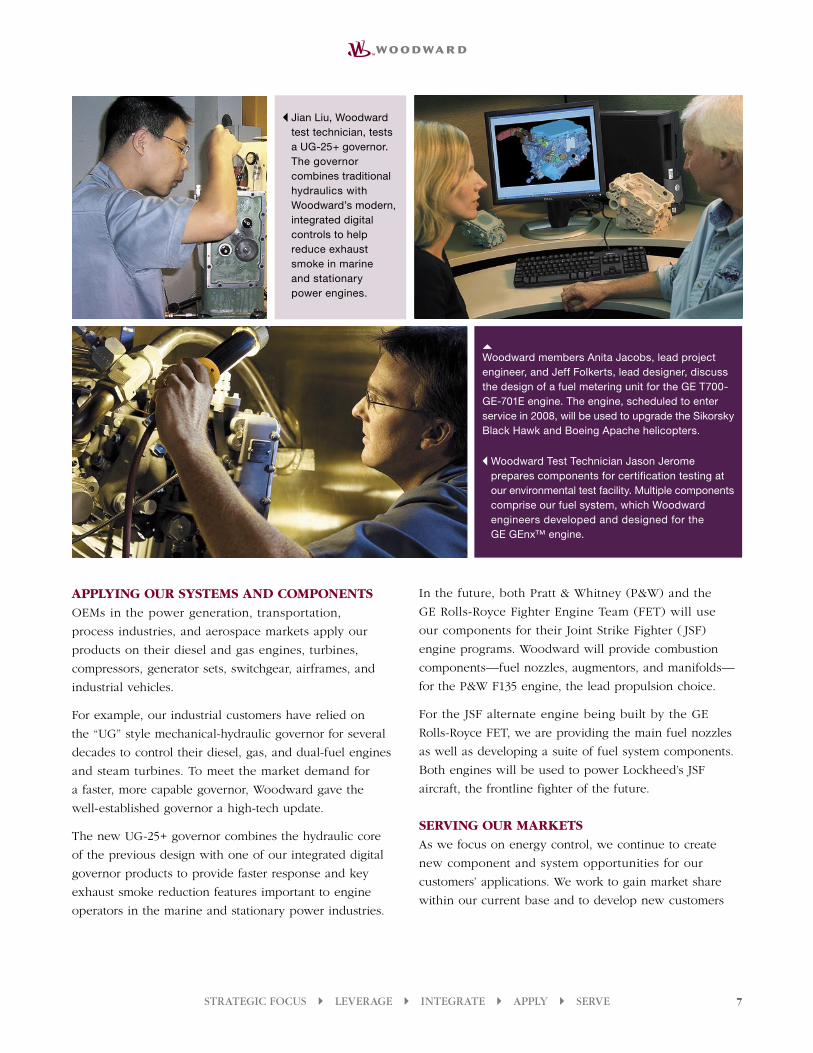
Woodward members Anita Jacobs, lead project engineer, and Jeff Folkerts, lead designer, discuss the design of a fuel metering unit for the GE T700-GE-701E engine. The engine, scheduled to enter service in 2008, will be used to upgrade the Sikorsky Black Hawk and Boeing Apache helicopters.
Woodward Test Technician Jason Jerome prepares components for certification testing at our environmental test facility. Multiple components comprise our fuel system, which Woodward engineers developed and designed for the GE GEnx™ engine.
Jian Liu, Woodward test technician, tests a UG-25+ governor. The governor combines traditional hydraulics with Woodward’s modern, integrated digital controls to help reduce exhaust smoke in marine and stationary power engines.
8 STRATEGIC FOCUS LEVERAGE INTEGRATE APPLY SERVE
in our core markets by setting the standard in reliability
and quality for energy control and optimization solutions.
We set up a facility in Poland to position ourselves to
serve the emerging markets in Eastern Europe and Russia.
In Krakow, we established the technical capabilities and
cost structure to meet our industrial customers’ demand
for electronic controls.
One area of focus in Poland is the testing of controls for
on-highway (OH) engine control systems developed for
compressed natural gas (CNG) and liquid propane gas
(LPG) engines for urban buses and trucks. In the last
decade, Woodward has developed and successfully
marketed three generations of OH engine control systems.
As the demand for clean air and use of locally produced
natural gas for energy independence increases, particularly
in China and other parts of Asia, there is a good level of
interest for the OH product line.
In the next 20 years, the need for energy is expected to
significantly increase as the world population grows
and standards of living escalate for people in developing
countries. Consequently, the power distribution market—
the flow of electrical energy from its source to the
consumer—is growing.
Woodward is participating in this market with our
existing product portfolio of protective relays and power
management controls, which are used to help power
distribution customers offer affordable, efficient, and
reliable electric power.
As we market our current power distribution products,
we continue to look toward developing partnerships with
key equipment manufacturers and to provide integrated
system solutions along with our component offerings.
While focusing on energy control solutions, we continually
ask: Is there a better way? Is there a more cost-effective
way? Is there a more efficient way to control energy
and deliver it in a predictable environment? By applying
our disciplined processes, we determine the answers
to these questions so our customers can meet their
market demands.
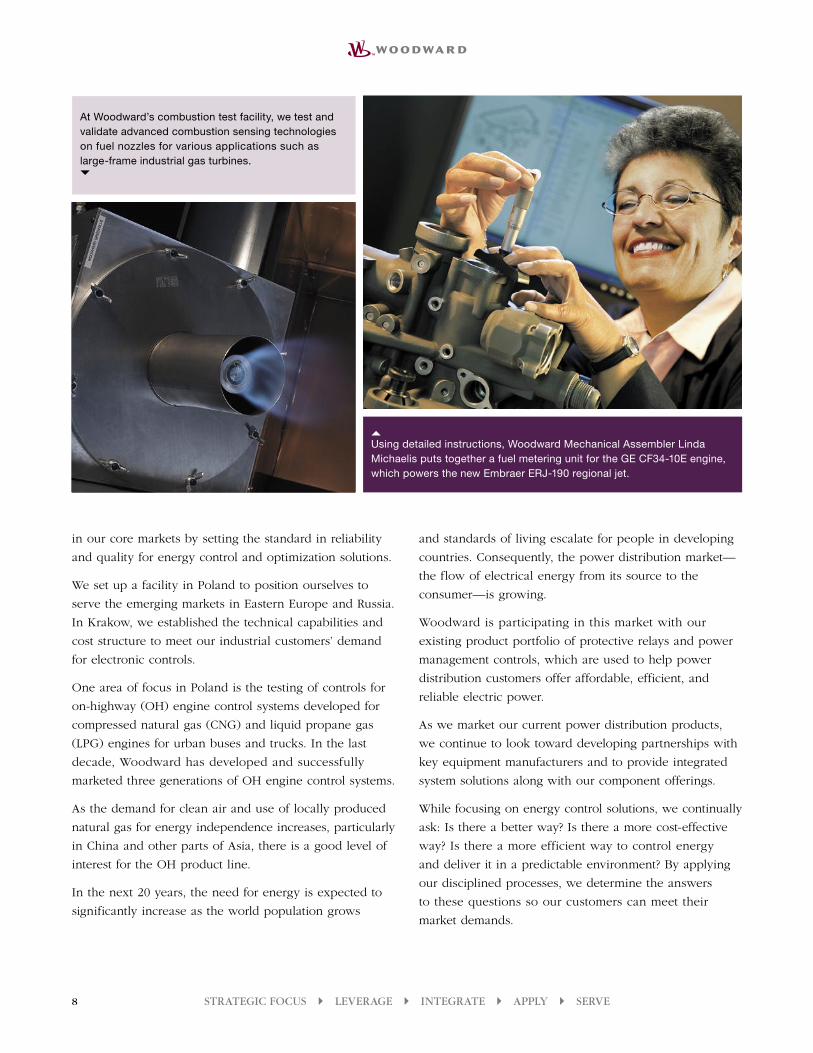
Using detailed instructions, Woodward Mechanical Assembler Linda Michaelis puts together a fuel metering unit for the GE CF34-10E engine, which powers the new Embraer ERJ-190 regional jet.
At Woodward’s combustion test facility, we test and validate advanced combustion sensing technologies on fuel nozzles for various applications such as large-frame industrial gas turbines.

UNITED STATES SECURITIES AND EXCHANGE COMMISSIONWashington, D.C. 20549
Form 10-K¥ ANNUAL REPORT PURSUANT TO SECTION 13 OR 15(d)
OF THE SECURITIES EXCHANGE ACT OF 1934
For the fiscal year ended September 30, 2006
or
n TRANSITION REPORT PURSUANT TO SECTION 13 OR 15(d)OF THE SECURITIES AND EXCHANGE ACT OF 1934
For the transition period from to
Commission file number 0-8408
WOODWARD GOVERNOR COMPANY(Exact name of registrant specified in its charter)
Delaware 36-1984010
(State or other jurisdiction ofincorporation or organization)
(I.R.S. EmployerIdentification No.)
5001 North Second Street,Rockford, Illinois
(Address of principal executive offices)
61125-7001(Zip Code)
Registrant’s telephone number, including area code:(815)877-7441
Securities registered pursuant to Section 12(b) of the Act:
Title of Each Class: Name of Each Exchange on Which Registered:Common stock, par value $.002917 per share NASDAQ Global Select Market
Securities registered pursuant to Section 12(g) of the Act:None
Indicate by check mark if the registrant is a well-known seasoned issuer, as defined in Rule 405 of the Securities Act. Yes ¥ No nIndicate by check mark if the registrant is not required to file reports pursuant to Section 13 or Section 15(d) of the
Act. Yes n No ¥Indicate by check mark whether the registrant (1) has filed all reports required to be filed by Section 13 or 15(d) of the Securities
Exchange Act of 1934 during the preceding 12 months (or for such shorter period that the registrant was required to file such reports), and
(2) has been subject to such filing requirements for the past 90 days. Yes ¥ No nIndicate by check mark if disclosure of delinquent filers pursuant to Item 405 of Regulation S-K is not contained herein, and will not be
contained, to the best of registrant’s knowledge, in definitive proxy or information statements incorporated by reference in Part III of this
Form 10-K or any amendment to this Form 10-K. n
Indicate by check mark whether the registrant is a large accelerated filer, an accelerated filer, or a non-accelerated filer. See definitions of
“accelerated filer and large accelerated filer” in Rule 12b-2 of the Exchange Act.
Large accelerated filer ¥ Accelerated filer n Non-accelerated filer n
Indicate by check mark whether the registrant is a shell company (as defined in Rule 12b-2 of the Act). Yes n No ¥The aggregate market value of the voting and non-voting common equity stock held by non-affiliates, computed by reference to the price
at which the common equity was last sold, or the average bid and ask price of such common equity, as of the last business day of our most
recently completed second fiscal quarter, was $967,019,000 (such aggregate market value does not include voting stock beneficially owned by
directors, officers, the Woodward Governor Company Profit Sharing Trust, Woodward Governor Company Deferred Shares Trust, or the
Woodward Governor Company Charitable Trust).
There were 34,142,962 shares of common stock with a par value of $.0292 per share outstanding at November 20, 2006.
DOCUMENTS INCORPORATED BY REFERENCEPortions of our proxy statement for the 2006 annual meeting of shareholders to be held January 24, 2007, are incorporated by reference
into Part III of this filing, to the extent indicated.
84256_Financials.indd i84256_Financials.indd i 12/5/2006 3:08:09 PM12/5/2006 3:08:09 PM

TABLE OF CONTENTS
Page
PART IItem 1. Business . . . . . . . . . . . . . . . . . . . . . . . . . . . . . . . . . . . . . . . . . . . . . . . . . . . . . . . . . . . . . . . 4
Item 1A. Risk Factors . . . . . . . . . . . . . . . . . . . . . . . . . . . . . . . . . . . . . . . . . . . . . . . . . . . . . . . . . . . . 6
Item 1B. Unresolved Staff Comments . . . . . . . . . . . . . . . . . . . . . . . . . . . . . . . . . . . . . . . . . . . . . . . . . 9
Item 2. Properties . . . . . . . . . . . . . . . . . . . . . . . . . . . . . . . . . . . . . . . . . . . . . . . . . . . . . . . . . . . . . . 10
Item 3. Legal Proceedings . . . . . . . . . . . . . . . . . . . . . . . . . . . . . . . . . . . . . . . . . . . . . . . . . . . . . . . . 10
Item 4. Submission of Matters to a Vote of Security Holders . . . . . . . . . . . . . . . . . . . . . . . . . . . . . . 10
PART IIItem 5. Market for Registrant’s Common Equity, Related Stockholder Matters and Issuer Purchases
of Equity Securities . . . . . . . . . . . . . . . . . . . . . . . . . . . . . . . . . . . . . . . . . . . . . . . . . . . . . . . 11
Item 6. Selected Financial Data . . . . . . . . . . . . . . . . . . . . . . . . . . . . . . . . . . . . . . . . . . . . . . . . . . . . 12
Item 7. Management’s Discussion and Analysis of Financial Condition and Results of Operations . . . 13
Item 7A. Quantitative and Qualitative Disclosures About Market Risk . . . . . . . . . . . . . . . . . . . . . . . . . 30
Item 8. Financial Statements and Supplementary Data . . . . . . . . . . . . . . . . . . . . . . . . . . . . . . . . . . . 31
Item 9. Changes in and Disagreements with Accountants on Accounting and Financial Disclosure . . . 58
Item 9A. Controls and Procedures . . . . . . . . . . . . . . . . . . . . . . . . . . . . . . . . . . . . . . . . . . . . . . . . . . . 58
Item 9B. Other Information . . . . . . . . . . . . . . . . . . . . . . . . . . . . . . . . . . . . . . . . . . . . . . . . . . . . . . . . 59
PART IIIItem 10. Directors and Executive Officers of the Registrant . . . . . . . . . . . . . . . . . . . . . . . . . . . . . . . . 59
Item 11. Executive Compensation . . . . . . . . . . . . . . . . . . . . . . . . . . . . . . . . . . . . . . . . . . . . . . . . . . . 59
Item 12. Security Ownership of Certain Beneficial Owners and Management and Related StockholderMatters . . . . . . . . . . . . . . . . . . . . . . . . . . . . . . . . . . . . . . . . . . . . . . . . . . . . . . . . . . . . . . . . 60
Item 13. Certain Relationships and Related Transactions. . . . . . . . . . . . . . . . . . . . . . . . . . . . . . . . . . . 60
Item 14. Principal Accounting Fees and Services . . . . . . . . . . . . . . . . . . . . . . . . . . . . . . . . . . . . . . . . 60
PART IVItem 15. Exhibits and Financial Statement Schedules . . . . . . . . . . . . . . . . . . . . . . . . . . . . . . . . . . . . . 60
Signatures . . . . . . . . . . . . . . . . . . . . . . . . . . . . . . . . . . . . . . . . . . . . . . . . . . . . . . . . . . . . . . . . . . . . . . 62
111
2
4
7
8
8
8
9
10
11
28
29
56
56
57
57
57
58
58
58
58
60
84256_Financials.indd Sec1:184256_Financials.indd Sec1:1 12/5/2006 3:08:09 PM12/5/2006 3:08:09 PM

PART I
Item 1. Business
Woodward Governor Company designs, manufactures, and services energy control systems and components
for aircraft and industrial engines and turbines. Leading OEMs (original equipment manufacturers) throughout the
world use our products and services in the power generation, aerospace, transportation, and process industries
markets.
We were established in 1870 and incorporated in 1902. We serve global markets from locations worldwide and
are currently headquartered in Rockford, Illinois. Our principal executive officers maintain offices in Fort Collins,
Colorado, as well as Rockford, Illinois. We plan to change the designation of our corporate headquarters to
Fort Collins, Colorado, effective January 1, 2007.
Our business is driven by the worldwide demand for efficient, low emission, long life, and high performance
energy use in harsh and demanding environments. Energy control and optimization solutions are our strength. One
of our key objectives is to accurately and precisely control energy to optimize the performance, reliability,
emissions, and efficiency of our customers’ products.
• Strategic Focus: Energy Control and Optimization Solutions. Our key areas of focus are fluid energy,
combustion control, electrical energy, and motion control.
• Leverage: Core Technologies. Our core technologies include valves, servo actuators, combustion sens-
ing, digital electronics, fuel injection, electric actuation, ignition, power electronics, pumps, and AC
measurement and control.
• Integrate: Systems. Our systems include fuel systems, combustion systems, fluid systems, actuation
systems, and electronic systems.
• Apply: OEM and Equipment Packagers. Our OEM and equipment packager customers use our systems
and components in their products, including diesel engines, turbines, gas engines, compressors, generator
sets, switchgear, and industrial vehicles. Some of our customers include Caterpillar, Cummins, Doosan,
Dresser-Rand, Ebara, Emerson Electric, Enginuity, GE, Guangxi Yuchai Machinery, Hyundai, Ingersoll-
Rand Bobcat, Kawasaki, Mitsubishi, Rolls-Royce, Siemens, U.S. government, United Technologies/Pratt &
Whitney, Wartsila and major airlines worldwide.
• Serve: Market Applications. Ultimately, our systems and components are used in products that are sold
into four key markets — power generation, transportation, process industries, and aerospace.
We have two operating segments — Industrial Controls and Aircraft Engine Systems. Industrial Controls is
focused on systems and components that provide energy control and optimization solutions for industrial markets,
which includes power generation, transportation, and process industries. Aircraft Engine Systems is focused on
systems and components that provide energy control and optimization solutions for the aerospace market.
Information about our operations in 2006 and outlook for the future, including certain segment information, is
included in “Item 7 — Management’s Discussion and Analysis of Financial Condition and Results of Operation.”
Additional segment information and certain geographical information are included in the Notes to the Consolidated
Financial Statements in “Item 8 — Financial Statements and Supplementary Data.” Other information about our
business follows.
Industrial Controls
We provide components and integrated systems through Industrial Controls primarily to OEMs of diesel
engines, industrial turbines, gas engines, compressors, generator sets, switchgear, and industrial vehicles. We also
sell components as spares or replacements, and provide other related services to these customers and other
customers. In 2006, our two largest customers were General Electric Company, which accounted for approximately
20% of Industrial Controls’ sales, and Caterpillar, Inc., which accounted for approximately 18% of Industrial
Controls’ sales.
42
84256_Financials.indd Sec1:284256_Financials.indd Sec1:2 12/5/2006 3:08:10 PM12/5/2006 3:08:10 PM
We generally sell Industrial Controls’ products and services directly to our OEM customers, although we also
generate sales to end users through distributors, dealers, and independent service facilities, whom often serve the
role of an equipment packager. We carry certain finished goods and component parts inventory to meet rapid
delivery requirements of customers, primarily for aftermarket needs. We do not believe Industrial Controls’ sales
are subject to significant seasonal variation.
We believe Industrial Controls has a significant competitive position within the market for components and
integrated systems for diesel engines, turbines, gas engines, compressors, generator sets, and switchgears. While
published information is not available in sufficient detail to enable an accurate assessment, we believe we hold a
strong position among independent manufacturers for power generation, transportation, and process industries
markets. We compete with as many as 10 independent manufacturers and with the in-house control operations of
OEMs. Customers demand technological solutions to meet their needs for efficiency, reliability, and the ability to
meet increasingly more stringent global emissions regulations. Companies compete on the basis of providing
products that meet these needs, as well as on the basis of price, quality, and customer service. In our opinion, our
prices are generally competitive, and our quality, customer service, and technology used in products are favorable
competitive factors.
Industrial Controls’ backlog orders were approximately $140 million at October 31, 2006, approximately 93%
of which we expect to fill by September 30, 2007. Last year, Industrial Controls’ backlog orders were approximately
$119 million at October 31, 2005, approximately 99% of which we expected to fill by September 30, 2006. Backlog
orders are not necessarily an indicator of future billing levels because of variations in lead times.
Aircraft Engine Systems
We provide components and integrated systems through Aircraft Engine Systems to OEMs of aircraft gas
turbines for use in those turbines. We also sell components as spares or replacements, and provide repair and
overhaul services to these customers and other customers. In 2006, our two largest customers were General Electric
Company, which accounted for approximately 24% of Aircraft Engine Systems’ sales, and United Technologies,
which accounted for approximately 17% of Aircraft Engine Systems’ sales.
We primarily sell Aircraft Engine Systems’ products and services directly to our customers, although we also
generate some aftermarket sales through distributors, dealers, and independent service facilities. We carry certain
finished goods and component parts inventory to meet rapid delivery requirements of customers, primarily for
aftermarket needs. We do not believe Aircraft Engine Systems’ sales are subject to significant seasonal variation.
We believe Aircraft Engine Systems has a significant competitive position within the market for components
and integrated systems for aircraft gas turbines. We compete with several other manufacturers, including divisions
of OEMs of aircraft gas turbines. While published information is not available in sufficient detail to enable an
accurate assessment, we do not believe any company holds a dominant competitive position. Companies compete
principally on price, quality, and customer service. In our opinion, our prices are competitive, and our quality and
customer service are favorable competitive factors.
Aircraft Engine Systems’ backlog orders were approximately $228 million at October 31, 2006, approxi-
mately 62% of which we expect to fill by September 30, 2007. Last year, Aircraft Engine Systems’ backlog orders
were approximately $137 million at October 31, 2005, approximately 71% of which we expected to fill by
September 30, 2006. Backlog orders are not necessarily an indicator of future billing levels because of variations in
lead times.
Other Matters
Products for both Industrial Controls and Aircraft Engine Systems make use of several patents and trademarks
of various durations that we believe are collectively important. However, we do not consider our business for either
segment dependent upon any one patent or trademark.
For both segments, our products consist of mechanical, electronic, and electromagnetic components.
Mechanical components are machined primarily from aluminum, iron, and steel. Generally there are numerous
53
84256_Financials.indd Sec1:384256_Financials.indd Sec1:3 12/5/2006 3:08:10 PM12/5/2006 3:08:10 PM

sources for the raw materials and components used in our products, and they are believed to be sufficiently available
to meet all requirements.
We spent approximately $60 million for company-sponsored research and development activities in 2006,
$50 million in 2005 and $40 million in 2004. Both Industrial Controls and Aircraft Engine Systems incurred these
expenses.
We do not believe that compliance with current Federal, State, or local provisions regulating the discharge of
materials into the environment, or otherwise relating to the protection of the environment, will have any material
effect on our capital expenditures, earnings, or competitive position. We are also not intending to incur material
capital expenditures for environmental control facilities through September 30, 2007.
We employed about 3,700 people at October 31, 2006.
This report contains forward-looking statements and should be read with “Item 1A — Risk Factors.”
We maintain a website at www.woodward.com. Securities and Exchange Commission filings, including
annual reports on Form 10-K, quarterly reports on Form 10-Q, current reports on Form 8-K, and proxy statements,
are available on our website as soon as reasonably practicable after they are filed electronically with, or furnished to,
the Securities and Exchange Commission. Shareholders may obtain, without charge, a single copy of Woodward’s
2006 annual report on Form 10-K upon written request to the Corporate Secretary, Woodward Governor Company,
5001 North Second Street, P.O. Box 7001, Rockford, Illinois, 61125-7001.
Item 1A. Risk Factors
Investment in our securities involves risk. An investor or potential investor should consider the risks
summarized in this section when making investment decisions regarding our securities.
Also, an investor should be aware that this annual report contains statements intended to be considered
forward-looking statements and therefore entitled to the safe harbor provisions of the Private Securities Litigation
Reform Act of 1995, including:
• Projections of sales, earnings, cash flows, or other financial items;
• Descriptions of our plans and objectives for future operations;
• Forecasts of future economic performance; and
• Descriptions of assumptions underlying the above items.
Forward-looking statements do not reflect historical facts. Rather, they are statements about future events and
conditions and often include words such as “anticipate,” “believe,” “estimate,” “expect,” “forecast,” “intend,”
“outlook,” “plan,” “project,” “target,” “can,” “could,” “may,” “should,” “will,” “would,” or similar expressions. Such
statements reflect our expectations about the future only as of the date they are made. We are not obligated to, and
we might not, update our forward-looking statements to reflect changes that occur after the date they are made.
Furthermore, actual results could differ materially from projections or any other forward-looking statements
regardless of when they are made.
Important factors that could individually, or together with one or more other factors, affect our business, results
of operations and/or financial condition include, but are not limited to, the following:
Company Risks
Customers that account for a significant portion of our sales may change suppliers, insource production,or be less successful in the marketplace.
We have fewer customers than many other companies with similar sales volumes. Two customers accounted
for 33% of our sales in 2006, each individually accounting for more than 10%. Our sales could decrease
significantly if a large customer were to change suppliers, insource production, or be less successful in the
markets in which it participates.
64
84256_Financials.indd Sec1:484256_Financials.indd Sec1:4 12/5/2006 3:08:10 PM12/5/2006 3:08:10 PM

Sales may not achieve the level forecast.
We use inputs from various sources in developing our sales forecast, including customer and third-party
forecasts of sales volumes and purchase requirements in our markets. Each of these sources could be overstated. In
addition, general business and economic conditions and industry-specific business and economic conditions change
over time, potentially resulting in lower sales.
Many of our expenses may not be able to be reduced in proportion to a sales shortfall.
Many of our expenses are relatively fixed in relation to changes in sales volumes. Some of these expenses are
related to past capital expenditures or business acquisitions in the form of depreciation and amortization expense.
Others are related to expenditures driven by levels of business activity other than the level of sales, including
manufacturing overhead. As a result, we might be unable to reduce spending quickly enough to compensate for a
reduction in sales, which would adversely affect our earnings.
Suppliers may be unable to provide us with materials of sufficient quality or quantity required to meetour production needs.
We are dependent upon suppliers for parts and raw materials used in the manufacture of components that we
sell to our customers. We may experience a shortage of materials for various reasons, such as financial distress,
work stoppages, natural disasters, or production difficulties that may affect one or more of our suppliers. A
protracted interruption of supplies for any reason may adversely affect our financial condition and results of
operations.
Product development activities may not be successful or may be more costly than currently anticipated.
Our business involves a significant level of product development activities, generally in connection with our
customers’ own development activities. If these activities are not as successful as currently anticipated, or if they are
more costly than currently anticipated, future sales and/or earnings could be lower.
Activities necessary to integrate an acquisition may result in costs in excess of current expectations or beless successful than anticipated.
We completed a business acquisition in October 2006 and we may acquire other businesses in the future. If
actual integration costs are higher than amounts assumed, or we are unable to integrate the assets and personnel
acquired in an acquisition as anticipated, our future earnings may be lower than anticipated.
Changes in the estimates of fair value of reporting units or of long-lived assets may result in futureimpairment charges.
Over time, the fair values of long-lived assets change. We test goodwill for impairment annually, and more
often if circumstances require. We also test property, plant, and equipment, and other intangibles for impairment
whenever events or changes in circumstances indicate that the carrying value may not be recoverable. Future
impairment charges may occur if estimates of fair values decrease, which will reduce future earnings.
Future subsidiary results may change the amount of valuation allowances provided for deferred incometax assets.
We establish valuation allowances to reflect the estimated amount of deferred tax assets that might not be
realized. The underlying analysis is performed for individual tax jurisdictions, generally at a subsidiary level. Future
subsidiary results, actual or forecasted, could change the outcome of our analysis and change the amount of
valuation allowances provided for deferred income tax assets.
Manufacturing activities may result in future environmental liabilities.
We use hazardous materials in our manufacturing operations. We also own facilities that were formerly owned
and operated by others that used hazardous materials. The risk that a release of hazardous materials has occurred in
75
84256_Financials.indd Sec1:584256_Financials.indd Sec1:5 12/5/2006 3:08:10 PM12/5/2006 3:08:10 PM

the past, or will occur in the future, cannot be completely eliminated. As a result, we may need to undertake future
environmental remediation activities that will negatively affect our future earnings and financial position.
Amounts accrued for contingencies may be inadequate to cover the amount of loss when the matters areultimately resolved.
We are currently involved in pending or threatened litigation or other legal proceedings regarding employ-
ment, product liability, and contractual matters arising from the normal course of business. We accrue for individual
matters that we believe are likely to result in a loss when ultimately resolved using estimates of the most likely
amount of loss. There may be additional losses that have not been accrued that will reduce future earnings.
Changes in the legal environment in which we operate may affect future sales and expenses.
We operate in a number of countries and are affected by a variety of laws and regulations, including
employment, import, export, business acquisitions, environmental, and taxation matters, among others. Unexpected
changes in the legal environment may result in lower sales or increased expenses in the future.
Operations outside the United States may be subject to additional risks.
Our principal plants include facilities in China and Germany, as well as the United States. The operations
outside the United States could be disrupted by a natural disaster, war, political unrest, terrorist activity, public
health concerns, or other unforeseen events that would be less likely to occur in the United States. Disruption of an
overseas operation could adversely affect our business, financial condition, and results of operations.
Changes in foreign currency exchange rates may decrease margins associated with our sales.
We have situations in which sales agreements and the related cost of sales are predominately denominated in
different currencies. These may involve foreign sales and domestic costs, or vice versa. Each of these situations
involve the risk that the margins associated with these sales could be lower than previous sales or forecasts because
of changes in foreign currency exchange rates.
Changes in assumptions may increase the amount of retirement pension and healthcare benefit obliga-tions and related expense.
Accounting for retirement pension and healthcare benefit obligations and related expense requires the use of
assumptions, including a weighted-average discount rate, an expected long-term rate of return on assets, and a net
healthcare cost trend rate, among others. Benefit obligations and benefit costs are sensitive to changes in these
assumptions. As a result, assumption changes could result in increases in our obligation amounts and expenses.
Industry Risks
Competitors may develop breakthrough technologies that are adopted by our customers.
Many of the components and systems we sell are used in harsh environments with difficult emissions
standards. The technological expertise we have developed and maintained could become less valuable if a
competitor were to develop a breakthrough technology that would allow them to match the performance of
existing technologies at a lower cost. A breakthrough technology could also accelerate the rate of change in
customer demands beyond what existing technologies are capable of achieving.
Changes in competitor strategies may reduce the demand for our products.
Companies compete on the basis of providing products that meet the needs of customers, as well as on the basis
of price, quality, and customer service. Changes in competitive conditions, including the availability of new
products and services, the introduction of new channels of distribution, and changes in OEM and aftermarket
pricing, could negatively affect future sales.
86
84256_Financials.indd Sec1:684256_Financials.indd Sec1:6 12/5/2006 3:08:10 PM12/5/2006 3:08:10 PM
Unforeseen events may occur that significantly reduce commercial airline travel.
Our Aircraft Engine Systems segment accounted for 43% of our sales in 2006, with the majority of sales tied to
commercial aviation. Market demand for our components and systems would be negatively affected by reductions
in commercial airline travel. Certain events have had a notable negative effect on passenger flight miles in the past,
such as the terrorist actions of 2001.
Increasing emission standards that drive certain product sales may be eased or delayed.
We sell components and systems that have been designed to meet demanding emission standards, including
standards that have not yet been implemented but are intended to be soon. If the demands of these emission
standards are eased, our future sales could be lower as potential customers select alternative products or delay
adoption of our products.
Natural gas prices may increase significantly and disproportionately to other sources of fuels used forpower generation.
Commercial producers of electricity use many of our components and systems, most predominately in their
power plants that use natural gas as their fuel source. Commercial producers of electricity are often in a position to
manage its use of different power plant facilities and make decisions based on operating costs. If natural gas prices
were to increase significantly and disproportionately to other sources of fuels, it is likely that the use of our
components and systems would decrease.
The U.S. Government may reduce defense funding or the mix of programs to which such funding isallocated.
The level of U.S. defense spending is subject to periodic congressional appropriation actions, which can
change. The mix of programs to which such funding is allocated is also uncertain. A portion of our sales of
components and systems is to the U.S. Government, primarily in the aerospace market. If the amount of spending
was to decrease, or there was a shift from certain aerospace programs to other programs, our sales could decrease.
Changes in foreign currency exchange rates or in interest rates may reduce the demand for our products.
Changes in foreign currency exchange rates or in interest rates affects demand for capital purchases. Each of
the markets in which we sell operates globally and is influenced by foreign currency exchange rates. Also, capital
expenditures tend to decrease as interest rates and economic uncertainty rise.
Investment Risks
The historic market price of our common stock may not be indicative of future market prices.
The market price of our common stock changes over time. The selling price of our common stock ranged from
a low of $25.10 per share to a high of $38.88 per share in 2006. The causes of stock price volatility are related to
many factors both within and outside management’s control. As a result, we may not be able to maintain or
increase the value of our common stock.
The typical trading volume of our common stock may affect an investor’s ability to sell significant shareholdings in the future without negatively affecting share price.
We currently have approximately 35 million shares of common stock outstanding. While the level of trading
activity will vary by day, the typical trading level represents only a small percentage of shares outstanding. As a
result, a seller of a significant number of shares in a short period of time could negatively affect our share price.
Item 1B. Unresolved Staff Comments
There are no unresolved comments from the staff of the U.S. Securities and Exchange Commission regarding
the periodic or current reports that we filed under the Securities Exchange Act of 1934.
97
84256_Financials.indd Sec1:784256_Financials.indd Sec1:7 12/5/2006 3:08:10 PM12/5/2006 3:08:10 PM
Item 2. Properties
Our principal plants are as follows:
United States
Fort Collins, Colorado — Industrial Controls manufacturing and corporate offices
Loveland, Colorado — Industrial Controls manufacturing and partially leased to a third party
Niles, Illinois — Industrial Controls manufacturing Rockford, Illinois — Aircraft Engine Systems manufac-
turing and corporate offices
Rockton, Illinois — Aircraft Engine Systems manufacturing and repair and overhaul
Zeeland, Michigan — Aircraft Engine Systems manufacturing
Greenville, South Carolina (leased) — Industrial Controls manufacturing
Other Countries
Suzhou, Peoples’ Republic of China (leased) — Industrial Controls manufacturing
Aken, Germany (leased) — Industrial Controls manufacturing
Kempen, Germany — Industrial Controls manufacturing (acquired on October 31, 2006, subsequent to the
year ended September 30, 2006)
Stuttgart, Germany (leased) — Industrial Controls manufacturing
Prestwick, Scotland, United Kingdom (leased) — Aircraft Engine Systems repair and overhaul
Our principal plants are suitable and adequate for the manufacturing and other activities performed at those
plants, and we believe our utilization levels are generally high. With continuing advancements in manufacturing
technology and operational improvements, we believe we can continue to increase production without additional
plants.
In addition to the principal plants listed above, we own facilities in Japan, The Netherlands, and
United Kingdom, and lease several facilities in locations worldwide, which are used primarily for sales and
service activities. The United Kingdom facility also serves as a key development site for diesel fuel injection
products.
We plan on changing the designation of our corporate headquarters from Rockford, Illinois to Fort Collins,
Colorado, effective January 1, 2007. In recent years, we have maintained corporate offices for our principal
executive officers in both locations. The address of our Fort Collins location is 1000 East Drake Road, Fort Collins,
Colorado, 80525, and its phone number is (970) 498-5811.
Item 3. Legal Proceedings
We are currently involved in pending or threatened litigation or other legal proceedings regarding employ-
ment, product liability, and contractual matters arising from the normal course of business. These matters are
discussed in the Notes to the Consolidated Financial Statements in “Item 8 — Financial Statements and Supple-
mentary Data.” We currently do not have any administrative or judicial proceedings arising under any Federal,
State, or local provisions regulating the discharge of materials into the environment or primarily for the purpose of
protecting the environment.
Item 4. Submission of Matters to a Vote of Security Holders
There were no matters submitted to a vote of security holders during the fourth quarter of 2006.
108
84256_Financials.indd Sec1:884256_Financials.indd Sec1:8 12/5/2006 3:08:11 PM12/5/2006 3:08:11 PM
PART II
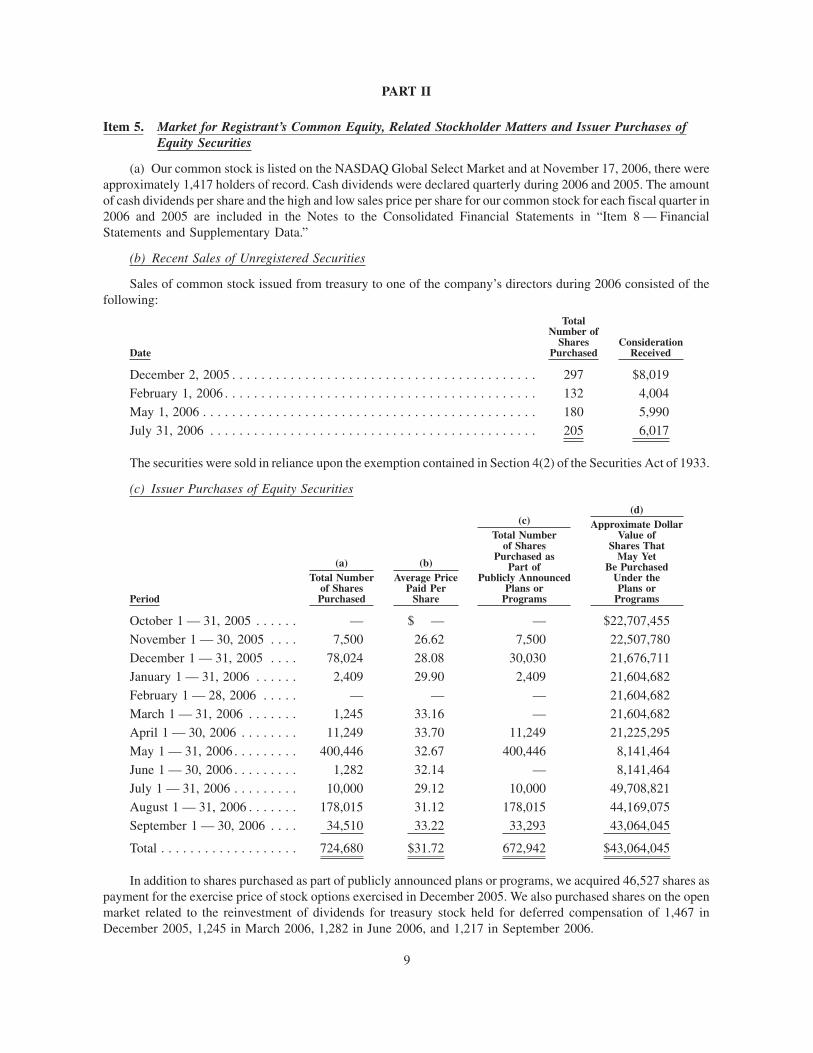
Item 5. Market for Registrant’s Common Equity, Related Stockholder Matters and Issuer Purchases ofEquity Securities
(a) Our common stock is listed on the NASDAQ Global Select Market and at November 17, 2006, there were
approximately 1,417 holders of record. Cash dividends were declared quarterly during 2006 and 2005. The amount
of cash dividends per share and the high and low sales price per share for our common stock for each fiscal quarter in
2006 and 2005 are included in the Notes to the Consolidated Financial Statements in “Item 8 — Financial
Statements and Supplementary Data.”
(b) Recent Sales of Unregistered Securities
Sales of common stock issued from treasury to one of the company’s directors during 2006 consisted of the
following:
Date
TotalNumber of
SharesPurchased
ConsiderationReceived
December 2, 2005 . . . . . . . . . . . . . . . . . . . . . . . . . . . . . . . . . . . . . . . . . . 297 $8,019
February 1, 2006 . . . . . . . . . . . . . . . . . . . . . . . . . . . . . . . . . . . . . . . . . . . 132 4,004
May 1, 2006 . . . . . . . . . . . . . . . . . . . . . . . . . . . . . . . . . . . . . . . . . . . . . . 180 5,990
July 31, 2006 . . . . . . . . . . . . . . . . . . . . . . . . . . . . . . . . . . . . . . . . . . . . . 205 6,017
The securities were sold in reliance upon the exemption contained in Section 4(2) of the Securities Act of 1933.
(c) Issuer Purchases of Equity Securities
Period
Total Numberof SharesPurchased
Average PricePaid Per
Share
Total Numberof Shares
Purchased asPart of
Publicly AnnouncedPlans or
Programs
Approximate DollarValue of
Shares ThatMay Yet
Be PurchasedUnder thePlans or
Programs
(a) (b)
(c)(d)
October 1 — 31, 2005 . . . . . . — $ — — $22,707,455
November 1 — 30, 2005 . . . . 7,500 26.62 7,500 22,507,780
December 1 — 31, 2005 . . . . 78,024 28.08 30,030 21,676,711
January 1 — 31, 2006 . . . . . . 2,409 29.90 2,409 21,604,682
February 1 — 28, 2006 . . . . . — — — 21,604,682
March 1 — 31, 2006 . . . . . . . 1,245 33.16 — 21,604,682
April 1 — 30, 2006 . . . . . . . . 11,249 33.70 11,249 21,225,295
May 1 — 31, 2006 . . . . . . . . . 400,446 32.67 400,446 8,141,464
June 1 — 30, 2006 . . . . . . . . . 1,282 32.14 — 8,141,464
July 1 — 31, 2006 . . . . . . . . . 10,000 29.12 10,000 49,708,821
August 1 — 31, 2006 . . . . . . . 178,015 31.12 178,015 44,169,075
September 1 — 30, 2006 . . . . 34,510 33.22 33,293 43,064,045
Total . . . . . . . . . . . . . . . . . . . 724,680 $31.72 672,942 $43,064,045
In addition to shares purchased as part of publicly announced plans or programs, we acquired 46,527 shares as
payment for the exercise price of stock options exercised in December 2005. We also purchased shares on the open
market related to the reinvestment of dividends for treasury stock held for deferred compensation of 1,467 in
December 2005, 1,245 in March 2006, 1,282 in June 2006, and 1,217 in September 2006.
119
84256_Financials.indd Sec1:984256_Financials.indd Sec1:9 12/5/2006 3:08:11 PM12/5/2006 3:08:11 PM
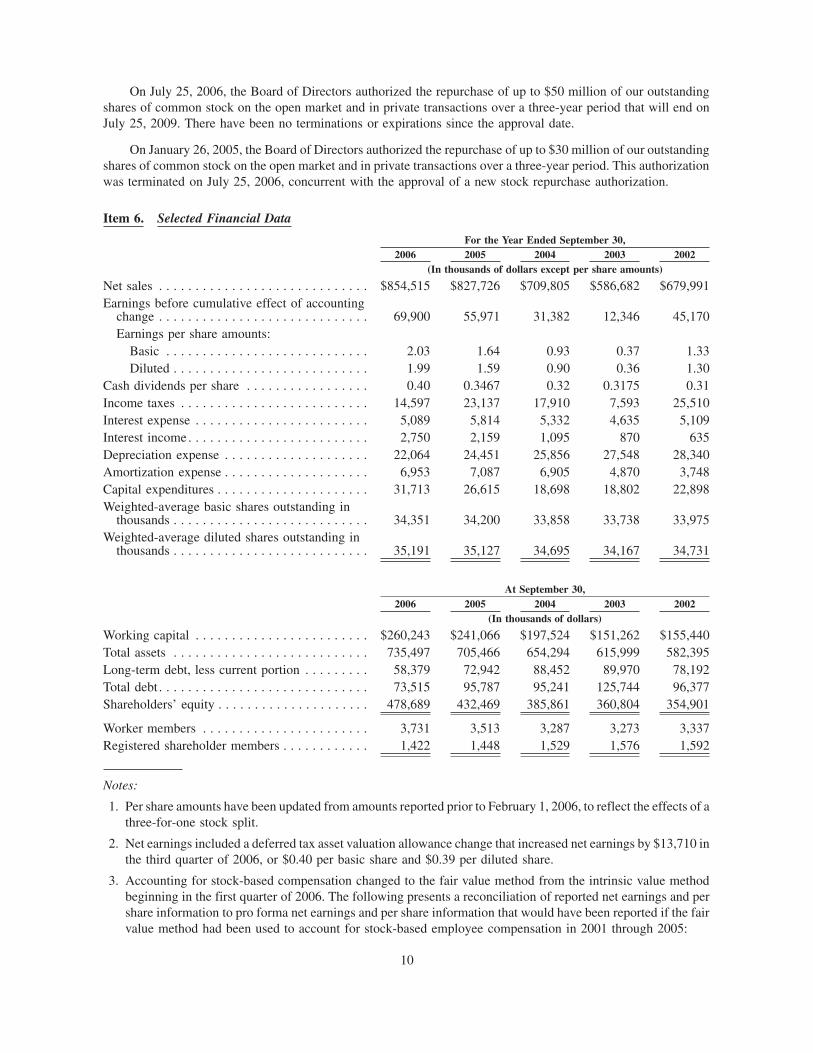
On July 25, 2006, the Board of Directors authorized the repurchase of up to $50 million of our outstanding
shares of common stock on the open market and in private transactions over a three-year period that will end on
July 25, 2009. There have been no terminations or expirations since the approval date.
On January 26, 2005, the Board of Directors authorized the repurchase of up to $30 million of our outstanding
shares of common stock on the open market and in private transactions over a three-year period. This authorization
was terminated on July 25, 2006, concurrent with the approval of a new stock repurchase authorization.
Item 6. Selected Financial Data
2006 2005 2004 2003 2002For the Year Ended September 30,
(In thousands of dollars except per share amounts)
Net sales . . . . . . . . . . . . . . . . . . . . . . . . . . . . . $854,515 $827,726 $709,805 $586,682 $679,991
Earnings before cumulative effect of accountingchange . . . . . . . . . . . . . . . . . . . . . . . . . . . . . 69,900 55,971 31,382 12,346 45,170
Earnings per share amounts:
Basic . . . . . . . . . . . . . . . . . . . . . . . . . . . . 2.03 1.64 0.93 0.37 1.33
Diluted . . . . . . . . . . . . . . . . . . . . . . . . . . . 1.99 1.59 0.90 0.36 1.30
Cash dividends per share . . . . . . . . . . . . . . . . . 0.40 0.3467 0.32 0.3175 0.31
Income taxes . . . . . . . . . . . . . . . . . . . . . . . . . . 14,597 23,137 17,910 7,593 25,510
Interest expense . . . . . . . . . . . . . . . . . . . . . . . . 5,089 5,814 5,332 4,635 5,109
Interest income . . . . . . . . . . . . . . . . . . . . . . . . . 2,750 2,159 1,095 870 635
Depreciation expense . . . . . . . . . . . . . . . . . . . . 22,064 24,451 25,856 27,548 28,340
Amortization expense . . . . . . . . . . . . . . . . . . . . 6,953 7,087 6,905 4,870 3,748
Capital expenditures . . . . . . . . . . . . . . . . . . . . . 31,713 26,615 18,698 18,802 22,898
Weighted-average basic shares outstanding inthousands . . . . . . . . . . . . . . . . . . . . . . . . . . . 34,351 34,200 33,858 33,738 33,975
Weighted-average diluted shares outstanding inthousands . . . . . . . . . . . . . . . . . . . . . . . . . . . 35,191 35,127 34,695 34,167 34,731
2006 2005 2004 2003 2002At September 30,
(In thousands of dollars)
Working capital . . . . . . . . . . . . . . . . . . . . . . . . $260,243 $241,066 $197,524 $151,262 $155,440
Total assets . . . . . . . . . . . . . . . . . . . . . . . . . . . 735,497 705,466 654,294 615,999 582,395
Long-term debt, less current portion . . . . . . . . . 58,379 72,942 88,452 89,970 78,192
Total debt . . . . . . . . . . . . . . . . . . . . . . . . . . . . . 73,515 95,787 95,241 125,744 96,377
Shareholders’ equity . . . . . . . . . . . . . . . . . . . . . 478,689 432,469 385,861 360,804 354,901
Worker members . . . . . . . . . . . . . . . . . . . . . . . 3,731 3,513 3,287 3,273 3,337
Registered shareholder members . . . . . . . . . . . . 1,422 1,448 1,529 1,576 1,592
Notes:
1. Per share amounts have been updated from amounts reported prior to February 1, 2006, to reflect the effects of a
three-for-one stock split.
2. Net earnings included a deferred tax asset valuation allowance change that increased net earnings by $13,710 in
the third quarter of 2006, or $0.40 per basic share and $0.39 per diluted share.
3. Accounting for stock-based compensation changed to the fair value method from the intrinsic value method
beginning in the first quarter of 2006. The following presents a reconciliation of reported net earnings and per
share information to pro forma net earnings and per share information that would have been reported if the fair
value method had been used to account for stock-based employee compensation in 2001 through 2005:
1210
84256_Financials.indd Sec1:1084256_Financials.indd Sec1:10 12/5/2006 3:08:11 PM12/5/2006 3:08:11 PM

2005 2004 2003 2002For the Year Ended September 30,
(In thousands of dollars except per share amounts)
Reported net earnings . . . . . . . . . . . . . . . . . . . . . . . . . . $55,971 $31,382 $12,346 $42,681
Stock-based compensation expense using the fair valuemethod, net of income tax. . . . . . . . . . . . . . . . . . . . . 1,502 1,400 1,025 910
Pro forma net earnings . . . . . . . . . . . . . . . . . . . . . . . . . $54,469 $29,982 $11,321 $41,771
Reported net earnings per share amounts:
Basic . . . . . . . . . . . . . . . . . . . . . . . . . . . . . . . . . . . . $ 1.64 $ 0.93 $ 0.37 $ 1.26
Diluted . . . . . . . . . . . . . . . . . . . . . . . . . . . . . . . . . . . 1.59 0.90 0.36 1.23
Pro forma net earnings per share amounts:
Basic . . . . . . . . . . . . . . . . . . . . . . . . . . . . . . . . . . . . $ 1.59 $ 0.89 $ 0.34 $ 1.23
Diluted . . . . . . . . . . . . . . . . . . . . . . . . . . . . . . . . . . . 1.55 0.86 0.33 1.20
Item 7. Management’s Discussion and Analysis of Financial Condition and Results of Operations
We prepared the following discussion and analysis to help you better understand our financial condition,
changes in our financial condition, and results of operations. This discussion should be read with the consolidated
financial statements.
OVERVIEW
Woodward designs, manufactures, and services energy control systems and components for aircraft and
industrial engines and turbines. Leading OEMs throughout the world use our products and services in the power
generation, process industries, transportation, and aerospace markets.
Our strategic focus is Energy Control and Optimization Solutions. The control of energy — fluid energy,
combustion, electrical energy, and motion — is a growing requirement in the markets we serve. Our customers look
to us to optimize the efficiency, emissions, and operations of power equipment. Our core technologies leverage well
across our markets and customer applications, enabling us to develop and integrate cost-effective and state-of-the-
art fuel, combustion, fluid, actuation, and electronic systems. We focus primarily on OEMs and equipment
packagers, partnering with them to bring superior component and system solutions to their demanding applications.
We have two operating segments — Industrial Controls and Aircraft Engine Systems. Industrial Controls is
focused on systems and components that provide energy control and optimization solutions for industrial markets,
which includes power generation, transportation, and process industries. Aircraft Engine Systems is focused on
systems and components that provide energy control and optimization solutions for the aerospace market. We use
segment information internally to assess the performance of each segment and to make decisions on the allocation
of resources.
Our sales and earnings have grown over the last four years. In 2006, our sales exceeded $850 million for the
first time in our history and our net earnings were just short of $70 million. Our markets have substantially
recovered from the declines that occurred in 2002 and 2003 and both of our segments benefited from these factors.
In addition, net earnings for 2006 benefited from a change in the valuation allowance for deferred tax assets of
$13.7 million.
Improvement of Industrial Controls’ earnings was a key objective for 2006, and its earnings nearly doubled
from 5.4% of sales in 2005 to 10.3% in 2006. This improvement was driven by a manufacturing consolidation in
2005 and early 2006, supply chain productivity initiatives, and market and management-initiated changes in our
product mix.
Aircraft Engine Systems continued to generate earnings within our targeted range of 20 to 22% of sales in
2006, and we are continuing to invest substantial amounts in research and development activities to sustain future
1311
84256_Financials.indd Sec1:1184256_Financials.indd Sec1:11 12/5/2006 3:08:11 PM12/5/2006 3:08:11 PM
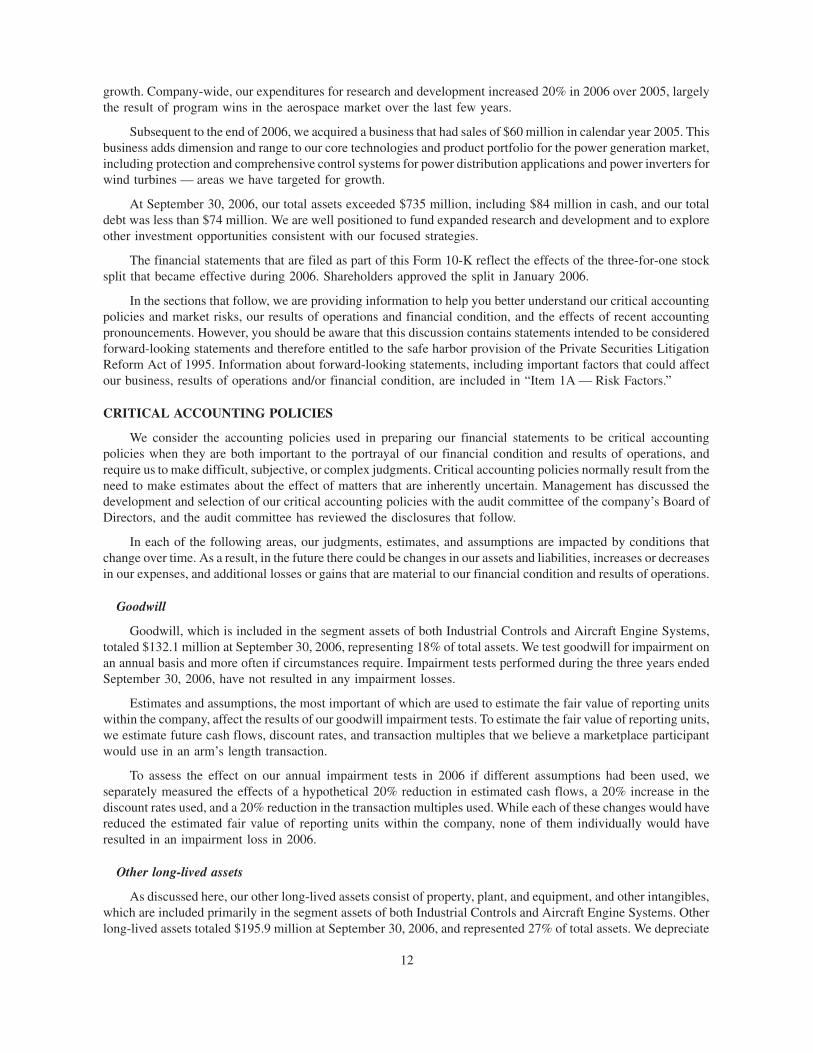
growth. Company-wide, our expenditures for research and development increased 20% in 2006 over 2005, largely
the result of program wins in the aerospace market over the last few years.
Subsequent to the end of 2006, we acquired a business that had sales of $60 million in calendar year 2005. This
business adds dimension and range to our core technologies and product portfolio for the power generation market,
including protection and comprehensive control systems for power distribution applications and power inverters for
wind turbines — areas we have targeted for growth.
At September 30, 2006, our total assets exceeded $735 million, including $84 million in cash, and our total
debt was less than $74 million. We are well positioned to fund expanded research and development and to explore
other investment opportunities consistent with our focused strategies.
The financial statements that are filed as part of this Form 10-K reflect the effects of the three-for-one stock
split that became effective during 2006. Shareholders approved the split in January 2006.
In the sections that follow, we are providing information to help you better understand our critical accounting
policies and market risks, our results of operations and financial condition, and the effects of recent accounting
pronouncements. However, you should be aware that this discussion contains statements intended to be considered
forward-looking statements and therefore entitled to the safe harbor provision of the Private Securities Litigation
Reform Act of 1995. Information about forward-looking statements, including important factors that could affect
our business, results of operations and/or financial condition, are included in “Item 1A — Risk Factors.”
CRITICAL ACCOUNTING POLICIES
We consider the accounting policies used in preparing our financial statements to be critical accounting
policies when they are both important to the portrayal of our financial condition and results of operations, and
require us to make difficult, subjective, or complex judgments. Critical accounting policies normally result from the
need to make estimates about the effect of matters that are inherently uncertain. Management has discussed the
development and selection of our critical accounting policies with the audit committee of the company’s Board of
Directors, and the audit committee has reviewed the disclosures that follow.
In each of the following areas, our judgments, estimates, and assumptions are impacted by conditions that
change over time. As a result, in the future there could be changes in our assets and liabilities, increases or decreases
in our expenses, and additional losses or gains that are material to our financial condition and results of operations.
Goodwill
Goodwill, which is included in the segment assets of both Industrial Controls and Aircraft Engine Systems,
totaled $132.1 million at September 30, 2006, representing 18% of total assets. We test goodwill for impairment on
an annual basis and more often if circumstances require. Impairment tests performed during the three years ended
September 30, 2006, have not resulted in any impairment losses.
Estimates and assumptions, the most important of which are used to estimate the fair value of reporting units
within the company, affect the results of our goodwill impairment tests. To estimate the fair value of reporting units,
we estimate future cash flows, discount rates, and transaction multiples that we believe a marketplace participant
would use in an arm’s length transaction.
To assess the effect on our annual impairment tests in 2006 if different assumptions had been used, we
separately measured the effects of a hypothetical 20% reduction in estimated cash flows, a 20% increase in the
discount rates used, and a 20% reduction in the transaction multiples used. While each of these changes would have
reduced the estimated fair value of reporting units within the company, none of them individually would have
resulted in an impairment loss in 2006.
Other long-lived assets
As discussed here, our other long-lived assets consist of property, plant, and equipment, and other intangibles,
which are included primarily in the segment assets of both Industrial Controls and Aircraft Engine Systems. Other
long-lived assets totaled $195.9 million at September 30, 2006, and represented 27% of total assets. We depreciate
1412
84256_Financials.indd Sec1:1284256_Financials.indd Sec1:12 12/5/2006 3:08:11 PM12/5/2006 3:08:11 PM

or amortize long-lived assets over their estimated useful lives. Depreciation and amortization expense associated
with these assets totaled $29.0 million in 2006, $31.5 million in 2005, and $32.8 million in 2004. We also test long-
lived assets for recoverability whenever events or changes in circumstances indicate that the carrying values may
not be recoverable.
The selection of useful lives for depreciation and amortization purposes requires judgment. If we had increased
the remaining useful life of all assets being depreciated and amortized by one year, depreciation and amortization
expense would have decreased, and the year-end carrying value of long-lived assets would have increased, by
approximately $3.5 million in 2006. Similarly, if we had decreased the remaining useful lives by one year,
depreciation and amortization expense would have increased, and the year-end carrying value of long-lived assets
would have decreased, by approximately $4.6 million in 2006. (The results of this sensitivity analysis ignore the
impact of individual assets that might have become fully depreciated or amortized during 2006 had these
hypothetical changes been made.)
The carrying value of a long-lived asset, or related group of assets, is reduced to its fair value whenever
estimates of future cash flows are insufficient to indicate the carrying value is recoverable. We form judgments as to
whether recoverability should be assessed, we estimate future cash flows and, if necessary, we estimate fair value.
Fair value estimates are most often based on estimated future cash flows and assumed discount rates.
Deferred income tax asset valuation allowances
Valuation allowances for deferred income tax assets totaled $2.6 million at September 30, 2006, representing
3% of deferred income tax assets before the allowances. The net changes in the valuation allowances increased total
comprehensive earnings (comprised of net earnings and foreign currency translation adjustments) by $15.2 million
in 2006 and $0.9 million in 2005.
Deferred tax assets are reduced by a valuation allowance if, based on the weight of available evidence, it is
more likely than not that some portion or all of the deferred tax assets will not be realized. Both positive and
negative evidence are considered in forming our judgment as to whether a valuation allowance is appropriate, and
more weight is given to evidence that can be objectively verified. Valuation allowances are reassessed whenever
there are changes in circumstances that may cause a change in judgment. In 2006, additional objective evidence
became available regarding earnings in tax jurisdictions that had unexpired net operating loss carryforwards that
affected our judgment about the valuation allowance that existed at the beginning of the year. If we had made
different judgments regarding the realizability of deferred tax assets, our valuation allowance and income tax
expense may have been higher or lower than amounts reported.
Retirement pension and healthcare benefits
The cost of retirement pension and healthcare benefits is recognized over employee service periods using an
actuarial-based attribution approach. Our net accrued benefit for these retirement benefits totaled $61.5 million at
September 30, 2006, which represented 24% of total liabilities and consisted of the following (in millions):
Pension Healthcare
• Benefit obligation. . . . . . . . . . . . . . . . . . . . . . . . . . . . . . . . . . . . . . . . . . . . $ 76 $ 52
• Fair value of plan assets . . . . . . . . . . . . . . . . . . . . . . . . . . . . . . . . . . . . . . . (58) —
• Unrecognized net losses . . . . . . . . . . . . . . . . . . . . . . . . . . . . . . . . . . . . . . . (16) (10)
• Unamortized prior service cost . . . . . . . . . . . . . . . . . . . . . . . . . . . . . . . . . . 3 8
• Other items affecting the liability . . . . . . . . . . . . . . . . . . . . . . . . . . . . . . . . 6 —
1513
84256_Financials.indd Sec1:1384256_Financials.indd Sec1:13 12/5/2006 3:08:11 PM12/5/2006 3:08:11 PM
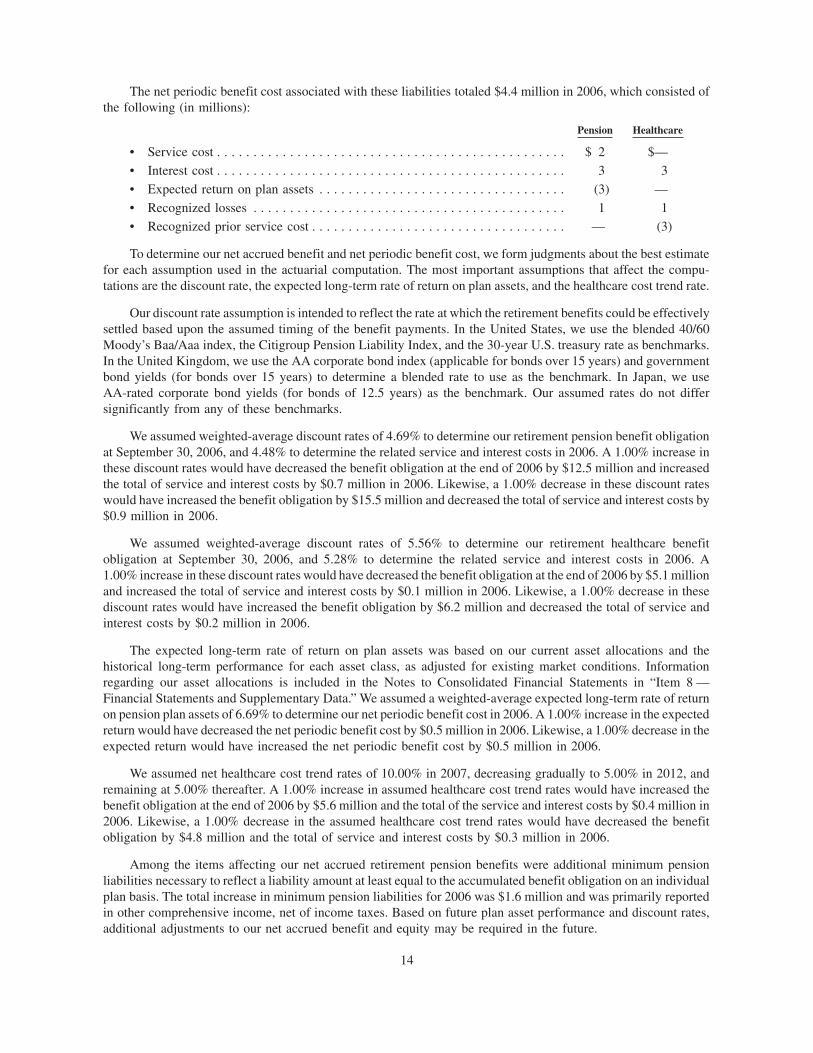
The net periodic benefit cost associated with these liabilities totaled $4.4 million in 2006, which consisted of
the following (in millions):
Pension Healthcare
• Service cost . . . . . . . . . . . . . . . . . . . . . . . . . . . . . . . . . . . . . . . . . . . . . . . . $ 2 $—
• Interest cost . . . . . . . . . . . . . . . . . . . . . . . . . . . . . . . . . . . . . . . . . . . . . . . . 3 3
• Expected return on plan assets . . . . . . . . . . . . . . . . . . . . . . . . . . . . . . . . . . (3) —
• Recognized losses . . . . . . . . . . . . . . . . . . . . . . . . . . . . . . . . . . . . . . . . . . . 1 1
• Recognized prior service cost . . . . . . . . . . . . . . . . . . . . . . . . . . . . . . . . . . . — (3)
To determine our net accrued benefit and net periodic benefit cost, we form judgments about the best estimate
for each assumption used in the actuarial computation. The most important assumptions that affect the compu-
tations are the discount rate, the expected long-term rate of return on plan assets, and the healthcare cost trend rate.
Our discount rate assumption is intended to reflect the rate at which the retirement benefits could be effectively
settled based upon the assumed timing of the benefit payments. In the United States, we use the blended 40/60
Moody’s Baa/Aaa index, the Citigroup Pension Liability Index, and the 30-year U.S. treasury rate as benchmarks.
In the United Kingdom, we use the AA corporate bond index (applicable for bonds over 15 years) and government
bond yields (for bonds over 15 years) to determine a blended rate to use as the benchmark. In Japan, we use
AA-rated corporate bond yields (for bonds of 12.5 years) as the benchmark. Our assumed rates do not differ
significantly from any of these benchmarks.
We assumed weighted-average discount rates of 4.69% to determine our retirement pension benefit obligation
at September 30, 2006, and 4.48% to determine the related service and interest costs in 2006. A 1.00% increase in
these discount rates would have decreased the benefit obligation at the end of 2006 by $12.5 million and increased
the total of service and interest costs by $0.7 million in 2006. Likewise, a 1.00% decrease in these discount rates
would have increased the benefit obligation by $15.5 million and decreased the total of service and interest costs by
$0.9 million in 2006.
We assumed weighted-average discount rates of 5.56% to determine our retirement healthcare benefit
obligation at September 30, 2006, and 5.28% to determine the related service and interest costs in 2006. A
1.00% increase in these discount rates would have decreased the benefit obligation at the end of 2006 by $5.1 million
and increased the total of service and interest costs by $0.1 million in 2006. Likewise, a 1.00% decrease in these
discount rates would have increased the benefit obligation by $6.2 million and decreased the total of service and
interest costs by $0.2 million in 2006.
The expected long-term rate of return on plan assets was based on our current asset allocations and the
historical long-term performance for each asset class, as adjusted for existing market conditions. Information
regarding our asset allocations is included in the Notes to Consolidated Financial Statements in “Item 8 —
Financial Statements and Supplementary Data.” We assumed a weighted-average expected long-term rate of return
on pension plan assets of 6.69% to determine our net periodic benefit cost in 2006. A 1.00% increase in the expected
return would have decreased the net periodic benefit cost by $0.5 million in 2006. Likewise, a 1.00% decrease in the
expected return would have increased the net periodic benefit cost by $0.5 million in 2006.
We assumed net healthcare cost trend rates of 10.00% in 2007, decreasing gradually to 5.00% in 2012, and
remaining at 5.00% thereafter. A 1.00% increase in assumed healthcare cost trend rates would have increased the
benefit obligation at the end of 2006 by $5.6 million and the total of the service and interest costs by $0.4 million in
2006. Likewise, a 1.00% decrease in the assumed healthcare cost trend rates would have decreased the benefit
obligation by $4.8 million and the total of service and interest costs by $0.3 million in 2006.
Among the items affecting our net accrued retirement pension benefits were additional minimum pension
liabilities necessary to reflect a liability amount at least equal to the accumulated benefit obligation on an individual
plan basis. The total increase in minimum pension liabilities for 2006 was $1.6 million and was primarily reported
in other comprehensive income, net of income taxes. Based on future plan asset performance and discount rates,
additional adjustments to our net accrued benefit and equity may be required in the future.
1614
84256_Financials.indd Sec1:1484256_Financials.indd Sec1:14 12/5/2006 3:08:12 PM12/5/2006 3:08:12 PM

MARKET RISKS
Our long-term debt is sensitive to changes in interest rates. We monitor trends in interest rates as a basis for
determining whether to enter into fixed rate or variable rate debt agreements, the duration of such agreements, and
whether to use hedging strategies. Our primary objective is to minimize our long-term costs of borrowing. At
September 30, 2006, our long-term debt consisted of fixed rate agreements. As measured at September 30, 2006, a
hypothetical 1% immediate increase in interest rates would reduce the fair value of our long-term debt by
approximately $1.9 million.
Assets, liabilities, and commitments that are to be settled in cash and are denominated in foreign currencies for
transaction purposes are sensitive to changes in currency exchange rates. We monitor trends in foreign currency
exchange rates and our exposure to changes in those rates as a basis for determining whether to use hedging
strategies. Our primary exposures are to the European Monetary Union euro and the Japanese yen. We do not have
any derivative instruments associated with foreign currency exchange rates. A hypothetical 10% immediate
increase in the value of the United States dollar relative to all other currencies, when applied to September 30, 2006,
balances, would adversely affect our 2007 net earnings and cash flows by approximately $3.6 million. Last year, a
hypothetical 10% immediate increase in the value of the United States dollar relative to all other currencies would
have adversely affected our 2006 net earnings and cash flows by $2.2 million.
RESULTS OF OPERATIONS
SalesIn Thousands for the Year Ended September 30, 2006 2005 2004
External net sales:
Industrial Controls . . . . . . . . . . . . . . . . . . . . . . . . . . . . . . . . $540,975 $536,937 $439,801
Aircraft Engine Systems . . . . . . . . . . . . . . . . . . . . . . . . . . . . 313,540 290,789 270,004
Consolidated net sales . . . . . . . . . . . . . . . . . . . . . . . . . . . . . . . $854,515 $827,726 $709,805
2006 Compared to 2005
Consolidated net sales increased 3% in 2006 compared to 2005, attributable to the following (in millions):
• Aircraft Engine Systems’ sales volume changes . . . . . . . . . . . . . . . . . . . . . . . . . . . . . . . . $21
• Price changes . . . . . . . . . . . . . . . . . . . . . . . . . . . . . . . . . . . . . . . . . . . . . . . . . . . . . . . . . 15
• Foreign currency translation rate changes . . . . . . . . . . . . . . . . . . . . . . . . . . . . . . . . . . . . . (7)
• Industrial Controls’ sales volume changes . . . . . . . . . . . . . . . . . . . . . . . . . . . . . . . . . . . . . (2)
Aircraft Engine Systems’ sales volume changes: Aircraft Engine Systems’ improvement continues to reflect
the effects of favorable trends in commercial aviation. Our commercial OEM sales have increased, driven by the
higher production levels of narrow-body and wide-body aircraft by Boeing and Airbus, especially the A320 and
Boeing 777. Orders for new aircraft by Asian airlines have been particularly strong. Regional jet production by
Embraer and Bombardier was fairly similar to the prior year. Sales related to business jets were up slightly, and we
anticipate additional growth in 2007 with the launches of the Cessna Mustang and Eclipse 500 jets. We also
continued to see a trend toward higher revenue passenger miles experienced by commercial airlines and cargo
growth, which drives aircraft usage and has a positive effect on our aftermarket sales. We estimate approximately
half of Aircraft Engine Systems’ sales were aftermarket sales in 2006 and 2005. Sales for military applications in
2006 were similar to 2005 levels.
Price changes: Price changes were made primarily in response to material cost increases in Industrial
Controls. The material cost increases were related to price fluctuations of commodities from which mechanical,
electronic, or electromagnetic components are produced.
Industrial Controls’ sales volume changes: Overall, Industrial Controls sales volumes were near the same
levels achieved a year ago. While shipment volumes increased for many of our products, we experienced lower sales
of turbine combustion products used in power generation, alternative fuel systems that are sold to Chinese OEMs,
1715
84256_Financials.indd Sec1:1584256_Financials.indd Sec1:15 12/5/2006 3:08:12 PM12/5/2006 3:08:12 PM

and pump sales to an Asian customer that secured an alternative source. In total, these decreases totaled
approximately $38 million.
We believe the decrease in sales of turbine combustion products is related to inventory adjustments made by
our largest customer. Customer inventory increased in 2004 and 2005 and was reduced in 2006. We believe their
inventory is now at sustainable levels and will be replenished at approximately their rate of sales.
We have attributed the decrease in sales of alternative fuel systems for Chinese OEMs to production and
ordering patterns typical in the Chinese market. Customers in China have shown a tendency to batch their orders and
engine production in such a manner that results in greater variability than is typical among customers in other
markets.
Increased sales of other products largely offset these decreases, including sales of process automation valves
and actuators that targeted new applications for use in the process industry. The core technologies used in fluid
systems, which have typically been applied to gas engines, gas and steam turbines, and compressors, can be applied
to the balance of plant equipment in process automation applications. In 2006, we developed a new product for this
adjacent market, generating sales of approximately $6 million.
Other increases in sales were primarily driven by increased demand for distributed power, marine, and heavy
equipment applications.
2005 Compared to 2004
Consolidated net sales increased 17% in 2005 compared to 2004, attributable to the following (in millions):
• Industrial Controls’ sales volume changes . . . . . . . . . . . . . . . . . . . . . . . . . . . . . . . . . . . . . $89
• Aircraft Engine Systems’ sales volume changes . . . . . . . . . . . . . . . . . . . . . . . . . . . . . . . . 19
• Foreign currency translation rate changes . . . . . . . . . . . . . . . . . . . . . . . . . . . . . . . . . . . . . 7
• Price changes . . . . . . . . . . . . . . . . . . . . . . . . . . . . . . . . . . . . . . . . . . . . . . . . . . . . . . . . . 3
Industrial Controls’ sales volume changes: Industrial Controls benefited from a broad industrial recovery
that included the segment’s power generation and transportation markets. We experienced higher demand for large
gas turbine fuel nozzles — the area affected most by the severe market declines of 2002 and 2003 — driven in part
by power generation improvement projects in Asia and Eastern Europe. We also won a number of new programs,
including one for an alternative fuel engine used in Asia, which resulted in increased sales. Use of alternative fuels
has increased in Asia in recent years due to more stringent environmental emission standards and the availability of
natural gas as a fuel source in the region.
Aircraft Engine Systems’ sales volume changes: Aircraft Engine Systems’ improvement reflects the effects
of favorable trends in commercial aviation. We experienced modest growth in commercial OEM sales, as Boeing
and Airbus ramped up their production levels for narrow- and wide-body aircraft. We also have seen a continuation
of the trend toward higher revenue passenger miles experienced by commercial airlines and cargo growth, which
has driven greater utilization of aircraft and higher aftermarket sales for us. We estimate approximately half of
Aircraft Engine Systems’ sales were aftermarket sales in 2005 and 2004.
Costs and Expenses
In Thousands for the Year Ended September 30, 2006 2005 2004
Cost of goods sold . . . . . . . . . . . . . . . . . . . . . . . . . . . . . . . . . . $612,263 $623,680 $542,240
Selling, general, and administrative expenses . . . . . . . . . . . . . . 92,013 79,858 70,949
Research and development costs . . . . . . . . . . . . . . . . . . . . . . . . 59,861 49,996 40,057
All other expense items . . . . . . . . . . . . . . . . . . . . . . . . . . . . . . 12,876 14,390 12,942
Curtailment gain . . . . . . . . . . . . . . . . . . . . . . . . . . . . . . . . . . . — (7,825) —
Interest and other income . . . . . . . . . . . . . . . . . . . . . . . . . . . . . (6,995) (11,481) (5,675)
Consolidated costs and expenses . . . . . . . . . . . . . . . . . . . . . . . . $770,018 $748,618 $660,513
1816
84256_Financials.indd Sec1:1684256_Financials.indd Sec1:16 12/5/2006 3:08:12 PM12/5/2006 3:08:12 PM
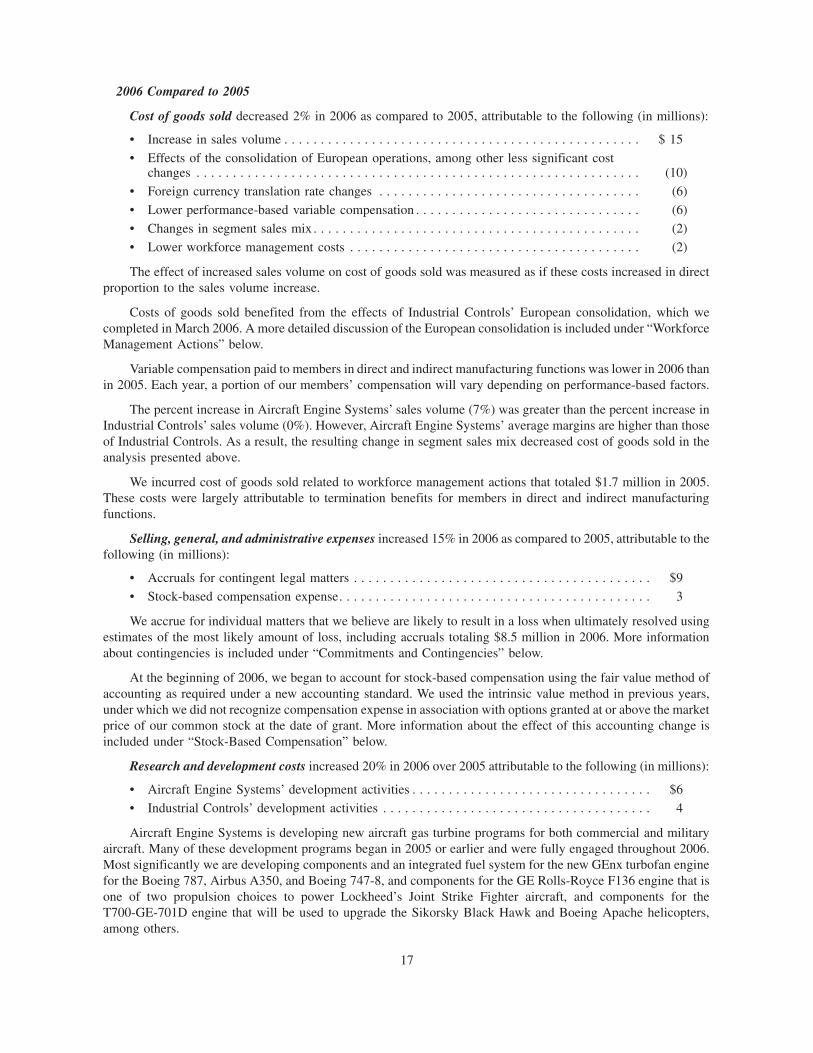
2006 Compared to 2005
Cost of goods sold decreased 2% in 2006 as compared to 2005, attributable to the following (in millions):
• Increase in sales volume . . . . . . . . . . . . . . . . . . . . . . . . . . . . . . . . . . . . . . . . . . . . . . . . . $ 15
• Effects of the consolidation of European operations, among other less significant costchanges . . . . . . . . . . . . . . . . . . . . . . . . . . . . . . . . . . . . . . . . . . . . . . . . . . . . . . . . . . . . . (10)
• Foreign currency translation rate changes . . . . . . . . . . . . . . . . . . . . . . . . . . . . . . . . . . . . (6)
• Lower performance-based variable compensation . . . . . . . . . . . . . . . . . . . . . . . . . . . . . . . (6)
• Changes in segment sales mix . . . . . . . . . . . . . . . . . . . . . . . . . . . . . . . . . . . . . . . . . . . . . (2)
• Lower workforce management costs . . . . . . . . . . . . . . . . . . . . . . . . . . . . . . . . . . . . . . . . (2)
The effect of increased sales volume on cost of goods sold was measured as if these costs increased in direct
proportion to the sales volume increase.
Costs of goods sold benefited from the effects of Industrial Controls’ European consolidation, which we
completed in March 2006. A more detailed discussion of the European consolidation is included under “Workforce
Management Actions” below.
Variable compensation paid to members in direct and indirect manufacturing functions was lower in 2006 than
in 2005. Each year, a portion of our members’ compensation will vary depending on performance-based factors.
The percent increase in Aircraft Engine Systems’ sales volume (7%) was greater than the percent increase in
Industrial Controls’ sales volume (0%). However, Aircraft Engine Systems’ average margins are higher than those
of Industrial Controls. As a result, the resulting change in segment sales mix decreased cost of goods sold in the
analysis presented above.
We incurred cost of goods sold related to workforce management actions that totaled $1.7 million in 2005.
These costs were largely attributable to termination benefits for members in direct and indirect manufacturing
functions.
Selling, general, and administrative expenses increased 15% in 2006 as compared to 2005, attributable to the
following (in millions):
• Accruals for contingent legal matters . . . . . . . . . . . . . . . . . . . . . . . . . . . . . . . . . . . . . . . . . $9
• Stock-based compensation expense. . . . . . . . . . . . . . . . . . . . . . . . . . . . . . . . . . . . . . . . . . . 3
We accrue for individual matters that we believe are likely to result in a loss when ultimately resolved using
estimates of the most likely amount of loss, including accruals totaling $8.5 million in 2006. More information
about contingencies is included under “Commitments and Contingencies” below.
At the beginning of 2006, we began to account for stock-based compensation using the fair value method of
accounting as required under a new accounting standard. We used the intrinsic value method in previous years,
under which we did not recognize compensation expense in association with options granted at or above the market
price of our common stock at the date of grant. More information about the effect of this accounting change is
included under “Stock-Based Compensation” below.
Research and development costs increased 20% in 2006 over 2005 attributable to the following (in millions):
• Aircraft Engine Systems’ development activities . . . . . . . . . . . . . . . . . . . . . . . . . . . . . . . . . $6
• Industrial Controls’ development activities . . . . . . . . . . . . . . . . . . . . . . . . . . . . . . . . . . . . . 4
Aircraft Engine Systems is developing new aircraft gas turbine programs for both commercial and military
aircraft. Many of these development programs began in 2005 or earlier and were fully engaged throughout 2006.
Most significantly we are developing components and an integrated fuel system for the new GEnx turbofan engine
for the Boeing 787, Airbus A350, and Boeing 747-8, and components for the GE Rolls-Royce F136 engine that is
one of two propulsion choices to power Lockheed’s Joint Strike Fighter aircraft, and components for the
T700-GE-701D engine that will be used to upgrade the Sikorsky Black Hawk and Boeing Apache helicopters,
among others.
1917
84256_Financials.indd Sec1:1784256_Financials.indd Sec1:17 12/5/2006 3:08:12 PM12/5/2006 3:08:12 PM

We also increased development activities in Industrial Controls, most notably in conjunction with customers’
development programs as we work closely with our customers early in their own development and design stages,
helping them by developing components and integrated systems that allow them to meet emissions requirements,
increase fuel efficiency, and lower their costs. We also continue to develop products for the turbine auxiliary market.
Turbine auxiliary applications offer multiple opportunities to leverage our existing hydraulic and electric actuation
and valve technologies for off-engine applications.
Curtailment gain relates to an amount recognized in 2005 for the immediate effects of amendments to one of
our retirement healthcare benefit plans. The amendment eliminated retirement healthcare benefits for members that
did not attain age 55 and 10 years of service by January 1, 2006.
Interest and other income decreased in 2006 from 2005 primarily as a result of the 2005 sale of rights to our
aircraft propeller synchronizer products to an unrelated third party, which resulted in a pre-tax gain of $3.8 million.
2005 Compared to 2004
Cost of goods sold increased 15% in 2005 as compared to 2004, attributable to the following (in millions):
• Increase in net sales . . . . . . . . . . . . . . . . . . . . . . . . . . . . . . . . . . . . . . . . . . . . . . . . . . . . $ 90
• Lower workforce management costs . . . . . . . . . . . . . . . . . . . . . . . . . . . . . . . . . . . . . . . . (11)
• Higher performance-based variable compensation . . . . . . . . . . . . . . . . . . . . . . . . . . . . . . 6
• Changes in segment sales mix . . . . . . . . . . . . . . . . . . . . . . . . . . . . . . . . . . . . . . . . . . . . . 3
• Other factors, net . . . . . . . . . . . . . . . . . . . . . . . . . . . . . . . . . . . . . . . . . . . . . . . . . . . . . . (7)
The effect of increased sales on cost of goods sold was measured as if these costs increased in direct proportion
to the 17% sales increase. However, there are many factors that affected cost of goods sold other than volume, the
most important of which are discussed in the paragraphs that follow.
We incurred cost of goods sold related to workforce management actions that totaled $1.7 million in 2005 and
$12.4 million in 2004, netting to a decrease of $10.7 million. These costs were largely attributable to termination
benefits for members in direct and indirect manufacturing functions.
Variable compensation paid to members in direct and indirect manufacturing functions was higher in 2005
than in 2004. Each year, a portion of our members’ compensation will vary depending on performance-based
factors, including consolidated financial results.
The percent increase in Industrial Controls sales (22%) was greater than the percent increase in Aircraft Engine
Systems sales (8%). However, Industrial Controls’ average margins are not as high as those of Aircraft Engine
Systems. As a result, the resulting change in segment sales mix increased cost of goods sold in the analysis
presented above.
Among the other factors affecting cost of goods sold were the favorable operating leverage effect of the
increased sales versus the fixed cost components of cost of goods sold, sales mix within each segment, and changes
in material costs.
Selling, general, and administrative expenses increased 13% in 2005 as compared to 2004, attributable to the
following (in millions):
• Higher performance-based variable compensation . . . . . . . . . . . . . . . . . . . . . . . . . . . . . . . . $3
• Internal control assessment and audit expenses . . . . . . . . . . . . . . . . . . . . . . . . . . . . . . . . . . 2
• Other factors, net . . . . . . . . . . . . . . . . . . . . . . . . . . . . . . . . . . . . . . . . . . . . . . . . . . . . . . . . 4
Variable compensation paid to members in selling and administrative functions was higher in 2005 than in
2004, driven by performance-based factors, including consolidated financial results.
In 2005, we incurred significant expense in assessing our internal control over financial reporting, as required
by the Sarbanes-Oxley Act of 2002. We also incurred higher external audit fees associated with the expanded audit
scope required by the Act.
2018
84256_Financials.indd Sec1:1884256_Financials.indd Sec1:18 12/5/2006 3:08:12 PM12/5/2006 3:08:12 PM

Among the other factors affecting selling, general, and administrative expenses are normal variations in legal
and other professional services and gains and losses related to transactions denominated in foreign currencies.
Research and development costs increased 25% in 2005 over 2004 attributable to the following (in millions):
• Industrial Controls’ development activities . . . . . . . . . . . . . . . . . . . . . . . . . . . . . . . . . . . . . $4
• Aircraft Engine Systems’ development activities . . . . . . . . . . . . . . . . . . . . . . . . . . . . . . . . . 3
• Higher performance-based variable compensation . . . . . . . . . . . . . . . . . . . . . . . . . . . . . . . . 3
We increased development activities in Industrial Controls, most notably in combustion sensing technologies
and in product development for the turbine auxiliary market. Turbine auxiliary applications offer multiple
opportunities to leverage our existing hydraulic and electric actuation and valve technologies for off-engine
applications. We also work closely with our customers early in their own development and design stages, helping
them by developing components and integrated systems that allow them to meet emissions requirements, increase
fuel efficiency, and lower their costs.
Aircraft Engine Systems’ development activities also increased, driven by new aircraft gas turbine programs
for both commercial and military aircraft. Most significantly, we are developing components and an integrated fuel
system for the new GEnx turbofan engine for the Boeing 787, Airbus A350, and Boeing 747 Advanced. We are also
developing components for the GE Rolls-Royce F136 engine that is one of two propulsion choices to power
Lockheed’s Joint Strike Fighter aircraft, and for the T700-GE-701D engine that will be used to upgrade the Sikorsky
Black Hawk and Boeing Apache helicopters, among others.
Variable compensation paid to members that performed research and development activities was higher in
2005 than in 2004, driven by performance-based factors, including consolidated financial results.
Curtailment gain relates to an amount recognized in 2005 for the immediate effects of amendments to one of
our retirement healthcare benefit plans. The amendment eliminated retirement healthcare benefits for members that
will not attain age 55 and 10 years of service by January 1, 2006.
Interest and other income increased in 2005 over 2004 primarily as a result of the sale of rights to our aircraft
propeller synchronizer products to an unrelated third party, which resulted in a pre-tax gain of $3.8 million. In
addition, our interest income increased in 2005 over 2004 as a result of higher cash balances.
Sales associated with the aircraft propeller synchronizer products totaled approximately $2 million annually at
the time we sold rights to the products to a third party.
Stock-Based Compensation
We adopted a new accounting standard for stock-based compensation beginning October 1, 2005 — Statement
of Financial Accounting Standards No. 123R, “Share-Based Payment.” This standard requires us to measure
employee compensation made in the form of stock-based instruments at the grant-date fair value of the stock-based
award and to recognize the compensation over the requisite service period. Upon adoption, we used the modified
prospective application transition method, under which prior periods are not restated in the financial statements.
Prior to October 1, 2005, we used the intrinsic value method to account for stock-based employee compen-
sation under Accounting Principles Board Opinion No. 25, “Accounting for Stock Issued to Employees,” and
therefore we did not recognize compensation expense in association with options granted at or above the market
price of our common stock at the date of grant.
The effect of adopting the new accounting standard on 2006 earnings was that earnings before income taxes
were reduced by $2.9 million and net earnings were reduced by $1.8 million, or $0.05 per basic share and $0.05 per
diluted share. Stock compensation is accounted for as a nonsegment expense. We expect stock compensation
expense in 2007 to be at levels similar to the amount recognized in 2006, although actual amounts will depend upon
a number of factors, including our common stock price at the date of grant.
If we had applied the provisions of the new accounting standard last year, our earnings before income taxes for
2005 would have been reduced by $2.4 million and our net earnings would have been reduced by $1.5 million, or
$0.05 per basic share and $0.04 per diluted share.
2119
84256_Financials.indd Sec1:1984256_Financials.indd Sec1:19 12/5/2006 3:08:13 PM12/5/2006 3:08:13 PM

Adoption of the new accounting standards also affected our presentation of cash flows. The change is related to
tax benefits associated with tax deductions that exceed the amount of compensation expense recognized in financial
statements. For 2006, cash flows from operating activities was reduced by $3.3 million and cash flow from
financing activities was increased by $3.3 million from amounts that would have been reported prior to the
accounting change.
At September 30, 2006, the amount of stock compensation expense that has not yet been recognized totaled
$4.7 million. This amount is related to stock options that have been granted but have not yet vested.
Workforce Management ActionsIn Thousands for the Year Ended September 30, 2006 2005 2004
Member termination benefits . . . . . . . . . . . . . . . . . . . . . . . . . . . . . . . . $ 70 $ 2,144 $12,151
Contractual pension termination benefits . . . . . . . . . . . . . . . . . . . . . . . 340 — 1,800
Related costs of facility consolidation . . . . . . . . . . . . . . . . . . . . . . . . . — 1,770 —
Member termination benefits adjustments . . . . . . . . . . . . . . . . . . . . . . — (2,204) (1,083)
Total costs of workforce management actions . . . . . . . . . . . . . . . . . . . $410 $ 1,710 $12,868
The workforce management actions reflected in the preceding table, all of which are associated with Industrial
Controls, are primarily related to the consolidation of manufacturing operations in The Netherlands and
United Kingdom with existing operations in the United States and Germany. The actions also involve the
consolidation of a small manufacturing operation in Japan with an existing operation in China and sales force
reductions in The Netherlands. These actions were taken to streamline the organization by eliminating redundant
manufacturing operations and to adjust the sales force in response to market shifts from Europe to Asia and North
America. The actions were completed in March 2006. In total, approximately 250 positions were eliminated from
the three locations.
Principally in 2004, we expensed a total of $15.9 million for these actions, which includes $12.0 million for
member termination benefits under ongoing termination benefit plans, $2.1 million of contractual pension
termination benefits, and $1.8 million for other costs primarily associated with moving equipment and inventory
to other locations. With the exception of the contractual pension termination benefits, all expenses were cash
expenses that were paid from available cash balances without the need for incremental borrowings.
In 2004, our expense for these actions totaled $13.8 million, which primarily consisted of member termination
benefits related to ongoing termination benefit plans for member service through September 30, 2004. In addition,
we expensed contractual pension termination benefits resulting from the retirement pension benefit plan provisions
that provided early retirement benefits for certain plan participants in the event of a workforce management action.
Our expenses for these actions were $1.7 million in 2005 and $0.4 million in 2006, equal to the total amounts
reflected in the preceding table. The expenses included member termination benefits that reflected amounts earned
by members during their service periods in 2005 and 2006, additional contractual pension termination benefits for
eligible participants, other costs primarily associated with moving equipment and inventory to other locations, and
adjustments of amounts previously accrued for these actions. The accrual adjustments were made as a result of
changes in estimates for termination benefits payable because of voluntary member resignations, the transfer of
members to a third-party distributor, and more members electing early retirement options.
Although it is difficult to precisely estimate the savings that are uniquely related to these actions, we believe
that current annual expense levels are $9.0 million to $11.0 million lower than they would have been prior to the
actions. The lower expenses are primarily related to reductions in personnel costs, although savings in travel and
other costs associated with the reduced headcount have also been realized. Of the total savings, approximately 90%
affects cost of goods sold and 10% selling, general, and administrative expenses.
For 2004, the preceding table also reflects amounts related to previous actions of Industrial Controls, the most
significant of which is a reduction in accrued member termination benefits of $0.7 million. This accrual reduction
was a direct result of decisions to discontinue the remaining actions from the previous year given the newly-formed
consolidation plans.
2220
84256_Financials.indd Sec1:2084256_Financials.indd Sec1:20 12/5/2006 3:08:13 PM12/5/2006 3:08:13 PM

Earnings
In Thousands for the Year Ended September 30, 2006 2005 2004
Segment earnings:
Industrial Controls . . . . . . . . . . . . . . . . . . . . . . . . . . . . . . . . . $ 55,704 $ 28,821 $ 6,437
Aircraft Engine Systems . . . . . . . . . . . . . . . . . . . . . . . . . . . . 63,859 64,052 59,192
Total segment earnings . . . . . . . . . . . . . . . . . . . . . . . . . . . . . . . 119,563 92,873 65,629
Nonsegment expenses . . . . . . . . . . . . . . . . . . . . . . . . . . . . . . . . (32,727) (17,935) (12,100)
Curtailment gain . . . . . . . . . . . . . . . . . . . . . . . . . . . . . . . . . . . . — 7,825 —
Interest expense and income . . . . . . . . . . . . . . . . . . . . . . . . . . . (2,339) (3,655) (4,237)
Consolidated earnings before income taxes. . . . . . . . . . . . . . . . . 84,497 79,108 49,292
Income taxes . . . . . . . . . . . . . . . . . . . . . . . . . . . . . . . . . . . . . . . 14,597 23,137 17,910
Consolidated net earnings . . . . . . . . . . . . . . . . . . . . . . . . . . . . . $ 69,900 $ 55,971 $ 31,382
2006 Compared to 2005
Industrial Controls’ segment earnings increased 93% in 2006 as compared to 2005, attributable to the
following (in millions):
• Selling price changes . . . . . . . . . . . . . . . . . . . . . . . . . . . . . . . . . . . . . . . . . . . . . . . . . . . . $12
• Effects of the consolidation of European operations, among other less significant cost andexpense changes . . . . . . . . . . . . . . . . . . . . . . . . . . . . . . . . . . . . . . . . . . . . . . . . . . . . . . . 13
• Lower performance-based variable compensation . . . . . . . . . . . . . . . . . . . . . . . . . . . . . . . 4
• Higher research and development costs. . . . . . . . . . . . . . . . . . . . . . . . . . . . . . . . . . . . . . . (4)
• Lower workforce management costs . . . . . . . . . . . . . . . . . . . . . . . . . . . . . . . . . . . . . . . . . 2
Selling price increases were made primarily to offset certain material cost increases, which were related to
price fluctuations of commodities from which mechanical, electronic, or electromagnetic components are pro-
duced. Typically, selling price increases lag material cost increases for some period of time, which varies depending
upon individual circumstances.
Industrial Controls’ earnings benefited from the effects of the European consolidation that we completed in
March 2006. A more detailed discussion of the European consolidation is included under workforce management
actions in a previous section of this discussion and analysis.
Variable compensation paid to Industrial Controls’ members was lower in 2006 than in 2005, driven by
performance-based factors.
Industrial Controls’ research and development cost increases were discussed previously as part of costs and
expenses.
Industrial Controls incurred costs related to workforce management actions that totaled $1.7 million in 2005.
Aircraft Engine Systems’ segment earnings in 2006 were about the same as in 2005, attributable to the
following (in millions):
• Increase in sales volume . . . . . . . . . . . . . . . . . . . . . . . . . . . . . . . . . . . . . . . . . . . . . . . . . . $ 7
• Higher research and development costs . . . . . . . . . . . . . . . . . . . . . . . . . . . . . . . . . . . . . . . (7)
• Gain on sale of product rights in 2005 . . . . . . . . . . . . . . . . . . . . . . . . . . . . . . . . . . . . . . . (4)
• Lower performance-based variable compensation. . . . . . . . . . . . . . . . . . . . . . . . . . . . . . . . 3
• Selling price changes . . . . . . . . . . . . . . . . . . . . . . . . . . . . . . . . . . . . . . . . . . . . . . . . . . . . 3
• Other factors, net . . . . . . . . . . . . . . . . . . . . . . . . . . . . . . . . . . . . . . . . . . . . . . . . . . . . . . . (2)
2321
84256_Financials.indd Sec1:2184256_Financials.indd Sec1:21 12/5/2006 3:08:13 PM12/5/2006 3:08:13 PM

The effect of the increase in sales volume on Aircraft Engine Systems’ segment earnings was measured as if
gross margins had increased in direct proportion to the sales volume increase without other changes. However, there
are many factors that affected segment earnings other than volume, the most important of which are discussed in the
paragraphs that follow.
Aircraft Engine Systems’ research and development cost increases were discussed previously as part of costs
and expenses.
Aircraft Engine Systems sold the rights to its propeller synchronizer products to an unrelated third party in
2005, which resulted in a pre-tax gain of $3.8 million that year.
Variable compensation paid to Aircraft Engine Systems’ members was lower in 2006 than in 2005, driven by
performance-based factors.
Nonsegment expenses increased 82% in 2006 as compared to 2005, attributable to the following (in millions):
• Accruals for contingent legal matters . . . . . . . . . . . . . . . . . . . . . . . . . . . . . . . . . . . . . . . . . $9
• Stock-based compensation expense. . . . . . . . . . . . . . . . . . . . . . . . . . . . . . . . . . . . . . . . . . . 3
• Other factors, net . . . . . . . . . . . . . . . . . . . . . . . . . . . . . . . . . . . . . . . . . . . . . . . . . . . . . . . . 3
We accrue for individual matters that we believe are likely to result in a loss when ultimately resolved using
estimates of the most likely amount of loss, including accruals totaling $8.5 million in 2006. More information
about contingencies is included under “Commitments and Contingencies” below.
At the beginning of 2006, we began to account for stock-based compensation using the fair value method of
accounting as required under a new accounting standard. We used the intrinsic value method in previous years,
under which we did not recognize compensation expense in association with options granted at or above the market
price of our common stock at the date of grant. More information about the effect of this accounting change is
included under “Stock-Based Compensation” above.
Among the other factors affecting nonsegment expenses are normal variations in legal and other professional
services.
Curtailment gain was discussed previously as part of costs and expenses.
Income taxes were provided at an effective rate on earnings before income taxes of 17.3% in 2006 compared to
29.2% in 2005. The change in the effective tax rate was attributable to the following (as a percent of earnings before
income taxes):
• Adjustments of the beginning-of-year balance of valuation allowances for deferred taxassets . . . . . . . . . . . . . . . . . . . . . . . . . . . . . . . . . . . . . . . . . . . . . . . . . . . . . . . . . . . . . . (16.2)%
• Change in estimates of taxes for previous periods in 2006 as compared to 2005 . . . . . . . 1.2%
• Research credit in 2006 as compared to 2005 . . . . . . . . . . . . . . . . . . . . . . . . . . . . . . . . . 0.8%
• Other changes, net . . . . . . . . . . . . . . . . . . . . . . . . . . . . . . . . . . . . . . . . . . . . . . . . . . . . . 2.3%
The 2006 change in the beginning-of-year valuation allowances reduced income tax expense by $13.7 million.
Exclusive of this item, the effective tax rate for 2006 was 33.5%. We establish valuation allowances to reflect the
estimated amount of deferred tax assets that might not be realized. Both positive and negative evidence are
considered in forming our judgment as to whether a valuation allowance is appropriate, and more weight is given to
evidence that can be objectively verified. Valuation allowances are reassessed whenever there are changes in
circumstances that may cause a change in our judgments. In 2006, additional objective evidence became available
regarding earnings in tax jurisdictions that have unexpired net operating loss carryforwards that affected our
judgment about the valuation allowance.
Income taxes for both 2006 and 2005 were affected by changes in estimates of income taxes for previous years.
In 2006, the changes were primarily related to the favorable resolution of certain tax matters. These changes
reduced the effective tax rate for 2006 by approximately 1.3% of pretax earnings. In 2005, the changes in estimates
were related to increases in the amount of certain credits claimed and changes in the amount of certain deductions
2422
84256_Financials.indd Sec1:2284256_Financials.indd Sec1:22 12/5/2006 3:08:13 PM12/5/2006 3:08:13 PM

taken as compared to prior estimates. These changes reduced reported income taxes by $1.9 million in 2005, or
approximately 2.5% of pretax earnings.
The effective tax rate comparison between 2006 and 2005 was affected by the expiration of the tax credit for
increasing research activities, which expired on December 31, 2005.
Among the other changes in our effective tax rate were the effects of changes in the amounts of extraterritorial
income exclusion and the effects of changes in the relative mix of earnings by tax jurisdiction, which affects the
comparison of foreign and state income tax rates relative to the United States federal statutory rate.
2005 Compared to 2004
Industrial Controls’ segment earnings were $29 million in 2005 compared to $6 million in 2004. The change
was attributable to the following (in millions):
• Increase in sales volume . . . . . . . . . . . . . . . . . . . . . . . . . . . . . . . . . . . . . . . . . . . . . . . . . $18
• Workforce management actions, net . . . . . . . . . . . . . . . . . . . . . . . . . . . . . . . . . . . . . . . . . 11
• Higher performance-based variable compensation . . . . . . . . . . . . . . . . . . . . . . . . . . . . . . . (6)
• Higher research and development costs. . . . . . . . . . . . . . . . . . . . . . . . . . . . . . . . . . . . . . . (4)
• Other factors, net . . . . . . . . . . . . . . . . . . . . . . . . . . . . . . . . . . . . . . . . . . . . . . . . . . . . . . . 3
The effect of the increase in sales volume on Industrial Controls’ segment earnings was measured as if gross
margins (external net sales less external cost of goods sold) had increased in direct proportion to the sales volume
increase without other changes. However, there are many factors that affected segment earnings other than volume,
the most important of which are discussed in the paragraphs that follow.
Industrial Controls incurred costs related to workforce management actions that totaled $1.7 million in 2005
and $12.9 million in 2004, netting to a decrease of $11.2 million.
Variable compensation paid to Industrial Controls’ members was higher in 2005 than in 2004, driven by
performance-based factors, including consolidated financial results.
Industrial Controls’ research and development cost increases were discussed previously as part of costs and
expenses.
Among other factors affecting the comparison of Industrial Controls’ segment earnings between 2005 and
2004 were the favorable operating leverage effect of the increased sales versus the fixed cost components of cost of
goods sold and other fixed expenses, sales mix, changes in material costs, normal variations in legal services, and
losses related to transactions denominated in foreign currencies.
Aircraft Engine Systems’ segment earnings increased 8% in 2005 as compared to 2004, attributable to the
following (in millions):
• Increase in sales volume . . . . . . . . . . . . . . . . . . . . . . . . . . . . . . . . . . . . . . . . . . . . . . . . . . $ 6
• Gain on sale of product rights . . . . . . . . . . . . . . . . . . . . . . . . . . . . . . . . . . . . . . . . . . . . . . 4
• Higher performance-based variable compensation . . . . . . . . . . . . . . . . . . . . . . . . . . . . . . . (4)
• Higher research and development costs . . . . . . . . . . . . . . . . . . . . . . . . . . . . . . . . . . . . . . . (3)
• Other factors, net . . . . . . . . . . . . . . . . . . . . . . . . . . . . . . . . . . . . . . . . . . . . . . . . . . . . . . . 2
The effect of the increase in sales volume on Aircraft Engine Systems’ segment earnings was measured as if
gross margins had increased in direct proportion to the sales volume increase without other changes. However, there
are many factors that affected segment earnings other than volume, the most important of which are discussed in the
paragraphs that follow.
Aircraft Engine Systems sold the rights to its propeller synchronizer products to an unrelated third party in
2005, which resulted in a pre-tax gain of $3.8 million.
Variable compensation paid to Aircraft Engine Systems’ members was higher in 2005 than in 2004, driven by
performance-based factors, including consolidated financial results.
2523
84256_Financials.indd Sec1:2384256_Financials.indd Sec1:23 12/5/2006 3:08:13 PM12/5/2006 3:08:13 PM
Aircraft Engine Systems’ research and development cost increases were discussed previously as part of costs
and expenses.
Among other factors affecting the comparison of Aircraft Engine Systems’ segment earnings between 2005
and 2004 were the favorable operating leverage effect of the increased sales versus the fixed cost components of cost
of goods sold and other fixed expenses.
Nonsegment expenses increased 48% in 2005 as compared to 2004, attributable to the following (in millions):
• Internal control assessment and audit expenses . . . . . . . . . . . . . . . . . . . . . . . . . . . . . . . . . . $2
• Higher performance-based variable compensation . . . . . . . . . . . . . . . . . . . . . . . . . . . . . . . . 2
• Other factors, net . . . . . . . . . . . . . . . . . . . . . . . . . . . . . . . . . . . . . . . . . . . . . . . . . . . . . . . . 2
In 2005, we incurred significant expense in assessing our internal control over financial reporting, as required
by the Sarbanes-Oxley Act of 2002. We also incurred higher external audit fees associated with the expanded audit
scope required by the Act.
Variable compensation paid to corporate members was higher in 2005 than in 2004, driven by performance-
based factors, including consolidated financial results.
Among the other factors affecting nonsegment expenses were normal variations in legal and other professional
services.
Curtailment gain was discussed previously as part of costs and expenses.
Income taxes were provided at an effective rate on earnings before income taxes of 29.2% in 2005 compared to
36.3% in 2004. The change in the effective tax rate was attributable to the following (as a percent of earnings before
income taxes):
• Change in estimates of taxes in 2005 for previous periods . . . . . . . . . . . . . . . . . . . . . . . . (2.5)%
• Change in effect of foreign losses on income taxes in 2005 as compared to 2004 . . . . . . . (2.0)%
• Research credit in 2005 as compared to 2004 . . . . . . . . . . . . . . . . . . . . . . . . . . . . . . . . . . (1.7)%
• Other changes, net . . . . . . . . . . . . . . . . . . . . . . . . . . . . . . . . . . . . . . . . . . . . . . . . . . . . . . (0.9)%
Income taxes for 2005 were affected by changes in estimates of income taxes for previous years, which
resulted from increases in the amounts of certain credits claimed and changes in the amounts of certain deductions
taken. These changes reduced reported income taxes by $1.9 million, or 2.5% of earnings before income taxes.
The effects of foreign losses on income taxes increased our effective tax rate by 0.1% in 2005 compared to
2.1% in 2004. Foreign losses affect income taxes in situations in which we are unable to use the losses to offset
earnings in particular tax jurisdictions, resulting in net operating loss carryforwards. In both years, we recorded a
valuation allowance to reflect the estimated amount of deferred tax assets that may not be realized due to foreign net
operating loss carryforwards.
The federal tax credit for 2005 for increasing research activities reduced our effective tax rate by 1.7%
compared to 2004. The credit was based on the level of current year research costs relative to gross receipts and
research costs in certain prior periods.
Among the other changes in our effective tax rate were the effects of changes in the relative mix of earnings by
tax jurisdiction, which affected the comparison of foreign and state income tax rates relative to the United States
federal statutory rate.
Subsequent Event
On October 31, 2006, we acquired 100 percent of the stock of SEG Schaltanlagen-Elektronik-Gerate GmbH &
Co. KG (SEG) and a related receivable from SEG that was held by one of the sellers. Headquartered in Kempen,
Germany, SEG is focused on the design and manufacture of a wide range of protection and comprehensive control
systems for power generation and distribution applications, power inverters for wind turbines, and complete
electrical systems for gas and diesel engine based power stations. The cost of this acquisition has not yet been
2624
84256_Financials.indd Sec1:2484256_Financials.indd Sec1:24 12/5/2006 3:08:13 PM12/5/2006 3:08:13 PM

finalized, but is currently expected to be approximately $45 million, including the amount of outstanding
borrowings assumed. The actual cost of the acquisition may be higher or lower than our current estimate based
on the outcome of a purchase price adjustment procedure customary to purchase agreements and the final
determination of the direct acquisition costs. SEG had sales of approximately $60 million in the year ended
December 31, 2005. SEG will be part of the Industrial Controls segment, and we currently expect the acquisition to
be accretive to earnings in 2007.
Outlook
Aerospace markets are on an upswing, and we currently anticipate Aircraft Engine Systems’ sales will increase
10-12% in 2007. These increases are expected for both OEM and aftermarket sales, with slightly more growth
among OEMs. In relation to sales, our segment earnings are expected to remain relatively stable with 2006, between
20-22% of sales.
We expect more modest market growth in the industrial markets served by Industrial Controls. However, the
business acquisition completed in October 2006 will allow Industrial Controls’ sales to exceed anticipated market
growth rates. With the effects of the acquisition, we currently believe Industrial Controls’ sales will grow 13-16% in
2007. Segment earnings are expected to be between 10-12% of sales.
Overall, we anticipate company-wide sales growth of 12-15% and earnings of $2.05 to $2.15 per share in fiscal
2007, including the effects of the acquisition just completed.
FINANCIAL CONDITION
Assets
In Thousands at September 30, 2006 2005
Industrial Controls. . . . . . . . . . . . . . . . . . . . . . . . . . . . . . . . . . . . . . . . . . . . $360,577 $370,220
Aircraft Engine Systems . . . . . . . . . . . . . . . . . . . . . . . . . . . . . . . . . . . . . . . 229,269 208,140
Unallocated assets . . . . . . . . . . . . . . . . . . . . . . . . . . . . . . . . . . . . . . . . . . . . 145,651 127,106
Consolidated total assets . . . . . . . . . . . . . . . . . . . . . . . . . . . . . . . . . . . . . . . $735,497 $705,466
Industrial Controls’ segment assets at September 30, 2006, decreased over the prior year primarily as a result
of lower levels of inventories and normal amortization of intangible assets.
Aircraft Engine Systems’ segment assets at September 30, 2006, increased over the prior year as a result of
higher levels of business activity in 2006 and 2005, which resulted in higher accounts receivable and inventories. In
addition, capital expenditures increased in 2006 to a level that exceeded depreciation expense, resulting in higher
property, plant, and equipment.
Unallocated assets at September 30, 2006, increased over the prior year primarily because of changes in
valuation allowances for deferred tax assets.
Other Balance Sheet Measures
In Thousands at September 30, 2006 2005
Working capital . . . . . . . . . . . . . . . . . . . . . . . . . . . . . . . . . . . . . . . . . . . . . . $260,243 $241,066
Long-term debt, less current portion. . . . . . . . . . . . . . . . . . . . . . . . . . . . . . . 58,739 72,942
Other liabilities . . . . . . . . . . . . . . . . . . . . . . . . . . . . . . . . . . . . . . . . . . . . . . 71,190 71,548
Shareholders’ equity . . . . . . . . . . . . . . . . . . . . . . . . . . . . . . . . . . . . . . . . . . 478,689 432,469
Working capital (total current assets less total current liabilities) at September 30, 2006, increased over the
prior year primarily as a result of increases in accounts receivable and a decrease in short-term borrowings.
Long-term debt, less current portion at September 30, 2006, decreased from the prior year to reflect the
amount of long-term debt paid in 2006. The current portion of long-term debt remained approximately the same.
2725
84256_Financials.indd Sec1:2584256_Financials.indd Sec1:25 12/5/2006 3:08:13 PM12/5/2006 3:08:13 PM

We currently have a revolving line of credit facility with a syndicate of U.S. banks totaling $100 million, with
an option to increase the amount of the line to $175 million if we choose. The line of credit facility expires on
March 11, 2010. In addition, we have other line of credit facilities, which totaled $17.7 million at September 30,
2006, that are generally reviewed annually for renewal. The total amount of borrowings under all facilities was
$0.5 million at September 30, 2006. The weighted-average interest rate for outstanding borrowings under these line
of credit facilities, which were in Japan at rates significantly lower than those typical in the United States, was 0.5%
at September 30, 2006.
Provisions of debt agreements include covenants customary to such agreements that require us to maintain
specified minimum or maximum financial measures and place limitations on various investing and financing
activities. The agreements also permit the lenders to accelerate repayment requirements in the event of a material
adverse event. Our most restrictive covenants require us to maintain a minimum consolidated net worth, a
maximum consolidated debt to consolidated operating cash flow, and a maximum consolidated debt to EBITDA, as
defined in the agreements. We were in compliance with all covenants at September 30, 2006.
Commitments and contingencies at September 30, 2006, include various matters arising from the normal
course of business. We are currently involved in pending or threatened litigation or other legal proceedings
regarding employment, product liability, and contractual matters arising from the normal course of business. We
accrued for individual matters that we believe are likely to result in a loss when ultimately resolved using estimates
of the most likely amount of loss, including accruals totaling $8.5 million that were recorded in 2006. There are also
individual matters that we believe the likelihood of a loss when ultimately resolved is less than likely but more than
remote, which were not accrued. While it is possible that there could be additional losses that have not been accrued,
we currently believe the possible additional loss in the event of an unfavorable resolution of each matter is less than
$10 million in the aggregate.
Among the legal proceedings referred to in the preceding paragraph, we were a defendant in a class action
lawsuit filed in the U.S. District Court for Northern District of Illinois and received findings of the U.S. Equal
Employment Opportunity Commission that alleged discrimination on the basis of race, national origin, and gender
in our Winnebago County, Illinois, facilities. On October 5, 2006, a U.S. District Court Judge gave preliminary
approval to a proposed $5 million settlement of the class action and EEOC matters. Accruals for the amount of the
settlement and related legal expenses are included in our consolidated balance sheet at September 30, 2006.
We file income tax returns in various jurisdictions worldwide, which are subject to audit. We have accrued for
our estimate of the most likely amount of expense that we believe may result from income tax audit adjustments.
We do not recognize contingencies that might result in a gain until such contingencies are resolved and the
related amounts are realized.
In the event of a change in control of the company, we may be required to pay termination benefits to certain
executive officers.
Shareholders’ equity at September 30, 2006, increased 11% over the prior year. Increases due to net earnings,
sales of treasury stock, tax benefits applicable to stock options, and stock-based compensation were partially offset
by purchases of treasury stock and dividend payments.
On January 26, 2005, the Board of Directors authorized the repurchase of up to $30 million of our outstanding
shares of common stock on the open market and private transactions over a three-year period. This authorization
was terminated on July 25, 2006, concurrent with the approval of a new stock repurchase authorization.
On July 25, 2006, the Board of Directors authorized the repurchase of up to $50 million of our outstanding
shares of common stock on the open market and private transactions over a three-year period that will end on
July 25, 2009.
2826
84256_Financials.indd Sec1:2684256_Financials.indd Sec1:26 12/5/2006 3:08:14 PM12/5/2006 3:08:14 PM
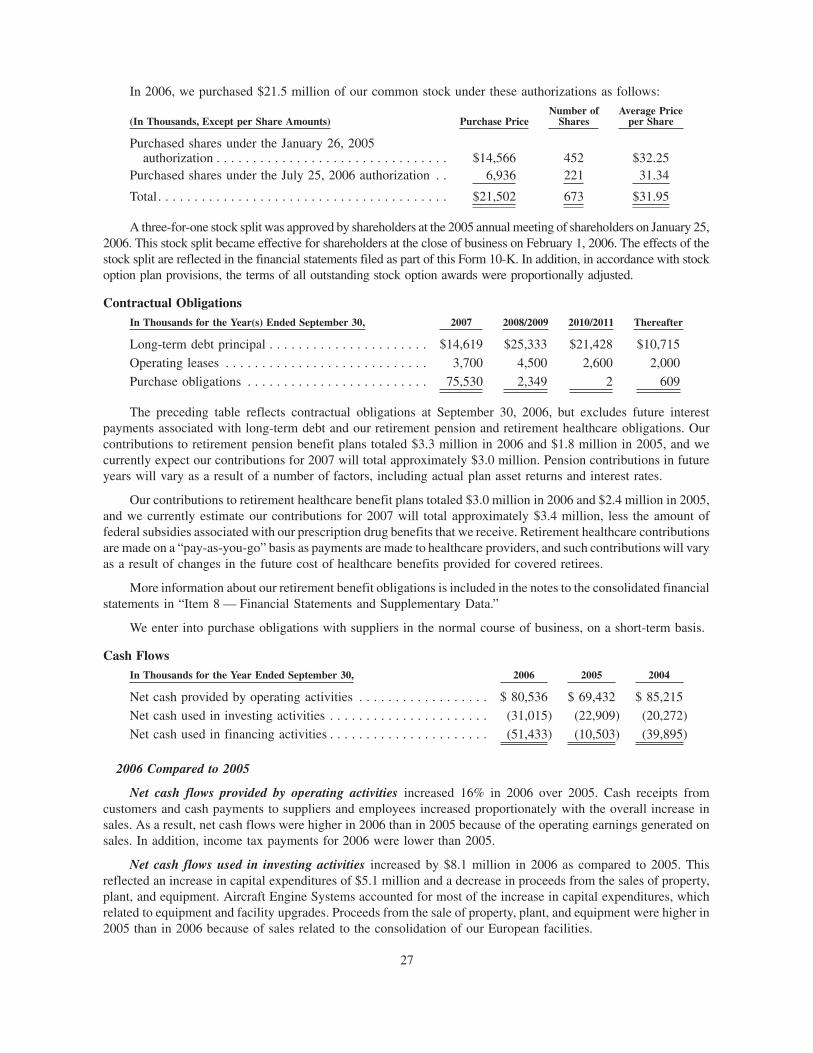
In 2006, we purchased $21.5 million of our common stock under these authorizations as follows:
(In Thousands, Except per Share Amounts) Purchase PriceNumber of
SharesAverage Price
per Share
Purchased shares under the January 26, 2005authorization . . . . . . . . . . . . . . . . . . . . . . . . . . . . . . . . $14,566 452 $32.25
Purchased shares under the July 25, 2006 authorization . . 6,936 221 31.34
Total. . . . . . . . . . . . . . . . . . . . . . . . . . . . . . . . . . . . . . . . $21,502 673 $31.95
A three-for-one stock split was approved by shareholders at the 2005 annual meeting of shareholders on January 25,
2006. This stock split became effective for shareholders at the close of business on February 1, 2006. The effects of the
stock split are reflected in the financial statements filed as part of this Form 10-K. In addition, in accordance with stock
option plan provisions, the terms of all outstanding stock option awards were proportionally adjusted.
Contractual ObligationsIn Thousands for the Year(s) Ended September 30, 2007 2008/2009 2010/2011 Thereafter
Long-term debt principal . . . . . . . . . . . . . . . . . . . . . . $14,619 $25,333 $21,428 $10,715
Operating leases . . . . . . . . . . . . . . . . . . . . . . . . . . . . 3,700 4,500 2,600 2,000
Purchase obligations . . . . . . . . . . . . . . . . . . . . . . . . . 75,530 2,349 2 609
The preceding table reflects contractual obligations at September 30, 2006, but excludes future interest
payments associated with long-term debt and our retirement pension and retirement healthcare obligations. Our
contributions to retirement pension benefit plans totaled $3.3 million in 2006 and $1.8 million in 2005, and we
currently expect our contributions for 2007 will total approximately $3.0 million. Pension contributions in future
years will vary as a result of a number of factors, including actual plan asset returns and interest rates.
Our contributions to retirement healthcare benefit plans totaled $3.0 million in 2006 and $2.4 million in 2005,
and we currently estimate our contributions for 2007 will total approximately $3.4 million, less the amount of
federal subsidies associated with our prescription drug benefits that we receive. Retirement healthcare contributions
are made on a “pay-as-you-go” basis as payments are made to healthcare providers, and such contributions will vary
as a result of changes in the future cost of healthcare benefits provided for covered retirees.
More information about our retirement benefit obligations is included in the notes to the consolidated financial
statements in “Item 8 — Financial Statements and Supplementary Data.”
We enter into purchase obligations with suppliers in the normal course of business, on a short-term basis.
Cash FlowsIn Thousands for the Year Ended September 30, 2006 2005 2004
Net cash provided by operating activities . . . . . . . . . . . . . . . . . . $ 80,536 $ 69,432 $ 85,215
Net cash used in investing activities . . . . . . . . . . . . . . . . . . . . . . (31,015) (22,909) (20,272)
Net cash used in financing activities . . . . . . . . . . . . . . . . . . . . . . (51,433) (10,503) (39,895)
2006 Compared to 2005
Net cash flows provided by operating activities increased 16% in 2006 over 2005. Cash receipts from
customers and cash payments to suppliers and employees increased proportionately with the overall increase in
sales. As a result, net cash flows were higher in 2006 than in 2005 because of the operating earnings generated on
sales. In addition, income tax payments for 2006 were lower than 2005.
Net cash flows used in investing activities increased by $8.1 million in 2006 as compared to 2005. This
reflected an increase in capital expenditures of $5.1 million and a decrease in proceeds from the sales of property,
plant, and equipment. Aircraft Engine Systems accounted for most of the increase in capital expenditures, which
related to equipment and facility upgrades. Proceeds from the sale of property, plant, and equipment were higher in
2005 than in 2006 because of sales related to the consolidation of our European facilities.
2927
84256_Financials.indd Sec1:2784256_Financials.indd Sec1:27 12/5/2006 3:08:14 PM12/5/2006 3:08:14 PM

Net cash flows used in financing activities increased by $40.9 million in 2006 as compared to 2005. Net
payments of borrowings were $22.5 million in 2006, compared to net proceeds from borrowings of $2.0 million in
2005. In addition, we increased the amount of cash used for the purchase of our common stock by $15.0 million in
2006 over 2005 and increased cash dividends by $1.9 million.
Our 2005 and 2006 purchases of common stock were primarily made in connection with authorizations by the
Board of Directors made in January 26, 2005, and July 25, 2006. The Board terminated the 2005 authorization
concurrent with their approval of the 2006 authorization. The 2006 authorization provides for the repurchase of up
to $50 million of our common stock on the open market and private transactions over a three-year period.
Approximately $43 million remains available for repurchase under the authorization at September 30, 2006.
2005 Compared to 2004
Net cash flows provided by operating activities decreased 19% in 2005 from 2004. Both operating cash
receipts and disbursements increased in 2005 over 2004 due to higher sales volume. However, cash paid to
employees and suppliers increased at a greater rate than cash collected from customers, reflecting normal variations
in collection and payment patterns. In addition, income tax payments increased in 2005 over 2004, resulting in an
income tax receivable position at September 30, 2005, compared to a payable position at September 30, 2004.
Net cash flows used in investing activities increased by $2.6 million in 2005 as compared to 2004. This
reflected an increase in capital expenditures of $7.9 million, which was partially offset by the effects of changes in
proceeds from the sale of property, plant, and equipment, and net payments associated with business acquisitions
that were made in 2004.
Net cash flows used in financing activities decreased by $29.5 million between 2005 and 2004, primarily as a
result of changes in borrowings. Net proceeds from borrowings totaled $2.0 million in 2005 compared to net
payments of borrowings of $30.4 million in 2004. In addition, both proceeds from the sale of treasury stock, which
were related to the exercise of stock options, and purchases of treasury stock were higher in 2005 than in 2004. The
effect of these treasury stock transactions on cash flows resulted in net use of cash of $0.6 million in 2005 and a net
source of cash of $1.3 million in 2004. Our dividend payments also increased by $1.0 million in 2005 over 2004 as a
result of increases in our quarterly dividend rate.
The 2005 treasury stock purchases were made in connection with a Board authorization that expired in July
2006. The 2004 treasury stock purchases were made in connection with a Board authorization that expired in
November 2004.
Outlook
Future cash flows from operations and available revolving lines of credit are expected to be adequate to meet
our cash requirements over the next twelve months.
Payments of our $64 million of senior notes are due over the 2007 — 2012 timeframe. Also, we have a
$100 million line of credit facility that includes an option to increase the amount of the line up to $175 million that
does not expire until March 11, 2010. Also, the acquisition completed on October 31, 2006, as discussed under
“Subsequent Events” above, was paid from available cash balances. Despite these factors, it is possible business
acquisitions could be made in the future that would require amendments to existing debt agreements and the need to
obtain additional financing.
Recent Accounting Pronouncements
A discussion of recent accounting pronouncements is included in the Notes to the Consolidated Financial
Statements in “Item 8 — Financial Statements and Supplementary Data.”
Item 7A. Quantitative and Qualitative Disclosures About Market Risk
Disclosures about market risk are included in “Item 7 — Management’s Discussion and Analysis of Financial
Condition and Results of Operations — Market Risks.”
3028
84256_Financials.indd Sec1:2884256_Financials.indd Sec1:28 12/5/2006 3:08:14 PM12/5/2006 3:08:14 PM

Item 8. Financial Statements and Supplementary Data
Consolidated Statements of Earnings WOODWARD
2006 2005 2004Year Ended September 30,
(In thousands except per share amounts)
Net sales . . . . . . . . . . . . . . . . . . . . . . . . . . . . . . . . . . . . . . . . . . . . . . . . $854,515 $827,726 $709,805
Costs and expenses:
Cost of goods sold . . . . . . . . . . . . . . . . . . . . . . . . . . . . . . . . . . . . . . . 612,263 623,680 542,240
Selling, general, and administrative expenses . . . . . . . . . . . . . . . . . . . . 92,013 79,858 70,949
Research and development costs . . . . . . . . . . . . . . . . . . . . . . . . . . . . . 59,861 49,996 40,057
Amortization of intangible assets . . . . . . . . . . . . . . . . . . . . . . . . . . . . . 6,953 7,087 6,905
Curtailment gain . . . . . . . . . . . . . . . . . . . . . . . . . . . . . . . . . . . . . . . . . — (7,825) —
Interest expense . . . . . . . . . . . . . . . . . . . . . . . . . . . . . . . . . . . . . . . . . 5,089 5,814 5,332
Interest income . . . . . . . . . . . . . . . . . . . . . . . . . . . . . . . . . . . . . . . . . . (2,750) (2,159) (1,095)
Other income . . . . . . . . . . . . . . . . . . . . . . . . . . . . . . . . . . . . . . . . . . . (4,245) (9,322) (4,580)
Other expense . . . . . . . . . . . . . . . . . . . . . . . . . . . . . . . . . . . . . . . . . . . 834 1,489 705
Total costs and expenses . . . . . . . . . . . . . . . . . . . . . . . . . . . . . . . . . . . 770,018 748,618 660,513
Earnings before income taxes . . . . . . . . . . . . . . . . . . . . . . . . . . . . . . . . . 84,497 79,108 49,292
Income taxes . . . . . . . . . . . . . . . . . . . . . . . . . . . . . . . . . . . . . . . . . . . . . 14,597 23,137 17,910
Net earnings . . . . . . . . . . . . . . . . . . . . . . . . . . . . . . . . . . . . . . . . . . . . . $ 69,900 $ 55,971 $ 31,382
Net earnings per share:Basic . . . . . . . . . . . . . . . . . . . . . . . . . . . . . . . . . . . . . . . . . . . . . . . . . . . $ 2.03 $ 1.64 $ 0.93
Diluted . . . . . . . . . . . . . . . . . . . . . . . . . . . . . . . . . . . . . . . . . . . . . . . . . . 1.99 1.59 0.90
Weighted-average number of shares outstanding:Basic . . . . . . . . . . . . . . . . . . . . . . . . . . . . . . . . . . . . . . . . . . . . . . . . . . . 34,351 34,200 33,858
Diluted . . . . . . . . . . . . . . . . . . . . . . . . . . . . . . . . . . . . . . . . . . . . . . . . . . 35,191 35,127 34,695
See accompanying Notes to Consolidated Financial Statements.
3129
84256_Financials.indd Sec1:2984256_Financials.indd Sec1:29 12/5/2006 3:08:14 PM12/5/2006 3:08:14 PM
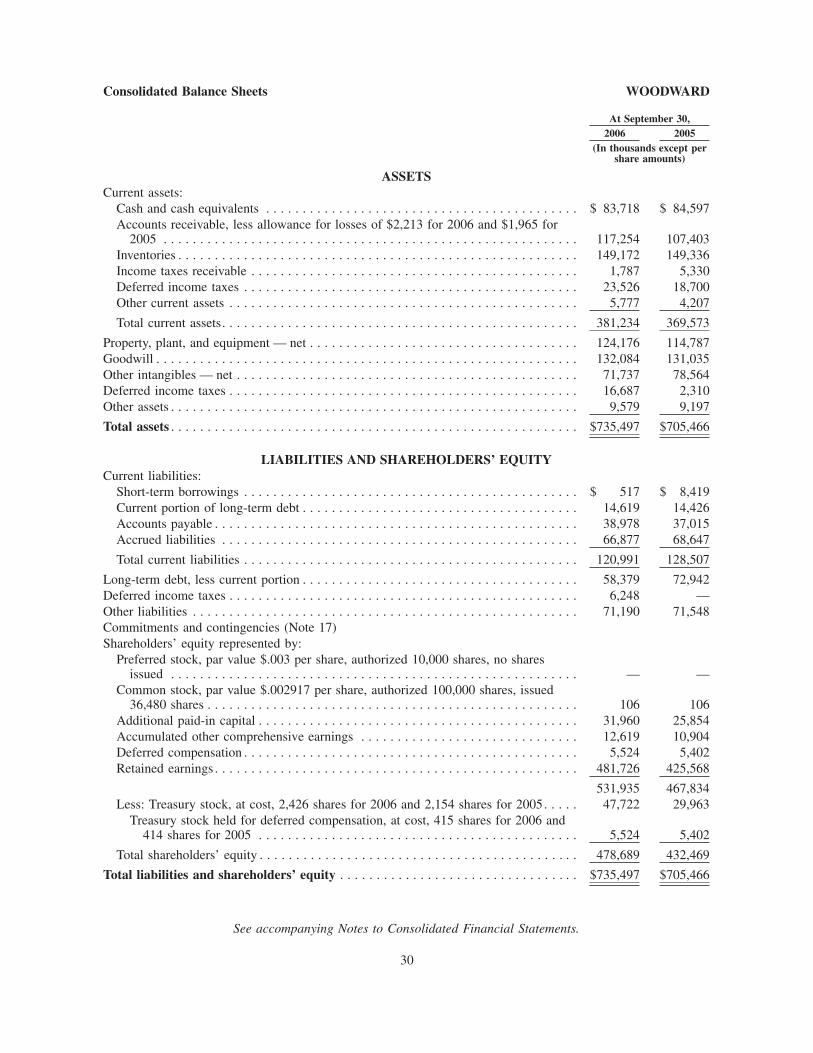
Consolidated Balance Sheets WOODWARD
2006 2005At September 30,
(In thousands except pershare amounts)
ASSETSCurrent assets:
Cash and cash equivalents . . . . . . . . . . . . . . . . . . . . . . . . . . . . . . . . . . . . . . . . . . . $ 83,718 $ 84,597
Accounts receivable, less allowance for losses of $2,213 for 2006 and $1,965 for2005 . . . . . . . . . . . . . . . . . . . . . . . . . . . . . . . . . . . . . . . . . . . . . . . . . . . . . . . . . 117,254 107,403
Inventories . . . . . . . . . . . . . . . . . . . . . . . . . . . . . . . . . . . . . . . . . . . . . . . . . . . . . . . 149,172 149,336
Income taxes receivable . . . . . . . . . . . . . . . . . . . . . . . . . . . . . . . . . . . . . . . . . . . . . 1,787 5,330
Deferred income taxes . . . . . . . . . . . . . . . . . . . . . . . . . . . . . . . . . . . . . . . . . . . . . . 23,526 18,700
Other current assets . . . . . . . . . . . . . . . . . . . . . . . . . . . . . . . . . . . . . . . . . . . . . . . . 5,777 4,207
Total current assets. . . . . . . . . . . . . . . . . . . . . . . . . . . . . . . . . . . . . . . . . . . . . . . . . 381,234 369,573
Property, plant, and equipment — net . . . . . . . . . . . . . . . . . . . . . . . . . . . . . . . . . . . . . 124,176 114,787
Goodwill . . . . . . . . . . . . . . . . . . . . . . . . . . . . . . . . . . . . . . . . . . . . . . . . . . . . . . . . . . 132,084 131,035
Other intangibles — net . . . . . . . . . . . . . . . . . . . . . . . . . . . . . . . . . . . . . . . . . . . . . . . 71,737 78,564
Deferred income taxes . . . . . . . . . . . . . . . . . . . . . . . . . . . . . . . . . . . . . . . . . . . . . . . . 16,687 2,310
Other assets . . . . . . . . . . . . . . . . . . . . . . . . . . . . . . . . . . . . . . . . . . . . . . . . . . . . . . . . 9,579 9,197
Total assets . . . . . . . . . . . . . . . . . . . . . . . . . . . . . . . . . . . . . . . . . . . . . . . . . . . . . . . . $735,497 $705,466
LIABILITIES AND SHAREHOLDERS’ EQUITYCurrent liabilities:
Short-term borrowings . . . . . . . . . . . . . . . . . . . . . . . . . . . . . . . . . . . . . . . . . . . . . . $ 517 $ 8,419
Current portion of long-term debt . . . . . . . . . . . . . . . . . . . . . . . . . . . . . . . . . . . . . . 14,619 14,426
Accounts payable . . . . . . . . . . . . . . . . . . . . . . . . . . . . . . . . . . . . . . . . . . . . . . . . . . 38,978 37,015
Accrued liabilities . . . . . . . . . . . . . . . . . . . . . . . . . . . . . . . . . . . . . . . . . . . . . . . . . 66,877 68,647
Total current liabilities . . . . . . . . . . . . . . . . . . . . . . . . . . . . . . . . . . . . . . . . . . . . . . 120,991 128,507
Long-term debt, less current portion . . . . . . . . . . . . . . . . . . . . . . . . . . . . . . . . . . . . . . 58,379 72,942
Deferred income taxes . . . . . . . . . . . . . . . . . . . . . . . . . . . . . . . . . . . . . . . . . . . . . . . . 6,248 —
Other liabilities . . . . . . . . . . . . . . . . . . . . . . . . . . . . . . . . . . . . . . . . . . . . . . . . . . . . . 71,190 71,548
Commitments and contingencies (Note 17)
Shareholders’ equity represented by:
Preferred stock, par value $.003 per share, authorized 10,000 shares, no sharesissued . . . . . . . . . . . . . . . . . . . . . . . . . . . . . . . . . . . . . . . . . . . . . . . . . . . . . . . . — —
Common stock, par value $.002917 per share, authorized 100,000 shares, issued36,480 shares . . . . . . . . . . . . . . . . . . . . . . . . . . . . . . . . . . . . . . . . . . . . . . . . . . . 106 106
Additional paid-in capital . . . . . . . . . . . . . . . . . . . . . . . . . . . . . . . . . . . . . . . . . . . . 31,960 25,854
Accumulated other comprehensive earnings . . . . . . . . . . . . . . . . . . . . . . . . . . . . . . 12,619 10,904
Deferred compensation . . . . . . . . . . . . . . . . . . . . . . . . . . . . . . . . . . . . . . . . . . . . . . 5,524 5,402
Retained earnings . . . . . . . . . . . . . . . . . . . . . . . . . . . . . . . . . . . . . . . . . . . . . . . . . . 481,726 425,568
531,935 467,834
Less: Treasury stock, at cost, 2,426 shares for 2006 and 2,154 shares for 2005. . . . . 47,722 29,963
Treasury stock held for deferred compensation, at cost, 415 shares for 2006 and414 shares for 2005 . . . . . . . . . . . . . . . . . . . . . . . . . . . . . . . . . . . . . . . . . . . . 5,524 5,402
Total shareholders’ equity . . . . . . . . . . . . . . . . . . . . . . . . . . . . . . . . . . . . . . . . . . . . 478,689 432,469
Total liabilities and shareholders’ equity . . . . . . . . . . . . . . . . . . . . . . . . . . . . . . . . . $735,497 $705,466
See accompanying Notes to Consolidated Financial Statements.
3230
84256_Financials.indd Sec1:3084256_Financials.indd Sec1:30 12/5/2006 3:08:14 PM12/5/2006 3:08:14 PM
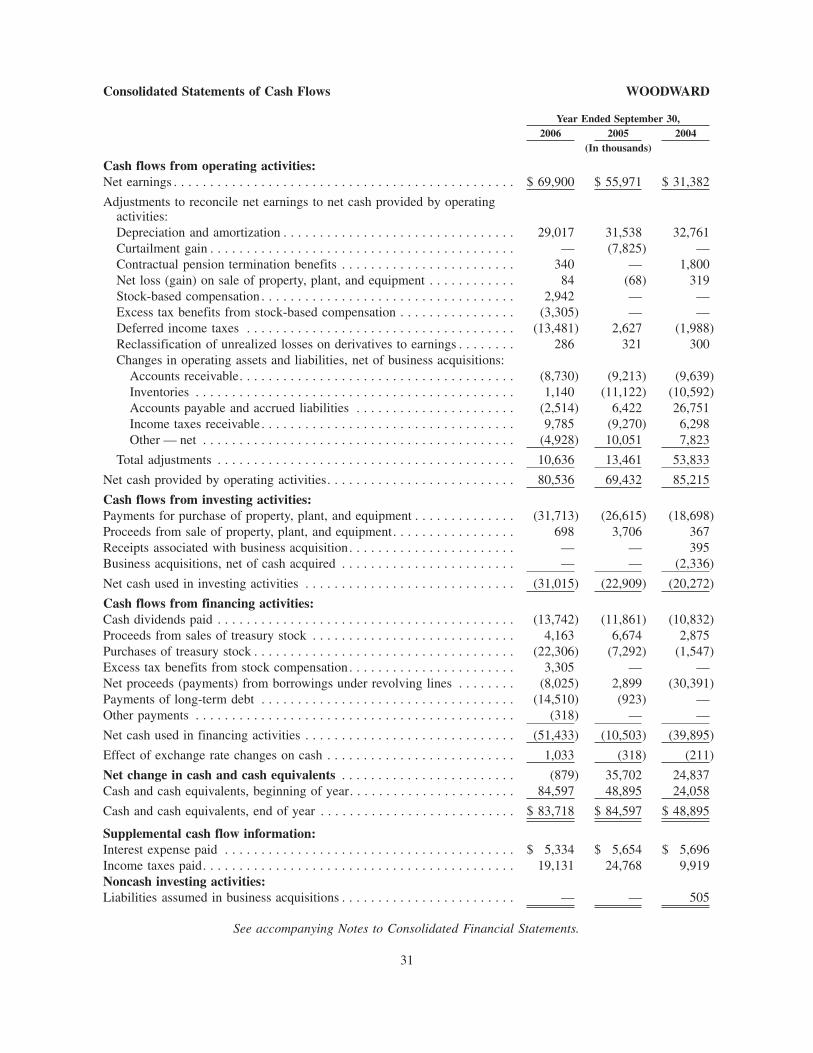
Consolidated Statements of Cash Flows WOODWARD
2006 2005 2004Year Ended September 30,
(In thousands)
Cash flows from operating activities:Net earnings . . . . . . . . . . . . . . . . . . . . . . . . . . . . . . . . . . . . . . . . . . . . . . . $ 69,900 $ 55,971 $ 31,382
Adjustments to reconcile net earnings to net cash provided by operatingactivities:
Depreciation and amortization . . . . . . . . . . . . . . . . . . . . . . . . . . . . . . . . 29,017 31,538 32,761
Curtailment gain . . . . . . . . . . . . . . . . . . . . . . . . . . . . . . . . . . . . . . . . . . — (7,825) —
Contractual pension termination benefits . . . . . . . . . . . . . . . . . . . . . . . . 340 — 1,800
Net loss (gain) on sale of property, plant, and equipment . . . . . . . . . . . . 84 (68) 319
Stock-based compensation . . . . . . . . . . . . . . . . . . . . . . . . . . . . . . . . . . . 2,942 — —
Excess tax benefits from stock-based compensation . . . . . . . . . . . . . . . . (3,305) — —
Deferred income taxes . . . . . . . . . . . . . . . . . . . . . . . . . . . . . . . . . . . . . (13,481) 2,627 (1,988)
Reclassification of unrealized losses on derivatives to earnings . . . . . . . . 286 321 300
Changes in operating assets and liabilities, net of business acquisitions:
Accounts receivable. . . . . . . . . . . . . . . . . . . . . . . . . . . . . . . . . . . . . . (8,730) (9,213) (9,639)
Inventories . . . . . . . . . . . . . . . . . . . . . . . . . . . . . . . . . . . . . . . . . . . . 1,140 (11,122) (10,592)
Accounts payable and accrued liabilities . . . . . . . . . . . . . . . . . . . . . . (2,514) 6,422 26,751
Income taxes receivable . . . . . . . . . . . . . . . . . . . . . . . . . . . . . . . . . . . 9,785 (9,270) 6,298
Other — net . . . . . . . . . . . . . . . . . . . . . . . . . . . . . . . . . . . . . . . . . . . (4,928) 10,051 7,823
Total adjustments . . . . . . . . . . . . . . . . . . . . . . . . . . . . . . . . . . . . . . . . . 10,636 13,461 53,833
Net cash provided by operating activities. . . . . . . . . . . . . . . . . . . . . . . . . . 80,536 69,432 85,215
Cash flows from investing activities:Payments for purchase of property, plant, and equipment . . . . . . . . . . . . . . (31,713) (26,615) (18,698)
Proceeds from sale of property, plant, and equipment. . . . . . . . . . . . . . . . . 698 3,706 367
Receipts associated with business acquisition. . . . . . . . . . . . . . . . . . . . . . . — — 395
Business acquisitions, net of cash acquired . . . . . . . . . . . . . . . . . . . . . . . . — — (2,336)
Net cash used in investing activities . . . . . . . . . . . . . . . . . . . . . . . . . . . . . (31,015) (22,909) (20,272)
Cash flows from financing activities:Cash dividends paid . . . . . . . . . . . . . . . . . . . . . . . . . . . . . . . . . . . . . . . . . (13,742) (11,861) (10,832)
Proceeds from sales of treasury stock . . . . . . . . . . . . . . . . . . . . . . . . . . . . 4,163 6,674 2,875
Purchases of treasury stock . . . . . . . . . . . . . . . . . . . . . . . . . . . . . . . . . . . . (22,306) (7,292) (1,547)
Excess tax benefits from stock compensation. . . . . . . . . . . . . . . . . . . . . . . 3,305 — —
Net proceeds (payments) from borrowings under revolving lines . . . . . . . . (8,025) 2,899 (30,391)
Payments of long-term debt . . . . . . . . . . . . . . . . . . . . . . . . . . . . . . . . . . . (14,510) (923) —
Other payments . . . . . . . . . . . . . . . . . . . . . . . . . . . . . . . . . . . . . . . . . . . . (318) — —
Net cash used in financing activities . . . . . . . . . . . . . . . . . . . . . . . . . . . . . (51,433) (10,503) (39,895)
Effect of exchange rate changes on cash . . . . . . . . . . . . . . . . . . . . . . . . . . 1,033 (318) (211)
Net change in cash and cash equivalents . . . . . . . . . . . . . . . . . . . . . . . . (879) 35,702 24,837
Cash and cash equivalents, beginning of year. . . . . . . . . . . . . . . . . . . . . . . 84,597 48,895 24,058
Cash and cash equivalents, end of year . . . . . . . . . . . . . . . . . . . . . . . . . . . $ 83,718 $ 84,597 $ 48,895
Supplemental cash flow information:Interest expense paid . . . . . . . . . . . . . . . . . . . . . . . . . . . . . . . . . . . . . . . . $ 5,334 $ 5,654 $ 5,696
Income taxes paid. . . . . . . . . . . . . . . . . . . . . . . . . . . . . . . . . . . . . . . . . . . 19,131 24,768 9,919
Noncash investing activities:Liabilities assumed in business acquisitions . . . . . . . . . . . . . . . . . . . . . . . . — — 505
See accompanying Notes to Consolidated Financial Statements.
3331
84256_Financials.indd Sec1:3184256_Financials.indd Sec1:31 12/5/2006 3:08:15 PM12/5/2006 3:08:15 PM

Consolidated Statements of Shareholders’ Equity WOODWARD
2006 2005 2004Year Ended September 30,
(In thousands except per share amounts)
Common stockBeginning and ending balance . . . . . . . . . . . . . . . . . . . . . . . . . . . . . . . $ 106 $ 106 $ 106
Additional paid-in capitalBeginning balance. . . . . . . . . . . . . . . . . . . . . . . . . . . . . . . . . . . . . . . . $ 25,854 $ 15,878 $ 14,234
Sales of treasury stock . . . . . . . . . . . . . . . . . . . . . . . . . . . . . . . . . . . . (141) 1,894 878
Tax benefits applicable to stock options . . . . . . . . . . . . . . . . . . . . . . . . 3,305 3,403 766
Stock-based compensation . . . . . . . . . . . . . . . . . . . . . . . . . . . . . . . . . . 2,942 — —
Deferred compensation transfer . . . . . . . . . . . . . . . . . . . . . . . . . . . . . . — 657 —
Treasury stock cost adjustment . . . . . . . . . . . . . . . . . . . . . . . . . . . . . . — 4,022 —
Ending balance . . . . . . . . . . . . . . . . . . . . . . . . . . . . . . . . . . . . . . . . . . $ 31,960 $ 25,854 $ 15,878
Accumulated other comprehensive earningsBeginning balance. . . . . . . . . . . . . . . . . . . . . . . . . . . . . . . . . . . . . . . . $ 10,904 $ 12,038 $ 9,625
Foreign currency translation adjustments, net of reclassification toearnings . . . . . . . . . . . . . . . . . . . . . . . . . . . . . . . . . . . . . . . . . . . . . 2,525 336 2,628
Reclassification of unrealized losses on derivatives to earnings . . . . . . . 177 200 186
Minimum pension liability adjustment . . . . . . . . . . . . . . . . . . . . . . . . . (987) (1,670) (401)
Ending balance . . . . . . . . . . . . . . . . . . . . . . . . . . . . . . . . . . . . . . . . . . $ 12,619 $ 10,904 $ 12,038
Deferred compensationBeginning balance. . . . . . . . . . . . . . . . . . . . . . . . . . . . . . . . . . . . . . . . $ 5,402 $ 4,461 $ 4,377
Deferred compensation invested in the company’s common stock . . . . . 165 984 120
Deferred compensation settled with the company’s common stock . . . . (43) (43) (36)
Ending balance . . . . . . . . . . . . . . . . . . . . . . . . . . . . . . . . . . . . . . . . . . $ 5,524 $ 5,402 $ 4,461
Retained earningsBeginning balance. . . . . . . . . . . . . . . . . . . . . . . . . . . . . . . . . . . . . . . . $425,568 $381,458 $360,908
Net earnings . . . . . . . . . . . . . . . . . . . . . . . . . . . . . . . . . . . . . . . . . . . . 69,900 55,971 31,382
Cash dividends — $0.40 per common share in 2006, $0.35 percommon share in 2005, and $0.32 per common share in 2004. . . . . . (13,742) (11,861) (10,832)
Ending balance . . . . . . . . . . . . . . . . . . . . . . . . . . . . . . . . . . . . . . . . . . $481,726 $425,568 $381,458
Treasury stockBeginning balance. . . . . . . . . . . . . . . . . . . . . . . . . . . . . . . . . . . . . . . . $ 29,963 $ 23,619 $ 24,069
Purchases of treasury stock . . . . . . . . . . . . . . . . . . . . . . . . . . . . . . . . . 22,820 7,292 1,547
Sales of treasury stock . . . . . . . . . . . . . . . . . . . . . . . . . . . . . . . . . . . . (5,061) (4,780) (1,997)
Deferred compensation transfer . . . . . . . . . . . . . . . . . . . . . . . . . . . . . . — (190) —
Treasury stock cost adjustment . . . . . . . . . . . . . . . . . . . . . . . . . . . . . . — 4,022 —
Ending balance . . . . . . . . . . . . . . . . . . . . . . . . . . . . . . . . . . . . . . . . . . $ 47,722 $ 29,963 $ 23,619
3432
84256_Financials.indd Sec1:3284256_Financials.indd Sec1:32 12/5/2006 3:08:15 PM12/5/2006 3:08:15 PM

2006 2005 2004Year Ended September 30,
(In thousands except per share amounts)
Treasury stock held for deferred compensationBeginning balance. . . . . . . . . . . . . . . . . . . . . . . . . . . . . . . . . . . . . . . . $ 5,402 $ 4,461 $ 4,377
Deferred compensation transfer . . . . . . . . . . . . . . . . . . . . . . . . . . . . . . — 847 —
Share distributions . . . . . . . . . . . . . . . . . . . . . . . . . . . . . . . . . . . . . . . (43) (43) (36)
Automatic dividend reinvestment . . . . . . . . . . . . . . . . . . . . . . . . . . . . . 165 137 120
Ending balance . . . . . . . . . . . . . . . . . . . . . . . . . . . . . . . . . . . . . . . . . . $ 5,524 $ 5,402 $ 4,461
Total shareholders’ equityBeginning balance. . . . . . . . . . . . . . . . . . . . . . . . . . . . . . . . . . . . . . . . $432,469 $385,861 $360,804
Effect of changes among components of shareholders’ equity:
Additional paid-in capital . . . . . . . . . . . . . . . . . . . . . . . . . . . . . . . . 6,106 9,976 1,644
Accumulated other comprehensive earnings . . . . . . . . . . . . . . . . . . . 1,715 (1,134) 2,413
Deferred compensation . . . . . . . . . . . . . . . . . . . . . . . . . . . . . . . . . . 122 941 84
Retained earnings . . . . . . . . . . . . . . . . . . . . . . . . . . . . . . . . . . . . . . 56,158 44,110 20,550
Treasury stock . . . . . . . . . . . . . . . . . . . . . . . . . . . . . . . . . . . . . . . . . (17,759) (6,344) 450
Treasury stock held for deferred compensation . . . . . . . . . . . . . . . . . (122) (941) (84)
Total effect of changes among components of shareholders’ equity . . . . 46,220 46,608 25,057
Ending balance . . . . . . . . . . . . . . . . . . . . . . . . . . . . . . . . . . . . . . . . . . $478,689 $432,469 $385,861
Total comprehensive earningsNet earnings . . . . . . . . . . . . . . . . . . . . . . . . . . . . . . . . . . . . . . . . . . . . $ 69,900 $ 55,971 $ 31,382
Other comprehensive earnings:
Foreign currency translation adjustments, net of reclassification toearnings. . . . . . . . . . . . . . . . . . . . . . . . . . . . . . . . . . . . . . . . . . . . 2,525 336 2,628
Reclassification of unrealized losses on derivatives to earnings . . . . . 177 200 186
Minimum pension liability adjustment . . . . . . . . . . . . . . . . . . . . . . . (987) (1,670) (401)
Total other comprehensive earnings . . . . . . . . . . . . . . . . . . . . . . . . . 1,715 (1,134) 2,413
Total comprehensive earnings . . . . . . . . . . . . . . . . . . . . . . . . . . . . . . . $ 71,615 $ 54,837 $ 33,795
Common stock, number of sharesBeginning and ending balance . . . . . . . . . . . . . . . . . . . . . . . . . . . . . . . 36,480 36,480 36,480
Treasury stock, number of sharesBeginning balance. . . . . . . . . . . . . . . . . . . . . . . . . . . . . . . . . . . . . . . . 2,154 2,532 2,703
Purchases of treasury stock . . . . . . . . . . . . . . . . . . . . . . . . . . . . . . . . . 720 273 72
Sales of treasury stock . . . . . . . . . . . . . . . . . . . . . . . . . . . . . . . . . . . . (448) (615) (243)
Deferred compensation transfer . . . . . . . . . . . . . . . . . . . . . . . . . . . . . . — (36) —
Ending balance . . . . . . . . . . . . . . . . . . . . . . . . . . . . . . . . . . . . . . . . . . 2,426 2,154 2,532
Treasury stock held for deferred compensation, number of sharesBeginning balance. . . . . . . . . . . . . . . . . . . . . . . . . . . . . . . . . . . . . . . . 414 375 372
Deferred compensation transfer . . . . . . . . . . . . . . . . . . . . . . . . . . . . . . — 36 —
Share distributions . . . . . . . . . . . . . . . . . . . . . . . . . . . . . . . . . . . . . . . (4) (3) (3)
Automatic dividend reinvestment . . . . . . . . . . . . . . . . . . . . . . . . . . . . . 5 6 6
Ending balance . . . . . . . . . . . . . . . . . . . . . . . . . . . . . . . . . . . . . . . . . . 415 414 375
See accompanying Notes to Consolidated Financial Statements.
35
Consolidated Statements of Shareholders’ Equity — (Continued) WOODWARD
33
84256_Financials.indd Sec1:3384256_Financials.indd Sec1:33 12/5/2006 3:08:15 PM12/5/2006 3:08:15 PM

WOODWARD
Notes to Consolidated Financial Statements(In thousands of dollars except per share amounts)
Note 1. Significant accounting policies:
Principles of consolidation: The consolidated financial statements include the accounts of the company and
its majority-owned subsidiaries. Transactions within and between these companies are eliminated. Results of joint
ventures in which the company does not have a controlling financial interest are included in the financial statements
using the equity method of accounting.
Stock-split: A three-for-one stock split was approved by shareholders at the 2005 annual meeting of
shareholders on January 25, 2006. The stock split became effective for shareholders at the close of business on
February 1, 2006. The number of shares and per share amounts reported in these consolidated financial statements
have been updated from amounts reported prior to February 1, 2006, to reflect the effects of the split. In addition, in
accordance with stock option plan provisions, the terms of all outstanding stock option awards were proportionally
adjusted.
Use of estimates: Financial statements prepared in conformity with accounting principles generally accepted
in the United States require the use of estimates and assumptions that affect amounts reported. Actual results could
differ materially from our estimates.
Foreign currency translation: The assets and liabilities of substantially all subsidiaries outside the United
States are translated at year-end rates of exchange, and earnings and cash flow statements are translated at weighted-
average rates of exchange. Translation adjustments are accumulated with other comprehensive earnings as a
separate component of shareholders’ equity and are presented net of tax effects in the consolidated statements of
shareholders’ equity. The effects of changes in exchange rates on loans between consolidated subsidiaries that are
not expected to be repaid in the foreseeable future are also accumulated with other comprehensive earnings.
Revenue recognition: We recognize sales when delivery of product has occurred or services have been
rendered and there is persuasive evidence of a sales arrangement, selling prices are fixed or determinable, and
collectibility from the customer is reasonably assured. We consider product delivery to have occurred when the
customer has taken title and assumed the risks and rewards of ownership of the products. Most of our sales are made
directly to customers that use our products, although we also sell products to distributors, dealers, and independent
service facilities. Sales terms for distributors, dealers, and independent service facilities are identical to our sales
terms for direct customers. We account for payments made to customers as a reduction of revenue unless they are
made in exchange for identifiable goods or services with fair values that can be reasonably estimated. These
reductions in revenues are recognized immediately to the extent that the payments cannot be attributed to expected
future sales, and are recognized in future periods to the extent that the payments relate to future sales, based on the
specific facts and circumstances underlying each payment.
Stock-based compensation: On October 1, 2005, we began to measure the cost of employee services in
exchange for an award of equity instruments based on the grant-date fair value of the award and to recognize the cost
over the requisite service period in accordance with Statement of Financial Accounting Standards No. 123R,
“Share-Based Payment.” Prior to October 1, 2005, we used the intrinsic value method to account for stock-based
employee compensation under Accounting Principles Board Opinion No. 25, “Accounting for Stock Issued to
Employees,” and therefore we did not recognize compensation expense in association with options granted at or
above the market price of our common stock at the date of grant. Upon adoption of the new accounting method, we
used the modified prospective transition method, under which financial statements for periods prior to the date of
adoption were not adjusted for the change in accounting.
As a result of adopting the new standard, earnings before income taxes for 2006 decreased by $2,942 , and net
earnings decreased by $1,824 , or $0.05 per basic share and $0.05 per diluted share. These results reflect stock
compensation expense of $2,942 and tax benefits of $1,118.
3634
84256_Financials.indd Sec1:3484256_Financials.indd Sec1:34 12/5/2006 3:08:15 PM12/5/2006 3:08:15 PM

Adoption of the new standard also affected our consolidated statements of cash flows. The change is related to
tax benefits associated with tax deductions that exceed the amount of compensation expense recognized in financial
statements. Cash flow from operating activities was reduced by $3,305 and cash flow from financing activities was
increased by $3,305 in 2006 from amounts that would have been reported if we had not adopted the new accounting
standard.
Concurrent with our adoption of the new statement, we began to use the non-substantive vesting period
approach for attributing stock compensation to individual periods. The nominal vesting period approach was used in
determining the stock compensation expense for the pro forma 2005 and 2004 net earnings in a table that follows.
The change in the attribution method will not affect the ultimate amount of stock compensation expense recognized,
but it has accelerated the recognition of such expense for non-substantive vesting conditions, such as retirement
eligibility provisions. Under both approaches, we elected to recognize stock compensation on a straight-line basis
for options with graded vesting schedules. As a result of the change in attribution method, earnings before income
taxes for 2006 were reduced by approximately $260, and net earnings were reduced by $161, which had no effect on
basic and diluted earnings per share.
The following table presents a reconciliation of reported net earnings and per share information to pro forma
net earnings and per share information that would have been reported if the fair value method had been used to
account for stock-based employee compensation in 2005 and 2004:
Year Ended September 30, 2005 2004
Reported net earnings . . . . . . . . . . . . . . . . . . . . . . . . . . . . . . . . . . . . . . . . . . . $55,971 $31,382
Stock-based compensation expense using the fair value method, net of incometax . . . . . . . . . . . . . . . . . . . . . . . . . . . . . . . . . . . . . . . . . . . . . . . . . . . . . . . (1,502) (1,400)
Pro forma net earnings . . . . . . . . . . . . . . . . . . . . . . . . . . . . . . . . . . . . . . . . . . $54,469 $29,982
Reported net earnings per share amounts:
Basic . . . . . . . . . . . . . . . . . . . . . . . . . . . . . . . . . . . . . . . . . . . . . . . . . . . . . $ 1.64 $ 0.93
Diluted . . . . . . . . . . . . . . . . . . . . . . . . . . . . . . . . . . . . . . . . . . . . . . . . . . . . 1.59 0.90
Pro forma net earnings per share amounts:
Basic . . . . . . . . . . . . . . . . . . . . . . . . . . . . . . . . . . . . . . . . . . . . . . . . . . . . . $ 1.59 $ 0.89
Diluted . . . . . . . . . . . . . . . . . . . . . . . . . . . . . . . . . . . . . . . . . . . . . . . . . . . . 1.55 0.86
Research and development costs: Expenditures related to new product development activities are expensed
when incurred and are separately reported in the consolidated statements of earnings.
Income taxes: Deferred income taxes are provided for the temporary differences between the financial
reporting basis and the tax basis of the company’s assets and liabilities. We provide for taxes that may be payable if
undistributed earnings of overseas subsidiaries were to be remitted to the United States, except for those earnings
that we consider to be permanently reinvested.
Cash equivalents: Highly liquid investments purchased with an original maturity of three months or less are
considered to be cash equivalents.
Accounts receivable: Virtually all our sales are made on credit and result in accounts receivable, which are
recorded at the amount invoiced. In the normal course of business, not all accounts receivable are collected and,
therefore, we provide an allowance for losses of accounts receivable equal to the amount that we believe ultimately
will not be collected. We consider customer-specific information related to delinquent accounts, past loss
experience, and current economic conditions in establishing the amount of our allowance. Accounts receivable
losses are deducted from the allowance and the related accounts receivable balances are written off when the
37
WOODWARD
Notes to Consolidated Financial Statements — (Continued)(In thousands of dollars except per share amounts)
35
84256_Financials.indd Sec1:3584256_Financials.indd Sec1:35 12/5/2006 3:08:15 PM12/5/2006 3:08:15 PM

receivables are deemed uncollectible. Recoveries of accounts receivable previously written off are recognized when
received.
Inventories: Inventories are valued at the lower of cost or market, with cost being determined on a first-in,
first-out basis.
Property, plant, and equipment: Property, plant, and equipment are recorded at cost and are depreciated over
the estimated useful lives of the assets, ranging from 5 to 45 years for buildings and improvements and 3 to 15 years
for machinery and equipment. Assets placed in service after September 30, 1998, are depreciated using the straight-
line method and assets placed in service as of and prior to September 30, 1998, are depreciated principally using
accelerated methods. Assets are tested for recoverability whenever events or circumstances indicate the carrying
value may not be recoverable.
Goodwill: Goodwill represents the excess of the cost of an acquired entity over the net amount assigned to
assets acquired and liabilities assumed. Goodwill is tested for impairment on an annual basis (as of April 1) and
more often if an event occurs or circumstances change that would more likely than not reduce the fair value of a
reporting unit below its carrying amount.
The goodwill impairment test is a two-step process. In the first step, we compare the fair value of a reporting
unit with its carrying amount, including goodwill. The goodwill is considered potentially impaired if the carrying
amount of the reporting unit exceeds its fair value. The second step is performed for all goodwill that is potentially
impaired. In this step, we compare the implied fair value of the goodwill of the reporting unit to the carrying amount
of that goodwill. The implied fair value of the goodwill is determined in the same manner as the amount of goodwill
recognized when a business combination is determined. If the carrying amount of goodwill exceeds the implied fair
value of goodwill, we would recognize an impairment loss to reduce the carrying amount to its implied fair value.
A reporting unit is the level at which goodwill is tested for impairment. A reporting unit is an operating
segment or a component one level below an operating segment if the component constitutes a business for which
discrete financial information is available and segment management regularly reviews the operating results of that
component. Two or more components would be aggregated and considered a single reporting unit if the components
have similar economic conditions. In our most recent impairment test, we determined our operating segments were
our reporting units for purposes of our impairment tests.
Other intangibles: Other intangibles are recognized apart from goodwill whenever an acquired intangible
asset arises from contractual or other legal rights, or whenever it is capable of being separated or divided from the
acquired entity and sold, transferred, licensed, rented, or exchanged, either individually or in combination with a
related contract, asset, or liability. An intangible other than goodwill is amortized over its estimated useful life
unless that life is determined to be indefinite. Currently, all of our intangibles have an estimated useful life and are
being amortized.
Impairment losses are recognized if the carrying amount of an intangible exceeds its fair value.
Deferred compensation: Deferred compensation obligations will be settled either by delivery of a fixed
number of shares of the company’s common stock (in accordance with certain eligible members’ irrevocable
elections) or in cash. We have contributed shares of common stock of the company into a trust established for the
future settlement of deferred compensation obligations that are payable in shares of the company’s common stock.
Common stock held by the trust is reflected in the consolidated balance sheet as treasury stock held for deferred
compensation, and the related deferred compensation obligation is reflected as a separate component of equity in
amounts equal to the fair value of the common stock at the dates of contribution. These accounts are not adjusted for
subsequent changes in fair value of the common stock. Deferred compensation obligations that will be settled in
cash are accounted for on an accrual basis in accordance with the terms of the underlying contract and are reflected
in the consolidated balance sheet as an accrued expense.
38
WOODWARD
Notes to Consolidated Financial Statements — (Continued)(In thousands of dollars except per share amounts)
36
84256_Financials.indd Sec1:3684256_Financials.indd Sec1:36 12/5/2006 3:08:15 PM12/5/2006 3:08:15 PM
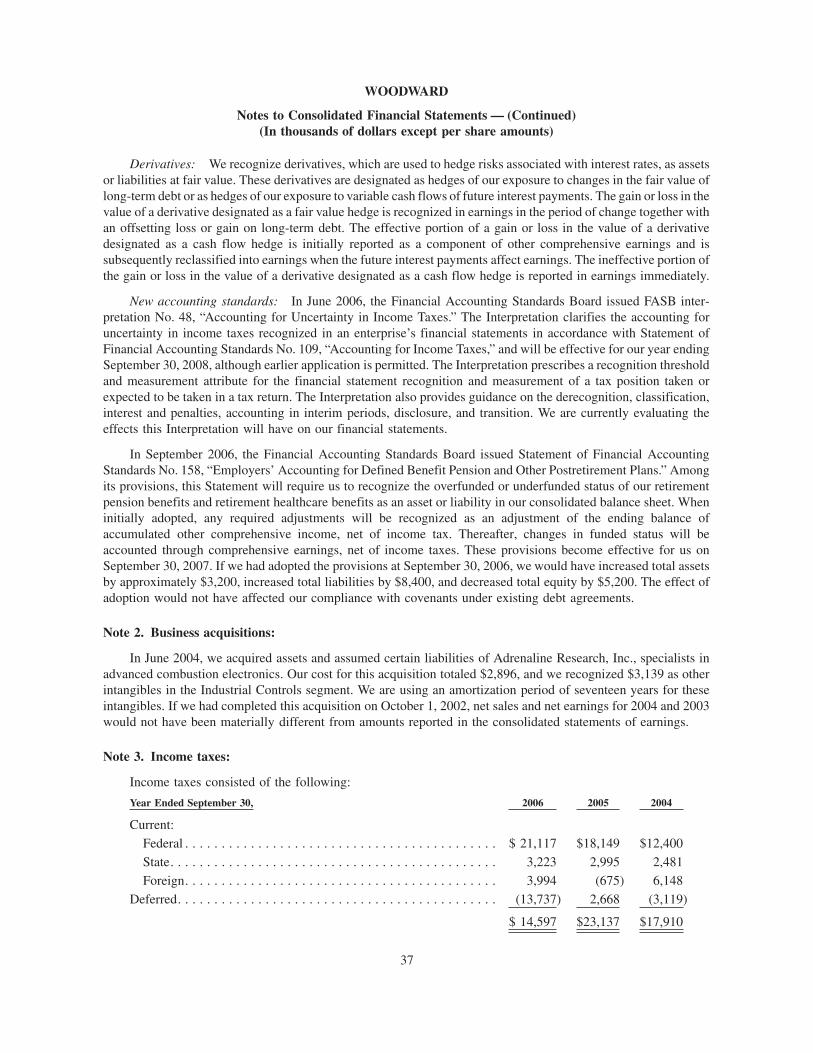
Derivatives: We recognize derivatives, which are used to hedge risks associated with interest rates, as assets
or liabilities at fair value. These derivatives are designated as hedges of our exposure to changes in the fair value of
long-term debt or as hedges of our exposure to variable cash flows of future interest payments. The gain or loss in the
value of a derivative designated as a fair value hedge is recognized in earnings in the period of change together with
an offsetting loss or gain on long-term debt. The effective portion of a gain or loss in the value of a derivative
designated as a cash flow hedge is initially reported as a component of other comprehensive earnings and is
subsequently reclassified into earnings when the future interest payments affect earnings. The ineffective portion of
the gain or loss in the value of a derivative designated as a cash flow hedge is reported in earnings immediately.
New accounting standards: In June 2006, the Financial Accounting Standards Board issued FASB inter-
pretation No. 48, “Accounting for Uncertainty in Income Taxes.” The Interpretation clarifies the accounting for
uncertainty in income taxes recognized in an enterprise’s financial statements in accordance with Statement of
Financial Accounting Standards No. 109, “Accounting for Income Taxes,” and will be effective for our year ending
September 30, 2008, although earlier application is permitted. The Interpretation prescribes a recognition threshold
and measurement attribute for the financial statement recognition and measurement of a tax position taken or
expected to be taken in a tax return. The Interpretation also provides guidance on the derecognition, classification,
interest and penalties, accounting in interim periods, disclosure, and transition. We are currently evaluating the
effects this Interpretation will have on our financial statements.
In September 2006, the Financial Accounting Standards Board issued Statement of Financial Accounting
Standards No. 158, “Employers’ Accounting for Defined Benefit Pension and Other Postretirement Plans.” Among
its provisions, this Statement will require us to recognize the overfunded or underfunded status of our retirement
pension benefits and retirement healthcare benefits as an asset or liability in our consolidated balance sheet. When
initially adopted, any required adjustments will be recognized as an adjustment of the ending balance of
accumulated other comprehensive income, net of income tax. Thereafter, changes in funded status will be
accounted through comprehensive earnings, net of income taxes. These provisions become effective for us on
September 30, 2007. If we had adopted the provisions at September 30, 2006, we would have increased total assets
by approximately $3,200, increased total liabilities by $8,400, and decreased total equity by $5,200. The effect of
adoption would not have affected our compliance with covenants under existing debt agreements.
Note 2. Business acquisitions:
In June 2004, we acquired assets and assumed certain liabilities of Adrenaline Research, Inc., specialists in
advanced combustion electronics. Our cost for this acquisition totaled $2,896, and we recognized $3,139 as other
intangibles in the Industrial Controls segment. We are using an amortization period of seventeen years for these
intangibles. If we had completed this acquisition on October 1, 2002, net sales and net earnings for 2004 and 2003
would not have been materially different from amounts reported in the consolidated statements of earnings.
Note 3. Income taxes:
Income taxes consisted of the following:
Year Ended September 30, 2006 2005 2004
Current:
Federal . . . . . . . . . . . . . . . . . . . . . . . . . . . . . . . . . . . . . . . . . . . $ 21,117 $18,149 $12,400
State. . . . . . . . . . . . . . . . . . . . . . . . . . . . . . . . . . . . . . . . . . . . . 3,223 2,995 2,481
Foreign. . . . . . . . . . . . . . . . . . . . . . . . . . . . . . . . . . . . . . . . . . . 3,994 (675) 6,148
Deferred. . . . . . . . . . . . . . . . . . . . . . . . . . . . . . . . . . . . . . . . . . . . (13,737) 2,668 (3,119)
$ 14,597 $23,137 $17,910
39
WOODWARD
Notes to Consolidated Financial Statements — (Continued)(In thousands of dollars except per share amounts)
37
84256_Financials.indd Sec1:3784256_Financials.indd Sec1:37 12/5/2006 3:08:16 PM12/5/2006 3:08:16 PM

Earnings before income taxes by geographical area consisted of the following:
Year Ended September 30, 2006 2005 2004
United States . . . . . . . . . . . . . . . . . . . . . . . . . . . . . . . . . . . . . . . . . $70,037 $81,244 $39,054
Other countries . . . . . . . . . . . . . . . . . . . . . . . . . . . . . . . . . . . . . . . 14,460 (2,136) 10,238
$84,497 $79,108 $49,292
Deferred income taxes presented in the consolidated balance sheets are related to the following:
At September 30, 2006 2005
Deferred tax assets:
Retirement healthcare and early retirement benefits . . . . . . . . . . . . . . . . . . $ 18,691 $ 18,434
Foreign net operating loss carryforwards . . . . . . . . . . . . . . . . . . . . . . . . . . 16,245 18,694
Inventory . . . . . . . . . . . . . . . . . . . . . . . . . . . . . . . . . . . . . . . . . . . . . . . . . 9,363 10,006
Other . . . . . . . . . . . . . . . . . . . . . . . . . . . . . . . . . . . . . . . . . . . . . . . . . . . . 30,779 24,022
Valuation allowance . . . . . . . . . . . . . . . . . . . . . . . . . . . . . . . . . . . . . . . . . (2,566) (17,769)
Total deferred tax assets, net of valuation allowance . . . . . . . . . . . . . . . . . 72,512 53,387
Deferred tax liabilities:
Intangibles — net . . . . . . . . . . . . . . . . . . . . . . . . . . . . . . . . . . . . . . . . . . . (26,294) (22,781)
Other . . . . . . . . . . . . . . . . . . . . . . . . . . . . . . . . . . . . . . . . . . . . . . . . . . . . (12,253) (9,596)
Total deferred tax liabilities . . . . . . . . . . . . . . . . . . . . . . . . . . . . . . . . . . . . (38,547) (32,377)
Net deferred tax assets . . . . . . . . . . . . . . . . . . . . . . . . . . . . . . . . . . . . . . . . . $ 33,965 $ 21,010
The foreign net operating loss carryforwards includes $888 that expires in 2012 and $15,357 that may be
carried forward indefinitely.
At September 30, 2006, we have not provided for taxes on undistributed foreign earnings of $18,270 that we
consider permanently reinvested. These earnings could become subject to income taxes if they are remitted as
dividends, are loaned to the company, or if we sell our stock in the subsidiaries. However, we believe that foreign tax
credits would largely offset any income tax that might otherwise be due.
The changes in the valuation allowance were as follows:
Year Ended September 30, 2006 2005 2004
Beginning balance . . . . . . . . . . . . . . . . . . . . . . . . . . . . . . . . . . . $(17,769) $(18,629) $(16,528)
Change in valuation allowance that existed at the beginning ofthe year . . . . . . . . . . . . . . . . . . . . . . . . . . . . . . . . . . . . . . . . . 13,710 — —
Foreign net operating loss carryforward . . . . . . . . . . . . . . . . . . . 1,493 860 (2,101)
Ending balance . . . . . . . . . . . . . . . . . . . . . . . . . . . . . . . . . . . . . $ (2,566) $(17,769) $(18,629)
Deferred tax assets are reduced by a valuation allowance if, based on the weight of available evidence, it is
more likely than not that some portion or all of the deferred tax assets will not be realized. Both positive and
negative evidence are considered in forming our judgment as to whether a valuation allowance is appropriate, and
more weight is given to evidence that can be objectively verified. Valuation allowances are reassessed whenever
there are changes in circumstances that may cause a change in judgment. In 2006, additional objective evidence
became available regarding earnings in tax jurisdictions that had unexpired net operating loss carryforwards that
affected our judgment about the valuation allowance that existed at the beginning of the year.
40
WOODWARD
Notes to Consolidated Financial Statements — (Continued)(In thousands of dollars except per share amounts)
38
84256_Financials.indd Sec1:3884256_Financials.indd Sec1:38 12/5/2006 3:08:16 PM12/5/2006 3:08:16 PM
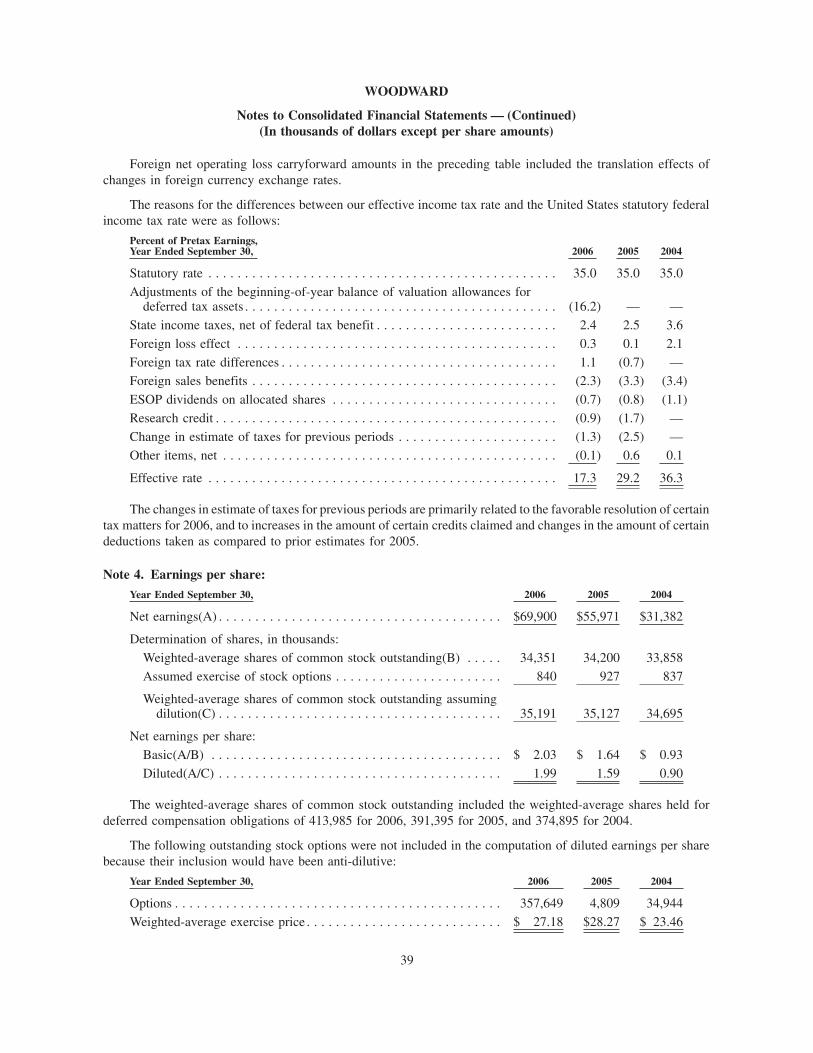
Foreign net operating loss carryforward amounts in the preceding table included the translation effects of
changes in foreign currency exchange rates.
The reasons for the differences between our effective income tax rate and the United States statutory federal
income tax rate were as follows:
Percent of Pretax Earnings,Year Ended September 30, 2006 2005 2004
Statutory rate . . . . . . . . . . . . . . . . . . . . . . . . . . . . . . . . . . . . . . . . . . . . . . . . 35.0 35.0 35.0
Adjustments of the beginning-of-year balance of valuation allowances fordeferred tax assets . . . . . . . . . . . . . . . . . . . . . . . . . . . . . . . . . . . . . . . . . . . (16.2) — —
State income taxes, net of federal tax benefit . . . . . . . . . . . . . . . . . . . . . . . . . 2.4 2.5 3.6
Foreign loss effect . . . . . . . . . . . . . . . . . . . . . . . . . . . . . . . . . . . . . . . . . . . . 0.3 0.1 2.1
Foreign tax rate differences . . . . . . . . . . . . . . . . . . . . . . . . . . . . . . . . . . . . . . 1.1 (0.7) —
Foreign sales benefits . . . . . . . . . . . . . . . . . . . . . . . . . . . . . . . . . . . . . . . . . . (2.3) (3.3) (3.4)
ESOP dividends on allocated shares . . . . . . . . . . . . . . . . . . . . . . . . . . . . . . . (0.7) (0.8) (1.1)
Research credit . . . . . . . . . . . . . . . . . . . . . . . . . . . . . . . . . . . . . . . . . . . . . . . (0.9) (1.7) —
Change in estimate of taxes for previous periods . . . . . . . . . . . . . . . . . . . . . . (1.3) (2.5) —
Other items, net . . . . . . . . . . . . . . . . . . . . . . . . . . . . . . . . . . . . . . . . . . . . . . (0.1) 0.6 0.1
Effective rate . . . . . . . . . . . . . . . . . . . . . . . . . . . . . . . . . . . . . . . . . . . . . . . . 17.3 29.2 36.3
The changes in estimate of taxes for previous periods are primarily related to the favorable resolution of certain
tax matters for 2006, and to increases in the amount of certain credits claimed and changes in the amount of certain
deductions taken as compared to prior estimates for 2005.
Note 4. Earnings per share:
Year Ended September 30, 2006 2005 2004
Net earnings(A) . . . . . . . . . . . . . . . . . . . . . . . . . . . . . . . . . . . . . . . $69,900 $55,971 $31,382
Determination of shares, in thousands:
Weighted-average shares of common stock outstanding(B) . . . . . 34,351 34,200 33,858
Assumed exercise of stock options . . . . . . . . . . . . . . . . . . . . . . . 840 927 837
Weighted-average shares of common stock outstanding assumingdilution(C) . . . . . . . . . . . . . . . . . . . . . . . . . . . . . . . . . . . . . . . 35,191 35,127 34,695
Net earnings per share:
Basic(A/B) . . . . . . . . . . . . . . . . . . . . . . . . . . . . . . . . . . . . . . . . $ 2.03 $ 1.64 $ 0.93
Diluted(A/C) . . . . . . . . . . . . . . . . . . . . . . . . . . . . . . . . . . . . . . . 1.99 1.59 0.90
The weighted-average shares of common stock outstanding included the weighted-average shares held for
deferred compensation obligations of 413,985 for 2006, 391,395 for 2005, and 374,895 for 2004.
The following outstanding stock options were not included in the computation of diluted earnings per share
because their inclusion would have been anti-dilutive:
Year Ended September 30, 2006 2005 2004
Options . . . . . . . . . . . . . . . . . . . . . . . . . . . . . . . . . . . . . . . . . . . . . 357,649 4,809 34,944
Weighted-average exercise price . . . . . . . . . . . . . . . . . . . . . . . . . . . $ 27.18 $28.27 $ 23.46
41
WOODWARD
Notes to Consolidated Financial Statements — (Continued)(In thousands of dollars except per share amounts)
39
84256_Financials.indd Sec1:3984256_Financials.indd Sec1:39 12/5/2006 3:08:16 PM12/5/2006 3:08:16 PM

Note 5. Inventories:At September 30, 2006 2005
Raw materials . . . . . . . . . . . . . . . . . . . . . . . . . . . . . . . . . . . . . . . . . . . . . . . $ 5,495 $ 4,876
Component parts . . . . . . . . . . . . . . . . . . . . . . . . . . . . . . . . . . . . . . . . . . . . . 91,644 97,429
Work in process . . . . . . . . . . . . . . . . . . . . . . . . . . . . . . . . . . . . . . . . . . . . . 30,124 28,326
Finished goods . . . . . . . . . . . . . . . . . . . . . . . . . . . . . . . . . . . . . . . . . . . . . . 21,909 18,705
$149,172 $149,336
Note 6. Property, plant, and equipment:At September 30, 2006 2005
Land . . . . . . . . . . . . . . . . . . . . . . . . . . . . . . . . . . . . . . . . . . . . . . . . . . . . . . $ 9,800 $ 9,766
Buildings and improvements . . . . . . . . . . . . . . . . . . . . . . . . . . . . . . . . . . . . 158,276 153,567
Machinery and equipment . . . . . . . . . . . . . . . . . . . . . . . . . . . . . . . . . . . . . . 248,907 238,550
Construction in progress . . . . . . . . . . . . . . . . . . . . . . . . . . . . . . . . . . . . . . . 11,181 4,905
428,164 406,788
Less accumulated depreciation . . . . . . . . . . . . . . . . . . . . . . . . . . . . . . . . . . . 303,988 292,001
Property, plant, and equipment — net . . . . . . . . . . . . . . . . . . . . . . . . . . . . . . $124,176 $114,787
Depreciation expense totaled $22,064 in 2006, $24,451 in 2005, and $25,856 in 2004.
Note 7. Goodwill:Year Ended September 30, 2006 2005
Industrial Controls:Beginning balance . . . . . . . . . . . . . . . . . . . . . . . . . . . . . . . . . . . . . . . . . . $ 68,913 $ 69,420
Foreign currency exchange rate changes . . . . . . . . . . . . . . . . . . . . . . . . . . 1,049 (507)
Ending balance . . . . . . . . . . . . . . . . . . . . . . . . . . . . . . . . . . . . . . . . . . . . $ 69,962 $ 68,913
Aircraft Engine Systems:Beginning and ending balance . . . . . . . . . . . . . . . . . . . . . . . . . . . . . . . . . $ 62,122 $ 62,122
Consolidated:Beginning balance . . . . . . . . . . . . . . . . . . . . . . . . . . . . . . . . . . . . . . . . . . $131,035 $131,542
Foreign currency exchange rate changes . . . . . . . . . . . . . . . . . . . . . . . . . . 1,049 (507)
Ending balance . . . . . . . . . . . . . . . . . . . . . . . . . . . . . . . . . . . . . . . . . . . . $132,084 $131,035
42
WOODWARD
Notes to Consolidated Financial Statements — (Continued)(In thousands of dollars except per share amounts)
40
84256_Financials.indd Sec1:4084256_Financials.indd Sec1:40 12/5/2006 3:08:16 PM12/5/2006 3:08:16 PM

Note 8. Other intangibles — net:
At September 30, 2006 2005
Industrial Controls:Customer relationships:
Amount acquired. . . . . . . . . . . . . . . . . . . . . . . . . . . . . . . . . . . . . . . . . . $ 37,387 $ 37,387
Accumulated amortization . . . . . . . . . . . . . . . . . . . . . . . . . . . . . . . . . . . (11,414) (8,814)
25,973 28,573
Other:
Amount acquired. . . . . . . . . . . . . . . . . . . . . . . . . . . . . . . . . . . . . . . . . . 31,072 31,207
Accumulated amortization . . . . . . . . . . . . . . . . . . . . . . . . . . . . . . . . . . . (12,739) (10,194)
18,333 21,013
Total . . . . . . . . . . . . . . . . . . . . . . . . . . . . . . . . . . . . . . . . . . . . . . . . . . . . $ 44,306 $ 49,586
Aircraft Engine Systems:Customer relationships:
Amount acquired. . . . . . . . . . . . . . . . . . . . . . . . . . . . . . . . . . . . . . . . . . $ 28,547 $ 28,547
Accumulated amortization . . . . . . . . . . . . . . . . . . . . . . . . . . . . . . . . . . . (7,930) (6,979)
20,617 21,568
Other:
Amount acquired. . . . . . . . . . . . . . . . . . . . . . . . . . . . . . . . . . . . . . . . . . 11,785 11,785
Accumulated amortization . . . . . . . . . . . . . . . . . . . . . . . . . . . . . . . . . . . (4,971) (4,375)
6,814 7,410
Total . . . . . . . . . . . . . . . . . . . . . . . . . . . . . . . . . . . . . . . . . . . . . . . . . . . . $ 27,431 $ 28,978
Consolidated:Customer relationships:
Amount acquired. . . . . . . . . . . . . . . . . . . . . . . . . . . . . . . . . . . . . . . . . . $ 65,934 $ 65,934
Accumulated amortization . . . . . . . . . . . . . . . . . . . . . . . . . . . . . . . . . . . (19,344) (15,793)
46,590 50,141
Other:
Amount acquired. . . . . . . . . . . . . . . . . . . . . . . . . . . . . . . . . . . . . . . . . . 42,857 42,992
Accumulated amortization . . . . . . . . . . . . . . . . . . . . . . . . . . . . . . . . . . . (17,710) (14,569)
25,147 28,423
Total . . . . . . . . . . . . . . . . . . . . . . . . . . . . . . . . . . . . . . . . . . . . . . . . . . . . $ 71,737 $ 78,564
Amortization expense associated with current intangibles is expected to be approximately $6,700 for 2007,
$5,900 for 2008, $5,500 for 2009, $5,400 for 2010, and $5,300 for 2011.
Note 9. Short-term borrowings:
Short-term borrowings reflect borrowings under certain bank lines of credit. The total amount available under
these lines of credit, including outstanding borrowings, totaled $17,691 at September 30, 2006, and $25,695 at
43
WOODWARD
Notes to Consolidated Financial Statements — (Continued)(In thousands of dollars except per share amounts)
41
84256_Financials.indd Sec1:4184256_Financials.indd Sec1:41 12/5/2006 3:08:16 PM12/5/2006 3:08:16 PM

September 30, 2005. Interest on borrowings under the lines of credit is based on various short-term rates. Several of
the lines assess commitment fees. The lines are generally reviewed annually for renewal and are subject to the usual
terms and conditions applied by the banks. The weighted-average interest rate for outstanding borrowings was 0.5%
at September 30, 2006, 2.3% at September 30, 2005, and 2.8% at September 30, 2004. For all three years, and in
particular 2006, the rates were lower than is typical in the United States because of borrowings in foreign countries.
Note 10. Long-term debt:
At September 30, 2006 2005
Senior notes — 6.39%. . . . . . . . . . . . . . . . . . . . . . . . . . . . . . . . . . . . . . . . . . . $64,286 $75,000
Term note — 5.19% . . . . . . . . . . . . . . . . . . . . . . . . . . . . . . . . . . . . . . . . . . . . 7,809 11,135
Fair value hedge adjustment for unrecognized discontinued hedge gains . . . . . . 903 1,233
72,998 87,368
Less current portion . . . . . . . . . . . . . . . . . . . . . . . . . . . . . . . . . . . . . . . . . . . . 14,619 14,426
$58,379 $72,942
The senior notes, which are held by multiple institutions, and the term note, which is held by a bank in
Germany, are uncollateralized. Required future principal payments of the senior notes and the term note at
September 30, 2006, are $14,619 in 2007, $14,619 in 2008, $10,714 in 2009, $10,714 in 2010, $10,714 in 2011, and
$10,715 thereafter.
We also have a $100,000 revolving line of credit facility that involves uncollateralized financing arrangements
with a syndicate of U.S. banks. There is an option to increase the amount of the line to $175,000. This line of credit
expires March 11, 2010. Interest rates on borrowings under the line vary with LIBOR, the money market rate, or the
prime rate. At September 30, 2006, there are no borrowings against the line.
Previously, we discontinued certain interest rate swaps that were designated as fair value hedges of long-term
debt. These actions resulted in gains that are recognized as a reduction of interest expense over the term of the
associated hedged debt using the effective interest method. The unrecognized portion of the gain was presented as
an adjustment to long-term debt in the preceding table.
Provisions of the debt agreements include covenants customary to such agreements that require us to maintain
specified minimum or maximum financial measures and place limitations on various investing and financing
activities. The agreements also permit the lenders to accelerate repayment requirements in the event of a material
adverse event. Our most restrictive covenants require us to maintain a minimum consolidated net worth, a
maximum consolidated debt to consolidated operating cash flow, and a maximum consolidated debt to EBITDA, as
defined in the agreements.
Note 11. Accrued liabilities:
At September 30, 2006 2005
Salaries and other member benefits . . . . . . . . . . . . . . . . . . . . . . . . . . . . . . . . . $28,673 $40,629
Warranties . . . . . . . . . . . . . . . . . . . . . . . . . . . . . . . . . . . . . . . . . . . . . . . . . . . 5,832 5,692
Contingent legal matters . . . . . . . . . . . . . . . . . . . . . . . . . . . . . . . . . . . . . . . . . 8,500 —Taxes, other than on income . . . . . . . . . . . . . . . . . . . . . . . . . . . . . . . . . . . . . . 4,391 4,828
Other items. . . . . . . . . . . . . . . . . . . . . . . . . . . . . . . . . . . . . . . . . . . . . . . . . . . 19,481 17,498
$66,877 $68,647
44
WOODWARD
Notes to Consolidated Financial Statements — (Continued)(In thousands of dollars except per share amounts)
42
84256_Financials.indd Sec1:4284256_Financials.indd Sec1:42 12/5/2006 3:08:16 PM12/5/2006 3:08:16 PM

Salaries and other member benefits included accrued termination benefits totaling $4,935 at September 30,
2005, which were related to the Industrial Controls segment. Changes in accrued termination benefits were as
follows:
Year Ended September 30, 2006 2005
Beginning balance . . . . . . . . . . . . . . . . . . . . . . . . . . . . . . . . . . . . . . . . . . . . . . $ 4,935 $12,000
Expense:
Cost of goods sold . . . . . . . . . . . . . . . . . . . . . . . . . . . . . . . . . . . . . . . . . . . . 69 2,066
Selling, general, and administrative expenses . . . . . . . . . . . . . . . . . . . . . . . . 1 78
Payments and other settlements . . . . . . . . . . . . . . . . . . . . . . . . . . . . . . . . . . . . (4,916) (7,041)
Accrual adjustments . . . . . . . . . . . . . . . . . . . . . . . . . . . . . . . . . . . . . . . . . . . . — (2,204)
Foreign currency exchange rate changes . . . . . . . . . . . . . . . . . . . . . . . . . . . . . . (89) 36
Ending balance . . . . . . . . . . . . . . . . . . . . . . . . . . . . . . . . . . . . . . . . . . . . . . . . $ — $ 4,935
The termination benefits that were expensed and accrued during 2005 and 2006 were primarily related to the
consolidation of two European manufacturing operations with existing operations. This action was taken to
streamline the organization by eliminating redundant manufacturing operations and was completed in 2006. The
total expense for this action was $15,920, which included $12,010 for termination benefits, $2,140 for contractual
pension termination benefits, and other costs primarily associated with moving equipment and inventory to other
locations totaling $1,770.
Provisions of our sales agreements include product warranties customary to such agreements. We establish
accruals for specifically identified warranty issues that are probable to result in future costs. We also accrue for
warranty costs on a non-specific basis whenever past experience indicates a normal and predictable pattern exists.
Changes in accrued product warranties were as follows:
Year Ended September 30, 2006 2005
Beginning balance . . . . . . . . . . . . . . . . . . . . . . . . . . . . . . . . . . . . . . . . . . . . . . $ 5,692 $ 6,401
Accruals related to warranties issued during the period . . . . . . . . . . . . . . . . . . . 6,107 5,761
Accruals related to pre-existing warranties . . . . . . . . . . . . . . . . . . . . . . . . . . . . (1,372) (1,543)
Settlements of amounts accrued . . . . . . . . . . . . . . . . . . . . . . . . . . . . . . . . . . . . (4,647) (4,876)
Foreign currency exchange rate changes . . . . . . . . . . . . . . . . . . . . . . . . . . . . . . 52 (51)
Ending balance . . . . . . . . . . . . . . . . . . . . . . . . . . . . . . . . . . . . . . . . . . . . . . . . $ 5,832 $ 5,692
Note 12. Other liabilities:
Year Ended September 30, 2006 2005
Net accrued retirement benefits, less amounts recognized with accruedliabilities . . . . . . . . . . . . . . . . . . . . . . . . . . . . . . . . . . . . . . . . . . . . . . . . . . . $55,075 $57,680
Other items. . . . . . . . . . . . . . . . . . . . . . . . . . . . . . . . . . . . . . . . . . . . . . . . . . . 16,115 13,868
$71,190 $71,548
Note 13. Retirement benefits:
We provide various benefits to eligible members of our company, including contributions to various defined
contribution plans, pension benefits associated with defined benefit plans, and retirement healthcare benefits. The
amount of expense associated with defined contribution plans totaled $13,684 in 2006, $12,705 in 2005, and
45
WOODWARD
Notes to Consolidated Financial Statements — (Continued)(In thousands of dollars except per share amounts)
43
84256_Financials.indd Sec1:4384256_Financials.indd Sec1:43 12/5/2006 3:08:16 PM12/5/2006 3:08:16 PM
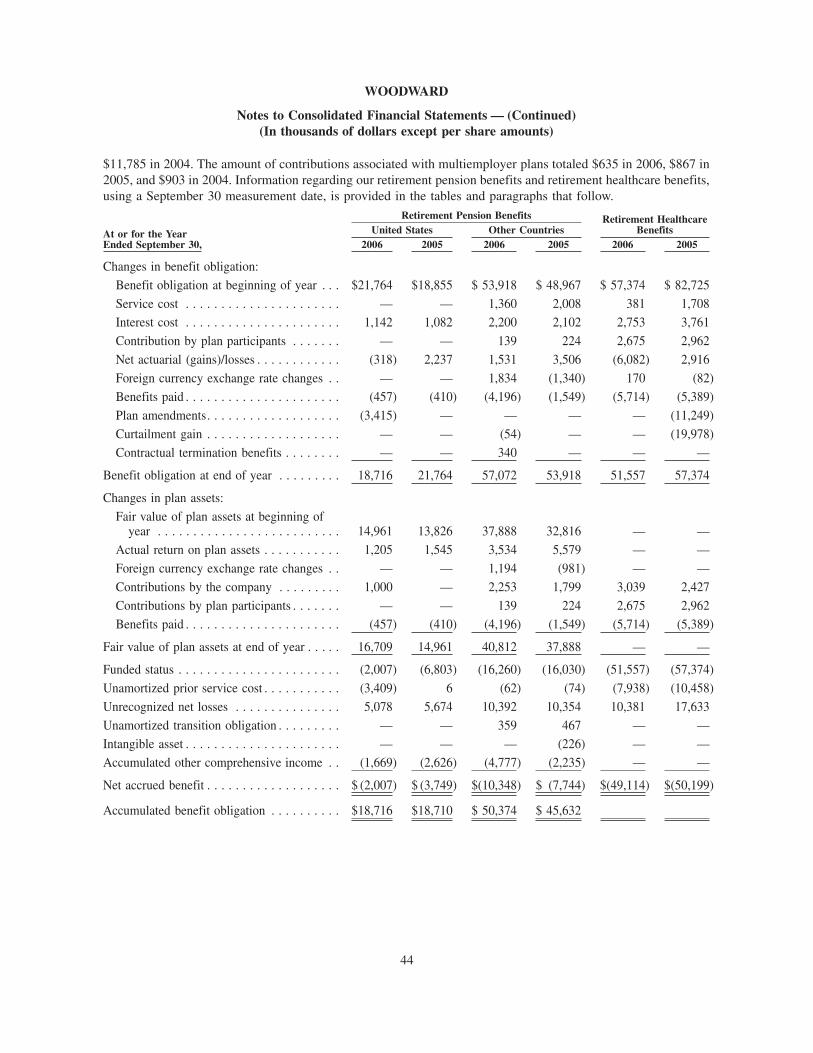
$11,785 in 2004. The amount of contributions associated with multiemployer plans totaled $635 in 2006, $867 in
2005, and $903 in 2004. Information regarding our retirement pension benefits and retirement healthcare benefits,
using a September 30 measurement date, is provided in the tables and paragraphs that follow.
At or for the YearEnded September 30, 2006 2005 2006 2005 2006 2005
United States Other CountriesRetirement Healthcare
BenefitsRetirement Pension Benefits
Changes in benefit obligation:
Benefit obligation at beginning of year . . . $21,764 $18,855 $ 53,918 $ 48,967 $ 57,374 $ 82,725
Service cost . . . . . . . . . . . . . . . . . . . . . . — — 1,360 2,008 381 1,708
Interest cost . . . . . . . . . . . . . . . . . . . . . . 1,142 1,082 2,200 2,102 2,753 3,761
Contribution by plan participants . . . . . . . — — 139 224 2,675 2,962
Net actuarial (gains)/losses . . . . . . . . . . . . (318) 2,237 1,531 3,506 (6,082) 2,916
Foreign currency exchange rate changes . . — — 1,834 (1,340) 170 (82)
Benefits paid . . . . . . . . . . . . . . . . . . . . . . (457) (410) (4,196) (1,549) (5,714) (5,389)
Plan amendments. . . . . . . . . . . . . . . . . . . (3,415) — — — — (11,249)
Curtailment gain . . . . . . . . . . . . . . . . . . . — — (54) — — (19,978)
Contractual termination benefits . . . . . . . . — — 340 — — —
Benefit obligation at end of year . . . . . . . . . 18,716 21,764 57,072 53,918 51,557 57,374
Changes in plan assets:
Fair value of plan assets at beginning ofyear . . . . . . . . . . . . . . . . . . . . . . . . . . 14,961 13,826 37,888 32,816 — —
Actual return on plan assets . . . . . . . . . . . 1,205 1,545 3,534 5,579 — —
Foreign currency exchange rate changes . . — — 1,194 (981) — —
Contributions by the company . . . . . . . . . 1,000 — 2,253 1,799 3,039 2,427
Contributions by plan participants . . . . . . . — — 139 224 2,675 2,962
Benefits paid . . . . . . . . . . . . . . . . . . . . . . (457) (410) (4,196) (1,549) (5,714) (5,389)
Fair value of plan assets at end of year . . . . . 16,709 14,961 40,812 37,888 — —
Funded status . . . . . . . . . . . . . . . . . . . . . . . (2,007) (6,803) (16,260) (16,030) (51,557) (57,374)
Unamortized prior service cost . . . . . . . . . . . (3,409) 6 (62) (74) (7,938) (10,458)
Unrecognized net losses . . . . . . . . . . . . . . . 5,078 5,674 10,392 10,354 10,381 17,633
Unamortized transition obligation . . . . . . . . . — — 359 467 — —
Intangible asset . . . . . . . . . . . . . . . . . . . . . . — — — (226) — —
Accumulated other comprehensive income . . (1,669) (2,626) (4,777) (2,235) — —
Net accrued benefit . . . . . . . . . . . . . . . . . . . $ (2,007) $ (3,749) $(10,348) $ (7,744) $(49,114) $(50,199)
Accumulated benefit obligation . . . . . . . . . . $18,716 $18,710 $ 50,374 $ 45,632
46
WOODWARD
Notes to Consolidated Financial Statements — (Continued)(In thousands of dollars except per share amounts)
44
84256_Financials.indd Sec1:4484256_Financials.indd Sec1:44 12/5/2006 3:08:17 PM12/5/2006 3:08:17 PM

Year Ended September 30, 2006 2005 2004 2006 2005 2004 2006 2005 2004United States Other Countries
RetirementHealthcare Benefits
Retirement Pension Benefits
Components of net periodic benefit cost:
Service cost . . . . . . . . . . . . . . . . . . . . . $ — $ — $ — $ 1,360 $ 2,008 $ 1,694 $ 381 $ 1,708 $2,206
Interest cost . . . . . . . . . . . . . . . . . . . . . 1,142 1,082 1,070 2,200 2,102 1,835 2,753 3,761 4,204
Expected return on plan assets . . . . . . . . (1,180) (1,090) (942) (1,998) (2,069) (1,641) — — —
Amortization of unrecognized transitionobligation . . . . . . . . . . . . . . . . . . . . . — — — 91 99 98 — — —
Recognized losses . . . . . . . . . . . . . . . . . 251 148 170 402 553 533 1,198 1,550 1,343
Recognized prior service cost . . . . . . . . . 1 1 1 (8) (9) (9) (2,520) (1,346) (508)
Contractual termination benefits . . . . . . . — — — 340 — 1,800 — — —
Curtailment gain . . . . . . . . . . . . . . . . . . — — — — — — — (7,825) —
Net periodic benefit cost . . . . . . . . . . . . $ 214 $ 141 $ 299 $ 2,387 $ 2,684 $ 4,310 $ 1,812 $(2,152) $7,245
Increase (decrease) in minimum pensionliability adjustment included in othercomprehensive earnings . . . . . . . . . . . $ (950) $ 1,113 $ 240 $ 2,542 $ 1,553 $ 390 $ — $ — $ —
Weighted-average assumptions used todetermine benefit obligation atSeptember 30:
Discount rate . . . . . . . . . . . . . . . . . . . . 5.60% 5.30% 5.80% 4.39% 4.08% 4.36% 5.56% 5.28% 5.79%
Rate of compensation increase . . . . . . . . 4.50% 4.50% 5.00% 3.44% 3.16% 3.02% — — —
Weighted-average assumptions used todetermine net periodic benefit cost foryears ended September 30:
Discount rate . . . . . . . . . . . . . . . . . . . . 5.30% 5.80% 6.00% 4.08% 4.36% 4.06% 5.28% 5.79% 6.00%
Rate of compensation increase . . . . . . . . 4.50% 5.00% 5.00% 3.16% 3.02% 2.91% — — —
Expected long-term rate of return on planassets . . . . . . . . . . . . . . . . . . . . . . . . 8.00% 8.00% 8.25% 5.57% 6.04% 5.44% — — —
An amendment was made to one of our retirement pension benefit plans in 2006 that modified the amount of
pension benefits payable to participants retiring after January 1, 2007. Amendments were also made to one of our
retirement healthcare benefit plans in 2005 that reduced the number of individuals who will qualify for retirement
healthcare benefits in future periods. The effects of the amendments were presented in the preceding tables under
the captions “plan amendments” and “curtailment gain.”
Contractual pension termination benefits were associated with workforce reductions of members covered by
one of our retirement pension benefit plans. The workforce reductions were related to the consolidation of
manufacturing operations that were initially accrued for in 2004. The expense was recognized in the Industrial
Controls segment.
As part of our retirement healthcare benefits, we provide a prescription drug benefit that is at least actuarially
equivalent to Medicare Part D. As a result, we are entitled to a federal subsidy that was introduced by the Medicare
Prescription Drug, Improvement and Modernization Act of 2003. The effect of the subsidy reduced our accumu-
lated postretirement benefit obligation by $7,934 at January 1, 2004, which was the date the Act became effective. It
also reduced our net periodic postretirement benefit cost for 2004 by $843, which consisted of $189 for service cost,
$356 for interest cost, and $298 for recognized actuarial gains. In 2006, we paid prescription drug benefits of
$2,336. We did not receive a federal subsidy in 2006, but we currently expect to receive $517 in 2007.
47
WOODWARD
Notes to Consolidated Financial Statements — (Continued)(In thousands of dollars except per share amounts)
45
84256_Financials.indd Sec1:4584256_Financials.indd Sec1:45 12/5/2006 3:08:17 PM12/5/2006 3:08:17 PM

Estimated benefit payments to be made over the next ten years, with retirement healthcare benefit payments
presented net of estimated participant contributions are as follows:
Year Ending September 30, United States Other CountriesRetirement Healthcare
Benefits
RetirementPension Benefits
2007. . . . . . . . . . . . . . . . . . . . . . . . . . . . . . . . $ 502 $ 2,222 $ 3,397
2008. . . . . . . . . . . . . . . . . . . . . . . . . . . . . . . . 535 1,912 3,579
2009. . . . . . . . . . . . . . . . . . . . . . . . . . . . . . . . 592 1,964 3,795
2010. . . . . . . . . . . . . . . . . . . . . . . . . . . . . . . . 647 2,119 3,968
2011. . . . . . . . . . . . . . . . . . . . . . . . . . . . . . . . 753 2,856 4,123
2012 - 2016 . . . . . . . . . . . . . . . . . . . . . . . . . . 5,588 14,740 21,852
We expect contributions by the company for retirement pension benefits will be $0 in the United States and
$2,997 in other countries in 2007. We also expect contributions by the company for retirement healthcare benefits
will be $3,397 in 2007, less amounts received as federal subsidies.
For retirement healthcare benefits, we assumed net healthcare cost trend rates of 10.00% in 2007, decreasing
gradually to 5.00% in 2012, and remaining at 5.00% thereafter. A 1.00% increase in assumed healthcare cost trend
rates would have increased the total of the service and interest cost components by $364 and increased the benefit
obligation at the end of the year by $5,554 in 2006. Likewise, a 1.00% decrease in the assumed rates would have
decreased the total of service and interest cost components by $311 and decreased the benefit obligation by $4,763
in 2006.
Our investment policies and strategies for plan assets focus on maintaining diversified investment portfolios
that provide for growth while minimizing risk to principal. The target allocation ranges for our plan assets in the
United States are 40-60% for United States equity securities, 10-15% for foreign equity securities, and 35-45% for
debt securities. The target allocation ranges for our plan assets in the United Kingdom, which represented about
75% of total foreign plan assets at September 30, 2006, are 47-57% for debt securities, 23-27% for United Kingdom
equity securities, and 23-27% for non-United Kingdom equity securities. The remaining foreign plan assets are in
Japan, and our investment manager uses asset allocations that are customary in that country. The expected long-term
rates of return on plan assets were based on our current asset allocations and the historical long-term performance
for each asset class, as adjusted for existing market conditions.
The actual percentage of the fair value of total plan assets were as follows:
At September 30, 2006 2005 2006 2005United States
OtherCountries
Equity securities . . . . . . . . . . . . . . . . . . . . . . . . . . . . . . . . . . . . . . . . . . 60% 60% 48% 55%
Debt securities . . . . . . . . . . . . . . . . . . . . . . . . . . . . . . . . . . . . . . . . . . . 40% 40% 40% 34%
Insurance contracts . . . . . . . . . . . . . . . . . . . . . . . . . . . . . . . . . . . . . . . . — — 10% 10%
Other . . . . . . . . . . . . . . . . . . . . . . . . . . . . . . . . . . . . . . . . . . . . . . . . . . — — 2% 1%
100% 100% 100% 100%
Note 14. Stock options:
We have granted stock options to key management members and directors of the company. These options are
generally granted with an exercise price equal to the market price of our stock at the date of grant, a four year graded
48
WOODWARD
Notes to Consolidated Financial Statements — (Continued)(In thousands of dollars except per share amounts)
46
84256_Financials.indd Sec1:4684256_Financials.indd Sec1:46 12/5/2006 3:08:17 PM12/5/2006 3:08:17 PM
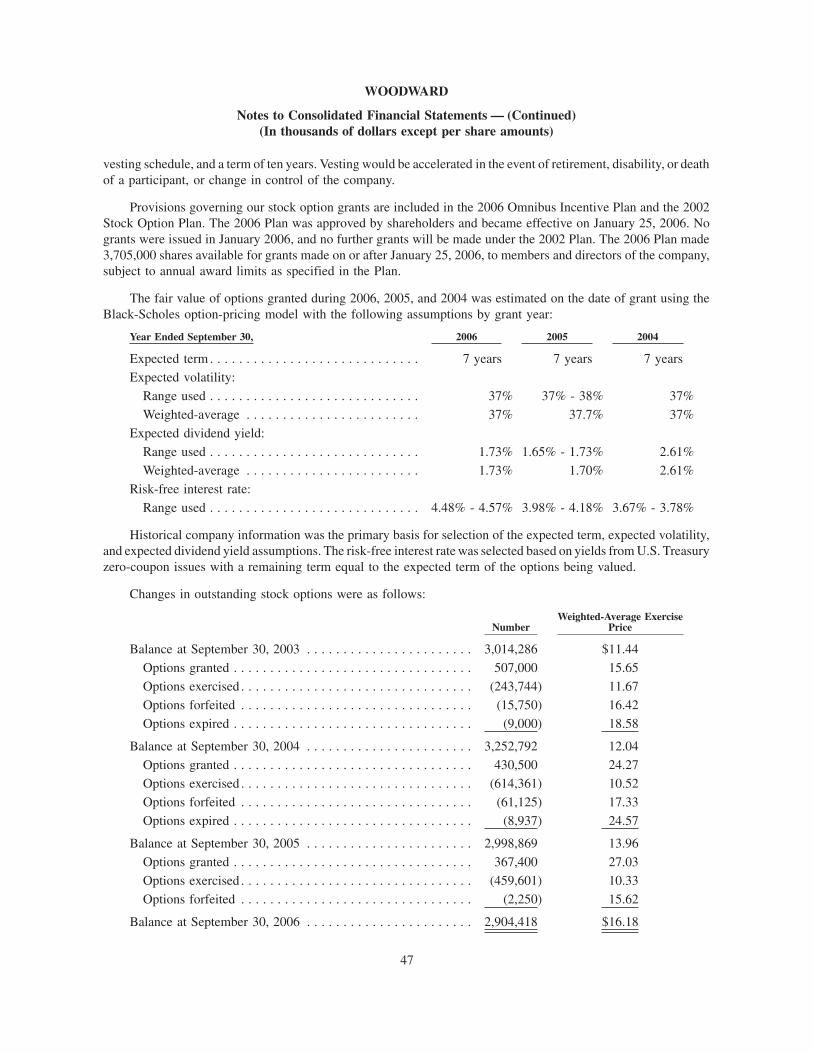
vesting schedule, and a term of ten years. Vesting would be accelerated in the event of retirement, disability, or death
of a participant, or change in control of the company.
Provisions governing our stock option grants are included in the 2006 Omnibus Incentive Plan and the 2002
Stock Option Plan. The 2006 Plan was approved by shareholders and became effective on January 25, 2006. No
grants were issued in January 2006, and no further grants will be made under the 2002 Plan. The 2006 Plan made
3,705,000 shares available for grants made on or after January 25, 2006, to members and directors of the company,
subject to annual award limits as specified in the Plan.
The fair value of options granted during 2006, 2005, and 2004 was estimated on the date of grant using the
Black-Scholes option-pricing model with the following assumptions by grant year:
Year Ended September 30, 2006 2005 2004
Expected term . . . . . . . . . . . . . . . . . . . . . . . . . . . . . 7 years 7 years 7 years
Expected volatility:
Range used . . . . . . . . . . . . . . . . . . . . . . . . . . . . . 37% 37% - 38% 37%
Weighted-average . . . . . . . . . . . . . . . . . . . . . . . . 37% 37.7% 37%
Expected dividend yield:
Range used . . . . . . . . . . . . . . . . . . . . . . . . . . . . . 1.73% 1.65% - 1.73% 2.61%
Weighted-average . . . . . . . . . . . . . . . . . . . . . . . . 1.73% 1.70% 2.61%
Risk-free interest rate:
Range used . . . . . . . . . . . . . . . . . . . . . . . . . . . . . 4.48% - 4.57% 3.98% - 4.18% 3.67% - 3.78%
Historical company information was the primary basis for selection of the expected term, expected volatility,
and expected dividend yield assumptions. The risk-free interest rate was selected based on yields from U.S. Treasury
zero-coupon issues with a remaining term equal to the expected term of the options being valued.
Changes in outstanding stock options were as follows:
NumberWeighted-Average Exercise
Price
Balance at September 30, 2003 . . . . . . . . . . . . . . . . . . . . . . . 3,014,286 $11.44
Options granted . . . . . . . . . . . . . . . . . . . . . . . . . . . . . . . . . 507,000 15.65
Options exercised . . . . . . . . . . . . . . . . . . . . . . . . . . . . . . . . (243,744) 11.67
Options forfeited . . . . . . . . . . . . . . . . . . . . . . . . . . . . . . . . (15,750) 16.42
Options expired . . . . . . . . . . . . . . . . . . . . . . . . . . . . . . . . . (9,000) 18.58
Balance at September 30, 2004 . . . . . . . . . . . . . . . . . . . . . . . 3,252,792 12.04
Options granted . . . . . . . . . . . . . . . . . . . . . . . . . . . . . . . . . 430,500 24.27
Options exercised . . . . . . . . . . . . . . . . . . . . . . . . . . . . . . . . (614,361) 10.52
Options forfeited . . . . . . . . . . . . . . . . . . . . . . . . . . . . . . . . (61,125) 17.33
Options expired . . . . . . . . . . . . . . . . . . . . . . . . . . . . . . . . . (8,937) 24.57
Balance at September 30, 2005 . . . . . . . . . . . . . . . . . . . . . . . 2,998,869 13.96
Options granted . . . . . . . . . . . . . . . . . . . . . . . . . . . . . . . . . 367,400 27.03
Options exercised . . . . . . . . . . . . . . . . . . . . . . . . . . . . . . . . (459,601) 10.33
Options forfeited . . . . . . . . . . . . . . . . . . . . . . . . . . . . . . . . (2,250) 15.62
Balance at September 30, 2006 . . . . . . . . . . . . . . . . . . . . . . . 2,904,418 $16.18
49
WOODWARD
Notes to Consolidated Financial Statements — (Continued)(In thousands of dollars except per share amounts)
47
84256_Financials.indd Sec1:4784256_Financials.indd Sec1:47 12/5/2006 3:08:17 PM12/5/2006 3:08:17 PM

At September 30, 2006, there was $4,706 of unrecognized compensation cost related to nonvested awards,
which we expect to recognize over a weighted-average period of 1.4 years. Information about stock options that are
vested, or are expected to vest, and that are exercisable at September 30, 2006, follows:
Number
Weighted-AverageExercise
Price
Weighted-Average
RemainingLifein
Years
AggregateIntrinsic
Value
Options vested or expected to vest . . . . . . . . . . . . . 2,810,837 $15.94 5.2 $49,469
Options exercisable . . . . . . . . . . . . . . . . . . . . . . . . 1,964,017 13.06 3.8 40,232
The weighted-average grant date fair value of options granted was $10.45 for 2006, $9.40 for 2005, and $5.23
for 2004. Other information follows:
Year Ended September 30, 2006 2005 2004
Total fair value of shares vested. . . . . . . . . . . . . . . . . . . . . . . . . . . . . . $2,668 $2,072 $1,862
Total intrinsic value of options exercised . . . . . . . . . . . . . . . . . . . . . . . 9,056 9,115 2,131
Cash received from exercises of stock options . . . . . . . . . . . . . . . . . . . 4,139 6,468 2,844
Tax benefit realized from exercise of stock options . . . . . . . . . . . . . . . 3,406 3,435 291
Note 15. Accumulated other comprehensive earnings:
Accumulated other comprehensive earnings, which totaled $12,619 at September 30, 2006, and $10,904 at
September 30, 2005, consisted of the following items:
Year Ended September 30, 2006 2005
Accumulated foreign currency translation adjustments:
Beginning balance . . . . . . . . . . . . . . . . . . . . . . . . . . . . . . . . . . . . . . . . . . . . $14,575 $14,239
Translation adjustments . . . . . . . . . . . . . . . . . . . . . . . . . . . . . . . . . . . . . . . . 4,073 (1,391)
Taxes associated with translation adjustments . . . . . . . . . . . . . . . . . . . . . . . . (1,548) 1,727
Ending balance . . . . . . . . . . . . . . . . . . . . . . . . . . . . . . . . . . . . . . . . . . . . . . $17,100 $14,575
Accumulated unrealized derivative losses:
Beginning balance . . . . . . . . . . . . . . . . . . . . . . . . . . . . . . . . . . . . . . . . . . . . $ (661) $ (861)
Reclassification to interest expense . . . . . . . . . . . . . . . . . . . . . . . . . . . . . . . 285 321
Taxes associated with interest reclassification . . . . . . . . . . . . . . . . . . . . . . . . (108) (121)
Ending balance . . . . . . . . . . . . . . . . . . . . . . . . . . . . . . . . . . . . . . . . . . . . . . $ (484) $ (661)
Accumulated minimum pension liability adjustments:
Beginning balance . . . . . . . . . . . . . . . . . . . . . . . . . . . . . . . . . . . . . . . . . . . . $ (3,010) $ (1,340)
Minimum pension liability adjustment . . . . . . . . . . . . . . . . . . . . . . . . . . . . . (1,585) (2,666)
Taxes associated with minimum pension liability adjustments . . . . . . . . . . . . 598 996
Ending balance . . . . . . . . . . . . . . . . . . . . . . . . . . . . . . . . . . . . . . . . . . . . . . $ (3,997) $ (3,010)
50
WOODWARD
Notes to Consolidated Financial Statements — (Continued)(In thousands of dollars except per share amounts)
48
84256_Financials.indd Sec1:4884256_Financials.indd Sec1:48 12/5/2006 3:08:17 PM12/5/2006 3:08:17 PM
Note 16. Leases:
We have entered into operating leases for certain facilities and equipment with terms in excess of one year.
Future minimum rental payments required under these leases are approximately $3,700 in 2007, $2,500 in 2008,
$2,000 in 2009, $1,700 in 2010, $900 in 2011, and $2,000 thereafter. Rent expense for all operating leases totaled
$4,610 in 2006, $4,557 in 2005, and $4,239 in 2004.
Note 17. Contingencies:
We are currently involved in pending or threatened litigation or other legal proceedings regarding employ-
ment, product liability, and contractual matters arising from the normal course of business. We accrued for
individual matters that we believe are likely to result in a loss when ultimately resolved using estimates of the most
likely amount of loss, including accruals totaling $8,500 that were made in 2006. There are also individual matters
that we believe the likelihood of a loss when ultimately resolved is less than likely but more than remote, which
were not accrued. While it is possible that there could be additional losses that have not been accrued, we currently
believe the possible additional loss in the event of an unfavorable resolution of each matter is less than $10,000 in
the aggregate.
Among the legal proceedings referred to in the preceding paragraph, we were a defendant in a class action
lawsuit filed in the U.S. District Court for Northern District of Illinois and received findings of the U.S. Equal
Employment Opportunity Commission that alleged discrimination on the basis of race, national origin, and gender
in our Winnebago County, Illinois, facilities. On October 5, 2006, a U.S. District Court Judge gave preliminary
approval to a proposed $5,000 settlement of the class action and EEOC matters. Accruals for the amount of the
settlement and related legal expenses are included in our consolidated balance sheet at September 30, 2006.
We file income tax returns in various jurisdictions worldwide, which are subject to audit. We have accrued for
our estimate of the most likely amount of expense that we believe may result from income tax audit adjustments.
We do not recognize contingencies that might result in a gain until such contingencies are resolved and the
related amounts are realized.
In the event of a change in control of the company, we may be required to pay termination benefits to certain
executive officers.
Note 18. Financial instruments:
The estimated fair values of our financial instruments were as follows:
At September 30, 2006 2005
Cash and cash equivalents. . . . . . . . . . . . . . . . . . . . . . . . . . . . . . . . . . . . . . . $ 83,718 $ 84,597
Short-term borrowings . . . . . . . . . . . . . . . . . . . . . . . . . . . . . . . . . . . . . . . . . (517) (8,419)
Long-term debt, including current portion . . . . . . . . . . . . . . . . . . . . . . . . . . . (74,617) (89,433)
The fair values of cash and cash equivalents and short-term borrowings at variable interest rates were assumed
to be equal to their carrying amounts. Cash and cash equivalents have short-term maturities and short-term
borrowings have short-term maturities and market interest rates. The fair value of long-term debt at fixed interest
rates was estimated based on a model that discounted future principal and interest payments at interest rates
available to the company at the end of the year for similar debt of the same maturity. The weighted-average interest
rates used to estimate the fair value of long-term debt at fixed interest rates were 5.38% at September 30, 2006, and
4.90% at September 30, 2005.
We hold cash and cash equivalents at financial institutions in excess of amounts covered by federal depository
insurance.
51
WOODWARD
Notes to Consolidated Financial Statements — (Continued)(In thousands of dollars except per share amounts)
49
84256_Financials.indd Sec1:4984256_Financials.indd Sec1:49 12/5/2006 3:08:17 PM12/5/2006 3:08:17 PM
Note 19. Segment information:
Our operations are organized based on the market application of our products and related services and consist
of two operating segments — Industrial Controls and Aircraft Engine Systems. Industrial Controls is focused on
systems and components that provide energy control and optimization solutions for industrial markets, which
includes power generation, transportation, and process industries. Aircraft Engine Systems is focused on systems
and components that provide energy control and optimization solutions for the aerospace market.
The accounting policies of the segments are the same as those described in Note 1. Intersegment sales and
transfers are made at established intersegment selling prices generally intended to approximate selling prices to
unrelated parties. Our determination of segment earnings does not reflect allocations of certain corporate expenses,
which we designate as nonsegment expenses, and is before curtailment gain, interest expense, interest income, and
income taxes.
Segment assets consist of accounts receivable, inventories, property, plant, and equipment — net, goodwill,
and other intangibles — net. Summarized financial information for our segments follows:
At or for the Year Ended September 30, 2006 2005 2004
Industrial Controls:External net sales . . . . . . . . . . . . . . . . . . . . . . . . . . . . . . . . . $540,975 $536,937 $439,801
Intersegment sales . . . . . . . . . . . . . . . . . . . . . . . . . . . . . . . . 1,849 1,118 849
Segment earnings . . . . . . . . . . . . . . . . . . . . . . . . . . . . . . . . . 55,704 28,821 6,437
Segment assets . . . . . . . . . . . . . . . . . . . . . . . . . . . . . . . . . . . 360,577 370,220 364,584
Depreciation and amortization . . . . . . . . . . . . . . . . . . . . . . . . 18,054 20,566 21,341
Capital expenditures . . . . . . . . . . . . . . . . . . . . . . . . . . . . . . . 13,659 13,844 13,564
Aircraft Engine Systems:External net sales . . . . . . . . . . . . . . . . . . . . . . . . . . . . . . . . . $313,540 $290,789 $270,004
Intersegment sales . . . . . . . . . . . . . . . . . . . . . . . . . . . . . . . . 4,871 4,385 2,193
Segment earnings . . . . . . . . . . . . . . . . . . . . . . . . . . . . . . . . . 63,859 64,052 59,192
Segment assets . . . . . . . . . . . . . . . . . . . . . . . . . . . . . . . . . . . 229,269 208,140 205,580
Depreciation and amortization . . . . . . . . . . . . . . . . . . . . . . . . 9,729 9,736 10,276
Capital expenditures . . . . . . . . . . . . . . . . . . . . . . . . . . . . . . . 15,056 11,205 4,281
The differences between the total of segment amounts and the consolidated financial statements were as
follows:
Year Ended September 30, 2006 2005 2004
Total segment net sales and intersegment sales . . . . . . . . . . . . . $861,235 $833,229 $712,847
Elimination of intersegment sales . . . . . . . . . . . . . . . . . . . . . . . (6,720) (5,503) (3,042)
Consolidated net sales . . . . . . . . . . . . . . . . . . . . . . . . . . . . . . . $854,515 $827,726 $709,805
Total segment earnings . . . . . . . . . . . . . . . . . . . . . . . . . . . . . . . $119,563 $ 92,873 $ 65,629
Nonsegment expenses. . . . . . . . . . . . . . . . . . . . . . . . . . . . . . . . (32,727) (17,935) (12,100)
Curtailment gain . . . . . . . . . . . . . . . . . . . . . . . . . . . . . . . . . . . — 7,825 —
Interest expense and income, net. . . . . . . . . . . . . . . . . . . . . . . . (2,339) (3,655) (4,237)
Consolidated earnings before income taxes . . . . . . . . . . . . . . . . $ 84,497 $ 79,108 $ 49,292
52
WOODWARD
Notes to Consolidated Financial Statements — (Continued)(In thousands of dollars except per share amounts)
50
84256_Financials.indd Sec1:5084256_Financials.indd Sec1:50 12/5/2006 3:08:17 PM12/5/2006 3:08:17 PM
At September 30, 2006 2005 2004
Total segment assets . . . . . . . . . . . . . . . . . . . . . . . . . . . . . . . . . $589,846 $578,360 $570,164
Unallocated corporate property, plant, and equipment — net . . . 4,577 2,765 2,384
Other unallocated assets . . . . . . . . . . . . . . . . . . . . . . . . . . . . . . 141,074 124,341 81,746
Consolidated total assets . . . . . . . . . . . . . . . . . . . . . . . . . . . . . . $735,497 $705,466 $654,294
Differences between total depreciation and amortization and capital expenditures of our segments and the
corresponding consolidated amounts reported in the consolidated statements of cash flows are due to unallocated
corporate amounts.
Two customers individually accounted for more than 10% of consolidated net sales in each of the years 2004
through 2006. Sales to the first customer were made by both of our segments and totaled approximately $186,000 in
2006, $189,000 in 2005, and $156,000 in 2004. Sales to the second customer were made by Industrial Controls and
totaled approximately $98,000 in 2006, $105,000 in 2005, and $83,000 in 2004.
External net sales by geographical area, as determined by the location of the customer invoiced, were as
follows:
Year Ended September 30, 2006 2005 2004
United States . . . . . . . . . . . . . . . . . . . . . . . . . . . . . . . . . . . . . . $449,617 $446,318 $413,901
Other countries . . . . . . . . . . . . . . . . . . . . . . . . . . . . . . . . . . . . 404,898 381,408 295,904
$854,515 $827,726 $709,805
Property, plant, and equipment — net by geographical area, as determined by the physical location of the
assets, were as follows:
At September 30, 2006 2005
United States. . . . . . . . . . . . . . . . . . . . . . . . . . . . . . . . . . . . . . . . . . . . . . . . $ 93,340 $ 85,595
Other countries . . . . . . . . . . . . . . . . . . . . . . . . . . . . . . . . . . . . . . . . . . . . . . 30,836 29,192
$124,176 $114,787
Note 20. Subsequent event:
On October 31, 2006, we acquired 100 percent of the stock of SEG Schaltanlagen-Elektronik-Gerate GmbH &
Co. KG (SEG) and a related receivable from SEG that was held by one of the sellers. Headquartered in Kempen,
Germany, SEG is focused on the design and manufacture of a wide range of protection and comprehensive control
systems for power generation and distribution applications, power inverters for wind turbines, and complete
electrical systems for gas and diesel engine based power stations. The cost of this acquisition has not yet been
finalized, but is currently expected to be approximately $45 million, including the amount of outstanding
borrowings assumed. The actual cost of the acquisition may be higher or lower than our current estimate based
on the outcome of a purchase price adjustment procedure customary to purchase agreements and the final
determination of the direct acquisition costs. SEG had sales of approximately $60 million in the year ended
December 31, 2005.
53
WOODWARD
Notes to Consolidated Financial Statements — (Continued)(In thousands of dollars except per share amounts)
51
84256_Financials.indd Sec1:5184256_Financials.indd Sec1:51 12/5/2006 3:08:18 PM12/5/2006 3:08:18 PM

Note 21. Unaudited quarterly financial information:
First Second Third Fourth2006 Fiscal Quarters
Net sales. . . . . . . . . . . . . . . . . . . . . . . . . . . . . . . . $195,634 $208,917 $217,053 $232,911
Gross profit . . . . . . . . . . . . . . . . . . . . . . . . . . . . . 53,695 56,890 62,964 68,703
Earnings before income taxes . . . . . . . . . . . . . . . . 19,119 17,177 21,579 26,622
Net earnings . . . . . . . . . . . . . . . . . . . . . . . . . . . . . 12,427 11,466 28,918 17,089
Net earnings per share:
Basic . . . . . . . . . . . . . . . . . . . . . . . . . . . . . . . . 0.36 0.33 0.84 0.50
Diluted . . . . . . . . . . . . . . . . . . . . . . . . . . . . . . . 0.35 0.32 0.82 0.49
Cash dividends per share . . . . . . . . . . . . . . . . . . . . 0.10 0.10 0.10 0.10
Common share price per share:
High . . . . . . . . . . . . . . . . . . . . . . . . . . . . . . . . . 29.30 33.95 38.88 34.07
Low . . . . . . . . . . . . . . . . . . . . . . . . . . . . . . . . . 25.10 28.34 27.53 27.45
Close . . . . . . . . . . . . . . . . . . . . . . . . . . . . . . . . 28.67 33.25 30.51 33.54
First Second Third Fourth2005 Fiscal Quarters
Net sales. . . . . . . . . . . . . . . . . . . . . . . . . . . . . . . . $189,325 $210,619 $210,252 $217,530
Gross profit . . . . . . . . . . . . . . . . . . . . . . . . . . . . . 46,052 53,099 51,385 53,510
Earnings before income taxes . . . . . . . . . . . . . . . . 19,040 20,290 25,488 14,290
Net earnings . . . . . . . . . . . . . . . . . . . . . . . . . . . . . 11,995 12,979 19,746 11,251
Net earnings per share:
Basic . . . . . . . . . . . . . . . . . . . . . . . . . . . . . . . . 0.35 0.38 0.58 0.33
Diluted . . . . . . . . . . . . . . . . . . . . . . . . . . . . . . . 0.34 0.37 0.56 0.32
Cash dividends per share . . . . . . . . . . . . . . . . . . . . 0.08 0.0833 0.0833 0.10
Common share price per share:
High . . . . . . . . . . . . . . . . . . . . . . . . . . . . . . . . . 24.65 24.99 29.23 30.00
Low . . . . . . . . . . . . . . . . . . . . . . . . . . . . . . . . . 19.50 22.01 20.08 25.26
Close . . . . . . . . . . . . . . . . . . . . . . . . . . . . . . . . 23.87 23.90 28.01 28.35
Notes:
1. Gross profit represents net sales less cost of goods sold.
2. Per share amounts have been updated from amounts reported prior to February 1, 2006, to reflect the effects of athree-for-one stock split.
3. Net earnings included a deferred tax asset valuation allowance change that increased net earnings by $13,710 inthe third quarter of 2006.
4. Earnings before income taxes included a curtailment gain associated with an amendment to a retiree healthcarebenefit plan of $7,825 in the third fiscal quarter of 2005.
5. Accounting for stock-based compensation changed to the fair value method from the intrinsic value methodbeginning in the first quarter of 2006. The following presents a reconciliation of reported net earnings and pershare information to pro forma net earnings and per share information that would have been reported if the fairvalue method had been used to account for stock-based employee compensation last year:
54
WOODWARD
Notes to Consolidated Financial Statements — (Continued)(In thousands of dollars except per share amounts)
52
84256_Financials.indd Sec1:5284256_Financials.indd Sec1:52 12/5/2006 3:08:18 PM12/5/2006 3:08:18 PM

First Second Third Fourth2005 Fiscal Quarters
Reported net earnings . . . . . . . . . . . . . . . . . . . . . . . . . . $11,995 $12,979 $19,746 $11,251
Stock-based compensation expense using the fair valuemethod, net of income tax. . . . . . . . . . . . . . . . . . . . . (344) (359) (377) (462)
Pro forma net earnings . . . . . . . . . . . . . . . . . . . . . . . . . $11,651 $12,620 $19,369 $10,789
Reported net earnings per share amounts:
Basic . . . . . . . . . . . . . . . . . . . . . . . . . . . . . . . . . . . . $ 0.35 $ 0.38 $ 0.58 $ 0.33
Diluted . . . . . . . . . . . . . . . . . . . . . . . . . . . . . . . . . . . 0.34 0.37 0.56 0.32
Pro forma net earnings per share amounts:
Basic . . . . . . . . . . . . . . . . . . . . . . . . . . . . . . . . . . . . $ 0.34 $ 0.37 $ 0.57 $ 0.31
Diluted . . . . . . . . . . . . . . . . . . . . . . . . . . . . . . . . . . . 0.33 0.36 0.55 0.31
55
WOODWARD
Notes to Consolidated Financial Statements — (Continued)(In thousands of dollars except per share amounts)
53
84256_Financials.indd Sec1:5384256_Financials.indd Sec1:53 12/5/2006 3:08:18 PM12/5/2006 3:08:18 PM

REPORT OF INDEPENDENT REGISTERED PUBLIC ACCOUNTING FIRM
To the Board of Directors and Shareholders
of Woodward Governor Company:
We have completed integrated audits of Woodward Governor Company’s 2006 and 2005 consolidated
financial statements and of its internal control over financial reporting as of September 30, 2006, and an audit
of its 2004 consolidated financial statements in accordance with the standards of the Public Company Accounting
Oversight Board (United States). Our opinions, based on our audits, are presented below.
Consolidated financial statements and financial statement schedule
In our opinion, the consolidated financial statements listed in the index appearing under Item 15(a)(1) present
fairly, in all material respects, the financial position of Woodward Governor Company and its subsidiaries at
September 30, 2006 and September 30, 2005, and the results of their operations and their cash flows for each of the
three years in the period ended September 30, 2006 in conformity with accounting principles generally accepted in
the United States of America. In addition, in our opinion, the financial statement schedule listed in the index
appearing under Item 15(a)(2) presents fairly, in all material respects, the information set forth therein when read in
conjunction with the related consolidated financial statements. These financial statements and financial statement
schedule are the responsibility of the Company’s management. Our responsibility is to express an opinion on these
financial statements and financial statement schedule based on our audits. We conducted our audits of these
statements in accordance with the standards of the Public Company Accounting Oversight Board (United States).
Those standards require that we plan and perform the audit to obtain reasonable assurance about whether the
financial statements are free of material misstatement. An audit of financial statements includes examining, on a test
basis, evidence supporting the amounts and disclosures in the financial statements, assessing the accounting
principles used and significant estimates made by management, and evaluating the overall financial statement
presentation. We believe that our audits provide a reasonable basis for our opinion.
As discussed in Note 1 to the consolidated financial statements, effective October 1, 2005, the Company
changed its method of accounting for share-based payments.
Internal control over financial reporting
Also, in our opinion, management’s assessment, included in Management’s Annual Report on Internal Control
Over Financial Reporting appearing under Item 9A, that the Company maintained effective internal control over
financial reporting as of September 30, 2006 based on criteria established in Internal Control — IntegratedFramework issued by the Committee of Sponsoring Organizations of the Treadway Commission (COSO), is fairly
stated, in all material respects, based on those criteria. Furthermore, in our opinion, the Company maintained, in all
material respects, effective internal control over financial reporting as of September 30, 2006, based on criteria
established in Internal Control — Integrated Framework issued by the COSO. The Company’s management is
responsible for maintaining effective internal control over financial reporting and for its assessment of the
effectiveness of internal control over financial reporting. Our responsibility is to express opinions on management’s
assessment and on the effectiveness of the Company’s internal control over financial reporting based on our audit.
We conducted our audit of internal control over financial reporting in accordance with the standards of the Public
Company Accounting Oversight Board (United States). Those standards require that we plan and perform the audit
to obtain reasonable assurance about whether effective internal control over financial reporting was maintained in
all material respects. An audit of internal control over financial reporting includes obtaining an understanding of
internal control over financial reporting, evaluating management’s assessment, testing and evaluating the design
and operating effectiveness of internal control, and performing such other procedures as we consider necessary in
the circumstances. We believe that our audit provides a reasonable basis for our opinions.
A company’s internal control over financial reporting is a process designed to provide reasonable assurance
regarding the reliability of financial reporting and the preparation of financial statements for external purposes in
accordance with generally accepted accounting principles. A company’s internal control over financial reporting
includes those policies and procedures that (i) pertain to the maintenance of records that, in reasonable detail,
5654
84256_Financials.indd Sec1:5484256_Financials.indd Sec1:54 12/5/2006 3:08:18 PM12/5/2006 3:08:18 PM
accurately and fairly reflect the transactions and dispositions of the assets of the company; (ii) provide reasonable
assurance that transactions are recorded as necessary to permit preparation of financial statements in accordance
with generally accepted accounting principles, and that receipts and expenditures of the company are being made
only in accordance with authorizations of management and directors of the company; and (iii) provide reasonable
assurance regarding prevention or timely detection of unauthorized acquisition, use, or disposition of the company’s
assets that could have a material effect on the financial statements.
Because of its inherent limitations, internal control over financial reporting may not prevent or detect
misstatements. Also, projections of any evaluation of effectiveness to future periods are subject to the risk that
controls may become inadequate because of changes in conditions, or that the degree of compliance with the
policies or procedures may deteriorate.
/s/ PricewaterhouseCoopers LLP
PricewaterhouseCoopers LLP
Chicago, Illinois
November 29, 2006
5755
84256_Financials.indd Sec1:5584256_Financials.indd Sec1:55 12/5/2006 3:08:18 PM12/5/2006 3:08:18 PM
Item 9. Changes in and Disagreements with Accountants on Accounting and Financial Disclosure
PricewaterhouseCoopers LLP was engaged as the principal registered public accounting firm to perform an
integrated audit of our consolidated financial statements and internal control over financial reporting during our two
most recent fiscal years, and no other accountant was engaged during this period on whom they expressed reliance
in their report.
Item 9A. Controls and Procedures
Evaluation of Disclosure Controls and Procedures
We have established disclosure controls and procedures, as defined in Rule 13a-15(e) under the Securities
Exchange Act of 1934 (the “Exchange Act”), which are designed to ensure that information required to be disclosed
in reports filed or submitted under the Exchange Act is recorded, processed, summarized, and reported, within the
time periods specified in the Securities and Exchange Commission’s rules and forms. These disclosure controls and
procedures include, without limitation, controls and procedures designed to ensure that information required to be
disclosed in the reports that we file or submit under the Act is accumulated and communicated to management,
including our principal executive officer (Thomas A. Gendron, president and chief executive officer) and principal
financial officer (Robert F. Weber, Jr., chief financial officer and treasurer), as appropriate to allow timely decisions
regarding required disclosures.
Thomas A. Gendron, our president and chief executive officer, and Robert F. Weber, Jr., our chief financial
officer and treasurer, evaluated the effectiveness of our disclosure controls and procedures as of the end of the period
covered by this Form 10-K. Based on their evaluation, they concluded that our disclosure controls and procedures
were effective in achieving the objectives for which they were designed as described in the preceding paragraph.
Management’s Annual Report on Internal Control Over Financial Reporting
We are responsible for establishing and maintaining adequate internal control over financial reporting for the
company. We have evaluated the effectiveness of internal control over financial reporting using the criteria
established in Internal Control — Integrated Framework issued by the Committee of Sponsoring Organizations of
the Treadway Commission (COSO) and, based on that evaluation, have concluded that the company’s internal
control over financial reporting was effective as of September 30, 2006, the end of the company’s most recent fiscal
year.
PricewaterhouseCoopers LLP, an independent registered public accounting firm, conducted an integrated
audit of the company’s 2006 consolidated financial statements and of the company’s internal control over financial
reporting as of September 30, 2006, as stated in their report included in “Item 8 — Financial Statements and
Supplementary Data.”
Internal control over financial reporting is a process designed by, or under the supervision of, our principal
executive and principal financial officers, or persons performing similar functions, and effected by our board of
directors, management, and other personnel, to provide reasonable assurance regarding the reliability of our
financial reporting and the preparation of our financial statements for external purposes in accordance with
generally accepted accounting principles. Internal control over financial reporting includes those policies and
procedures that:
• Pertain to the maintenance of records that, in reasonable detail, accurately and fairly reflect the transactions
and dispositions of the assets of the company;
• Provide reasonable assurance that transactions are recorded as necessary to permit preparation of financial
statements in accordance with generally accepted accounting principles, and that receipts and expenditures
of the company are being made only in accordance with authorization of management and directors of the
company; and
• Provide reasonable assurance regarding prevention or timely detection of unauthorized acquisition, use or
disposition of the company’s assets that could have a material effect on the financial statements.
5856
84256_Financials.indd Sec1:5684256_Financials.indd Sec1:56 12/5/2006 3:08:18 PM12/5/2006 3:08:18 PM

Changes in Internal Control Over Financial Reporting
There has been no change in our internal control over financial reporting during the fourth fiscal quarter
covered by this Form 10-K that has materially affected, or is reasonably likely to materially affect, our internal
control over financial reporting.
Item 9B. Other Information
There is no information required to be disclosed in a report on Form 8-K during the fourth quarter of 2006 that
was not reported on Form 8-K.
PART III
Item 10. Directors and Executive Officers of the Registrant
Executive Officers:
Thomas A. Gendron, age 45 — president and chief executive officer since July 2005; president and chief
operating officer September 2002 through June 2005; vice president and general manager of Industrial Controls
June 2001 through September 2002; vice president of Industrial Controls April 2000 through May 2001; director of
global marketing and Industrial Controls’ business development February 1999 through March 2000.
Robert F. Weber, Jr., age 52 — chief financial officer and treasurer since August 2005. Prior to August 2005,
Mr. Weber was employed at Motorola, Inc. for 17 years, where he held various positions, including corporate vice
president and general manager — EMEA Auto, corporate vice president and director — strategy, corporate vice
president and finance director — IESS, and other financial roles from business controller up through a sector
finance director. Mr. Weber also held the position in the corporate finance department at Motorola as the senior
manager responsible for all financial reporting at the corporate level — annual report, SEC filings, internal
reporting, and special filings. In addition, Mr. Weber served as the senior manager responsible for corporate internal
audit at Motorola with global audit responsibility.
Carol J. Manning, age 57 — secretary since June 1991.
All executive officers were elected to their current positions to serve until the January 24, 2007, Board of
Directors meeting, or until their successors have been elected. The Board of Directors elected the executive officers
to their current positions on January 25, 2006.
We have adopted a code of ethics for senior financial officers and other finance members that applies to
Thomas A. Gendron, our principal executive officer, and Robert F. Weber, Jr., our principal financial and accounting
officer. This code of ethics, which is listed in Exhibit 14 in “Item 15 — Exhibits and Financial Statement
Schedules,” is incorporated here by reference.
Other information regarding our directors and executive officers is under the captions “Board of Directors,”
“Board Meetings and Committees — Audit Committee” (including information with respect to audit committee
financial experts), “Share Ownership of Management,” and “Section 16(a) Beneficial Ownership Reporting
Compliance” in our proxy statement for the 2006 annual meeting of shareholders to be held January 24, 2007,
incorporated here by reference.
Item 11. Executive Compensation
Information regarding executive compensation is under the captions “Board Meetings and Committees —
Director Compensation,” “Executive Compensation,” “Stock Options,” and “Long-Term Management Incentive
Compensation Plan Awards” in our proxy statement for the 2006 annual meeting of shareholders to be held
January 24, 2007, incorporated here by reference.
5957
84256_Financials.indd Sec1:5784256_Financials.indd Sec1:57 12/5/2006 3:08:19 PM12/5/2006 3:08:19 PM

Item 12. Security Ownership of Certain Beneficial Owners and Management and Related StockholderMatters
Information regarding security ownership of certain beneficial owners and management and related stock-
holder matters is under the tables captioned “Share Ownership of Management,” “Persons Owning More than Five
Percent of Woodward Stock,” and “Stock Options — Equity Compensation Plan Information (as of September 30,
2006),” in our proxy statement for the 2006 annual meeting of shareholders to be held January 24, 2007,
incorporated here by reference.
Item 13. Certain Relationships and Related Transactions
There are no relationships, transactions, or other information to be reported under this item.
Item 14. Principal Accounting Fees and Services
Information regarding principal accounting fees and services is under the captions “Audit Committee Report to
Shareholders — Audit Committee’s Policy on Pre-Approval of Services Provided by Independent Registered
Public Accounting Firm and Fees Paid by PricewaterhouseCoopers LLP” in our proxy statement for the 2006
annual meeting of shareholders to be held January 24, 2007, incorporated herein by reference.
PART IV
Item 15. Exhibits and Financial Statement Schedules
(a)(1) Consolidated Financial Statements:
Page Numberin Form 10-K
Consolidated Statements of Earnings for the years ended September 30,2006, 2005, and 2004 . . . . . . . . . . . . . . . . . . . . . . . . . . . . . . . . . . . . . . . . 31
Consolidated Balance Sheets at September 30, 2006 and 2005. . . . . . . . . . . . 32
Consolidated Statements of Cash Flows for the years ended September 30,2006, 2005, and 2004 . . . . . . . . . . . . . . . . . . . . . . . . . . . . . . . . . . . . . . . . 33
Consolidated Statements of Shareholders’ Equity for the years endedSeptember 30, 2006, 2005, and 2004. . . . . . . . . . . . . . . . . . . . . . . . . . . . . 34
Notes to Consolidated Financial Statements . . . . . . . . . . . . . . . . . . . . . . . . . 36
Report of Independent Registered Public Accounting Firm . . . . . . . . . . . . . . 56
(a)(2) Consolidated Financial Statement Schedules
Valuation and Qualifying Accounts . . . . . . . . . . . . . . . . . . . . . . . . . . . . . . . 63
Financial statements and schedules other than those listed above are omitted for the reason that they are not
applicable, are not required, or the information is included in the financial statements or the footnotes.
(a)(3) Exhibits Filed as Part of This Report
3(i) Restated Certificate of Incorporation filed as Exhibit 3(i) to Form 10-Q for the three months ended June 30,2006, incorporated here by reference.
3(ii) Bylaws, filed as an exhibit.
4.1 Note Purchase Agreement dated October 15, 2001, filed as Exhibit 4 to Form 10-Q for the three monthsended December 31, 2001, incorporated here by reference.
4.2 Credit Agreement dated March 11, 2005, filed as Exhibit 4 to Form 10-Q for the three months endedMarch 31, 2005, incorporated here by reference.
10.1 Long-Term Management Incentive Compensation Plan, filed as Exhibit 10(c) to Form 10-K for the yearended September 30, 2000, incorporated here by reference.
6058
29
30
31
32
34
54
61
84256_Financials.indd Sec1:5884256_Financials.indd Sec1:58 12/5/2006 3:08:19 PM12/5/2006 3:08:19 PM
10.2 Annual Management Incentive Compensation Plan, filed as Exhibit 10(d) to Form 10-K for the year endedSeptember 30, 2000, incorporated here by reference.
10.3 2002 Stock Option Plan, effective January 1, 2002 filed as Exhibit 10 (iii) to Form 10-Q for the three monthsended March 31, 2002, incorporated here by reference.
10.4 Executive Benefit Plan (non-qualified deferred compensation plan), filed as Exhibit 10(e) to Form 10-K forthe year ended September 30, 2002, incorporated here by reference.
10.5 Form of Outside Director Stock Purchase Agreement with James L. Rulseh, filed as Exhibit 10(j) toForm 10-K for the year ended September 30, 2002, incorporated here by reference.
10.6 Form of Transitional Compensation Agreement with Thomas A. Gendron filed as Exhibit 10 to Form 10-Qfor the three months ended December 31, 2002, incorporated here by reference.
10.7 Summary of non-employee director meeting fees and compensation, filed as Exhibit 99.1 to Form 8-K filedNovember 3, 2006, incorporated here by reference.
10.8 Material Definitive Agreement with Thomas A. Gendron, filed on Form 8-K filed August 1, 2005,incorporated here by reference.
10.9 Material Definitive Agreement with Robert F. Weber, Jr., filed on Form 8-K filed August 24, 2005,incorporated here by reference.
10.10 2006 Omnibus Incentive Plan, effective January 25, 2006, filed as Exhibit 4.1 to Registration Statement onForm S-8 effective April 28, 2006, incorporated here by reference.
10.11 Form of Transitional Compensation Agreement with Robert F. Weber, Jr., dated August 22, 2005, filed asan exhibit.
11 Statement on computation of earnings per share, included in Note 4 of Notes to Consolidated FinancialStatements.
14 Code of Ethics filed as Exhibit 14 to Form 10-K for the year ended September 30, 2003, incorporated hereby reference.
21 Subsidiaries, filed as an exhibit.
23 Consent of Independent Registered Public Accounting Firm, filed as an exhibit.
31(i) Rule 13a-14(a)/15d-14(a) certification of Thomas A. Gendron, filed as an exhibit.
31(ii) Rule 13a-14(a)/15d-14(a) certification of Robert F. Weber, Jr., filed as an exhibit.
32(i) Section 1350 certifications, filed as an exhibit.
6159
84256_Financials.indd Sec1:5984256_Financials.indd Sec1:59 12/5/2006 3:08:19 PM12/5/2006 3:08:19 PM

SIGNATURES
Pursuant to the requirements of Section 13 or 15(d) of the Securities Exchange Act of 1934, the registrant has
duly caused this report to be signed on its behalf by the undersigned, thereunto duly authorized.
WOODWARD GOVERNOR COMPANY
/s/ THOMAS A. GENDRON
Thomas A. Gendron
President, Chief Executive Officer(Principal Executive Officer)
Date: November 30, 2006
/s/ ROBERT F. WEBER, JR.
Robert F. Weber, Jr.
Chief Financial Officer, Treasurer(Principal Financial and Accounting Officer)
Date: November 30, 2006
Pursuant to the requirements of the Securities Exchange Act of 1934, this report has been signed below by the
following persons on behalf of the registrant and in the capacities and on the dates indicated.
Signature Title Date
/s/ JOHN D. COHN
John D. CohnDirector November 24, 2006
/s/ PAUL DONOVAN
Paul DonovanDirector November 27, 2006
/s/ THOMAS A. GENDRON
Thomas A. GendronDirector November 30, 2006
/s/ JOHN A. HALBROOK
John A. HalbrookChairman of the Board
and DirectorNovember 24, 2006
/s/ MICHAEL H. JOYCE
Michael H. JoyceDirector November 24, 2006
/s/ MARY L. PETROVICH
Mary L. PetrovichDirector November 24, 2006
/s/ LARRY E. RITTENBERG
Larry E. RittenbergDirector November 24, 2006
/s/ JAMES R. RULSEH
James R. RulsehDirector November 22, 2006
/s/ MICHAEL T. YONKER
Michael T. YonkerDirector November 24, 2006
6260
84256_Financials.indd Sec1:6084256_Financials.indd Sec1:60 12/5/2006 3:08:19 PM12/5/2006 3:08:19 PM

WOODWARD GOVERNOR COMPANY AND SUBSIDIARIES
SCHEDULE II — VALUATION AND QUALIFYING ACCOUNTSFor the years ended September 30, 2006, 2005, and 2004
(in thousands of dollars)
Description
Balanceat
Beginningof
Year
Chargedto
Costsand
Expenses
Chargedto
OtherAccounts(a) Deductions(b)
Balanceat
Endof
Year
Additions
ColumnA
ColumnB
Column C
ColumnD
ColumnE
Allowance for doubtful accounts
2006 . . . . . . . . . . . . . . . . . . . . . . . . . . . . . . . . $1,965 $249 $363 $ (364) $2,213
2005 . . . . . . . . . . . . . . . . . . . . . . . . . . . . . . . . $2,836 $ (98) $281 $(1,054) $1,965
2004 . . . . . . . . . . . . . . . . . . . . . . . . . . . . . . . . $2,601 $462 $718 $ 945 $2,836
Notes:
(a) Includes recoveries of accounts previously written off.
(b) Represents accounts written off and foreign currency translation adjustments. Currency translation adjust-
ments resulted in decreases in the reserve of $22 in 2005, and increases in the reserve of $43 in 2006 and $45 in
2004.
6361
84256_Financials.indd Sec1:6184256_Financials.indd Sec1:61 12/5/2006 3:08:19 PM12/5/2006 3:08:19 PM

Officer and Investor Information
DIRECTORS
John A. HalbrookChairman of the Board, Woodward Governor Company
John D. CohnSenior Vice President, Strategic Development and Communications, Rockwell Automation, Inc.
Paul DonovanRetired Executive Vice President and Chief Financial Officer, Wisconsin Energy Corporation
Thomas A. GendronPresident and Chief Executive Officer, Woodward Governor Company
Michael H. JoyceRetired President and Chief Operating Officer, Twin Disc, Incorporated
Mary L. PetrovichChief Executive Officer, AxleTech International
Larry E. RittenbergErnst & Young Professor of Accounting & Information Systems, University of Wisconsin
James R. RulsehGroup Vice President, Modine Manufacturing Company
Michael T. YonkerRetired President and Chief Executive Officer, Portec, Inc.
OFFICERS
Thomas A. GendronPresident and Chief Executive Officer
Robert F. Weber, Jr.Chief Financial Officer and Treasurer
Dennis M. BenningVice President, General Manager Fluid Systems and Controls
Donald J. BergholzVice President, General Manager Turbine Combustion Systems
Martin V. GlassVice President, General Manager Aircraft Engine Systems
Gerhard LaufferVice President, General Manager Electronic Controls
Chad R. PreissVice President, General Manager Industrial Controls
Carol J. ManningCorporate Secretary
INVESTOR INFORMATION
Woodward Governor CompanyCorporate Headquarters 5001 North Second Street P.O. Box 7001 Rockford, IL 61125-7001 1-815-877-7441 www.woodward.com
Transfer Agent and RegistrarAmerican Stock Transfer & Trust Company Shareholder Services 59 Maiden Lane Plaza LevelNew York, NY 100381-800-937-5449
Shareholder Account AssistanceShareholders who wish to change the address or ownership of stock, report lost certificates, eliminate duplicate mailings, or for other account registration procedures and assistance, should contact the Transfer Agent at the address or phone number above.
Dividend Reinvestment Plan and Direct Deposit of DividendsWoodward offers shareholders of record a convenient Dividend Reinvestment and Direct Stock Purchase and Sale Plan. Through this Plan, shareholders have options to purchase or sell shares of Woodward stock, have their dividends automatically reinvested in Woodward common stock and to make periodic supplemental cash payments to purchase additional shares.
For further information and an authorization form, contact the Transfer Agent at the address or phone on this page.
Annual MeetingJanuary 24, 2007, at 10:00 a.m. Fort Collins Marriott 350 East Horsetooth Road Fort Collins, CO 80525
Stock ExchangeNasdaq National Market Ticker Symbol: WGOV SEC filings are available on our website at www.woodward.com.
An Equal Opportunity EmployerIt is Woodward’s policy to provide equal employment opportunity for all qualified members and applicants without regard to race, color, religion, age, sex, national origin, disability, veteran’s or marital status, and to base all employment decisions so as to further this principle of equal employment opportunity.
STRATEGIC FOCUS LEVERAGE INTEGRATE APPLY SERVE
desi
gned
by
curr
an &
con
nors
, inc
. / w
ww
.cur
ran-
conn
ors.
com

Woodward Governor Company5001 North Second Street, P.O. Box 7001
Rockford, Illinois 61125-7001 USA815-877-7441
www.woodward.com


