
See discussions, stats, and author profiles for this publication at: https://www.researchgate.net/publication/46577403
Weight status and iron deficiency among urban Malian women of reproductive
age
Article in The British journal of nutrition · February 2011
DOI: 10.1017/S0007114510003776 · Source: PubMed
CITATIONS
26READS
178
6 authors, including:
Some of the authors of this publication are also working on these related projects:
INSECTAIR Study: Assessing the fractional absorption of iron from edible insects View project
Lifestraw Family Project, Kisumu View project
Nadia Fanou-Fogny
University of Abomey-Calavi
25 PUBLICATIONS 712 CITATIONS
SEE PROFILE
Naomi Saronga
The University of Newcastle, Australia
10 PUBLICATIONS 109 CITATIONS
SEE PROFILE
Yara Koreissi
Wageningen University & Research
9 PUBLICATIONS 131 CITATIONS
SEE PROFILE
Alida Melse
Wageningen University & Research
111 PUBLICATIONS 2,915 CITATIONS
SEE PROFILE
All content following this page was uploaded by Inge D Brouwer on 13 January 2014.
The user has requested enhancement of the downloaded file.

Fonio (Digitaria exilis) as a staple food
in Mali:
an approach to upgrade nutritional value
Nadia M.L. Fanou-Fogny

Thesis committee Thesis supervisor
Prof. dr. ir. F.J. Kok Professor of Nutrition and Health Wageningen University Thesis co-supervisors
Dr. ir. I.D. Brouwer Assistant professor, Division of Human Nutrition Wageningen University Prof. dr. R.A.M. Dossa† Associate professor, Department of Nutrition and Food Sciences University of Abomey Calavi, Benin Other members Prof. dr. ir. M.A.J.S. van Boekel, Wageningen University Prof. dr. ir. C. de Graaf, Wageningen University Prof. dr. P.W. van Kolsteren, University of Ghent, Belgium Institute of Tropical Medicine, Antwerpen, Belgium Prof. dr. E-A. D. Ategbo, UNICEF Niamey, Niger This research was conducted under the auspices of the Graduate School VLAG (Advanced studies in Food Technology, Agrobiotechnology, Nutrition and Health Sciences)

Fonio (Digitaria exilis) as a staple food in Mali:
an approach to upgrade nutritional value
Nadia M.L. Fanou-Fogny
Thesis
submitted in fulfilment of the requirements for the degree of doctor at Wageningen University
by the authority of the Rector Magnificus Prof. dr. M.J. Kropff,
in the presence of the Thesis Committee appointed by the Academic Board
to be defended in public on Friday 22 June 2012 at 1.30 p.m. in the Aula.

Nadia M.L. Fanou-Fogny
Fonio (Digitaria exilis) as a staple food in Mali: an approach to upgrade nutritional value
188 pages
Thesis, Wageningen University, Wageningen, The Netherlands (2012)
With references, with summaries in English, Dutch and French
ISBN 978-94-6173-292-7

To my beloved
husband Guillaume,
young daughter Sika,
and little son Sènami
A mes chers parents Dorothée et Louis
In memory of Romain A.M. Dossa and Lidwien van der Heijden who played key roles from the beginning of this thesis but did not see its end


Abstract Background With the increasing nutritional and health problems related to the global food crisis, the potential contribution of traditional foods to alleviation of poverty, nutritional deficiencies and health issues has been emphasized. Fonio (Digitaria exilis) is the most ancient West African cereal representing a key crop in food supply during crop shortfall periods. Less is known about the potential of fonio to contribute to nutrition and health in West Africa. The value chain approach for nutritional goals is a set of strategies through which values are added to products for improvement of nutrition among vulnerable groups, while creating benefits for stakeholders. Strategies in a value chain approach comprise agricultural strategies, processing, and consumer‐oriented actions to enhance acceptability. Objectives In this thesis we explored value chain strategies as possible solutions to existing nutritional problems among West African women, using fonio as product. To achieve this objective, specific research questions were investigated through the following cross‐sectional studies: i) baseline assessment of nutrition (iron) status, iron intake and adequacy to define the nutritional context for operating the value chain approach; ii) assessment of socio‐cultural acceptability of fonio as strategic entry point for consumer‐oriented activities; iii) investigating processing (dephytinisation and fortification) as strategy for adding nutritional value to fonio. Methods Subjects involved were women of reproductive age randomly selected in Bamako, the capital city of Mali (108 women aged 15‐49 y‐old from 3‐stage cluster sampling procedure), and Cotonou, the largest city of Benin (16 women aged 18‐30 y‐old from simple random sampling for an iron absorption study). Data collection included anthropometric and blood indicators measurement; dietary assessment based on a duplicate 24‐h dietary recall, indirect and rapid assessment techniques; food ethnography focused on fonio, including an availability survey on market, a food consumption survey on the uses of fonio, and an acceptability survey based on a behavioral model; and an iron absorption study using stable isotopes. Results Investigating the nutritional context for operating value chain strategies indicated that overweight/obesity prevalence was 19%, and 25% of women were iron‐deficient based on low serum ferritin concentration. Forty‐six percent and 53% women were at risk of inadequate iron and overall micronutrient intake respectively. Intakes of grains, vegetables and legumes/nuts were significantly associated with iron intake (rho = 0.3; P < 0.05) but not with the probability of adequacy of iron intake. Assessing the socio‐cultural acceptability of fonio as entry point for consumer‐based strategies revealed that average daily frequency

consumption (68% consuming 1 to 3 times/month) and daily portion size of fonio (152 g) was relatively low as compared to other staples like rice and millet. Fonio consumption was strongly predicted by intention to consume (r = 0.78, P < 0.001), which was influenced by positive beliefs and attributes (β = 0.32, P < 0.05). Subjective norms, namely the opinion of the husband, the family and the neighborhood motivated intention to consume fonio (r = 0.26, P < 0.001). Perceived barriers such as time‐consuming processing and lack of skills in cooking fonio had a significant interaction between intention to consume and fonio consumption (β = ‐0.72, P < 0.05). Exploring processing as strategy for adding nutritional value to fonio showed that dephytinisation with intrinsic wheat phytase reduced phytate‐to‐iron molar ratio from 23.7:1 to 2.7:1 and iron fortification decreased the molar ratio to 0.3:1. Dephytinisation with wheat phytase and fortification significantly increased iron absorption from 2.6% to 8.2% in fonio porridges. Conclusions and recommendations Dephytinisation with native wheat phytase and iron fortification appeared relevant for adding nutritional value to fonio. Nonetheless, the achievement in iron absorption might not be sufficient to consider fonio as an appropriate food for improving iron status through iron fortification. However, as staple food contributing to food security, consumer‐oriented activities for enhancing fonio consumption should emphasize positive attitudes and opinions of men, family and neighbors, while strengthening skills of women in cooking good quality fonio meals. For the value chain approach to be relevant, the impact of value‐added fonio products on smallholders’ income should be assessed, as well as the effect of the improved income on the nutritional outcome of vulnerable communities.

Content Chapter 1 General introduction 11
Chapter 2 Weight status and iron deficiency among urban Malian women of reproductive age
Br J Nutr 2011; 105: 574‐579
37
Chapter 3 Food groups associated with a composite measure of probability of adequate intake of 11 micronutrients in the diets of women in urban Mali
J Nutr 2010; 140:2070S‐2078S
51
Chapter 4 Day‐to‐day variation in energy, macronutrients and micronutrients intake from a duplicate 24‐h dietary recall among urban Malian women of reproductive age and implications for usual intake assessment
submitted
75
Chapter 5 Consumption of, and beliefs about fonio (Digitaria exilis) in urban area in Mali
Afr J Agric Nutr Dev (AJFAND) 2009; 9(9): 1927‐1944
89
Chapter 6 Factors predicting consumption of fonio grain (Digitaria exilis) among urban Malian women of reproductive age
J Nutr Educ Behav 2011; 43:219‐228
107
Chapter 7 Effect of dephytinization of fonio with intrinsic wheat phytase on iron absorption in Beninese women
submitted
129
Chapter 8 General discussion 145
Summary – English, Dutch, French 169
Acknowledgements 179
About the author – brief bibliography, publications, educational programme 183


Chapter 1
General Introduction
Chapter 1
Page | 12
BACKGROUND Fonio, a traditional cereal with potential in Sub‐Saharan Africa
For decades, food security in developing communities has been dependent on traditional
food products locally produced and consumed in identifiable geographical areas (1). In sub‐
Saharan Africa, traditional grains encompass white maize (Zea mays), sorghum (Sorghum
bicolor), millets (Pennisetum sp), fonio (Digitaria sp), teff (Eragrostis tef), and also amaranth
seeds (Amaranthus caudatus) (2).
Fonio is the most ancient traditional cereal cultivated across West African dry savannah
regions along the Sudanese zone (3). Particularly white fonio (Digitaria exilis) is primarily
grown in Guinea, Mali, Burkina Faso, Ivory Coast, Nigeria and Benin, in marginal,
mountainous and hilly zones with sandy, poor and degraded soils, without fertilizers and
pesticides (4). In 2009, about 460 685 tons have been produced on 519 846 hectares in
western Africa (5). In Mali, Burkina Faso and Guinea semiarid and subhumid areas, fonio
contributes to 17‐21 % of staple cereals requirement (6)
Due to its large ecological adaptability and the relatively short crop cycle of some varieties,
fonio is believed to have a high potential as key‐crop in agriculture and food supply in its
traditional cultivation zones, particularly when annual harvests fail or during local crop
shortfall periods (2, 3). In West African semi‐arid areas, fonio is the major part of the diet
during harvest periods, and in sub‐humid zones it is stored during the post‐harvest period,
for use as food supply during the food shortage periods (6).
Although accounting for only about 10% of the global aggregate cereal output, the
contribution of fonio and other traditional grains to food requirement is significant in many
developing countries, for they are subsistence‐oriented food staples (2). They may have high
nutritional value, with some potential for combating the 'hidden hunger' caused by
micronutrient deficiencies. Beside their importance to food supplies and health, traditional
grains as fonio can also contribute to improved income among the most food‐insecure
population groups (2).

Introduction
Page | 13
Challenges facing fonio as a traditional food crop in Sub‐Saharan Africa Major constraints reported in fonio cultivation and harvesting are related to the small size of
the grain, showing tiny kernels of 700 µm size (7). This leads to tedious and time‐consuming
post‐harvest and cooking processes (3, 8, 9). As most traditional cereals, fonio is produced in
traditional systems with little or no external inputs (4). Most activities are manually
performed, making post‐harvest activities more laborious and time‐consuming (8).
Meanwhile, urbanization and related changes leading to an increased demand of industrially
produced and sophisticated foods induced a rapid shift of coarse grains to non‐traditional
grains (10, 11). This resulted in a decrease in consumption of traditional foods, particularly in
urban areas. In addition, there has been an increasing inadequacy in research investment
between the need to follow‐up these substantial lifestyles changes occurring in developing
areas and the need to improve the production and processing chains of the traditional grains
(12). This led to a turn of farmers to the cultivation of exportable cash crops (13). Therefore,
the productivity, output and harvested areas of traditional food crops such as fonio
appeared to be reducing over the past years in several West African countries (12, 13).
Subsequently, fonio has been undervalued by decision makers, receiving decreased
attention. Hence there has been a lack of improved agronomic practices, little efforts for
agricultural research, low post‐harvest promotion including losses, inadequate marketing
channels and processing technologies, poor product quality, and no up‐to‐date information
to upgrade the quality of the grain (12, 13). As a consequence, fonio has been classified as
“lost crop of Africa”, “minor” or “neglected” crop without economic potential (3).
Re‐considering the role of fonio in strategies against the global food crisis With the global food crisis, trends in malnutrition, household food security and poverty have
been worse, especially in Sub‐Saharan Africa, and the need for an accelerated reduction of
malnutrition and poverty has been emphasized (14). Evidence of the potential
micronutrient‐value of some underutilized species has been reported along with information
on ways to consider those available biological food resources in strategies to reduce
malnutrition (15, 16). Therefore, national and international research and development
institutions have come to appreciate the roles that traditional grains like fonio can play for
nutrition and food security. Subsequently, many neglected species and varieties have been

Chapter 1
Page | 14
reconsidered to become potential vehicles for improved nutrition, as well as convenient
sources of increased food supply and income (15, 16). Hence, a renewed interest in fonio is
growing, especially in West African urban areas (17).
During the past decade, national agricultural research centers of the main producing West‐
African countries have collected and conserved important germplasm of fonio genetic
resources (18). Moreover, in the perspective of defining appropriate strategies for
conservation of fonio on farm, information has been produced on ethnobotanical and
indigenous knowledge related to fonio production, diversity, use and conservation, genome
content and size of the crop as well as its genetic diversity (18‐20). To improve fonio
processing and cooking techniques, modern and new equipments have been developed at
small companies and women’s groups in West Africa (8). Also, modern small‐scale
processing industries for ready‐to‐cook products have been developed in urban areas and
modern fonio‐based recipes have been experienced (8). However, less effort has been made
to document and improve the potential of fonio to contribute to nutritional and health‐
related issues in West Africa.
Fonio is the most ancient West African traditional cereal, with a large ecological adaptability. As staple grain for the food shortage periods, there is a need to reconsider the potential of fonio to contribute to nutrition and food security among vulnerable
groups of West African communities.
Fonio IP6 project: upgrading quality and competitiveness of fonio for improved livelihoods in West Africa In order to explore properties of fonio as a potential healthy and nutritive food for urban
areas in Sub‐Saharan Africa and European countries, while generating income for local
producers, the interdisciplinary project FONIO “Upgrading quality and competitiveness of
fonio for improved livelihoods in West Africa” was launched in 2006 for 3 years. FONIO is a
collaborative research project funded by the EU Specific International Scientific Cooperation
Activities (INCO). It involved research institutions from 3 European countries (France,
Netherlands and Belgium) and 4 West African countries (Mali, Guinea, Burkina Faso and
Senegal). The main goal of the project was to develop research on production, post‐harvest
and food technology for fonio products of high nutritional value, good sensory quality and
commercial value (21). The FONIO project focused on 3 strategies: i) development of farming
Introduction
Page | 15
and cropping systems to increase fonio production as well as the value of various uses ‐grain,
straw and by‐products as animal feed, and improving soil fertility‐, for creating opportunities
to improve the livelihoods of producers; ii) investigating the nutritional quality and
improving the nutritional value of fonio products for adding substantial health/nutrition
value to fonio products to contribute to better nutrition and health; iii) investigating
processing and marketing systems (women’s association, small and medium enterprises) in
order to facilitate economic access to local communities, and promote the development of
export markets for improved/new fonio products (21). The main expected outputs of the
FONIO project were to alleviate (hidden) hunger and poverty burden among women who are
involved in the fonio production chain as producers, processors or traders; and to improve
local living standards through a sustainable development of the fonio commodity chain from
rural zones to urban or export markets. A secondary expected output was to maintain fonio
cultivation and so contributing to the conservation of natural local resources and
preservation of the local biodiversity (21).
The FONIO project has been initiated with the main goal to develop research on production, post‐harvest and food technology in order to arrive at fonio products of
high nutritional value, good sensory quality and commercial value.
IMPROVING FONIO VALUE FOR BETTER NUTRITION IN WEST AFRICA The value chain approach for nutrition goals
The value chain approach is a supply chain along which values are added to a product, from
production of the raw food to the final product. Series of activities and actors are involved in
this process. The objective of the value‐chain approach is to obtain a product with improved
affordability, availability, acceptability and quality, in order to increase food security and diet
quality (22). Value chain approaches for nutrition goals in resource poor settings mainly aim
to address the lack of access to, and the low intake of high‐quality foods and balanced diets,
being the key underlying determinants of nutritional problems in developing countries (22).
Therefore, a set of nutrition‐oriented strategies are initiated to improve the nutrition value
of the foods that do or potentially can contribute consistently to the daily intake of a wide
range of nutrients. In general, these strategies involve different sectors. Their perspectives

Chapter 1
Page | 16
are to create long‐term, sustainable benefits for food security and livelihoods, while
improving the nutrient quality and intake of the upgraded products. As such, nutritional
outcomes can be enhanced among vulnerable groups (22).
For the present research, implementing the value chain approach for nutritional purposes
would target the need to set fonio as a key crop in development policy, by adding substantial
and consistent (nutrition/health) value to fonio products for West African vulnerable groups
for whom fonio is part of the diet (13). The value chain approach should primarily focus on
women as vulnerable group, for they contribute to more than 50% of production, processing
and marketing activities of fonio, as well as cooking in the households (18, 23). Thus,
targeting women for nutrient‐ improved and healthy fonio products would be a way to
guarantee a healthy consumption pattern for the households consuming fonio products.
Improving the value of fonio products for the consumers, would bring forward the benefits
of fonio as a valuable food that can help with their health problems, hence resulting in a
renewed interest and increased demand of fonio. This added value would also lead to a
better market value for fonio (13, 23). Furthermore, the increased market value and demand
for fonio products will encourage farmers to allow larger cropping areas for fonio and boost
fonio production, resulting in an improvement of income and living conditions of local
producers and processers (13, 23).
Strategies to add nutritional value to foods through the value chain approach include i)
agricultural strategies to improve the nutrient content of foods, ii) food processing to
improve the level and uptake of nutrient from foods, and iii) improving the acceptability of
the food with consumer‐oriented strategies (Figure 1) (22). In the next sections, these
strategies are explained in the global context of the value chain approach for nutritional
goals, together with some propositions for their operationalization with fonio as staple food.
Prior to this description, the nutritional context (defined by existing food consumption
patterns and nutritional problems) in which these strategies will be applied needs to be
considered, since the primary goal in improving the nutritional value of fonio is to achieve
enhanced nutritional outcomes.
Adding nutritional value to fonio through a value chain approach can be a relevant nutrition research goal for improving household food security and nutritional/health
status of West African women.

Figure 1
Nutriti Anemia
Anemia
physiolo
the cut‐
prevale
problem
because
Africa, t
54% of t
1: Conceptunutrition
ional diso
a and nutr
defined
ogical disor
‐off of <12
nce of ane
m (27). Ane
e of high r
the prevale
the women
ual framewonal goals. Ad
orders amo
ritional iron
as low ha
rder in deve
g/dL indica
emia > 5%
emia is of p
requiremen
ence of ane
n aged 15‐49
ork for adddapted from
ong wome
n deficienc
aemoglobin
eloping cou
ates overall
among vul
public heal
ts and loss
emia among
9y living in
ing value tom Hawkes a
en of repr
cy
(Hb) con
untries (25)
anemia am
lnerable gro
th importa
ses during
g non‐pregn
urban areas
o a productnd Ruel (22
roductive
centration
. A decreas
mong wome
oups define
nce among
youth, pre
nant wome
s in Mali are
: the value 2)
age in We
(24) is th
se of Hb co
en of repro
es anemia
g women o
gnancy and
en is 44% (2
e anemic (2
Intro
P
chain appr
est Africa
he most c
oncentratio
oductive age
as a public
of reproduc
d lactation
27). In Wes
28).
oduction
Page | 17
oach for
common
n below
e (26). A
c health
tive age
(25). In
st Africa,

Chapter 1
Page | 18
Iron is the major component of Hb. As iron cannot be excreted by the body, its
concentration is regulated by the iron absorbed from the diet (29). Nutritional iron
deficiency (ID) occurs in case of failures to meet physiological requirements from dietary iron
(30). Three stages of nutritional ID are usually detected: depleted iron stores, iron deficient
erythropoiesis and iron deficiency anemia (IDA) (26). The first stage of ID is defined by a
progressive decrease of the iron stored in the liver as ferritin and haemosiderin. At this
stage, the supply of iron to the body is not compromised and the concentration of circulating
iron is normal. However the progressive depletion of iron stores is reflected by a fall in
serum ferritin (SF) concentration (26, 29). Referred to as iron deficiency without anemia, the
iron‐deficient erythropoiesis stage is characterized by an exhaustion of iron stores. The iron
supply to erythropoietic cells progressively decreases, as does the erythrocyte
protoporphyrin concentration, with an increase in serum transferrin receptors (sTfR)
concentration. Hb may decline slightly at this stage, but the concentration usually remains
within the normal ranges (26, 29). The third stage of ID is characterized by a total exhaustion
of iron stores and declining levels of circulating iron. The main feature is anemia defined as a
reduction in Hb concentration in the red blood cells, arising from the restriction of iron
supply to the bone narrow (26, 29).
Related to the 3 stages of ID development, useful indicators for differentiating nutritional
IDA from overall anemia are SF and sTfR concentrations (27, 31, 32). SF is the only measure
of iron that can reflect a deficient, excess or normal iron status. A decline in SF below the
cut‐off of 12 µg/L reflects iron depletion for women of reproductive age. Combined with low
Hb levels, decreased SF concentration indicates IDA (26). However, SF is an acute phase
protein that may be elevated in inflammatory conditions, resulting in misleading high ferritin
concentrations (33). To control for the effect of inflammatory conditions, SF is usually
associated with the measurement of C‐reactive protein (CRP) and alpha‐1 glycoprotein (AGP)
(26, 34). CRP is the commonly used parameter for acute infections, while AGP is used to
detect chronic infections (26). In situations where infections highly influence SF levels, sTfR
may be used to detect true IDA. sTfR are iron‐related proteins that regulate the uptake of
tissue iron to body cells (31, 32). They are much less influenced by ongoing inflammatory
processes. The expression of sTfR at body cells surface is proportional to the requirement of
iron (26, 29). Cutoff values of > 8.5 mg/L (depending on the analysis method used)

Introduction
Page | 19
associated with low SF and Hb concentration indicate true IDA among women of
reproductive age (26).
Nutritional ID continues to be the most common single micronutrient deficiency of public
health importance in West Africa (30). It has been estimated that half of the prevalence of
overall anemia among women of reproductive is related to nutritional ID (25, 27). As in most
developing countries, Hb has been the only one indicator used to estimate ID in West Africa
(28) because of the low‐cost and simplicity of the measurement (35). However its specificity
is low (36) especially in developing countries where infections rates are still high (37, 38). SF
and sTFR are more specific and accurate in detecting nutritional IDA (31, 32, 35, 39) but they
are scarcely used because of their high costs and the lack of accurate measurement devices
in developing countries (30). This results in a failure to differentiate other causes of anemia
from nutritional ID, the prevalence of the latter being an indicator of the effectiveness of
interventions for reducing ID in developing countries (29, 40). For instance, iron fortification
has been recommended for groups at risk of ID in developing countries (40‐42) but to date,
it has been difficult to assess the effectiveness of iron fortification programs in these
countries (30). Therefore, an adequate assessment of iron status is essential for a suitable
evaluation of the effectiveness of iron fortification (29). Particularly for women of
reproductive age in West Africa, there is a need to document their iron status using accurate
biochemical indicators in order to design and monitor appropriate programs for alleviating
the burden of ID among them.
ID and weight status
Beside chronic energy deficiency and micronutrient deficiencies, overweight and obesity
have become an emerging public health concern in developing countries during the past
decade (43‐48). Urban communities are the most at risk of overweight and obesity because
of the transition in the habitual diet, associated with a sedentary lifestyle defined by
decreased physical activity due to the sedentary nature of work activities, changing modes
of transportation, and increasing urbanization (10, 45, 48). Prevalences of overweight
ranging from 10 to 70% have been reported for women living in urban areas in developing
countries (49). In Bamako, the prevalence of overweight and obesity increased from 10% in
2001 to 31% in 2006 (30, 48). Overweight and obesity are defined as abnormal or excessive

Chapter 1
Page | 20
fat accumulation that may impair health (48, 50). Increased BMI is a key determinant of
cardiovascular diseases, diabetes, musculoskeletal disorders and some cancers (48).
Recently, significant correlations between iron biomarkers, fat mass and BMI have been
reported, and it has been suggested that excess adiposity may negatively affect iron status
(51, 52). The mechanisms explaining reduced iron status in obese individuals have not been
clearly determined. Assumptions about this correlation include a possible lower iron intake
from poor‐quality diets (53). However, it has been demonstrated that dietary iron intakes of
normal‐weight individuals was not significantly higher than iron intakes of overweight adults
(51). Another hypothesis is related to the function of hepcidin, an hormone secreted by the
liver (54). Hepcidin expression is induced by inflammation (54, 55). In obese individuals, the
chronic adipose tissue inflammation associated with obesity (56, 57), increases the secretion
of hepcidin (58, 59). In the presence of hepcidin, iron absorption from the gastrointestinal
route is blocked whereas its uptake by macrophages increased (54, 55). This could reduce
dietary iron absorption (60, 61). Higher circulating hepcidin concentrations have been
associated with lower iron status in overweight children in industrialized countries (60).
Adiposity have been reported to predict lower iron absorption among young women in
emerging countries undergoing nutrition transition (62).
Despite this evidence, the association between ID and weight status has not been
investigated in developing countries. Both ID and obesity result in overall poor health
conditions and are associated with increased mortality risk (48, 50). Particularly in urban
areas of developing countries where lifestyles are changing at a rapid pace (48), there is a
need to document ID in association with the increasing weight status among women of
reproductive who are the most at risk of these nutritional comorbidities.
West African women of reproductive age living in urban areas are at double risk of iron deficiency and overweight/obesity. Estimates of prevalence of iron deficiency using specific iron biomarkers and their association with weight status are insufficiently documented.

Introduction
Page | 21
Nutrient adequacy among women of reproductive age in West Africa Nutrient intake and adequacy
Like in many developing countries, low intake of micronutrients from poor diets is the major
cause of micronutrient deficiencies in West Africa. Habitual traditional West African diets are
monotonous, mainly based on grains, roots and tubers. Main protein sources are plant‐
based. Animal source foods are consumed in insufficient amounts (41, 63, 64). Iron
bioavailability and hence uptake from these diets is generally low (65‐68). Low iron
bioavailability from habitual plant‐based diets has been associated with ID in rural African
children (69).
In recent years, traditional diets have progressively turned to transitional diets in urban
areas, as a consequence of the increasing urbanization process observed in most of West
African cities. These diets are often described as rich in saturated fats and based on highly
processed energy‐dense foods with low levels of micronutrients (45, 70). Thus, beside the
increasing exposure to chronic diseases, communities living in West African urban areas are
also at risk of low iron and other micronutrients intake from the diet (45, 48).
Despite this evidence, micronutrient intake among women of reproductive age living in such
settings, as well as its association with the diet has been documented in very few West
African countries (71‐74). Particularly among women living in urban areas facing the double
risk of overweight and ID, there is a need to document the extent of the risk of nutrient
inadequacy from their diet in comparison to the dietary recommendations. Diet
diversification/modification has been emphasized as an approach to ensure adequate iron
intake from diets in developing countries (75‐79). However, as in a number of West African
countries, there is a lack of systematic data reporting on diet and food group intake of
women in Mali. Especially in urban areas where traditional and transitional diets are
consumed simultaneously, foods and food groups contributing substantially to nutrient
intakes and adequacy need to be explored as potential for increasing the variety and the
diversity of the diets.

Chapter 1
Page | 22
Assessing dietary intake among women of reproductive age in West Africa
The 24‐h dietary recall (24hDR) has been developed to fill the need of an accurate cost‐
effective, and non‐invasive dietary assessment tool, with the ability to quantify daily
amounts, types of food, and intakes of micronutrient (77, 80). The 24hDR in national or
international surveys allow comparison of data on the dietary pattern of heterogeneous
populations (77, 80, 81). A number of studies have adjusted or computerized this method for
assessing dietary intake among different groups in industrialized countries (82‐87). In
developing countries, the 24hDR has been adapted to the context of low literacy rate by
training interviewers to probe respondents and help them recall foods and amounts
consumed (88). However, as most self‐reported dietary assessment methods, the 24hDR is
marked by the bias of food intake misreporting (80, 88) which along with the day‐to‐day
variation in individual diets may lead to under or over estimation of the intake, limiting the
precision of prevalence of inadequate intake estimates (89, 90). Especially in West Africa
human development indexes are the lowest compared to other African regions, and illiteracy
rate is still high among women (91). In addition traditional dietary practices such as shared
plate‐eating (many household members sharing meals in a same plate) are still common
(74), even in urban areas, challenging the precision of diet assessment. There is a need to
report updated information on the day‐to‐day variation from the diet in such settings. This
will contribute to an accurate assessment of their usual intake, thus decreasing the risk of
misleading estimation of prevalence of high or low intakes (92, 93).
Low intake and absorption of iron from the diet is a major cause of the nutritional iron deficiency among women of reproductive age in West African urban areas. However, information on nutrient intake from urban diet patterns and its association with the
diet diversity still need to be documented, along with the ability of the diet assessment method to report accurate information on the dietary intake.
Strategies to add nutritional value to products in a value chain approach
Strategies to be implemented for upgrading the nutritional value of fonio within the above
described nutritional context comprise agricultural strategies, processing and improvement
of acceptability. In the following, the feasibility of these strategies as well as factors to be
influenced to increase acceptability of fonio are described.

Introduction
Page | 23
Agricultural strategies
Agricultural strategies are applied at production level of the value chain. They contribute to
increasing the micronutrients content in staple foods through agronomic strategies,
breeding or genetic engineering (94, 95). For instance, biofortification can be explored as a
breeding technique to produce new varieties with higher concentrations in iron and zinc and
a higher grain yield than the traditional landraces of traditional crop such as fonio. This
aspect is not further addressed as it goes beyond the scope of the present research.
Processing
Moving forward in the value chain, upgrading nutritional quality of foods can be achieved
through processing, including home processing and fortification. Home processing is mainly
used to improve retention of micronutrients or reduce the concentration of phytate (96),
present in most plant‐based foods and binding minerals into non bioavailable complexes (66,
68). Home processing encompasses practices like soaking, malting, cooking, germination,
fermentation (79, 97‐108); or parboiling, particularly for cereals, to enhance nutrient
content yield at milling (109‐111). Another, relatively new, approach is the use of natural
phytase of plant‐based foods or microbial phytase treatment to reduce phytate level (112‐
114).
Adding nutritional value through processing can also be achieved by fortification, which is
the addition of minerals and/or vitamins to a food vehicle with the goal of increasing their
concentration in the fortified product (41). Selected food vehicles for fortification are either
staple foods consumed on a regular basis and in relatively consistent amounts by a large
share of vulnerable population, or products with specific value for specific groups of the
population, like indigenous foods (41).
Consumer acceptability
Activities aiming to upgrade nutritional value of a food can be effective only if the latter is
accepted by the targeted vulnerable group of the community. Consumer‐oriented strategies
within value‐chain approaches are meant to satisfy this condition. They comprise a set of
community‐based activities intended to stimulate triggers influencing the consumers’
acceptability for a value‐added product (115). They usually include nutrition education

Chapter 1
Page | 24
activities at consumers’ level, and policies influencing activities targeting decision makers
(22).
Processing and investigating fonio acceptability may be key entry points for adding
value to fonio products in a value chain approach with nutrition goals targeting women
in West Africa.
Strategic entry points for adding nutritional value to fonio Acceptability of fonio
The acceptability and utilisation of foods in societies depend upon four main internal and
external factors regulated by cognitive processes (115). These factors are related to: ‐
information obtained from observing, handling, and consuming the food, ‐ information
acquired from the surrounding social and cultural context; ‐ information gained from the
physiological effects (pleasure, satiety, dislike, discomfort) experienced when eating and
after eating a certain food; and ‐ comparison with information stored in the memory of past
experiences (115). The Theory of Planned Behavior (116) is one of the most predictive
persuasion theories applied to various fields interested in the relationships between beliefs,
attitudes, behavioural intentions and behaviour. For nutritional goals, the TBP has been used
to measure the social acceptability of foods as the effect of internal and external factors on
the intention to consume these foods (117‐119). For health related purposes in nutrition,
the TBP has been combined with the Health Belief Model (120, 121). This combined model
integrates individual beliefs, social beliefs and perceived barriers related to the use of the
product, as well as health and nutritional outcomes related to the decision to use or not to
use the product (120, 121).
Previous investigations on the dietary role of fonio in West African societies reported that
the grain was essentially cultivated for home consumption in rural areas (3, 4, 6, 122). The
average individual amount consumed was 4.4 kg/year in Mali (123) with a range of 650 to
840 g/year in urban areas (124). Fonio is consumed by every age group, as couscous or as
porridges made from grain or flour (122), but the consumption of fonio porridge as infant
food has not been reported.

Introduction
Page | 25
Reported beliefs and factors related to the uses of fonio in West African communities
showed that the dietary role of the grain is interrelated with religious and sociocultural
beliefs and uses (3, 4, 8, 123, 124). It is often reported to be the tastiest, nutritious and easy
to digest cereal. For long time, fonio has been reserved particularly for chiefs, royalty, and
special occasions like Ramadan for Muslims (3, 4, 123). For some rural communities, fonio is
the most important food ingredient in traditional and religious events (4). In some
communities, fonio is believed to help prevent blood clotting after women give birth (4,
123), and fonio porridge is recommended for breastfeeding women to stimulate milk
production (4, 123). The difficult post‐harvest processing, the time‐consuming cooking
process, and the high‐cost of fonio products compared to other traditional cereals are often
reported as limitation factors regarding the consumption of fonio as daily cereal (3, 4, 8, 123,
124).
However, this evidence is mostly based on anecdotal information reported in descriptive
studies and so far, no systematic approach has been used to show their actual effect on the
consumption of fonio. Particularly in urban areas facing rapid shifts to transitional diets (10,
45), other non‐identified important socio‐cultural and cognitive determinants, as well as
factors related to the nutritional quality of the grain may influence its consumption. To
assess the acceptability of fonio in West African urban areas, those factors, as well as their
interrelationships with existing determinants and their influence on the consumption of
fonio, need to be appropriately documented using behavioral models. Documenting the
acceptability of fonio in West urban areas is an essential step for bringing forward the
necessity to add nutritional value to fonio products.
Processing: Phytate degradation and fortification
The food composition table of Mali (TACAM) reported an iron content of 8.5 mg/100g dry
weight for the husked raw grain of fonio, being higher than other cereals, except for
sorghum (125). However it has been recently shown that after home processing, the iron
concentration of fonio is rather low, being 0.8 to 1.8 mg/100g dry weight (126). The grains
are also reported to have high brewing and malting potentials (127, 128) and the potential
of fonio for traditional and technological processing have been reported (129). However, as
most plant‐based foods, fonio grains contain phytic acid that forms complexes with iron, and
thus reducing its bioavailability (66, 68). A recent investigation on phytate content in fonio

Chapter 1
Page | 26
reported a concentration of 123 mg/100g dry weight after cooking (126), indicating that the
phytate‐to‐iron molar ratio from fonio products is much greater than the optimal level of
<0.4:1 required to achieve a significant increase in iron absorption (130, 131). Adding value
to fonio could therefore only be achieved by increasing both the iron content and
bioavailability in fonio products, hence a better contribution of fonio‐based diets to the daily
intake of iron can be expected.
Iron fortification of staple foods has been recommended as a strategic processing option to
increase the content of available iron in foods (30, 41). Water soluble ferrous sulfate, is the
suitable iron fortificant in developing countries as it is cheaper and shows similar
bioavailability as native iron, compared to poorly water soluble and insoluble compounds.
Also, at a low fortification level, sensory properties alteration of the fortified foods led by
ferrous sulfate can be reduced (30, 41, 42). Recently, Zimmermann et al (132) reported that
iron absorption from ferrous sulfate was well up‐regulated in iron deficiency, and
emphasized its use for low‐level fortification in iron‐deficient populations (132). However,
iron absorption from highly bioavailable iron compounds can be inhibited by phytic acid in
cereals‐based foods (65, 133, 134). Therefore, reducing phytate level is essential to improve
iron absorption from iron‐fortified foods (133).
Phytic acid can be degraded by adding microbial phytase to foods (112‐114, 135‐138), or by
enhancing the activity of the intrinsic phytase present in a large range of plant‐based foods
(112, 114, 137, 139‐145). Using home processing practices, Egli et al. (146) showed that
adding wheat to cereal‐based foods mixtures completely degraded phytate at optimal
incubation conditions. The efficacy of this technique in improving iron absorption from
staple cereals needs to be demonstrated in humans but up till now, evidence has not been
reported.
Although iron fortification has been shown to be potentially cost‐effective for West African
countries, very few efficacy trials are being implemented to bring forward evidence of the
positive effects of iron fortification. In Mali, fonio is a traditional staple cereal for some
communities in rural as well as in urban areas. Increasing the content of iron using ferrous
sulfate as a cheap iron compound after reducing the concentration of phytate in fonio
products is a strategy to be investigated as entry point for adding value to fonio products
through a value chain approach. An iron absorption study with iron‐fortified fonio products

Introduction
Page | 27
is an essential exploratory step towards enhancing the contribution of fonio to iron intake of
women living in urban areas.
A number of outstanding research questions need to be addressed in order to achieve nutritional value‐added fonio products using acceptability and home processing/fortification as entry points in a value chain approach
RATIONALE AND OBJECTIVES
Fonio is the most ancient West African traditional cereal having a large ecological
adaptability. In some communities, fonio is a staple grain particularly during the food
shortage periods. As such, its potential for contributing to food security in West African
communities, while alleviating nutritional deficiencies among vulnerable groups has been
reconsidered. The FONIO project was initiated with the vision to develop fonio products of
high nutritional value, good sensory quality and commercial value. The value chain approach
for nutritional goals is a set of strategies that can be explored for upgrading the nutritional
value of fonio products. Particularly for West African women living in urban areas facing the
double risk of iron deficiency and overweight/obesity, adding nutritional value to fonio
products can be relevant for improving their nutritional/health status while enhancing
household food security. Processing and investigating fonio acceptability may be key entry
points of a value chain approach for adding nutritional value to fonio products. However, a
number of outstanding research questions need to be addressed before achieving this.
As part of the FONIO project, the main objective of the present research was to upgrade the
nutritional value of fonio through home processing and fortification. To achieve this
objective, some specific research questions are addressed through the chapters of the
thesis.
Chapter 2 addresses the need of defining the nutritional context for operating the value
chain approach by providing updated and specific data on nutritional problems faced by
West African women. Results of a baseline assessment of nutrition (iron) status among a
sample of Malian women of reproductive age are presented, with as scientific objective to
investigate the association between iron deficiency and weight status. In chapter 3, the
intake and adequacy of iron and other micronutrients are examined among the same sample
Chapter
Page | 2
of wom
dietary
provide
assessin
Chapter
grain in
to its co
investig
Chapter
fonio w
sample
Main fin
along w
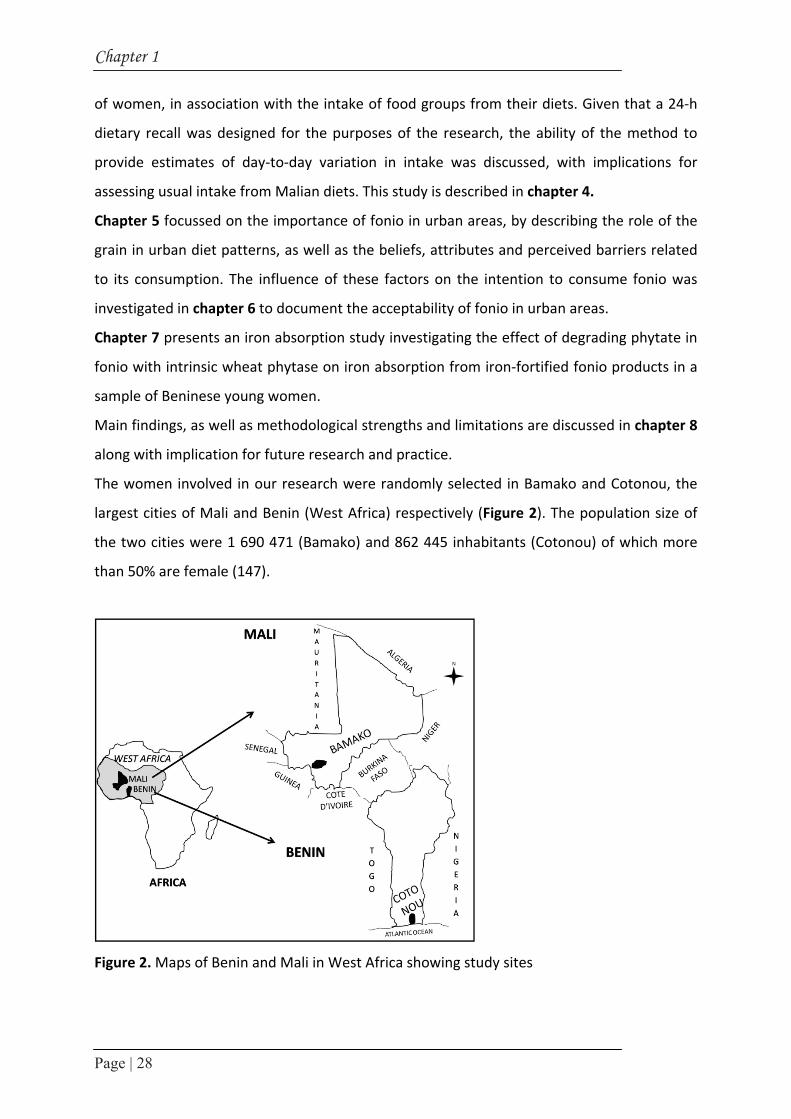
The wo
largest
the two
than 50
Figure 2
r 1
28
men, in asso
recall was
e estimates
ng usual inta
r 5 focussed
urban diet
onsumption
gated in cha
r 7 presents
with intrinsic
of Beninese
ndings, as w
with implicat
men involv
cities of Ma
o cities wer
0% are fema
2. Maps of B
ciation with
designed f
of day‐to‐
ake from M
d on the im
t patterns, a
n. The influ
apter 6 to do
s an iron ab
c wheat phy
e young wo
well as meth
tion for futu
ved in our r
ali and Ben
e 1 690 47
ale (147).
Benin and M
h the intake
for the purp
‐day variati
Malian diets.
mportance o
as well as t
uence of the
ocument th
bsorption st
ytase on iro
omen.
hodological
ure research
research we
nin (West Af
1 (Bamako)
Mali in West
e of food g
poses of th
ion in inta
. This study
of fonio in u
the beliefs,
ese factors
he acceptab
tudy invest
on absorptio
strengths a
h and pract
ere random
frica) respe
) and 862 4
t Africa sho
roups from
e research,
ke was dis
is described
urban areas
attributes a
on the int
bility of foni
igating the
on from iro
and limitati
tice.
mly selected
ectively (Fig
445 inhabita
wing study
m their diets
, the ability
scussed, wi
d in chapte
s, by describ
and perceiv
tention to c
o in urban a
effect of de
on‐fortified
ons are disc
d in Bamako
gure 2). The
ants (Coton
sites
s. Given tha
y of the me
th implicat
r 4.
bing the rol
ved barriers
consume fo
areas.
egrading ph
fonio produ
cussed in ch
o and Coton
e population
nou) of whi
at a 24‐h
ethod to
tions for
le of the
s related
onio was
hytate in
ucts in a
hapter 8
nou, the
n size of
ch more

Introduction
Page | 29
References
1. Trichopoulou A, Vasilopoulou E, Georga K, Soukara S, Dilis V. Traditional foods: Why and how to sustain them. Trends Food Sci Technol. 2006; 17: 498‐504.
2. CCP/GR. Development strategy for traditional grains. Committee on Commodity Problems Intergovernmental Group on Grains. 1995, Rome, Italy.
3. Vietmeyer N, Borlaugh N, Axtell J, Burton G, Harlan J, Rachie K. Fonio (Acha), in NRC/BSTID ed Lost crops of Africa. 1996, National Academy Press: Washington DC. 59‐76.
4. Adoukonou‐Sagbadja H, Dansi A, Vodouhè R, Akpagana K. Collecting fonio landraces (Digitaria exilis Stapf, Digitaria Iburua Stapf) in Togo. Plant Genet Resour Newsl. 2004; 139: 63‐67.
5. FAO. FAOSTAT 2009, Crops production, Western Africa: Statistics Division, Downloaded from http://faostat.fao.org/site/567/DesktopDefault.aspx?PageID=567#ancor, Oct 26, 2011.
6. Vall E, Andrieu N, Beavogui F, Sogodogo D. Contribution of fonio (Digitaria exilis Stapf) to seasonal food security (Les cultures de soudure comme stratégie de lutte contre l'insécurité alimentaire saisonnière en Afrique de l'Ouest: le cas du fonio). Cah Agric. 2011; 20(4): 294‐300.
7. Irving DW , Jideani IA. Microstructure and composition of Digitaria exilis Stapf (acha): a potential crop. Cereal Chemistry 1997; 74(3): 224‐228.
8. Cruz J‐F. Fonio: a small grain with potential. LEISA. 2004; 20: 16‐17. 9. Kuta DD, Kwon‐Ndung E, Dachi S, Ukwungwu M, Imolehin ED. Potential role of biotechnology
tools for genetic improvement of “lost crops of Africa”: the case of fonio (Digitaria exilis and Digitaria iburua). Afr J Biotechnol. 2003; 2(12): 580‐585.
10. den Hartog AP, van Staveren WA, Brouwer ID, eds. Food habits and consumption in developing countries. Manual for field studies. 2006, Wageningen academic Publishers: Netherlands.
11. Regmi A, Dyck J. Effects of urbanization on global food demand. Changing Structure of Global Food Consumption and Trade WRS‐01‐1. 2001, Economic Research Service, USDA, Washington DC. 23‐30.
12. Jaenicke H, Höschle‐Zeledon I, eds. Strategic Framework for Underutilized Plant Species Research and Development, with Special Reference to Asia and the Pacific, and to Sub‐Saharan Africa. 2006, International Centre for Underutilised Crops: Colombo, Sri Lanka; Global Facilitation Unit for Underutilized Species: Rome, Italy.
13. Will M. Promoting value chains of neglected and underutilized species for pro‐poor growth and biodiversity conservation. guidelines and good practices. 2008, Global Facilitation Unit for Underutilized Species: Rome, Italy.
14. SCN. 5th Report on the World Nutrition Situation: Nutrition for Improved Development Outcomes. 2004, Available at http://www.unscn.org/layout/modules/resources/files/rwns5.pdf. Downloaded Nov. 10, 2011: WHO, Geneva.
15. Morón C. Food‐based nutrition interventions at community level. Br J Nutr. 2006; 96(S1): S20‐S22.
16. Toledo A, Burlingame B. Biodiversity and nutrition: A common path toward global food security and sustainable development. JFCA 2006; 19: 477‐483.
17. Vodouhe SR, Zannou A, Achigan Dako EG. Proceedings of the first workshop on genetic diversity of fonio (Digitaria exilis) in West Africa [Premier Atelier sur la Diversité Génétique du Fonio en Afrique de l’Ouest]; 4‐6 August 1998, 2003, IPGRI, Rome, Italy: Conakry, Guinea. 36‐41.
18. Adoukonou‐Sagbadja H, Dansi A, Vodouhè R, Akpagana K. Indigenous knowledge and traditional conservation of fonio millet (Digitaria exilis Stapf, Digitaria iburua Stapf) in Togo. Biodivers Conserv. 2006; 15: 2379‐2395.
19. Adoukonou‐Sagbadja H, Schubert V, Dansi A, Jovtchev G, Meister A, Pistrick K, Akpagana K, Friedt W. Flow cytometric analysis reveals different nuclear DNA contents in cultivated Fonio (Digitaria spp.) and some wild relatives from West‐Africa. Syst Evol. 2007; 267: 163‐176.
20. Adoukonou‐Sagbadja H, Wagner C, Dansi A, Ahlemeyer J, Daïnou O, Akpagana K, Ordon F, Friedt W. Genetic diversity and population differentiation of traditional fonio millet (Digitaria spp.)

Chapter 1
Page | 30
landraces from different agro‐ecological zones of West Africa. Theor Appl Genet. 2007; 115(7): 917‐931.
21. CIRAD, Enda Graf Sahel, IRAG, IER, CIRDES, CRA‐W, WUR. Upgrading quality and competitiveness of fonio for improved livelihoods in West Africa. Final report. . 2009, France: CIRAD.
22. Hawkes C, Ruel MT. Value chains for nutrition; Paper 4, in IFPRI 2020 International Conference 2011: New Delhi, India.
23. IRG. Fonio value chain in Senegal. Support for accelerated growth and increased competitiveness. [Chaine de valeur Fonio au Sénégal. Analyse et cadre stratégique d’initiatives pour la croissance de la filière]. 2008, Washington, DC: International Resources Group.
24. Ajzen I, Fishbein M. Editorial comment on questions raised by a reasoned action approach: Comment on Ogden (2003). Health Psychology. 2004; 23(4): 431‐434.
25. McLean E, Egli I, Cogswell M, de Benoist B, Wojdyla D, Cogswell M. Worldwide prevalence of anemia in preschool aged children, pregnant women and non‐pregnant women of reproductive age, in K Kraemer, MB Zimmermann ed Nutritional Anemia. 2007, Sight and Life Press: Switzerland. Chap 1:1‐12.
26. Biesalski HK , Erhardt JG. Diagnosis of nutritional anemia ‐ laboratory assessment of iron status, in K Kraemer, MB Zimmermann ed Nutritional Anemia. 2007, Sight and Life Press: Switzerland. Chap 4:37‐43.
27. WHO, UNICEF, UNU. Iron Deficiency Anemia Assessment, Prevention, and Control. 2001, Geneva: World Health Organization.
28. CPS/MS , DNSI/MEIC. Mali Demography and Health Survey 2006. [Enquête Démographique et de Santé du Mali 2006 (EDSM‐IV)] 2007: Cellule de Planification et de Statistique du Ministère de la Santé, Bamako Mali; Direction Nationale de la Statistique et de l’Informatique du Ministère de l’Économie de l’Industrie et du Commerce, Bamako Mali; Macro International Inc, Calverton MD.
29. Lynch S. Iron metabolism, in K Kraemer, MB Zimmermann ed Nutritional Anemia. 2007, Sight and Life Press: Switzerland. Chap 6:59‐76.
30. Zimmermann MB, Hurrell RF. Nutritional iron deficiency. Lancet. 2007; 370: 511‐520. 31. Cook JD. Diagnosis and management of iron‐deficiency anaemia. Best Pract Res Clinic Haem.
2005; 18(2): 319‐332. 32. Skikne BS, Flowers CH, Cook JD. Serum transferrin receptor: a quantitative measure of tissue
iron deficiency. Blood 1990; 75: 1870‐1876. 33. Fitzsimons EJ , Brock JH. The anaemia of chronic disease. BMJ. 2001; 322: 811‐812. 34. Thurnham DI, Mburu‐de Wagt AS, Mwaniki DL, Muniu EM, Alumasa F, de Wagt A. Using plasma
acute phase protein concentrations to interpret nutritional biomarkers in apparently‐healthy HIV‐1 seropositive Kenyan adults. Br J Nutr. 2008; 100: 174‐182.
35. Zimmermann MB, Molinari L, Asobayire FS, Hess SY, Chaouki N, Adou P, Hurrell RF. Serum transferrin receptor and zinc protoporphyrin as indicators of iron status in African children. Am J Clin Nutr. 2005; 81: 615‐623.
36. White KC. Anemia is a poor predictor of iron deficiency among toddlers in the United States: for heme the bell tolls. Pediatrics 2005; 115: 315‐320.
37. Asobayire FS, Adou P, Davidsson L, Cook JD, Hurrell RF. Prevalence of iron deficiency with and without concurrent anemia in population groups with high prevalences of malaria and other infections: a study in Cote d’Ivoire. Am J Clin Nutr. 2001; 74: 776‐782.
38. Stoltzfus RJ, Chwaya HM, Montresor A, Albonico M, Savioli L, Tielsch JM. Malaria, hookworms and recent fever related to anemia and iron status indicators in 0‐to 5‐y Zanzibari children and these relationships change with age. J Nutr. 2000; 130: 1724 ‐1733.
39. Looker AC, Gunter EW, Johnson CL. Methods to assess iron status in various NHANES studies. Nutr Rev. 1995; 53: 246‐254.
40. Hurrell RF. How to ensure adequate iron absorption from iron‐fortified food. Nutr Rev. 2002; 60: S7‐15.
41. Allen L, de Benoist B, Dary O, Hurrell RF, eds. Guidelines on food fortification with micronutrients. 2006: WHO, Geneva, Switzerland; FAO, Rome, Italy.

Introduction
Page | 31
42. Hurrell RF. Preventing iron deficiency through food fortification. Nutr Rev. 1997; 55: 210‐222. 43. Amoah AGB. Sociodemographic variations in obesity among Ghanaian adults. Public Health Nutr
2003; 6: 751‐757. 44. Martorell R, Khan LK, Hughes ML, Grummer‐Strawn LM. Obesity in women from developing
countries. Eur J Clin Nutr. 2004; 54: 247‐252. 45. Popkin BM. An overview of the nutrition transition and its health implications: the Bellagio
meeting. Public Health Nutr. 2002; 5: 93‐103. 46. Siervo M, Grey P, Nyan OA, Prentice AM. Urbanization and obesity in The Gambia: a country in
the early stages of the demographic transition. Eur J Clin Nutr. 2006; 60(6): 455‐463. 47. Sodjinou R, Agueh V, Fayomi B, Delisle H. Obesity and cardio‐metabolic risk factors in urban
adults of Benin: relationship with socio‐economic status, urbanisation, and lifestyle patterns. BMC Public Health. 2008; 8: 84.
48. WHO. Obesity and overweight, fact sheet No 311. 2011, WHO Media Centre, Available at http://www.who.int/mediacentre/factsheets/fs311/en/. Download Oct. 27 2011.
49. Mendez MA, Monteiro CA, Popkin BM. Overweight exceeds underweight among women in most developing countries. Am J Clin Nutr. 2005; 81: 714‐721.
50. Flegal KM, Graubard BI, Williamson DF, Gail MH. Cause specific excess deaths associated with underweight, overweight, and obesity. JAMA 2007; 298: 2028‐2037.
51. Lecube A, Carrera A, Losada E, Hernández C, Simó R, Mesa J. Iron deficiency in obese postmenopausal women. Obesity 2006; 14: 1724‐1730.
52. Yanoff LB, Menzie CM, Denkinger B, Sebring NG, McHugh T, Remaley AT, Yanovski JA. Inflammation and iron deficiency in the hypoferremia of obesity. Int J Obes. 2007; 31: 1412‐1419.
53. Seltzer CC , Mayer J. Serum iron and iron‐binding capacity in adolescents 2. Comparison of obese and nonobese subjects. Am J Clin Nutr. 1963; 13: 354‐357.
54. Nemeth E, Valore EV, Territo M, Schiller G, Lichtenstein A, Ganz T. Hepcidin, a putative mediator of anemia of inflammation, is a type II acute‐phase protein. Blood. 2003; 101: 2461‐2463.
55. Nemeth E , Ganz T. Regulation of iron metabolism by hepcidin. Annu Rev Nutr. 2006; 26: 323‐342.
56. Greenberg AS , Obin MS. Obesity and the role of adipose tissue in inflammation and metabolism. Am J Clin Nutr. 2006; 83: S461‐465.
57. McClung JP , Karl JP. Iron deficiency and obesity: the contribution of inflammation and diminished iron absorption. Nutr Rev. 2009; 67: 100‐104.
58. Bekri S, Gual P, Anty R, Luciani N, Dahman M, Ramesh B, Iannelli A, Staccini‐Myx A, Casanova D, Ben Amor I, Saint‐Paul MC, Huet PM, Sadoul JL, Gugenheim J, Srai SK, Tran A, Le Marchand‐Brustel Y. Increased adipose tissue expression of hepcidin in severe obesity is independent from diabetes and NASH. Gastroenterology 2006; 131: 788‐796.
59. Chung B, Matak P, McKie AT, Sharp P. Leptin increases the expression of the iron regulatory hormone hepcidin in HuH7 human hepatoma cells. J Nutr. 2007; 137(11): 2366‐2370.
60. Aeberli I, Hurrell RF, Zimmermann MB. Overweight children have higher circulating hepcidin concentrations and lower iron status but have dietary iron intakes and bioavailability comparable with normal weight children. Int J Obes. 2009; 33: 1111‐1117.
61. Laftah AH, Ramesh B, Simpson RJ, Solanky N, Bahram S, Schümann K, Debnam ES, Srai SK. Effect of hepcidin on intestinal iron absorption in mice. Blood 2004; 103(10): 3940‐3944.
62. Zimmermann MB, Zeder C, Muthayya S, Winichagoon P, Chaouki N, Aeberli I, Hurrell RF. Adiposity in women and children from transition countries predicts decreased iron absorption, iron deficiency and a reduced response to iron fortification. Int J Obes. 2008; 32(7): 1098‐1104.
63. Burlingame B. The food of Near East, North West and Western African regions. Asia Pacific J Clin Nutr. 2003; 12(3): 309‐312.
64. FAO. Agriculture food and nutrition for Africa ‐ A resource book for teachers of agriculture. Chap7. African diets and diet composition. 1997, Rome, Italy: Division of information, Available at http://www.fao.org/docrep/W0078E/W0078E00.htm, Downloaded Oct. 27, 2011.

Chapter 1
Page | 32
65. Cook JD, Reddy MB, Burri J, Juillerat MA, Hurrell RF. The influence of different cereal grains on iron absorption from infant cereal foods. Am J Clin Nutr. 1997; 65: 964‐969.
66. Gillooly M, Bothwell TH, Charlton RW, Torrance JD, Bezwoda WR, MacPhail AP, Derman DP, Novelli L, Morrall P, Mayet F. Factors affecting the absorption of iron from cereals. Br J Nutr. 1984; 51: 37‐46.
67. Hurrell RF. Bioavailability of iron. Eur J Clin Nutr. 1997; 51: S4‐8. 68. Hurrell RF, Reddy M, Cook JD. Inhibition of non‐haem iron absorption in man by polyphenol‐
containing beverages. Br J Nutr. 1999; 81: 289‐295. 69. Zimmermann MB, Chaouki N, Hurrell RF. Iron deficiency due to consumption of a habitual diet
low in bioavailable iron: a longitudinal cohort study in Moroccan children. Am J Clin Nutr. 2005; 81: 115‐121.
70. Urquiaga I, Guasch V, Marshall G, San Martín A, Castillo O, Rozowski J, Leighton F. Effect of Mediterranean and Occidental Diets, and Red Wine, on Plasma Fatty Acids in Humans. An Intervention Study. Biol Res. 2004; 37: 253‐261.
71. Becquey E, Martin‐Prevel Y. Micronutrient adequacy of women’s diet in urban burkina faso is low. J Nutr. 2010; 140: S2079‐2085.
72. Savy M, Martin‐Prével Y, Danel P, Traissac P, Dabire HB, Delpeuch F. Are dietary diversity scores related to the socioeconomic and anthropometric status of women living in an urban area in Burkina Faso? Public Health Nutr. 11. 2008(2): 132‐141.
73. Savy M, Martin‐Prével Y, Sawadogo P, Kameli Y, Delpeuch F. Use of variety/ diversity scores for diet quality measurement: relation with nutritional status of women in a rural area in Burkina Faso. Eur J Clin Nutr. 2005; 59: 703‐716.
74. Torheim LE. Methods for assessing dietary intake in rural Mali, West Africa: challenges when people eat from shared plates. 2003: Faculty of Medicine, University of Oslo.
75. Alaofe H, Zee J, Dossa R, O'Brien HT. Effect of a nutrition education program and diet modification in Beninese adolescent girls suffering from mild iron deficiency anemia. Ecol Food Nutr. 2009; 48: 21‐38.
76. Allen L. To what extent can food‐based approaches improve micronutrient status?. Asia Pac J Clin Nutr. 2008; 17(S1): 103‐105.
77. Gibson RS. Strategies for Preventing Micronutrient Deficiencies in Developing Countries. Asia Pac J Clin Nutr. 2004; 13: S23.
78. Gibson RS, Hotz C. Dietary Diversification/Modification Strategies to Enhance Micronutrient Content and Bioavailability of Diets in Developing Countries. Br J Nutr. 2001; 85: S159‐166.
79. Gibson RS, Yeudall F, Drost N, Mitimuni BM, Cullinan TR. Experiences of a community‐based dietary intervention to enhance micronutrient adequacy of diets low in animal source foods and high in phytate: a case study in rural Malawian children. J Nutr. 2003; 133(11Suppl2): S3992‐3999.
80. Gibson RS. Principle of nutritional assessment, 2nd edition. 2005, New York: Oxford University Press.
81. Biro G, Hulshof KF, Ovesen L, Cruz JA. Selection of methodology to assess food intake. Eur J Clin Nutr. 2002; 56(Suppl2): S25‐32.
82. Canada S. Canadian Community Health Survey, Cycle 2.2, Nutrition. A Guide to accessing and interpreting the data. 2004, Ottawa: Minister of Health.
83. Conway JM, Ingwersen LA, Moshfegh AJ. Accuracy of dietary recall using the USDA five‐step multiple‐pass method in men: an observational validation study. J Am Diet Assoc. 2004; 104: 595‐603.
84. Crispim SP, de Vries JH, Geelen A, Souverein OW, Hulshof PJ, Lafay L, Rousseau AS, Lillegaard ITL, Andersen LF. Two non‐consecutive 24‐h recalls using EPIC‐Soft software are sufficiently valid for comparing protein and potassium intake between five European centers ‐ results from the European Food Consumption Validation (EFCOVAL) study. Br J Nutr. 2011; 105: 447‐458.
85. McLennan W, Podger A. National Nutrition Survey User’s Guide. 1995, Canberra: Australian Government Printing Service.

Introduction
Page | 33
86. Russell D, Parnell W, Wilson N. NZ Food: NZ People. Key Results of the 1997 National Nutrition Survey. 1999, Wellington: Minister of Health.
87. Verger P, Ireland J, Moller A, Abravicius JA, De Henauw S, Naska. Improvement of comparability of dietary intake assessment using currently available individual food consumption surveys. Eur J Clin Nutr. 2002; 56: 18S‐24S.
88. Gibson R , Ferguson E, eds. An interactive 24‐hour recall for assessing the adequacy of iron and zinc intakes of developing countries. Technical monograph 8: Harvest Plus. 2008: Washington, DC.
89. Beaton GH, Milner J, Corey P, McGuire V, Cousins M, Stewart E, de Ramos M, Hewitt D, Grambsch PV, Kassim N, Little JA. Source of variance in 24‐hour dietary recall data: implications for nutrition study design and interpretation. Am J Clin Nutr. 1979; 32: 2546‐2559.
90. Beaton GH, Milner J, Corey P, McGuire V, Cousins M, Stewart E, de Ramos M, Hewitt D, Grambsch PV, Kassim N, Little JA. Sources of variance in 24‐hour dietary recall data: implications for nutrition study design and interpretation. Carbohydrate sources, vitamins, and minerals. Am J Clin Nutr. 1983; 37: 986‐995.
91. UNDP. Human Development Report 2011. Sustainability and equity: A better future for all. downloaded Nov 27, 2011, UNDP, New York, USA, Available at http://hdr.undp.org/en/reports/global/hdr2011/.
92. Dodd KW, Guenther PM, Freedman LS, Subar AF, Kipnis V, Midthune D, Tooze JA, Krebs‐Smith SM. Statistical methods for estimating usual intake of nutrients and foods: a review of the theory. J Am Diet Assoc. 2006; 106: 1640‐1650.
93. Mackerras D, Rutishauser I. 24‐h national dietary survey data: how do we interpret them most effectively? Public Health Nutr. 2005; 8: 657‐665.
94. Hotz C, Brown KH. Assessment of the Risk of Zinc Deficiency in Populations and Options for Its Control: International Zinc Technical Document#1. Food Nutr Bulletin. 2004; 25: S94‐204.
95. Nestel P, Bouis HE, Meenakshi JV, Pfeiffer W. Biofortification of staple crops. Symposium: food fortification in developing countries. J Nutr. 2006; 136: 1064‐1067.
96. Ruel MT, Levin CE. Assessing the potential for food‐based strategies to reduce vitamin A and iron deficiencies: a review of recent evidence. Food consumption and nutrition division discussion paper. 2000, Washington DC: IFPRI.
97. Agte VV, Joshi SR. Effect of traditional food processing on phytate degradation in wheat and millets. J Agric Food Chemistry. 1997; 45: 1659‐1661.
98. Bhandal A. Effect of fermentation on in vitro digestibilities and the level of antinutrients in moth bean (Vigna aconitifolia (Jacq.) Marechal). Int J Food Sci Technol. 2008; 43: 2090‐2094.
99. Camacho L, Sierra C, Campos R, Guzmán E, Marcus D. Nutritional changes caused by germination of legumes commonly eaten in Chile. Arch LatinoAm Nutr. 1992; 42: 283.
100. Dicko MH, Gruppen H, Traore AS, Van Berkel WJH, Voragen AGJ. Evaluation of the Effect of Germination on Phenolic Compounds and Antioxidant Activities in Sorghum Varieties. J Agric Food Chemistry. 2005; 53: 2581‐2588.
101. Elemo GN, Elemo BO, Okafor JNC. Preparation and nutritional composition of a weaning food formulated from germinated sorghum (sorghum bicolor) and steamed cooked cowpea (Vigna ungiculata Walp). Am J Food Technol. 2011; 6(5): 413‐421.
102. Hemalatha S, Platel K, Srinivasan K. Influence of germination and fermentation on bioaccessibility of zinc and iron from food grains. Eur J Clin Nutr. 2007; 61: 342‐348.
103. Hotz C, Gibson RS. Traditional food‐processing and preparation practices to enhance the bioavailability of micronutrients in plant‐based diets. J Nutr. 2007; 137: 1097‐1100.
104. Kayodé APP, Hounhouigan JD, Nout MJR. Impact of brewing process operations on phytate, phenolic compounds and in vitro solubility of iron and zinc in opaque sorghum beer. LWT 2007; 40: 834‐841.
105. Kayodé APP, Linnemann AR, Nout MJR, Van Boekel MAJS. Impact of sorghum processing on phytate, phenolic compounds and in vitro solubility of iron and zinc in thick porridges. J Sci Food Agric. 2007; 87: 832‐838.

Chapter 1
Page | 34
106. Mahgoub SEO, Elhag SA. Effect of milling, soaking, malting, heat‐treatment and fermentation on phytate level of four Sudanese sorghum cultivars. Food Chemistry. 1998; 6: 77‐80.
107. Miller DD. Effects of cooking and food processing on the content of bioavailable iron in foods. in Micronutrient interactions: Impact on child health and nutrition. 1996. Washington DC: ILSI Press.
108. Tizazu S, Urga K, Belay A, Abuye C, Retta N. Effect of germination on mineral bioavailability of sorghum‐based complementary foods. AJFAND 2011; 11(5): 5083‐5095.
109. Bhattacharya KR. Improved parboiling technologies for better product quality. Indian Food Industry. 1990; 9(5): 25‐26.
110. Kar N, Jain RK, Srivastav PP. Parboiling of dehusked rice. J Food Engineering. 1999; 39: 17‐22. 111. Raghavendra Rao' S, Juliano BO. Effect of Parboiling on Some Physicochemical Properties of
Rice. J Agr Food Chem. 1970; 18(2): 289‐294. 112. Greiner R, Konietzny U. Phytase for Food Application. Food Technol Biotechnol. 2006; 44(2):
125‐140. 113. Konietzny U , Greiner R. Molecular and catalytic properties of phytate‐degrading enzymes
(phytases). Int J Food Sci Technol 2002; 37: 791‐812. 114. Kumar V, Sinha A, Makkar HPS, Becker K. Dietary roles of phytate and phytase in human
nutrition: A review. Food Chemistry. 2010; 120: 945‐959. 115. Costell E, Tárrega A, Bayarri S. Food acceptance: the role of consumer perception and attitudes.
Chem Percept. 2010; 3: 42‐50. 116. Ajzen I. The Theory of Planned Behavior. Organ Behav Hum Decis Process. 1991; 50: 179‐211. 117. Blanchard CM, Fisher J, Sparling PB, Shanks TH, Nehl E, Rhodes RE, Courneya KS, Baker F.
Understanding adherence to 5 servings of fruits and vegetables per day: a Theory of Planned Behavior perspective. J Nutr Educ Behav. 2009; 41: 3‐10.
118. Kim K, Reicks M, Sjoberg S. Applying the Theory of Planned Behavior to predict dairy product consumption by older adults. J Nutr Educ Behav. 2003; 35: 294‐301.
119. Rah JH, Hasler CM, Painter JE, Chapman‐Novakofski KM. Applying the Theory of Planned Behavior to women’s behavioral attitudes on and consumption of soy products. J Nutr Educ Behav. 2004; 36: 238‐244.
120. Macharia‐Mutie CW, Van de Wiel AM, Moreno‐Londono AM, Mwangi AM, Brouwer ID. Sensory acceptability and factors predicting the consumption of grain amaranth in Kenya. Ecol Food Nutr. 2011; 50(5): 375‐392.
121. Sun X, Guo Y, Wang S, Sun J. Predicting iron‐fortified soy sauce consumption intention: application of the Theory of Planned Behavior and Health Belief Model. J Nutr Educ Behav. 2006; 38: 276‐285.
122. Cruz JF, Beavogui F, Dramé D. Fonio, an African cereal [Le fonio, une céréale africaine]. Collection Agricultures tropicales en poche. 2011: Edition Quae Versailles Cedex, CTA Wageningen, Presses agronomiques de Gembloux.
123. Sidibe A. Fonio in Mali [Le fonio au Mali], in Proceedings of the 1st workshop on genetic diversity of Fonio (Digitaria exilis Stapf.) in West Africa, 4 ‐ 6 August 1998, SR Vodouhe, A Zannou,GE Achigan‐Dako, Eds. 2003, IPGRI, Rome, Italy: Guinea Conakry. 17‐21.
124. Konkobo‐Yameogo C, Chaloub AO, Kergna N, Bricas Y, Karimou R, Ndiaye JL. Urban consumption of fonio, a traditional cereal in West Africa. [La consommation urbaine d’une céréale traditionnelle en Afrique de l’Ouest: le fonio]. Cah Agric. 2004; 13: 125‐128.
125. Barikmo I, Ouattara F, Oshaug A. Table de composition des aliments du Mali (TACAM), 2004: Oslo: Akershus University College.
126. Koreissi Y, et al. Personal communication. 127. Nzelibe HC, Nwasike CC. The brewing potential of ‘acha’ (Digitaria exilis) malt compared with
pearl millet (Pennisetum typhoides) malts and sorghum (Sorghum bicolor) malts. J Inst Brew. 1995; 101: 345‐350.
128. Nzelibe HC, Obaleye S, Onyenekwe PC. Malting characteristics of different varieties of fonio millet (Digitaria exilis). Eur Food Res Tech. 2000; 211: 126‐129.

Introduction
Page | 35
129. Jideani IA, Jideani VA. Developments on the cereal grains Digitaria exilis (acha) and Digitaria iburua (iburu). J Food Sci Technol 2011; 48(3): 251‐259.
130. Hurrell R, Egli I. Iron bioavailability and dietary reference values. American Journal of Clinical Nutrition. 2010; 91(5): S1461S‐1467.
131. Hurrell RF. Phytic acid degradation as a means of improving iron absorption. Int J Vitam Nutr Res. 2004; 74: 445‐452.
132. Zimmermann MB, Biebinger R, Egli I, Zeder C, Hurrell RF. Iron deficiency up‐regulates iron absorption from ferrous sulphate but not ferric pyrophosphate and consequently food fortification with ferrous sulphate has relatively greater efficacy in iron‐deficient individuals. Br J Nutr. 2011; 105: 1245‐1250.
133. Hurrell RF. Fortification: Overcoming Technical and Practical Barriers. J Nutr. 2002; 132: S806‐812.
134. Hurrell RF, Reddy MB, Burri J, Cook JD. An evaluation of EDTA compounds for iron fortification of cereal‐based foods. Br J Nutr. 2000; 84: 903‐910.
135. Greiner R , Konietzny U. Improving enzymatic reduction of myo‐inositol phosphates with inhibitory effects on mineral absorption in black beans (Phaseolus vulgaris var Preto). J Food Proc Preservation. 1999; 23: 249‐261.
136. Hurrell RF, Reddy MB, Juillerat MA, Cook JD. Degradation of phytic acid in cereal porridges improves iron absorption by human subjects. Am J Clin Nutr. 2003; 77: 1213‐1219.
137. Lopez Y, Gordon DT, Fields L. Release of phosphorus from phytate by natural lactic acid fermentation. J Food Science. 1983; 48: 952‐954.
138. Marklinder IM, Larsson M, Fredlund K, Sandberg AS. Degradation of phytate by using varied sources of phytases in an oat‐based nutrient solution fermented by Lactobacillus plantarum 2991. Food Microbiol. 1995; 12: 487‐495.
139. Bartnik M, Florysiak J. Phytate hydrolysis during bread‐making in several sorts of Polish bread. Die Nahrung. 1988; 32: 37‐42.
140. Egli I, Davidsson L, Juillerat MA, Barclay D, Hurrell RF. The influence of soaking and germination on the phytase activity and phytic acid content of grains and seeds potentially useful for complementary foods. J Food Sciences. 2002; 67(9): 3484‐3488.
141. Fujita J, Shigeta S, Yamane Y, Fukuda H, Kizaki Y, Wakabayashi S, Ono K. Production of two types of phytase from Aspergillus oryzae during industrial koji making. J Bioscience Bioengineering. 2003; 95: 460‐465.
142. Greiner R, Muzquiz M, Burbano C, Cuadrado C, Pedrosa MM, Goyoaga C. Purification and characterisation of a phytate‐degrading enzyme from germinated faba beans (Vicia faba var Alameda). J Agric Food Chem 2001; 49: 2234‐2240.
143. Larsson M, Sandberg AS. Phytate reduction in bread containing oat flour, oat bran, or rye bran. J Cereal Science. 1991; 14(2): 141‐149.
144. Larsson M, Sandberg AS. Phytate reduction in oats during malting. J Food Science. 1992; 57: 994‐997.
145. Sandberg A‐S, Svanberg U. Phytate hydrolysis by phytase in cereals; effects on in vitro estimation of iron availability. J Food Sci Technol. 1991; 56: 1330‐1333.
146. Egli I, Davidsson L, Juillerat MA, Barclay D, Hurrell RF. Phytic acid degradation in complementary foods using phytase naturally occurring in whole grain cereals. J Food Science. 2003; 68(5): 1855‐1859.
147. United Nations Demographic Yearbook. UN Statistics Division, Available at http://unstats.un.org/unsd/demographic/products/dyb/default.htm, downloaded Nov 28, 2011.


Chapter 2
Weight status and iron deficiency among urban
Malian women of reproductive age
Nadia Fanou-Fogny, Naomi J Saronga, Yara Koreissi,
Romain AM Dossa†, Alida Melse-Boonstra, Inge D Brouwer
British Journal of Nutrition 2011; 105:574-579

Chapter 2
Page | 38
Abstract
The present study investigated the association between weight status and Fe deficiency (ID)
among urban Malian women of reproductive age. Height, weight, serum ferritin (SF), soluble
transferrin receptor (sTfR) and C‐reactive protein (CRP) concentrations were measured in
sixty apparently healthy women aged 15–49 years old in Bamako, Mali. Prevalences of
overweight and obese were 19 and 9%, respectively. SF was non‐significantly different
between overweight (84 µg/l) and normal‐weight women (52 µg/l). The prevalence of ID (SF
< 12 µg/l) was 9% in the overweight group and no true ID (sTfR > 8.3 mg/l) cases were
recorded in the overweight and obese groups. The prevalence OR of ID (SF < 12 µg/l) in the
overweight group was NS (OR = 0.3; P = 0.363). Conversely, the chronic energy deficiency
group was at a significantly higher risk of ID than the normal‐weight group, adjusting or not
for CRP (OR = 7.7; 95%CI 1.49, 39.96; P = 0.015). The lack of association between overweight
and ID in the present study could be due to the fact that the excess of body fat of the
women might not be critical to induce chronic inflammation related to reduced Fe
absorption. Future research based on a larger convenience sample should be designed to
further investigate associations between overweight, obesity and ID in developing countries.

Weight status and iron deficiency
Page | 39
Introduction
Fe deficiency (ID) continues to be the most prevalent single micronutrient deficiency among
women of reproductive age in Mali, West Africa (1). In the meantime, obesity has become an
emerging public health concern in developing countries, especially in urban communities (2,
3). In Bamako, 10 % of women were overweight in 2001 (4). Recently, significant correlations
between serum Fe, soluble transferrin receptors (sTfR), fat mass and BMI have been
reported, and it was suggested that excess adiposity may negatively affect Fe (5‐8) status.
Both ID and obesity increase the risk of overall poor health and are associated with
increased risk of mortality (1, 9) but definitive mechanisms explaining low Fe status in the
obese have not been clearly determined (10). The association between Fe status and obesity
should be explored further, as obesity and ID continue to evolve worldwide, and the
combined impact of these nutritional comorbidities is unknown (11). Because very few
studies have investigated the association between ID and weight status in a developing
context, exploratory research is a necessary step to bring forward consistent conclusions
about relationships between ID and overweight/obesity. The present study examined the
association between weight status and ID among women of reproductive age in urban Mali,
using part of the data originally collected for a larger research project named FONIO
(EU/INCO no. 0015403). (Fonio is the name of a West African traditional cereal). Although
the research was not powered to study the relationship between weight status and ID,
results were found to be interesting to publish in a research communication – as data on
developing countries are still lacking – and to generate points of discussion about the
interaction between obesity and Fe status in developing countries for further research. We
hypothesised that overweight women have a higher risk of ID than normal‐weight women,
irrespective of Fe intake.
Subjects and methods
For the purpose of the FONIO project, 108 Malian women aged 15–49 years old were
randomly selected from 108 households of Bamako, using a three‐stage cluster sampling
(12) and the random walk method (13). The sampling procedure has been fully described
elsewhere (14). For the present study, a sub‐sample of sixty women was selected from the
main sample of the FONIO project, based on their willingness to participate in

Chapter 2
Page | 40
anthropometry and blood sample collection. Due to the small sample size, statistical power
of the results is limited. The study was conducted according to the guidelines laid down in
the Declaration of Helsinki, and all procedures involving human subjects were approved by
the ethical committee of the Malian National Institute of Research in Public Health (Mali).
Verbal consent was witnessed and a written informed consent was obtained from all the
participants before data collection. All the data were collected over a period of 3 months.
Anthropometry
Body weight and height were measured early in the morning, from fasting subjects according
to WHO standardised procedures (15). Weight was measured with a SECA Model 761
platform spring balance scale with a 150 kg maximum range and 0.5 kg graduation (Seca
761; Seca, Hamburg, Germany). Height was measured with a body measuring tape with 2200
mm maximum range and 1 mm graduation. BMI (kg/m2) was calculated from
anthropometric data and subjects were divided into four groups: chronic energy deficiency
(CED) defined as BMI < 18.5 kg/m2, normal weight defined as 18.5 ≤ BMI ≤ 24.9 kg/m2,
overweight defined as 25 ≤ BMI<30 kg/m2 and obesity defined as BMI ≥30 kg/m2 (16).
Blood samples and biochemical measurements
Whole blood was collected by venepuncture from overnight fasting subjects in K2 EDTA
tubes (2 ml) for Hb, and in normal tubes (6 ml) for sTfR, serum ferritin (SF) and C‐reactive
protein (CRP). Hb was measured using an automated counter (Horiba ABX Micros 60‐OT16,
Montpellier, France). Anaemia was defined as Hb < 120 g/l (17). SF was analysed by
chemiluminescent immunoassay using the Beckman Access Immunoassay DXL System
(Immulite/Ferritin, Beckman Coulter, Inc., Fullerton, CA, USA). sTfR was analysed by ELISA
(Ramco, Stafford, TX, USA), using the quality‐control materials supplied by the company. ID
was defined as SF <12 µg/l. Because SF can be influenced by a high CRP level (18), true ID
was also defined using sTfR > 8.3 mg/l (17). High sensitive CRP was measured using latex
nephelometry (BNProSpec System; Dade Behring Limited, Tokyo, Japan), normal reference
value: CRP >7.5 mg/l (19).
Weight status and iron deficiency
Page | 41
Dietary and nutrient adequacy assessment
Energy and Fe intake was assessed by two non‐consecutive 24 h dietary recalls as described
in Gibson & Ferguson (13). All days of the week were included in the 24 h recalls except
weekends and special event days to reduce bias due to occasional consumption of foods
with exceptionally high Fe or other (micronutrients) content. Foods were weighed with
digital dietary scales with a 10 kg maximum range and 2 g graduation. Procedures for dietary
assessment and food intake data processing have been fully described elsewhere (14).
Probability of Fe adequacy was derived from the intake of the 2 recall days, assuming a
bioavailability factor of 5% regarding the diet of the women. As Fe requirement distribution
is not normally distributed (20), probability of Fe adequacy was determined by the intake of
absorbed Fe from the Institute of Medicine table for adult women (21).
Statistical analysis
Statistics were performed using SPSS 15 for windows (SPSS, Inc., release 15.0.1.1, Chicago,
IL, USA, 2007). A P‐value < 0.05 was considered significant. Normality of variable distribution
in BMI groups was assessed using the Shapiro‐Wilk test. Mean Fe intake, SF and sTfR
distributions were (log) transformed for normality. One‐way ANOVA test was used for means
comparison; when significant, the Tukey’s minimum significant difference was used as a post
hoc test, assuming homogeneity of variances. Pearson’s χ2 test was used for comparison of
proportions. Logistic regression was performed to determine the prevalence OR of ID in
overweight and CED groups using the normal‐weight group as reference. The model was
adjusted for CRP by excluding three cases (each from the CED, normal‐weight and obese
groups) with simultaneously high CRP (> 20 mg/l) and ferritin levels (> 65 mg/l), and by
including CRP as a covariate in the model.
Results
The mean age of the women was 32.5 (SD 10) years. BMI ranged between 16.6 and 38.7
with a mean of 23.4 kg/m2 (Table 1). Prevalences of overweight and obesity were 19 and 9%,
respectively. About 16% of the women suffered from CED. Mean daily Fe intake appeared to
be the lowest in the obese group (13 mg) as compared to the normal‐weight (19 mg) and
CED groups (22 mg) but this was NS. Of the women, 20% had an adequate intake of Fe
Chapter 2
Page | 42
(probability of Fe adequacy = 0.2); 30 and 20% of the women in the CED and overweight
groups had an adequate intake respectively, while none of the obese women had an
adequate Fe intake. However, there was no significant difference between the groups. Mean
concentration of SF was 39 mg/l, being significantly higher in the obese group (84 µg/l)
compared to the CED group (15 µg/l). However, there was no significant difference between
SF of the overweight group (52 µg/l) and SF of the normal‐weight group (36 µg/l). Using SF as
an indicator, the prevalence of ID was 25%, with the lowest prevalence recorded in the
overweight group (9%). No ID cases were recorded among obese women. Overall sTfR levels
and means among groups were not higher than the normal reference value for detecting
true ID (> 8.3 mg/l). Subsequently, overall prevalence of true ID among women was low
(9%). Also, no true ID cases were recorded in overweight and obese groups. Mean CRP level
was lower (2.4 mg/l) than the reference value for detecting present inflammation (> 7.5
mg/l). Overweight and obese groups showed higher CRP values as compared to normal and
CED groups but this was NS. Except for the three cases which were deleted because of
simultaneously very high CRP (> 20 mg/l) and ferritin levels (SF > 65 µg/l), five out of the
fifty‐seven women (9%) showed an elevated CRP level (> 7.5 mg/l), of which one was in the
overweight group (9%), one was in the CED group (11%) and three were in the normal‐
weight group (9%). The proportion of women with elevated CRP level (> 7.5 mg/l) was non‐
significantly different between groups. Because none of the obese women was Fe deficient,
only overweight women were included in the regression model. Also, because sTfR indicated
zero prevalence among the overweight and obese women, only SF was used as an Fe
biomarker in the model. The prevalence OR of ID (SF < 12 µg/l) in the overweight group was
< 1 and NS (OR = 0.3; 95%CI 0.04, 3.24; P = 0∙363). Adjusting for CRP level did not influence
the relationship (OR = 0.3; 95% CI 0.03, 2.99; P = 0.314). Conversely, the CED group was at a
significantly higher risk of ID than the normal‐weight group (OR = 7.1; 95%CI 1.41, 36.08; P =
0.017). The relationship remained significant after adjusting for CRP level (OR = 7.7; 95%CI
1.49, 39.96; P = 0.015).
Discussion and conclusion
Based on the studies suggesting that obesity may be a causal factor in the development of ID
in adults, one might expect that indications of poor Fe status would be observed in
overweight and obese adults, especially in settings where the double burden of malnutrition
Weight status and iron deficiency
Page | 43
and micronutrient deficiencies exists simultaneously (8). In the present study, we
investigated the association between weight status and ID among urban Malian women of
reproductive age. There was a lack of association between ID and BMI in overweight
women; the prevalence OR of ID was low and NS for overweight women, using normal
weight as reference; mean SF was not significantly different between overweight and
normal‐weight women; overweight women showed the lowest ID prevalence.
Study limitation
Limitations of the present study included the use of SF as a unique biomarker in the
regression model. SF may be elevated in inflammatory conditions even in the presence of
true ID, and therefore resulted in a misleadingly high ferritin concentration (18). Indeed, the
present results showed a trend of higher CRP and ferritin levels in the overweight and obese
groups than in the normal‐weight and CED groups, although this was not statistically
significant. sTfR concentration has been suggested as the best indicator for detecting true ID
because it is not influenced by infection or by inflammatory processes (22). Also, as indicated
by Looker et al. (23, 24), an individual must show an abnormal value for two or more
indicators to be considered Fe deficient. This did not apply to the present study because sTfR
concentration indicated zero prevalence of ID among overweight and obese groups and thus
was not included in the model.

Ch
ap
ter 2
Page | 44
Table 1. Characteristics of the women by weight category and mean comparison between CED, normal, overweight and obese groups* (Means values and standard deviations)
All groups (n=57) CED (n=9) Normal weight
(n=32) Overweight
(n=11) Obese (n=5) Mean comparison
Mean SD Mean SD Mean SD Mean SD Mean SD BMI (kg/m2) 23.4 4.9 17.6 0.7 21.9 1.98 27.2 1.2 34.9 3.4 Energy intake (kj/d) 8946 2432.7 9496 1814.4 9088 2297.4 8085 3536.4 8959 1096.2 P = 0.596 Iron intake (mg/d) 18.4 7.9 22.3 8.8 18.5 7.4 17.4 9.1 13.0 2.7 P = 0.209 PAiron 0.2 0.2 0.3 0.3 0.2 0.2 0.2 0.3 0.0 0.0 P = 0.107 Hb (g/l) 123 15 113 22 123 12 128 16 128 6 P = 0.123 SF (µg /l) 39.3 51.0 14.8 14.6 33.8 31.5 52.2 72.3 83.5 104.3 P = 0.004† sTfR (mg/l) 4.6 3.6 7.6 7.3 4.2 2.5 3.7 0.8 3.7 1.2 P = 0.094 CRP (mg/l) 2.4 3.6 1.3 2.5 2.0 3.9 3.8 3.4 3.7 2.4 P = 0.315 Iron status All groups CED Normal weight Overweight Obese Anemia (%)
Hb<12g/dl 35 44 38 36 0 P = 0.371 Iron deficiency (%)
SF<12µg/l 25 67 22 9 0 P = 0.008† sTfR>8.5mg/l 9 22 9 0 0 P = 0.310
Elevated CRP (%)CRP >7.5 mg/l 9 11 9 9 0 P = 0.906
PAiron probability of iron adequacy; SF serum ferritin; sTfR serum transferrin receptors; CRP C-reactive protein;
*Oneway ANOVA for means comparison and Pearson’ χ2 for comparison of proportions †P < 0.05
Weight status and iron deficiency
Page | 45
Nonetheless, SF has been indicated as the most specific biochemical test that correlates with
relative total body Fe stores. Looker et al. (24) reported that models including ferritin are
more likely to detect an early stage of ID. Indeed, low SF levels reflect depleted Fe stores and
hence are a precondition for ID in the absence of infection (17). In our model, a correction
has been made to reduce bias related to the use of ferritin by excluding three cases with
simultaneously high CRP and ferritin levels (> 65 mg/l), and by including CRP as a covariate in
the model.
The second limitation of the present study was the probability that under‐reporting of
dietary intake could have occurred, as indicated by the lowest energy intake of the
overweight group as compared to the normal‐weight and CED groups (non‐significantly
different though). Also, the prevalence of inadequate intake of Fe was almost 100% in the
obese group for a zero prevalence of ID. Dietary under‐reporting has been shown to be
particularly prevalent in obese subjects (25). In the present study, the interviewers were
carefully trained and supervised in order to minimise reporting errors, and it was not
possible to detect under‐reporting during food intake data collection.
Iron deficiency in overweight/obese
The results of the present study confirmed those of Karl et al. (10) who reported that
decreased Fe status was not associated with increasing adiposity among overweight and
overfat non‐obese American women. One hypothesis developed to explain the association
between high rates of ID among overweight individuals is that overweight may be associated
with lower Fe intake from a poor‐quality diet (26). The present study did not support this
hypothesis; mean Fe intake was not‐significantly different between weight categories. This
confirmed the results of previous studies which showed that dietary Fe intakes in overweight
adults were not lower than in normal‐weight individuals (5, 7).
A second hypothesis is that chronic inflammation and increased leptin production in obesity
increase hepcidin secretion from the liver (27) which, along with hepcidin produced by
adipose tissue (28), could reduce dietary Fe absorption (29). Recently, higher circulating
hepcidin concentrations have been associated with lower Fe status in overweight children
(30). Owing to the fact that obesity is an excess accumulation of body fat resulting in a
chronic inflammation condition (31), Karl et al. (10)suggested that a certain critical level of
relative body fat mass may be required to support an association between body composition

Chapter 2
Page | 46
and poor Fe status in obese adults. This might be applicable in the present study. In our
sample, none of the obese women was Fe deficient and although body fat was not assessed,
the mean BMI of overweight women (27 kg/m2) suggested that the level of body fat may not
be enough to induce the critical chronic inflammation level associated with obesity.
Although hepcidin level was not measured in the present study, the rate of chronic
inflammation observed among overweight women was 9% and the NS difference between
BMI categories showed that CRP was not associated with weight status. All this together
supported the assumption that the lack of association between ID and overweight in the
present study might be due to the fact that the fat mass in overweight women did not meet
the critical level needed to induce an inflammatory process, and thus the production of
hepcidin leading to the reduction of absorbed Fe. In addition, an inverse relationship has
been found between physical activity and weight gain, and it has been suggested that
physical inactivity could be another factor associated with ID in obesity (5), but this
assumption has not yet been tested in human subjects. McClung et al. (32) investigated the
effects of physical activity on moderate Fe‐deficient rats’ body composition. They reported
that moderate ID may cause increased body fat accretion, while physical activity attenuates
that effect. Physical activity was not measured in the present study but 90% of the women in
our sample are housewives, with activities such as cleaning the house, shopping at the
market, cooking and getting water (from the well). This indicates that the potential increase
of ID due to increased fat mass in overweight women could be attenuated by the physical
activity level of the women, but this hypothesis could not be verified with our data.
Iron deficiency in chronic energy deficiency
The present study showed that individuals in the CED group are significantly at risk of ID
using SF as the biomarker, although they apparently have the highest Fe intake as compared
to the other groups. However, the probability of Fe adequacy of the CED group (0.3)
indicated that the prevalence of inadequate intake is 70%, which is close to the observed
prevalence of ID in the group (67%). This confirms the recommendation that the estimate of
Fe inadequacy prevalence should agree with the prevalence of ID (20).

Weight status and iron deficiency
Page | 47
Conclusion and public health significance
The present study was the first exploratory research about association between ID and
weight status in an urban West African context. From a public health perspective, the study
revealed that ID, CED and obesity are all occurring at the public health level among women
of reproductive age in urban Mali. However, based on our sample, there were no ID cases
among obese women and no association between ID and weight status among overweight
women. This could be due to the fact that in our sample the excess of body fat might not be
critical to induce chronic inflammation related to reduced Fe absorption. Future research
based on larger convenience samples should be designed to further investigate associations
between overweight, obesity and ID in developing countries along with causal factors
related to this association.
Acknowledgements
This work was supported by the European Union under the project EU/INCO no. 0015043.
We acknowledge Lucy Okma and Joke Barendse (Wageningen University) for the help with
blood sample collection and handling; the authors also thank all the women for their
willingness to participate and their important contribution to the study. N. F.‐F. was
responsible for the proposal writing, data collection and analysis, and article writing; N. J. S.
collaborated in proposal writing and analysed data. Y. K. collaborated in data collection and
article refining; R. A. M. D. collaborated in refining the article; A. M.‐B. and I. D. B. refined
methodologies and the article; all authors read and approved the final content. The authors
declare no conflict of interest.

Chapter 2
Page | 48
References
1. McLean E, Egli I, Cogswell M, de Benoist B, Wojdyla D. Worldwide prevalence of anemia in preschool aged children, pregnant women and non‐pregnant women of reproductive age, in Nutritional Anemia, K Kraemer ,MB Zimmermann, Eds. 2007, Sight and Life Press: Basel. 1‐12.
2. Siervo M, Grey P, Nyan OA, al e. Urbanization and obesity in The Gambia: a country in the early stages of the demographic transition Eur J Clin Nutr, 2006. 60: 455‐463.
3. Sodjinou R, Agueh V, Fayomi B, al. e. Obesity and cardio‐metabolic risk factors in urban adults of Benin: relationship with socio‐economic status, urbanisation, and lifestyle patterns. BMC Public Health, 2008. 8.
4. Diarra M, Sy K, Cissé S. Nutrition et état nutritionnel (Nutrition and nutritional status), in Enquête Démographique et de Santé au Mali (EDSM‐III) (Demographic and Health Survey in Mali (DHS‐III)), M Ballo, S Traoré,I Niambélé, Eds. 2001, Macro International Inc Calverton, MD. 137‐164.
5. Lecube A, Carrera A, Losada E, Hernández C, Simó R, Mesa J. Iron deficiency in obese postmenopausal women. Obesity 2006. 14: 1724‐1730.
6. Menzie CM, Yanoff LB, Denkinger BI, McHugh T, Sebring NG, Calis KA, Yanovski JA. Obesity related hypoferremia is not explained by differences in reported intake of heme and nonheme iron or intake of dietary factors that can affect iron absorption. J Am Diet Assoc, 2008. 108: 145‐148.
7. Yanoff LB, Menzie CM, Denkinger B, Sebring NG, Calis KA, Yanovski JA. Inflammation and iron deficiency in the hypoferremia of obesity. Int J Obes, 2007. 31: 1412‐1419.
8. Zimmermann MB, Zeder C, Muthayya S, Winichagoon P, Chaouki N, Aeberli I, Hurrell RF. Adiposity in women and children from transition countries predicts decreased iron absorption, iron deficiency and a reduced response to iron fortification. Int J Obes, 2008. 32(7): 1098‐1104.
9. Flegal KM, Graubard BI, Williamson DF, Gail MH. Cause specific excess deaths associated with underweight, overweight, and obesity. JAMA 2007. 298: 2028‐2037.
10. Karl JP, Lieberman HR, Cable SJ, Williams KW, Glickman EL, Young AJ, McClung JP. Poor iron status is not associated with overweight or overfat in non‐obese pre‐menopausal women. J Am Coll Nutr, 2009. 28: 37‐42.
11. McClung JP, Karl JP. Iron deficiency and obesity: the contribution of inflammation and diminished iron absorption. Nutr Rev, 2009. 67: 100‐104.
12. UNICEF. Monitoring the Situation of Children and Women. Multiple indicator cluster survey manual 2005, 2006: Division of policy and planning, Plaza, New York.
13. Gibson R, Ferguson E, eds. An interactive 24‐hour recall for assessing the adequacy of iron and zinc intakes of developing countries. Technical monograph 8: Harvest Plus. 2008, IFPRI, IITA: Washington, DC.
14. Kennedy G, Fanou N, Seghieri C, Brouwer ID. Dietary diversity as a measure of the micronutrient adequacy of women’s diets: results from Bamako, Mali Site. , 2009, Food and Nutrition Technical Assistance II Project, Academy for Educational Development, Washington, DC: Available at http://www.fantaproject.org/downloads/pdfs/WDDP_Mali_Dec09.pdf, Downloaded Nov 07, 2011.
15. WHO. Physical Status: The Use and Interpretation of Anthropometry. Report of WHO Expert Committee, 1995, WHO: Geneva
16. Geissler C, Powers H. Human Nutrition. 2005, London: Churchill Livingstone. 17. WHO/UNICEF/UNU. Iron Deficiency Anemia Assessment, Prevention, and Control, 2001, World
Health Organization: Geneva. 18. Fitzsimons EJ, Brock JH. The anaemia of chronic disease. BMJ 2001. 322: 811‐812. 19. Shine B, de Beer FC, Pepys MB. Solid phase radioimmunoassays for human C‐reactive protein. Clin
Chim Acta, 1981. 117: 13‐23. 20. Murphy SP. Using DRIs for dietary assessment. Review article. Asia Pac J Clin Nutr, 2008. 17:
299S1‐301S1.

Weight status and iron deficiency
Page | 49
21. IOM. Dietary Reference Intake for Vitamin A, Vitamin K, Arsenic, Boron, Chromium, Copper, Iodine, Iron, Manganese, Molybdenum, Nickel, Silicon, Vanadium and Zinc, 2001, National Academy Press: Washington, DC.
22. Baillie FJ, Morrison AE, Fergus I. Soluble transferrin receptor: a discriminating assay for iron deficiency. Clin Lab Haematol, 2003. 25: 353‐357.
23. Looker AC, Dallman PR, Carroll MD, Gunter EW, Johnson CL. Prevalence of iron deficiency in the United States. JAMA, 1997. 277: 973‐976.
24. Looker AC, Gunter EW, Johnson CL. Methods to assess iron status in various NHANES studies. Nutr Rev, 1995. 53: 246‐254.
25. Black AE. Critical evaluation of energy intake using the Goldberg cut‐off for energy intake: basal metabolic rate. A practical guide to its calculation, use and limitations. Int J Obes, 2000. 24: 1119‐1130.
26. Seltzer CC, Mayer J. Serum iron and iron‐binding capacity in adolescents 2.Comparison of obese and nonobese subjects. Am J Clin Nutr, 1963. 13: 354‐357.
27. Chung B, Matak P, McKie AT, Sharp P. Leptin increases the expression of the iron regulatory hormone hepcidin in HuH7 human hepatoma cells. J Nutr, 2007. 137: 2366‐2370.
28. Bekri S, Gual P, Anty R, Luciani N, Dahman M, Ramesh B, Iannelli A, Staccini‐Myx A, Casanova D, Ben Amor I, Saint‐Paul MC, Huet PM, Sadoul JL, Gugenheim J, Srai SK, Tran A, Le Marchand‐Brustel Y. Increased adipose tissue expression of hepcidin in severe obesity is independent from diabetes and NASH. Gastroenterology 2006. 131: 788‐796.
29. Laftah AH, Ramesh B, Simpson RJ, Solanky N, Bahram S, Schümann K, Debnam ES, Srai SK. Effect of hepcidin on intestinal iron absorption in mice. Blood 2004. 103(10): 3940‐3944.
30. Aeberli I, Hurrell RF, Zimmermann MB. Overweight children have higher circulating hepcidin concentrations and lower iron status but have dietary iron intakes and bioavailability comparable with normal weight children. Int J Obes, 2009. 33: 1111‐1117.
31. Greenberg AS, Obin MS. Obesity and the role of adipose tissue in inflammation and metabolism. Am J Clin Nutr, 2006. 83: S461‐465.
32. McClung JP, Andersen NE, Tarr TN, Stahl CH, Young AJ. Physical activity prevents augmented body fat accretion in moderately iron‐deficient rats. J Nutr, 2008. 138(7): 1293‐1297.

Chapter 3
Food groups associated with a composite measure of probability of adequate
intake of 11 micronutrients in the diets of women
in urban Mali
Gina Kennedy, Nadia Fanou-Fogny, Chiara Seghieri, Mary Arimond, Yara
Koreissi, Romain Dossa†, Frans J. Kok, Inge D. Brouwer
Journal of Nutrition 2010; 140:2070S-2078S

Chapter 3
Page | 52
Abstract
The prevalence of micronutrient deficiency is high among women of reproductive age living
in urban Mali. Despite this, there are little data on the dietary intake of micronutrients
among women of reproductive age in Mali. This research tested the relationship between
the quantity of intake of 21 possible food groups and estimated usual micronutrient (folate,
vitamin B‐12, calcium, riboflavin, niacin, vitamin A, iron, thiamin, vitamin B‐6, vitamin C, and
zinc) intakes and a composite measure of adequacy of 11 micronutrients [mean probability
of adequacy (MPA)] based on the individual probability of adequacy (PA) for the 11
micronutrients. Food group and micronutrient intakes were calculated from 24‐h recall data
in an urban sample of Malian women. PA was lowest for folate, vitamin B‐12, calcium, and
riboflavin. The overall MPA for the composite measure of 11 micronutrients was 0.47 ± 0.18.
Grams of intake from the nuts/seeds, milk/yogurt, vitamin A rich dark green leafy vegetables
(DGLV), and vitamin C‐rich vegetables food groups were correlated (Spearman’s rho = 0.20–
0.36; P < 0.05) with MPA. Women in the highest consumption groups of nuts/seeds and
DGLV had 5‐ and 6‐fold greater odds of an MPA > 0.5, respectively. These findings can be
used to further the development of indicators of dietary diversity and to improve
micronutrient intakes of women of reproductive age.
Food groups and micronutrient adequacy
Page | 53
Introduction
Micronutrient malnutrition is a global public health problem; it undermines the health,
development, and economic potential of millions of people worldwide. Women of
reproductive age are among the most vulnerable to micronutrient deficiencies due to
physiologically higher micronutrient requirements during the reproductive life stage (1). The
impact of poor maternal micronutrient status is transmitted intergenerationally from
mother to child, resulting in less optimal fetal growth and development (2). In Bamako, Mali,
it is estimated that 54% of women 15–49 y with a child under 5 y suffer from anemia (3) and
that the Mali national gross domestic product is decreased by 2.7% due to vitamin and
mineral deficiencies (4). Food‐based approaches have been cited as one of the primary
means to improve micronutrient status and control other problems related to poor diet
quality (5). However, women’s dietary intake receives insufficient attention in many
developing countries. In Mali, there are no nationally representative data on women’s food
intake. Available dietary intake information is often fragmented and, due to diverse data
collection methodologies, cannot be compared internationally or over time within the same
country. This is partly due to the fact that collecting information on dietary intake is costly
and time consuming. The challenges of collecting accurate quantitative information on
dietary intake can be even greater in developing countries, where literacy levels are low,
restricting the types of survey instruments that can be used (6). In addition, shared‐plate
eating requires adaptation of survey instruments and additional time for data collection (7).
Because of the challenges associated with quantitative dietary data collection, simpler
methods yielding information on dietary intake are needed. Simple counts of the number of
food groups consumed have been shown in developing country settings to be adequate
proxy indicators of micronutrient intake among children (8‐12) and also among adults in
diverse settings (13‐15). Although the use of food group diversity indicators (FGI)1 has shown
promise in different settings, methodologies for indicator construction have varied (16). For
infants and children aged 6–23 mo, the WHO (17) has defined a FGI that sums 7 food groups.
For older children and adults, there is currently no standard indicator and no consensus on
the level of aggregation of foods or number of food groups to sum when creating FGI. This
1 Abbreviations used: AI, adequate intake; DGLV, vitamin A‐rich dark, green, leafy vegetables; EAR, estimated average requirement; FGI, food group diversity,indicator; MPA, mean probability of adequacy; PA, probability
Chapter 3
Page | 54
study used 2 non consecutive days of 24‐h dietary recall to examine the correlation between
a set of 6 and 21 food groups, micronutrient intakes, and mean probability of adequacy
(MPA), a summary measure of probability of adequacy (PA) across 11 micronutrients, among
a sample of women of reproductive age in Bamako, Mali. The results highlight specific food
groups that may have potential to improve the micro‐nutrient adequacy of the diet of
women of reproductive age in Mali and help to advance knowledge about FGI construction.
Materials and Methods
The data used in this study are from a cross‐sectional food consumption survey undertaken
as part of the FONIO project funded by the Sixth European Union Framework Program. Some
results presented in this paper were part of a multi‐site study, the Women’s Dietary
Diversity Project (WDDP), funded by the Food and Nutrition Technical Assistance II Project
and its predecessor project, Food and Nutrition Technical Assistance. Full results of the Mali
site report are available elsewhere (18). The main objective of the WDDP was to analyze the
relationship between simple FGI and the micronutrient adequacy of the diet of women in
resource‐poor settings. A standardized protocol used by all collaborators specified the
micronutrients of focus (folate, vitamin B‐12, calcium, riboflavin, niacin, vitamin A, iron,
thiamin, vitaminB‐6, vitamin C, and zinc) and provided standardized methods for indicator
construction and calculation of PA. A description of the research protocol can be found in
the summary paper in this supplement (14).
Study site and sampling methodology. Study participants were women 15–49y living in
Bamako, Mali. Ethical clearance for the study was obtained from National Institute of Public
Health Research in Mali. All women included in the study were informed of the study
purpose and provided verbal consent.
A total sample size of 108 women was calculated based on the original FONIO objective to
provide an estimate of iron intake. Five women dropped out of the survey sample, leaving
103 women with dietary intake data available from the first recall. Of the 103 women with
dietary intake from the first recall, 6 did not participate in the second recall due to
unavailability. During analysis, 1 woman was considered a severe outlier and was deleted
of adequacy; RE, retinol equivalent; TACAM, Table de Composition des aliments du Mali; WDDP, Women’s

Food groups and micronutrient adequacy
Page | 55
from analysis, leaving a total sample of 102 women with 1d of intake data and a subsample
of 96 women with 2 non consecutive days of recall.
Women were selected using a 3‐stage cluster sampling method (19). The initial sampling
frame consisted of Bamako’s 72 quarters; 12 were selected for sampling using probability
proportional to size. In each selected quarter, 9 households were randomly selected using
the random walk method. All women aged 15–49y living in the selected households were
listed, and1apparently healthy nonpregnant, nonlactating woman belonging to a Malian
sociolinguistic group was randomly selected from eligible women in each household. If the
selected woman was not responsible for food preparation on the recall day, amounts of
ingredients used in recipes were obtained from the person responsible for meal preparation
on the recall day.
Dietary intake data collection. Two 24‐h dietary recalls were performed from February to
April 2007, which corresponds to the postharvest season. The 2 recalls were from non
consecutive days with 2–11 d separating the recall periods. Weekends and special event
days were excluded. The participants’ daily food intake was assessed by a quantitative 24‐h
recall method adapted to the context of shared‐plate eating, which involved asking the
respondent to use known‐weight utensils on the recall day to help them visualize the
amount of food consumed (7). Participants were asked to name all the food and drinks
consumed during the preceding day, including anything consumed outside the home. Then
they were asked to describe ingredients and cooking methods of any mixed dishes and the
place and time of consumption. Finally, the amounts of all foods, beverages, and ingredients
of mixed dishes were estimated either in household units or monetary value2. For meals
consumed within the household, the total amount of the cooked food and the amount
consumed by the respondent were estimated in household units to derive the proportion
consumed by the respondent from the total volume of the dish. Food weights were
measured using digital dietary scales (Soehnle, Plateau Art, model 65086, 10 kg maximum)
and recorded to the nearest 2g. Information on consumption of fortified food products was
not collected. However, most of the fortified foods commonly available in the study area are
Dietary Diversity Project; YORV, vitamin A‐rich deep yellow, orange, and red vegetables. 2 When a monetary unit was used to describe a portion, these foods or ingredients were converted from monetary value to weight equivalent by using the mean weight per fixed monetary value obtained from several vendors in the main market areas
Chapter 3
Page | 56
designed for infants and preschool children. These foods were not consumed by any of the
women in our study.
Food composition data. The food composition values used in this study are based on a food
composition table developed for a larger project (a detailed description of the food
composition table’s development is provided elsewhere (20)) and relied primarily on the
Table de Composition des aliments du Mali (TACAM) (21). The nutrients for all staple foods
in TACAM are expressed as cooked. To account for nutrient losses during cooking in other
foods where only raw values are provided in TACAM, such as fish, meat, and vegetables,
USDA Retention Factors release 6 (22) were applied to the nutrient values of the raw foods.
Twelve percent of the nutrient values were not in TACAM3, including 10 foods for which all
values were taken from other sources. For other foods, missing values were replaced most
commonly for vitamin B‐6, folate, and zinc. Missing values were first obtained from USDA
release 20 (23) and, if necessary, from the International Mini List (24). Retinol equivalents
(RE) were calculated as the sum of retinol and β‐carotene, using the following conversions: 1
mg retinol = 1 mg RE and 1 mg beta‐carotene = 0.167 mg RE, as recommended by the
FAO/WHO (1). Nutrient values from sources other than the TACAM were adjusted to
account for differences in moisture content4.
Food groups and food group intakes. Food group combinations based on 6 and 21 food
groups were used in this analysis (Table 1). For simplicity of presentation, results from only
the most disaggregated set of food groups (21 food groups) are presented in most tables
and figures. Notable results based upon the least disaggregated set of food groups (6 food
groups) are described in the text. Construction of FGI was based on food group intakes
(grams) reported on only the first day of recall to coincide with the overall aim of the WDDP
to test 1‐d FGI that could be used in large‐scale surveys.
3 Vitamin B‐6 values reported for cooked staples in the Table de Composition des aliments du Mali were very low, so vitamin B‐6 values for cooked staples from the USDA and International Mini List were used. 4 International Mini List tables do not report moisture content. The moisture content for foods taken from the International Mini List was estimated based on the closest food match from the USDA.
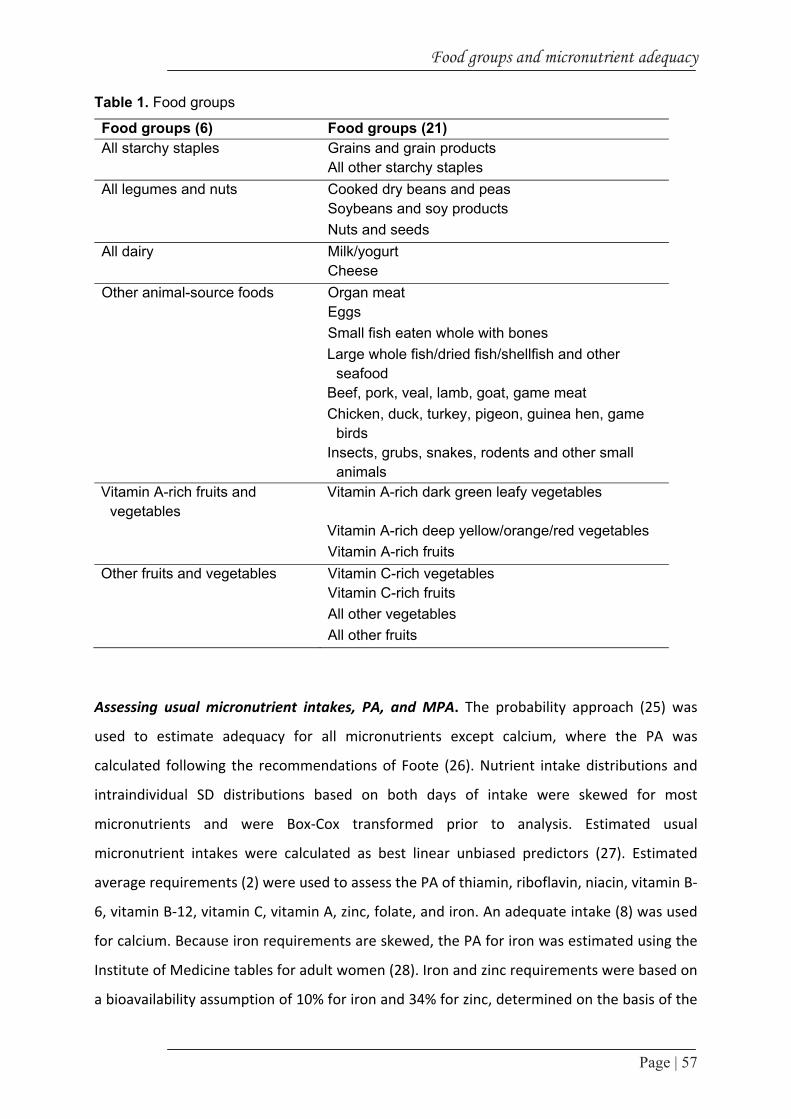
Food groups and micronutrient adequacy
Page | 57
Table 1. Food groups
Food groups (6) Food groups (21)All starchy staples Grains and grain products All other starchy staplesAll legumes and nuts Cooked dry beans and peas Soybeans and soy products Nuts and seedsAll dairy Milk/yogurt CheeseOther animal-source foods Organ meat Eggs Small fish eaten whole with bones Large whole fish/dried fish/shellfish and other
seafood Beef, pork, veal, lamb, goat, game meat Chicken, duck, turkey, pigeon, guinea hen, game
birds Insects, grubs, snakes, rodents and other small
animals Vitamin A-rich fruits and
vegetables Vitamin A-rich dark green leafy vegetables
Vitamin A-rich deep yellow/orange/red vegetables Vitamin A-rich fruitsOther fruits and vegetables Vitamin C-rich vegetables Vitamin C-rich fruits All other vegetables All other fruits
Assessing usual micronutrient intakes, PA, and MPA. The probability approach (25) was
used to estimate adequacy for all micronutrients except calcium, where the PA was
calculated following the recommendations of Foote (26). Nutrient intake distributions and
intraindividual SD distributions based on both days of intake were skewed for most
micronutrients and were Box‐Cox transformed prior to analysis. Estimated usual
micronutrient intakes were calculated as best linear unbiased predictors (27). Estimated
average requirements (2) were used to assess the PA of thiamin, riboflavin, niacin, vitamin B‐
6, vitamin B‐12, vitamin C, vitamin A, zinc, folate, and iron. An adequate intake (8) was used
for calcium. Because iron requirements are skewed, the PA for iron was estimated using the
Institute of Medicine tables for adult women (28). Iron and zinc requirements were based on
a bioavailability assumption of 10% for iron and 34% for zinc, determined on the basis of the

Chapter 3
Page | 58
dietary pattern of the sample (1). The PA associated with estimated usual intake for each
micronutrient was calculated taking into account nutrient requirement distributions and
inter‐and intra‐individual variation in intake. MPA was constructed as a summary indicator,
taking the mean of all PA.
Statistical methods. The relationship between food group intake (grams) and estimated
usual micronutrient intake and food group intake and MPA was assessed by Spearman
correlation due to the fact that food group intake (grams) was not normally distributed and
was untransformed. For food groups observed to have a significant correlation with MPA, a
categorical variable of food group intake was created. Categories of intake were defined as
follows: 1) for those food groups for which all women consumed at least 1 g, a low, middle,
and high consumer category was created based on tertiles of food group intake; 2) for other
food groups, the low intake category was defined as an intake of 0 g and the middle and high
intake categories defined by using the median intake among consumers as the cutpoint.
Binary logistic regression models were used to assess these categorical food group intake
variables as predictors of MPA > 0.50. Because energy intake from individual food groups,
most notably nuts/seeds, is endogenous to the model, logistic regression models controlled
for total energy intake from other food groups and age. However, results were not
influenced by age in any model. Therefore, only results unadjusted for age are presented.
STATA/IC version 10 was used for all analyses (29). P < 0.05 was considered significant.
Values in the text are means ± SD or medians (25th and 75th interquartile range).
Results
Sample characteristics. The mean age in the sample was 31 ± 10.5y, with 16% adolescents
(15–18y) (Table 2). The literacy rate, defined as having attended primary school or Islamic
school, was 65%. Median energy intake was 8474 kJ (2024kcal) (6753 kJ, 10,521 kJ), with
11% of dietary energy from protein, 57% from carbohydrates, and 32% from fat.
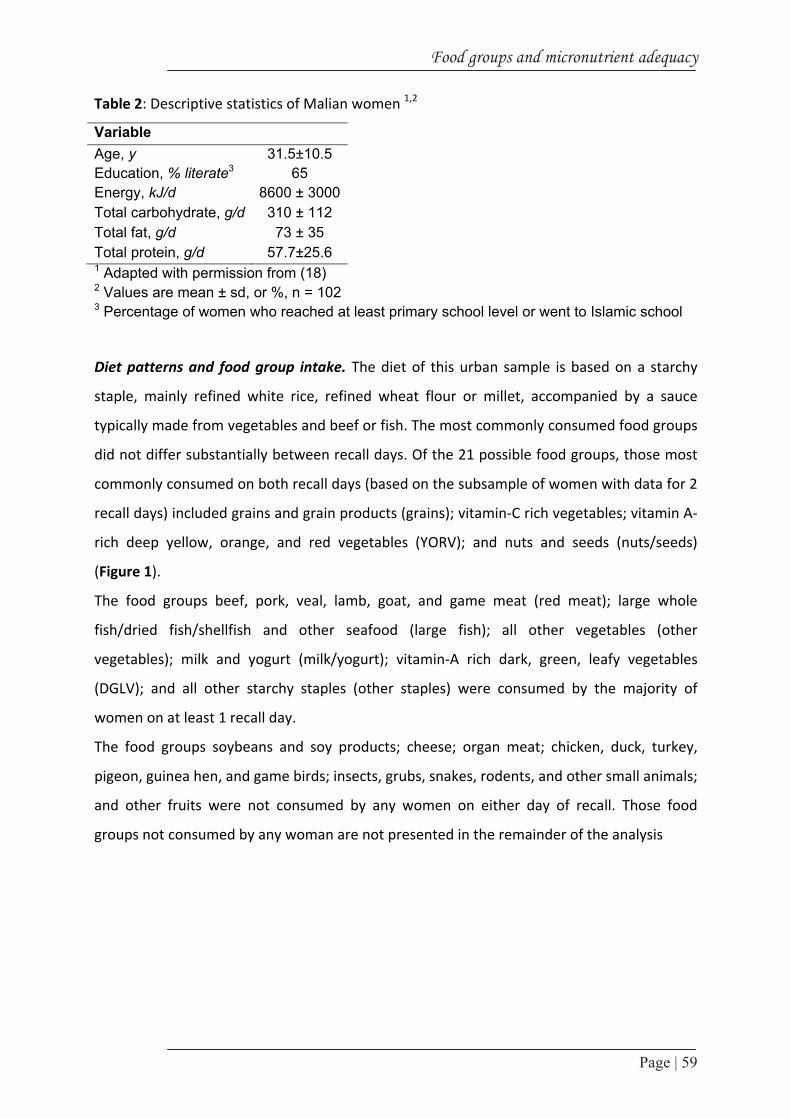
Food groups and micronutrient adequacy
Page | 59
Table 2: Descriptive statistics of Malian women 1,2
Variable Age, y 31.5±10.5Education, % literate3 65 Energy, kJ/d 8600 ± 3000Total carbohydrate, g/d 310 ± 112Total fat, g/d 73 ± 35 Total protein, g/d 57.7±25.61 Adapted with permission from (18) 2 Values are mean ± sd, or %, n = 102 3 Percentage of women who reached at least primary school level or went to Islamic school
Diet patterns and food group intake. The diet of this urban sample is based on a starchy
staple, mainly refined white rice, refined wheat flour or millet, accompanied by a sauce
typically made from vegetables and beef or fish. The most commonly consumed food groups
did not differ substantially between recall days. Of the 21 possible food groups, those most
commonly consumed on both recall days (based on the subsample of women with data for 2
recall days) included grains and grain products (grains); vitamin‐C rich vegetables; vitamin A‐
rich deep yellow, orange, and red vegetables (YORV); and nuts and seeds (nuts/seeds)
(Figure 1).
The food groups beef, pork, veal, lamb, goat, and game meat (red meat); large whole
fish/dried fish/shellfish and other seafood (large fish); all other vegetables (other
vegetables); milk and yogurt (milk/yogurt); vitamin‐A rich dark, green, leafy vegetables
(DGLV); and all other starchy staples (other staples) were consumed by the majority of
women on at least 1 recall day.
The food groups soybeans and soy products; cheese; organ meat; chicken, duck, turkey,
pigeon, guinea hen, and game birds; insects, grubs, snakes, rodents, and other small animals;
and other fruits were not consumed by any women on either day of recall. Those food
groups not consumed by any woman are not presented in the remainder of the analysis
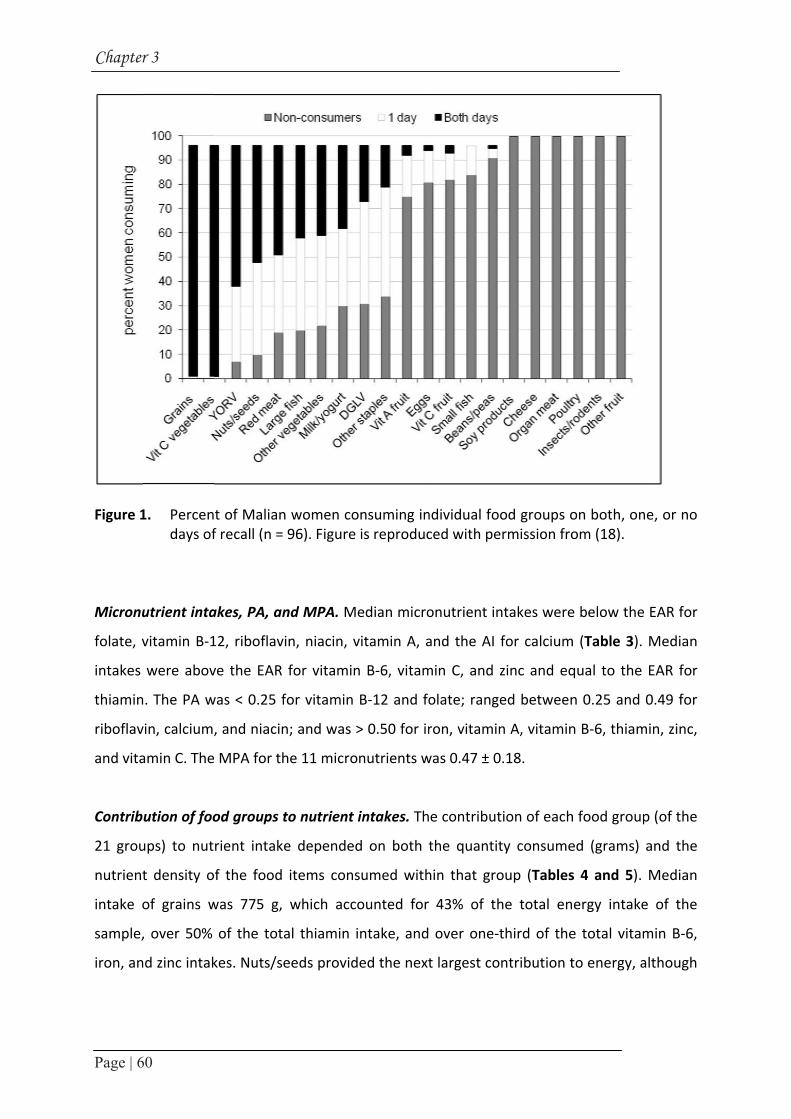
Chapter
Page | 6
Figure 1
Micronu
folate, v
intakes
thiamin
riboflav
and vita
Contrib
21 grou
nutrient
intake o
sample,
iron, an
r 3
60
1. Percendays of
utrient inta
vitamin B‐1
were abov
n. The PA w
vin, calcium,
amin C. The
ution of foo
ups) to nut
t density o
of grains w
, over 50%
nd zinc intak
t of Malianf recall (n =
akes, PA, an
12, riboflavi
ve the EAR
was < 0.25 f
, and niacin
MPA for th
od groups t
rient intake
f the food
was 775 g,
of the tota
kes. Nuts/se
women co96). Figure
nd MPA. M
in, niacin, v
for vitamin
for vitamin
n; and was >
he 11 micro
to nutrient
e depended
items cons
which acco
al thiamin i
eeds provid
onsuming inis reproduc
edian micro
vitamin A, a
n B‐6, vitam
B‐12 and fo
> 0.50 for ir
nutrients w
intakes. Th
d on both t
sumed with
ounted for
intake, and
ded the next
ndividual fooced with pe
onutrient in
and the AI
min C, and z
olate; range
ron, vitamin
was 0.47 ± 0
e contribut
the quantit
hin that gro
43% of th
over one‐t
t largest co
od groups ormission fro
ntakes were
for calcium
zinc and eq
ed between
n A, vitamin
0.18.
tion of each
ty consume
oup (Tables
he total en
third of the
ntribution t
on both, onom (18).
e below the
m (Table 3).
qual to the
n 0.25 and
n B‐6, thiam
h food group
ed (grams)
s 4 and 5).
nergy intake
e total vitam
to energy, a
ne, or no
e EAR for
Median
EAR for
0.49 for
min, zinc,
p (of the
and the
Median
e of the
min B‐6,
although
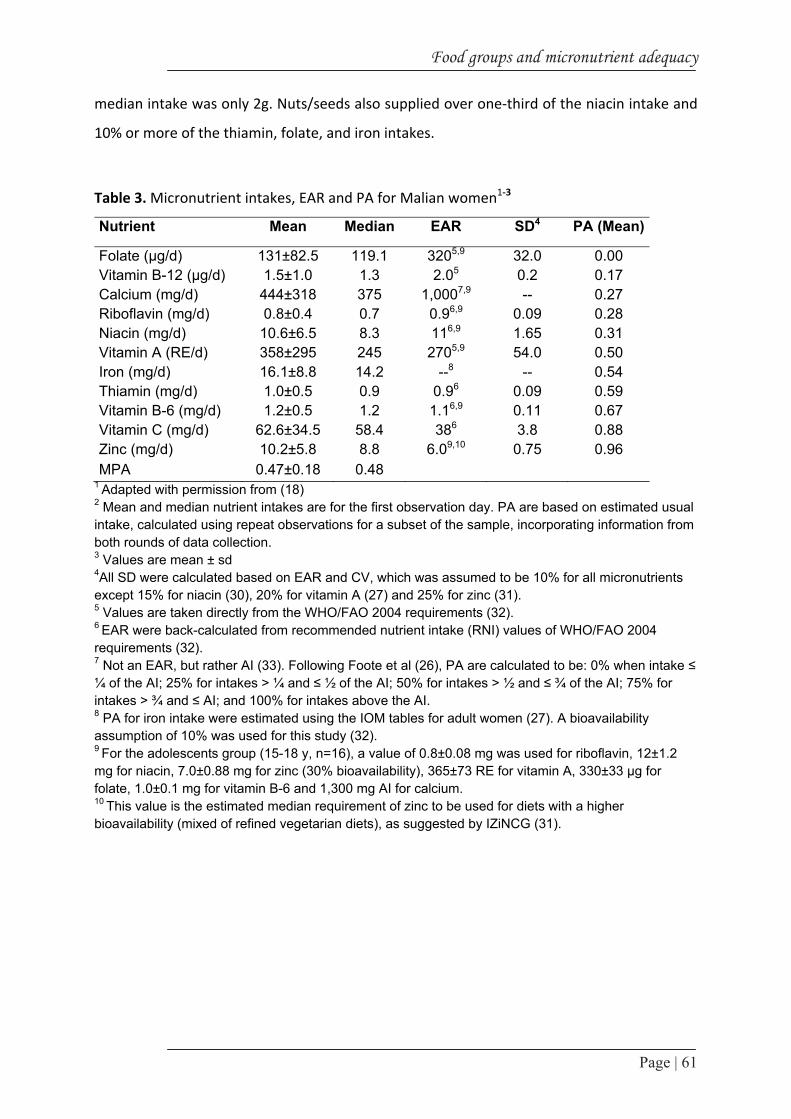
Food groups and micronutrient adequacy
Page | 61
median intake was only 2g. Nuts/seeds also supplied over one‐third of the niacin intake and
10% or more of the thiamin, folate, and iron intakes.
Table 3. Micronutrient intakes, EAR and PA for Malian women1‐3
Nutrient Mean Median EAR SD4 PA (Mean)
Folate (μg/d) 131±82.5 119.1 3205,9 32.0 0.00 Vitamin B-12 (μg/d) 1.5±1.0 1.3 2.05 0.2 0.17 Calcium (mg/d) 444±318 375 1,0007,9 -- 0.27 Riboflavin (mg/d) 0.8±0.4 0.7 0.96,9 0.09 0.28 Niacin (mg/d) 10.6±6.5 8.3 116,9 1.65 0.31 Vitamin A (RE/d) 358±295 245 2705,9 54.0 0.50 Iron (mg/d) 16.1±8.8 14.2 --8 -- 0.54 Thiamin (mg/d) 1.0±0.5 0.9 0.96 0.09 0.59 Vitamin B-6 (mg/d) 1.2±0.5 1.2 1.16,9 0.11 0.67 Vitamin C (mg/d) 62.6±34.5 58.4 386 3.8 0.88 Zinc (mg/d) 10.2±5.8 8.8 6.09,10 0.75 0.96 MPA 0.47±0.18 0.48
1 Adapted with permission from (18) 2 Mean and median nutrient intakes are for the first observation day. PA are based on estimated usual intake, calculated using repeat observations for a subset of the sample, incorporating information from both rounds of data collection. 3 Values are mean ± sd
4All SD were calculated based on EAR and CV, which was assumed to be 10% for all micronutrients except 15% for niacin (30), 20% for vitamin A (27) and 25% for zinc (31). 5 Values are taken directly from the WHO/FAO 2004 requirements (32). 6 EAR were back-calculated from recommended nutrient intake (RNI) values of WHO/FAO 2004 requirements (32). 7 Not an EAR, but rather AI (33). Following Foote et al (26), PA are calculated to be: 0% when intake ≤ ¼ of the AI; 25% for intakes > ¼ and ≤ ½ of the AI; 50% for intakes > ½ and ≤ ¾ of the AI; 75% for intakes > ¾ and ≤ AI; and 100% for intakes above the AI. 8 PA for iron intake were estimated using the IOM tables for adult women (27). A bioavailability assumption of 10% was used for this study (32). 9 For the adolescents group (15-18 y, n=16), a value of 0.8±0.08 mg was used for riboflavin, 12±1.2 mg for niacin, 7.0±0.88 mg for zinc (30% bioavailability), 365±73 RE for vitamin A, 330±33 μg for folate, 1.0±0.1 mg for vitamin B-6 and 1,300 mg AI for calcium. 10 This value is the estimated median requirement of zinc to be used for diets with a higher bioavailability (mixed of refined vegetarian diets), as suggested by IZiNCG (31).

Ch
ap
ter 3
Page | 62
Table 4. Intake of food groups by Malian women 1,2
Food group All women (n=102) Consumers Consumers only g/d % g/dGrains (g/d) 743±333 775.5 (497,958) 100 743±333 775.5 (497,958) Other staples (g/d) 61±93 0 (0,92) 42 144±103 124 (81,176) Beans/peas (g/d) 5±5 0 (0,0) 4 134±76 121.5 (67,212) Nuts/seeds (g/d) 37±37 2 (0,80) 70 53±56 25 (2,99) Milk/yogurt (g/d) 75±136 0 (0,86) 48 155±161 94 (35,287.5)
Red meat3 (g/d) 42±38 41.5 (0,67) 70 61±31 52 (40,81) Large fish4 (g/d) 25±38 12 (0,38) 56 45±41 35 (19,56.5) Small fish5 (g/d) 0.3±2 0 (0,0) 5 6±4 5 (3,10)Eggs (g/d) 4±15 0 (0, 0) 8 52±16 57.5 (55,60) DGLV6 (g/d) 30±56 0 (0,25) 41 73±67 87.5 (7,125) YORV7 (g/d) 8±9 5 (3,8) 82 9±9 5 (4,9)Vitamin C-rich vegetables (g/d) 212±115 209.5 (121,283) 100 212±115 209.5 (121,283) All other vegetables (g/d) 16±22 11 (0,26) 60 27±22 24 (14.5,35) Vitamin A-rich fruits (g/d) 4±13 0 (0,0) 12 32±24 20 (13,50.5) Vitamin C-rich fruits (g/d) 15±68 0 (0,0) 9 167±174 42 (12.5,357)
1Values are mean±sd or median (interquatile range) 2Adapted with permission from (18) 3 Beef, pork, veal, lamb, goat, game meat 4 Large whole fish/dried fish, shellfish and other seafood 5 Small fish eaten whole with bones 6 Vitamin A-rich DGLV 7 Vitamin A-rich YORV

Page | 63
Fo
od
gro
up
s an
d m
icron
utrien
t ad
equ
acy
Table 5. Contribution of food groups (21) to energy and micronutrient intakes1‐3
Food groups Energy Folate Vitamin B-12
Calcium Riboflavin Niacin Vitamin A
Iron Thiamin Vitamin B-6
Vitamin C
Zinc
(%)
Grains 43.0 8.8 0.24 10.5 24.8 14.7 3.3 40.3 53.0 35.1 0.8 39.4
Other staples 3.1 6.1 1.5 2.0 5.9 1.3 2.2 5.9 12.9 15.0 1.2
Beans/peas 0.2 8.3 0.3 0.4 0.2 0.8 1.1 0.4 0.7
Nuts/seeds 10.3 13.0 5.6 6.2 37.5 0.1 17.6 10.6 8.3 9.0
Milk/yogurt 4.6 5.0 30.4 43.4 29.4 4.4 20.2 0.3 5.0 3.6 0.9 19.5
Red meat 4.8 1.6 30.6 1.0 8.4 14.4 9.4 6.9 4.3 17.0
Large fish 2.0 2.3 31.1 5.7 3.7 6.9 0.4 4.5 1.7 5.3 0.4 3.8
Small fish 0.1 0.5 0.7 0.2 0.1 0.2 0.1
Eggs 0.3 0.6 4.1 0.4 1.5 0.1 1.7 0.5 0.4 0.5 0.6
DGLV 0.4 12.2 10.6 7.3 2.1 35.7 5.8 2.3 3.3 6.4 1.2
YORV 0.2 1.8 0.5 0.8 1.5 11.6 1.0 1.1 2.1 0.6 0.4
Vitamin C-rich vegetables 3.9 33.0 17.1 11.7 8.8 12.3 14.1 8.8 17.0 66.5 6.2
All other vegetables 0.1 1.9 0.5 1.0 0.5 3.5 0.6 0.9 1.3 1.8 0.4
Vitamin A-rich fruits 0.5 0.1 0.1 0.1 0.1 7.5 0.1 0.1 0.1 2.1
Vitamin C-rich fruits 0.6 2.2 0.3 0.6 0.8 0.6 0.1 0.5 3.9 2.7 0.3
1 Reproduced with permission from (18). 2 Percentages might not total 100 due to nutrient contributions from foods excluded from the groups comprising the FGI (e.g., fats, sweets, alcohol). 3 Empty cells mean no contribution. 4 This value comes from butter croissant (0.16 μg/100 g).

Chapter 3
Page | 64
The median intake of vitamin C‐rich vegetables, which included cabbage, tomatoes, and
onions, was 209 g. This food group supplied two‐thirds of the vitamin C intake, one‐third of
the folate intake, and over 10% of the riboflavin, vitamin B‐6, vitamin A, and iron intakes.
Milk/yogurt supplied only 5% of the energy intake but .20% of the riboflavin, vitamin B‐12,
vitamin A, and calcium intakes. Eggs did not supply > 5% of the intake for any micronutrient.
Red meat supplied < 5% of the total energy intake but one‐third of the vitamin B‐12 intake
and > 10% of the niacin and zinc intakes. DGLV supplied < 1% of the total energy intake but
36% of the vitamin A intake and 10% or more of the folate and calcium intakes.
Correlations between grams of intake from individual food groups, micronutrient intakes,
and MPA. When using the highest level of food group aggregation (6 food groups), intake
(grams) for each food group was positively correlated with estimated usual intakes (mg, µg,
or RE) of between 4 and 7 individual micronutrients (P < 0.001–0.01) and with MPA (P <
0.001–0.01) (Table 6). With further disaggregation into 21 food groups, associations became
more specific to certain subgroups. Grams of intake from the food groups nuts/seeds,
milk/yogurt, DGLV, and vitamin C‐rich vegetables were significantly correlated with intakes
(mg, µg, or RE) of 5 or more individual micronutrients (Table 7) and with MPA (P < 0.001 ‐
0.01). The 3 micronutrients with the lowest PA were folate, vitamin B‐12, and calcium.
Beans/peas, nuts/seeds, DGLV, and vitamin C‐rich vegetables were significantly correlated
with folate intakes (micrograms); milk/yogurt, eggs, and red meat were significantly
correlated with vitamin B‐12 intakes (micrograms); and milk/yogurt was significantly
correlated with calcium intakes (milligrams).

Fo
od
gro
up
s an
d m
icron
utrien
t ad
equ
acy
Page | 65
Table 6. Correlations between intakes of 6 food groups (g/d) and estimated usual micronutrient intakes or MPA1
Food group Folate Vitamin B-12
Calcium Riboflavin Niacin Vitamin A
Iron Thiamin Vitamin B-6
Vitamin C
Zinc MPA
µg mg RE mg
All starchy staples 0.13 -0.08 0.12 0.11 0.17 -0.04 0.34* 0.47* 0.50* 0.22* 0.40* 0.25*
Legumes and nuts 0.42* -0.03 0.13 0.15 0.56* 0.13 0.37* 0.36* 0.21* -0.01 0.27* 0.35*
All dairy 0.10 0.50* 0.54* 0.49* -0.01 0.36* -0.09 0.02 0.01 -0.02 0.28* 0.25*
Other animal source foods 0.22* 0.55* 0.26* 0.32* 0.18 0.15 0.11 0.22* 0.15 0.28* 0.22* 0.27*
Vitamin A rich fruits and vegetables
0.43* 0.05 0.13 0.19 0.19 0.55* 0.17 0.09 0.21* 0.29* 0.09 0.28*
Other fruits and vegetables 0.26* 0.05 0.08 0.14 0.16 0.02 0.19 0.29* 0.35* 0.36* 0.20* 0.22*
1Estimated usual micronutrient intakes and MPA incorporate information from both rounds of data collection * P < 0.05

Ch
ap
ter 3
Page | 66
Table 7. Correlations between intakes of 21 (g/d) food groups and estimated usual micronutrient intakes and MPA1
Food group (g) Folate Vitamin B-12 Calcium Riboflavin Niacin Vitamin
A Iron Thiamin Vitamin B-6
Vitamin C Zinc MPA
µg mg RE mg
Grains 0.09 -0.11 0.09 0.07 0.15 -0.11 0.33* 0.44* 0.44* 0.17 0.39* 0.19
Other staples 0.14 0.09 0.09 0.11 0.01 0.24 0.00 0.06 0.19 0.21* 0.03 0.14
Beans/peas 0.30* -0.06 -0.09 -0.11 -0.03 0.02 0.04 0.02 -0.08 -0.17 0.05 -0.05
Nuts/seeds 0.29* -0.02 0.16 0.18 0.57* 0.12 0.35* 0.37* 0.24* 0.05 0.24* 0.36*
Milk/yogurt 0.10 0.50* 0.54* 0.49* -0.01 0.36* -0.09 0.24 0.01 -0.02 0.28* 0.25*
Eggs 0.10 0.25* 0.10 0.14 -0.09 0.17 -0.12 -0.07 -0.00 0.05 -0.15 0.09
Small fish 0.10 0.00 0.02 0.02 0.19 0.07 0.18 0.00 0.17 0.07 0.13 0.08
Large fish -0.01 0.14 0.04 -0.03 0.17 -0.15 0.11 0.10 0.19 0.05 0.06 0.09
Red meat 0.16 0.28* 0.14 0.23* 0.07 0.16 0.05 0.15 -0.02 0.18 0.21* 0.14
DGLV 0.42* 0.03 0.18 0.22* 0.27* 0.45* 0.34* 0.11 0.09 0.12 0.22* 0.27*
YORV 0.01 0.03 -0.04 -0.07 0.03 -0.02 -0.04 0.09 0.18 0.16 0.07 0.03
Vitamin C-rich vegetables
0.25* 0.04 0.07 0.12 0.16 -0.03 0.18 0.27* 0.30* 0.33* 0.20* 0.20*
Vitamin A-rich fruits
0.02 0.01 -0.03 -0.01 -0.06 0.24* -0.13 -0.03 0.03 0.16 -0.16 0.04
Vitamin C-rich fruits
0.06 0.08 0.01 0.04 -0.12 0.15 -0.21* -0.15 0.02 0.14 -0.26* -0.01
All other vegetables
0.06 0.06 0.13 0.11 0.03 0.14 0.14 0.16 0.19 0.18 0.15 0.15
1 Estimated usual micronutrient intakes and MPA incorporate information from both rounds of data collection.
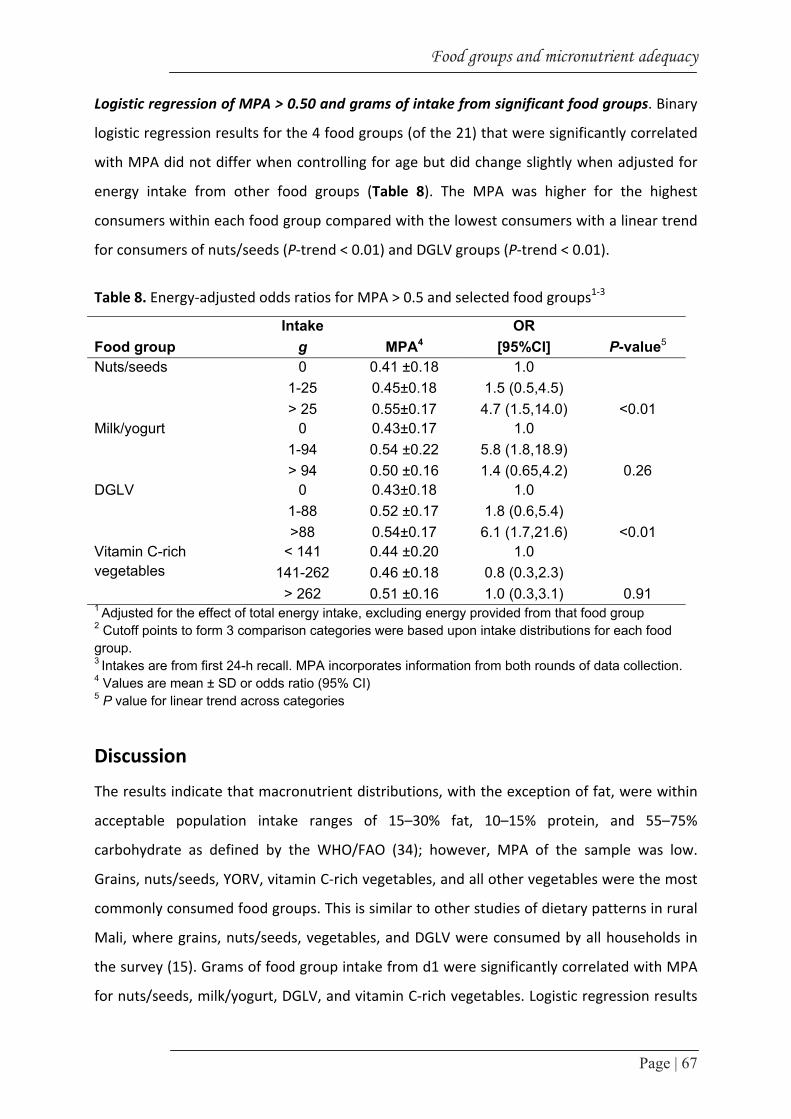
Food groups and micronutrient adequacy
Page | 67
Logistic regression of MPA > 0.50 and grams of intake from significant food groups. Binary
logistic regression results for the 4 food groups (of the 21) that were significantly correlated
with MPA did not differ when controlling for age but did change slightly when adjusted for
energy intake from other food groups (Table 8). The MPA was higher for the highest
consumers within each food group compared with the lowest consumers with a linear trend
for consumers of nuts/seeds (P‐trend < 0.01) and DGLV groups (P‐trend < 0.01).
Table 8. Energy‐adjusted odds ratios for MPA > 0.5 and selected food groups1‐3
Intake OR Food group g MPA4 [95%CI] P-value5
Nuts/seeds 0 0.41 ±0.18 1.0 1-25 0.45±0.18 1.5 (0.5,4.5) > 25 0.55±0.17 4.7 (1.5,14.0) <0.01
Milk/yogurt 0 0.43±0.17 1.0 1-94 0.54 ±0.22 5.8 (1.8,18.9) > 94 0.50 ±0.16 1.4 (0.65,4.2) 0.26
DGLV 0 0.43±0.18 1.0 1-88 0.52 ±0.17 1.8 (0.6,5.4) >88 0.54±0.17 6.1 (1.7,21.6) <0.01
Vitamin C-rich vegetables
< 141 0.44 ±0.20 1.0 141-262 0.46 ±0.18 0.8 (0.3,2.3)
> 262 0.51 ±0.16 1.0 (0.3,3.1) 0.91 1 Adjusted for the effect of total energy intake, excluding energy provided from that food group 2 Cutoff points to form 3 comparison categories were based upon intake distributions for each food group. 3 Intakes are from first 24-h recall. MPA incorporates information from both rounds of data collection. 4 Values are mean ± SD or odds ratio (95% CI) 5 P value for linear trend across categories
Discussion
The results indicate that macronutrient distributions, with the exception of fat, were within
acceptable population intake ranges of 15–30% fat, 10–15% protein, and 55–75%
carbohydrate as defined by the WHO/FAO (34); however, MPA of the sample was low.
Grains, nuts/seeds, YORV, vitamin C‐rich vegetables, and all other vegetables were the most
commonly consumed food groups. This is similar to other studies of dietary patterns in rural
Mali, where grains, nuts/seeds, vegetables, and DGLV were consumed by all households in
the survey (15). Grams of food group intake from d1 were significantly correlated with MPA
for nuts/seeds, milk/yogurt, DGLV, and vitamin C‐rich vegetables. Logistic regression results

Chapter 3
Page | 68
showed the highest consumers of nuts/seeds had 5 times higher odds than non‐consumers
to have an MPA > 0.50. Consumers in the highest category of DGLV intake had 6 times higher
odds of an MPA > 0.50 than non‐consumers.
Study limitations. Both the data for individual food groups consumed and the estimated
usual micronutrient intakes were calculated from the same 24‐h recall data; however,
estimated usual micronutrient intakes, A, and MPA were based on 2 recall days, whereas
food group intakes represent intakes from only d1. Use of the same round 1 data could lead
to artificially higher correlations. Conversely, the random error inherent in all dietary data
collection can attenuate correlations (35). The sample size for the original study was
designed to measure iron intake. Sample sizes required to measure other micronutrients
may be smaller or larger than that needed to estimate iron intake. The relatively small size of
the sample may not be adequate to detect significant differences for all micronutrients,
particularly vitamin A, vitamin B‐12, calcium, folate, and niacin, which had a larger CV than
iron in our sample. Additionally, we did not control for some potential confounders of MPA
such as educational level and socioeconomic status. PA were low for several micronutrients
and MPA was only 0.47. Due to the combination of low MPA and small sample size, only 47
women had an MPA > 0.50, 25 had an MPA > 0.60, and 11 had MPA > 0.70. For these
reasons, MPA > 0.50 was used throughout the analysis. There are no clear guidelines on how
to define an acceptable MPA level. Ideally, the benchmark chosen to define acceptable MPA
would be higher, e.g. 0.80, 0.90. To use a higher and more desirable probability, the sample
population studied would need to have micronutrient intakes higher than those observed in
this population.
Food group intakes, MPA, and intakes of individual micronutrients. Despite significant
correlation with MPA, the logistic regression results for consumer categories and MPA were
not significant for the highest consumers of milk/yogurt or any consumer category of vitamin
C‐rich vegetables. The lack of significant differences for consumers of vitamin C‐rich
vegetables could relate to the fact that all women consumed some amount of this food
group, whereas for the other 3 food groups that were significant predictors of MPA, the
reference category was non consumers. Another interesting result was that women who
consumed 1–94 g of milk/yogurt had significantly higher odds of better MPA than non‐

Food groups and micronutrient adequacy
Page | 69
consumers whereas women in the highest consumption (> 94 g) did not. Reasons for this
finding were not evident. For example, removing certain outliers did not alter the results.
Additionally, there were very few types of milk/yogurt consumed and thus the difference
observed is not likely due to consumption of different types of these products.
The nutrients with the lowest estimated prevalence of adequacy were folate, vitamin B‐12,
calcium, riboflavin, and niacin. These results are similar to those of non‐pregnant, non‐
lactating women in urban Burkina Faso, where the lowest PA were for vitamin B‐12, folate,
iron, and riboflavin (36). In similar studies in rural Mali, which considered only 7 of our 11
micronutrients, calcium and vitamin A were most limited in the diets of adults (15) and
vitamin A, calcium, vitamin C, and riboflavin had the lowest adequacy ratio for children (9).
Our Spearman correlation results indicate that increasing intakes of red meat, DGLV,
nuts/seeds, and milk/yogurt could increase intakes of some of the key nutrients deficient in
our study population. Each of these food groups was consumed on at least 1recallday by a
majority of women, indicating that there are no cultural barriers to consumption of foods
within these groups. However, for many of the food groups, median portion sizes were
small. Qualitative research methods could be used to explore constraints and opportunities
related to increasing consumption frequency and quantity of foods within these food
groups. These food groups could form the basis of focus for both programmatic efforts and
individual dietary choices where the goal is to promote micronutrient adequacy through
food‐based approaches.
Implications for development of proxy indicators of micronutrient adequacy. Part of the
overall goal of the WDDP was to analyze the relationship between simple indicators of
dietary diversity and diet quality for women. The analysis in this paper, which had a more in‐
depth focus on performance of individual food groups, helped to draw attention to the
performance and role of certain food groups in achieving better MPA in this particular
population from urban Mali. Of the other 4 sites participating in the WDDP, the 3 food
groups with the strongest correlation with MPA (controlling for energy intake) were DGLV,
vitamin A‐rich fruits, and red meat in Burkina Faso (36); vitamin A‐rich fruit, DGLV, and other
vegetables in Mozambique (37); milk, organ meat, and other vegetables in the Philippines
(38); and DGLV, nuts/seeds, and small fish in Bangladesh (39). A similar study among urban
adults in Benin found higher intakes of the food groups vegetables and legumes/ nuts were

Chapter 3
Page | 70
the most strongly associated (P < 0.001) with a micronutrient adequacy ratio (40). An
analysis of diets of rural schoolchildren in Kenya found that vegetables, fruits, and dairy had
the strongest correlations to a diet most likely to be adequate in micronutrients (41). A study
of the adequacy of micronutrient density of complementary foods from 9 countries tested
how well selected nutrient‐dense food groups (“sentinel” food groups) predicted this
dimension of diet quality (12). The study also tested FGI. The most consistent sentinel group
across all countries was animal source foods, which included dairy and/or eggs and/or
meat/fish/poultry. Additionally, in some countries, dairy alone, vitamin‐A rich fruits and
vegetables, and/or other fruits and vegetables were good indicators of better diet quality of
complementary foods. This was related to different diet patterns in the sites; e.g. in Malawi
almost no animal source foods were consumed and DGLV were the best sentinel food group
to predict micronutrient density. Based on the convergence of evidence from these studies,
dairy, eggs fruits and vegetables, particularly DGLV, fish, red meat, and legumes and nuts, or
their subgroups are key food groups for developing proxy indicators of micronutrient
adequacy based on dietary diversity scores. However, for operational purposes, it is
important to note that the food groups contributing most to micronutrient adequacy varied
by study site. These findings support using combinations of food groups rather than single
food groups in isolation serving as sentinel food groups, because no individual food group
seems to perform equally well across diverse contexts.
In conclusion, this analysis showed a strong and positive association between the quantity of
intake (grams) of the food groups nut/seeds and DGLV and higher MPA. The food groups
milk/yogurt and vitamin C‐rich vegetables were also positively and significantly correlated
with MPA, although the relationship was not as strong. These results suggest that dietary
diversification is a valid strategy to improve micronutrient intake of women of reproductive
age, because several food groups contributed substantially to estimated intakes of different
individual micronutrients. In Mali, a particular focus on increasing intake of nuts and seeds
and DGLV could be used to help improve micronutrient intakes in vulnerable populations.

Food groups and micronutrient adequacy
Page | 71
Acknowledgments
The data used in this study were collected as part of the FP6/EU/INCO FONIO project (No.
INCO CT‐2005‐015403). The analysis presented in this study was made possible through the
support of the Office of Health, Infectious Disease, and Nutrition, Bureau for Global Health,
United States Agency for International; Development (USAID), under terms of Cooperative
Agreement No. HRN‐A‐00‐98‐00046‐00, through the FANTA Project, managed by AED.
We thank Megan Deitchler for technical review and comments received on drafts of the
manuscript. N.F., Y.K., R.D., F.J.K., and I.D.B. were responsible for research design, including
project conception, research plan, and study oversight; N.F. conducted the research; G.K.,
N.F., and C.S. analyzed data and performed statistical analysis; G.K., N.F., and I.D.B. wrote
the first draft of the paper; C.S., M.A.,Y.K., R.D., and F.J.K. provided technical input into the
subsequent drafts; and G.K. had primary responsibility for final content. All authors read and
approved the final manuscript.

Chapter 3
Page | 72
References 1. FAO/WHO. Human vitamin and mineral requirements. 2002, Rome: FAO. 2. United Nations Administrative Committee on Coordination, Subcommittee on Nutrition in
collaboration, Institute IFPR. Fourth report on the world nutrition situation. 2000, Geneva: United Nations Administrative Committee on Coordination/Subcommittee on Nutrition.
3. CPS/MS , DNSI/MEIC. Mali Demography and Health Survey 2006. (Enquête Démographique et de Santé du Mali 2006 (EDSM‐IV)) 2007: Cellule de Planification et de Statistique du Ministère de la Santé, Bamako Mali; Direction Nationale de la Statistique et de l’Informatique du Ministère de l’Économie de l’Industrie et du Commerce, Bamako Mali; Macro International Inc, Calverton MD.
4. UNICEF , Micronutrient Initiative. Vitamin and mineral deficiency: a global damage assessment report 2008 UNICEF: New York, Available from: http://www.micronutrient.org/CMFiles/PubLib/Report‐67‐VMD‐A‐Global‐damageAssessment‐Report1KSB‐3242008‐9634.pdf, downloaded Jan 13, 2009
5. Allen L. To what extent can food‐based approaches improve micronutrient status? Asia Pac J Clin Nutr, 2008. 17(S1): 103‐105.
6. Solomons NW , Valdés‐Ramos R. Dietary assessment tools for developing countries for use in multi‐centric collaborative protocols. Public Health Nutr, 2002. 5: 955‐968.
7. Gibson R, Ferguson E, eds. An interactive 24‐hour recall for assessing the adequacy of iron and zinc intakes of developing countries. Technical monograph 8: Harvest Plus. 2008: Washington, DC.
8. Daniels MC, Adair L, Popkin BM, Truong Y. Dietary diversity scores can be improved through the use of portion requirements: an analysis in young Filipino children. Eur J Clin Nutr, 2009. 63: 199‐208.
9. Hatloy A, Torheim LE, Oshaug A. Food variety: a good indicator of nutritional adequacy of the diet? A case study from an urban area in Mali, West Africa. Eur J Clin Nutr, 1998. 52: 891‐898.
10. Kennedy G. Evaluation of dietary diversity scores for assessment of micronutrient intake and food security in developing countries (PhD thesis dissertation) 2009, Wageningen University: Wageningen.
11. Steyn NP, Nel JH, Nantel G, Kennedy G, Labadarios D. Food variety and dietary diversity scores in children: are they good indicators of dietary adequacy? Public Health Nutr, 2006. 9: 644‐650.
12. Working Group on Infant and Young Child Feeding Indicators. Developing and validating simple indicators of dietary quality and energy intake of infants and young children in developing countries: summary of findings from analysis of 10 data sets. 2006, Washington, DC: FANTA, Academy for Educational Development.
13. Ahn BC, Engelhardt K, Joung H. Diet variety is associated with socioeconomic factors. Ecol Food Nutr, 2006. 45: 417‐430.
14. Arimond M, Wiesmann D, Becquey E, Carriquiry A, Daniels M, Deitchler M, Fanou F, Joseph M, G. K, Martin‐Prevel Y, Torheim LE. Simple food group diversity indicators predict micronutrient adequacy of women’s diets in five diverse, resource‐poor settings. J Nutr, 2010. 140: 2059‐69.
15. Torheim LE, Ouattara F, Diarra M, Thiam F, Barikmo I, Hatloy A, Oshaug A. Nutrient adequacy and dietary diversity in rural Mali: association and determinants. Eur J Clin Nutr, 2004. 58: 594‐604.
16. Ruel MT. Operationalizing dietary diversity: a review of measurement issues and research priorities. J Nutr, 2003. 133(11 Suppl 2): S3911‐3926.
17. WHO. Indicators for assessing infant and young child feeding practices: conclusions of a consensus meeting Nov 6–8, 2007, Washington DC. WHO 2008 Geneva
18. Kennedy G, Fanou N, Seghieri C, Brouwer ID. Dietary diversity as a measure of the micronutrient adequacy of women’s diets: results from Bamako, Mali Site. 2009, Washington, DC: Food and Nutrition Technical Assistance II Project, Academy for Educational Development, Available at http://www.fantaproject.org/downloads/pdfs/WDDP_Mali_Dec09.pdf, Downloaded Nov 07, 2011.

Food groups and micronutrient adequacy
Page | 73
19. UNICEF. Monitoring the Situation of Children and Women. Multiple indicator cluster survey manual 2005. 2006, Division of policy and planning, Plaza, New York.
20. Koreissi Y, Fanou N, Brouwer ID. Development of the fonio food composition table, 2007, INCO FONIO Project: Wageningen.
21. Barikmo I, Ouattara F, Oshaug A. Table de composition des aliments du Mali. 2004, Akershus University College, Oslo.
22. USDA. US Department of Agriculture. Table of Nutrient Retention Factors, Release 6. 2007, Available from Nutrient Data Laboratory Home Page, http://www.ars.usda.gov/ba/bhnrc/ndl: Agricultural Research Service, US Department of Agriculture.
23. USDA. National Nutrient Database for Standard Reference, Release 20. 2007, Available from Nutrient Data Laboratory Home Page, http://www.ars.usda.gov/ba/bhnrc/ndl: Agricultural Research Service, US Department of Agriculture.
24. World Food Dietary Assessment System. Users guide to the World Food Dietary Assessment System, version 2.0. Available from: http://www.fao.org/infoods/software/wfood2.doc: World Food Dietary Assessment System.
25. IOM. Dietary Reference Intakes. Applications in dietary assessment. 2002, Washington, DC: National Academies Press.
26. Foote JA, Murphy SP, Wilkens LR, Basiotis PP, Carlson A. Dietary variety increases the probability of nutrient adequacy among adults. J Nutr, 2004. 134: 1779‐1785.
27. Joseph M, Carriquiry A. A measurement error approach to assess the association between dietary diversity, nutrient intake and mean probability of adequacy. J Nutr, 2010. 140: 2094‐2101.
28. IOM. Dietary reference intakes for vitamin A, vitamin K, arsenic, boron, chromium, copper, iodine, iron, manganese, molybdenum, nickel, silicon, vanadium, and zinc. 2000, Washington, DC: National Academies Press.
29. StataCorp. Stata Statistical Software: release 10‐IC. 2007, College Station (TX): StataCorp LP. 30. IOM. Dietary reference intakes for thiamin, riboflavin, niacin, vitamin B‐6, folate, vitaminB‐12,
pantothenic acid, biotin and choline. 1998, Washington, DC: National Academy Press. 31. International Zinc Nutrition Consultative Group. Assessment of the Risk of Zinc Deficiency in
Populations and Options for Its Control. Food Nutr Bulletin, 2004. 25: S94‐204. 32. WHO/FAO. Vitamin and mineral requirements in human nutrition. 2nd ed. 2004, Geneva: WHO. 33. IOM. Dietary reference intakes for calcium, phosphorus, magnesium, vitamin D and fluoride.
1997, Washington, DC: National Academies Press. 34. WHO/FAO. Diet, nutrition and the prevention of chronic diseases. Report of a joint
WHO/FAOexpert consultation. 2003, Geneva: WHO. 35. Block G, Hartman M. Issues in reproducibility and validity of dietary studies. Am J Clin Nutr, 1989.
50: 1133‐1138. 36. Becquey E, Capon G, Martin‐Prevel Y. Dietary diversity as a measure of the micronutrient
adequacy of women’s diets: results from Ouagadougou, Burkina Faso Site. 2009, Washington, DC: Food and Nutrition Technical Assistance II Project, Academy for Educational Development.
37. Wiesmann D, Arimond A, Loechi C. Dietary diversity as a measure of the micronutrient adequacy of women’s diets: Results from rural Mozambique site. 2009, Washington, DC: Food and Nutrition Technical Assistance II Project, Academy for Educational Development.

Fonio as a staple food in Mali: an approach to upgrade nutritional value
Page | 74
38. Daniels M. Dietary diversity as a measure of the micronutrient adequacy of women’s diets: results from Metropolitan Cebu, Philippines site. 2009, Washington, DC: Food and Nutrition Technical Assistance II Project, Academy for Educational Development.
39. Arimond M, Torheim LE, Wiesmann D, Joseph M, Carriquiry A. Dietary diversity as a measure of the micronutrient adequacy of women’s diets: results from rural Bangladesh site. 2009 Washington, DC, : FANTA‐2, AED, Available from: http://www.fantaproject.org/downloads/pdfs/WDDP_Bangladesh_Dec09.pdf downloaded Feb 2 2009.
40. Sodjinou R, Agueh V, Fayomi B, Delisle H. Obesity and cardio‐metabolic risk factors in urban adults of Benin: relationship with socio‐economic status, urbanisation, and lifestyle patterns. BMC Public Health, 2008. 8: 84.
41. Ruel M, Graham J, Murphy S, Allen L. Validating simple indicators of dietary diversity and animal source food intake that accurately reflect nutrient adequacy in developing countries. Report submitted to Global Livestock‐Collaborative Research and Support Program. 2004, Washington, DC: IFPRI.

Chapter 4
Day-to-day variation in energy, macronutrients and
micronutrients intake from a duplicate 24-h dietary recall
among urban Malian women of reproductive age
and implications for usual intake assessment
Nadia Fanou-Fogny, Jeanne HM de Vries, Yara Koreissi,
Romain AM Dossa†, Frans J Kok, Inge D Brouwer
Submitted
Chapter 4
Page | 76
Abstract
Day‐to‐day variation in diet is the most common random error source in dietary assessment
hampering accurate estimation of usual intake. The present study reports on the day‐to‐day
variation of urban Malian women diet, with implications for estimating true intake at group
and individual level. A duplicate 24‐h dietary recall was conducted on independent days with
a sample of 108 not pregnant and not lactating women of reproductive age (15‐49y),
randomly selected in Bamako (Mali), using a three‐stage cluster sampling method. One‐way
ANOVA and general linear model were used to determine intra‐ and inter‐individual
variance, unadjusted and adjusted for cluster effects. Adjusted intra‐individual variance was
used to determine the number of assessment days needed for assessing usual intake. Both
intra‐ and inter‐individual variances were used to estimate the number of days required for
correctly classifying individuals. The ratio of intra‐ to inter‐individual variance was ≥1 for fat,
Zn, Ca, Vitamin A and C, and B6 intake, and <1 for energy, carbohydrates, protein, iron,
thiamin and riboflavin intake. Adjusting for cluster effect appeared to increase the variance
ratios. The range of days required across nutrients for estimating usual intake was 2‐3 (iron,
zinc, folate) to 12 (fat) at percentage limit of ±20% for group level, and 1‐2 (energy, protein,
iron) to 12 (fat) for correctly ranking individual using an attenuation factor of 0.8. For
designing future research, these findings should be balanced with research purpose, cost,
targeted nutrients, desired precision limit and sampling design to derive the most
appropriate required replicates.
Day-to-day variation in Malian diet
Page | 77
Introduction
Day‐to‐day variation in diet is the most common random error source in dietary assessment
hampering accurate estimation of usual intake (1, 2). Usual nutrient intake, defined as the
long‐run average daily nutrient intake by an individual, is essential for understanding
relationships between diet and health status (3). At population level, an accurate estimation
of usual intake is required for providing precise estimates of the prevalence of nutrient
inadequacy in comparison to dietary recommendations (4). At individual level, accurate
estimate of usual intake is also fundamental for ranking correctly individuals for decision
making purposes regarding appropriate interventions (5). The extent of the day‐to‐day
variation from diets can be assessed through dietary assessment (3). As daily assessment of
diet intake over very long periods is impractical, very costly and often unnecessary, the
required number of days for an accurate estimation of the usual nutrient intake can be
estimated by quantifying day‐to‐day variation from a number of replicate dietary assessment
over different food seasons (1, 3, 5). The number of days required vary according to the
purposes of obtaining reliable estimates of true intake at group level or ranking individuals
(1, 5). Some estimates of day‐to‐day variation in nutrient intake, as well as number of
replicates required for assessing usual intake at group or individual level have been
previously reported from developed and some developing countries (1, 2, 5‐10). Less is
known from African countries. Particularly in West Africa, traditional dietary practices such
as shared plate‐eating (many household members sharing meals in a same plate) are still
common, even in urban areas and collecting accurate dietary intake data from such settings
is challenging (11). There is a need to report updated information on dietary intakes as well
as an estimation of the extent of day‐to‐day variance in those diets. This will contribute to an
accurate assessment of the usual intake, thus decreasing the risk of imprecise estimation of
nutrient adequacy prevalence among west African women (3, 12). The present paper reports
on day‐to‐day variation from the diet of urban Malian women of reproductive age assessed
by a duplicate 24hDR method, with implications on estimation of true intake at group and
individual level.
Chapter 4
Page | 78
Subjects and methods
Subjects and sampling
The study was conducted in Bamako, the capital city of Mali. We randomly selected 108 apparently
healthy women of reproductive age (15‐49y), not pregnant and not lactating from 12 quarters of
Bamako, using a three‐stage cluster sampling method (13). The sampling procedure has been
described elsewhere (14). From the 108 selected, 5 did not complete the 1st day of the 24hDR
assessment and 6 were not available for the 2nd day. Thus, a total of 96 women with intake data for
the 2 days of 24‐hDR assessment were included in variance components analysis.
The ethical committee of the Malian National Institute of Research in Public Health approved the
study protocol. Participants were informed in detail, verbally and in written form, about the purposes
of the study. Oral agreement was obtained from the participants before dietary assessment and
signed informed consent was obtained before anthropometric measurements.
Background information and anthropometry
Baseline information was collected using a short questionnaire, including information about
age, marital status, number of children, sociolinguistic group, and occupational activity.
Anthropometric measurements (body weight and height) were carried out with a sub‐
sample of 60 women. Measurements were performed early in the morning, in fasting
subjects according to standardized procedures (15). Weight was measured using a SECA
platform spring balance model 761, maximum range 150 kg, graduation 0.5 kg. Height was
measured using a body measuring tape label MZ10017 (measuring range 2200 mm,
graduation 1 mm). Both height and weight were measured twice and the average value was
taken.
Dietary assessment
24‐h dietary recalls
Trained interviewers conducted two 24‐h dietary recalls on non‐consecutive days (2d‐
24hDR) in face‐to‐face semi‐structured interviews at the respondents’ home and in their
native language. To reduce bias due to occasional consumption of foods with exceptionally
high micronutrients content, weekends and special event days were not included in the
24hDR. Participants were interviewed by different enumerators at different sessions to
reduce interviewer bias. Food preparers were also probed in case the respondents did not

Day-to-day variation in Malian diet
Page | 79
cook on the recall days. A nutritionist supervised the interviews and checked completeness
of dietary recall forms. Procedures for collecting dietary information and estimating amounts
consumed were performed as described by Gibson and Ferguson (16). The amounts of all
foods, beverages and ingredients of mixed dishes consumed by the respondents were
estimated either in household units using marked known‐weight (standardized) utensils, or
in monetary value. The total volume of food cooked for the respondents’ household and the
volume of the food consumed by the respondent were estimated to derive the proportion
consumed. Household units were converted back to weight equivalent as follows: beverages
and foods consumed were listed along with corresponding standardized utensils; the
standardized utensils were weighed without and with beverages or foods corresponding to
levels indicated by the respondents; and amounts consumed were derived from the
difference between the two (16). The same procedure was applied to determine total
amount cooked for the households, using known‐weight utensils. When a monetary unit was
used to describe a portion, these foods or ingredients were converted to weight equivalent
as follows: all ingredients and their monetary values were listed. Three to five food vendors
were randomly selected from each of the three most frequented markets of the study area
for a total of nine to fifteen vendors. For each ingredient, the prices and weights of different
portions sold were recorded from each vendor to derive the mean weight per fixed
monetary value (16). To estimate the amount of ingredients eaten from mixed dishes with
unknown amounts of ingredients (e.g., because the foods were gifts from neighbours or
purchased outside the home), standardized recipes of these foods were determined (16).
Weights were measured using digital dietary scales with a 10 kg maximum range, and 2 g
graduation.
Nutrient intake
Nutrient intake was computed with the VBS Food Calculation System version 31, using the
Mali food composition table (Table de composition d'aliments du Mali (TACAM)) (17) as the
primary data source for energy and nutrient content of foods. The United States Department
of Agriculture (USDA) Nutrient Database Release 20 (18) was used as a secondary data
source when needed. The International Mini List version 2.0 (19) and McCance &
1 Bas Nutrition Software, Arnhem, The Netherlands, www.bare.nl, last update on August 8, 2004
Chapter 4
Page | 80
Widdowson’s Composition of Foods (20) were referred to when USDA nutrient values were
very different from TACAM or when no suitable food match was found in the TACAM or
USDA food composition tables. When the nutrient content of cooked forms of the foods was
not available, USDA Retention Factors Release 6 (21) was used to account for nutrients loss
during cooking. For this study, the intakes of energy, carbohydrates, protein, fat, and 11
micronutrients (iron, zinc, calcium, Vitamin A, Vitamin C, riboflavin, thiamin, niacin, B6,
folate and B12) were estimated.
Evaluation of the 2d‐24hDR
A weighed food record on one day (1d‐WFR) among a sub‐sample of 35 women, and the
95% limits Goldberg cut‐offs (22) were used to evaluate energy and micronutrients intake
assessed by the 2d‐24hDR at group level. The ratio of EI to BMR ranged from 0.8 to 2.75 with
average values of 1.5±0.4. The ratio fell within the 95% CI of the Goldberg cut‐offs, indicating
that the reporting bias in energy intake was not significant at group level. In addition, there
was no statistically significant difference between mean (original) intakes estimated by the
2d‐24hDR and 1d‐WFR for all nutrients (P‐values > 0.05).
Statistical analyses
Statistical analyses were computed with SPSS 19 for Windows (IBM SPSS Statistics Release
19.0.0.1, SPSS Inc., Chicago, IL, 2011). P‐values < 0.05 were considered significant for all
analyses. Mean intake distributions from the 2d‐24hDR were visually checked and tested for
normality using Shapiro‐Wilk test. Energy and macronutrients were normally distributed but
not the micronutrients. These latter were log transformed to normality. One‐way ANOVA
and general linear model were used to determine intra‐ ( 2wS ) and inter‐individual variance
( 2bS ), unadjusted and adjusted for cluster effects. Adjusted intra‐individual variance was
used to determine the number of assessment days needed for the observed estimate of an
individual’s intake to lie within a specified percentage of the true mean at 95% CI, as follows:
d = (Zα CVw/Dw) (1), where d is the number of required days per individual, Zα the normal
deviate, e.g. 1.96 at 95% CI, CVw the within‐subject variation, calculated as square root of
intra‐individual variance (SD)/mean intake, and Dw the specified limit as a percentage of
long‐term individual intake (1). Values of 10% and 20% were tested in this study. Both intra‐

Day-to-day variation in Malian diet
Page | 81
and inter‐individual variances were used to estimate the number of days required for
correctly classifying individuals using the following formula d = [r2/(1 – r2)] × ( 2wS / 2
bS ) (23);
where d is the number of days, 2wS / 2
bS is the within/between‐subject variance ratio, r is the
attenuation factor, defined as the unobservable correlation between observed and true
mean nutrient intakes of subjects (23). Higher values of r indicate a lower proportion of
misclassification. Values of 0.8 and 0.9 were tested for the present study.
Results
Overall, the women’s median age was 30 years. Mean BMI was 23.4 kg/m2. One‐third of the
women were not married (including widow/divorced), and two‐thirds had fewer than 3
children. Thirty‐five percent of them were illiterate (never went to school). Nearly half of the
women had no income‐generating activity (48%), and among those who did, 8% had formal
employment. Detailed description of the diet has been given elsewhere (14). Briefly, all of
the women (100%) consumed starchy staples, mainly sorghum and millet, and vegetables.
Nuts/seeds were consumed by 36% of the women. The main animal source foods consumed
were beef (70%), large fish (47%) and milk/yoghurt (47%). Eggs were consumed by only 8%
of the women, and foods such as chicken and other poultry were not consumed by any
woman in the sample during the dietary assessment period. Sugar‐rich foods, mostly refined
sugar and soft drinks, were consumed by 57% of the women, oils and fatty foods by 79% and
25% of the women respectively.
Overall, the intra‐individual variance was greater than (or equal to) inter‐individual variance
for fat, Zn, Ca, Vitamin A and C, and B6 intake. Subsequently, variance ratio was ≥1 for those
nutrients, with global range of 0.1‐3.9 for all nutrients. Niacin, B12 and folate showed very
high values due to the influence of outliers. Adjusting for cluster effect appeared to increase
the variance ratios, with range of 0.1 to 6.9 (Table 1). Based on within subject variation
coefficient and at ±10% limit percentage of the true mean, a minimum number of 7 (folate
intake) to 47 dietary assessment days (fat intake) would be required to have an estimate of
the true average intake of the sample. A number of 2 to 12 days were estimated for ±20%
limit. There was no change in number of days required after adjusting for cluster effect.
Using within and between subject variance, minimum of 2‐29 and 2‐12 replications were
Chapter 4
Page | 82
required respectively for an attenuation factor of 0.9 and 0.8 between true and observed
intake (Table 2).
Discussion
The present study reported on estimates of day‐to‐day variation in energy, macro‐ and
micronutrients intake from the diet of a sample of West African women living in urban areas,
with implications for usual intake estimation at group and individual level. The ratio of
intraindividual to interindividual variance was equal to or greater than 1 for fat, Zn, Ca,
Vitamin A and C, and B6 intake. Less variance was explained by within‐subject variation for
energy, carbohydrates, protein, iron, thiamin and riboflavin intake. Adjusting for cluster
effects increased the variance ratios, due to either a reduction of between‐subject variance
or increase of within‐subject variance. However, the increase was not sufficient to influence
the number of days required for assessing usual intake.
The variance ratio of energy intake estimated in our study was the lowest as compared to
those estimated in other parts of Africa (East (Kenya), South (Malawi) and North (Egypt)) (7)
as well as other developing countries (Bangladesh, Indonesia and Mexico) (6, 9, 10) and
some developed countries (US, UK and Canada) (2, 5, 8, 10). Similar trend was observed for
micronutrients intake, except for zinc, vitamin C and niacin showing higher values than those
of the industrialized countries, albeit lower than those of the other developing countries.

Da
y-to
-da
y v
aria
tion
in M
alia
n d
iet
Page | 83
Table 1. Mean (SD) and median (IQ range) nutrients intake with variance components (intraindividual, interindividual and variance ratio) unadjusted and adjusted for cluster effects (n=96)
Nutrients Mean (SD) Median (25th-75th) Unadjusted Variancea Adjusted variancea
intraindividual interindividual Ratio intraindividual interindividual Ratio
Energy (kcal) 2149 (561.7) 2157 (1798.8 - 2450.9) 266951 763506 0.4 269146 729012 0.4
Carbohydrates (g) 334.0 (93.4) 330.4 (269.5 - 394.4) 6900 55148 0.1 6484 46612 0.1
Protein (g) 60.7 (18.8) 61.3 (47.1 - 72.6) 361 812 0.4 366 986 0.4
Fat (g) 72.4 (29.3) 69.3 (51.8 - 90.3) 644 194 3.3 644 94 6.9
Iron (mg) 17.5 (7.4) 15.9 (12.1 - 22.8) 0.2 0.8 0.3 0.2 0.8 0.3
Zinc (mg) 10.5 (4.1) 10.0 (8.0 - 12.5) 0.2 0.2 0.9 0.2 0.2 1.1
Calcium (mg) 477.0 (256.9) 431.5 (274.1 - 596.7) 12.6 4.7 2.7 13 6.8 1.9
Vitamin C (mg) 62.3 (25.7) 62.9 (42.9 - 74.6) 9.9 4.5 2.2 9.8 7.4 1.3
Vitamin A (µgRE) 371.2 (245.7) 323.8 (172.1 - 555.3) 13.4 3.4 3.9 13.3 5.4 2.5
Thiamin (mg) 1.0 (0.3) 0.9 (0.8 - 1.2) 0.1 0.3 0.3 0.02 0.1 0.3
Riboflavin (mg) 0.8 (0.3) 0.8 (0.5 - 1.0) 0.1 0.3 0.5 0.1 0.4 0.4
Vitamin B6 (mg) 1.3 (0.4) 1.3 (0.9 - 1.6) 0.1 0.1 0.8 0.1 0.1 1.0
Niacin (mg) 10.5 (4.6) 9.5 (6.5 - 13.9) 0.4 0.0 -b 0.4 0.0 - b
Vitamin B12 (µg) 1.6 (0.9) 1.4 (0.8 - 2.2) 0.4 0.0 - b 0.4 0.0 - b
Folate (µg) 130.2 (55.9) 120.7 (90.9 - 163.0) 1.3 0.0 - b 1.3 0.0 - b a analysis with logtransformed values for all micronutrients b very high values strongly influenced by outliers

Chapter 4
Page | 84
Table 2. Number of replicates needed for 95% of observed intakes to lie within specified
percentage of true mean and for correctly ranking individualsa (n=96).
Nutrients CV
intraindividual (%)
Specified percentage limit of true meanb Attenuation factor rc
±10% ±20% 0.9 0.8Energy (kcal) 24.1 22 6 2 1Carbohydrates (g) 24.1 22 6 1 1
Protein (g) 31.5 38 10 2 1Fat (g) 35 47 12 29 12Iron (mg) 15.5 9 2 1 1Zinc (mg) 18.2 13 3 5 2Calcium (mg) 22.7 20 5 8 3Vitamin C (mg) 25.7 25 6 6 2Vitamin A (µgRE) 24.5 23 6 11 4Niacin (mg) 23.9 22 5 -d -d
Thiamin (mg) 46.8 19 5 -d -d
Folate (µg) 13.6 7 2 -d -d
a analysis with logtransformed values for all micronutrients b number of days calculated as : d = (Zα CVw/Dw), where Zα is the normal deviate (1.96 at 95% CI), CVw the within-subject variation, and Dw the specified limit as a percentage of long-term intake (1). c number of days calculated as d = [r2/(1 – r2)] × ( 2
wS / 2bS ), where r is the attenuation factor defined as
the unobservable correlation between observed and true mean nutrient intake, 2wS / 2
bS is the within-
to-between-subject variance ratio (24). d not calculated because very high values of variance ratios influenced by outliers
This suggested a lower day‐to‐day variation in urban Malian diet and subsequently less days
required for assessing usual nutrient intake, probably explained by the low diversity of the
diet and the restriction in food choices (even when a large range of foods is locally available)
due to low living standards (9). However, our study was restricted to 2 recall days, excluding
weekend days, to a unique food season and to a relatively limited sample size, whereas most
of the above mentioned studies were performed on more than 2 recall days, and/or across
different seasons of the year. Thus the overall diet variation was not captured, being the
major drawback for the present study.
The higher variance ratio of fat intake compared to other macronutrients suggested an
emerging intake of high‐fat foods by the women, as shown by the percent of women
consuming fatty foods such as fried potato, fried plantain. This should be further closely
monitored, in association with the increased risk of overweight and obesity among this
sample (published elsewhere, (24)). Among the micronutrients, iron intake showed low

Day-to-day variation in Malian diet
Page | 85
within‐to‐between subject variance ratio and low number of replicates for estimating true
average intake at 20% acceptable error. This indicated a consistent daily iron intake from the
diet, though the bioavailability of this intake is insufficient for achieving high probability of
adequacy, due to the negative influence of phytate on iron absorption from plant‐based
diets (25). The number of days required for an accurate estimation of the usual nutrient
intake is an important issue for designing appropriate nutrition research or interventions. It
has been reported that the extent of within‐subject variation varies across nutrients, and the
greater the intraindividual variance, the greater the number of days (1, 2, 5). This was shown
in the present study by the range of days required across nutrients for estimating usual
intake at group level: 2‐3 days (iron, zinc and folate) to 12 days (fat) at percentage limit of
±20%, and 7‐9 (iron, folate) to 47 days at ±10%. Also, as expected, different number of
replicates were estimated in this study depending on whether the usual intake is needed for
deriving group estimates or for ranking individuals (1, 5). For applicability in designing future
research, findings from the present study should be balanced with research purpose, cost,
targeted nutrients, desired precision limit and sampling design to derive the best suitable
number of required days.
Conclusions
Replicating the 24hDR on two independent days allowed having an estimate of day‐to‐day
variation from urban Malian women’s diet. Most of the West African countries (including
Mali) are in the lowest human development category and in addition, the diet is still
influenced by traditional dietary practices. Such information is useful for assessing the extent
of nutrient intake inadequacy risk among women in those areas in comparison to dietary
recommendations, and for correctly ranking individuals. To improve the accuracy of these
estimates, at least 2 to 6 replications for estimation at group level and 2 to 12 replications
for analysis at individual level are required for the 24hDR, on independent days, including
weekend days and with a larger sample size.
Chapter 4
Page | 86
Acknowledgments
The data used in this study were collected as part of the FP6/EU/INCO FONIO project No.
INCO CT‐2005‐015403. N Fanou‐Fogny, JHM de Vries, Y Koreissi, RAM Dossa, FJ Kok and ID
Brouwer have no conflicts of interest. We are indebted to late Lidwien van der Heyden for
her valuable contribution to designing and implementing the food consumption surveys. We
thank Olga Souvereign for her contribution to refining methodology. N.F.F, R.A.M.D. and
I.D.B. designed the research; N.F.F., J.V. and I.D.B. refined methodology and previous drafts;
N.F.F. collected data, analysed data and performed statistical analysis; Y.K. collaborated in
fieldwork; N.F.F. wrote the paper and had responsibility for the final content. All authors
read and approved the final manuscript. In memory of R.A.M.D.

Day-to-day variation in Malian diet
Page | 87
References 1. Beaton GH, Milner J, Corey P, McGuire V, Cousins M, Stewart E, de Ramos M, Hewitt D,
Grambsch PV, Kassim N, Little JA. Source of variance in 24‐hour dietary recall data: implications for nutrition study design and interpretation. Am J Clin Nutr. 1979; 32: 2546‐2559.
2. Beaton GH, Milner J, Corey P, McGuire V, Cousins M, Stewart E, de Ramos M, Hewitt D, Grambsch PV, Kassim N, Little JA. Sources of variance in 24‐hour dietary recall data: implications for nutrition study design and interpretation. Carbohydrate sources, vitamins, and minerals. Am J Clin Nutr. 1983; 37: 986‐995.
3. Dodd KW, Guenther PM, Freedman LS, Subar AF, Kipnis V, Midthune D, Tooze JA, Krebs‐Smith SM. Statistical methods for estimating usual intake of nutrients and foods: a review of the theory. J Am Diet Assoc. 2006; 106: 1640‐1650.
4. Tooze JA, Kipnis V, Buckman DW, Carroll RJ, Freedman LS, Guenther PM, Krebs‐Smith SM, Subar AF, Dodd KW. A mixed‐effects model approach for estimating the distribution of usual intake of nutrients: The NCI method. Statist Med. 29. 2010: 2857‐2868.
5. Nelson M, Black AE, Morris JA, Cole TJ. Between‐ and within‐subject variation in nutrient intake from infancy to old age: estimating the number of days required to rank dietary intakes with desired precision. Am J Clin Nutr. 1989; 50: 155‐167.
6. Launer LJ, Kardjati S, Kusin JA, Reed GF. Patterns of variability in the nutrient intake of nutritionally vulnerable pregnant women. Eur J Clin Nutr. 1991; 45: 131‐138.
7. Nyambose J, Koski KG, Tucker KL. High intra/interindividual variance ratios for energy and nutrient intakes of pregnant women in rural Malawi show that many days are required to estimate usual intake. J Nutr. 2002; 132: 1313‐1318.
8. Palaniappan U, Cue RI, Payette H, Gray‐Donald K. Implications of day‐to‐day variability on measurements of usual food and nutrient intakes. J Nutr. 2003; 133: 232‐235.
9. Persson V, Winkvist A, Hartini TNS, Greiner T, Hakimi M, Stenlund H. Variability in nutrient intakes among pregnant women in Indonesia: implications for the design of epidemiological studies using the 24‐h recall method. J Nutr. 2001; 131: 325‐330.
10. Torres A, Willett W, Orav J, Chen L, Huq E. Variability of total energy and protein intake in rural Bangladesh: implications for epidemiological studies of diet in developing countries. Food Nutr Bull. 1990; 12: 220‐228.
11. Torheim LE. Assessing dietary intake in rural Mali ‐ Challenges when people eat from shared plates. 2003, Oslo: Faculty of Medicine, University of Oslo.
12. Mackerras D , Rutishauser I. 24‐h national dietary survey data: how do we interpret them most effectively? Public Health Nutr. 2005; 8: 657‐665.
13. UNICEF. Monitoring the Situation of Children and Women. Multiple indicator cluster survey manual 2005. 2006, Plaza, New York: Division of policy and planning.
14. Kennedy G, Fanou N, Seghieri C, Brouwer ID. Dietary diversity as a measure of the micronutrient adequacy of women’s diets: results from Bamako, Mali Site. . 2009, Washington, DC: Food and Nutrition Technical Assistance II Project, Academy for Educational Development, Available at http://www.fantaproject.org/downloads/pdfs/WDDP_Mali_Dec09.pdf, Downloaded Nov 07, 2011.
15. WHO. Physical Status: The use and interpretation of anthropometry 1995, Report of WHO Expert Committee, Geneva: WHO.
16. Gibson R, Ferguson E. An interactive 24‐hour recall for assessing the adequacy of iron and zinc intakes of developing countries. Technical monograph 8. 2008, Washington, DC: Harvest Plus.
17. Barikmo I, Ouattara F, Oshaug A. Table de composition des aliments du Mali. 2004, Akershus University College, Oslo.
18. USDA. National Nutrient Database for Standard Reference, Release 20. 2007, Available from Nutrient Data Laboratory Home Page, http://www.ars.usda.gov/ba/bhnrc/ndl: Agricultural Research Service, US Department of Agriculture.
Fonio as a staple food in Mali: an approach to upgrade nutritional value
Page | 88
19. World Food Dietary Assessment System. Users guide to the World Food Dietary Assessment System, version 2.0. Available from: http://www.fao.org/infoods/software/wfood2.doc.
20. Holland B, Welch AA, Unwin ID, Buss DH, Paul AA, Southgate DAT. The Composition of Foods McCance & Widdowson’s 5th Ed. 1991, The Royal Society of Chemistry and Ministry of Agriculture, Fisheries and Food, Cambridge.
21. USDA. US Department of Agriculture. Table of Nutrient Retention Factors, Release 6. 2007, Available from Nutrient Data Laboratory Home Page, http://www.ars.usda.gov/ba/bhnrc/ndl: Agricultural Research Service, US Department of Agriculture.
23. Black AE. Critical evaluation of energy intake using the Goldberg cut‐off for energy intake: basal metabolic rate. A practical guide to its calculation, use and limitations. Int J Obes. 2000; 24: 1119‐1130.
24. Black AE, Cole TI, Wiles SI, White F. Daily variation in food intake of infants from 2 to 18 months. Hum Nutr Appl Nutr. 1983; 37A: 448‐458.
25. Fanou‐Fogny N, Saronga NJ, Koreissi Y, Dossa RAM, Melse‐Boonstra A, Brouwer ID. Weight status and iron deficiency among urban Malian women of reproductive age. Br J Nutr. 2011; 105: 574‐579.
26. Hurrell RF. Bioavailability of iron. Eur J Clin Nutr. 1997; 51: S4‐8.

Chapter 5
Consumption of, and beliefs about fonio
(Digitaria exilis) in urban areas in Mali
Nadia Fanou-Fogny, Yara Koreissi,
Romain AM Dossa†, Inge D Brouwer
Afr J of Food Agric. Nutrition and Development 2009; 9 (9): 1927-1944
Chapter 5
Page | 90
Abstract
The study sought to determine beliefs and practices about neglected crops in West‐Africa,
using fonio (Digitaria exilis) as a model to understand how obstacles impede the
consumption of this cereal in Bamako, the capital city of Mali. This was a cross‐sectional
study on food ethnography in three steps: a market survey on availability of fonio, a food
consumption survey on utilisation of fonio, and on beliefs and attributes on fonio. The study
covered the pre‐harvest and post‐harvest periods and involved key informants, food
vendors, and women of reproductive age in households. Fonio, as all cereals, is available
year‐long on markets in Bamako, and is abundant from September to May before most of
the common cereals mature. More than two‐thirds (68%) of the women reported having
consumed fonio one to three times a month. Fonio was more consumed as snack (djouka)
on working days (62%) than on weekend and special event days, suggesting that encouraging
the development of ready‐to‐serve fonio‐based products would help increase the
consumption of fonio among women in urban area. The average individual portion size of
fonio was 152 g/day, and the contribution to daily energy intake was 16%. A large share of
the women was convinced that eating fonio was good for them (95%) and their family
members (94%). Also, most of them thought that fonio had good cooking, organoleptic and
nutritional qualities and could contribute to diet’s variation (91% to 100%). Decision by the
women to purchase or prepare fonio in the household could be favourably influenced by
factors such as media, household members suffering from anaemia, neighbouring people
buying fonio and shortage of other cereals; whereas shortage of fonio products (77%), high
cost of fonio products (69%), difficult cooking process (51%), and lack of knowledge about
processing and cooking fonio (43%) were likely to limit fonio consumption among the
women. Also, in the present study, fonio was perceived to be for rich people by more than
half (58%) of the women. Improving cooking process and knowledge of the women about
fonio cooking, as well as creating a demand for the women with the household’s head and
others through media, social and health care services would help increase fonio
consumption in Bamako.

Consumption of and beliefs about fonio
Page | 91
Introduction
Malnutrition and numerous deficiency diseases continue to persist in the developing world
as a result of deficiencies of essential nutrients in the daily diet (1). Women of reproductive
age are mostly affected because of increasing needs during pregnancy and lactation. In Mali,
a prevalence of 13% has been reported for women of reproductive age suffering from
chronic energy deficiency and 50% for anaemic women in Bamako the capital city (2).
Household food insecurity is an important underlying cause of malnutrition and how
households cope with scarce food are key determinants in maintaining healthy nutrition (3).
Promotion of local and traditional food has been recommended to improve household food
security and further contribute to reduction of malnutrition (4). Fonio (Digitaria exilis), one
of the most ancient indigenous West African cereals is a major part of the diet in some
communities in Mali (5‐7). Regarded for a long time as a minor crop without economic
potential (8), fonio is attracting renewed interest in urban areas of West Africa for its
organoleptic and nutritional qualities (9). Recently, the crop has been listed as priority crop
for West Africa (10). Because of its short growing cycle, fonio can be harvested in the critical
shortage season before major food crops (7) and its contribution to food security has been
suggested (11). The food composition table of Mali indicates fonio as second cereal with
higher iron content (8.5 mg/100g dry matter) after sorghum (11 mg/100g dry matter) (12).
The grain is also an excellent source of methionine, cysteine and leucine, whose
concentrations are slightly higher than those defined for the FAO reference protein (13).
Fonio‐based products and modern recipes have been developed in urban areas in Mali (14).
Promoting fonio consumption in urban areas could help improve household food security
not only as income source but also as a transition food that could contribute to energy
intake of household members during seasonal food shortage. However, fonio consumption
is still low, particularly in urban areas. Based on a study in three West African cities, Bamako
(Mali), Conakry (Guinea) and Ouagadougou (Burkina Faso), a consumption frequency of less
than once a month for 54% of fonio consumers in households has been reported (5).
Average amount consumed per person was estimated at 4.4 kg/ year for Mali (6) with a
range of 650 to 840 g/year in Bamako (5). Difficult post‐ harvest processing, high‐quality
product demand, time consuming cooking process, and high‐cost of fonio products were
pointed out to explain the low consumption of fonio in Bamako (5, 7‐9, 15). However, social

Chapter 5
Page | 92
factors and cultural beliefs are also important factors influencing food choice and
consumption patterns (3, 4). The present study sought to determine the intake of fonio in
households and shared beliefs about fonio consumption in urban Mali. The research is part
of the FP6/EU/INCO/STREP1 funded FONIO project, which aimed at upgrading the quality
and competitiveness of fonio (Digitaria exilis) for improved livelihoods in West Africa.
Methods
A cross‐sectional food ethnographic study (3, 4) was performed in Bamako, the capital city of
Mali, during the pre‐harvest (August‐September) and post‐harvest (February‐July) periods.
The study was carried out in three steps: 1) a market survey on availability of fonio, 2) a food
consumption survey on utilisation of fonio and 3), a beliefs and attributes study on fonio
among women of reproductive age (4).
Informants and respondents
Food vendors
Three categories of food vendors were selected: the street food vendors, the supermarkets
food vendors and the markets food vendors. Street food vendors are those who sell ready‐
to‐serve food either at fixed places (restaurants) or at non determined places (road sides).
The supermarket food vendors are those who sell food at fixed prices in supermarket. The
market food vendors are those who sell foods at bargaining base prices in markets. In total,
40 street food vendors, 15 in restaurants and 25 on road sides were randomly sampled. Five
supermarkets were randomly selected, according to geographical position. Three of the
most frequented markets of Bamako were visited: Medine, Fadjiguila and Sabalibougou. A
total of 63 market food vendors were randomly selected according to the type and diversity
of foods sold.
Households
A household was considered as any person or group of persons who share the same living
accommodation, who pool some or all of their income and wealth and who take food
prepared from a common kitchen or cooking pot (16). A total of 30 households were
1 Project number 0015403

Consumption of and beliefs about fonio
Page | 93
selected by a convenient sampling (17) based on discussion with key informants (agriculture
and demography services staff, community leaders). The average size of the households was
11±6.8 members, and 33.7% of the households had more than 11 members. One food
preparer was conveniently selected in each household based on discussion with the
members. The preparers are the persons in the households who play a key role in the
preparation of the food for all household members.
Women of reproductive age
A total of 108 women of reproductive age (15‐49 year‐old) were randomly selected in 12
quarters of Bamako using three‐stage cluster sampling (18) and the random walk method
(19). The women were involved in the survey based on verbal agreement.
Availability study
Availability study was carried out in the pre‐harvest period to identify available and
consumed fonio products in Bamako. This included market survey and interviews in
households.
The market survey was done by discussion with the selected food vendors in markets,
supermarkets, restaurants and at road sides. Data such as fonio product names, attributes,
seasonality, units sold, price per unit sold, were collected.
Interviews were carried out with the food preparers in the selected households. They gave
information on the size of the household, the meal pattern, the main fonio dishes cooked in
the household, and the seasonal availability of fonio products.
Food consumption survey
A food consumption survey including a 24‐hr recall and a food frequency focused on fonio
products were performed with the 108 women of reproductive age during the post‐harvest
period. Data were collected by well‐trained local assistants through semi‐structured
interviews based on standard questionnaires.
The 24‐hr recall was performed to assess the mean energy intake of the women, the daily
portion size of fonio and the contribution of fonio to energy intake. The recall was
performed on two non consecutive days following a standardized format (19). Weekends
and special event days were excluded. Amount of ingredients eaten from mixed dishes and

Chapter 5
Page | 94
snacks with unknown amounts of ingredients (gifts or foods purchased outside the
household) were determined using the standard recipe method (19). Amounts consumed
were estimated in household utensils and monetary values. Conversion factors from
household measures and monetary value to weight equivalent (grams) were determined.
Weights were measured using digital dietary scales (Soehnle, Plateau Art, Germany) Nr
65086 (22lb), maximum range 10 kg, nearest to 2 g (0.1oz). Food intake was computed by
the VBS Food Calculation System version 32 using primarily the Mali food composition table
TACAM (12), and secondarily the USDA nutrient database release 18 (20) and 20 (21). The
International Mini List (IML), version 2.03 and the McCance & Widdowson’s composition of
foods (22) were used when USDA nutrient values were different from TACAM or when no
suitable food match was found. USDA Retention factors release 6 was used to determine
nutrient losses during cooking (23).
Foods were classified into 13 groups: starchy staples; dairy; legumes and nuts; small fish
eaten whole with bones; all other flesh foods and miscellaneous small animal protein;
vitamin A‐rich dark green leafy vegetables; vitamin A‐rich deep yellow; orange and red
vegetables; vitamin C‐rich fruits; vitamin C‐rich vegetables; vitamin A‐rich fruits; eggs; all
other fruits and vegetables; and all other foods (including sugars, fats, and stimulants such as
tea and coffee). The food groups were taken from the standardized analytical research
protocol of the Women’s Dietary Diversity Project (24).
The frequency questionnaire focused on fonio and fonio products, and was completed to
estimate the usual frequency of fonio products consumption in a period of one month. The
questionnaire included a list of 15 fonio dishes with associated frequency categories.
Beliefs and attributes study
The beliefs and attributes study consisted of a questionnaire survey with the 108 women of
reproductive age. Topics to be included in the questionnaire were identified by a food
attribute and pile sort study (4). For this latter study, 26 women different from the 108, were
randomly selected from the households involved in the food consumption survey described
above. The main selection criteria were to be willing to participate and to have basic
knowledge on fonio. The study on food attributes and pile sort was carried out in three
2 Bas Nutrition Software, Arnhem, The Netherlands, www.bware.nl 3 Available from: http://www.fao.org/infoods/

Consumption of and beliefs about fonio
Page | 95
steps: pile setting, food difference and food attribute (4). The questionnaire was structured
in topics such as knowledge of iron deficiency; diabetes and fonio; outcomes of fonio
consumption; fonio attributes; perceived barriers to fonio consumption; information source;
people and factors that could enhance fonio consumption; and subjective beliefs about
fonio. To determine the perceptions of the women, the questions were reflected as
statements and the women were asked to indicate if they agree, disagree, or are neutral. For
each question, each response corresponds to a one‐point score.
Data analysis
Incomplete data of 6 women were dropped. Descriptives were used to determine average
portion size of fonio, mean energy and macronutrients intake, and contribution of fonio to
the mean energy intake. Descriptives were also performed to determine the most consumed
fonio dishes and the consumption frequency. Beliefs about fonio were reported as the
proportion of women who agree with the statements of the questionnaire. All analyses were
performed using SPSS 14.0.1 (2005) for windows.
Results
Fonio availability and consumption frequency
Overall, 11 food groups were available on Bamako markets: 1) cereals and cereal products,
2) roots and tubers, 3) legumes, nuts and seeds, 4) fruits and sweets, including beverages, 5)
vegetables including leafy vegetables; 6) meat and poultry; 7) fish and fisheries; 8) dairy and
eggs; 9) oils and fats; 10) spices; 11) stimulants and others (Table 1).
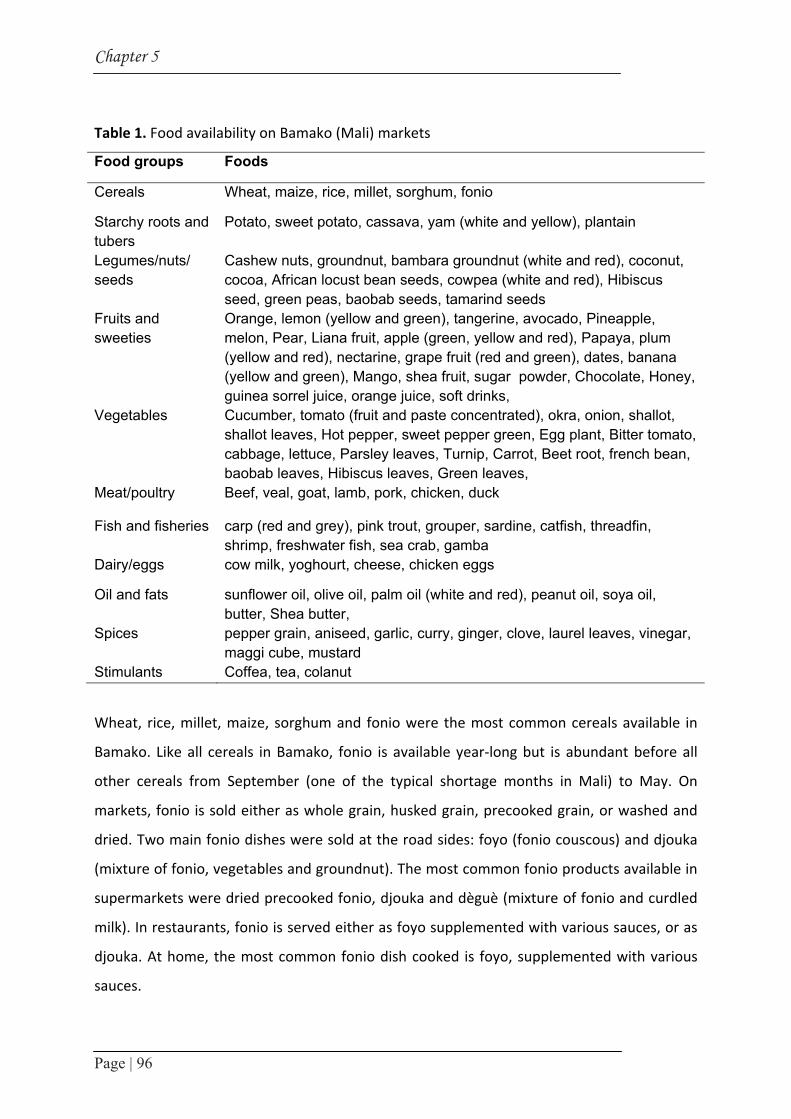
Chapter 5
Page | 96
Table 1. Food availability on Bamako (Mali) markets
Food groups Foods
Cereals Wheat, maize, rice, millet, sorghum, fonio
Starchy roots and tubers
Potato, sweet potato, cassava, yam (white and yellow), plantain
Legumes/nuts/ seeds
Cashew nuts, groundnut, bambara groundnut (white and red), coconut, cocoa, African locust bean seeds, cowpea (white and red), Hibiscus seed, green peas, baobab seeds, tamarind seeds
Fruits and sweeties
Orange, lemon (yellow and green), tangerine, avocado, Pineapple, melon, Pear, Liana fruit, apple (green, yellow and red), Papaya, plum (yellow and red), nectarine, grape fruit (red and green), dates, banana (yellow and green), Mango, shea fruit, sugar powder, Chocolate, Honey, guinea sorrel juice, orange juice, soft drinks,
Vegetables Cucumber, tomato (fruit and paste concentrated), okra, onion, shallot, shallot leaves, Hot pepper, sweet pepper green, Egg plant, Bitter tomato, cabbage, lettuce, Parsley leaves, Turnip, Carrot, Beet root, french bean, baobab leaves, Hibiscus leaves, Green leaves,
Meat/poultry Beef, veal, goat, lamb, pork, chicken, duck
Fish and fisheries carp (red and grey), pink trout, grouper, sardine, catfish, threadfin, shrimp, freshwater fish, sea crab, gamba
Dairy/eggs cow milk, yoghourt, cheese, chicken eggs
Oil and fats sunflower oil, olive oil, palm oil (white and red), peanut oil, soya oil, butter, Shea butter,
Spices pepper grain, aniseed, garlic, curry, ginger, clove, laurel leaves, vinegar, maggi cube, mustard
Stimulants Coffea, tea, colanut
Wheat, rice, millet, maize, sorghum and fonio were the most common cereals available in
Bamako. Like all cereals in Bamako, fonio is available year‐long but is abundant before all
other cereals from September (one of the typical shortage months in Mali) to May. On
markets, fonio is sold either as whole grain, husked grain, precooked grain, or washed and
dried. Two main fonio dishes were sold at the road sides: foyo (fonio couscous) and djouka
(mixture of fonio, vegetables and groundnut). The most common fonio products available in
supermarkets were dried precooked fonio, djouka and dèguè (mixture of fonio and curdled
milk). In restaurants, fonio is served either as foyo supplemented with various sauces, or as
djouka. At home, the most common fonio dish cooked is foyo, supplemented with various
sauces.

Consumption of and beliefs about fonio
Page | 97
Of the 15 fonio‐ based dishes, djouka, foyo and fini zamé (fried fonio) were eaten by 73 out
of 102 women (71%). Among those consumers, foyo and djouka were eaten by 41% and
55%, respectively (Table 2). Among those consuming foyo and djouka, 68% reported a
consumption frequency of one to three times per month. Few women (8%) reported
consumption of more than 10 times per month (Table 2). Fonio was more frequently
consumed as snack (djouka) on working days (62%) than on weekend (26%) and special
event (baptism and wedding) days (13%).
Table 2. Frequency of consuming fonio among women in Bamako (n = 73)
Times / month 1 2 3 4 5 6 8 10 13 Total Number of women consuming all fonio dishes
31 12 7 6 3 6 2 4 2 73
Number of women consuming by dish Total Djouka fonio 14 5 4 4 3 3 2 3 2 40Foyo 15 6 3 2 0 3 0 1 0 30Fini zamé 2 1 0 0 0 0 0 0 0 3Days of consumption Number of women
Working days Weekend days Event days Total 45 19 9 73
Fonio intake and contribution to energy intake
Starchy staples, vitamin C‐rich vegetables, all other fruits and vegetables, other flesh foods
and miscellaneous small animal protein, and legumes and nuts were the food groups mostly
consumed by the women (Table 3).
Among starchy staples, rice (38%), wheat products (33%) and millet products (20%) were the
most commonly consumed, the least consumed being fonio (5%). Tomato (36%), cabbage
(19%) and hot pepper (15%) were the most often consumed vitamin C‐rich vegetables, used
mainly as ingredients of sauces (percent not shown in table).
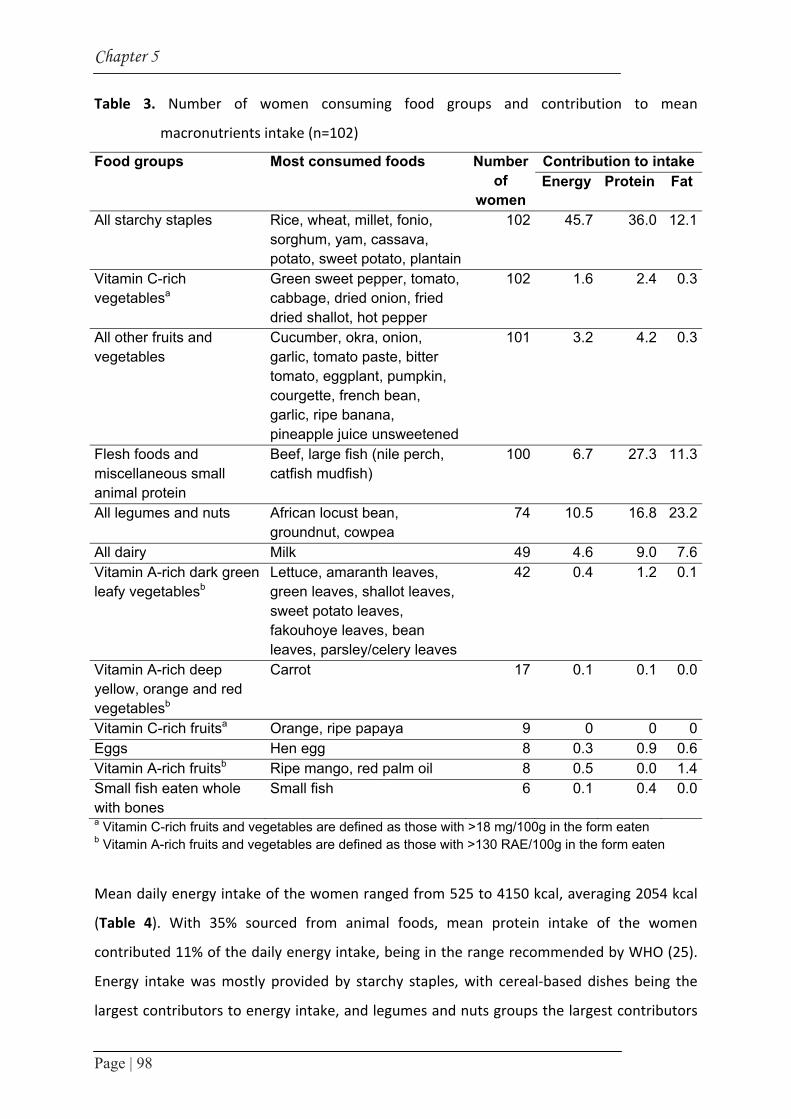
Chapter 5
Page | 98
Table 3. Number of women consuming food groups and contribution to mean
macronutrients intake (n=102)
Food groups Most consumed foods Number of
women
Contribution to intakeEnergy Protein Fat
All starchy staples Rice, wheat, millet, fonio, sorghum, yam, cassava, potato, sweet potato, plantain
102 45.7 36.0 12.1
Vitamin C-rich vegetablesa
Green sweet pepper, tomato, cabbage, dried onion, fried dried shallot, hot pepper
102 1.6 2.4 0.3
All other fruits and vegetables
Cucumber, okra, onion, garlic, tomato paste, bitter tomato, eggplant, pumpkin, courgette, french bean, garlic, ripe banana, pineapple juice unsweetened
101 3.2 4.2 0.3
Flesh foods and miscellaneous small animal protein
Beef, large fish (nile perch, catfish mudfish)
100 6.7 27.3 11.3
All legumes and nuts African locust bean, groundnut, cowpea
74 10.5 16.8 23.2
All dairy Milk 49 4.6 9.0 7.6Vitamin A-rich dark green leafy vegetablesb
Lettuce, amaranth leaves, green leaves, shallot leaves, sweet potato leaves, fakouhoye leaves, bean leaves, parsley/celery leaves
42 0.4 1.2 0.1
Vitamin A-rich deep yellow, orange and red vegetablesb
Carrot 17 0.1 0.1 0.0
Vitamin C-rich fruitsa Orange, ripe papaya 9 0 0 0Eggs Hen egg 8 0.3 0.9 0.6Vitamin A-rich fruitsb Ripe mango, red palm oil 8 0.5 0.0 1.4Small fish eaten whole with bones
Small fish 6 0.1 0.4 0.0
a Vitamin C-rich fruits and vegetables are defined as those with >18 mg/100g in the form eaten b Vitamin A-rich fruits and vegetables are defined as those with >130 RAE/100g in the form eaten
Mean daily energy intake of the women ranged from 525 to 4150 kcal, averaging 2054 kcal
(Table 4). With 35% sourced from animal foods, mean protein intake of the women
contributed 11% of the daily energy intake, being in the range recommended by WHO (25).
Energy intake was mostly provided by starchy staples, with cereal‐based dishes being the
largest contributors to energy intake, and legumes and nuts groups the largest contributors

Consumption of and beliefs about fonio
Page | 99
to fat intake (Table 4). Protein intake was mostly provided by starchy staples group (36%),
other flesh foods and miscellaneous small animal protein group (27%), and legumes and nuts
group (17%). Based on the proportion of women consuming fonio products, individual
portion size of fonio ranged from 113 to 208 g/day, averaging 152 g/day. The average energy
intake from fonio was 321.6±74.6 kcal/day, giving a contribution of 16% to mean daily
energy intake.
Table 4. Mean daily macronutrient intake of women (n=102)
Mean nutrient intake Mean SD Range % kcal
Energy (kcal) 2054.0 716.5 525 - 4150 Protein (g) 57.7 25.6 12.6 - 136.0 11Animal protein source (g) 20.1 20.0 0 - 8.6 4.6Plant source (g) 38.7 20.8 9.2 - 109.9 8.8Total carbohydrate (g) 310.1 112.3 106.6 - 605.6 57Total fat 73.2 34.8 1.7 - 181 32Fonio consumption Individual portion size of fonio (g) 152.4 35.3 113 - 208 Energy intake from fonio (kcal) 321.6 74.6 238.4 - 438.9
Beliefs and attributes about fonio
According to their background, more than half of the women reported that fonio contains
iron and its consumption could help prevent anemia and treat diabetes (Table 5). A large
share of the women (94%) was convinced that eating fonio is good for them and their family
members. Further, most of them thought that fonio had good cooking, organoleptic and
nutritional qualities and could contribute to diet’s variation. However, some barriers to fonio
consumption have been identified.

Chapter 5
Page | 100
Table 5. Beliefs about fonio consumption
Topic Questions Percent Knowledge Fonio is important to treat diabetes 88
Fonio can prevent anaemia 70.4Fonio contains iron 64.8
Outcomes from fonio consumption
Eating fonio is good for my household members 95.4Eating fonio is good for me 94.4
Fonio attributes Fonio has good taste, swells up well during cooking, is pleasant in mouth 99.6Fonio is a traditional food and diversifies meals 94.5Fonio stimulates appetite, easy digestible, nutritious, healthy, good for weight loosing 92.8Eating fonio helps to treat diseases and to prevent stomach problems 91.2
Perceived barriers Fonio not available throughout the year 76.9Fonio not available on markets and restaurants 73.5High cost of fonio products 69.4Fonio contains impurities, not white, has small size grain, low quality variety 62.8Not knowing how to cook fonio 42.6Household size too large to prepare fonio 51.9Time consuming, hardness of cooking 51.4Head of the household does not like fonio 45.4
Information source, people and factors enhancing fonio consumption
The media favourably affect decision to eat fonio 93.5Nurse, social workers, favourably affect decision to eat fonio 93.5Fonio consumed mostly during important ceremonies, like weddings, funerals or baptism 92.1Household members suffering from anaemia favourably affect decision to buy fonio 90.8Friends, members of my association, neighbours favourably affect decision to eat fonio 85.8People around me buying fonio makes me want to eat fonio 85.2Husband, household members, mother-in-law favourably affect decision to eat fonio 83.9A shortage of food favourably affects decision to eat fonio 81.5Fonio sellers favourably affect decision to buy fonio 79.7Fonio consumed mostly in restaurants and when guests in household 74.1
Subjective beliefs Fonio is for rich people 58.3Fonio is for poor people 35.2
These are: 1) seasonal shortage (or frequent unavailability) in restaurants (77%) and on
markets (74%); 2) high cost of fonio products (69%); 3) lack of knowledge about processing

Consumption of and beliefs about fonio
Page | 101
(43%); time consuming processing and difficult cooking process (51%); and 5) small size,
dirtiness and dark colour (some varieties) of fonio grains (63%). The size of the household
(52%) and the apathy of the household head for fonio consumption (45%) were additional
barriers reported by the women. Decision to buy or prepare fonio for the household could
be favourably influenced by factors such as media (94%), household members suffering from
anaemia (91%), neighbouring people buying fonio (85%) and food shortage (82%). The
women also reported that they ate fonio mostly in restaurants or when they have guests for
dinner at home (74%) and during important celebrations like weddings, baptism (92%).
Paramedical staff, friends, husband and family members are persons who could positively or
negatively influence fonio consumption. Beliefs such as “fonio is for rich people” were also
reported by 58% of the women as factors likely to influence fonio consumption.
Discussion
Food ethnography was performed to determine the contribution of fonio to the dietary
pattern, and to identify shared beliefs about fonio consumption in urban Mali.
Fonio is available in shortage season before the most common cereals are harvested. The
usual diet is based on cereal, mainly rice, and fonio was reported as consumed by 5% of the
women. The same trend has been earlier described for a rural area in Mali, but the main
cereal dishes were based on maize and sorghum, and fonio consumption reported by 12% of
men and women (26).
This difference could be linked to the relative abundance of almost all common cereals
during the food consumption survey period (post‐harvest), and also to the contrast of urban
vs. rural areas, where dishes are still mostly based on indigenous cereals (8). Consumption
frequency (one to three times a month) and average daily individual portion size of fonio
(152 g) were higher in the study compared to the frequency of less than once a month and
the individual amount of 650 to 840 g/person/year reported earlier in the study on fonio
consumption in urban areas (5).
This suggests an increase in fonio consumption since 2004. However, because of the low
proportion of women consuming fonio dishes (5%) and small size of daily portion consumed
(152 g/day) compared with those of rice (38% and 489 g/day, respectively), the contribution

Chapter 5
Page | 102
of fonio was about the fifth of the daily energy intake of the women consuming fonio dishes.
This small portion size of fonio compared to rice could be explained by the fact that fonio
was mostly consumed as snack. No previous studies reported contribution of fonio to energy
intake, thus hampering comparisons, but under same conditions (equivalent proportion of
consumers and daily portion size), fonio (steam‐cooked) would better contribute to energy
intake than rice, due to its higher energy content: 223 kcal/100g for cooked fonio as
compared to 102 kcal/100g for cooked rice (12).
Fonio has often been reported as a food mostly cooked and consumed during weekends and
special events (5, 7‐9, 15). A previous study in Bamako also reported that fonio was often
consumed outside and cooked in households mostly when there are guests (5). The
availability study confirmed that fonio products are mostly served in restaurants and most of
the women are likely to consume fonio outside. The food frequency survey revealed that
fonio is more often consumed on working days than on event days. This suggests that
encouraging development of ready‐to‐eat fonio‐based products would help increase the
consumption of fonio among women, especially in urban areas.
Difficult post‐harvest processing, time consuming cooking process, and high‐cost of fonio
products were often reported as common barriers to fonio consumption (5, 8, 9, 15). The
results of the present study not only supported previous studies but revealed other factors
that were also likely to hamper fonio consumption in Bamako. One of the perceived barriers
was the lack of knowledge about processing and cooking fonio. Due to its very small size,
fonio is contaminated with sand and dust during post‐ harvest processing and needs to be
carefully washed for several times using a traditional sedimentation method to get a cleaned
product, which must be steam‐cooked two to three times at least to get a soft‐in‐mouth and
easy‐to‐digest product (9). This cleaning and cooking process needs some basic ability and
knowledge that might not be common among all women, especially in the context of urban
areas. Another reported obstacle was the size of the household. This might be linked either
to the high cost of fonio products which could not allow purchasing large amounts when the
size of the household is large, or to the difficult cleaning and cooking process that might
increase cooking time in large size households. Furthermore, the apathy of the household
head for fonio consumption (perceived barrier for 45% of the women) might be related to

Consumption of and beliefs about fonio
Page | 103
the low quality of cooked fonio served by the women in the households due to their lack of
knowledge and skills. On the other hand, factors like food shortage, media, family members
suffering from anaemia, neighbourhood opinion, and paramedical staff, family members and
friends are likely to influence fonio consumption among the women. Association between
these factors and consumption of fonio needs to be tested in further studies. Finally, in the
present study, fonio was perceived to be for rich people by more than half of the women.
This viewpoint contradicts previous reports on fonio which often postulated fonio to be for
poor people (7, 9). These discrepancies in results might be due to the fact that this study was
carried out in an urban context and women could have linked their opinion to the high cost
of fonio products.
Conclusion
The purpose of this study was to determine shared beliefs that could positively or negatively
influence fonio consumption. Results showed that fonio is available year‐ long on markets in
Bamako, as all cereals, but is abundant before most of the common cereals. More than two‐
thirds (68%) of the women reported consuming fonio one to three times per month. Fonio
was more consumed as snack on working days than on weekend and special event days,
suggesting that encouraging development of ready‐to‐eat fonio‐based products would help
increase consumption of fonio among women in urban areas. Energy intake was mostly
provided by starchy staples, with cereal‐based dishes being the largest contributors to
energy intake. The average individual portion size of fonio was 152 g/day, and its
contribution to daily energy intake was 16%. A large share of the women was convinced that
eating fonio is good for them and their family members. Further, most of them thought that
fonio had good cooking, organoleptic and nutritional qualities and could contribute to diet’s
variation (91% to 100%). The decision to buy or prepare fonio by women in households
might be favourably influenced by factors such as media, household members suffering from
anaemia, neighbouring people purchasing fonio and shortage of other cereals; whereas
shortage of fonio products, high cost of fonio products, difficult cooking process, and lack of
knowledge about processing and cooking fonio are likely to limit fonio consumption among
women in urban area. Further, fonio was perceived to be for rich people by more than half
of the women. Improving cooking process and knowledge of women about fonio cooking, as

Chapter 5
Page | 104
well as creating a demand for the women with the husband and others through media,
social and health care services would help increase fonio consumption inside households in
Bamako. Further research should be designed to examine the effect of these factors on
consumption of fonio in urban areas in Mali.
Acknowledgements
We acknowledge European Union project N° 0015043 for funding the project. We are also
grateful to the late Guindo Doré (Institute or Rural Economics, Mali) for giving the
opportunity to conduct the field work; Jean‐François Cruz (CIRAD, general manager of Fonio
project) for institutional support; all the women for their willingness to participate and their
important contribution to the study. We thank Bianca Van Dam (Division of Human
Nutrition, Wageningen University) for her contribution to study design, data collection and
data entering.
Consumption of and beliefs about fonio
Page | 105
References
1. Shetty P. Food and nutrition: the global challenge: Introduction to Human Nutrition. 2002, New York: Oxford Blackwell publishing.
2. Diarra M, Sy K, Cissé S. Nutrition and Nutritional status, in M Ballo, S Traoré, I Niambélé, et al. ed Demography and Health Survey Mali (EDSM‐III). 2001, Macro international Inc: Maryland USA. chap 9:137‐164.
3. den Hartog AP, van Staveren WA, Brouwer ID, eds. Food habits and consumption in developing countries. Manual for field studies. 2006, Wageningen academic Publishers: Netherlands.
4. Blum L, Pelto P, Pelto G, Kuhnlein H. Community Assessment of Natural Food Sources of Vitamin A ‐ Guidelines for an Ethnographic Protocol. 1997, Boston, USA; Canada: International Nutrition Foundation for Developing Countries; International Development Research Centre.
5. Konkobo‐Yameogo C, Chaloub AO, Kergna N, Bricas Y, Karimou R, Ndiaye JL. Urban consumption of fonio, a traditional cereal in West Africa. [La consommation urbaine d’une céréale traditionnelle en Afrique de l’Ouest: le fonio]. Cah Agric. 2004; 13: 125‐128.
6. Sidibe A. Fonio in Mali [Le fonio au Mali], in Proceedings of the 1st workshop on genetic diversity of Fonio (Digitaria exilis Stapf.) in West Africa, 4 ‐ 6 August 1998, SR Vodouhe, A Zannou,GE Achigan‐Dako, Eds. 2003, IPGRI, Rome, Italy: Guinea Conakry. 17‐21.
7. Vietmeyer N, Borlaugh N, Axtell J, Burton G, Harlan J, Rachie K. Fonio (Acha), in NRC/BSTID ed Lost crops of Africa. 1996, National Academy Press: Washington DC. 59‐76.
8. Vodouhe SR, Zannou A, Achigan Dako EG. Proceedings of the first workshop on genetic diversity of fonio (Digitaria exilis) in West Africa (Premier Atelier sur la Diversité Génétique du Fonio en Afrique de l’Ouest); 4‐6 August 1998, 2003, IPGRI, Rome, Italy: Conakry, Guinea. 36‐41.
9. Cruz J‐F. Fonio: a small grain with potential. LEISA. 2004; 20: 16‐17. 10. Bosch CH , Borus DJ, eds. Cereals and pulses of Tropical Africa. Conclusions and
recommendations based on PROTA 1: ‘Cereals and pulses’. 2007, PROTA Foundation: Wageningen, Netherlands.
11. Vodouhè SR, Achigan‐Dako EG. Digitaria exilis (Kippist) Stapf, in MBaG Belay ed Plant Resources of Tropical Africa. 2006, PROTA Foundation; CTA; Backhuys Publishers: Wageningen,The Netherlands. Vol 1: 59‐63.
12. Barikmo I, Ouattara F, Oshaug A. Table de composition des aliments du Mali (TACAM), 2004: Oslo: Akershus University College.
13. Temple JV, Bassa DJ. Proximate chemical composition of Acha (Digitaria exilis) grain. J Sc Food Agric. 1991; 56: 561‐563.
14. Cruz JF, Dramé D. Fonio‐based recipes. Projet CFC/IGG : Improving post‐harvest processing of fonio. 2004, Mali; Guinée; France: IER; IRA; IRSAD/CIRAD
15. Adoukonou‐Sagbadja H, Dansi A, Vodouhè R, Akpagana K. Indigenous knowledge and traditional conservation of fonio millet (Digitaria exilis Stapf, Digitaria iburua Stapf) in Togo. Biodivers Conserv. 2006; 15: 2379‐2395.
16. SNA. System of National Accounts 1993. 1993, Brussels/Luxembourg; New York; Paris; Washington DC: Inter‐Secretariat Working Group on National Accounts; Commissions of the European Communities‐Eurostat; International Monetary Fund; OECD; United Nations; World Bank.
17. Bartlett JE, Kotrlik JW, Higgins C. Organizational research: Determining appropriate sample size for survey research. Inf Technol Learn Perform J. 2001; 19: 43‐50.
18. UNICEF. Monitoring the Situation of Children and Women. Multiple indicator cluster survey manual 2005. 2006, Division of policy and planning, Plaza, New York.

Fonio as a staple food in Mali: an approach to upgrade nutritional value
Page | 106
19. Gibson R, Ferguson E. An interactive 24‐hour recall for assessing the adequacy of iron and zinc intakes of developing countries. Technical monograph 8: Harvest Plus. 2008, Washington, DC.
20. USDA. National Nutrient Database for Standard Reference, Release 18. 2005, Available from Nutrient Data Laboratory Home Page, http://www.ars.usda.gov/ba/bhnrc/ndl: Agricultural Research Service, US Department of Agriculture.
21. USDA. National Nutrient Database for Standard Reference, Release 20. 2007, Available from Nutrient Data Laboratory Home Page, http://www.ars.usda.gov/ba/bhnrc/ndl: Agricultural Research Service, US Department of Agriculture.
22. Holland B, Welch AA, Unwin ID, Buss DH, Paul AA, Southgate DAT. The Composition of Foods McCance & Widdowson’s 5th Ed. 1991, The Royal Society of Chemistry and Ministry of Agriculture, Fisheries and Food, Cambridge.
23. USDA. US Department of Agriculture. Table of Nutrient Retention Factors, Release 6. 2007, Available from Nutrient Data Laboratory Home Page, http://www.ars.usda.gov/ba/bhnrc/ndl: Agricultural Research Service, US Department of Agriculture.
24. Arimond M, Wiesmann D, Torheim L. Validation of dietary diversity as a measure of the micronutrient adequacy of women’s diets. Background and research protocol 3rd version. Submitted to the Food and Nutrition Technical Assistance Project (FANTA)/ Academy for Educational Development (AED), 2007.
25. World Health Organisation. Nutrition and the Prevention of Chronic Diseases. Report of a Joint WHO/FAO Expert Consultation. Technical Report Series 916. 2003, Geneva.
26. Torheim LE, Ouattara F, Diarra M, Thiam F, Barikmo I, Hatloy A, Oshaug A. Nutrient adequacy and dietary diversity in rural Mali: association and determinants. Eur J Clin Nutr. 2004; 58: 594‐604.

Chapter 6
Factors predicting
consumption of fonio grain (Digitaria exilis) among
urban Malian women of reproductive age
Nadia Fanou-Fogny, Bianca van Dam, Yara Koreissi,
Romain AM Dossa†, Inge D Brouwer
Journal of Nutrition Education and Behaviour 2011; 43:219-228.

Chapter 6
Page | 108
Abstract
Objective: To identify factors influencing intention to consume an indigenous nutritious
grain, fonio (Digitaria exilis), among women in Mali.
Design: A cross‐sectional questionnaire survey based on the Theory of Planned Behavior and
the Health Belief Model.
Setting and Participants: One hundred and eight women (31.5 ±10.5 years), randomly
selected by a 3‐stage cluster sampling, Bamako, Mali.
Main Outcome Measures: Model constructs scores, intention to consume fonio, and fonio
consumption.
Analysis: Correlation and multiple regression, Wilcoxon signed rank and Mann‐Whitney tests
for score comparison.
Results: Attitudes toward behavior (β = 0.32, P < 0.05) was the best predictor of intention to
consume fonio, which was significantly correlated with fonio consumption (rho = 0.78, P <
0.001). Health value (β = 0.23, P < 0.05) was a significant predictor of health behavior
identity, which was significantly correlated with attitudes toward behavior (rho = 0.67, P <
0.001) and perceived barriers (rho = 0.33, P < 0.001). The latter formed a significant
interaction term between intention and behavior (β = ‐ 0.72, P < 0.05).
Conclusions and Implications: Fonio consumption could be increased in Bamako through
stimulation of positive attitudes, changing men’s beliefs, influencing family and neighbors’
opinions, and improving the processing and the skills of women who prepare fonio.
Predicting fonio consumption
Page | 109
Introduction
Sorghum and millets are among the world’s most important food crops being the main
sources of protein and energy (1) especially for inhabitants of the semi‐arid tropics. In Mali,
sorghum, millet, maize, rice and fonio are traditionally common cereals which provide the
basis for a daily meal in many households (2).
Fonio (Digitaria exilis) is considered one of the oldest West African indigenous cereals (3). Up
to 250 000 tons of fonio is produced annually on more than 380 000 hectares (4), and its
contribution to food security has been suggested (5). Fonio resembles Te’f (Eragrostis tef), a
traditional cereal cultivated in Ethiopia. Te’f and fonio have some similarities in structural
and physicochemical properties (6). The potential for production of fonio in West Africa is
high, because it performs better than other cereals under conditions of drought and low soil
fertility, and is less susceptible to damage by pests during storage (7). In countries like
Burkina Faso, Guinea, Senegal, Mali and Nigeria, fonio is a staple food especially for
communities in mountainous areas (3). Its potential for reducing human misery during
“hungry times” is valuable because some varieties have a very short growing cycle and are
ready to harvest before all other grains. Moreover, when the other cereals are scarce due to
a failing harvest, fonio consumption is high (3).
Nutritionally, fonio is regarded as a rich source of energy during the food shortage season
(3). The food composition table of Mali indicates fonio as the cereal with the highest content
of calcium (41 mg/100g dry matter) compared to the other cereals, and the second for
highest concentration of protein (7.1 mg/100g dry matter) and iron (8.5 mg/100g dry
matter) after sorghum (11 mg/100g dry matter for both protein and iron) (8). Fonio is also an
excellent source of methionine, cysteine and leucine, whose concentrations are slightly
higher than those defined for the FAO reference protein (9). Fonio species contain less
polyphenols than sorghum (10), hence the high digestibility of protein observed in fonio
(11).
Fonio is among the world’s best‐tasting cereals and has a high diversity of uses in human
consumption (3). In many African countries, fonio is traditionally cooked as couscous,
various porridges and dishes, and local beverages (11). Also, fonio has been used for bakery
products such as cakes, doughnuts and cookies, and has been suggested as a substitute for
semolina (a wheat product used to make pastas) (6).
Chapter 6
Page | 110
Fonio has a great religious and socio‐cultural importance for its producers in many West
African communities (3, 12, 13). In Senegal, Mali, Guinea, Burkina Faso and Togo, fonio is
reserved particularly for chiefs, royalty and special occasions like Ramadan for Muslims (12,
13). For some traditional communities in Togo, fonio is the most important ingredient in
women’s initiation ceremonies, weddings, and for the traditional baptism of newborn
children. In some communities fonio is believed to help prevent blood clotting after women
give birth (12) and fonio porridge is recommended for breastfeeding women to stimulate
milk production (14). The grain is also reported to be easy to digest (4).
One of the objectives of the Plan of Action of the Food World Summit 1996, was to reduce
by half the number of undernourished people before the year 2015. The importance of the
production and consumption of traditional under‐utilized crops with good nutritional value,
which have been abandoned in favour of commercial crops, was highlighted among the
recommended strategies to ensure food security in West African households (14, 15). From a
nutrition perspective, under‐utilized crops such as fonio could increase the availability of
energy and nutrients and provide a balanced diet composition, improving food security in
low‐income rural and urban households. Moreover, fonio can be cultivated in small family
farms with minimum costs of water and fertilizers, in land not appropriate for other crops.
Therefore, small producers and women may obtain economic benefits from these income‐
generating activities (15).
During the past 10 years, collaborative efforts have been made to make fonio more
competitive on markets in terms of quality and price, by domesticating the seeds, and
improving the grain processing techniques at small companies and women’s groups through
the modernization of existing and the development of new equipment (4). Modern small‐
scale processing industries for ready‐to‐cook products have been developed (16). Despite
these efforts, fonio is still under‐utilized and its consumption is low in urban areas. In urban
areas in Mali, fonio accounts for less than 1% of the cereals eaten, and the average
consumption is between 0.5 kg to 1.0 kg per person annually (16).
To date, limited research has indicated that difficult post‐harvest processing, a time
consuming cooking process, and the high‐cost of fonio products compared to other cereals
like maize, rice and millet, are the main factors explaining low consumption of fonio in urban
areas (16). However, social factors and cultural beliefs can also influence food choice and
consumption patterns (17). To improve the consumption of fonio as a staple food in urban

Predicting fonio consumption
Page | 111
areas, there is a need to identify social cognitive factors that may positively or negatively
influence its consumption, especially in urban contexts. Also, the interrelationships among
the potential factors and the consumption of fonio are important issues to be clarified in the
process of enhancing production and consumption of a crop that could contribute to
household food security in both rural and urban areas.
The Theory of Planned Behavior (TPB) (18, 19) and the Health Belief Model (HBM)(20) have
been used to examine factors influencing consumption behavior (21, 22). According to the
TPB, behavior is mainly determined by a related intention. Behavioral intention is
established based on behavioral attitudes, subjective norms, and perceived behavior (18,
19). The HBM is a health‐specific model, which suggests that health behaviors are the result
of a set of core beliefs (21).
Sun et al. (23) suggested a new model based on the combination of the TPB and the HBM in
their study on variables that significantly predict intention to consume iron‐fortified soy
sauce in rural and urban areas of China. This new model consists of 12 constructs distributed
within internal and external factors (Figure 1) (23, 24). Perceived susceptibility is one’s
subjective perception of the risk of contracting a health condition, and perceived severity
expresses the feelings concerning the seriousness of contracting an illness or leaving it
untreated. Health value represents the importance of the health consequences of the
disease. Perceived barriers are the beliefs about negative aspects of the behavior, while
attitudes towards behavior are the positive or negative evaluation of the consequences of
the behavior and its importance. Health behavior identity reflects whether the person thinks
that performing the behavior is a good thing to do. External control beliefs represent one’s
perceived ability to perform the behavior, while cues to action are external triggers that
stimulate action to perform the behavior. Subjective norms reflect what others think the
individual should do and the individual’s motivation to comply. In the Attitude‐Social
Influence‐Self Efficacy model (25) the perceived barriers in internal factors are expected to
be an interaction term in the relationship between intention and behavior. This relationship
was added to the original model of Sun et al. (23) in our study.
Using the combined models of the TPB and HBM, the present study seeks to identify factors
influencing the consumption of fonio among women of reproductive age in urban areas in
Mali.

Chapter 6
Page | 112
Methods
Participants and sampling
In total, 108 apparently healthy women of reproductive age (15‐49 year‐old) belonging to
one Malian sociolinguistic group were randomly selected from 108 households in 12
quarters of Bamako, using a 3‐stage cluster sampling, as described by UNICEF (26).
Households were selected using the random walk method (27), and all eligible women of the
selected households were listed. From this list, one woman was randomly selected in each
household for the questionnaire survey. The main selection criteria were willingness to
participate and basic knowledge on fonio products as foods. When a selected woman did not
fulfill the selection criteria, another woman in the same household was selected. Almost all
selected women met the selection criteria.
To identify the items of the model, an attribute‐pile sort (APS) study was conducted with 26
key informant women, randomly selected from the previously described list of eligible
women based on their willingness to participate, excluding those selected for the main
study. Verbal agreements were obtained from the local leaders of the quarters, the heads of
households and the women before starting the survey. The study is part of a larger project
aiming at upgrading the quality and competitiveness of fonio for improved livelihoods of the
stakeholders of the marketing system (28). One objective of the project is to determine the
mean nutrient intake and nutritional status of the women of reproductive age in Bamako
and the importance of fonio in the dietary pattern. The proposal of the whole survey was
approved by the Ethical Committee of the National Institute of Public Health Research of
Mali.
Food APS study
The food APS study was conducted in 3 steps: the pile sorting, the food difference and the
food attributes, as described in Blum et al. (29). The food groups of the Mali food
composition table (8) were used for the pile sorting. The food difference method was based
on comparison of fonio with rice and millet. The food attributes method was applied only for
fonio and fonio products.

Pred
icticting
fon
io co
nsu
mp
tion
Page | 113
Attitudes towards behavior
Health behavior identity
Perceived barriers
Health value
Perceived severity
Perceived susceptibility
Knowledge
Background and perception
Behavioral intention Behavior
Belief and attitude
Intention Behavior
Subjective norms
Cues to action
Control beliefs
External factors
.59**
.46*
.50
.59**
.33**
.67**
.19
.29**
.26** .25* .19
.78**
-.01
Internal factors
Figure 1. Combined Health Belief Model and Theory of Planned Behavior based on Sun et al. (23) with Spearman correlation coefficients between constructs. * P<0.05, ** P<0.01

Chapter 6
Page | 114
The women were asked to describe 3 main attributes: (1) the outcomes (advantages and
disadvantages) expected when consuming fonio products, (2) the people and the
information sources that would enhance their fonio consumption, and (3) the factors that
would limit their consumption of fonio.
Questionnaire
The questionnaire consisted of 76 items identified by a literature search and the APS study.
The items were categorized according to the 12 constructs of Sun et al.’s model (Figure 1)
(23). The maximum number of questions per construct was 20 (perceived barriers). External
control beliefs had only one question. Items about iron deficiency and diabetes were
introduced in background and perception constructs because relationships were expected
between these items and fonio consumption based on the answers of the women during
APS study. Behavioral intention and behavior are intention to consume fonio and fonio
consumption respectively. Socio‐demographic characteristics were recorded as well. The
questionnaire was translated into French and Bambara (the most common local language) to
ensure that locally used terms for iron in food, iron‐rich food, iron deficiency, and diabetes
were used. Correctness of the translation was checked with back translation into English and
French respectively. To ensure that questions were comprehensible for the women and that
they were stated in a standardized way by the interviewers, the questionnaire was pre‐
tested among 10 women different from those participating in the research. No change to the
questionnaire was necessary after the pre‐test.
Variables measurement
The variables were measured at the respondents’ home through structured interviews
carried out by well‐trained local female assistants (native French and Bambara speakers)
based on the questionnaire. To ascertain that the women understood the terms "diabetes",
"iron in food", and "anemia", they were asked if they had heard about these terms, and
whether they could give an example of food rich in iron before starting the interviews. No
woman was removed from the study because all of them were aware of the terms. All
questions, except for those related to socio‐demographic characteristics, were reflected as
statements and the women were asked to indicate their level of agreement using a 5‐point

Predicting fonio consumption
Page | 115
Likert response scale, ranging from strongly disagree to strongly agree. To ensure that
respondents understood the Likert scale well, an example question not related to fonio was
used to clarify the response scale before each interview. For intention to consume fonio and
fonio consumption, a different answer scale was used: no consumption, once a month, 2‐3
times a month, once a week, and 2 or more times a week.
The items of most constructs were scored from 1 to 5. However, the items of 2 constructs
(attitude towards behavior and subjective norms) consisted of pair questions (behavioral
beliefs & evaluation of beliefs, and normative beliefs & motivation to comply, respectively).
The scores of the behavioral and normative beliefs ranged from ‐2 to 2, and scores of the
evaluation of beliefs and motivation to comply ranged from 1 to 5. The scores of the pair
questions were then multiplied to derive one score for each item. This resulted in a score
range of ‐10 to 10 for each item. For each respondent, the scores within a construct were
added, to derive a total score per construct.
Data analysis
Descriptive statistics were performed to examine socio‐demographic characteristics of the
women, and to calculate the median scores of the constructs. Multiple item constructs were
tested for reliability of the questionnaire and internal consistency using Cronbach’s α and
item‐total correlation (30). The items within a construct were regarded as consistent when
Cronbach’s α was approximately 0.80 or higher and the corrected item‐total correlation of
all items in a construct was higher than 0.30 (30). The Wilcoxon signed‐rank test was used to
compare the scores of intention to consume fonio and fonio consumption and to test
whether the subjects significantly changed their response in one direction (i.e. score
intention > score behavior). A Mann‐Whitney test was used to examine whether the scores
of women with a high intention and those with a low intention to consume fonio were
significantly different. Spearman’s correlation (31) was used to test the bivariate association
within constructs. Multiple linear regression analyses were performed to examine the
contribution of the constructs to intention to consume fonio, and to assess whether the
perceived barriers were a significant interaction term in the relationship between intention
to consume fonio and fonio consumption. All models were adjusted for age, education and
interviewer. Overall, statistical tests were two‐tailed and P‐values < 0.05 were considered

Chapter 6
Page | 116
statistically significant. All statistical analyses were performed using SPSS for Windows (SPSS
Inc., version 12.0.1, Chicago, Ill, 2003).
Results
The mean age of the women was just beyond 30 years and 15% of the respondents were
adolescent (15‐18 year‐old). Illiteracy rate was 29%, while 17% reached secondary and
higher school. Approximately half of the women (46.3%) went to primary school, but not
always completed the education program. Two‐thirds of the women were married and 34%
had more than 3 children. One‐third of them have no children. Two‐thirds of the women
obtained an income, mainly by commerce activities (Table 1).
Cronbach’s α coefficients ranging from 0.77 to 0.95 demonstrated high reliability of the
multiple item constructs (Table 2). Median scores for all constructs ranged from 4 (external
control beliefs) to 70 (perceived barriers). The high value of median scores in comparison to
the range of possible scores showed that most women tended to agree with the statements.
Table 1. Sociodemographic characteristics of the women (n=108)
Characteristics Percent Age
15 – 18 years 14.819 – 34 years 46.335 – 49 years 38.9
Education Illiterate 28.7Primary school a 46.3Islam school a 8.3Secondary school or higher a 16.6
Ethnic group Malinké 21.3Bambara 18.5Peulh 12.0Other (Sarakolé, Senofo, Bamanan etc.) 48.1
Marital Status Married 67.3Separated 2.9Unmarried 26.9Widow 2.9
Number of children No 331 to 3 32.94 to 11 34.1Income-generating activities 66.7a Some of the subjects did not complete the education program. Note: A household is considered as a group of persons who sleep and eat together.
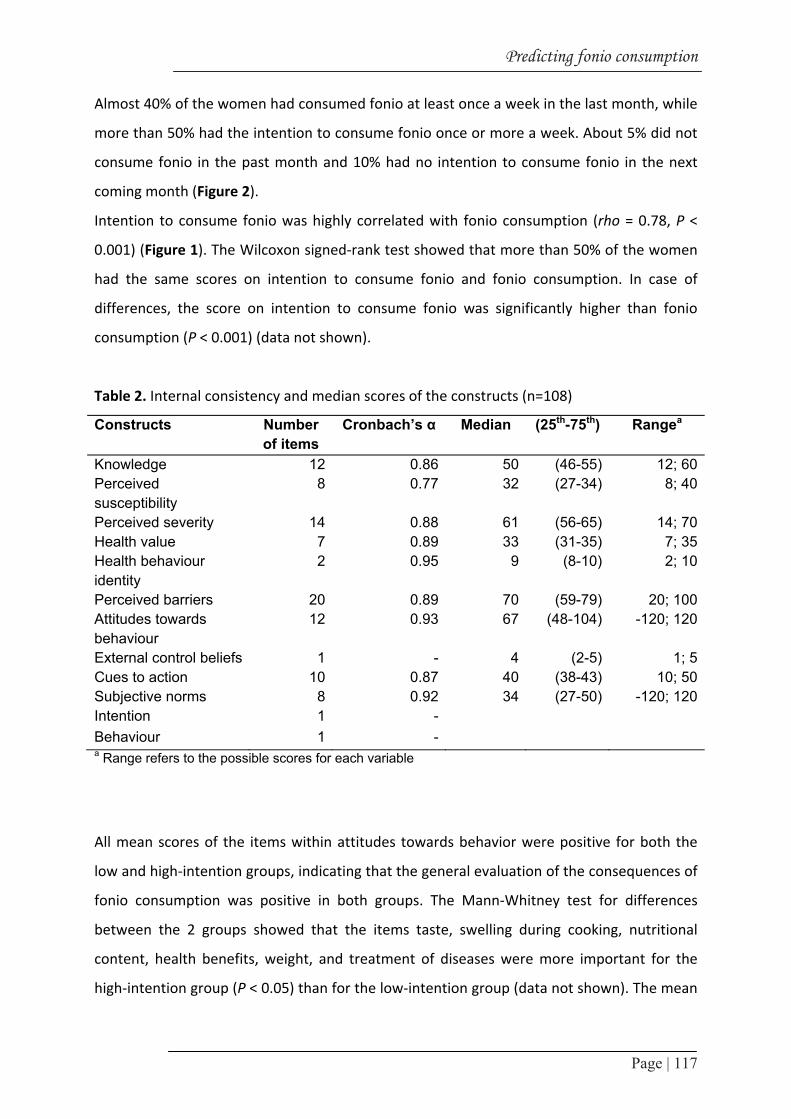
Predicting fonio consumption
Page | 117
Almost 40% of the women had consumed fonio at least once a week in the last month, while
more than 50% had the intention to consume fonio once or more a week. About 5% did not
consume fonio in the past month and 10% had no intention to consume fonio in the next
coming month (Figure 2).
Intention to consume fonio was highly correlated with fonio consumption (rho = 0.78, P <
0.001) (Figure 1). The Wilcoxon signed‐rank test showed that more than 50% of the women
had the same scores on intention to consume fonio and fonio consumption. In case of
differences, the score on intention to consume fonio was significantly higher than fonio
consumption (P < 0.001) (data not shown).
Table 2. Internal consistency and median scores of the constructs (n=108)
Constructs Number of items
Cronbach’s α Median (25th-75th) Rangea
Knowledge 12 0.86 50 (46-55) 12; 60Perceived susceptibility
8 0.77 32 (27-34) 8; 40
Perceived severity 14 0.88 61 (56-65) 14; 70Health value 7 0.89 33 (31-35) 7; 35Health behaviour identity
2 0.95 9 (8-10) 2; 10
Perceived barriers 20 0.89 70 (59-79) 20; 100Attitudes towards behaviour
12 0.93 67 (48-104) -120; 120
External control beliefs 1 - 4 (2-5) 1; 5Cues to action 10 0.87 40 (38-43) 10; 50Subjective norms 8 0.92 34 (27-50) -120; 120Intention 1 - Behaviour 1 - a Range refers to the possible scores for each variable
All mean scores of the items within attitudes towards behavior were positive for both the
low and high‐intention groups, indicating that the general evaluation of the consequences of
fonio consumption was positive in both groups. The Mann‐Whitney test for differences
between the 2 groups showed that the items taste, swelling during cooking, nutritional
content, health benefits, weight, and treatment of diseases were more important for the
high‐intention group (P < 0.05) than for the low‐intention group (data not shown). The mean
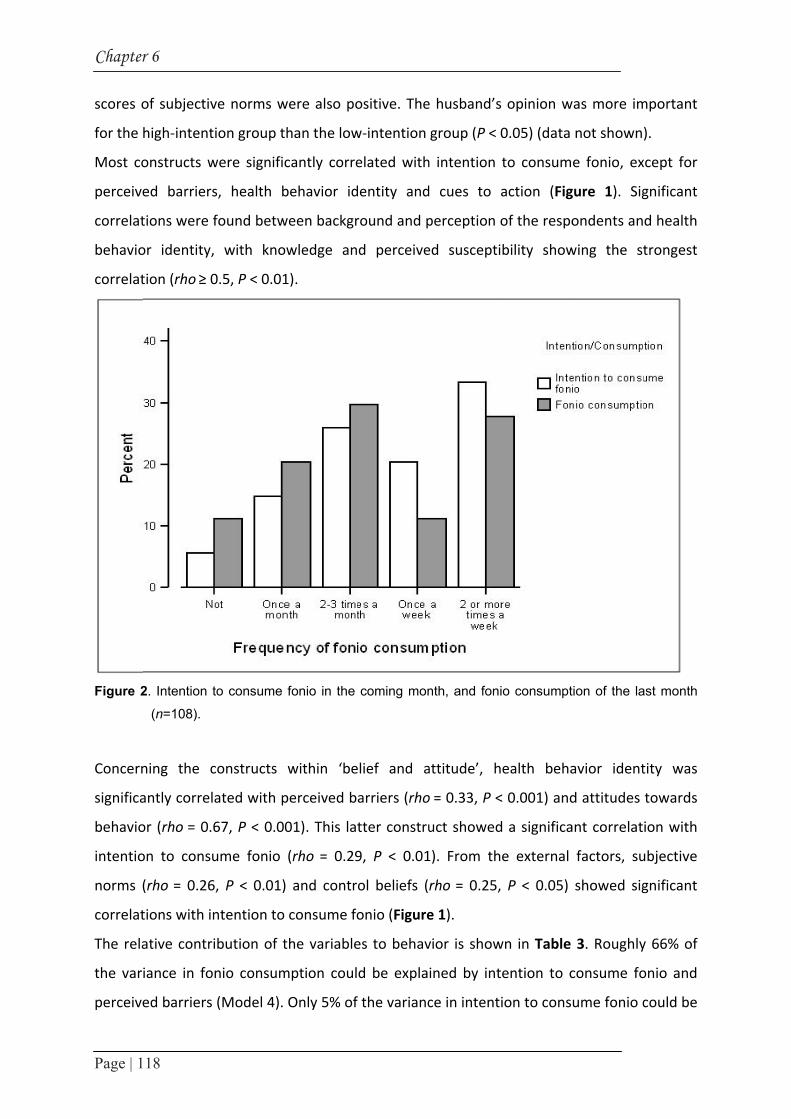
Chapter
Page | 1
scores o
for the
Most co
perceive
correlat
behavio
correlat
Figure 2
Concern
significa
behavio
intentio
norms (
correlat
The rela
the var
perceive
r 6
18
of subjectiv
high‐intent
onstructs w
ed barriers
tions were f
or identity,
tion (rho ≥ 0
2. Intention t
(n=108).
ning the c
antly correla
or (rho = 0.6
on to consu
(rho = 0.26
tions with in
ative contri
iance in fo
ed barriers
ve norms w
ion group t
were signific
s, health b
found betw
with kno
0.5, P < 0.01
to consume
constructs
ated with p
67, P < 0.00
ume fonio
6, P < 0.01)
ntention to
ibution of t
nio consum
(Model 4).
were also po
han the low
cantly corre
behavior id
ween backgr
wledge an
1).
fonio in the
within ‘be
perceived b
01). This lat
(rho = 0.29
and contr
consume fo
the variable
mption coul
Only 5% of
ositive. The
w‐intention
elated with
dentity and
round and p
d perceive
coming mon
elief and a
arriers (rho
tter constru
9, P < 0.01
ol beliefs (
onio (Figure
es to behav
d be expla
f the varianc
e husband’s
group (P <
h intention
d cues to
perception
ed suscepti
nth, and foni
attitude’, h
o = 0.33, P <
uct showed
1). From th
rho = 0.25,
e 1).
vior is show
ined by int
ce in intent
s opinion w
0.05) (data
to consum
action (Fig
of the respo
bility show
io consumpt
health beha
< 0.001) and
d a significa
e external
P < 0.05)
wn in Table
tention to c
ion to cons
was more im
not shown
e fonio, ex
gure 1). Sig
ondents an
wing the st
tion of the la
avior ident
d attitudes
ant correlat
factors, su
showed sig
3. Roughly
consume fo
ume fonio c
mportant
).
xcept for
gnificant
d health
trongest
ast month
tity was
towards
ion with
ubjective
gnificant
y 66% of
onio and
could be

Predicting fonio consumption
Page | 119
explained by ‘Belief and attitude’, of which attitudes towards behavior was the only
significant predictor (Model 2; standardized β = 0.32, P < 0.05). The variables within
‘Background and perception’ accounted for 34% of the variance in health behavior identity,
where only health value was a significant predictor (Model 1; standardized β = 0.23, P <
0.05). Subjective norms from the external factors seemed to be the best predictor for
intention to consume fonio (standardized β = 0.28, P < 0.05, not shown in the table), but
significance disappeared after adjusting for age, education, and interviewer (Model 3). In
model 4, perceived barriers were a significant interaction term (standardized β = ‐0.72, P <
0.05) in the relation between intention to consume fonio and fonio consumption. In the
high‐barrier‐group (score on perceived barriers > 70, n = 54) the association between
intention to consume fonio and fonio consumption was lower (rho = 0.69, P < 0.001)
compared to the low‐barrier group (score on perceived barriers ≤ 70, n = 54, rho = 0.87, P <
0.001).
Discussion
The core objective of our study was to identify factors influencing the consumption of fonio
among women of reproductive age in urban areas in Mali, using the adjusted model of Sun
et al. (23). Intention to consume fonio was a good predictor of fonio consumption among
women of reproductive age. A greater intention to consume fonio was directly associated
with positive attitudes and through these, was indirectly influenced by health behavior
identity. The latter was associated with health value. Finally, the association between
intention and behavior was lower when perceived barriers were higher.
Our study confirmed the results of previous studies stating that the behavior is mainly
determined by a related intention. Intention accounted for 66% of the variance in the
behavior in our study. No similar previous studies on fonio or other cereals has been
reported to allow comparison, but the predictive power of behavior in our study was higher
in comparison with previous studies using the TPB model (31‐33).

Chapter 6
Page | 120
Table 3. Predictors of health behavior identity (model 1), intention to consume fonio (models 2 and 3) and fonio consumption (model 4) among women of reproductive age in Mali (n=108)
Modelsa Standardized β
P R2 Adjusted R2
Model 1 Dependent variable: health behaviour identity 0.39 0.34Knowledge 0.22 0.089 Perceived susceptibility 0.08 0.466 Perceived severity 0.19 0.128 Health value 0.24b 0.011 Model 2 Dependent variable: intention to consume 0.11 0.05Health behaviour identity 0.03 0.785 Perceived barriers -0.07 0.500 Attitudes towards behaviour 0.32b 0.016 Model 3 Dependent variable: intention to consume 0.12 0.07External control beliefs 0.19 0.071 Cues to action -0.01 0.918 Subjective norms 0.25 0.068 Model 4 Dependent variable: fonio consumption 0.67 0.66Age 0.15 0.011 Perceived barriers 0.34 0.050 Intention to consume fonio 1.39 0.063 Perceived barriers - Intention to consume fonio
-0.72b 0.037
aall models are adjusted for age, education and interviewers effect bstandardized β for these variables were significant (P < 0.05)
The proportion of women who intended to consume fonio once a week was higher than
those consuming fonio once a week in the past month, indicating the potential role of a
nutrition education program for promoting the consumption of fonio in urban areas.
Increasing fonio consumption in urban areas may strengthen livelihoods of the women who
develop modern small‐scale processing industries for ready‐to‐cook fonio, while contributing
to energy supply for households especially during the food shortage season.
Concerning the internal factors, the study showed that attitude measures were the best
predictor of behavioral intention, confirming the findings of Nejad et al. (22). The most
Predicting fonio consumption
Page | 121
important items reported within positive attitudes were good taste, pleasantness in the
mouth, easy digestibility, healthiness, nutritious quality, meal diversification, contribution to
weight maintenance, and appetite stimulation. Those beliefs were also reported in previous
studies (2‐5, 12, 13, 16). The positive mean scores of the items and the correlation of the
construct with intention to consume fonio suggested that these qualities should be
emphasized to stimulate fonio consumption in urban areas. The women also liked fonio
because of its traditional value. This confirmed the results of Konkobo‐yameogo et al. (16)
who reported that in urban areas in Mali and Burkina Faso, fonio is also considered as an
African food and the consumers like it because it is a food traditionally included in their
dietary pattern.
Health behavior identity appeared to be a good mediating variable for stimulating a positive
attitude towards fonio consumption. This indicates that women will evaluate the
consequences of fonio consumption more positively, when they agree that fonio is good for
them and their household members. Previously, Sun et al. (23) also found a significantly
positive correlation between health behavior identity and attitudes towards iron‐fortified
soy sauce consumption. Health behavior identity was also positively associated with
perceived barriers, indicating that women perceive more barriers when they are convinced
that consuming fonio is good for them. Conversely, the association between intention and
behavior is lower when the perceived barriers are higher. Sun et al. (23) also demonstrated
that Chinese women perceived more barriers when they agree that iron‐fortified soy sauce
was good for them and their household members.
The results of this study indicated 8 significant barriers to consuming fonio, including
availability in city markets, restaurants or canteens, lack of consistent supply throughout the
year, high cost of fonio products, hard texture coupled with time‐consuming cooking
process, a lack of knowledge related to preparing and cooking, poor quality of fonio (dirty
and filled with sand) cooked at home, large family size requiring a larger amount of fonio,
and an apathetic head of household. Our results not only support the barriers reported by
Konkobo‐yameogo et al. (16) but revealed that other factors are also likely to limit fonio
consumption in Bamako. One of them was the lack of knowledge about processing and
cooking. Indeed, due to the very small size of fonio grains, threshing, removing husks and
hulls, and milling are time‐consuming: it takes nearly 1 hour to peel just 1 to 2 kilos of fonio
by hand (4). After a complete dehulling, the grain is still contaminated with sand and dust,

Chapter 6
Page | 122
and needs to be carefully washed for several times using a traditional sedimentation method
to get a cleaned product. This latter product must be steam‐cooked 3 times at least to get a
soft‐in‐mouth and easy‐to‐digest product (4). This cleaning and cooking process requires
some basic ability and knowledge (16) that might not be common among all women,
especially in urban areas. Another reported bottleneck was the size of the household. This
factor could be related either to the high cost of fonio products compared to rice, which
would make it difficult to afford large amounts to feed the entire household, or to the
difficult cleaning and cooking process that might increase cooking time in large size
households. The apathy of the household’s head for fonio consumption might be related to
the low quality of the fonio‐based foods served by the women in the households due to their
lack of knowledge about cleaning and cooking. Reducing these barriers might help increase
fonio consumption in the households in Bamako.
Concerning the factors of background and perception, knowledge and susceptibility factors
showed the strongest correlations with health behavior identity, but the value to health was
the best predictor. Sun et al. (23) also showed that health value was highly correlated with
health behavior identity in rural areas, and in urban areas, knowledge, susceptibility and
severity were significantly correlated with health behavior identity. The items of health value
comprised importance of health in the life, survival, growth, intelligence and school
performance of the children, importance of income for survival, importance of weight
maintenance, and their own survival. So, whether women think that fonio is good for them
was mainly determined by general value perceptions of health rather than specific health
issues such as iron deficiency or diabetes. Almost all of the previous studies have used the
behavioral models to understand the consumption behavior of specific nutrient rich foods
such as iron‐fortified foods (23), soy products (33), dairy products (32), legumes and
vegetables (31). Our study was concerned with an indigenous cereal of which consumption
has been often associated with cultural and religious beliefs, hence the link with a particular
micronutrient was not as evident. And although previous studies on fonio reported the
potentialities of fonio in the treatment of diabetes, stomach diseases and blood losses after
women give birth (12), no scientific evidence of the relationship between fonio consumption
and the treatment of the aforementioned diseases has been demonstrated so far. Therefore,
an intervention aiming at increasing the intention to consume fonio needs to positively

Predicting fonio consumption
Page | 123
influence the background and perception of the women, with an emphasis on the general
value of health associated with fonio consumption.
Concerning the external factors, the subjective norms were correlated with the behavioral
intention but they were not good predictors. Our results confirmed the findings of Rah et al.
(33) who also showed that the subjective norms were correlated with the behavioral
intention, but predicted it more weakly than the attitudes. Opinions of the family, the
neighbors and the husband were the most important items included in this factor in our
study. In the context of Africa, values of extended family and community also significantly
influence the behavior of the individual (34, 35). In Mali, the husband has a crucial role in
decision‐making within the household. For example, in the Demography and Health Survey
(36), the women reported that the husbands alone make the decisions regarding daily
household purchases (63.4%), and which food to cook each day (33.1%). In our sample, 67%
of the women were married, and most of them agree that the opinion of their husband is
very important for them. Thus, nutrition education regarding fonio should first address
positive attitudes, but also influencing men, family and the neighborhood’s beliefs about
fonio consumption would be an important step for the promotion of fonio to be more
efficacious.
Cues to action (from external factors) composed with items such as “food shortage, media,
important ceremonies, special events, presence of guests for dinner, and invitation to
restaurant” were not significantly associated with intention to consume fonio. Our results
did not confirm those of Sun et al. (23) who found a positive association between cues to
action and behavioral intention. Given that the median score of the items was positive and
that previous literature reported fonio as a shortage food (3, 13), a special event food (2, 12,
16) and a food mostly consumed in the restaurants (16), it was a bit surprising that this
relationship was not significant in the current study.
The high reliability of the multiple constructs (0.77 to 0.95) and the positive correlation
within most of the constructs suggested the adequacy of the model for the purpose of our
study. However, some limitations need to be considered for future research. First, we found
that almost 40% of the women consumed fonio once a week or more. This frequency is
much higher than the 10% for several times/week previously reported for urban areas in
Guinea (Conakry) and Burkina Faso (Ouagadougou) (16). Hebert et al. (37) concluded that
self‐report of dietary intake could be biased by social desirability or social approval,
Chapter 6
Page | 124
especially when correct or desirable answers are easily recognizable. So, being aware of the
study purpose could have created social desirability bias in the answers of the women, and
they could have overestimated their fonio consumption. Secondly, almost all women tended
to agree with the statements, as shown by the high values of the median scores. Hofstede
and Hofstede (38), interested in the ‘individualism versus collectivism’ dimension of cultural
behavior, showed that West African countries can be characterized as more collectivistic,
where direct confrontations are considered as rude and undesired and the word ‘no’ is
seldom used, as it is considered confrontational. Consequently, for the Likert scale, this
could indicate that people from West African countries have a tendency to agree (positive
score). In Mali, no research has been done on response patterns to Likert items. In the
present study, the influence of cultural behavior on the answers was minimized by carefully
training the respondents in order to understand the Likert scale, and by using a 5‐point
Likert scale to allow for variation, even if the answers are only positive. Third, Ajzen and
Fishbein (39, 40) recommended that researchers should always conduct a pilot study, in
which open‐ended questions are used to obtain significant beliefs from a sample similar to
the one that will be used in the main study. Although this recommendation has been
followed up in our study through the food APS study, a large part of the variance in the
behavioral intention could not be explained, suggesting that some factors could have been
left unexplored.
Overall, our study revealed that the women living in urban area in Mali had positive
attitudes towards fonio consumption and a positive evaluation of the consequences of fonio
consumption on their health. However, barriers such as time‐consuming cooking process
and lack of knowledge related to preparing and cooking fonio should be reduced to ensure
that intention leads to effective fonio consumption.
Implications for research and practice
Baranowski et al. (41) emphasized the importance of using theory to develop nutrition‐
based interventions. The results of the present study suggested the potential role of a
nutrition education program for promoting the consumption of fonio in urban areas in Mali.
An increase in fonio consumption may strengthen livelihoods of fonio producers, processors
and retailers, while contributing to dietary energy supply for households especially during
Predicting fonio consumption
Page | 125
the food shortage season. The model of Sun et al. (23) was useful for identification of factors
that could be important in promoting fonio consumption among women of reproductive age
in Bamako. This could be achieved through stimulation of positive attitudes, influencing
men, family and neighbors’ opinions, and improving the processing and the know‐how of
women who prepare fonio. Future research should be designed to investigate whether
promoting fonio in urban areas would help improve economic benefits and household food
security, and further studies using behavioral models should pay attention to identifying
more specific beliefs.
Acknowledgements
This research was funded by the FP6 European Union INCO‐FONIO project N° 0015043. We
acknowledge late Guindo Doré (Institute or Rural Economics, Mali) for giving the opportunity
to conduct the fieldwork; Jean‐François Cruz (CIRAD; general manager of Fonio project) for
institutional support; Jan Burema (Wageningen University) and Olga Souverein (Wageningen
University) for statistical advice; all the women for their willingness to participate and their
important contribution to the study.

Chapter 6
Page | 126
References 1. Wendorf F, Close AE, Schid R, Wasylikowa K, Housley R, Harlan J, Krolik H. Saharan exploitation
of plants 8,000 years BP. Nature 1992; 359: 721‐724. 2. Sidibe A. Fonio in Mali (Le fonio au Mali), in Proceedings of the 1st workshop on genetic diversity
of Fonio (Digitaria exilis Stapf.) in West Africa, 4 ‐ 6 August 1998, SR Vodouhe, A Zannou,GE Achigan‐Dako, Eds. 2003, IPGRI, Rome, Italy: Guinea Conakry. 17‐21.
3. Vietmeyer N, Borlaugh N, Axtell J, Burton G, Harlan J, Rachie K. Fonio (Acha), in NRC/BSTID ed Lost crops of Africa. 1996, National Academy Press: Washington DC. 59‐76.
4. Cruz J‐F. Fonio: a small grain with potential. LEISA. 2004; 20: 16‐17. 5. Vodouhè SR , Achigan‐Dako EG. Digitaria exilis (Kippist) Stapf, in MBaG Belay ed Plant Resources
of Tropical Africa. 2006, PROTA Foundation; CTA; Backhuys Publishers: Wageningen,The Netherlands. Vol 1: 59‐63.
6. Jideani IA. Traditional and possible technological uses of D. exilis (acha) and D. Iburua (iburu): A review. Plants foods for human nutrition 1999; 54: 363‐374.
7. Irving DW , Jideani IA. Microstructure and composition of Digitaria exilis Stapf (acha): a potential crop. Cereal Chemistry 1997; 74(3): 224‐228.
8. Barikmo I, Ouattara F, Oshaug A. Table de composition des aliments du Mali (TACAM), 2004: Oslo: Akershus University College.
9. Temple JV , Bassa DJ. Proximate chemical composition of Acha (Digitaria exilis) grain. J Sc Food Agric. 1991; 56: 561‐563.
10. Ekpenyong TE. Effect of cooking on polyphenolic content of some Nigerian legumes and cereals. Nutr Reports Intl 1985; 31: 561‐565.
11. Jideani IA, Owusu Apenten RK, Muller HG. The effect of cooking on proteins of acha (Digitaria exilis) and durum wheat. J Sci Food Agric. 1994; 65: 465‐476.
12. Adoukonou‐Sagbadja H, Dansi A, Vodouhè R, Akpagana K. Indigenous knowledge and traditional conservation of fonio millet (Digitaria exilis Stapf, Digitaria iburua Stapf) in Togo. Biodivers Conserv. 2006; 15: 2379‐2395.
13. Portères R. Les céréales mineures du genre Digitaria en Afrique et en Europe. J Agric trop botan appl. 1955; 2: 349‐386; 477‐510; 620‐675.
14. Vodouhe SR, Zannou A, Achigan Dako EG. Proceedings of the first workshop on genetic diversity of fonio (Digitaria exilis) in West Africa (Premier Atelier sur la Diversité Génétique du Fonio en Afrique de l’Ouest); 4‐6 August 1998, 2003, IPGRI, Rome, Italy: Conakry, Guinea. 36‐41.
15. Morón C. Food‐based nutrition interventions at community level. Br J Nutr. 2006; 96(Suppl1): S20‐22.
16. Konkobo‐Yameogo C CA, Kergna N, Bricas Y, Karimou R, Ndiaye JL. Urban consumption of fonio, a traditional cereal in West Africa. (La consommation urbaine d’une céréale traditionnelle en Afrique de l’Ouest: le fonio). Cah Agric. 2004; 13: 125‐128.
17. den Hartog AP, van Staveren WA, Brouwer ID, eds. Food habits and consumption in developing countries. Manual for field studies. 2006, Wageningen academic Publishers: Netherlands.
18. Ajzen I. The Theory of Planned Behavior. Organ Behav Hum Decis Process. 1991; 50: 179‐211. 19. Fishbein M, Ajzen I. Belief, attitude, intention and behavior: an introduction to theory and
research (reviewed work by RJ Hill). Contemp Sociol. 1977; 6: 244‐245. 20. Janz N , Becker MH. The health belief model: a decade later. Health Educ Q. 1984; 11: 1‐47. 21. McClenahan C, Shevlin M, Adamson G, Bennett C, O’Neill B. Testicular self‐examination: a test of
the health belief model and the theory of planned behavior. Health Educ Res. 2007; 22: 272‐284.

Predicting fonio consumption
Page | 127
22. Nejad LM, Wertheim EH, Greenwood KM. Comparison of the Health Belief Model and the Theory of Planned Behavior in the prediction of dieting and fasting behavior. J Appl Psychol: Social section. 2005; 1: 63‐74.
23. Sun X, Guo Y, Wang S, Sun J. Predicting iron‐fortified soy sauce consumption intention: application of the Theory of Planned Behavior and Health Belief Model. J Nutr Educ Behav. 2006; 38: 276‐285.
24. Koelen M, van den Ban A. Health education and health promotion. 1st ed. 2004, Wageningen, the Netherlands: Wageningen Academic Publishers.
25. De Vries H, Dijkstra M, Kuhlman P. Self‐efficacy: the third factor besides attitude and subjective norm as a predictor of behavior behavioral intentions. Health Educ Res. 1988; 3: 273‐282.
26. UNICEF. Monitoring the Situation of Children and Women. Multiple indicator cluster survey manual 2005. 2006, Division of policy and planning, Plaza, New York.
27. Gibson R, Ferguson E. An interactive 24‐hour recall for assessing the adequacy of iron and zinc intakes of developing countries. Technical monograph 8: Harvest Plus. 2008, Washington, DC.
28. Cruz J‐F. Amélioration de la qualité et de la compétitivité de la filière fonio en Afrique de l’Ouest. Rapport d’activités de la 1ère année. INCO FONIO, Projet spécifique de recherche ciblé. 2007, Montpellier, France: CIRAD.
29. Blum L, Pelto P, Pelto G, Kuhnlein H. Community Assessment of Natural Food Sources of Vitamin A ‐ Guidelines for an Ethnographic Protocol. 1997, Boston, USA; Canada: International Nutrition Foundation for Developing Countries; International Development Research Centre.
30. Field A. Discovering statistics using SPSS. 2nd ed. 2005, London: SAGE Publications. 31. Blanchard CM, Fisher J, Sparling PB, Shanks TH, Nehl E, Rhodes RE, Courneya KS, Baker F.
Understanding adherence to 5 servings of fruits and vegetables per day: a Theory of Planned Behavior perspective. J Nutr Educ Behav. 2009; 41: 3‐10.
32. Kim K, Reicks M, Sjoberg S. Applying the Theory of Planned Behavior to predict dairy product consumption by older adults. J Nutr Educ Behav. 2003; 35: 294‐301.
33. Rah JH, Hasler CM, Painter JE, Chapman‐Novakofski KM. Applying the Theory of Planned Behavior to women’s behavioral attitudes on and consumption of soy products. J Nutr Educ Behav. 2004; 36: 238‐244.
34. Airhihenbuwa C , DeWitt WJ. Culture and African contexts of HIV/AIDS prevention care and support. SAHARA J. 2004; 1: 4‐13.
35. Stephenson R, Baschieri A, Clements S, Hennink M, Madise N. Contextual influences on the use of health facilities for childbirth in Africa. Am J Public Health. 2006; 96: 84‐93.
36. Diarra M, Sy K, Cissé S. Nutrition and Nutritional status, in M Ballo, S Traoré, I Niambélé, et al. ed Demography and Health Survey Mali (EDSM‐III). 2001, Macro international Inc: Maryland USA. chap 9:137‐164.
37. Hebert J, Clemow L, Pbert L, Ockene I, Ockene J. Social desirability bias in dietary self‐report may compromise the validity of dietary intake measures. Int J Epidemiol. 1995; 24: 389‐398.
38. Hofstede G , Hofstede GJ. All dissenters: dealing with Cultural Differences (Allemaal Andersdenkenden: omgaan met cultuurverschillen). 2005, 18th ed. Amsterdam/Antwerpen.
39. Ajzen I, Fishbein M. Understanding attitudes and predicting social behavior. 1980, Englewood Cliffs, NJ: Prendice‐Hall Inc.
40. Ajzen I, Fishbein, M. Understanding attitudes and predicting social behavior. 1980. 41. Baranowski T, Cullen K, Baranowski J. Psychosocial correlates of dietary intake: advancing
dietary intervention. Ann Rev Nutr. 1999; 19: 17‐40.

Page | 128
Chapter 7
Effect of dephytinization of fonio with intrinsic wheat
phytase on iron absorption in
Beninese women
Nadia Fanou Fogny, Diego Moretti, Yara Koreissi, Stephan Schuth,
Romain AM Dossa†, Ines Egli, Frans Kok, Michael Zimmermann, Inge
D. Brouwer
Submitted

Chapter 7
Page | 130
Abstract
Background: Fonio is an indigenous West African cereal which may contribute to household
food security. However, low iron content and high phytate in processed fonio products make
fonio based meals a poor source of bioavailable iron.
Objective: We compared the iron bioavailability from ferrous sulfate fortified fonio meals ,
with and without reducing phytic acid by native phytase from wheat flour.
Design: Using a crossover design, sixteen Beninese women were fed non‐dephytinised (FFP)
and dephytinised fonio porridge(FWFP) fortified with 4 mg isotopically labeled (57Fe)‐ and
(58Fe)‐ferrous sulfate. Iron absorption was measured based on erythrocyte incorporation of
stable isotope labels 14 d later.
Results: Phytate‐to‐iron molar ratio decreased from 23.7:1 in FFP to 2.7:1 in FWFP. Iron
fortification reduced phytate:iron ratio from 1.9:1 in FFP to 0.3:1 in FWFP . Geometric mean
(95% CI) iron absorption ratio significantly increased from 2.6 (0.8‐7.8) in FFP to 8.3 (3.8‐
17.9) in FWFP meal (paired t test, P < 0.0001). Three out of 16 subjects had iron deficiency
anemia. Serum ferritin negatively correlated with iron absorption from both meals, but
significantly only from FWFP ( r = ‐0.64, P < 0.001). In the regression with ferritin and meal
type as predictors, only ferritin was a significant predictor of iron absorption (standardised β
= ‐0.57, 95%CI (‐0.77, ‐0.19), P < 0.01).
Conclusions: Dephytinisation and fortification with 4 mg ferrous sulfate significantly
increased fractional iron absorption by 3.2‐fold. The technical feasability of this strategy in a
home‐fortification perspective needs to be further explored with regard to users’
compliance in developing countries’ household conditions.

Iron absorption from fonio porridges
Page | 131
Introduction
Fonio (Digitaria exilis) is an indigenous West African cereal, with potential for contribution to
household food security because of the early maturing of some varieties (1). In semi‐arid
areas, fonio represents a major part of the diet. In subhumid zones, fonio is stored for long
periods, to be used as staple food during food shortage season (2). In consumption areas,
fonio is mainly consumed as couscous or porridge made from grain or flour (3). In urban
areas in Mali, fonio is consumed at least once per week by one‐third of the women (4).
However, processing of fonio reduces the initially high iron content to 0.8 ‐ 1.8 mg/100g on
dry weight basis (5). In addition, as most plant‐based foods, fonio grains contain phytic acid
which forms complexes with iron, thus reducing its bioavailability (6, 7). Home processing
such as soaking, malting, cooking, germination, fermentation, parboiling did not sufficiently
reduce the phytate content in fonio (5) to the optimal phytate‐to‐iron molar ratio (<0.4:1) to
achieve a significant increase in iron absorption from pure cereal‐based meals (8). Low iron
content combined with high levels of phytate indicate that there is a need to increase both
iron content and bioavailability for fonio‐based diets to contribute to the daily intake of iron.
Iron fortification of staple foods has been recommended as a strategic option to increase the
content of available iron in the foods. Ferrous sulfate has been the standard iron compound
used in iron absorption studies and the bioavailability of other iron compounds are
expressed relatively to its bioavailability (9). Water soluble compounds like ferrous sulfate
may be suitable for low iron fortification levels in iron‐deplete populations, as it has been
shown that iron absorption from ferrous sulfate is well up‐regulated in iron deficiency (10).
However, because iron absorption can be strongly inhibited by phytic acid in cereals‐based
foods (11), reducing phytate levels might be essential for an improved iron absorption from
iron‐fortified fonio‐based diets. Phytic acid can be degraded by enhancing the activity of
intrinsic phytase present in a large range of plant‐derived foods, or by adding microbial
phytases (12, 13). Previously it has been shown that adding wheat to cereal or legume‐based
complementary food mixtures completely degraded phytate at optimal incubation
conditions (14). The efficacy of this technique in improving iron absorption from different
food matrices needs to be further explored (15). The objective of the present study was to
measure the effect of dephytinisation of iron‐fortified fonio porridge with intrinsic wheat
phytase on iron absorption from test meals labelled with stable iron isotopes.
Chapter 7
Page | 132
Methods
Subjects
A group of 16 apparently healthy young Beninese women aged 18 to 30 years (confirmed
through birth certificate or other official documents) were recruited between September
2010 and January 2011, from neighborhood communities of the University of Abomey
Calavi. Inclusion criteria were: i) body weight < 65 kg (measured according to standard
procedures (16)), ii) no pregnancy (confirmed by rapid pregnancy test using Nancy HCG kit,
3H Medical Products, China) and no breastfeeding, iii) no reported chronic medical illnesses,
iv) no reported symptoms of malaria in the last 2 months (fever, headache, stomach ache,
diarrhoea, nausea, vomiting), v) no recent malaria (negative blood smear response based on
Giemsa stained microscopy following standard guidelines (17), vi) no intake of vitamin and
mineral supplements in the last 2 weeks, vii) no blood donation in the last 6 months, vii) no
iron medication or supplementation during the study, ix) no reported allergy to gluten. A
sample size of 16 subjects was estimated, based on expected mean increase in bioavailability
of 30% (18) with 95% power and a significance level of 5%, using a standard deviation of
0.35 (log) iron absorption (19) and accounting for a conservative drop out of 2 participants.
Before enrolment, study participants received a full explanation of the study in written form
and orally during group discussion sessions. Written informed consent was obtained from all
subjects before starting the study. The study protocol was approved by the National
Provisional Ethical Committee for Public Health Research in Benin (Comité National
Provisoire d’Ethique pour la Recherche en Santé Publique, CNPERS) and by the Medical
Ethical Committee of the University of Wageningen (Medisch Ethische Toetsingscommissie,
METC‐WU).
Study design
Subjects were given 2 labeled meals on consecutive days using a cross over design (Figure 1).
Iron absorption was based on erythrocyte incorporation of iron stable isotope labels 14 days
after intake of labelled test meals. The meals consisted of a single fonio flour porridge (FFP)
and a mixed fonio‐wheat flour porridge (FWFP), both fortified with 4 mg iron.

Iron absorption from fonio porridges
Page | 133
Two weeks before the test, participants were dewormed with anthelminth (Zentel, 400 mg
Albendazole tablets, laboratoire Glaxosmithkline, France).
On the first day (day 1), participants were randomly assigned to 2 equal groups: the 1st group
receiving 240 g FFP with 3 mg 58FeSO4 and 1 mg FeSO4 with natural isotopic composition and
the 2nd group receiving 240 g FWFP with 4 mg 57FeSO4. In addition, they consumed 50 ml of
drinking water used to rinse the bowl after the test meal was consumed. Meals were served
to participants from 7.00 to 9.00 am after overnight fasting (no food after 8.00 pm and no
drink after 12.00 am on the evening before day 1). Meals were consumed under
standardized conditions and close supervision. No food was allowed to the participants
within 3 hours after test meal consumption. After this period each participant received a
breakfast package which the subject was allowed to consume ad libitum.
On day 2, within the same timeframe and under identical conditions as day 1, the two
groups of participants received the labelled test meals FFP and FWFP with alternate
composition and iron compound following a cross over design.
The day before day 1 (day 0) and on day 16, 8 ml venous blood samples were collected from
the participants in K2EDTA tubes and in normal tubes, between 7.00 am to 8.00 am after
overnight fasting. Blood withdrawal was performed by two experienced technicians in a
private room at the biomedical analysis laboratory of the Army Hospital of Cotonou (Benin).
During the test period, to ensure that participants were fasted, the evenings before days 1,
2, and 16, participants were lodged in a centre in the neighbourhood of the University of
Abomey Calavi, and dinner was served from 6.30 to 7.45 pm.

Chapter 7
Page | 134
Figure 1. Experimental design of iron absorption test with fonio porridge using
stable iron isotope. FFP, Fonio flour porridge; FWFP, fonio + wheat
flour porridge; 57FeSO4 and 58FeSO4, ferrous sulfate isotope 57 and
58.
Enrolment Beninese women (n=16)
(18-30 y, weight ≤ 65 kg, no malaria infection, no chronic illness)
Day 0 Venipuncture (8 ml whole blood
sample after overnight fasting)
Two weeks before Day 1 Anthelminthic treatment
Day 1: meal test Group1 (8 subjects)
Labelled 58FeSO4 FFP
D16 Venipuncture (8 ml whole blood
sample after overnight fasting)
Day 1: meal test Group 2 (8 subjects)
Labelled 57FeSO4 FWFP
Day 2: meal test Group1 (8 subjects)
Labelled 57FeSO4 FWFP
Day 2: meal test Group 2 (8 subjects)
Labelled 58FeSO4 FFP
Hb, ferritin, transferrin receptors,
CRP, AGP
Meal test on 2 consecutive days on
cross-over basis. Random assignment
of subjects to two equal groups.
Hb, ferritin, transferrin receptors, CRP, AGP, isotopic
iron composition

Iron absorption from fonio porridges
Page | 135
Test meals
Test meals consisted of 2 fonio porridges of 240 g: single fonio flour porridge (FFP) and
mixed fonio‐wheat porridge (FWFP, ratio 3:1, weight‐to‐weight). The meals were prepared in
bulk at the Division of Human Nutrition of Wageningen University (Netherlands), using
adapted recipes previously developed by Egli et al (5, 14). Fonio flour was diluted in water,
at a water‐to‐flour ratio of 20 ml‐to‐1g. The mixture was added to boiling water cooked for
22 minutes from boiling. The pH of the cooked porridge was adjusted to approx. 5 by adding
citric acid at incubation temperature (50°C). The porridge was divided into 16 portions of
240 g which were immediately cooled on ice to restrain wheat intrinsic enzymatic activity.
For the mixed fonio‐wheat meal, the same recipe was used and the wheat flour was added
directly to the porridge at incubation temperature, after adjusting pH to approx. 5. After
mixing homogeneously, 16 portions of 240 g of the mixed porridge were set in the incubator
for 3h at 50°C under constant stirring at 115 rpm (Innova 44, incubator shaker series, New
Brunswick Scientific Co., Inc, Eppendorf company, USA), after which they were immediately
cooled on ice. Porridge portions were stored at ‐18°C and sent by express courier to Benin
one week before the test. Each evening before day 1 and day 2, 16 portions were thawed
overnight in a fridge at 4 ‐5°C. On the test days, thawed portions were quickly warmed up
for 1 min in a microwave and iron isotope solutions were added quantitatively before
consumption. Weights were measured using electronic scales S4001 (capacity 4000g,
precision 0.1g, Denver instrument, NY, USA) for flours, and CP 324S (max 320g, precision
0.1mg, Sartorius, Germany) for iron isotope solutions.
Analysis
Phytate and iron in the test meals
Iron concentration in the test meals was analysed using Inductively Coupled Plasma Atomic
Emission Spectrometry (ICP‐AES), after microwave digestion with hydrofluoric acid (40%),
HNO3 (65%), and H2O2 (30%). Phytate content was determined as inositol hexakis‐phosphate
(IP6) according to Van Veldhoven and Mannaerts (20), liberated from phytate degradation
using a modified method of Makower (21).

Chapter 7
Page | 136
Measurements of blood indicators
Haemoglobin (Hb) was measured immediately after blood collection, using an automated
Sysmex counter (KX 21‐N, Sysmex, cyanide‐free reagent used for Hb detection, normal
values range 11.50‐15 g/dL). A 3‐level Eightcheck‐3WP control material provided by the
manufacturer was used for quality check. Overall anemia was defined as Hb < 12 g/dL,
moderate anemia as Hb < 10 g/dL and severe anemia as Hb < 9.0 g/dL. A sandwich enzyme‐
linked immunosorbent assays (ELISAs) technique was used for the simultaneous
measurement of SF, sTfR, CRP and AGP (22). Iron deficiency was defined as SF <12 µg/L or
sTfR > 8.5 mg/L, and iron deficiency anemia as Hb < 12 g/dL and SF <12 µg/L. CRP > 10 mg/L
and AGP values > 1 g/L were used to identify existing inflammation.
Isotopic composition in blood samples
Whole blood samples were mineralised and separated as described by Schoenberg and von
Blanckenburg (23). Mineralisation was done with concentrated HNO3 (65%) and H2O2 (30%),
using a microwave digestion system with temperature control. Iron was then separated from
matrix elements by anion‐exchange chromatography using resin AG 1‐X8, 100‐200 mesh
(Bio‐Rad) and precipitated with ammonium hydroxide (NH4OH). Isotopic analysis was
performed using a high‐resolution, multicollector inductively coupled plasma mass
spectrometer (Neptune; Thermo‐Finnigan) at the Institute of Geology and Mineralogy of the
University of Cologne, Germany using Cu‐doping to correct for internal mass bias (23). Each
isotopically enriched solution was measured in triplicate using the bracketing technique (23).
One third of the samples were re‐measured as external duplicates. Analysis was done under
chemical blank monitoring using 57Fe or 58Fe indicator solutions as quality control.
Calculation of Fe absorption
Calculation of iron absorption was based on the shift in the isotopic ratios after a 14‐d
incorporation period as described by Walczyk et al. (24). Circulating iron was calculated on
the basis of the blood volume, which was estimated from the participant’s height and weight
according to Brown et al. (25). Isotopic ratios were calculated according to the principle of
isotope dilution (26) and taking into account that isotopic labels are not monoisotopic (27). A
ratio of 80% incorporation of the absorbed iron into red blood cells was assumed for our
sample of young women.

Iron absorption from fonio porridges
Page | 137
Statistical analysis
Statistical analyses were performed using PASW statistic 18 (Release 18.0.3; IBM SPSS Inc.,
Chicago, IL, 2010). P values < 0.05 were considered significant. Visual check and Shapiro‐Wilk
test were used to check for normality of the distribution. Normally distributed data were
expressed as mean ± SD, non‐normally data distributed as median (interquartile range) and
log transformed data as geometric mean ± SD. Fractional iron absorption distribution was
log‐transformed to normality and corrected to a value corresponding to serum ferritin
concentration of 15 µg/L (28). Log‐transformed and corrected fractional iron absorption
from FFP and FWFP meals were compared using paired t tests. Pearson’s correlation was
used to test for association between (log) serum ferritin and log fractional iron absorption
from different meals. Linear regression was used to test the effect of meals and serum
ferritin levels on iron absorption, with log fractional absorption from FWFP meal as
dependent variable and log serum ferritin and meal type (non‐dephytinised/dephytinised) as
independent variables.
Results
Participants
Sixteen participants were recruited, but one did not complete the test because suffering
from malaria on day 16. Participants were aged 24 years on average, with mean (±SD) BMI of
21.2±3.3. Mean (±SD) hemoglobin and body iron stores concentration was 11.9±1.4 g/L and
3.5±4.9 mg/kg respectively. Median (25th ‐ 75th) ferritin and transferrin receptor was 22.9
(12.7 – 74.8) µg/L and 6.0 (5.2 ‐ 7.6) mg/L. Seven subjects had moderate anemia. Three
subjects had iron deficiency anemia and one subject was iron deficient but not anemic.
Mean (±SD) CRP and AGP concentration was 3.4±7.8 mg/L and 0.8±0.2 mg/L respectively.
CRP and AGP concentration was elevated for two (14.7 and 28.2 mg/L) and three
participants (1.05, 1.04 and 1.06 g/L) respectively.
Phytate‐to‐iron molar ratio of test meals
Average iron content in fonio flour was 1.5 (range 0.6 ‐ 4.6) mg/100g dry weight basis. The
expected iron concentration in the portion (240 g) of fonio flour porridge and fonio‐wheat
flour porridge was respectively 0.3 mg and 0.5 mg wet weight basis. Mean (±SD) phytate

Chapter
Page | 1
concent
wet we
meal. FF
in FWFP
Iron ab
Geomet
8.3% (3
Figure 2
Fraction
< 0.000
(paired
absorpt
r 7
38
tration per
ight. Phytat
FP meal wit
P meal.
bsorption
tric mean (9
.8 ‐ 17.9) re
. Compariwheat f(n=15). Bfractionaconcentrfrom FFPfractionaP < 0.000
nal iron abs
01). The dif
t test, P
tion but sign
FFP and FW
te‐to‐iron m
th iron forti
from test
95% CI) iron
espectively
son of (log)flour, FFP) Black lines sal absorptiration of 15P and FWFPal iron abso01).
orption in F
fference re
< 0.05). A
nificantly on
WFP meal po
molar ratio
fication sho
t meals
n absorptio
(Figure 2).
) fractional and dephyshow meanon correct5 µg/L (28)P meals is 2orption was
FWFP meal
emained sig
As expecte
nly for FWF
ortion was r
decreased f
owed phyta
on from FFP
iron absorpytinised (wn log fractioted to a v. Geometric2.6 (0.8 – 7significantl
was 3.2‐fol
gnificant af
d, serum f
FP (FWFP m
respectively
from 23.7:1
ate:iron of 1
P and FWFP
ption betwewith wheat onal iron abvalue correc mean (957.8) and 8.3ly different
d higher th
fter correct
ferritin neg
eal r = ‐ 0.6
y 96±16.2 m
1 in FFP me
1.9:1, which
meal was 2
een non‐depflour, FW
bsorption fresponding 5% CI) of iro3 (3.8 – 17.9between m
an in FFP m
tion for fer
gatively co
64, P < 0.01;
mg and 16.2
eal to 2.7:1
h decreased
2.6% (0.8 ‐
phytinised (FP) fonio prom each mto serum on absorpti9) respectivmeals (paire
meal (paired
rritin conce
orrelated w
; FFP meal r
2±4.4 mg
in FWFP
to 0.3:1
7.8) and
(without porridge meal. Log
ferritin ion ratio vely. Log ed t test,
t test, P
entration
with iron
r = ‐0.19,
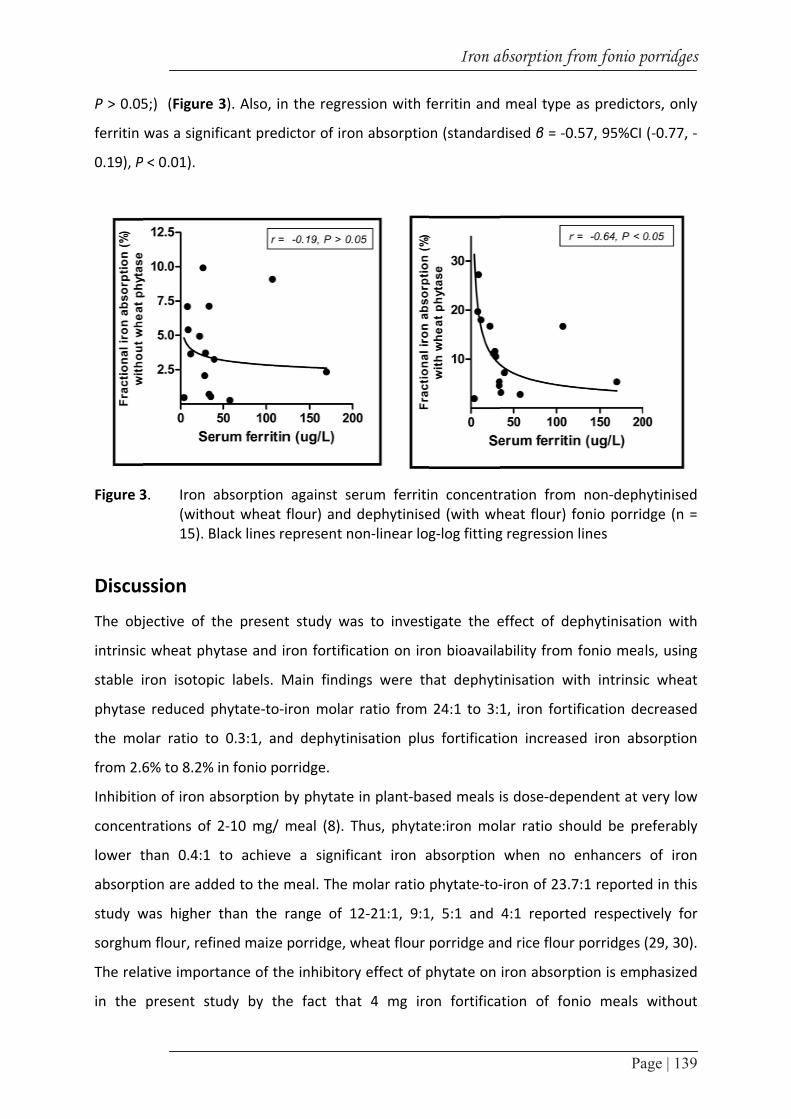
P > 0.05
ferritin
0.19), P
Figure 3
Discus
The obj
intrinsic
stable i
phytase
the mo
from 2.6
Inhibitio
concent
lower t
absorpt
study w
sorghum
The rela
in the
5;) (Figure
was a signi
P < 0.01).
3. Iron a(witho15). B
ssion
jective of t
c wheat phy
iron isotop
e reduced p
olar ratio to
6% to 8.2%
on of iron a
trations of
than 0.4:1
tion are add
was higher
m flour, refi
ative impor
present st
3). Also, in
ficant pred
absorption out wheat Black lines re
the present
ytase and i
ic labels. M
phytate‐to‐i
o 0.3:1, and
in fonio po
absorption b
2‐10 mg/ m
to achieve
ded to the m
than the r
ined maize
rtance of th
tudy by th
n the regres
ictor of iron
against seflour) and depresent no
t study wa
ron fortifica
Main findin
iron molar
d dephytin
orridge.
by phytate
meal (8). T
e a signific
meal. The m
range of 1
porridge, w
e inhibitory
e fact that
ssion with f
n absorptio
erum ferritidephytiniseon‐linear log
s to invest
ation on iro
ngs were th
ratio from
isation plu
in plant‐ba
Thus, phytat
cant iron a
molar ratio
2‐21:1, 9:1
wheat flour
y effect of p
t 4 mg iro
Iron a
ferritin and
on (standard
n concentred (with whg‐log fitting
igate the e
on bioavaila
hat dephyti
24:1 to 3:1
s fortificati
sed meals i
te:iron mol
absorption
phytate‐to‐
1, 5:1 and
porridge an
phytate on
on fortifica
absorption f
meal type
dised β = ‐0
ration fromheat flour) fg regression
effect of de
ability from
inisation w
1, iron fort
on increase
is dose‐dep
lar ratio sh
when no
‐iron of 23.7
4:1 reporte
nd rice flour
iron absorp
tion of fon
from fonio p
Pa
as predicto
0.57, 95%CI
m non‐dephfonio porridn lines
ephytinisati
fonio mea
with intrinsi
tification de
ed iron ab
pendent at v
hould be pr
enhancers
7:1 reporte
ed respecti
r porridges
ption is emp
nio meals
porridges
age | 139
ors, only
(‐0.77, ‐
hytinised dge (n =
ion with
ls, using
c wheat
ecreased
sorption
very low
referably
of iron
ed in this
ively for
(29, 30).
phasized
without

Chapter 7
Page | 140
dephytinisation resulted in phytate‐to‐iron ratio of 1.9:1, and mean iron absorption of 2.6%.
This would provide only 7.6% of the 1.46 mg/day median absolute requirement for iron
absorbed among menstruating non‐pregnant non‐lactating women. This indicates that
fortification alone is not sufficient to overcome the negative effect of phytic acid in cereal‐
based foods.
An essential finding from this study was that adding wheat flour to fonio porridge before
consumption reduced the phytate content, decreasing phytate‐to‐iron ratio from 23.7:1
down to 0.3:1 in iron‐fortified fonio porridge. This result confirmed evidence from a previous
study showing that adding whole wheat grain to cereal‐based complementary foods
completely degraded phytate in a relatively short time (14). Reducing phytate content in
cereal‐based foods is challenging in low‐income countries because home processing
practices often do not achieve a sufficient degradation to significantly improve the iron
absorption. In addition, exogenous phytases are often costly and also, their use is restricted
in some countries because some of the microbiases are derived from genetically modified
species of Aspergillus Niger (30). Therefore, the use of locally available and widely used
cereals as wheat for dephytinisation is a promising practice that needs to be further
explored in developing countries with other traditional cereal‐based porridges.
Most important finding from this study was that complete reduction of phytate content with
intrinsic wheat phytase, and fortification significantly increased iron absorption ratio by 3.2‐
fold. It has been shown that dephytinization significantly increased absorption by 2‐fold from
low‐tannin Sudan sorghum porridges, but phytate degradation was achieved with
commercial phytase (31). Also, significant increases in fractional absorption of iron (1.7‐fold)
and zinc (1.5‐fold) in adults have been previously reported for cereal‐based foods
dephytinized using commercial phytase and wheat flour intrinsic phytase respectively, but
without fortification (15, 32). Previous studies on the inhibitory effect of phytate have also
reported 2‐12 fold increase of iron absortpion from different dephytinised meals (18, 33,
34). These substantial achievements, together with our results, adressed the double issue of
the low level of bioavailable iron in cereal‐based meals caused by the negative effect of
phytate on absorption, and the low content of native iron particularly in fonio meals due to
losses during processing.
A high level of fortification (4 mg ferrous sulfate/ 0.5 mg native iron in 24 g dry weight fonio
flour) has been used to modify phytate‐to‐iron ratio in fonio porridges. A practical issue in

Iron absorption from fonio porridges
Page | 141
the context of low income countries is that such a fortification level can be very costly and
difficult to apply. Particularly in mass fortification, this level may be too high in view of the
amount of fonio consumed. But with that low native iron content in processed fonio
products, this proof of concept study showed that this fortification level was necessary to
achieve a significant increase in iron absorption. With a lower iron content, the magnitude of
improving effect of wheat would be less, but we did not test this. Home fortification of
specific foods for a target population has the advantages to be cost‐effective, while
adressing the needs of a clearly defined group of the population (9, 35). In addition, products
are usually fortified in final form, immediately before consumption, limiting the effects of
fortificants on sensory properties (9). Such fortification form is likely to be the best suitable
for increasing iron content in fonio meals, and should be further explored for assessing cost
and technological feasability.
In addition, iron ferrous sulfate used in the present study is reported to affect sensory
properties of the fortified meals, reducing their acceptability by the consumers. However,
compared to other iron compounds, ferrous sulfate is the cheapest iron compound showing
the highest bioavailability (9), and the option of using encapsulated formula has been
suggested to overcome the barrier of sensory modifications of the fortified meals (36).
This study was based on a single meal design, which could have overemphasized the effect
of phytate reduction on iron absorption (8). Cook et al. previously reported significantly
lower increase in iron absorption from total diet (2.5‐fold) compared to increase from a
single meal (5.9‐fold) (28). In addition, we cannot exclude that other unknown components
of wheat flour might have caused the increased iron absorption. However, phytic acid is the
main inhibitor of iron absorption (8) and the significantly reduced level of phytic acid means
that the natural phytase in wheat is most likely responsible for the improvement in iron
absorption.
Investigating the effect of phytase on iron absorption from different food matrices has been
recently emphasized (15). Fonio is the most ancient west African traditional cereal and to
date, this is the first study investigating the effect of phytase and iron fortification on iron
absorption from fonio meals among women using stable isotope technique. Findings from
this study indicated that dephytinisation using intrinsic wheat phytase is a promising
processing practice to overcome the negative effect of phytate on iron absorption. In
addition, iron fortification seemed a necessary step to increase the amount of absorbed iron

Chapter 7
Page | 142
from fonio meals. The technical feasability of this technology with regard to users’
compliance need to be further explored in developing countries household conditions, as
wheat phytase can reach its optimal activity only within a limited range of temperature and
after more than 1h of incubation.
Aknowledgements
We thank all women participating in the study; staff members and technicians of Laboratoire
Santé Plus (Benin) for facilitating anthropometric measurements, blood samples collection
and handling, and part of biochemical analysis (hemoglobin and CRP) in Benin; Ms Diane
Djossinou for assisting in meals test supervision; Ms Lucy Elburg for facilitating test meals
sending to Benin; Dr Lionelle Fanou‐Kloubou for supervision during blood sample collection;
Dr Barbara Troesch for assisting in refining research proposal; Prof. Karsten Muenker for
providing facilities (Multicollector_ICP‐MS) for isotopic ratio measurements; Erhardt Jurgen
for iron blood indicators analysis. NFF, DM, and IDB designed research, conducted research
and analyzed data; RAMD and MBZ helped in refining research proposal; YK participated in
test meals preparation; RAMD participated in meals test supervision; DM and SS
collaborated in blood isotopic composition analysis; NFF wrote the first draft of the
manuscript and had primary responsibility for final content; DM and IDB refined previous
manuscript drafts; All authors read and approved the final manuscript. None of the authors
declare conflict of interest. In memory of RAMD.

Iron absorption from fonio porridges
Page | 143
References 1. Vietmeyer N, Borlaugh N, Axtell J, Burton G, Harlan J, Rachie K. Fonio (Acha), in NRC/BSTID ed
Lost crops of Africa. 1996, National Academy Press: Washington DC. 59‐76. 2. Vall E, Andrieu N, Beavogui F, Sogodogo D. Contribution of fonio (Digitaria exilis Stapf) to
seasonal food security [Les cultures de soudure comme stratégie de lutte contre l'insécurité alimentaire saisonnière en Afrique de l'Ouest: le cas du fonio]. Cah Agric. 2011; 20(4): 294‐300.
3. Cruz JF, Beavogui F, Dramé D. Fonio, an African cereal [Le fonio, une céréale africaine]. Collection Agricultures tropicales en poche. 2011: Edition Quae Versailles Cedex, CTA Wageningen, Presses agronomiques de Gembloux.
4. Fanou‐Fogny N, Koreissi Y, Dossa RAM, Brouwer ID. Consumption of, and beliefs about fonio (Digitaria exilis) in urban area in Mali. AJFAND 2009; 9(9): 1927‐1944.
5. Koreissi Y , et al. Personal communication. 6. Gillooly M, Bothwell TH, Charlton RW, Torrance JD, Bezwoda WR, MacPhail AP, Derman DP.
Factors affecting the absorption of iron from cereals. Br J Nutr 1984; 51: 37‐46. 7. Cook JD, Reddy MB, Burri J, Juillerat MA, Hurrell RF. The influence of different cereal grains on
iron absorption from infant cereal foods. Am J Clin Nutr. 1997(65): 964‐969. 8. Hurrell RF , Egli I. Iron bioavailability and dietary reference values. Am J Clin Nutr. 2010; 91:
S1461‐1467. 9. Allen L, de Benoist B, Dary O, Hurrell RF, eds. Guidelines on food fortification with
micronutrients. 2006: WHO, Geneva, Switzerland; FAO, Rome, Italy. 10. Zimmermann MB, Biebinger R, Egli I, Zeder C, Hurrell RF. Iron deficiency up‐regulates iron
absorption from ferrous sulphate but not ferric pyrophosphate and consequently food fortification with ferrous sulphate has relatively greater efficacy in iron‐deficient individuals. Br J Nutr. 2011; 105: 1245‐1250.
11. Hurrell RF. Bioavailability of iron. Eur J Clin Nutr. 1997; 51: S4‐8. 12. Greiner R, Konietzny U. Phytase for Food Application. Food Technol Biotechnol. 2006; 44(2):
125‐140. 13. Egli I, Davidsson L, Juillerat MA, Barclay D, Hurrell RF. The influence of soaking and germination
on the phytase activity and phytic acid content of grains and seeds potentially useful for complementary foods. J Food Sciences 2002; 67 (9): 3484‐3488.
14. Egli I, Davidsson L, Juillerat MA, Barclay D, Hurrell RF. Phytic acid degradation in complementary foods using phytase naturally occurring in whole grain cereals. J Food Science. 2003; 68(5): 1855‐1859.
15. Troesch B, Egli I, Zeder C, Hurrell RF, de Pee S, Zimmermann MB. Optimization of a phytase‐containing micronutrient powder with low amounts of highly bioavailable iron for in‐home fortification of complementary foods. Am J Clin Nutr. 2009; 89: 539‐544.
16. WHO. Physical Status: The Use and Interpretation of Anthropometry. Report of WHO Expert Committee. 1995, WHO: Geneva
17. WHO. Methods manual for product testing of malaria rapid diagnostic tests. Manual of standard operating procedures for Assessment of Malaria Rapid Diagnostic Tests within the Product Testing Programme of the World Health Organization. Version 1. 2008, Atlanta: WHO/FIND/CDC.
18. Hurrell RF, Juillerat M‐A, Reddy MB, Lynch SR, Dassenko SA, Cook JD. Soy protein, phytate, and iron absorption in humans. Am J Clin Nutr. 1992; 56: 573‐578.
19. Moretti D, Zimmermann MB, Wegmüller R, Walczyk T, Zeder C, Hurrell RF. Iron status and food matrix strongly affect the relative bioavailability of ferric pyrophosphate in humans. Am J Clin Nutr. 2006; 83: 632‐ 638.
20. Van Veldhoven PP, Mannaerts GP. Inorganic and organic phosphate measurements in the nanomolar range. Anal Biochem. 1987; 161: 45‐48.

Chapter 7
Page | 144
21. Makower RU. Extraction and determination of phytic acid in beans (Phaeolus vulgaris). Cereal Chem. 1970; 47: 288‐295.
22. Erhardt JG, Estes JE, Pfeiffer CM, Biesalski HK, Craft NE. Combined Measurement of Ferritin, Soluble Transferrin Receptor, Retinol Binding Protein, and C‐Reactive Protein by an Inexpensive, Sensitive, and Simple Sandwich Enzyme‐Linked Immunosorbent Assay Technique. J Nutr. 2004; 134: 3127‐3132.
23. Schoenberg R, von Blanckenburg F. An assessment of the accuracy of stable Fe isotope ratio measurements on samples with organic and inorganic matrices by high‐resolution multicollector ICP‐MS. Int J Mass Spectrom. 2005; 242: 257‐272.
24. Walczyk T. Iron isotope ratio measurements by negative thermal ionisation mass spectrometry using FeF4‐ molecular ions. Int J Mass Spectrom Ion Processes. 1997; 161: 217‐227.
25. Brown E, Hopper JJ, Hodges JLJ, Bradley B, Wennesland R, Yamauchi H. Red cell, plasma, and blood volume in the healthy women measured by radiochromium cell‐labeling and hematocrit. J Clin Invest. 1962; 41: 2182‐2190.
26. Kastenmayer P, Davidsson L, Galan P, Cherouvrier F, Hercberg S, Hurrell RF. A double stable‐isotope technique for measuring iron absorption in infants. Br J Nutr. 1994; 71: 411‐424.
27. Walczyk T, Davidsson L, Zavaleta N, Hurrell RF. Stable isotope labels as a tool to determine the iron absorption by Peruvian school children from a breakfast meal. Fresenius J Anal Chem. 1997; 359: 445‐449.
28. Cook JD, Dassenko SA, Lynch SR. Assessment of the role of nonhemeiron availability in iron balance. Am J Clin Nutr 1991; 54: 717‐222.
29. Kayodé APP LA, Hounhouigan JD, Nout MJR, van Boekel MAJS. Genetic and environmental impact on iron, zinc and phytate in food sorghum grown in Benin. J Agric Food Chemistry. 2006; 54: 256‐262.
30. Gibson RS, Bailey KB, Gibbs M, Ferguson EL. A review of phytate, iron, zinc, and calcium concentrations in plant‐based complementary foods used in low‐income countries and implications for bioavailability. Food Nutr Bull. 2010; 31(2): S134‐146.
31. Hurrell RF, Reddy MB, Juillerat MA, Cook JD. Degradation of phytic acid in cereal porridges improves iron absorption by human subjects. Am J Clin Nutr 2003; 77: 1213‐1219.
32. Egli I, Davidsson L, Zeder C, Walczyk T, Hurrell RF. Dephytinization of a Complementary Food Based on Wheat and Soy Increases Zinc, but Not Copper, Apparent Absorption in Adults. J Nutr. 2004; 134: 1077‐1080.
33. Sandberg AS, Hulthen LR, Turk M. Dietary Aspergillus niger phytase increases iron absorption in humans. J Nutr. 1996; 126: 476‐480.
34. Hallberg L, Brune M, Rossander L. Iron‐absorption in man‐ascorbic acid and dose‐dependent inhibition by phytate. Am J Clin Nutr. 1989; 49: 140‐144.
35. Ip H, Hyder SMZ, Haseen F, Rahman M, Zlotkin SH. Improved adherence and anaemia cure rates with flexible administration of micronutrient Sprinkles: a new public health approach to anaemia control. 2007; 63(2): 165‐172.
36. Hurrell RF. Fortification: Overcoming Technical and Practical Barriers. J Nutr. 2002; 132: S806‐812.

Chapter 8
General discussion

Chapter 8
Page | 146
This thesis aimed to upgrade the nutritional value of fonio, a traditional West African staple
grain. To achieve this objective, processing (dephytinisation and fortification) have been
explored as entry points for strategies in a value chain approach targeting West African
women of reproductive age living in urban areas. Prior to this, some specific research
questions have been investigated to define the nutritional context for operating the value
chain strategies, as well as the acceptability of fonio among our study population.
This chapter summarizes the main findings of the research and discusses outstanding
methodological questions about the quality of the studies. In addition, the main results are
discussed in the context of existing literature. The chapter ends with suggestions for future
research and the main implications of this research for public health in West Africa.
Main findings
The main results of the research are presented in Table 1. The study population was
represented by apparently healthy women of reproductive age (15‐49 y) living in an urban
area in Mali (chapters 2‐6) and Benin (chapter 7). Investigating the nutritional context of the
research showed one‐quarter of the women with iron deficiency based on ferritin
concentration, and 19% overweight women in Mali. About half of the women were at risk of
inadequate iron intake and a similar share was at risk of overall inadequacy of micronutrient
intake. Intakes of grains, vegetables and legumes/nuts were significantly associated with
iron intake but not with the probability of adequacy of iron intake. The assessment of fonio
acceptability showed that fonio is consumed one to three times/month by 68% of the
women mainly as snack on working days, and on a lesser extent as main dish on weekend
days. Average daily portion (152 g/day) consumed was small compared to rice, the main
staple cereal of the diet. Increasing the acceptability of fonio in urban areas should focus on
stimulating positive attitudes, influencing household’s heads, family and neighbors’ opinions,
and improving the processing skills of the women. Phytate degradation with native wheat
phytase and iron fortification of fonio porridges decreased phytate‐to‐iron molar ratio and
significantly improved iron absorption from fonio porridges from 2.6% to 8.2%.

General discussion
Page | 147
Table 1. Upgrading the nutritional value of fonio in a value chain approach: main findings related to the specific research questions
Main findings Chapter
Nutritional context 2
Prevalence of iron deficiency and overweight (obesity) was 25% and 19% (9%) respectively
Nutrient intake and adequacy; day-to-day variation in diet 3; 4
Iron probability of adequacy was 0.54 and intake from grains, nuts/seeds and leafy vegetables groups was significantly correlated with iron intake (rho = 0.3; P < 0.05)
Mean probability of adequacy for 11 micronutrients (MPA) was 0.47±0.18 and individuals with higher intake from nuts/seeds and leafy vegetables were more likely to have MPA above 0.5
Intra-to-interindividual variance ratio was ≥ 1 for fat, Zn, Ca, Vitamin A and C, and B6 intake; and <1 for energy, carbohydrates, protein, iron, thiamin and riboflavin intake. At least 2 - 6 replications for an estimation of accurate usual intake at group level, and 2 - 12 replications for correctly ranking individual are required on independent days, including weekend days and with a larger sample.
Acceptability of fonio 5; 6
Intention to consume fonio was significantly correlated with fonio consumption (rho = 0.78, P < 0.001).
Positive attitudes were the best predictors of intention to consume fonio (β=0.32, P < 0.05).
Subjective norms (men’s beliefs and neighbors’ opinion) influenced intention to consume fonio (rho = 0.26, P < 0.001). Perceived barriers (difficult processing and lack of skills in cooking fonio meals), negatively interacted between intention to consume and fonio consumption (β = -0.72, P < 0.05)
Processing fonio 7
Dephytinisation with native wheat phytase reduced phytate-to-iron molar ratio from 24:1 to 3:1 and iron fortification decreased the molar ratio to 0.3:1
Dephytinisation and fortification increased iron absorption ratio from 2.6% to 8.2% in fonio porridges

Chapter 8
Page | 148
INTERNAL VALIDITY
The main methodological issues discussed in this chapter are related to the cross‐sectional
design used in chapters 2‐6, namely bias in selection of the study population and
measurement bias.
Selection of study population
The sample described in chapters 2‐6 was selected using a three‐stage cluster sampling
design developed by UNICEF for multiple indicator cluster surveys in developing countries
(1). Main limitations likely to increase the risk of selection bias concerned the design effect,
the non‐random selection and the non‐response bias.
Design effect
The design effect in a cluster sampling is the factor accounting for the variance between
different clusters (2, 3). It is estimated by the ratio of the variance of the outcome variable
under cluster sampling design to the variance under simple random sampling. Contrary to
simple random sampling, data are usually dependent in cluster sampling design because
individuals within clusters are often linked by environmental, social or genetic factors (4).
Thus, overlooking the design effect in sample size calculation or data analysis leads to an
underestimation of the variance of the outcome variable. In this thesis, chapters 2‐4
provided estimates (mean and prevalence) for nutritional and iron status, as well as
micronutrient intake and adequacy. Previous estimates of the variance of these parameters
were not available, so cluster design effect was not taken into account for sample size
estimation or data analysis. Estimated design effect ranging 0.8 to 2.7 have been reported
from previous studies using 3‐stage cluster sampling, though with larger cluster size and
higher number of clusters than in our study (2, 5). This suggested that a sample size 2 times
larger than estimated was required for our study. Thus, the variance estimates reported for
the above‐mentioned outcomes were likely to be underestimated, and the confidence
interval overestimated. The influence of the design effect has been reported to be reduced
for regression coefficients (6), thus the probability of overestimation of the confidence
interval of the correlation and regression coefficients reported in chapters 2‐6 was low.

General discussion
Page | 149
Non‐random selection bias
The sample selection was performed by a three‐stage cluster sampling design and non‐
random selection bias may have occurred within each step (1, 7, 8).
In the first step, to ensure a good representativeness of the Malian population, 9 clusters
over a total of 72 clusters (1% of Bamako population) were excluded due to over
representation of international experts and industries. Also, a probability proportional to
size procedure was applied for clusters selection, to take into account the variation in
clusters size.
In the second step, the random walk (by spinning bottle at a central point) was used for
selecting the households (1, 7, 8). This did not assume a strictly equal probability of selection
for each household because the selection stopped when the number of desired respondents
was reached (1). In addition, households nearby the starting point were more likely to be
oversampled, while those at the edge of the clusters would be underrepresented. However,
in lack of a comprehensive map of the study area and complete household addresses and
lists as was the case for our research, this method has proven evidence for providing
virtually unbiased samples of households (1). In addition, to have a good approximation of
the central point of the selected clusters, key informants were consulted and when
necessary a rapid tour of the clusters was done.
In the last step, selection bias was likely to occur because often more than one woman in the
selected households met the eligibility criteria. To minimize the risk of self‐selection, a
random selection was done from a list of all eligible women in the selected households.
Thus, care has been taken to minimize the risk of non‐random selection bias along the
sampling procedure through a systematic approach.
Non‐response bias
The non‐response bias is a systematic error reducing the representativeness of the sample.
The evaluation of the effect of non‐response is often difficult because no or only limited data
are available for the non‐respondents (9).
For the study reported in chapter 2, only 66 women out of the 108 selected actually showed
up for the blood sample collection session, although all the women in the sample verbally
agreed to participate after detailed explanation of the purposes of the study. Trying to

Chapter 8
Page | 150
collect a blood sample from non‐respondents from door to door was not successful and, no
clear explanation was given as reason to this refusal. A probable reason might be the strong
influence of some common beliefs linking any blood sample withdrawal to the screening for
HIV‐AIDS in developing countries communities, as HIV‐related stigma is a worldwide
common phenomenon (10).
This refusal caused a non‐response rate of 39%, being a major limitation of the study.
Particularly because the sample has been selected with a cluster sampling design, some
clusters could have been overrepresented by chance. Consequently, the outcome variables
estimated from this sub‐sample might be unlikely to reflect the actual estimates of the total
sample. However, the non‐response rate seemed to be equally distributed across the
clusters (3‐5%) except for 2 clusters for which the non‐response rate was 1% and 6%
respectively. Also, from the background information of the sample, it appeared that the sub‐
sample of respondents were not very different from non‐respondents regarding their socio‐
demographic characteristics: median age of 28y and 30y for non‐respondents and
respondents groups respectively; illiteracy rate of 17% and 18%; average number of children
of 1 (maximum of 10) and 2 (maximum of 11), 14% and 17% married women. In addition,
none of these socio‐demographic variables appeared to confound the relationships among
the outcome variables included in analyses in chapters 2‐6. Therefore, a difference in socio‐
demographic status between respondents and non‐respondents was not likely to have an
effect on the findings. Lastly, regarding practical issues for research in developing countries,
systematic data on women of reproductive age are scarcely reported from West African
countries and, although the generalizability could be hampered in our research due to
methodology settings, the information provided can be used as starting point for improving
future research design.
Measurement bias
Measurement bias could have occurred in chapters 2‐6, particularly regarding outcome
variable accuracy (chapter 2) (11), diet assessment (chapters 3 and 4) and acceptability of
fonio (chapters 5 and 6).

General discussion
Page | 151
Outcome variable
In chapter 2, measurement bias could have happened because the dependent outcome
variable systematically misclassified individuals. Investigating the relationship between
weight status and iron deficiency, ferritin was used as unique indicator of iron deficiency
because serum transferrin receptors showed zero prevalence of iron deficiency among
overweight/obese women. Ferritin is a sensitive biomarker of iron deficiency (12) but can
artificially increase in inflammatory conditions, reducing its accuracy in detecting depleted
iron stores (13, 14). An implication is the probable underestimation of the prevalence of iron
deficiency, limiting the power of our study in detecting significant associations between iron
deficiency and increasing body mass index. However, to identify individuals with artificially
high ferritin levels, C‐reactive protein (CRP) was measured, and 5% of the sample showed
simultaneously high CRP (> 20 mg/L) and ferritin levels (> 65 mg/L). To limit their
confounding effect, data of those respondents were excluded from further analysis in
chapter 2. The correction factor suggested by Turnham et al. (15) was not used to adjust for
the confounding effect of inflammation on ferritin because this was estimated from HIV‐
infected individuals and application for apparently healthy population has not been
reported.
Bias in assessment of diet
Systematic bias and random errors are the main limitations for the validity of dietary
assessment methods and the precision of the estimates (16). Systematic errors usually
appear when the respondents misreport the foods consumed, or under/over‐ estimate the
amounts consumed, or when amounts consumed and intake are incorrectly estimated from
a non‐systematic procedure.
In chapter 3, the adequacy of nutrient intakes was estimated using a duplicate 24‐h dietary
recall assessment (2d‐24hDR). In the context of high illiteracy rates and shared plate eating
settings even in urban areas in Mali, systematic errors were likely to occur from the
respondents who might not be able to recall or report accurately the foods or amounts
consumed. Also, because amounts consumed were estimated in households measures,
systematic errors could have occurred when converting from households units to standard
units (grams). To minimize these errors, a systematic procedure (17) was carefully used at
each step during data collection and data handling. In addition, using the 95% limits

Chapter 8
Page | 152
Goldberg cut‐offs (18) to evaluate energy intake assessed by the 2d‐24hDR indicated that
reporting bias in energy intake was not significant at group level (chapter 4).
Since nutrient intakes from the 2d‐24hDR were calculated from food composition tables,
there was also a probability of systematic error at this step. Systematic errors are more likely
to occur by the use of food composition tables particularly when food composition data are
outdated, or when they do not provide the appropriate nutrient information for the foods as
consumed (17, 19). The national food composition table of Mali (TACAM) (20) was used as
first source of information for our research, based on the assumption that it would provide a
good representation of locally available and traditional foods. A systematic procedure was
used to improve the reliability of the food composition database used for the study,
including: an internal evaluation of the quality of the TACAM (21); a substitution of missing
nutrient values with values from secondary tables; the use of retention factors to account
for nutrient loss during cooking. Therefore, systematic errors related to the use of food
composition data were not likely to be a potential issue for the validity of the dietary
assessment.
The most common random error occurring in dietary assessment is the non or inaccurate
adjustment for the day‐to‐day variation in individual diets (22, 23). Day‐to‐day variation
leads to an over or under estimation of the intake, decreasing the accuracy of the prevalence
of inadequate intake (24). In chapters 3 and 4, the estimates of nutrient intakes were not
adjusted for day‐to‐day variation because the 2d‐24hDR was restricted to 2 recall days
excluding weekend days, to a unique food season and to a limited sample size, considering
the purposes of our research. However, with the use of independent days it was possible to
have an estimate of day‐to‐day variation from the diet, thus allowing to provide further
information on number of days needed to have accurate estimation of the usual energy,
macronutrient and micronutrient intakes for analysis at individual or population level
(chapter 4). Also, in chapter 3, to account for day‐to‐day variation in estimating the
probability of micronutrients adequacy, the ISU method was used to transform and adjust
the intake distributions (25).
Thus in general, the main probable sources of systematic errors were carefully monitored
during the dietary assessment. But because it was not possible to capture the overall intra‐
individual variation from the diet by the 2d‐24hDR, a very accurate information on the usual
nutrient intake was unlikely to be achieved from this research.
General discussion
Page | 153
Correlated measurement error is a specific issue related to chapter 4 where food group
intake was associated with nutrient adequacy estimated from the same dietary intake data.
Correlated errors increase the probability of spurious associations between variables (26).
Lower but significant correlation coefficients between dietary diversity score and nutrition
adequacy have been reported from independent dietary assessment as compared to
coefficients estimated from association between indicators from same dietary intake data
(27). Thus, the estimates of the correlation coefficients between food groups probability of
adequacy reported in this study were likely to be artificially increased.
Bias in assessment of acceptability
In chapter 6, a behavioural model was used to assess the acceptability of fonio. The
response bias is the major limitation for the reliability of social cognitive models used to
predict behaviour (28). The response bias occurs when the respondents give the response
they think suitable for the research, or by social desirability to comply with cultural norms,
regardless of their personal feelings. Response bias often hides the true relationships
between variables (28). The study in chapter 6 showed that most of the respondents tended
to agree with the statements of the model. We suspected that being aware of the purpose
of the research could have created a response bias among the women. Also, in many West
African cultures, saying ‘‘no’’ is perceived as a direct confrontation, which is an undesirable
social behaviour (29, 30). This could have led the women to answer by social desirability
resulting in a reduced variation in answers. Thus flawed association between constructs
could have occurred in the model. However, to reduce this risk, the respondents were
carefully trained before the interviews to understand the likert scales. Also, a 5‐point likert
scale was used instead of the 3‐point likert scale, to allow for variance in answers, even
when positive answers were given.

Chapter
Page | 1
EXTER
In the p
adding
focusing
home‐p
as strate
In this
findings
the con
reviewi
well as
value to
practica
health w
Nutriti
Iron d
status
Chapter
the valu
status o
ferritin
deficien
In previ
have be
reprodu
togethe
the ran
among
r 8
54
RNAL VA
present rese
nutritional
g on soc
processing
egic entry p
section, th
s will be c
ntext of exis
ng the nutr
the strate
o fonio. Fut
al implicat
will also be
ional cont
deficiency
r 2 of this t
ue chain wil
of Malian w
(SF) and tra
ncy.
ious studie
een observe
uctive age i
er with the
ge of the 1
West Africa
ALIDITY
earch the v
l value to
ial accept
and fortif
points (Figu
he validity
considered
sting literat
itional cont
gies used t
ture resear
tions for
discussed.
text
and nutr
hesis addre
ll be operat
women of
ansferrin re
s in West A
ed in urban
n Cote d’Ivo
prevalence
17‐32% rat
an women
value chain
fonio,
tability,
fication
re 1).
of the
within
ture by
text, as
to add
ch and
public
ritional
essed the ne
ted, by prov
reproducti
eceptors (sT
African cou
n areas am
oire (32) an
e of 25% ob
e of iron d
of reproduc
F
for nutritio
eed of docu
viding upda
ve age. Sp
TFR) were u
untries usin
ong menst
nd pregnant
bserved in
deficiency d
ctive age (3
Figure 1: Concvalue Hawke
onal goals h
umenting th
ted informa
pecific bioch
used to prov
g SF, preva
ruating wo
t women in
our sub‐sam
derived by
34). This sho
ceptual framewochain approac
es and Ruel (21
has been us
he nutrition
ation on the
hemical ind
vide accura
alences of 1
men in Ben
n Ghana (33
mple of Ma
halving pre
owed that d
ork for adding ch for nutrition)
sed as appr
nal context
e nutrition
dicators like
ate estimate
17%, 40% a
nin (31), wo
3). These es
alian wome
evalence of
depleted ir
value to a pronal goals. Ada
oach for
in which
and iron
e serum
e of iron
and 16%
omen of
stimates,
en are in
f anemia
on store
oduct: the pted from
General discussion
Page | 155
is a common public health issue among women in West African urban areas. Using sTFR, 9%
of Malian women were iron‐deficient, which was lower than the 35% reported in Cote
d’Ivoire (32). The high cost and expertise demand associated with the use of a variety of
specific indicators limited systematic information on the trends of iron deficiency prevalence
among West African women. This is shown by the fragmented information gathered in the
above‐mentioned studies, and the lack of data based on sTFR in most of those studies.
Documenting iron status among vulnerable groups with accurate biochemical indicators is an
essential step for designing and monitoring appropriate nutrition intervention programs
(35). Efforts are being made in West African countries to add at least ferritin concentration
to the measure of hemoglobin for detecting iron deficiency, as shown by the studies
mentioned above. Yet, the high prevalence of infections and inflammation in West African
countries remains major drawback for the use of SF as only indicator of iron deficiency (36).
Implications for the present research have been discussed previously in measurement bias.
CRP and AGP level has been most often used to exclude data confusing the actual estimates
of iron deficiency prevalence. By doing this, the estimate of iron deficiency prevalence using
ferritin is also likely to be spuriously lowered (37). Using correction factor to adjust for the
confounding effect of inflammation on ferritin, more precise identification of iron deficient
and iron‐replete individuals has been reported in HIV‐infected adults population (15, 38).
This method needs to be further tested in apparently healthy West African populations living
in high infections settings.
Chapter 2 also addresses the emerging issue of increased body mass index or body fat as a
risk factor of iron deficiency. This issue has often been investigated in industrialized
countries, but changes in lifestyles and shift of traditional to transitional diet in urban areas
of emerging and developing countries suggest an increased probability of association
between weight status and iron deficiency in those settings. This has been demonstrated
among women and children from transition countries like Morocco, Thailand, India and
Mexico (39, 40). A number of hypotheses has been mentioned to explain this association,
the most probable being the impairment of iron absorption and metabolism due to the
inflammation process associated with hepcidin function in obesity, as described in number
of studies reported in chapter 1.

Chapter 8
Page | 156
Findings from this study showed an increasing body mass index among urban Malian
women, with a total overweight prevalence of 19%, being at the lower side of the range of
18‐33% reported for West African women (41). However, iron deficiency was not associated
with increased body mass index among oursample. In addition to the small sample size
addressed above in internal validity, a probable hypothesis for this lack of association might
be that the inflammation process related to obesity did not achieve the critical level inducing
imbalanced iron absorption in our sample. There is a need of more documentation on this
issue from West African urban areas and more evidence about the underlying mechanisms
of this association.
Iron intake and adequacy
Chapter 3 examined the nutritional context of the research in terms of intake and adequacy
of iron in association with the food groups consumed from the diet. A range of 88‐90% has
been reported for the prevalence of inadequate intake of iron among women of
reproductive age in resource‐poor settings, including one West African country (42). In the
present research, the prevalence of inadequate intake was 46%, being lower than the range
reported above. Also, this estimate was lower than the 74% observed among women in
urban Burkina Faso (43), though the usual iron intake of the latter (23.6 mg) was higher than
the usual intake of 17 mg of the Malian women. These discrepancies may be related to the
different bioavailability levels applied to the iron requirement, which was assumed to be 5%
for Burkina Faso and 10% for our sample’s diet, based on FAO/WHO estimates of iron
bioavailability according to usual diets (35).
Findings from this study also showed that grains, nuts/seeds, and vegetables were the food
groups most likely to contribute to iron intake and to overall micronutrient probability of
adequacy (MPA), with higher daily intakes from nuts/seeds (> 25 g) and vitamin A‐rich
vegetables (> 88 g) likely to induce MPA higher than 0.5. However, none of the intake of
these food groups appeared to significantly improve iron probability of adequacy, suggesting
that a single increase of the diet diversity is not enough for improving iron intake. Owing to
the fact that more than 75% of the dietary iron came from plant‐based food groups, with
40% from grains, the amount of available iron absorbed from plant‐based foods and
especially grains is probably an important factor influencing this association. Thus, increasing
the availability of iron from a variety of staple foods could be an option for improving iron

General discussion
Page | 157
status among women in Mali, in addition to diet diversification for improving overall
micronutrient adequacy.
Strategic entry point for adding nutritional value to fonio
Acceptability of fonio
Investigating consumer‐oriented strategies is one of the key entry point of the value chain
approach. In the present research, we assessed the socio‐cultural acceptability of fonio for
documenting potential actions to be included in a behavioral change communication
program. This was reported in Chapters 5 and 6. A number of positive social and cultural
attributes have been related to the consumption of fonio in West Africa (44‐48). In previous
studies and the present research as well, the most important attributes often reported were
the good cooking, organoleptic and nutritional qualities, softness, easy digestibility,
healthfulness, contribution to weight maintenance, appetite stimulation, contribution to
meal variation, and traditional value of fonio. Health‐related attributes were also reported
about fonio, being its potential in diabetes and stomach diseases treatment, and blood loss
preventing after birth delivery (44). However, scientific evidence of the relationship between
fonio consumption and the treatment of these diseases has not been demonstrated so far.
Also, most of these attributes were reported in qualitative research, and have never been
associated to the consumption of fonio using a systematic method.
In the used behavioral model (49), intention to consume fonio in urban areas was influenced
by positive beliefs and attributes mentioned above. Subjective norms, namely husbands’ and
neighborhood opinion, were also more likely to motivate intention to consume fonio. This
pointed out the relative importance of the opinion of the household’s head as well as the
social environment in the dietary behavior in Malian urban areas. The model also allowed
identifying potential barriers to fonio consumption, being seasonal shortage, time‐
consuming processing and cooking, the high costs of fonio products in urban markets, and
the lack of skills in cooking fonio. Those obstacles have been described in previous studies
(45, 46), and appeared to have a significant interaction between intention to consume and
fonio consumption. These findings indicated that the more the women have intention to
consume fonio, the more likely they will face some obstacles for consuming fonio.

Chapter 8
Page | 158
An important issue related to the use of behavioral models is the ability to explain the
variance in the outcome variables (50). A large variance unexplained suggests that better
measures of the model should be designed or more predictors should be added to the
model (51). In our study, the model has been carefully designed by associating a
comprehensive literature search to qualitative research to collect as many beliefs as
possible, and by evaluating the internal consistency and the reliability of the model. Despite
this, a large part of the variance in the behavioral intention was not explained, suggesting
that some predictors could have been left unexplored. However, the amount of variance a
model has to explain for it to be judged acceptable has not been reported (52). Also, the
behavioural models often meant to identify factors that need to be influenced to achieve
substantial changes in behaviour and the lack of association between the predictors and the
behavioural intention does not necessarily question the reliability of the model (52). Thus,
although the explained variance of our model is not very high, the identified determinants
are relevant to use in a behavioral change program.
Processing
Processing as key strategy for adding value to fonio is documented in chapter 7. Explicitly,
the effect of phytate degradation with intrinsic wheat phytase and fortification on iron
absorption was investigated using stable isotope technique. Phytate at very low
concentration can strongly inhibit iron absorption in cereal‐based meals and the molar ratio
phytate‐to‐iron should be preferably lower than 0.4:1 to achieve a significant iron absorption
(53). Results from our study showed a phytate‐to‐iron molar ratio of 24:1 in unprocessed
fonio flour porridges, being higher than the range of 12:1‐21:1, 9:1, 5:1 and 4:1 previously
estimated for sorghum, maize, wheat and rice flour porridges respectively (54, 55). Adding
wheat flour to fonio porridges significantly decreased the ratio to 3:1. This result confirmed
the findings of Egli et al. (56) who demonstrated earlier that adding whole wheat flour to
cereals‐based complementary foods completely degraded phytate in a relatively short time.
However, the phytate‐to‐iron ratio reached with only dephytinisation did not appear
sufficient for achieving significant iron absorption from fonio meals in our study. Indeed, a
significant increase of iron absorption ratio by 3.2‐fold was achieved after fortification of the
dephytinised fonio porridges with 4 mg ferrous sulfate.

General discussion
Page | 159
It has been shown that dephytinization significantly increased absorption 2‐fold from low‐
tannin Sudan sorghum porridges, but the phytate degradation was achieved by exogenous
phytase microbiase (57). Also, 1.7‐fold and 1.5‐fold significant increases in fractional
absorption of iron and zinc respectively in adults have been previously reported for cereal‐
based foods dephytinized using wheat flour, but without fortification (58). These substantial
achievements from the previous and this research emphasized the need to adress the
double issue of the low level of bioavailable iron in cereal‐based meals (caused by the
negative effect of phytate on iron absorption), and the low content of native iron,
particularly in fonio meals due to losses during processing.
An issue with single‐meal iron absorption study is overemphasizing the effect of phytate
reduction on iron absorption (53). Cook et al. (59) previously reported significantly lower
increase in iron absorption from total diet (2.5‐fold) compared to increase from a single meal
(5.9‐fold). Therefore, lower increase in iron absorption ratio than reported in this research
could have been observed in the context of multiple meal study.
Value chain for adding nutritional value to fonio
The value chain is the process in which a set of related activities and actors add value to a
product as it moves through the chain (60). Particularly targeting nutritional goals, the value
chain aims at improving nutritional outcomes of vulnerable groups, by addressing the lack of
access to foods, and the low and inadequate intake of nutrients from foods. For the present
research, implementing the value chain for nutritional purposes targeted the need to set
fonio as a key crop in development policy, by adding nutritional value to fonio products for
the improvement of women’s iron status, while contributing to household food security for
fonio stakeholders.
The use of the value chain approach for targeting nutritional goals in developing countries is
relatively recent and achievements are still being documented. In order to improve vitamin
A intake and status in Mozambique and Uganda, a two‐years project has been implemented,
using the value‐chain approach to increase the availability of orange‐fleshed sweet potato
(61). In Uganda, with the ultimate goal of improving sustainable livelihoods in rural
communities by strengthening key value‐chain stakeholders of beans, the approach is
currently being tested within a 5‐years research project to enhance the nutritional value and
marketability of beans (62). The Renewed Efforts Against Child Hunger project recently
Chapter 8
Page | 160
launched in Sierra Leone aims at scaling up demand for nutritious foods by leveraging local
farmers production. The value‐chain approach will focus essentially on identifying food‐
based interventions with potential to increase the incomes of smallholder farmers and
improve the nutritional status of the family members, particularly mothers and young
children (63).
The definition of an explicit outcome‐oriented nutrition goal is a potential strength for a
value chain targeting nutrition goals, with the basic assumption that different components of
the chain hold potential for solutions (60). In Mozambique and Sierra Leone, emphasis was
on increasing the availability of nutritious/nutrient‐rich foods like orange‐fleshed sweet
potato. In Uganda and in Mali (this research), increasing respectively the nutritional quality
of a nutrient‐rich food and the nutritional value of a staple food was on focus. Overall,
strategic entry points identified by the other projects comprised improving production,
improving postharvest handling, supporting trader‐level marketing, and increasing demand
through consumer‐oriented activities. In this research focusing on the nutritional aspect of
fonio, strategies to add nutritional value to fonio included processing to increase iron
bioavailability and uptake from fonio; and consumer‐oriented research for investigating
socio‐cultural acceptability of fonio. Thus, consistently with our research, the
aforementioned projects based on clearly defined nutrition‐oriented outcomes, and a
variety of strategies to reach their goal, although seeking different objectives.
Basically, the value chain applied to nutrition is defined by different terms, according to the
field of application (60). This established the conceptual difference between this research
and the other projects. The latter used the concept as a process for intervening in a value
chain to achieve nutritional goals, of which the nutrition specific term is the value chain
development for enhanced nutrition, often called the value chain approach. It involved
functioning of various stakeholders and coordination of the different components of the
chain to produce sustainable nutritional achievement. The present research puts emphasis
on the value added to the product, measured in nutrition or dietary terms in a value chain.
Thus specifically, it would be defined as “value‐for‐nutrition”. However, the most important
consideration in leveraging the different value chain concepts for nutritional goals is to
generate and achieve a nutritionally‐added value, in addition to other benefits like economic
value. The value added in the present research can be measured technically by the

General discussion
Page | 161
decreased molar ratio phytate‐to‐iron in fonio porridge, and the increased iron absorption
ratio.
Nevertheless, a nutritionnally improved product that is not culturally acceptable and not
economically valuable could not be seen as a benefit product for the value chain, especially
for fonio smallhoders and processors (60). As strategic entry point adopted for this research,
the social‐cultural value of fonio as staple food has been assessed, but not that of the added‐
value product, neither its sensorial acceptability and economic value.
CONCLUSIONS
The value chain approach is a set of strategies through which values are added to products
for creating benefits for stakeholders. Targeting nutrition goals, the value chain is relevant
when contributing to improved nutritional outcomes among vulnerable groups. In this thesis
we explored value chain strategies as possible solutions to existing nutritional problems
among West African women, using fonio as product.
Investigating the nutritional context for operating value chain strategies, we found that
overweight/obesity and iron deficiency were simultaneously prevalent among urban Malian
women of reproductive, but they were not associated.
Assessing the socio‐cultural acceptability of fonio as entry point for consumer‐based
strategies in the value chain, we suggested that promoting fonio consumption should
emphasize positive attitudes and opinions of men, family and neighbors, while strengthening
skills of women in cooking good quality fonio meals.
Exploring processing as strategy for adding nutritional value to fonio showed that
dephytinisation with native wheat phytase appeared to be a relevant strategy for achieving
significant increase in iron absorption from fonio meals only if associated with iron
fortification.

Chapter 8
Page | 162
IMPLICATIONS FOR FUTURE RESEARCH AND PUBLIC HEALTH
In the following, future research questions and the implication of our findings for public
health are discussed.
Future research
Nutrition interventions for reducing iron deficiency in developing countries should further
explore the association between increasing body fat mass and iron status. A clear
definition of the nutrition problem is the key starting point for operating value chain for
nutrition goals. Targeting women in our research, iron deficiency and increased body weight
have been identified as existing nutritional problems in Malian urban areas. Evidence has
been reported from industrialized countries and some transition countries that overweight is
also a risk factor of iron deficiency. It was not the case among our sample, but the evidence
of these two morbidity factors evolving simultaneously in West African countries is
requesting for more attention for this problem in public health debates. Therefore, we
suggest that future research on nutrition‐oriented approaches for improving iron status in
developing countries should evaluate more closely weight status as risk factor of iron
deficiency.
The technical feasibility of plant‐based meal dephytinisation with native wheat phytase
through home processing pathways needs to be investigated at household level.
Substantial removal of phytate from cereal‐based foods is challenging in West African
countries. Wheat is a locally available and widely used cereal and its potential for
dephytinisation has been proven to be higher than most other cereals. In this research,
significant decrease of phytate was achieved from fonio meal using wheat flour phytase, but
in experimental conditions. The practical feasibility of this technology in West African living
conditions needs to be further studied, as wheat phytase can reach its optimal activity only
within a limited range of temperature and after more than 1h of incubation. Although the
potential usefulness of the method for industrial production of complementary food was
demonstrated in an earlier research, the suitability of application at household level is still
unknown. Yet, exogenous phytases are not commonly used in most West African countries.
In addition, central processing of cereals (including fonio) is still not common nor well‐

General discussion
Page | 163
organised in most West African countries and most processing activities are performed at
household level. Thus, home processing should be explored as option for operating cereal‐
based meal dephytinisation with wheat phytase, through appropriate field trials at
household level in order to standardize the procedure.
The impact of value‐added fonio products on fonio smallholders’ income and livelihoods
should be assessed. Leveraging agriculture has been recently emphasized as a sustainable
approach for achieving better nutrition among vulnerable groups in developing countries. To
operationalize this concept, the value chain approach for nutrition goals is being increasingly
implemented in developing countries. A core characteristic of the value chain approach is to
add value to products for creating double benefits of increasing income for smallholder
farmers and improving the nutritional status of vulnerable populations. Regarding fonio as
value chain product, efforts have been made recently to upgrade fonio market value by
enhancing productivity, improving post‐harvest technologies, quality of exportable fonio
products, and promoting women’s associations processing fonio in urban areas. In this
research we added nutritional value to fonio, with the expectation to boost fonio demand
and purchase, so producers will be encouraged to allow larger areas for fonio cultivation and
production and as such increase their income. However, the benefits of the above
mentioned interventions for stakeholder’s income, and hence, nutrition improvement
through increased income has not been evaluated, as also did not our research. To bring
forward the value chain approach relevance, there is a need to investigate i) the long‐term
effect of operating this concept on stakeholders household food security, in terms of
economic value‐added, demand/production of the (nutritional and other) value‐added
products and income; and ii) whether the income translate into an improvement of the
nutritional situation of vulnerable populations.
Implication for Public Health
Fonio as a traditional cereal might not be an appropriate food for improving iron status
through iron fortification. With the increasing nutrition and health consequences related to
the global food crisis, the potential contribution of traditional foods to alleviation of poverty,
nutritional deficiencies and health problems has been emphasized. A number of previous

Chapter 8
Page | 164
qualitative and anecdotal studies has claimed fonio as having potential for contributing to
food security and nutrition/health among vulnerable groups. The contribution of fonio to
household food security during shortfalls has been recently reported. However regarding
contribution to nutritional outcomes, it appeared from our research that i) average daily
frequency consumption (68% consuming 1 to 3 times/month) and daily portion size of fonio
(152 g) was relatively low as compared to other staples like rice and millet, ii) native iron
content of processed fonio products was very low (1.5 mg/100g dry weight basis), and iii) a
high level of fortification (4 mg/240 g meal portion) was necessary to achieve 3.2‐fold
increase in iron absorption after dephytinisation. This increase is significant but might not be
enough as improved nutritional outcome to balance the costs involved in improving the iron
value in fonio meal. Therefore, fonio may not be the preferred food vehicle for fortification
to improve nutrition. Results of our study also indicate that more care must be taken when
claiming the potential of traditional foods like fonio to contribute to improved nutritional
outcomes, especially iron status.
General discussion
Page | 165
References
1. UNICEF. Monitoring the Situation of Children and Women. Multiple indicator cluster survey manual 2005. 2006, Division of policy and planning, Plaza, New York.
2. Kerry S, Bland M. The intracluster correlation coefficient in cluster randomisation. Statistics notes. BMJ. 1998; 316: 1455.
3. Vierron E , Giraudeau B. Design effect in multicenter studies: gain or loss of power? BMC Medical Research Methodology 2009; 9: 39.
4. Katz J, Carey V, zeger S, Sommer A. Estimation of design effects and diarrhea clustering within households and villages. Am J Epidemiol. 1993; 138: 994‐1006.
5. Bennett S, Woods T, Liyanage W, Smith D. A simplified general method for cluster‐sample surveys of health in developing countries. World Health Statistics. 1991; 44: 98‐106.
6. Verhoef H, Rijlaarsdam J, Burema J, West CE, Kok FJ. Chap 2. Variance estimation when using cluster surveys in developing countries to assess exposure‐health outcome relationship in ed Iron deficiency and malaria as determinants of anaemia in African children. Thesis PhD. 2001, Division of Human Nutrition and Epidemiology, Wageningen University: Wageningen. 47‐62.
7. Magnani R. Sampling Guide, 1997, Food and Nutrition Technical Assistance Project, Academy for Educational Development Washingotn DC.
8. Turner A. Sampling strategies. Draft produced for the expert group meeting to review the draft handbook on designing of household sample surveys, 2003: UN secretariat, Statistics division.
9. Brick JM, Westat, J. B. Analysis of potential nonresponse bias. in Proceedings of the Annual Meeting of the American Statistical Association (August, 5‐9). 2001. Rockville, Maryland.
10. UNAIDS. Reducing HIV stigma and discrimination: a critical part of national AIDS programmes. 2007, Geneva: Joint UN Programme on HIV/AIDS.
11. Hartman JM, Forsen JW, Wallace MS, Neely JG. Tutorials in clinical research: Part IV: Recognizing and controlling bias. Laryngoscope. 2002; 112: 23‐31.
12. Finch CA, Bellotti V, Stray S, Lipschitz DA, Cook JD, Pippard MJ, Helmut AH. Plasma ferritin determination as a diagnostic tool. West J Med. 1986; 145: 657‐663.
13. Cook JD. Diagnosis and management of iron‐deficiency anaemia. Best Pract Res Clinic Haem. 2005; 18(2): 319‐332.
14. Fitzsimons EJ, Brock JH. The anaemia of chronic disease. BMJ 2001; 322: 811‐812. 15. Thurnham DI, Mburu‐de Wagt AS, Mwaniki DL, Muniu EM, Alumasa F, de Wagt A. Using plasma
acute phase protein concentrations to interpret nutritional biomarkers in apparently‐healthy HIV‐1 seropositive Kenyan adults. Br J Nutr. 2008; 100: 174‐182.
16. Ferro Luzzi A. Individual food intake survey methods, in Measurement and Assessment of Food Deprivation and Undernutrition; Proceedings from the International Scientific Symposium on Measurement and Assessment of Food Deprivation and Undernutrition. Available at http://www.fao.org/docrep/005/Y4249E/Y4249E00.HTM, downloaded Nov. 22, 2011.2003, FAO: Rome.
17. Gibson R, Ferguson E, eds. An interactive 24‐hour recall for assessing the adequacy of iron and zinc intakes of developing countries. Technical monograph 8: Harvest Plus. 2008: Washington, DC.
18. Black AE. Critical evaluation of energy intake using the Goldberg cut‐off for energy intake: basal metabolic rate. A practical guide to its calculation, use and limitations. Int J Obes. 2000; 24: 1119‐1130.
19. Bathalon GP, Tucker KL, Hays NP, Vinken AG, Greenberg AS, McCrory MA, Roberts SB. Psychological measures of eating behavior and the accuracy of 3 common dietary assessment methods in healthy postmenopausal women. . Am J Clin Nutr. 2000; 71: 739‐745.
20. Barikmo I, Ouattara F, Oshaug A. Table de composition des aliments du Mali (TACAM), 2004: Oslo: Akershus University College.
21. Koreissi Y , et al. personal communication.

Chapter 8
Page | 166
22. Beaton GH, Milner J, Corey P, McGuire V, Cousins M, Stewart E, de Ramos M, Hewitt D, Grambsch PV, Kassim N, Little JA. Source of variance in 24‐hour dietary recall data: implications for nutrition study design and interpretation Am J Clin Nutr. 1979; 32: 2546‐2559.
23. Beaton GH, Milner J, Corey P, McGuire V, Cousins M, Stewart E, de Ramos M, Hewitt D, Grambsch PV, Kassim N, Little JA. Sources of variance in 24‐hour dietary recall data: implications for nutrition study design and interpretation. Carbohydrate sources, vitamins, and minerals. Am J Clin Nutr. 1983; 37: 986‐995.
24. Dodd KW, Guenther PM, Freedman LS, Subar AF, Kipnis V, Midthune D, Tooze JA, Krebs‐Smith SM. Statistical methods for estimating usual intake of nutrients and foods: a review of the theory. J Am Diet Assoc. 2006; 106: 1640‐1650.
25. Nusser SM, Carriquiry AL, Dodd KW, Fuller WA. A semi‐parametric transformation approach to estimating usual daily intake distributions. J Am Stat Assoc. 1996; 91: 1440‐1449.
26. Michels KB, Bingham SA, Luben R, Welch AA, Day NE. The Effect of Correlated Measurement Error in Multivariate Models of Diet. Am J Epidemiol. 2004; 160: 59‐67.
27. Kennedy G. Evaluation of dietary diversity scores for assessment of micronutrient intake and food security in developing countries [PhD thesis dissertation] 2009, Wageningen University: Wageningen.
28. Podsakoff PM, MacKenzie SB, Lee J‐Y, Podsakoff NP. Common method biases in behavioral research: a critical review of the literature and recommended remedies. J Appl Psychol. 2003; 88(5): 879‐903.
29. Hebert J, Clemow L, Pbert L, Ockene I, Ockene J. Social desirability bias in dietary self‐report may compromise the validity of dietary intake measures. Int J Epidemiol. 1995; 24: 389‐398.
30. Hofstede G , Hofstede GJ. All dissenters: dealing with Cultural Differences [Allemaal Andersdenkenden: omgaan met cultuurverschillen]. 2005, 18th ed. Amsterdam/Antwerpen.
31. Hercberg S, Chauliac M, Galan P, Devanlay M, Zohoun I, Agboton Y, Soustre Y, Auvert B, Masse‐Raimbault A, Dupin H. Prevalence of iron deficiency and iron‐deficiency anaemia in Benin. Public Health. 1988; 102: 73‐83.
32. Asobayire FS, Adou P, Davidsson L, Cook JD, Hurrell RF. Prevalence of iron deficiency with and without concurrent anemia in population groups with high prevalences of malaria and other infections: a study in Cote d’Ivoire. Am J Clin Nutr. 2001; 74: 776‐782.
33. Engmanna C AR, Lu TS, Bosea C, Lozoff B. Anemia and iron deficiency in pregnant Ghanaian women from urban areas. Int J Gynecolo Obst. 2008; 101: 62‐66.
34. de Benoist B, McLean E, Egli I, Cogswell M, eds. Worldwide prevalence of anaemia 1993‐2005. WHO Global Database on Anaemia. ed. WHO2008: Geneva, Switzerland.
35. Allen L, de Benoist B, Dary O, Hurrell RF, eds. Guidelines on food fortification with micronutrients. 2006: WHO, Geneva, Switzerland; FAO, Rome, Italy.
36. WHO , CDC. Assessing the iron status of populations : including literature reviews : report of a Joint Technical Consultation on the Assessment of Iron Status at the Population Level ; 2nd ed. 2007, Geneva, Switzerland.
37. WHO. Serum ferritin concentrations for the assessment of iron status and iron deficiency in populations. Vitamin and Mineral Nutrition Information System. Vol. WHO/NMH/NHD/MNM/11.2. 2011, Geneva: WHO; Available at http://www.who.int/vmnis/indicators/serum_ferritin.pdf, downloaded Nov 23, 2011. .
38. Mburu‐de Wagt AS, Thurnham DI, Mwaniki DL, Muniu EM, Alumasa F, de Wagt A. The Influence and Benefits of Controlling for Inflammation on Plasma Ferritin and Hemoglobin Responses following a Multi‐Micronutrient Supplement in Apparently Healthy, HIV‐1 Kenyan Adults. J Nutr. 2008; 138: 613‐619.
39. Cepeda‐Lopez AC, Osendarp SJM, Melse‐Boonstra A, Aeberli I, Gonzalez‐Salazar F, Feskens E, Villalpando S, Zimmermann MB. Sharply higher rates of iron deficiency in obese Mexican women and children are predicted by obesity‐related inflammation rather than by differences in dietary iron intake Am J Clin Nutr; doi: 10.3945/ajcn.110.005439. 2011.

General discussion
Page | 167
40. Zimmermann MB, Zeder C, Muthayya S, Winichagoon P, Chaouki N, Aeberli I, Hurrell RF. Adiposity in women and children from transition countries predicts decreased iron absorption, iron deficiency and a reduced response to iron fortification. Int J Obes. 2008; 32(7): 1098‐1104.
41. Mendez MA, Monteiro CA, Popkin BM. Overweight exceeds underweight among women in most developing countries. Am J Clin Nutr. 2005; 81: 714‐721.
42. Arimond M, Wiesmann D, Becquey E, Carriquiry A, Daniels M, Deitchler M, Fanou F, Joseph M, G. K, Martin‐Prevel Y, Torheim LE. Simple food group diversity indicators predict micronutrient adequacy of women’s diets in five diverse, resource‐poor settings. J Nutr. 2010; 140: 2059‐69.
43. Becquey E, Martin‐Prevel Y. Micronutrient adequacy of women’s diet in urban burkina faso is low. J Nutr. 2010; 140: S2079‐2085.
44. Adoukonou‐Sagbadja H, Dansi A, Vodouhè R, Akpagana K. Indigenous knowledge and traditional conservation of fonio millet (Digitaria exilis Stapf, Digitaria iburua Stapf) in Togo. Biodivers Conserv. 2006; 15: 2379‐2395.
45. Cruz JF, Beavogui F, Dramé D. Fonio, an African cereal [Le fonio, une céréale africaine]. Collection Agricultures tropicales en poche. 2011: Edition Quae Versailles Cedex, CTA Wageningen, Presses agronomiques de Gembloux.
46. Konkobo‐Yameogo C, Chaloub AO, Kergna N, Bricas Y, Karimou R, Ndiaye JL. Urban consumption of fonio, a traditional cereal in West Africa. [La consommation urbaine d’une céréale traditionnelle en Afrique de l’Ouest: le fonio]. Cah Agric. 2004; 13: 125‐128.
47. Vietmeyer N, Borlaugh N, Axtell J, Burton G, Harlan J, Rachie K. Fonio (Acha), in NRC/BSTID ed Lost crops of Africa. 1996, National Academy Press: Washington DC. 59‐76.
48. Vodouhe SR, Zannou A, Achigan Dako EG. Proceedings of the first workshop on genetic diversity of fonio (Digitaria exilis) in West Africa [Premier Atelier sur la Diversité Génétique du Fonio en Afrique de l’Ouest]; 4‐6 August 1998, 2003, IPGRI, Rome, Italy: Conakry, Guinea. 36‐41.
49. Sun X, Guo Y, Wang S, Sun J. Predicting iron‐fortified soy sauce consumption intention: application of the Theory of Planned Behavior and Health Belief Model. J Nutr Educ Behav. 2006; 38: 276‐285.
50. Ogden J. Some problems with social cognition models: a pragmatic and conceptual analysis. Health Psychology. 2003; 22(4): 424‐428.
51. Conner M , Armitage CJ. Extending the theory of planned behaviour: a review and avenues for further research. J Appl Social Psychol. 1998 28: 1429‐1464.
52. Ajzen I FM. Editorial comment on questions raised by a reasoned action approach: Comment on Ogden (2003). Health Psychology. 2004; 23(4): 431‐434.
53. Hurrell R , Egli I. Iron bioavailability and dietary reference values. Am J Clin Nutr. 2010; 91: S1461‐1467.
54. Gibson RS, Bailey KB, Gibbs M, Ferguson EL. A review of phytate, iron, zinc, and calcium concentrations in plant‐based complementary foods used in low‐income countries and implications for bioavailability., ;() Food Nutr Bull. 2010; 31(2): S134‐146.
55. Kayodé APP LA, Hounhouigan JD, Nout MJR, van Boekel MAJS. Genetic and environmental impact on iron, zinc and phytate in food sorghum grown in Benin. J Agric Food Chemistry. 2006; 54: 256‐262.
56. Egli I, Davidsson L, Juillerat MA, Barclay D, Hurrell RF. Phytic acid degradation in complementary foods using phytase naturally occurring in whole grain cereals. J Food Science. 2003; 68(5): 1855‐1859.
57. Hurrell RF, Reddy MB, Juillerat MA, Cook JD. Degradation of phytic acid in cereal porridges improves iron absorption by human subjects. Am J Clin Nutr 2003; 77: 1213‐1219.
58. Egli I, Davidsson L, Zeder C, Walczyk T, Hurrell RF. Dephytinization of a Complementary Food Based on Wheat and Soy Increases Zinc, but Not Copper, Apparent Absorption in Adults. J Nutr. 2004; 134: 1077‐1080.
59. Cook JD , Reddy MB. Effect of ascorbic acid intake on nonheme‐iron absorption from a complete diet. The American Journal of Clinical Nutrition. 2001; 73(1): 93‐98.
Chapter 8
Page | 168
60. Hawkes C, Ruel MT. Value chains for nutrition; Paper 4, in IFPRI 2020 International Conference 2011: New Delhi, India.
61. Coote C, Tomlins K, Massingue J, Okwadi J, Westby A. Farmer, Trader, and Consumer Decisionmaking: Toward Sustainable Marketing of Orange‐Fleshed Sweet potato in Mozambique and Uganda; Conference Note 2, in IFPRI 2020 International Conference, C Hawkes ,MT Ruel, Eds. 2011: New Delhi, India.
62. Mazur R, Musoke HK, Nakimbugwe D, Ugen M. Enhancing Nutritional Value and Marketability of Beans through Research and Strengthening Key Value‐Chain Stakeholders in Uganda; Conference Note 1, in IFPRI 2020 International Conference, C Hawkes ,MT Ruel, Eds. 2011: New Delhi, India.
63. Torgenson S. Wiegers ES, van Dorp M, Ljungqvist B. Developing nutrition programs in Sierre Leone: The case of REACH; Conference Note 3, in IFPRI 2020 International Conference, C Hawkes ,MT Ruel, Eds. 2011: New Delhi, India.

Page | 169
Summary
English, -Dutch, - French
Summary
Page | 170
Summary
Fonio (Digitaria exilis) is the most ancient West African cereal representing a key crop in the food supply during crop shortfall periods. During the past decades, efforts have been made to improve the genetic potential of fonio as well as post‐harvest processing techniques. However, less is known about the potential of fonio to contribute to nutritional and health‐related problems in West Africa. The present thesis focused on the nutritional value of fonio. Particularly, the value chain has been considered as strategic approach to add nutritional value to fonio for improvement of West African women nutritional outcome. Samples of women of reproductive age (15‐49 y‐old) randomly selected in Bamako and Cotonou, the largest cities of Mali and Benin (West Africa) were involved in the research. The value chain for nutrition is relevant only if contributing to resolution of existing nutritional problems. The nutritional context for operating the value chain approach in this research was explored in chapters 2‐3 by evaluating nutritional problems faced by Malian women in urban areas. In Chapter 2 the prevalence of iron deficiency, assessed by serum ferritin and transferrin receptors (sTFR), was determined in relation to body mass index (BMI). To account for the confounding effect of inflammation on ferritin concentration, C‐reactive protein was measured and data of individuals with artificially high ferritin levels were removed from non‐descriptive analysis in this chapter. Mean ferritin and sTFR levels were 39.3±51.0 µg/L and 4.6±3.6 mg/L respectively. Based on these two indicators, iron deficiency prevalence, was 25% and 9% respectively. Average BMI was 23.4±4.9 kg/m2, and 19% of women were overweight, of which 9% obese, but increased body mass index was not associated with iron deficiency. A probable hypothesis for this lack of association might be that the inflammation process related to obesity did not achieve the critical level inducing imbalanced iron absorption in our sample. Chapter 3 assessed iron intake and adequacy among urban Malian women, as well as food groups substantially contributing to these, using a duplicate 24‐h recall dietary assessment. We found that with mean daily iron intake of 16.1±8.8 mg, the median iron probability of adequacy was 0.54. Grains, nut/seeds, and vitamin C‐rich vegetables significantly correlated with mean iron intake (r = 0.3, P <0.05), but not with iron probability of adequacy. None of meat and fish groups were correlated with iron intake and probability of adequacy. Based on the fact that more than 75% of the dietary iron came from plant‐based food groups, with 40% from grains, we suspected that low iron bioavailability from the grains is probably an important factor limiting the correlation between food groups intake and iron adequacy. Thus increasing availability of iron from grains could be an option for improving iron status of women in Mali. Given that a 24‐h dietary recall was designed for the purposes of the research, the ability of the method to provide an estimate of day‐to‐day variation in intake was discussed, with implication for assessing usual intake from Malian diets in chapter 4. Overall, the 24‐h provided good estimates of nutrient intake at group level, but within‐to‐between subject

English
Page | 171
variance ratio was ≥ 1 for fat, Zn, Ca, Vitamin A and C, and B6 intake. Less variance was explained by day‐to‐day variation for energy, carbohydrates, protein, iron, thiamin and riboflavin intake. Adjusting for cluster effect appeared to increase the variance ratio. The number of days required across nutrients for estimating usual intake was 2‐3 (iron, zinc, folate) to 12 (fat) at percentage limit of ±20% for group level, and 1‐2 (energy, protein, iron) to 12 (fat) for correctly ranking individual using an attenuation factor of 0.8. To improve the accuracy of the 24‐h recall in assessing usual intake, weekend days should be included, with a larger sample size. Strategies to upgrade nutritional value of foods through a value chain approach comprise agricultural strategies, processing, and consumer‐oriented activities to enhance acceptability. Chapters 5‐7 focused on investigating fonio acceptability as entry point for consumer‐oriented activities, and processing as strategy for adding nutritional value to fonio products. Socio‐cultural factors influencing fonio consumption in urban areas were identified and integrated in the combined model of Theory of Planned Behaviour and Health Belief Model to assess the acceptability of fonio as staple grain in Malian urban areas (chapters 5 and 6). From our results, it appeared that positive attributes often reported were good cooking, organoleptic and nutritional qualities, contribution to meal variation, and traditional value. Potential barriers to fonio consumption identified were seasonal shortage, time‐consuming processing and cooking, the high costs of fonio products in urban markets, and the lack of skills in cooking fonio. In the behavioral model, intention to consume strongly correlated with fonio consumption (r = 0.78, P < 0.001). Fonio consumption was influenced by positive beliefs and attributes mentioned above (β = 0.32, P < 0.05). Subjective norms, namely the opinion of the husband, family and neighbors were also more likely to influence intention to consume fonio (r = 0.26, P < 0.001). Perceived barriers appeared to have a significant interaction between intention to consume and fonio consumption (β = ‐0.72, P < 0.05). In chapter 7, an iron absorption study using stable isotope was performed, comparing the effect of iron‐fortified fonio flour porridge vs iron‐fortified fonio‐wheat flour porridge on iron absorption among young women in Benin. We found that dephytinisation with intrinsic wheat flour phytase reduced phytate‐to‐iron molar ratio from 23.7:1 to 2.7:1 in fonio porridges, iron fortification decreased the molar ratio to 0.3:1, and dephytinisation plus fortification increased iron absorption from 2.6% to 8.2%. In chapter 8, based on our main findings and considering existing literature, we suggested that i) dephytinisation with native wheat phytase is relevant for achieving significant increase in iron absorption from fonio meals only if associated with iron fortification; ii) promoting fonio as a staple food in Malian urban areas should emphasize positive attitudes and opinions of men, family and neighbors, while strengthening skills of women in cooking good quality fonio meals; iii) the technical feasibility of plant‐based meal dephytinisation with native wheat flour phytase needs to be investigated at household level through home processing pathways; iv) further research should: ‐ investigate the long‐term effect of operating value chain approach on stakeholders’ household food security, in terms of

Summary
Page | 172
economic value‐added, demand and production of the (nutritional and other) value‐added products; and ‐ examine whether the income translate into an improvement of the nutritional situation of vulnerable populations.
Dutch
Page | 173
Samenvatting
Fonio (Digitaria exilis) is een traditioneel West Afrikaans graangewas met een belangrijke rol voor voedselzekerheid in periodes van voedselschaarste. In de afgelopen jaren zijn veel inspanningen gedaan om het genetische potentieel en de verwerkingstechnieken van fonio te verbeteren. Minder bekend is of fonio kan bijdragen aan het verbeteren van voeding‐ en gezondheidsproblemen in West Afrika. Deze thesis richt zich op de voedingswaarde van fonio. De ketenbenadering wordt hierbij gebruikt als een strategische benaderingswijze om voedingswaarde toe te voegen aan fonio om zo de voedingstoestand van West‐Afrikaanse vrouwen in reproductieve leeftijd te verbeteren. Bij deze studie waren vrouwen in reproductieve leeftijd (15‐49 jaar) betrokken die willekeurig geselecteerd zijn in Bamako en Cotonou, de grootste steden in Mali en Benin (West Afrika). Een ketenbenadering voor voedingsverbetering is alleen relevant wanneer het bijdraagt aan een oplossing voor bestaande voedingsproblemen. De voedingsproblemen van Malinese vrouwen in urbane gebieden zijn onderzocht en beschreven in hoofdstuk 2 en 3. In Hoofdstuk 2 is de prevalentie van ijzertekorten, vastgesteld aan de hand van serum ferritine en serum transferrin receptor (sTfR) concentratie, onderzocht in relatie tot de body mass index (BMI). Om het verstorende effect van infecties op ferritine concentratie te voorkomen, zijn alle vrouwen met een verhoogde C‐reactive proteine concentratie en een daarmee samenhangende kunstmatig verhoogde ferritine concentratie van analyse uitgesloten. Gemiddelde SF and sTFR concentraties waren 39.3±51.0 µg/L en 4.6±3.6 mg/L. Gebaseerd op deze parameters was de prevalentie van ijzertekorten 25% en 9% respectievelijk. Gemiddelde BMI was 23.4±4.9 kg/m2 en 19% van de vrouwen had overgewicht waarvan 9% obees. Verhoogde BMI was echter niet geassocieerd met ijzertekorten. Een mogelijke verklaring voor de afwezigheid van dit verband is dat het ontstekingsprocess gerelateerd aan obesitas in onze onderzoeksgroep wellicht nog niet de kritische waarde heeft bereikt waarop het de absorptie van ijzer aantast. Hoofdstuk 3 beschrijft de ijzer inname van urbane Malinese vrouwen, of deze voldoende is, en welke voedselgroepen substantieel bijdragen aan de ijzerinname, gebaseerd op data van een 24‐h recall uitgevoerd op twee dagen. Wij vonden dat met een gemiddelde dagelijkse ijzerinname van 16.1±8.8 mg, de kans op een voldoende ijzerinname 54% was. Granen, noten/zaden en vitamine C rijke groentes droegen significant bij aan de ijzerinname (r = 0.3, P <0.05), maar niet aan de kans op een voldoende inname. Geen van de vlees of vis voedselgroepen droegen bij aan de ijzerinname of aan de kans op een voldoende inname. Gebaseerd op de vinding dat meer dan 75% van het ijzer uit het dieet afkomstig is van plantaardige voedingsmiddelen, waarvan 40% van granen, verwachten we dat de lage beschikbaarheid van ijzer waarschijnlijk een belangrijke oorzaak is van de afwezigheid van een correlatie tussen de consumptie van voedselgroepen en de kans op een voldoende ijzerinname. Daarom zou het verhogen van de beschikbaarheid van ijzer in granen een mogelijke optie zijn voor het verbeteren van de ijzerstatus van vrouwen in Mali.

Summary
Page | 174
Aangezien in deze studie een 24‐hr recall werd gebruikt aangepast aan de studie doelstellingen, is besproken in hoofdstuk 4 hoeverre de gebruikte methodologie de dag‐tot‐dag variatie in inname kan meten en de gevolgen daarvan voor het meten van gebruikelijke nutriënt inname van Malinese diëten. Algemeen genomen gaf de 24‐h recall goede schattingen van nutriënt inname op groepsniveau, maar de binnen–tot‐tussen persoonsvariatie ratio was ≥1 voor vet, Zn, Ca, vitamines A en C, en B6 inname. De dag‐tot‐dag variatie verklaarde een kleiner gedeelte van de totale variatie voor energie, koolhydraten, eiwit, ijzer, thiamine en riboflavine inname. Correctie voor een cluster effect deed de variatie ratio stijgen. Het aantal dagen nodig voor het schatten van gebruikelijke inname varieerde van 2‐3 (ijzer, zink, foliumzuur) tot 12 (vet) binnen een nauwkeurigheid van ±20% op groepsniveau. Daarnaast zijn 1‐2 dagen (energie, eiwit, ijzer) tot 12 dagen (vet) nodig voor het juist classificeren van individuen gebruik makend van een attenuatie factor van 0.8 (welke corrigeert voor de meetfout in de methode). Om de accuraatheid van de 24‐hr recall te vergroten, moet een grotere onderzoeksgroep bij de studie betrokken worden en ook moeten weekeinde dagen meegenomen worden. Strategieën om de voedingswaarde van fonio te verbeteren gebruik makend van een ketenbenadering, omvatten landbouwkundige strategieën, voedselbereidings‐methoden en consumentgeoriënteerde strategieën ter verbetering van de acceptatie van fonio. In de Hoofdstukken 5‐7 worden de acceptatie van fonio als startpunt voor consument‐georiënteerde activiteiten en voedselbereiding als strategie ter verbetering van de voedingswaarde van fonio beschreven. Sociaal‐culturele factoren die de fonio consumptie in Malinese urbane gebieden beïnvloeden werden geïdentificeerd gebaseerd op een gedragsmodel dat de ‘Theory of Planned Behaviour’ en de ‘Health Belief Model’ combineert (Hoofdstuk 5 en 6). Onze resultaten gaven aan dat de volgende positieve attributen vaak werden gerapporteerd: goede kookeigenschappen, organoleptische en voedingskundige kwaliteiten, bijdrage aan variatie in de maaltijden, en de traditionele waarde van fonio. Potentiele barrières voor het consumeren van fonio waren de seizoensmatige beschikbaarheid, het tijdverslindende verwerkings‐ en kookproces, de kosten van fonio producten op de urbane markten en de afwezigheid van vaardigheden in het bereiden van fonio. In het gedragsmodel was de intentie om fonio te eten sterk geassocieerd met de actuele fonio consumptie (r = 0.78, P < 0.001). Fonio consumptie was ook geassocieerd met bovengenoemde attributen (β = 0.32, P < 0.05). Subjectieve normen, met name de opinie van de echtgenoot, familieleden en buren, waren ook gerelateerd aan de intentie om fonio te eten (r = 0.26, P < 0.001). Barrières zoals ervaren door de respondenten vormden een significante interactieterm in the relatie tussen intentie om fonio te eten en de daadwerkelijke consumptie van fonio (β = ‐0.72, P < 0.05). In Hoofdstuk 7 is een ijzerabsorptie studie (gebruik makend van stabiele isotopen) beschreven, waarin bij jonge Beninese vrouwen het effect van een ijzer verrijkte pap gemaakt van fonio meel vergeleken wordt met dat van een ijzer‐verrijkte pap gemaakt van fonio‐ en tarwemeel. Wij vonden dat in fonio pappen de fytaat‐verlagende werking van de intrinsieke fytase uit tarwe de fytaat:ijzer molaire ratio reduceerde van 23.7:1 tot 2.7:1,
Dutch
Page | 175
terwijl de ijzerverrijking de molaire ratio verlaagde tot 0.3:1. De gecombineerde verlaging van fytaat met ijzerfortificatie verhoogde de ijzerabsorptie van 2.6% tot 8.2%. In Hoofdstuk 8 gebaseerd op onze belangrijkste bevindingen in het licht van bestaande literatuur, komen wij tot de volgende conclusies en suggesties: i) verlaging van fytaat door natuurlijke fytase in tarwe is alleen relevant voor een significante verhoging van de ijzerabsorptie uit fonio maaltijden wanneer het gecombineerd wordt met een ijzerverrijking; ii) het promoten van fonio als basisvoedsel in urbane gebieden in Mali moet de positieve attributen benadrukken en ook de opinies van mannen, familieleden en buren, terwijl de vaardigheden van vrouwen in het bereiden van fonio van een goede kwaliteit verbeterd moeten worden; iii) de technische haalbaarheid van het verlagen van fytaat in plantaardig voedsel door middel van natuurlijke fytase in tarwe moet verder onderzocht worden op huishoudniveau met gebruikmaking van voedselbereidingsmethoden gebruikt in het huishouden; iv) verder onderzoek moet zich richten: ‐ op de langetermijn effecten van een ketenbenadering op voedselzekerheid op huishoudniveau met name op het gebied van toevoegen van economische waarde, productie van en vraag naar producten, met een verhoogde (voedings of anderszins) verhoogde waarde.

Summary
Page | 176
Résumé
Le fonio, (Digitaria exilis), céréale la plus ancienne de l’Afrique de l’Ouest, joue un rôle critique dans la sécurité alimentaire pendant les périodes de soudure alimentaire. Au cours des dernières décennies, des efforts ont été menés pour améliorer le potentiel génétique du fonio, de même que les techniques post‐récoltes. Cependant, peu de travaux ont été publiés concernant la contribution du fonio à la résolution des problèmes nutritionnels de santé publique en Afrique de l’Ouest. La présente recherche s’est intéressée à la valeur nutritionnelle du fonio. Plus spécifiquement, la chaine des valeurs a été considérée comme approche stratégique pour ajouter de la valeur nutritionnelle au fonio afin de contribuer à l’amélioration de l’état nutritionnel des femmes en Afrique de l’Ouest. Des échantillons de femmes en âge de procréer (15‐49 ans) ont été sélectionnés au hasard à Bamako et Cotonou, les deux plus grandes villes du Mali et du Benin (Afrique de l’Ouest). La chaine des valeurs pour l’amélioration nutritionnelle ne serait pertinente que si contribuant à la résolution des problèmes nutritionnels. Le contexte nutritionnel d’opérationnalisation de la chaine des valeurs dans le cadre de la présente recherche a été exploré à travers les chapitres 2‐3 par une évaluation des problèmes nutritionnels auxquels sont confrontées les femmes vivant en milieu urbain au Mali. Dans le chapitre 2, la prévalence de la carence en fer évaluée par la ferritine sérique et les récepteurs de transferrine, a été déterminée, en relation avec le statut nutritionnel évalué par l’indice de masse corporelle (IMC). Pour tenir compte de l’effet du statut inflammatoire sur la concentration en ferritine, la concentration en protéine c‐réactive a été mesurée et les données des individus présentant des concentrations en ferritine artificiellement élevées ont été exclues des analyses d’inférence dans ce chapitre. Les concentrations moyennes en ferritine et récepteurs de transferrine étaient de 39,3±51,0 µg/L et 4,6±3,6 mg/L respectivement. La prévalence de la carence en fer basée sur ces 2 indicateurs était de 25% et 9% respectivement. L’IMC moyen était de 23,4±4,9 mg/kg2 et 19% des femmes présentaient un surpoids corporel, dont 9% obèses, mais aucune corrélation n’a été relevée entre la prévalence d’IMC élevé et celle de la carence en fer. Une hypothèse probable à ce manque d’association serait que le processus inflammatoire induit par l’obésité n’aurait pas atteint l’étape critique entrainant une absorption inadéquate du fer par l’organisme dans le cas de notre échantillon. Le chapitre 3 a évalué l'apport en fer et son adéquation parmi les femmes maliennes vivant en milieu urbain, ainsi que les groupes d'aliments contribuant substantiellement à cette adéquation, en utilisant comme méthode d’évaluation du régime alimentaire un double rappel de 24 heures non consécutif. Nous avons trouvé qu’avec un apport journalier moyen en fer de 16,1 ± 8,8 mg, la probabilité médiane d’adéquation en fer était de 0,54. Les groupes alimentaires des céréales, noix/légumineuses, légumes riches en vitamine C étaient significativement corrélées avec l'apport moyen en fer (r = 0,3, P <0,05), mais pas avec la probabilité d’adéquation en fer. Aucun des groupes de viande et poisson n’était associé avec l’apport ou la probabilité de d'adéquation en fer. Considérant que plus de 75% du fer

French
Page | 177
alimentaire est d’origine végétale, avec 40% de contribution des céréales, nous émettons l’hypothèse que la faible biodisponibilité du fer provenant des céréales et légumineuses est probablement un important facteur limitant de la corrélation entre l’apport alimentaire et l’adéquation en fer. De ce fait, l’amélioration de la biodisponibilité du fer provenant des céréales et légumineuses consommées pourrait être une option pour améliorer le statut en fer des femmes au Mali. Dans le chapitre 4, étant donné qu'un double rappel de 24h a été utilisé dans le cadre de la présente recherche, la capacité de cette méthode à fournir une estimation de la variation intra‐individuelle dans l'apport alimentaire a été explorée, avec les implications pour l'évaluation de l'apport nutritionnel habituel des régimes alimentaires maliens. Dans l'ensemble, le rappel de 24h, a permis d’obtenir de bonnes estimations des apports nutritionnels moyens au niveau du groupe, mais les ratios de variance intra‐/inter‐individuelle étaient ≥ 1 pour les apports en lipides, Zn, Ca, vitamine A, C, et B6. Une moindre part de la variance a été expliquée par la variation intra‐individuelle de l’apport en énergie, glucides, protéines, fer, thiamine et riboflavine. L’ajustement pour l’effet de la méthode d’échantillonnage en grappes a semblé accroître la valeur des ratios. Selon les nutriments, le nombre de jours recommandés pour estimer l'apport habituel au niveau groupe varie de 2‐3 (fer, zinc, acide folique) à 12 (lipides), pour une limite de précision de ± 20% ; et de 1‐2 (énergie, protéines, de fer) à 12 (matières grasses) au niveau individu pour un facteur d'atténuation de 0,8. Pour améliorer la précision du rappel de 24h à évaluer l'apport habituel, les jours de week‐end devraient être inclus, avec un échantillon plus large. Les stratégies d’amélioration de la valeur nutritionnelle des aliments grâce à l’approche chaine de valeur comprennent les procédés agricoles, la transformation alimentaire, et les actions visant à améliorer l'acceptabilité des produits par les consommateurs. Les chapitres 5‐7 ont examiné l'acceptabilité du fonio comme point d’entrée stratégique pour des actions orientées vers le consommateur, et la transformation alimentaire comme stratégie pour ajouter de la valeur nutritionnelle aux produits du fonio. Pour évaluer l'acceptabilité du fonio comme céréale de base au Mali, les facteurs socio‐culturels influençant la consommation du fonio en milieu urbain ont été identifiés et intégrés dans un modèle comportementale combinant la théorie du comportement planifié et le modèle des croyances relatives à la santé (chapitres 5 et 6). De nos résultats, il est apparu que les attributs positifs souvent rapportés au fonio étaient ses bonnes qualités culinaires, organoleptiques et nutritionnelles, sa contribution à la variation des repas, et sa valeur traditionnelle. Les obstacles potentiels à la consommation du fonio étaient la pénurie saisonnière, le long temps de transformation et de préparation, le coût élevé des produits de fonio sur les marchés urbains, et le manque d’habilité des femmes à préparer des produits de fonio de qualité. Dans le modèle comportemental, l'intention de consommer était fortement corrélée à la consommation du fonio (r = 0,78, P <0,001). La consommation du fonio a été influencée par les croyances et attributs positifs mentionnés ci‐dessus (β = 0,32, P <0,05). Les normes subjectives, telles que l'opinion du mari, de la famille et des voisins sont également des facteurs influençant l'intention de consommer le fonio (r = 0,26, P <0,001).
Summary
Page | 178
Les obstacles perçus semblent avoir un effet interactif significatif entre l'intention de consommer et la consommation du fonio (β = ‐0,72, P <0,05). Dans le chapitre 7, une étude d’absorption du fer utilisant les isotopes stables a été effectuée, en comparant l'effet de deux bouillies de fonio déphytinisées et enrichie/non‐enrichie en fer sur la biodisponibilité du fer, avec un échantillon de jeunes femmes en âge de procréer au Bénin. Nous avons constaté que: la déphytinisation avec la farine blé a réduit le ratio molaire phytate:fer de 23,7:1 à 2,7:1 dans les bouillies de fonio ; l'enrichissement en fer a réduit le ratio molaire à 0,3:1 ; la fortification plus la déphytinisation ont amélioré l'absorption du fer de 2,6% à 8,2%. Dans le chapitre 8, sur la base de nos principaux résultats et tenant compte des travaux existant, nous suggérons que i) pour les aliments à base de fonio, la déphytinisation avec la phytase de la farine de blé ne serait pertinente pour obtenir une augmentation significative de l'absorption du fer que si associée à une fortification en fer; ii) les programmes de promotion du fonio comme aliment de base en milieu urbain au Mali devraient mettre l'accent sur les croyances et attributs positifs, les opinions des chefs de ménage, de la famille et du voisinage, tout en renforçant les capacités des femmes à cuisiner des produits de fonio de bonne qualité; iii) la faisabilité technique de la déphytinisation des aliments d’origine végétale avec la phytase intrinsèque de la farine de blé devrait être explorée au niveau ménages par le biais des procédés de transformation alimentaire domestique ; iv) des recherches futures devraient : ‐ étudier l'effet de l’opérationnalisation à long terme de l'approche chaine de valeur sur la sécurité alimentaire des ménages des acteurs, en termes de valeur économique ajoutée, de production et de demande des produits à valeur (nutritionnelle et autres valeurs) ajoutée ; ‐ et investiguer si le revenu ajouté se traduit par une amélioration de la situation nutritionnelle des populations vulnérables.

Acknowledgments

Acknowledgements
Page | 180
The successful completion of this thesis was motivated and supported by some nice people I would like to thank sincerely.
I would like to thank my supervisor and advisor, late Romain Dossa (27‐03‐1964 ‐ 15‐02‐2012) who trusted in me, and was confident in my abilities and skills to facing the challenges hidden within this thesis. All these years of collaboration revealed a man of friendship, patience, but also courage and commitment to his convictions about the emergence of nutritional science in major development issues of the developing world. I am convinced that your sacrifices are not in vain.
During these past six years, I had the chance to meet and work closely with an outstanding woman, Inge Brouwer. Every moment spent working with you was exciting. Working with you, I learned how to address challenging scientific issues with a more critical, methodological and open approach. You have been not only a coach but also a Dutch‐“African” sister for me, committed to my professional promotion and always attentive to my difficulties, doing the same for your numerous other international students, while being a mother and wife for your own family. Thank you for having been there continuously, for your patience and for taking care, especially during my difficult times. I hope we continue to collaborate on future projects.
I am grateful to my promotor Frans Kok. I appreciated a lot our discussions about this thesis but also on different interesting issues. I also liked your warmness and your great sense of humour that make me feel familiar with the Division. I would like to thank also the other members of the thesis committee, MAJS van Boekel, C de Graaf, PW van Kolsteren, and EAD Ategbo for contributing to the improvement of this thesis. Particularly to Eric Ategbo who has been my mentor for my Ir degree graduation, I acknowledge you for motivating and encouraging me to pursue a nutrition scientist career.
My stays in Wageningen were made pleasant with the happiness and kindness of some nice persons working at the Division, Lucy Okma, Joke Barendse, Alida Melse, Diego Moretti, Paul Hulshof, Fré Pepping, Lucy Elburg, Bianca van Dam. Your support in various ways contributed to the success of this thesis. Lucy and Bianca my paranymphs and also good friends, I appreciated very much your organization and efficient managing that make everything run smoothly for the defense. Many thanks for your help. I am also thankful to Lous Duym, and the strong team of Biotechnion and Agrotechnion secretariat and other administrative staff members of the Division for the discreet but intensive “behind the scenes” work to support the students. I am particularly grateful to late Lidwien van der Heijden, another tough woman I met at the Division of Human Nutrition. I am mindful all you have done to facilitate my stays in Wageningen, your help with solving personal issues, your contribution to my capacity building, your presence and support during the fieldwork in Mali, and the nice moments shared during these past years. All this remained precious souvenirs for me. To the big team of international students of the Division, of which Razack Abizaria, Caterine Macharia Mutie, Sophie Ngala, Qing Yu, Rina Agustina, Wanjiku Gichohi, our discussion and
Acknowledgements
Page | 181
experience sharing contributed to strengthen my abilities to address scientific issues with open mind. To my country fellows living in Wageningen, Yann Madodé, Jonas Wanvoeke, Alphonse Singbo, Romaric Vitohotegbe, Sylvain Dabadé, Augustin Kouévi, your presence make me feel at home in the Netherlands.
My fieldwork in Mali was facilitated and supported by the staff members and technicians of the Institut d’Economie Rurale, and the FONIO project team members working in Mali, which I thank sincerely. I would like to express especially my acknowledgements to late Dore Guindo, former director of the Centre Rural de Recherches Agricoles de Sotuba, and to Jean‐François Cruz, former coordinator of the FONIO project, for facilitating administrative formalities in Mali. I am particularly grateful to my colleague, friend and thesis co‐fellow, Yara Koreissi who has devoted her time to make easy all arrangements for my stays in Mali. Yara, I know that with your perseverance and tenacity, you will successfully achieve your goals. Many thanks to the dynamic team of interviewers in Mali, Fatoumata Bocoum, Rokia Coulibaly, Adam Kanté, Laya Dolo, Safiatou Sanogo, Fanta Dicko, Bintou Dicko, Djénéba Mallé.
I am grateful to Professor Joseph Hounhouigan of the Département de Nutrition et Sciences Alimentaires, Université d’Abomey Calavi in Benin, for his commitment to the sustainable improvement of the quality of scientific research in food sciences and nutrition, and to the professional promotion of the students of the department. To the team of nutrition scientists of the department, Eunice Nago, Evariste Mitchikpè, Waliou Amoussa, Saturnin Houndji, I appreciated the solidarity and mutual support after the great loss of our leader recently. I wish we keep standing for our decision to face the challenge of sustaining the quality of training and research in human nutrition in Benin.
Je voudrais aussi remercier infiniment mes chers parents Dorothée Dakpogan et Louis Fanou. Cher papa, au cours de toutes tes années d’épreuves tu n’as jamais négligé l’instruction de tes enfants. Chère maman, tu as toujours été là pour tes enfants et tu n’as jamais baissé les bras. Merci pour tant d’années de sacrifice. Mes sentiments de gratitude vont aussi à l’endroit de mes frères et sœurs Anita, Gilles, Sabrina et Nicolas pour leur présence et leur soutien constants. Lastly, I am indebted to my husband Guillaume and my two lovely children Sika and Sènami. Guillaume, we both had the chance to undertake postgraduate studies but we decided that I start first, and you constantly supported and helped me in so many ways. Sika my daughter and Sènami my son, it was not easy to let mum goes abroad frequently, but you have been very wise and kind to make it. Thanks to you three for being there, for your love, for trusting in me, for being so patient and for your continuous support.


About the author

Fonio as a staple food in Mali: an approach to upgrade nutritional value
Page | 184
BRIEF BIBLIOGRAPHY
Nadia Fanou‐Fogny was born in Cotonou, Republic of Benin (West Africa) on June 23rd 1974.
After completing the secondary school in 1993, she studied Chemistry, Biology and Geology
for two years at the Faculté des Sciences et Techniques of the Université d’Abomey‐Calavi
(UAC), Benin. In 1996, she joined the Faculty of Agronomic Sciences of UAC, where she
graduated as Agricultural Engineer (Ir Agronome) in 2000 with major in Nutrition and Food
Sciences. From 2001 to 2004, she worked as assistant of the coordinator for the NGO Réseau
de Développement d’Agriculture Durable. In 2005‐2006 she obtained a Masters degree
(Diplôme d’Etudes Approfondies) in Nutrition and Food Sciences with major in Human
Nutrition at the Département de Nutrition et Sciences Alimentaires of UAC, after which she
worked as PhD fellow in Mali and at the Division of Human Nutrition of Wageningen
University for the FONIO project (European Union /INCO No 0015403) presented in this
thesis.

About the author
Page | 185
PUBLICATIONS
Fanou‐Fogny N, van Dam B, Koreissi Y, Dossa RAM, and ID Brouwer Factors Predicting Consumption of Fonio Grain (Digitaria exilis) among Urban Malian Women of Reproductive Age. Journal of Nutrition Education and Behavior 2011;43:219‐228.
Fanou‐Fogny N, Saronga NJ, Koreissi Y, Dossa RAM, Melse‐Boonstra A, Brouwer ID. Weight status and iron deficiency among urban Malian women of reproductive age. British Journal of Nutrition 2011, 105: 574 – 579.
Kennedy GL, Fanou‐Fogny N, Seghieri C, Arimond M, Koreissi Y, Dossa RAM, Kok FJ, Brouwer ID. Food groups associated with a composite measure of probability of adequate intake of 11 micronutrients in the diets of women in urban Mali. Journal of Nutrition. 2010, 140: 2070–2078S.
Arimond M, Wiesmann D, Becquey E, Carriquiry A, Daniels MC, Deitchler M, Fanou‐Fogny N, Joseph ML, Kennedy G, Martin‐Prevel Y, Torheim LE. Simple Food Group Diversity Indicators Predict Micronutrient Adequacy of Women’s Diets in 5 Diverse Resource‐Poor Settings. Journal of Nutrition. 2010, 140: 2059–2069S.
Kennedy G, Fanou N, Seghieri C, Brouwer ID. Dietary Diversity as a Measure of the Micronutrient Adequacy of Women’s Diets: Results from Bamako, Mali Site. Washington, DC: Food and Nutrition Technical Assistance II Project, Academy for Educational Development; 2009
Fogny‐Fanou N, Koreissi Y, Dossa RAM, and ID Brouwer. Consumption of, and beliefs about fonio (Digitaria exilis) in urban area in Mali. African Journal of Food Agriculture Nutrition and Development, 2009, 9 (9), 1927 – 1944.
Achigan Dako GE, Fanou N, Kouke A, Avohou H. Vodouhe RS, Ahanchede A. Évaluation agronomique de trois espèces de Egusi (Cucurbitaceae) utilisées dans l’alimentation au Bénin et élaboration d’un modèle de prédiction du rendement. Biotechnology Agronomy Sociology and Environnement 2006 10 (2), 121 – 129.
Fanou NLM, Dossa RAM, Ategbo EAD, 2002. Assessment of the nutritional status and risk factors facing older people in urban and rural areas in Benin. In Summary of research findings on the nutritional status and risk factors for vulnerability of older people in Africa. Pp 7‐10. HelpAge International Africa Regional Centre. Naïrobi, Kenya.

About the author
Page | 186
EDUCATIONAL PROGRAMME
Discipline specific activities
Courses Basic statistics and advanced statistics for nutritionists, Wageningen University, 2006 Training on food consumption survey, Wageningen University, 2006 Production and use of food composition data in nutrition, Wageningen University, 2007 Food perception and preference, Wageningen University, 2007
Conferences Symposium Quality: from soil to Healthy people, Wageningen University, 2006 Symposium Fortification with iron, Wageningen University, 2007 Symposium Nutrition intervention for reduction of iron deficiency anemia, Department Nutrition and Food Sciences, FSA, University of Abomey Calavi, Benin, 2008 Workshop FANTA Women’s dietary diversity project, AED/USAID, Washington DC, USA, 2008 Workshop Fonio SIAGRI, Institute of rural economics, Bamako, Mali, 2008 Workshop on conservation and utilization of traditional vegetables, National Institute of Agronomic Research, Cotonou, Benin, 2008 African Nutritional Epidemiology Conferences, Cairo, Egypt, 2008 and Nairobi, Kenya, 2010 Wageningen Nutritional Sciences Forum, Wageningen University, The Netherlands, 2009 7th International conference on Diet Activity and Methods, NCI, Washington DC, USA, 2009 19th International conference on Nutrition, IUNS, Bangkok, Thailand, 2009 General courses Introduction and Advanced endnote course, Graduate school VLAG, Wageningen University, 2006 PhD introduction week 16th edition, Graduate school VLAG, Wageningen University, 2006 Basic statistics, Wageningen University, 2006 Scientific publishing, Graduate school VLAG, Wageningen University, 2009 Ethics in health research in sub-saharan Africa, Institute of Applied Biomedical Sciences, Cotonou, Benin, 2011 Analysis using R, Graduate school VLAG, Wageningen University, 2012 Optional courses and activities Research proposal writing and presentations, Division of Human Nutrition, Wageningen University, 2006 Advanced statistics for nutritionists, Division of Human Nutrition, Wageningen University, 2006 PhD retreats and meetings, Division of Human Nutrition, Wageningen University, 2007 Workshop on conservation and utilization of traditional crops, INRAB, Cotonou, Benin, 2008 International Nutrition Club and Methodology club meetings, Division of Human Nutrition, Wageningen University, 2009 and 2011 Retreat chairgroup nutrition and health, Division of Human Nutrition, Wageningen University, 2011

Fonio as a staple food in Mali: an approach to upgrade nutritional value
Page | 187
This thesis was financially supported by the Dutch Embassy of Benin through the Netherlands Fellowships Programmes (NFP) for PhD studies of the Netherlands Organisation for International Cooperation in Higher Education (NUFFIC). Fieldwork research for the thesis was partly financed by the European Union funded Fonio Project FP6/EU/INCO CT-2005-015403, and the International Foundation for Science IFS Project E4491-1. Financial support from Dr Judith Zwartz Foundation for printing this thesis is gratefully acknowledged.

Page | 188
Cover, design and layout Nadia Fanou-Fogny
Printing GVO drukkers & vormgevers B.V. | Ponsen & Looijen
© Nadia Fanou-Fogny, 2012
View publication statsView publication stats


