UNLV Theses, Dissertations, Professional Papers, and Capstones
Summer 2016
Food Rescue Program Evaluation Three Square Food Bank Food Rescue Program Evaluation Three Square Food Bank
Anna Caputo University of Nevada, Las Vegas
Rich Easter University of Nevada, Las Vegas
Rosa Rosas University of Nevada, Las Vegas
Mark Sakurada University of Nevada, Las Vegas
Follow this and additional works at: https://digitalscholarship.unlv.edu/thesesdissertations
Part of the Public Administration Commons, and the Public Affairs Commons
Repository Citation Repository Citation Caputo, Anna; Easter, Rich; Rosas, Rosa; and Sakurada, Mark, "Food Rescue Program Evaluation Three Square Food Bank" (2016). UNLV Theses, Dissertations, Professional Papers, and Capstones. 2839. http://dx.doi.org/10.34917/9842217
This Capstone is protected by copyright and/or related rights. It has been brought to you by Digital Scholarship@UNLV with permission from the rights-holder(s). You are free to use this Capstone in any way that is permitted by the copyright and related rights legislation that applies to your use. For other uses you need to obtain permission from the rights-holder(s) directly, unless additional rights are indicated by a Creative Commons license in the record and/or on the work itself. This Capstone has been accepted for inclusion in UNLV Theses, Dissertations, Professional Papers, and Capstones by an authorized administrator of Digital Scholarship@UNLV. For more information, please contact [email protected].
råáîÉêëáíó=çÑ=kÉî~Ç~I=i~ë=sÉÖ~ë=`çääÉÖÉ=çÑ=rêÄ~å=^ÑÑ~áêë=pÅÜççä=çÑ=mìÄäáÅ=mçäáÅó=~åÇ=iÉ~ÇÉêëÜáé=_çñ=QRQMPM=QRMR=pçìíÜ=j~êóä~åÇ=m~êâï~óI=i~ë=sÉÖ~ëI=kÉî~Ç~=UVNRQJMQPV=
Food Rescue Program Evaluation qÜêÉÉ=pèì~êÉ=cççÇ=_~åâ=
PUA 729 Capstone Program Evaluation Summer 2016 Professor: Dr. Jaewon Lim Students: Anna Caputo, Rich Easter, Rosa Rosas, and Mark Sakurada
1
Acknowledgments
We would like to express our gratitude to the Three Square team for giving us the
opportunity of working with the organization. A large thank you to Director of
Procurement and Distribution, Darwin Bosen, Research Specialist, Regis Whaley,
Agency Relations Manager, Debbie Harpster, and Special Event Coordinator, Krystalin
Meneses, and many more team members for your collaboration and engagement
throughout the evaluation.
A special thanks to the following food bank staffers for their participation and insight
via the benchmark study:
● Nancy Carriveau, Great Plains Food Bank
● Suzi Casillas, Food Bank of the Rockies
● Bill Hendrix, Regional Food Bank of OKC
● Jason Lessard, Food Bank of Alaska
● Jennifer Mariano, Care and Share Food Bank for Southern Colorado
● Alicia Saake, Feeding America San Diego
To our faculty advisor, Dr. Jaewon Lim, we are sincerely grateful for all of your
guidance and encouragement throughout the project. Your assistance has been
invaluable, our deepest appreciation for the learning opportunity.
Finally, to our family and friends, our deepest gratitude for all of your care and love
during difficult times throughout our academic endeavors. Our heartfelt thanks for your
support while completing this project.
2
Executive Summary
With 48 million Americans currently struggling with hunger, addressing food insecurity
in U.S. communities remains a persistent issue in need of a remedy. Conversely, food
waste is the single largest material deposited in American landfills, with an estimated
70 billion pounds wasted annually. The recovery of this food waste, or “food rescue” in
food banking jargon, offers an ideal solution to fight hunger in our communities. With
Three Square Food Bank (Three Square) consistently seeking to increase food rescue
and distribution in its efforts to eliminate hunger, the need to ensure operational
effectiveness and efficiency through programmatic change and improvement is a
constant driving force within the organization. This report provides an examination and
evaluation of Three Square’s Food Rescue program in Southern Nevada.
Three Square is the sole Southern Nevada food bank serving the residents of Clark,
Esmeralda, Lincoln, and Nye counties. Created in 2007, Three Square operates
several programs through extensive partnerships with federal, state, and local
governments, nonprofit organizations, religious organizations and private businesses.
One of a wide array of programmatic services, Three Square’s Food Rescue Program
seeks to empower participating agencies by providing perishable foods to their
respective clientele through efficient and effective food recovery. Utilizing the current
combination of delivery services (Delivery Model) and logistics management of direct
pickup (Agency-Direct Model) provided to participating agencies, the Food Rescue
Program is able to recover roughly 15 million pounds of perishable food from local
retailers annually.
This report utilizes implicit program theory to examine the operational effectiveness
and efficiency of the program, specifically the effectiveness of service delivery and the
efficiency in the use of program resources. The process evaluation focuses on the
ongoing functions within the Food Rescue Program, analyzing the program’s
organizational plan framed within a logic model to understand the availability of
resources and organizational effectiveness. The objective of the program evaluation is
to identify current barriers to effective and efficient program performance, specifically
in a manner that aids decision-making for Three Square’s leadership team.
The evaluation employs a convergent mixed-methodological approach throughout the
study in order to gain a holistic understanding of the implications of Three Square’s
3
planned programmatic shift toward an agency-centric food rescue model. The study’s
research methodologies include:
● Strength, Weakness, Opportunities, and Threats (SWOT) Analysis
● Benchmark Study
● Survey Tool
● Cost-Benefit Analysis
The evaluation concurrently collected and analyzed data from the different
methodologies from April 2016 to August 2016. Complete raw data from each
methodology are listed within appendices, with pertinent analysis and selected data
described in detail in the body of this report.
The evaluation finds that while operationally effective in its current form, with Three
Square positively positioned to leverage Food Rescue Program operations through a
transition toward increased use of an agency-direct model, several strategic issues
should be addressed to safeguard improved program performance. In attempting to
assure that any transition results in the efficient and effective use of scarce resources,
the evaluation formed the following recommendations:
Short-term Recommendations (current - 18 months)
● Increased Promotion of Food Rescue Program
● Development of Training and Onboarding Curriculum
● Building of Agency Capacity
● Increased Focus on Relationship Management
Medium-term Recommendations (18 months - 3 years)
● Dedicated Food Rescue Manager
● Transition Away From Quarterly Fee Structure
Long-term Recommendations (3 - 5 years)
● Development of Mobile-Accessible Software
The primary finding of the program evaluation sees current resources utilized within the
delivery model of the Food Rescue Program as representing a significant and ongoing
opportunity cost, whereby the current choice of utilizing limited program resources
within the program as offering a loss in benefit that could have resulted if used for
other organizational activities. Toward this effort, the transition toward a majority
agency-direct model of food rescue is seen as beneficial in capturing additional food waste and commensurate with its mission, especially in regards to ensuring healthy, long-term program performance.
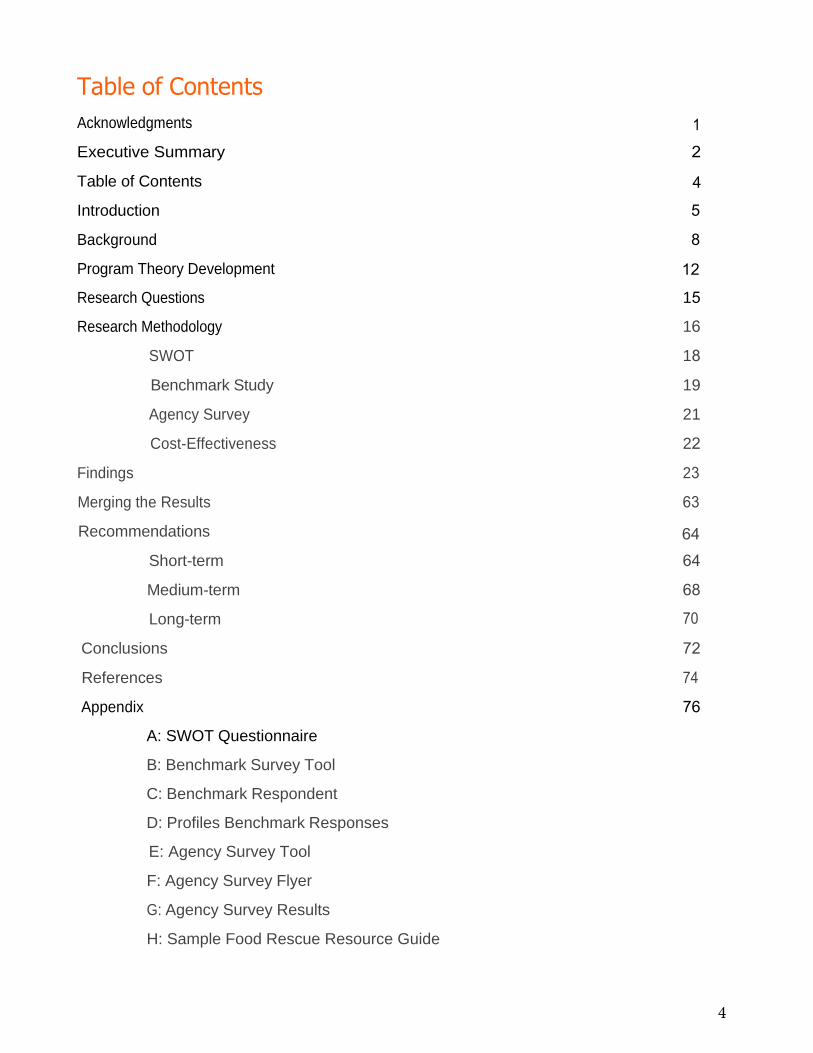
Table of Contents
Acknowledgments 1
Executive Summary 2
Table of Contents 4
Introduction 5
Background 8
Program Theory Development 12
Research Questions 15
Research Methodology 16
SWOT 18
Benchmark Study 19
Agency Survey 21
Cost-Effectiveness 22
Findings 23
Merging the Results 63
Recommendations 64
Short-term 64
Medium-term 68
Long-term 70
Conclusions 72
References 74
Appendix 76
A: SWOT Questionnaire
B: Benchmark Survey Tool
C: Benchmark Respondent
D: Profiles Benchmark Responses
E: Agency Survey Tool
F: Agency Survey Flyer
G: Agency Survey Results
H: Sample Food Rescue Resource Guide
4
5
Introduction
Throughout the nation, as Americans fight hunger on a daily basis, the public policy
debate surrounding food access in local communities remains a persistent concern.
Within the debate over food access, the two contrasting issues involve food insecurity
and food waste. As food recovery or rescue efforts seek to bridge these contrasting
issues, nonprofit organizations have built programs to address food access and
challenge the underlying causes of hunger within local communities. In Southern
Nevada, one of the ways the Three Square Food Bank seeks to address food access in
the community is through its Food Rescue Program. This report details the evaluation
into the effectiveness and efficiency of Three Square Food Bank’s Food Rescue
Program.
Food Insecurity
Viewing the most recently available data, the USDA Economic Research Service found
that one in seven American households was food insecure at some point during 2014
(Coleman-Jensen, Rabbit, Gregory, & Singh, 2015). Pared down further, an estimated
forty-eight million individuals currently experience food insecurity, including over thirty-
two million adults and fifteen million children. In Nevada, the level of food insecurity is
seen at similar rates, with slightly higher than one in seven households food insecure
during the year (Feeding America, 2016a). While this establishes the prevalence of the
issue, defining food insecurity and the underlying notions involved sheds light onto the
context in which millions of Americans live everyday.
Food security specifically refers to a USDA measure of households with “reduced
quality, variety, or desirability of diet” with possible effect on food intake (United States
Department of Agriculture, 2015). Distinguished from hunger as “an individual
physiological condition,” the USDA defines food security along a continuum with
ranges of “low” and “very low” (aka: food insecure). The rate of occurrence is
determined through the Current Population Survey (CPS) conducted and calculated
through the U.S. Census Bureau. Additionally, while commonly mentioned and
correlated within ideas of hunger and poverty, the condition of being food insecure is
not static. Rather, measuring food insecurity is a dynamic situation for American
households, with several underlying socioeconomic and demographic factors
associated with the condition (Gundersen, Kreider, & Pepper, 2011).
6
Seeking to understand the larger context, it is especially important to address the
commonly held public conception that poverty directly causes food insecurity. First,
the socioeconomic conditions of poverty and food insecurity do not always coincide,
with nearly 65% of near-poverty households food secure and more than 20% of
households with income twice the level of poverty line food insecure (Gunderson et al.,
2011). The more predictive measure of food insecurity involves the stability of
households, with greater correlation when measuring access to liquid assets and two-
year household income. The flipside of the public’s misperception is that food
insecurity can be completely eradicated by addressing poverty through government
assistance programs. While programs such as the Supplemental Nutrition Assistance
Program (SNAP) and National School Lunch Program (NSLP) reduce food insecurity in
communities, neither is able to sufficiently address the issue, as significant limitations
often hamper their effectiveness.
While low-income households experience food insecurity at a significantly higher rate
(33.7% of households with income up to 185% of poverty threshold), there are several
demographic groups and factors showing a higher correlation to being food insecure
(Coleman-Jensen et al., 2015):
● Households with children (19.2%)
● Single Households
○ Women (35.3%)
○ Men (21.7%)
● Households headed by minorities, specifically
○ Black, Non-Hispanics (26.1%)
○ Hispanics (22.4%)
Additionally, within respondents to the USDA survey, several conditions are
characteristically reported in households with low or very low food security (Coleman-
Jensen et al., 2015):
● “Worried food would run out”
● “Food bought did not last”
● “Could not afford a balanced meal”
7
Nearly ninety percent of households found to have very low food security report these
conditions for greater than three months of the year. Nearly six years after the great
recession, food insecurity continues to persist at levels higher than the 12% pre-
recession level (Gunderson et al., 2011). Given Nevada has an estimated 423,000 food
insecure residents, the challenges of fighting hunger and addressing the human
condition are ever-present.
Food Waste
Within the United States, food waste represents the single largest type of municipal
solid waste after recycling efforts, with low estimates of roughly 31 million tons
deposited in landfills each year (Buzby & Hyman, 2012). Defined as “a component of
food loss [which] occurs when an edible item goes unconsumed,” this excludes farm
and processing level food loss (Buzby, Wells, & Hyman, 2014, p. 1). Viewed through
the context of the U.S. food supply, the numbers are even more startling, with an
estimated 31 percent going uneaten at the retail and consumer level (Buzby, Wells, &
Hyman, 2014). Additionally, scholars have noted that as the food supply has
progressively increased, food waste continues to rise (Hall, Guo, Dore, & Chow, 2009).
Current federal efforts to curb food waste continue with limited success. In 2015, the
USDA and EPA established a lofty goal of cutting food loss and waste in half by the
year 2030 (U.S. EPA, 2016a). While advancements in prevention have decreased
industry food loss in some areas, specific types of foods such as grain, fresh fruit,
vegetables, dairy, fish, and seafood product losses remain greater than thirty percent.
Given that nearly one-third of the food reaching the retailer level fails to get consumed,
the opportunity for recovering significant amounts of food appears ripe for growth.
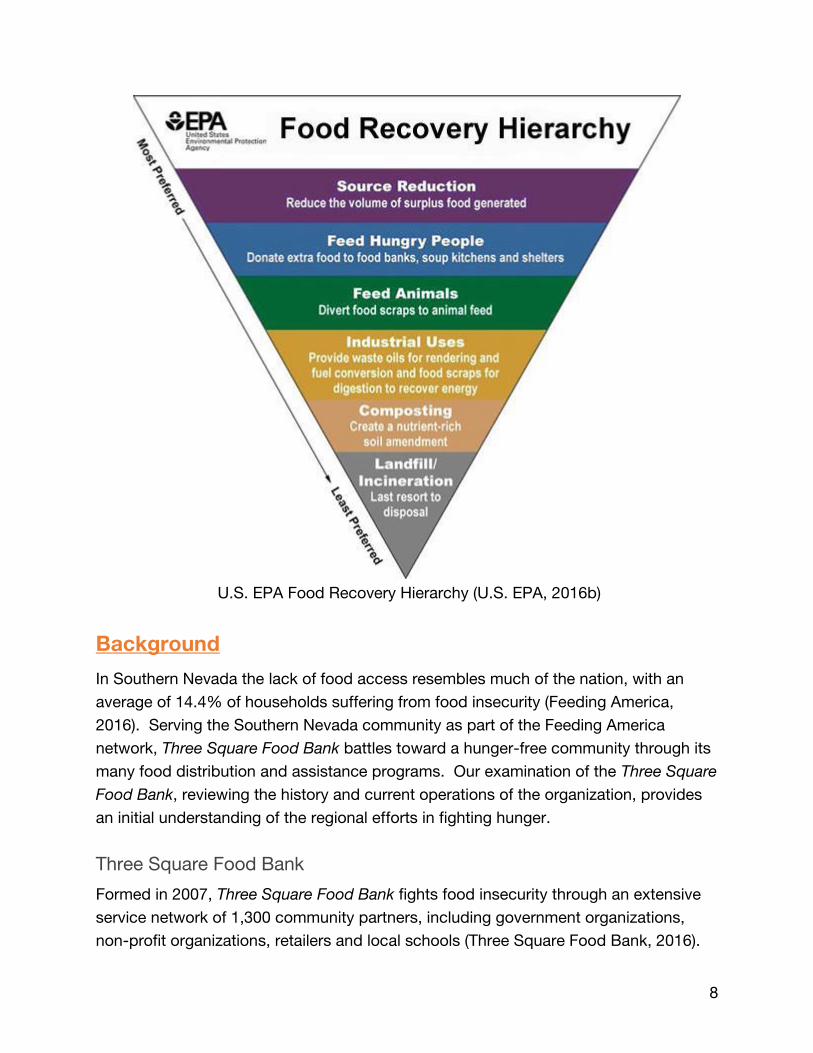
With food recovery efforts stubbornly low, ranging from an estimated three to five
percent (Buzby, Wells, & Hyman, 2014, United States Environmental Protection
Agency, 2015), creation of the food recovery hierarchy (figure x) provides a possible
roadmap in addressing food loss and waste in the United States.
8
U.S. EPA Food Recovery Hierarchy (U.S. EPA, 2016b)
Background
In Southern Nevada the lack of food access resembles much of the nation, with an
average of 14.4% of households suffering from food insecurity (Feeding America,
2016). Serving the Southern Nevada community as part of the Feeding America
network, Three Square Food Bank battles toward a hunger-free community through its
many food distribution and assistance programs. Our examination of the Three Square
Food Bank, reviewing the history and current operations of the organization, provides
an initial understanding of the regional efforts in fighting hunger.
Three Square Food Bank
Formed in 2007, Three Square Food Bank fights food insecurity through an extensive
service network of 1,300 community partners, including government organizations,
non-profit organizations, retailers and local schools (Three Square Food Bank, 2016).
9
As of 2013, seven zip codes in the Las Vegas valley experience food insecurity rates
higher than twenty percent (89101, 89102, 89103, 89106, 89115, 89119, 89169) (Three
Square Food Bank, 2014). With one-in-six Southern Nevadans struggling with hunger,
Three Square distributes more than 38 million pounds of food annually (Three Square
Food Bank, 2016). A 2014 Three Square report found that although current efforts
have resulted in serving over 137,000 unique clients, significant barriers exist in
reaching all in need within the community. Three Square’s simultaneous drive for
programmatic growth while ensuring operational effectiveness and efficiency remain
ongoing strategic objectives. The organization currently delineates the services
provided to the Southern Nevada community within several specific programs,
including:
· Food Bank Distribution
Food Bank Program
Food Rescue Program
· Childhood Nutrition
Backpack for Kids
Kids Café
Meet Up and Eat Up
· SNAP Outreach
· Senior Share Program
Mission Statement
As Three Square Food Bank fights against the expansiveness of food insecurity in
Southern Nevada community, the current mission of the organization reflects the scope
of the issue within the region: “To provide wholesome food to hungry people, while
passionately pursuing a hunger-free community” (Three Square Food Bank, 2016).
Vision
“The vision of Three Square is simple: No one in our community should be hungry. By
bringing together the resources, experience and passion of the people and businesses
of Southern Nevada, we can make sure no one has to. Together, we can feed
everyone” (Three Square Food Bank, 2016).
Core Values
Compassion – With respect for our diverse community and a willingness to put
ourselves in the shoes of others, we act from the heart.
10
Collaboration – We believe in the power of working together, and we are thankful for
those who help us help others.
Innovation – The status quo is yesterday’s news; we believe new ideas will drive
efficient solutions to this oldest of problems.
Stewardship – By planning ahead and holding ourselves accountable, we ensure the
responsible and sustainable use of resources in the long-term.
Transparency – We operate in the public eye, with integrity and respect for those who
fund us, rely on us, and give us their time and trust.
Urgency – It is not enough to plan; we must act with all speed to help those who are
hungry.
(Three Square Food Bank, 2016)
Three Square Food Rescue Program
Three Square Food Bank recognizes that food waste is a problem with a solution:
rescue the “past retail ready” or “salable” food that would otherwise be sent to landfills
by grocery retailers and food distributors. The program is designed to collect edible
food from donor retailers and distribute to local community relief non-profit
organizations (known as “agency partners”). According to Three Square Food Bank
(2016), “the Food Rescue Program enables our [participating agencies] to provide their
clients with perishable foods, such as fruits, vegetables, meat, dairy and bakery
products that are close to code.” With the reasoning for the program sufficiently
addressed, it is important to understand current operations and issues facing the
program.
The foundation of Three Square’s Food Rescue Program relies on the management of
the relationship between retail donors and participating agencies, allowing for the near
simultaneous rescue of food waste and distribution of the food to food insecure
households. Forming partnerships between retailers and agencies allows the
organization to understand and address local food waste and relief agency need,
matching parties within mutually beneficial relationships. Utilizing two models, the
Agency-Direct and Delivery models, Three Square empowers participating agencies to
capture food waste within two different levels of involvement by the organization. In
the Agency-Direct model, Three Square manages the relationship between retailers
and agencies, giving participating agencies the freedom to cultivate individual
relationships with donor retailers. Theoretically, this provides both donor retailers and
participating agencies the ability to accommodate the other’s needs. Within the
Delivery model, Three Square uses its own resources (trucks, employees) to pick up
11
donated product from retailers and then deliver the rescued food to agency partners,
resulting in significantly less contact between the agencies and donors. The model
utilizes seven refrigerated utility trucks, deploying seven drivers five days a week to 140
retailers along pre-planned routes [1]. Immediately following pickup of rescued food,
distribution occurs through delivery services provided by Three Square personnel.
Currently, approximately 88% of all food rescued is administered through the Delivery-
model, with the remaining 12% accrued through Agency-Direct operations [2]. Three
Square presently recovers a portion of logistical costs through quarterly fees assessed
to the agencies. Current estimates of retailer participation stand between 85-95%,
with varying levels of donated product between different donor retailers. Participating
agencies benefit through the ability to provide rescued food to clientele; donor retailers
benefit through the ability to assist their local community, avoid unnecessary food
waste, and gain possible tax benefits. Collectively, this reduces food waste and
directly correlates to Three Square’s mission to eradicate hunger from the community.
From inception, Three Square has sought to increase the effectiveness and efficiency
of the Food Rescue Program. As availability of resources are a constant concern, the
use of the two models and the corresponding programmatic mix raises questions of
logistical effectiveness and efficiency for several reasons. First, with delivery trucks
commonly encountering significant fluctuations in the amount of food donated from
participating agencies, it is important to consider whether resources are being properly
allocated. Second, as Three Square attempts to close the “meal gap” and combat
food insecurity in Southern Nevada, they need to know how best to manage logistical
operations in an advantageous manner consistent with the mission. As Three Square
strives to rescue greater amounts of food, understanding how and why the program
intends to accomplish its objectives is especially important to increasing programmatic
performance.
[1] D. Bosen, personal communication, March 25, 2016 [2] D. Bosen, personal communication, March 25, 2016
12
Program Theory Development
An initial assessment concerning the current need surrounding food access issues,
combined with an initial examination of the Three Square Food Bank, formed an
implicit program theory and provided a basic understanding regarding the political and
organizational environment of the Food Rescue program. As the program is
fundamentally a social program intended to assist those suffering from food insecurity,
questions surrounding the adequacy of resources and effectiveness in delivering
appropriate services formed the basis of the need for a program evaluation. Additional
discussions with Three Square management personnel helped in further forming an
appreciation of the resulting change from programmatic functions. The objective of the
program evaluation is to identify current barriers to effective and efficient program
performance, specifically in a manner that aids decision-making for food rescue
program managers. Assembling and integrating the information allowed for
establishing the initial purpose and scope of the evaluation centered on defining the
effectiveness and efficiency of resources utilized within the Food Rescue Program.
Purpose of Evaluation
The purpose of the Three Square Food Rescue program evaluation is to examine how
well the program is operating, specifically the effectiveness of service delivery and the
efficiency in the use of program resources.
Scope of Evaluation
The scope of the program evaluation will be focused on the ongoing functions within
the Food Rescue Program, including the logistical abilities of participating agencies
within Southern Nevada.
Use of Logic Model
In further developing the rationale for the program, the importance of how services are
delivered within the program became especially relevant, with program leaders
concerned with the efficiency of resources utilized in supporting program activities. As
the project evolved to further focus on how the ongoing Food Rescue Program
delivered services, the primary objective matured to providing identification of barriers
and solutions toward effective and efficient program performance, specifically
concerning the logistical models employed in program operations. As the complexity
13
of operations within Three Square became clear (operating as part of a national
Feeding America network; offering a diverse number of services; the organization’s
vast system of partnerships throughout the community) forming an understanding of
the program became increasingly complicated. Utilizing a logic model to illustrate the
implicit program theory, or the assumptions regarding the resources underpinning
program activities and the outputs that are needed to effectuate program outcomes,
established how the different program elements relate to one another and guided the
formation of research questions for the evaluation.
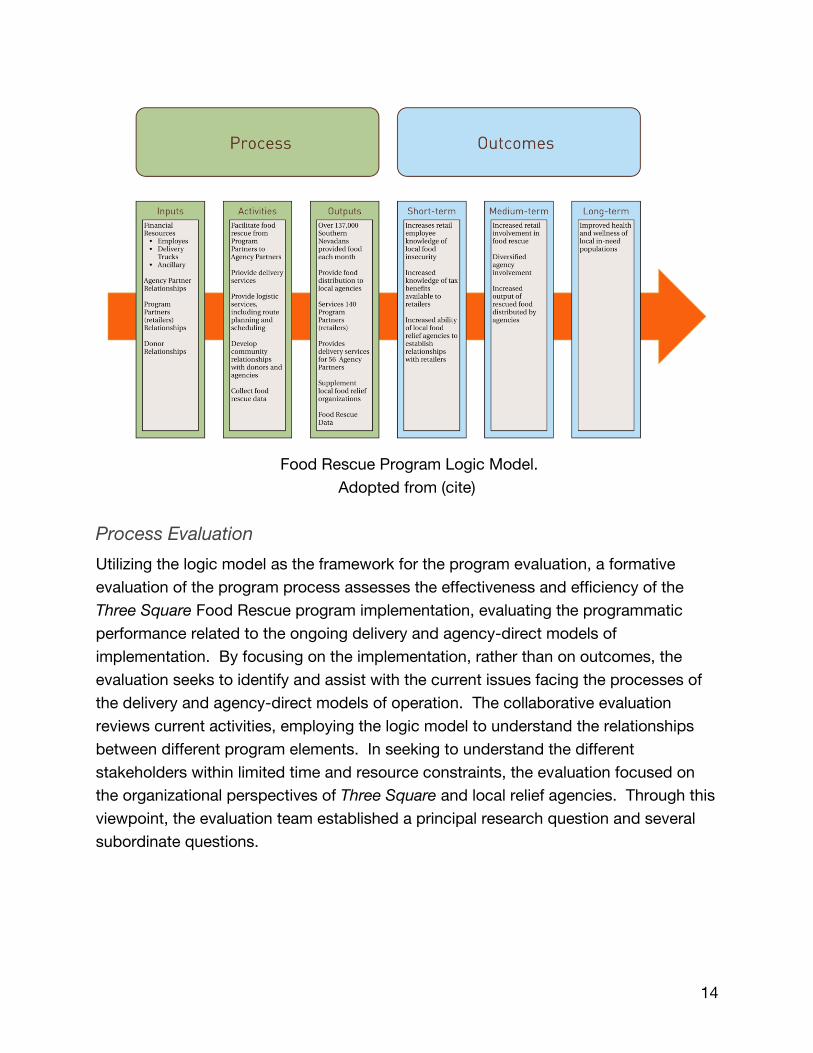
As the evaluation team sought to understand the current issues facing the program,
the logic model provided the framework used to form the research questions and
research design. Shown in figure 1, the logic model breaks down the inputs, activities,
outputs, and outcomes of the program and allows for greater understanding of
program operations. In forming research questions, creation of the logic model
provided the foundation for a collaborative evaluation, specifically in understanding the
relationship between how inputs being utilized in program activities result in specific
outputs and eventually outcomes. Further consultation with Three Square team
members revealed the belief in that a move toward greater agency-direct model
program activities would lead to an increase in pounds of food rescued and greater
overall program performance. Accordingly, the organization plans to move toward
utilizing the agency-direct model as the primary source of conducting food rescue in
the near future. The discussion of the two distinct models utilized for program
operations raised significant questions as to how each affects food rescue program
performance. As Three Square continuously attempts to ensure efficient operations,
the logic model highlighted the relationship between financial resources used toward
delivery service activities and the resulting outputs. In seeking to ensure the cost of
resources results in capturing and distributing the greatest pounds of food to local
relief agencies, understanding the implications of the planned move became the focus
of the program evaluation.
14
Food Rescue Program Logic Model.
Adopted from (cite)
Process Evaluation
Utilizing the logic model as the framework for the program evaluation, a formative
evaluation of the program process assesses the effectiveness and efficiency of the
Three Square Food Rescue program implementation, evaluating the programmatic
performance related to the ongoing delivery and agency-direct models of
implementation. By focusing on the implementation, rather than on outcomes, the
evaluation seeks to identify and assist with the current issues facing the processes of
the delivery and agency-direct models of operation. The collaborative evaluation
reviews current activities, employing the logic model to understand the relationships
between different program elements. In seeking to understand the different
stakeholders within limited time and resource constraints, the evaluation focused on
the organizational perspectives of Three Square and local relief agencies. Through this
viewpoint, the evaluation team established a principal research question and several
subordinate questions.
15
Principal Research Question
· What are the effects of moving toward an agency-centric food rescue model?
Subordinate Research Questions
· How are participating agencies in the Three Square Food Rescue Program
determining non-agency direct or agency-centric participation?
· Are presently participating agencies able to handle current and future food
collection levels within an agency-centric model?
· What are the current issues preventing agency participation in agency-direct food
rescue?
· How do currently participating agencies describe their agency-direct food rescue
program experiences?
· What are the resources needed for the programmatic shift toward an agency-
centric food rescue model and are they currently available?
· How do other food rescue organizations utilizing an agency-centric model define
effective performance? If applicable, are they more effective in capturing greater
proportions or amounts of available food?
16
Research Methodology
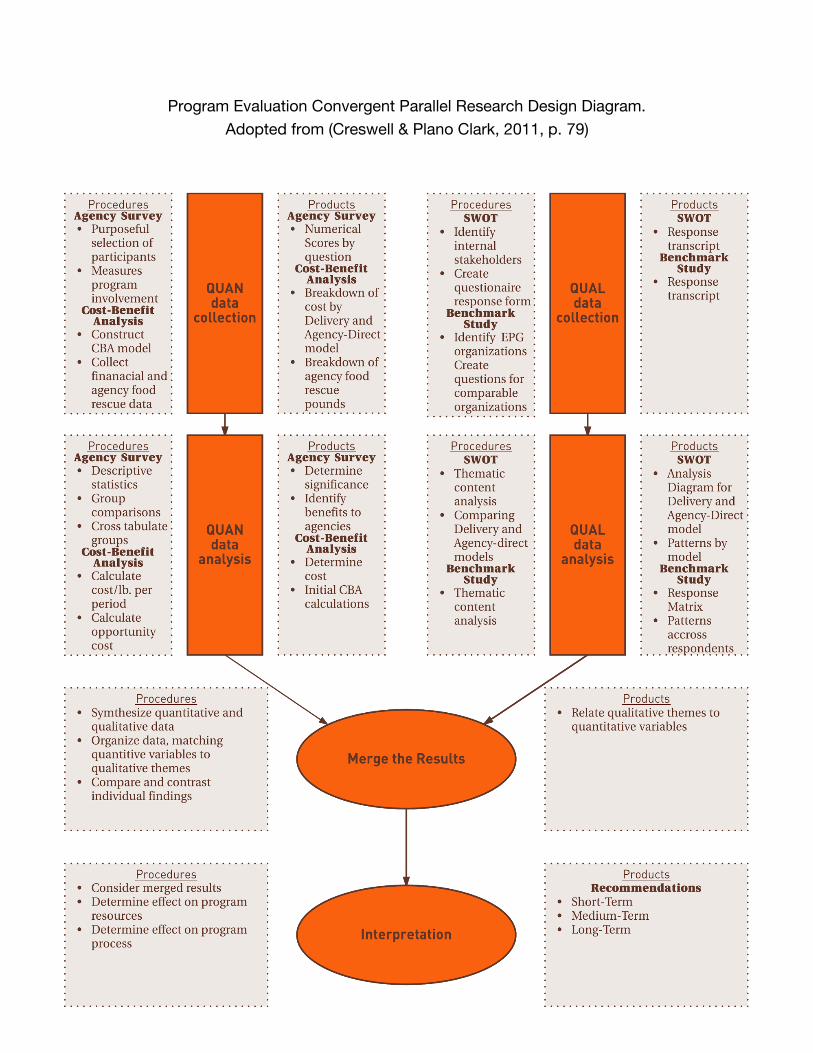
This collaborative program evaluation employs a mixed-methodological approach -
specifically a convergent parallel mixed methods research design - in order to gain a
holistic understanding of the implications of Three Square’s planned programmatic
shift in its food rescue program. Given the complex supply and distribution chain,
combined with ongoing time constraints, the concurrent triangulation design is
intended to strengthen the validity of results through the use of cross-validation and
corroboration of quantitative and qualitative data. As illustrated in the ch, the
convergent research design includes four steps, each resulting in a corresponding
product. The first step includes the design and collection of a corresponding
quantitative or qualitative data strand; with a strength, weakness, opportunities, and
threat (SWOT) analysis and benchmark study comprising the qualitative strand, and the
quantitative strand simultaneously composed of an agency survey and cost-benefit
analysis. This is followed by concurrent data analysis involving each individual study,
with individual corresponding results. These results are then synthesized by related
topic. The resulting mixed-method product is then interpreted, with short-term,
medium-term, and long-term results intended to provide future guidance for program
operations.
The following research methodologies were utilized
● SWOT Analysis
● Benchmark Study
● Agency Survey
● Cost-Benefit Analysis
17
Program Evaluation Convergent Parallel Research Design Diagram.
Adopted from (Creswell & Plano Clark, 2011, p. 79)
18
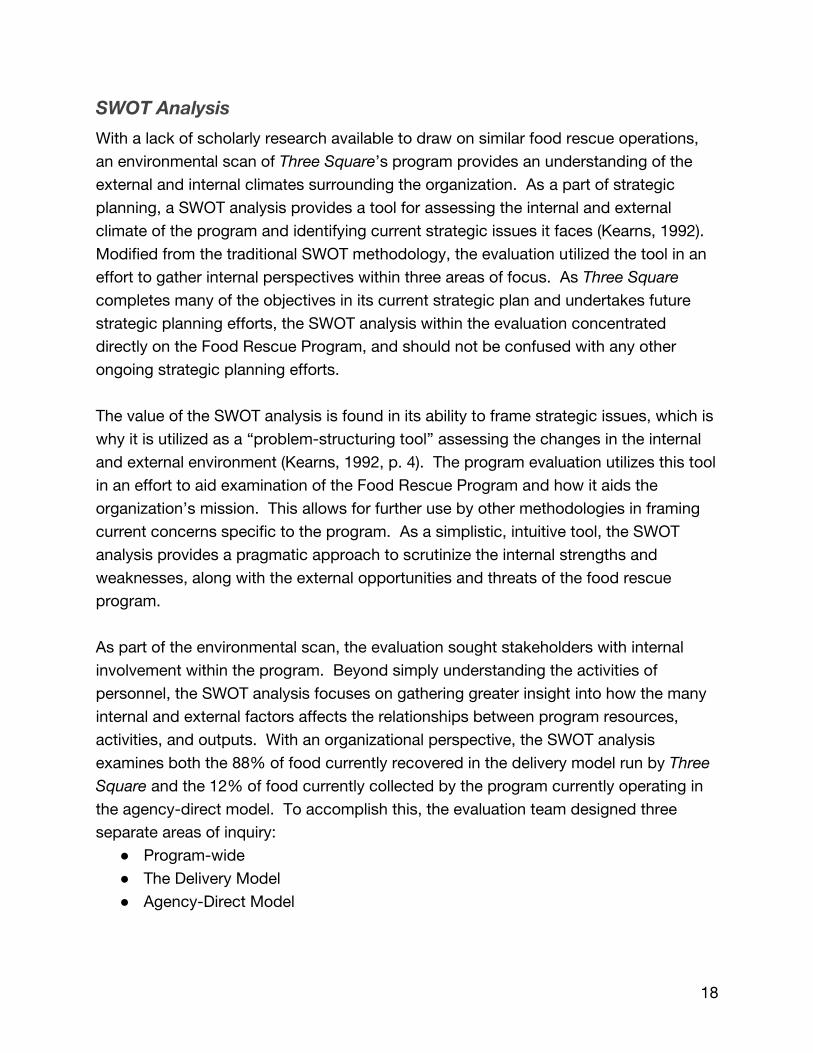
SWOT Analysis
With a lack of scholarly research available to draw on similar food rescue operations,
an environmental scan of Three Square’s program provides an understanding of the
external and internal climates surrounding the organization. As a part of strategic
planning, a SWOT analysis provides a tool for assessing the internal and external
climate of the program and identifying current strategic issues it faces (Kearns, 1992).
Modified from the traditional SWOT methodology, the evaluation utilized the tool in an
effort to gather internal perspectives within three areas of focus. As Three Square
completes many of the objectives in its current strategic plan and undertakes future
strategic planning efforts, the SWOT analysis within the evaluation concentrated
directly on the Food Rescue Program, and should not be confused with any other
ongoing strategic planning efforts.
The value of the SWOT analysis is found in its ability to frame strategic issues, which is
why it is utilized as a “problem-structuring tool” assessing the changes in the internal
and external environment (Kearns, 1992, p. 4). The program evaluation utilizes this tool
in an effort to aid examination of the Food Rescue Program and how it aids the
organization’s mission. This allows for further use by other methodologies in framing
current concerns specific to the program. As a simplistic, intuitive tool, the SWOT
analysis provides a pragmatic approach to scrutinize the internal strengths and
weaknesses, along with the external opportunities and threats of the food rescue
program.
As part of the environmental scan, the evaluation sought stakeholders with internal
involvement within the program. Beyond simply understanding the activities of
personnel, the SWOT analysis focuses on gathering greater insight into how the many
internal and external factors affects the relationships between program resources,
activities, and outputs. With an organizational perspective, the SWOT analysis
examines both the 88% of food currently recovered in the delivery model run by Three
Square and the 12% of food currently collected by the program currently operating in
the agency-direct model. To accomplish this, the evaluation team designed three
separate areas of inquiry:
● Program-wide
● The Delivery Model
● Agency-Direct Model

19
Method of Subject Selection
Procedures for data collection involved collaborative efforts used for identification of
internal stakeholders. Questions were formed through brainstorming by the evaluation
team based on information gathered during the initial exploration of the organization’s
background in general and the Food Rescue program specifically. The initial list of
thirty questions was collaboratively reduced to twenty-five, with eight program-wide,
nine delivery model, and eight agency-direct model questions forming the final
questionnaire. Lacking current dedicated food rescue program personnel, participants
were selected based on their involvement with the program.
Utilizing Google Forms for data collection, the questionnaire was distributed on July
12th, 2016 to Three Square personnel, with respondents offered anonymity to increase
objectivity. Simultaneously, the evaluation team notated program factors involved with
both the internal and external environments. Due to time and resource constraints, the
collection of data closed on July 22nd, 2016 with one respondent. The responses
(Appendix A), in combination with evaluation team input, formed the basis for
organizing the data with the three areas of program-wide, delivery model, and agency-
direct model operations. Identifying the external environments, the opportunities and
threats were identified and categorized accordingly. Conversely, internal strengths and
weaknesses were similarly identified and categorized. The initial SWOT analysis
allowed evaluators the opportunity to establish the internal and external forces
currently facing the Food Rescue Program, providing further focus of applicable
research area(s) to contribute to the benchmark study.
Benchmark Study
In order to collect data for the benchmark study, a questionnaire was crafted that
mirrored the SWOT analysis questions used by the evaluation team to understand
Three Square’s current programmatic model. The SWOT format was done deliberately
so that there would be a clearer line of comparison between the data collected via the
benchmark study and the data gained from Three Square’s own SWOT analysis. In
addition to 10 SWOT questions, the questionnaire also included nine general
information questions to establish linkages between the food banks and Three Square,
and two pitfalls/best practices open-ended questions that allowed respondents to
share information about their program they deemed important. The entire
questionnaire is included in Appendix B. Once participation was confirmed by the
subject food banks via email/phone communication, a time was setup to conduct the
20
questionnaire over the phone. The evaluation team thought this would provide the
best data by allowing the interviewer to ask for additional clarification or more detail in
responses. Five subjects did conduct over-the-phone interviews between June 1st and
June 10th, with the lone exception (FASD) completing the questionnaire themselves due
to time and scheduling constraints.
Summarized answers to the questionnaires were then charted in a table in order to
summarize the findings and provide a framework for direct comparative analysis.
Additionally, all of the raw responses for each type (Strengths, Weaknesses,
Opportunities, Threats) were grouped together and displayed according to type to
provide an additional mode of qualitative analysis. The evaluation team analyzed the
responses, each identifying keywords, themes, or general takeaways apparent from
the aggregated data. These observations served as the basis for the discussion of
findings that follows, and both the chart and SWOT-formatted results are included in
Appendix C.
Method of Subject Selection
The Feeding America network has approximately 200 food banks nationwide that
provide services to local hunger relief organizations. In order to normalize this diverse
group of partners, it has developed Environmental Peer Groups (EPGs) that create
subgroupings of food banks with similar characteristics named after different fruits and
vegetables. Food banks in a specific EPG are similar in four major characteristics:
service area food insecurity, resource availability, service area size, and cost to operate
(From Good to Great: Environmental Peer Groups and the Performance Framework
Dashboard, Mark Buettner, PPT). These EPGs are useful for comparison and allowed
the evaluation team to refine their benchmark targets to not only other Feeding
America food banks, but the more narrowly defined group of similar food banks
designated in the Orange/Papaya grouping.
To begin the sample selection process, websites of all food banks with the
Orange/Papaya EPG designation were researched by members of the evaluation team.
The goal of this initial vetting was to find evidence of a food rescue program in which
product was received by local grocers and other retail outlets. Nine potential food
banks were identified via this method, and along with a 10th food bank in a separate
EPG (Feeding America San Diego) each were invited to participate in the study via
email. Feeding America San Diego was included for a few reasons. First, although not
grouped together by Feeding America, they are geographically close
21
to Three Square. Additionally, Feeding America San Diego has a successful all agency
food rescue model, which made them a good source for information. Finally, one of
the members of the evaluation team was a former employee of Feeding America San
Diego, and felt confident he could use his connection with the food bank to encourage
participation in the survey. Of the 10 organizations invited, a total six accepted and
provided data for the benchmark study.
Agency Survey
The broad purpose of the survey methodology was to gain the perspectives of Three
Square’s Agency Partners with regard to the Food Rescue Program. The evaluation
team wished to find out at what level agencies were participating in the program, their
abilities to participate, preferences and attitudes toward involvement in the Food
Rescue Program, and the resources available to them which could affect the efficiency
and effectiveness of the program. While the SWOT and Benchmark methods would
provide insight into the “food bank” perspective of the program, the evaluation team
realized the need to include agency data in order to obtain a 360-degree view of the
program. Three Square’s desire for agencies to assume a majority of the operational
responsibility required a measure of both the capacity and willingness of those
agencies to carry the load. Qualtrics survey software was chosen as the survey tool
due to its ability to reach Three Square’s agency partners while also providing
analytical tools appropriate for the evaluation.
Formulation of the survey tool questions began with review of the initial responses to
the benchmark study questions. The experiences of Feeding America network food
banks were expected to inform regarding the efficiency of agency direct vs. pickup
models, levels of participation, and resources deemed necessary for success. The
evaluation team developed various types of questions in order to elicit subjective
information from an agency-centric perspective. The survey contained classification
questions, open and closed questions, and lists and scale questions (Bamberger, et al.
2012). The entire evaluation group reviewed and approved the final questions in
collaboration with relevant Three Square staff. (Appendix E)
Method of Subject Selection
The goal was to have 100% participation of Three Square’s current partner agencies,
whether or not they were current participants of the Food Rescue Program. The
feedback of non-participants would help determine the capacity for agency-direct
growth. Prior to completing and distributing the finished survey, the evaluation team
promoted the survey using various techniques. On June 3, 2016, an announcement of
the survey was included in Three Square’s monthly agency e-newsletter. The
announcement also promoted an in-person presentation during the mandatory
“Agency Gathering” at Three Square on June 14th and 15th. A member of the
22
evaluation team provided a brief presentation during the Agency Gathering on those
two dates, providing the attending agency members with an overview of evaluation
program and forthcoming survey. The evaluation team also distributed flyers at the
Agency Gathering containing information about the project and survey (Appendix F).
The Qualtrics link for the finished survey was sent to Three Square on June 17, 2016
and Three Square forwarded it to 353 Agency Partners on June 20, 2016 with a
request for each agency to complete the survey. The survey closed on July 12, 2016
at 5:00pm. Additionally, Three Square offered the agencies the chance to win a $25.00
account credit for completing the survey with the drawing being held on July 13, 2016.
Cost-Benefit
Various financial data was collected from Three Square to determine the actual cost of
providing delivery services, including: driver salaries and benefits, truck payments and
maintenance, fuel costs, and equipment costs. Data also included income for the
delivery model, in the form of a flat quarterly fee ($150) paid by participating agencies.
Although there are indirect costs related to the agency-direct model (for example, the
salary of staff that support the agencies and those who manage the overarching
relationship with food donors), we controlled the data by eliminating these costs for
both the agency-direct and delivery scenarios. This allowed us to set the “cost” for the
agency-direct model to $0 for Three Square. It is important to acknowledge that there
are still costs associated with the agency-direct model, and that the majority of these
costs fall on the agencies themselves. However, for purposes of this evaluation,
setting the agency-direct cost to $0 allows the research team to study the effect of
transitioning rescue from delivery to agency direct on a pound for pound basis, which
is discussed in greater detail in the Findings section.
The raw data was distilled to reflect a calendar year running from May 2015 - May
2016, in order to further normalize the numbers for analysis. Costs were tallied for the
year and averaged out for quarterly and monthly costs and revenues; pounds rescue
via the delivery model were treated in a similar fashion. Using the averages of both net
expenses (revenues-expenses) and total pounds collected, a cost-per-pound average
for the current delivery program was determined.
23
Research Findings
Following data collection for individual methodologies, the resulting data was
simultaneously analyzed by individual team members. As each methodology focused
on a given perspective of the program, the framework was meant to provide additional
validity when merging the resulting products. Due to time constraints, the timing of
each study occurred slightly differently, with collaboration between the evaluation team
and the Three Square team continuing throughout the analysis of the individual studies.
Occurring throughout the month of July 2016 and into August 2016, the individual
analyses allowed the evaluation team to examine the initial data, framing strategic
issues and concerns from different perspectives.
24
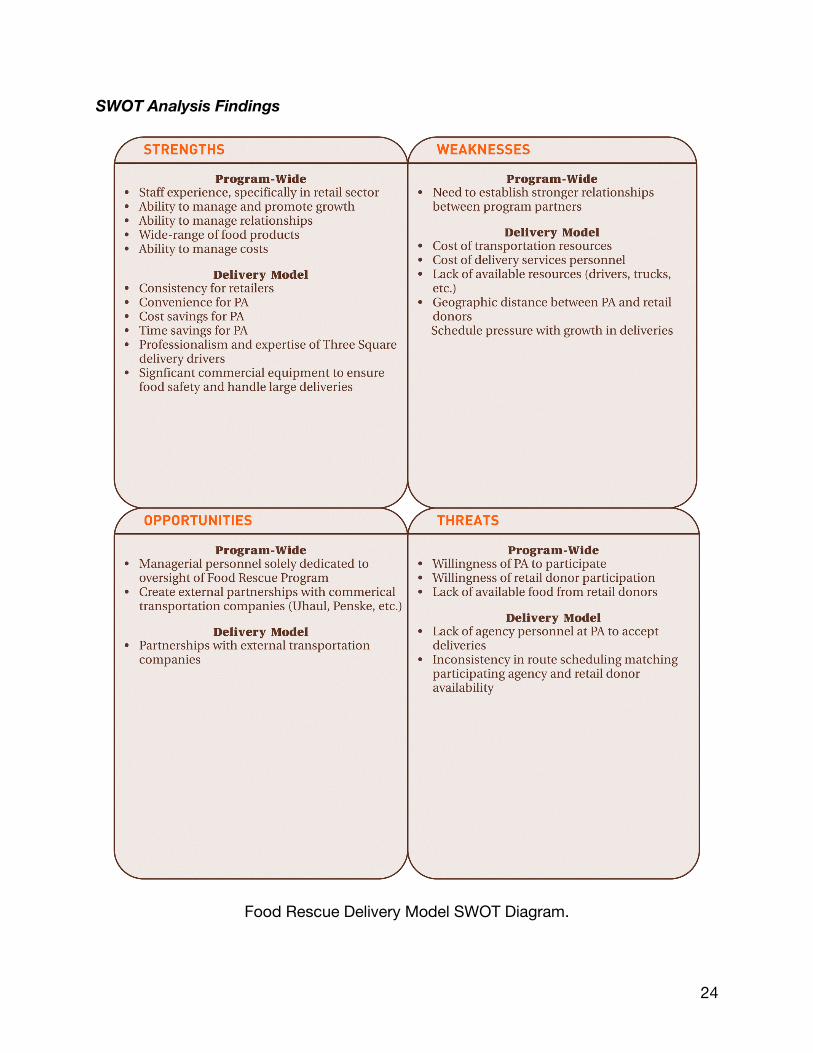
SWOT Analysis Findings
Food Rescue Delivery Model SWOT Diagram.
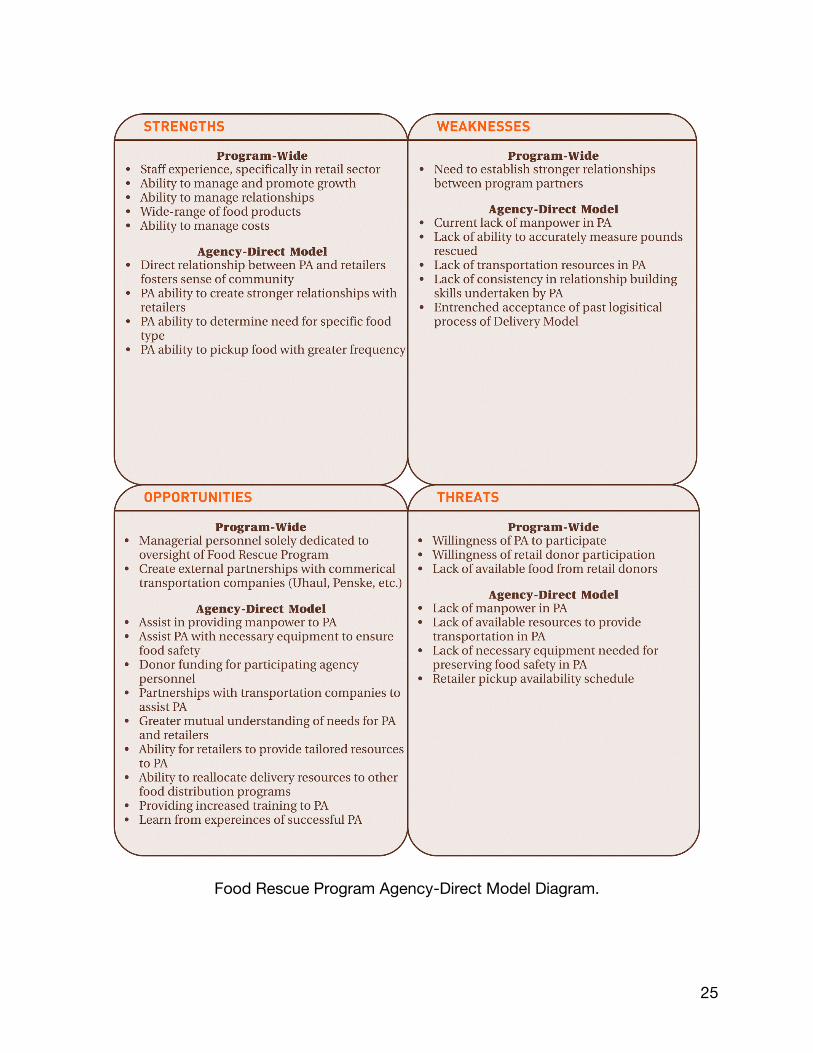
25
Food Rescue Program Agency-Direct Model Diagram.
26
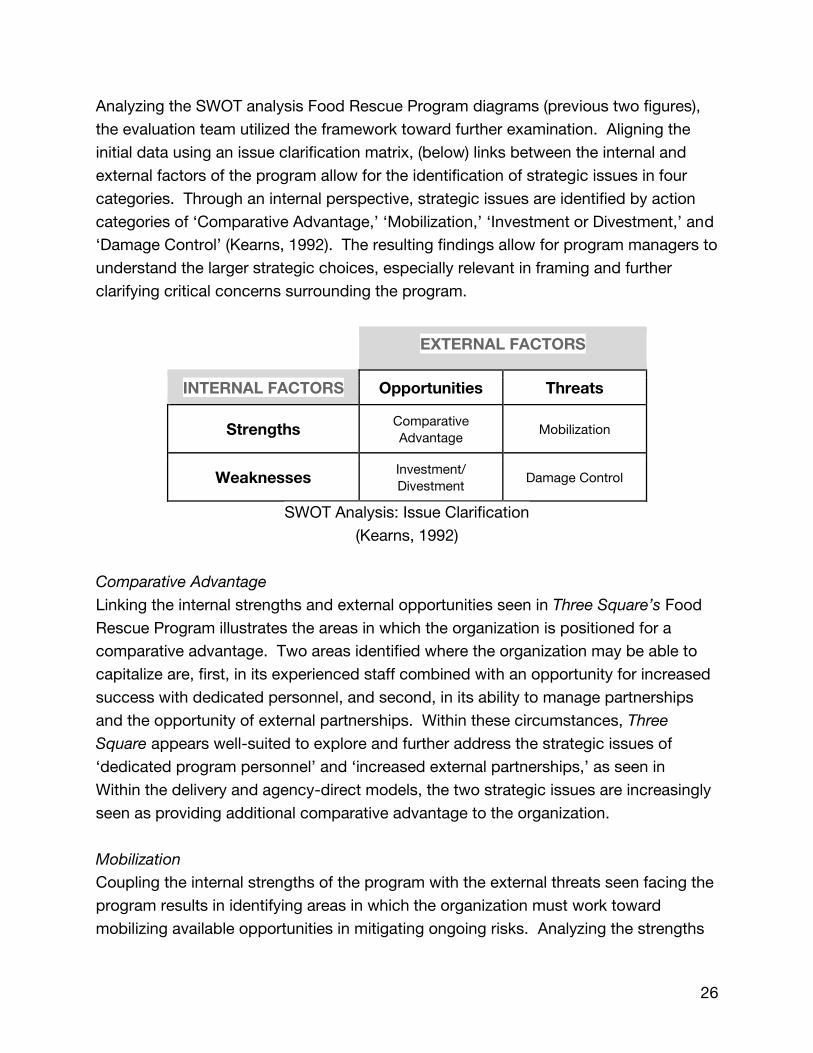
Analyzing the SWOT analysis Food Rescue Program diagrams (previous two figures),
the evaluation team utilized the framework toward further examination. Aligning the
initial data using an issue clarification matrix, (below) links between the internal and
external factors of the program allow for the identification of strategic issues in four
categories. Through an internal perspective, strategic issues are identified by action
categories of ‘Comparative Advantage,’ ‘Mobilization,’ ‘Investment or Divestment,’ and
‘Damage Control’ (Kearns, 1992). The resulting findings allow for program managers to
understand the larger strategic choices, especially relevant in framing and further
clarifying critical concerns surrounding the program.
EXTERNAL FACTORS
INTERNAL FACTORS Opportunities Threats
Strengths Comparative
Advantage Mobilization
Weaknesses Investment/ Divestment
Damage Control
SWOT Analysis: Issue Clarification
(Kearns, 1992)
Comparative Advantage
Linking the internal strengths and external opportunities seen in Three Square’s Food
Rescue Program illustrates the areas in which the organization is positioned for a
comparative advantage. Two areas identified where the organization may be able to
capitalize are, first, in its experienced staff combined with an opportunity for increased
success with dedicated personnel, and second, in its ability to manage partnerships
and the opportunity of external partnerships. Within these circumstances, Three
Square appears well-suited to explore and further address the strategic issues of
‘dedicated program personnel’ and ‘increased external partnerships,’ as seen in
Within the delivery and agency-direct models, the two strategic issues are increasingly
seen as providing additional comparative advantage to the organization.
Mobilization
Coupling the internal strengths of the program with the external threats seen facing the
program results in identifying areas in which the organization must work toward
mobilizing available opportunities in mitigating ongoing risks. Analyzing the strengths
27
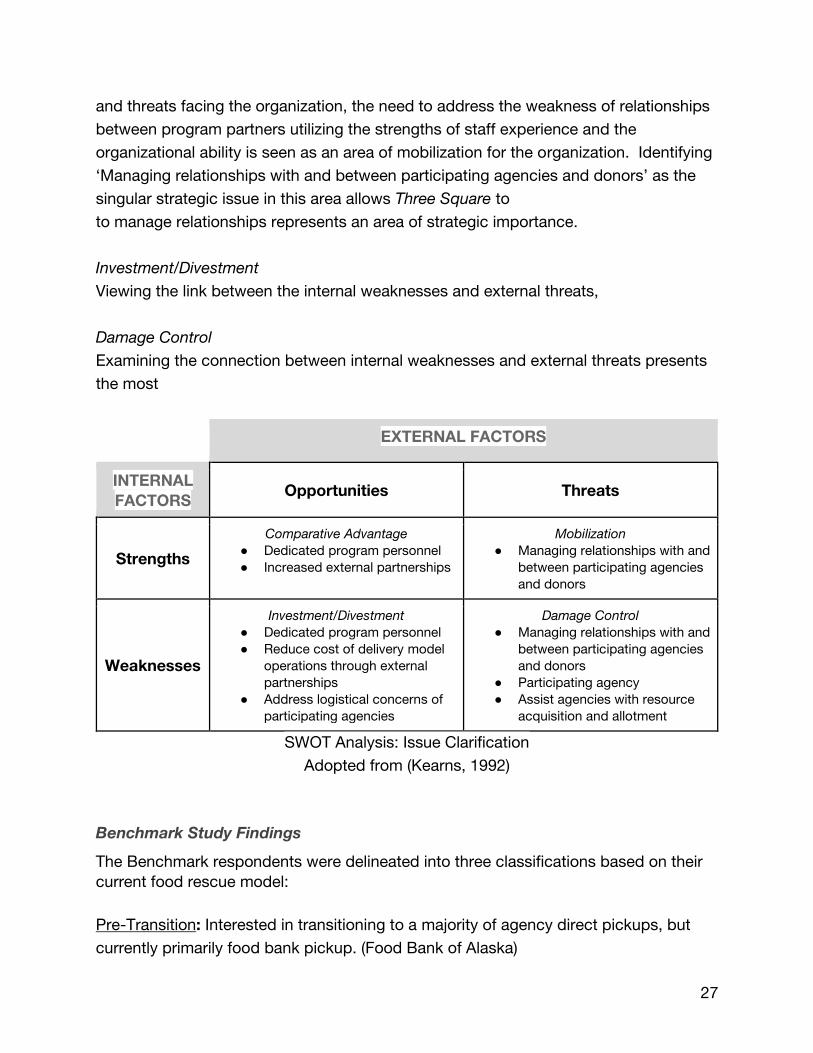
and threats facing the organization, the need to address the weakness of relationships
between program partners utilizing the strengths of staff experience and the
organizational ability is seen as an area of mobilization for the organization. Identifying
‘Managing relationships with and between participating agencies and donors’ as the
singular strategic issue in this area allows Three Square to
to manage relationships represents an area of strategic importance.
Investment/Divestment
Viewing the link between the internal weaknesses and external threats,
Damage Control
Examining the connection between internal weaknesses and external threats presents
the most
EXTERNAL FACTORS
INTERNAL
FACTORS Opportunities Threats
Strengths
Comparative Advantage ● Dedicated program personnel
● Increased external partnerships
Mobilization ● Managing relationships with and
between participating agencies
and donors
Weaknesses
Investment/Divestment ● Dedicated program personnel
● Reduce cost of delivery model
operations through external
partnerships
● Address logistical concerns of
participating agencies
Damage Control ● Managing relationships with and
between participating agencies
and donors
● Participating agency
● Assist agencies with resource
acquisition and allotment
SWOT Analysis: Issue Clarification
Adopted from (Kearns, 1992)
Benchmark Study Findings
The Benchmark respondents were delineated into three classifications based on their
current food rescue model:
Pre-Transition: Interested in transitioning to a majority of agency direct pickups, but
currently primarily food bank pickup. (Food Bank of Alaska)
28
Transitioning: Has made strides in moving from a food bank model to agency direct,
but have not reached their goals yet. (Food Bank of the Rockies; Care and Share Food
Bank)
Fully Transitioned: Have met their goals on agency direct pickups, or in the case of
FASD, started 100% agency direct and remain that way. (Regional Food Bank of
Oklahoma; Great Plains Food Bank; Feeding America San Diego)
A complete profile of each of the benchmark subjects is included as Appendix D, and
is useful for comparing and contrasting to Three Square’s organizational profile.
The results to the benchmark study are presented through the SWOT framework in
which the questionnaire was developed. This approach helps to make more
meaningful connections to Three Square’s existing program through direct comparison
of the benchmark and Three Square SWOT datasets.
Strengths
The consolidated benchmark data indicates that making local connections, equipment
and human resources, and increasing overall poundage are the strengths of the
agency-direct model, regardless of the stage (transitioning or fully transitioned);
alternatively, it indicates stability and brand recognition as strengths of the food bank
pick-up model.
Local connections are viewed as bedrock of agency direct models. Regional Food
Bank shared that agencies “build stronger relationships [with donors] then the Food
Bank ever could”, and Care and Share identified the ability to provide food to a local
pantry, which may even serve the store’s own shoppers, provides a “feel good”
incentive for the store’s employees. North Dakota identified the relationship between
agency and donor the aspect that “works really well with [their] Food Rescue
Program.” These connections are not only Agency-Donor however; connections
between dedicated food bank staff is also an important strength in the model. The
dedicated Food Rescue Coordinator in Denver makes visits to the stores three days a
week in order to share donation reports and express any agency concerns, such as
lack of certain types of food. This relationship ensures that donors (and specifically
store managers) are kept up to date on the progress or regression of their donation
program, which results in not only more overall poundage, but also a better selection.
29
Local agencies are also more in tune with what their service population is in need of
(for example: some areas may have an abundance of produce but no access to dairy,
or vice versa) and can share these needs directly with the donor to better serve that
population.
Another strength of agency-direct models are the resources they are able to provide to
the program, both material and human. Freezer blankets, scales, and thermometers,
all which relate to food safety, where identified by each agency-direct model as the
“resources that allow [their] program to succeed.” Purchased by the food banks for
the agencies, often through specific Walmart grant funding, these items are required
for agencies to participate in the program in at least half of the sample, and most likely
all although it was not explicitly disclosed. On the human resource side, a dedicated
staff position at the Food Bank to manage the program was identified as a strength in
three cases; strong volunteer involvement in one. North Dakota and Denver were
specifically adamant about the importance of the dedicated coordinator in maintaining
successful donor relations/education and stabilizing donation levels. Care and Share
had a similar position that was identified as critical in its program success, but staffed
it with a skill-based volunteer with great success.
Increased poundage and quick response time were the other overarching strengths of
the agency direct model. Regional Food Bank and San Diego identified additional food
as the thing that “works really well” with their agency direct program. Both North
Dakota and San Diego mentioned “quick pickups” as a benefit, due to the fact that the
Food Bank’s trucks are usually out on set schedules and making adjustments to pick-
up a one time or new opportunity takes an investment of both time and money.
Some strengths also emerged from the food bank pickup model, both in “pre-
transition” and “transitioning models”. Alaska indicated that the Food Bank’s brand
identity helped donors feel secure about food safety and the ultimate destination of the
food donation (ie: given to those who need it, not re-selling, etc.). Alaska and Denver
indicated that the scales and pallet jacks the drivers were equipped with were
strengths. Consistency was also a strength within this model, with the Food Bank
being able to have stronger control over donor relations issues by consistently making
assigned pickups on time.
30
Weaknesses
Weaknesses across agency direct models in every stage of transition were very
homogenous, commonly identified as reporting issues, reliability concerns, and staffing
shortages.
Getting pounds reported back from agencies conducting pickups was an issue for all
but the Regional Food Bank, with sites having trouble with both manual paper-based
reporting (North Dakota) and utilization of Meal Connect, Feeding America’s online
poundage portal (Denver, Care and Share, San Diego). Denver sets an expectation of
reporting within 24 hours; San Diego includes reporting deadlines (15 day window) in
its agency agreements, but still has “a difficult time strictly enforcing them because we
haven’t yet created an effective system of consequences for late reports,” and
indicates that “late receipts greatly affect the entire organization.” Care and Share has
implemented a consequence of the loss of food drive and meat allocations until reports
are current, but it still remains a struggle.
Reliability of pickups and communication with donors was also a common thread
across subjects. North Dakota sees “communication between agencies and donors” as
a main area for improvement, noting that there is a stronger relationship at donor sites
between Food Bank drivers and donor staff then between agency partners and the
donor. Denver isolated “accountability to make sure they are picking everything up on
time” as the “one thing [they] would change about how the program currently
operates,” noting that agencies sometimes “don’t pick up and don’t tell the donors.”
On a positive note, Regional Food Bank answered the same question this way: “Wish
we would have started as agency direct from the beginning.”
Staffing shortages were mentioned as a weakness both explicitly and implicitly. Care
and Share indicated a new staff member would be “the one thing they would change
about how the program currently operates”. San Diego shared that “without a
dedicated staff member, FASD cannot focus as much attention on continuous
improvement of our partner agencies, the participation of current donors, or the
recruitment of new donors.” More implied responses related to staffing include:
Denver’s hopes for “continued education of donor personnel”; San Diego’s wishes to
increase agency monitoring visits; North Dakota’s hopes to move the current FTE
responsible for the program from an 80% focus on Food Rescue to 50%.
Alaska, representing the food bank model, identified their own capacity limits as the
program’s greatest weakness. Some of their donors “want pickups 5-6 days a week
31
and evenings, but the capacity just isn’t there.” Additional trucks, staffing, and funding
were shared as resources currently “missing in helping the Food Bank meet its full
potential”. Interestingly, Alaska identified moving toward an agency pickup model as
the “one thing they would change about how the program currently operates.”
Opportunities
Agency direct models conveyed building agency capacity and increased donor
education as the opportunities most readily available to maximize the impact of their
Food Rescue program. Agency capacity building took many forms, including: “more
trucks and refrigeration for agencies” (Regional Food Bank); “more staff and volunteers
for the agencies” (North Dakota); more freezers, freezer blankets, and more agency-
based volunteers (Care and Share); increasing store pickups to a minimum of 5 days a
week (San Diego). Denver identified “more funding for agency supplies” as an
opportunity to assist their program. San Diego recognized an increase in collaboration
between the Food Sourcing Department and Agency relations as a way to bolster
agency strength. Regional Food Bank similarly identified work between Food Rescue
and Agency Relations as “critical.”
Education of donors and their staff was also seen as an area to increase total food
rescued. Denver would like to see increased education on when to donate vs. when to
compost, with special attention paid to dairy. San Diego cited a new California law (AB
1826) that has mandated food waste generators to divert food from landfills or pay a
fine. This has “prompted a lot of businesses to look at their waste streams and
evaluate how they handle leftovers or excess foods.”
On the food bank pick-up side, education of donors is also a concern. Alaska
mentioned the corporate Walmart policy against donating eggs as a roadblock to
increased product. But overall, Alaska is seeing an increase in the amount of food
being donated and is unable to rescue 100% of product with their limited resources.
The opportunity for increased poundage is there, but limited funding and manpower
are hindering their ability to maximize their rescue.
Threats
Threats to programs were all widely distributed, with a few main themes being
developed. In an interesting parallel, while donor education is an opportunity for many
Food Banks, food safety concerns related to agency pickups is identified as the major
threat to the programs from the respondents. North Dakota pointed to new protocols
32
for federal temperature regulations as “an external change that could potentially harm
the program.” Denver is also proactive about food safety concerns, requiring
participant agencies to take a class and sign a waiver that they are away of safety
procedures. Care and Share takes this model even further, mandating it’s agencies
engaged in the program attend SafeServ training—and providing them with the funding
to do so. San Diego notes they are “frequently commended on our high-level food
safety standards and continued efforts train and monitor our partner agencies to
uphold the same standards,” and have created their own resource guide for food
rescue agencies (See Appendix H).
Other threats included: an aging volunteer workforce at the agency level (San Diego);
new companies attempting to buy out of code food for profit, such as FoodEx
(Regional Food Bank, Care and Share); donor-agency relations issues, including
removing agencies from pickup (Denver, North Dakota). It is also worth noting that
almost all Food Banks indicated a “warming up period” between donors and agencies,
especially in the beginning of the transition when pickups had formerly been made by
the Food Bank itself.
Alaska identified fluctuating gas prices as a major threat to their food bank pickup
model, as well as incorrect food safety interpretation by donors leading to un-rescued
product. Fluctuations in donations were also an issue. This included lulls in February
(after the holidays) and in the summer time.
Survey Findings
The following tables and figures represent selected results from the Agency Survey,
which are included in the subsequent Analysis subsection. Complete survey results
are included as Appendix G.
33
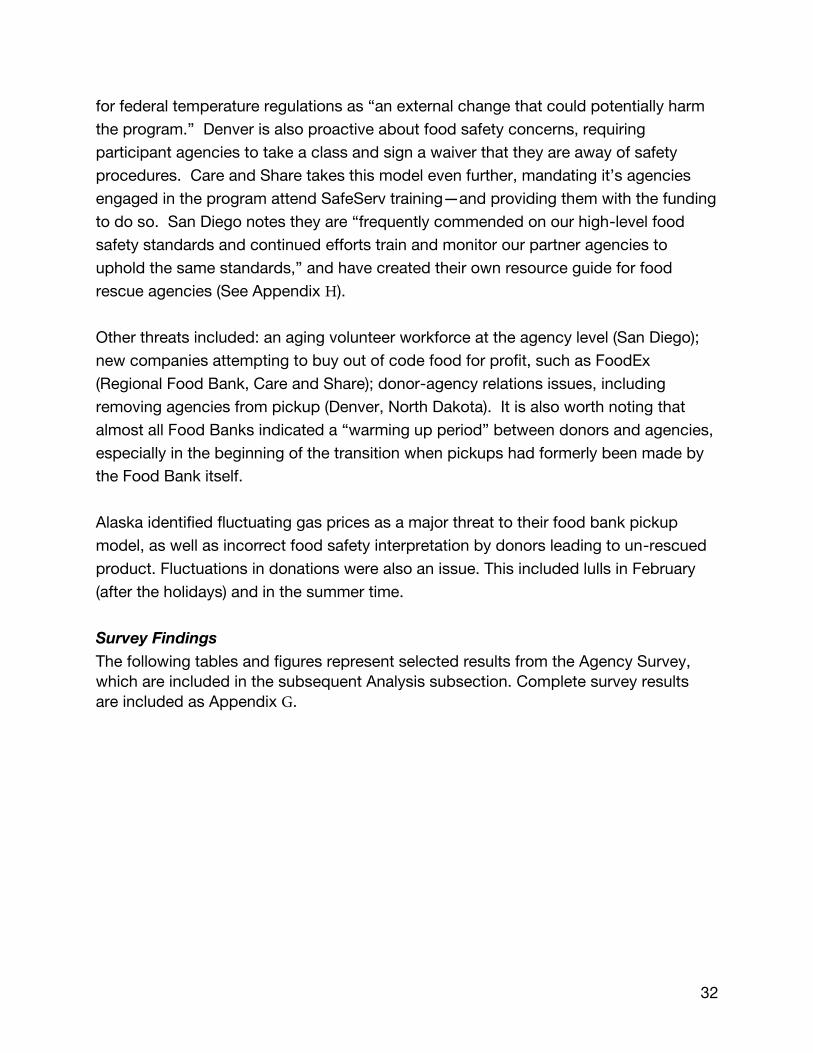
Faith-Based vs. Non Faith-Based.
Percentage of Faith-Based and Non Faith-Based Respondents
34
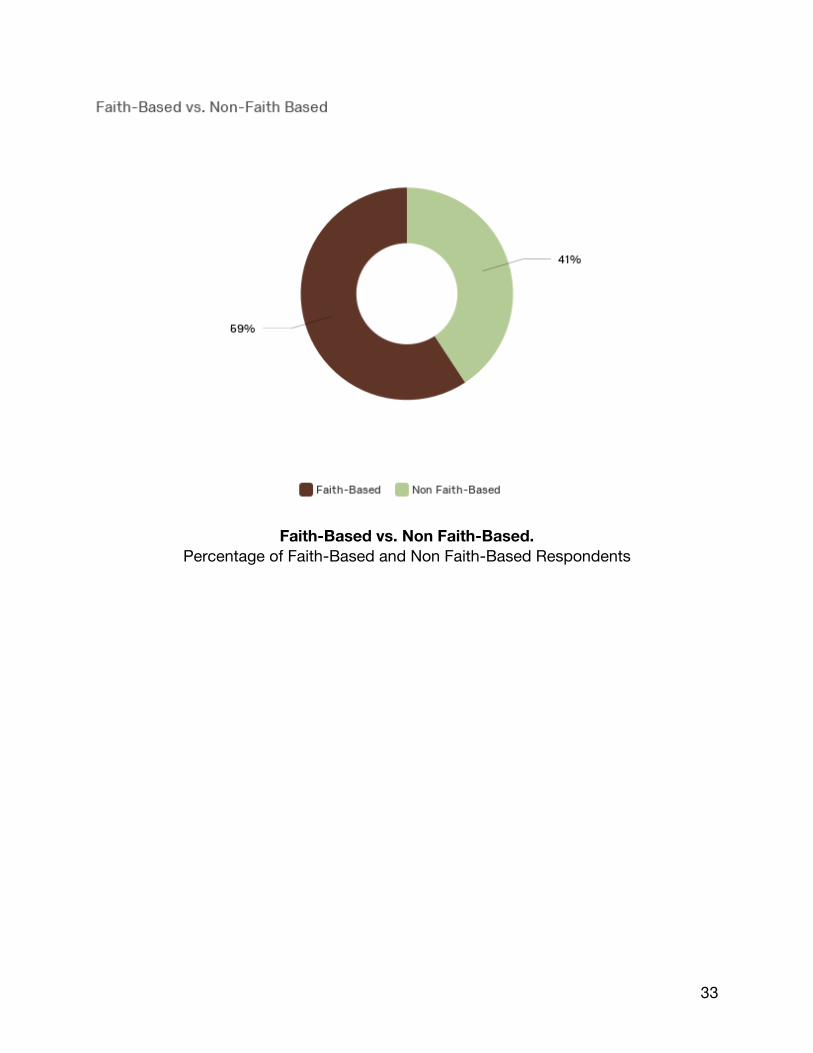
How long has your agency partnered with Three Square?
Length of time respondent had partnered with Three Square in any capacity; from less
than one year to greater than 6 years by percentage of respondents.
How many individuals (paid and unpaid) within your organization are assigned
duties related to food distribution?
44 responses – Approximately 600 individuals.
How many individuals (paid and unpaid) within your organization are assigned
duties related to food distribution?
44 respondents reported a total of approximately 600 individuals working on food
distribution.
How many clients receive food from your Agency each week?
46 responses - Approximately 10,300 clients.
How many clients receive food from your agency each week?
46 respondents reported a total of approximately 10,300 clients receiving food.
35
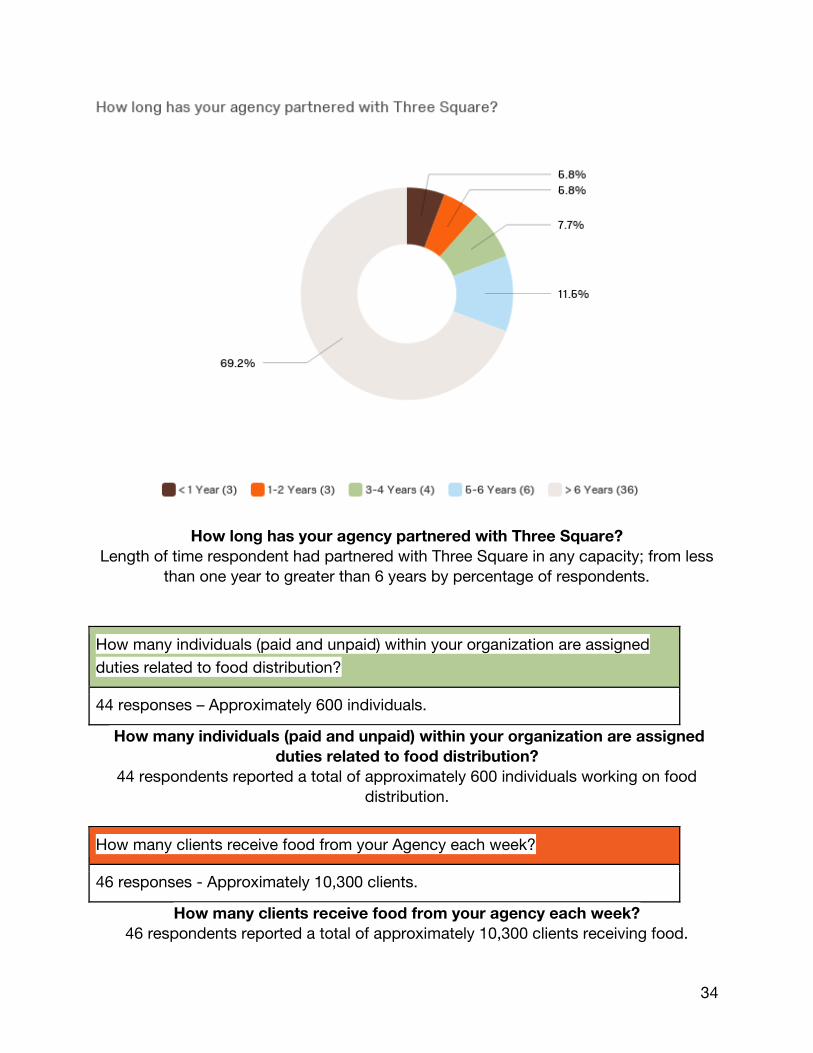
Does your agency currently participate in Three Square’s Food Rescue Program?
Percentage of respondents participating, not participating or on the waitlist for food
rescue.
36
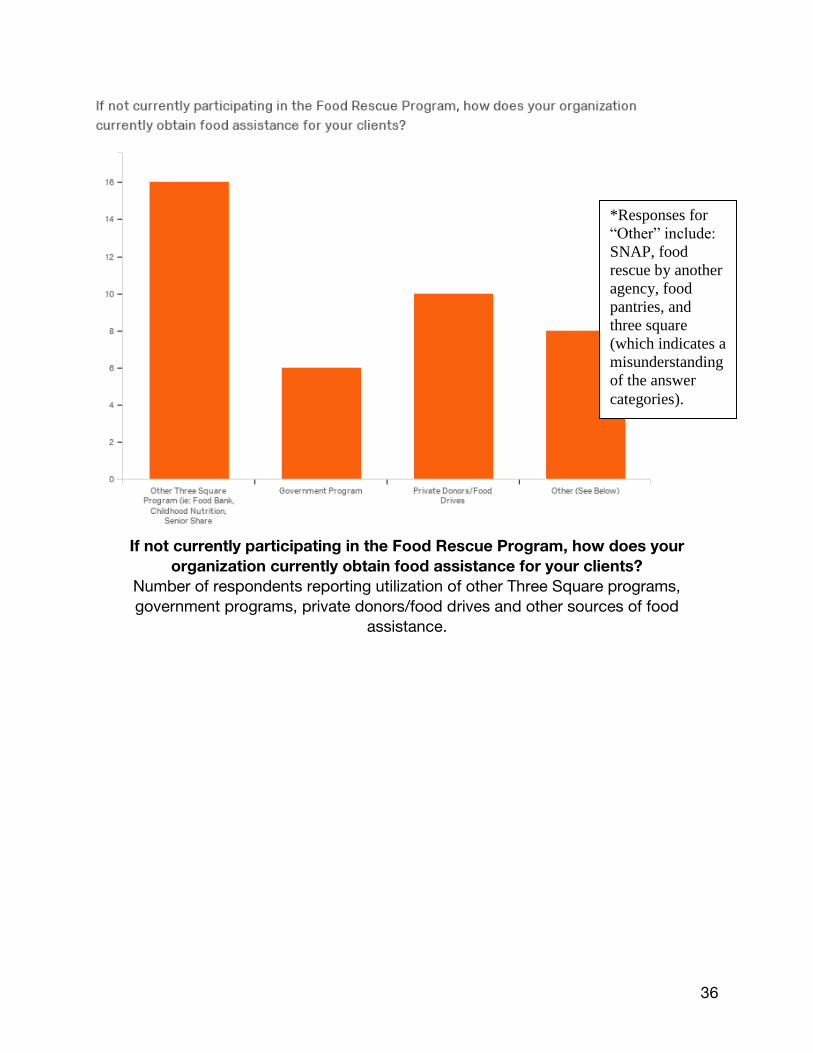
If not currently participating in the Food Rescue Program, how does your
organization currently obtain food assistance for your clients?
Number of respondents reporting utilization of other Three Square programs,
government programs, private donors/food drives and other sources of food
assistance.
*Responses for
“Other” include:
SNAP, food
rescue by another
agency, food
pantries, and
three square
(which indicates a
misunderstanding
of the answer
categories).
37
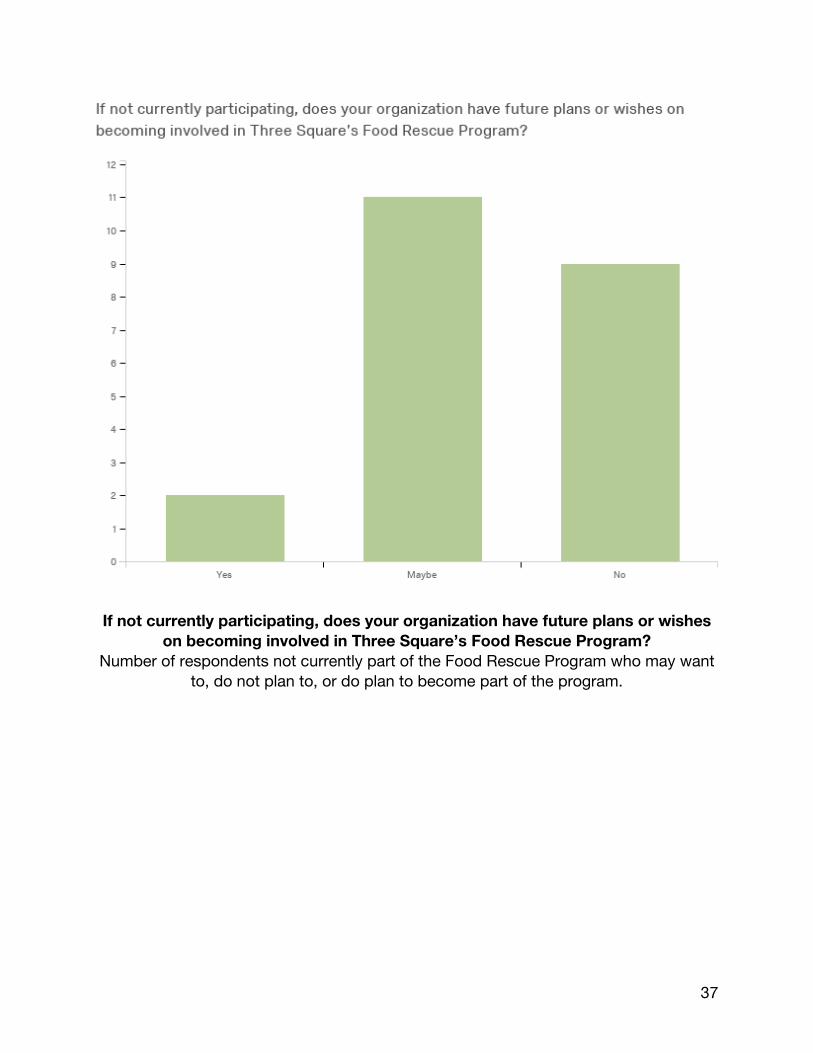
If not currently participating, does your organization have future plans or wishes
on becoming involved in Three Square’s Food Rescue Program?
Number of respondents not currently part of the Food Rescue Program who may want
to, do not plan to, or do plan to become part of the program.
38
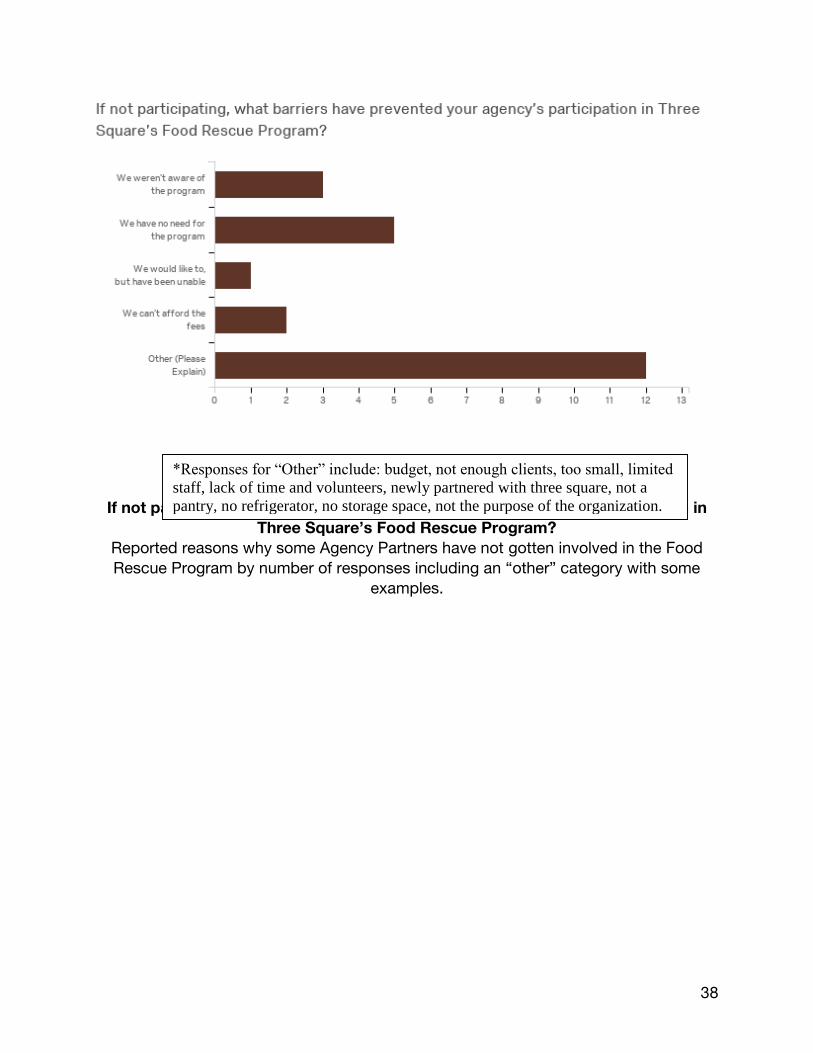
If not participating, what barriers have prevented your agency’s participation in
Three Square’s Food Rescue Program?
Reported reasons why some Agency Partners have not gotten involved in the Food
Rescue Program by number of responses including an “other” category with some
examples.
*Responses for “Other” include: budget, not enough clients, too small, limited
staff, lack of time and volunteers, newly partnered with three square, not a
pantry, no refrigerator, no storage space, not the purpose of the organization.
39
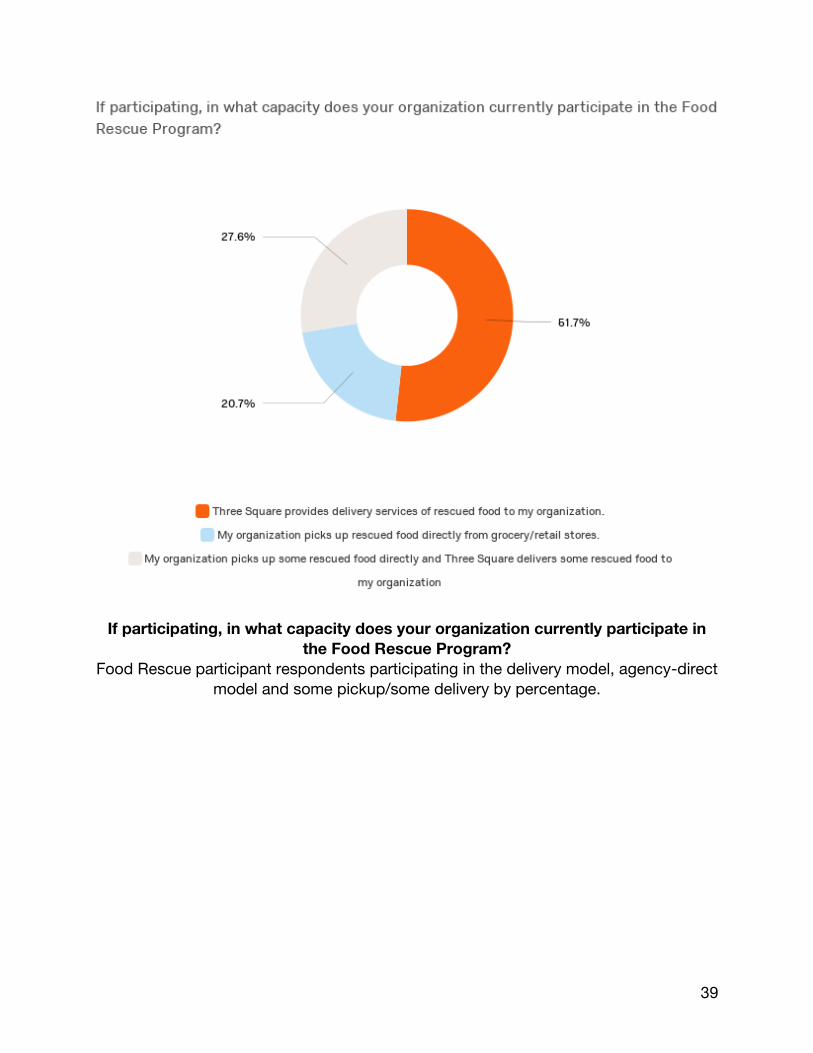
If participating, in what capacity does your organization currently participate in
the Food Rescue Program?
Food Rescue participant respondents participating in the delivery model, agency-direct
model and some pickup/some delivery by percentage.
40
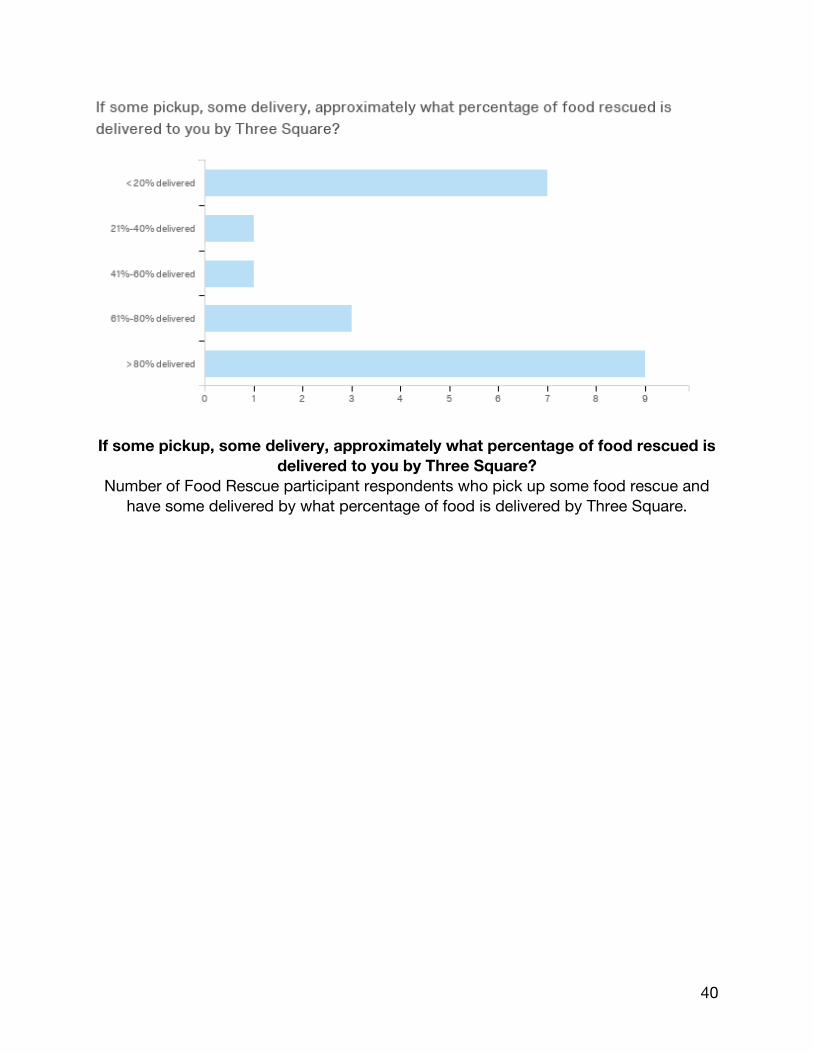
If some pickup, some delivery, approximately what percentage of food rescued is
delivered to you by Three Square?
Number of Food Rescue participant respondents who pick up some food rescue and
have some delivered by what percentage of food is delivered by Three Square.
41
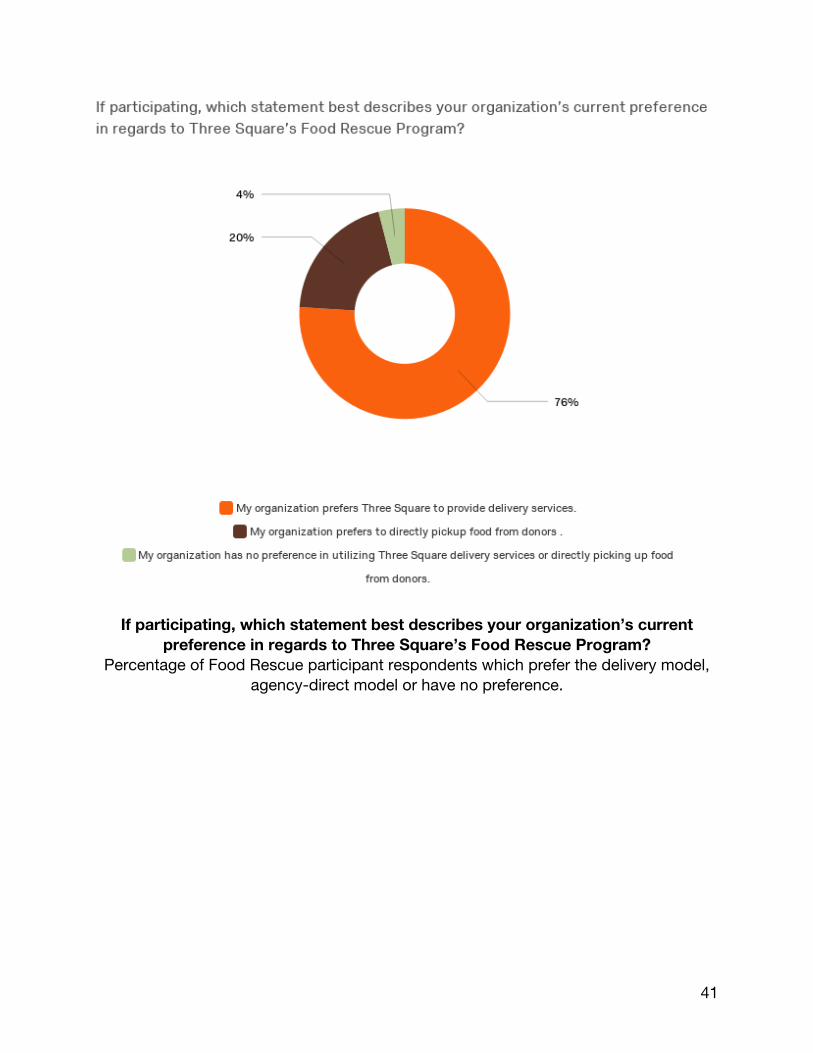
If participating, which statement best describes your organization’s current
preference in regards to Three Square’s Food Rescue Program?
Percentage of Food Rescue participant respondents which prefer the delivery model,
agency-direct model or have no preference.
42
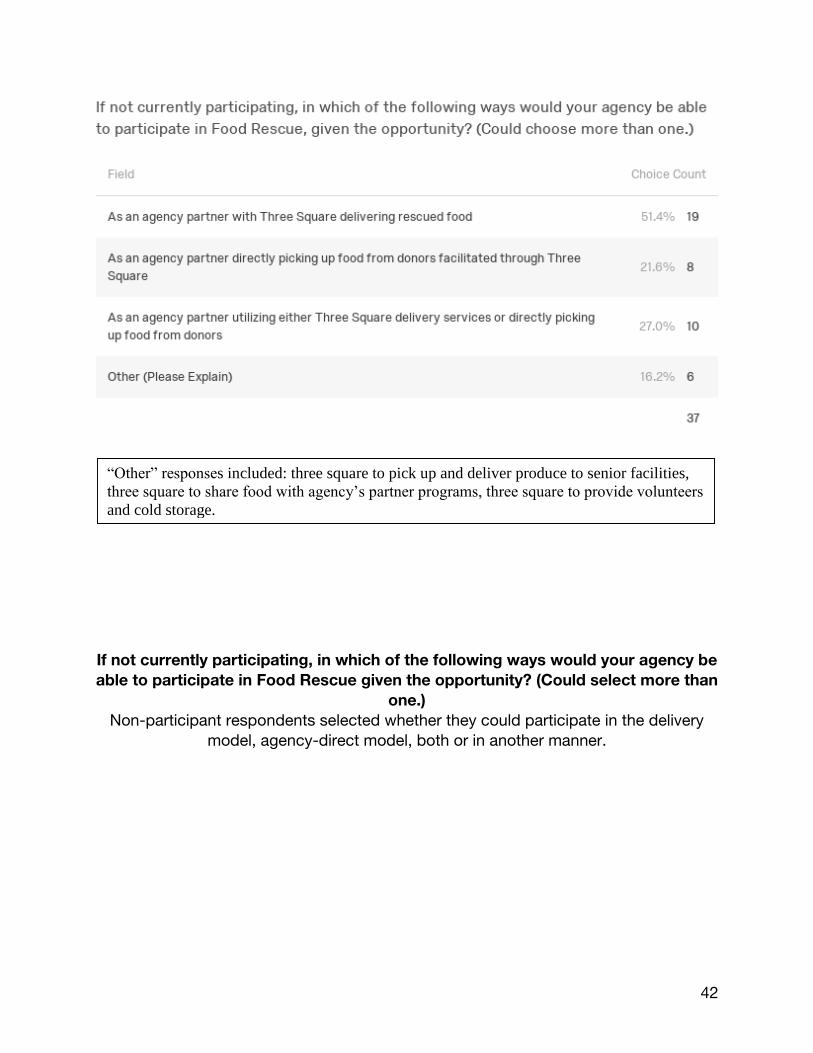
“Other” responses included: three square to pick up and deliver produce to senior facilities,
three square to share food with agency’s partner programs, three square to provide volunteers
and cold storage.
If not currently participating, in which of the following ways would your agency be
able to participate in Food Rescue given the opportunity? (Could select more than
one.)
Non-participant respondents selected whether they could participate in the delivery
model, agency-direct model, both or in another manner.
43
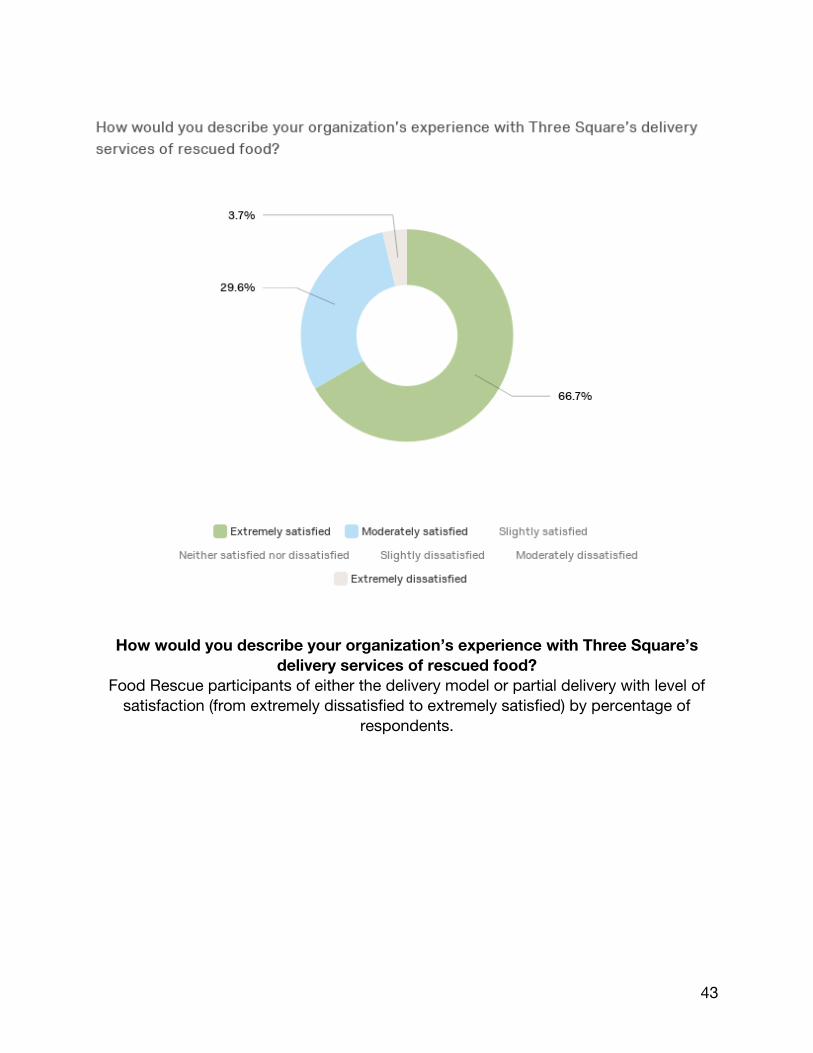
How would you describe your organization’s experience with Three Square’s
delivery services of rescued food?
Food Rescue participants of either the delivery model or partial delivery with level of
satisfaction (from extremely dissatisfied to extremely satisfied) by percentage of
respondents.
44
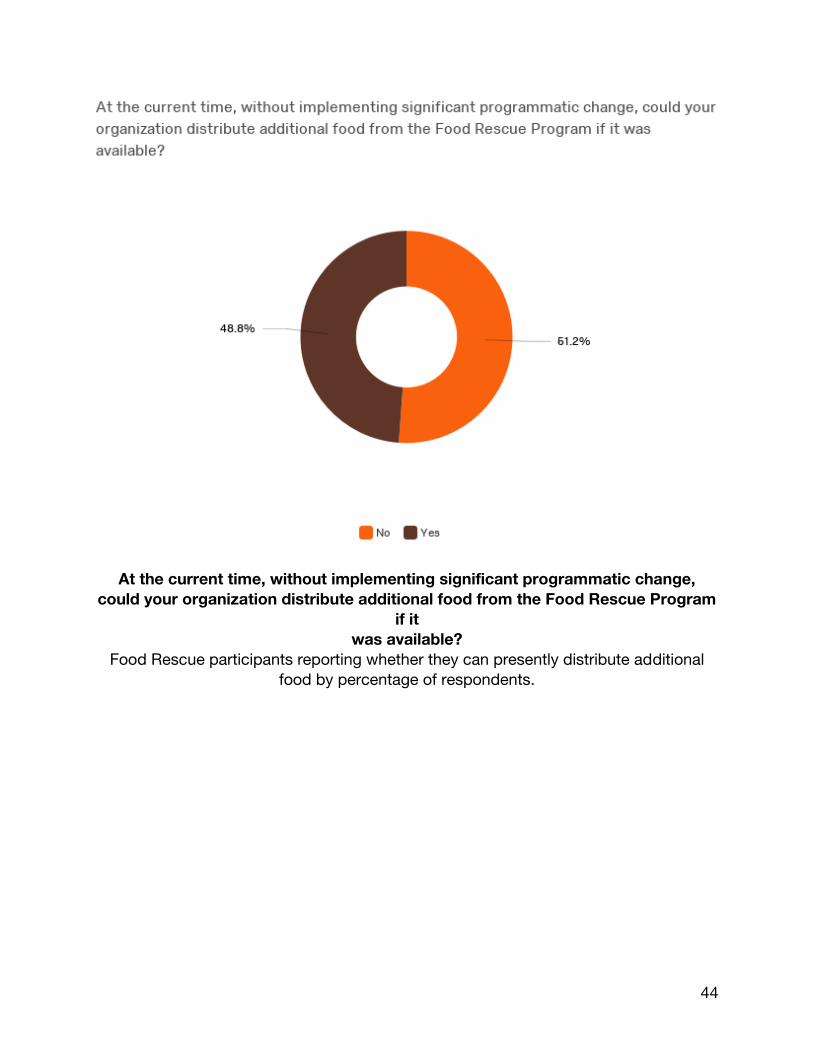
At the current time, without implementing significant programmatic change,
could your organization distribute additional food from the Food Rescue Program
if it
was available?
Food Rescue participants reporting whether they can presently distribute additional
food by percentage of respondents.
45
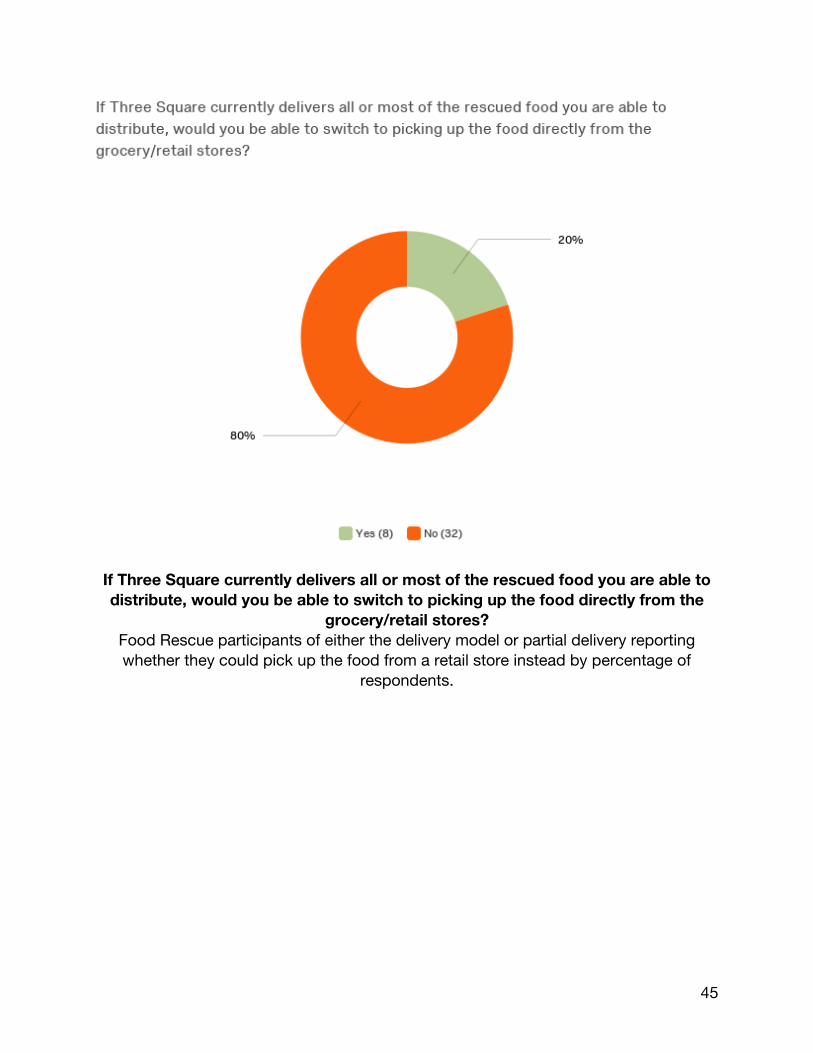
If Three Square currently delivers all or most of the rescued food you are able to
distribute, would you be able to switch to picking up the food directly from the
grocery/retail stores?
Food Rescue participants of either the delivery model or partial delivery reporting
whether they could pick up the food from a retail store instead by percentage of
respondents.
46
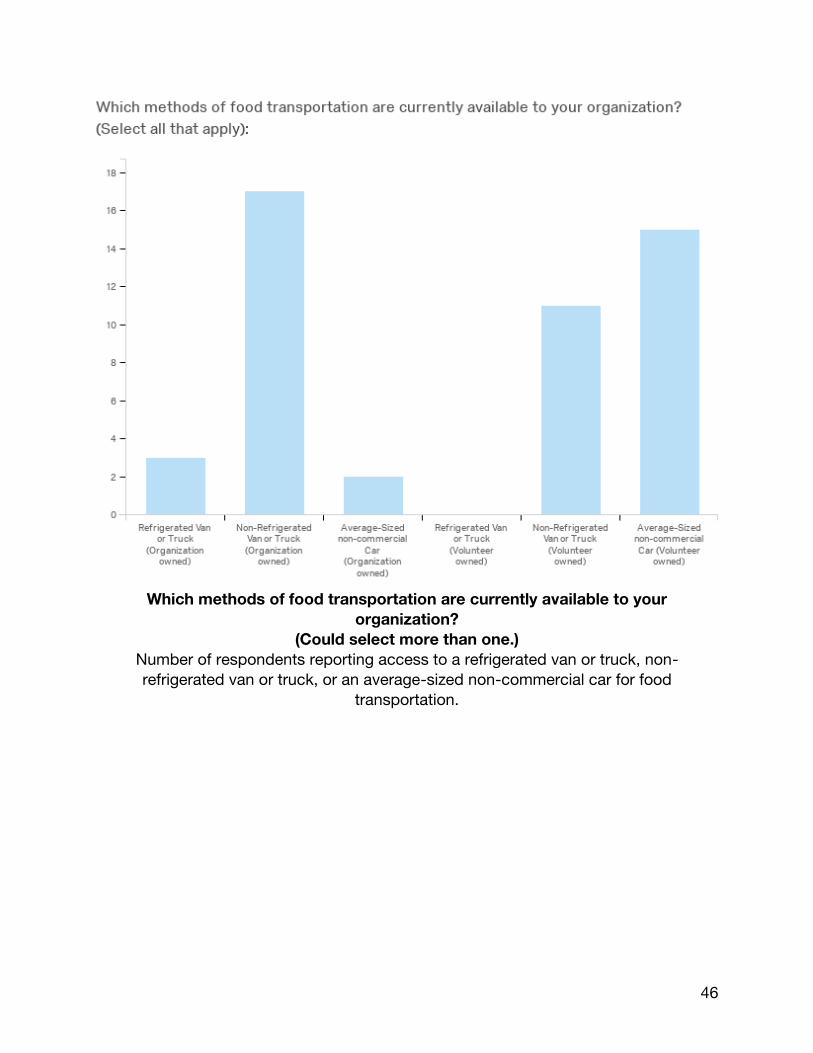
Which methods of food transportation are currently available to your
organization?
(Could select more than one.)
Number of respondents reporting access to a refrigerated van or truck, non-
refrigerated van or truck, or an average-sized non-commercial car for food
transportation.
47
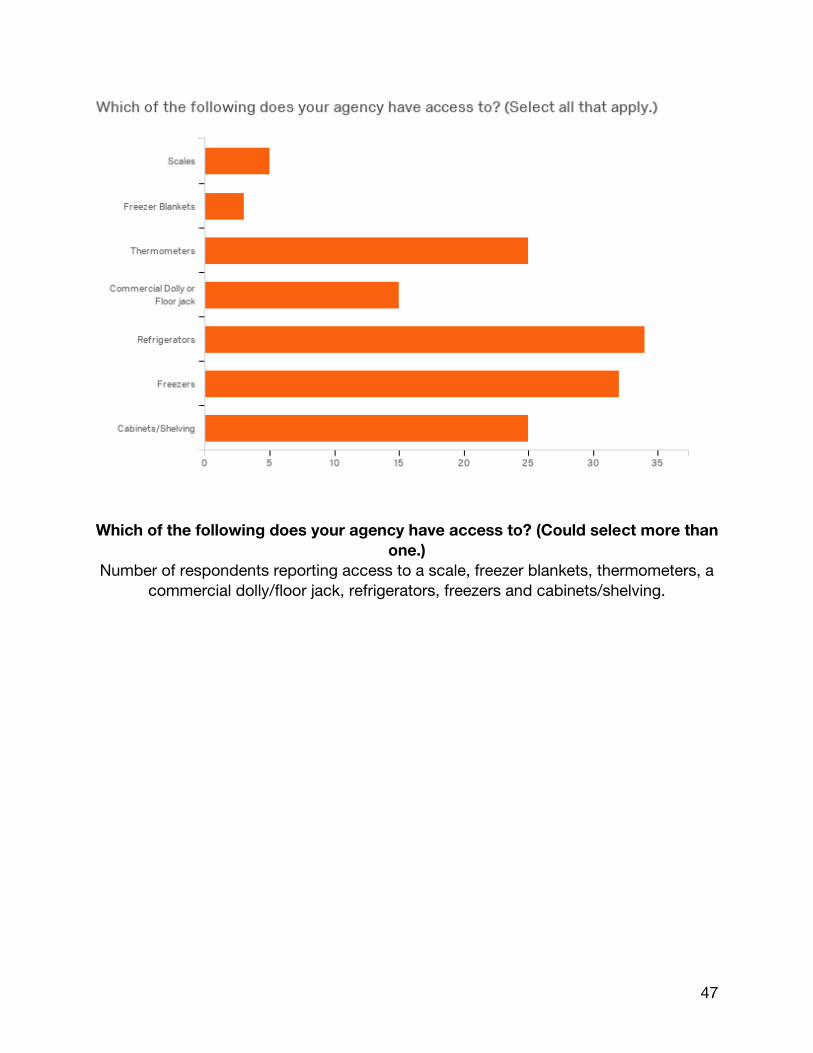
Which of the following does your agency have access to? (Could select more than
one.)
Number of respondents reporting access to a scale, freezer blankets, thermometers, a
commercial dolly/floor jack, refrigerators, freezers and cabinets/shelving.
48
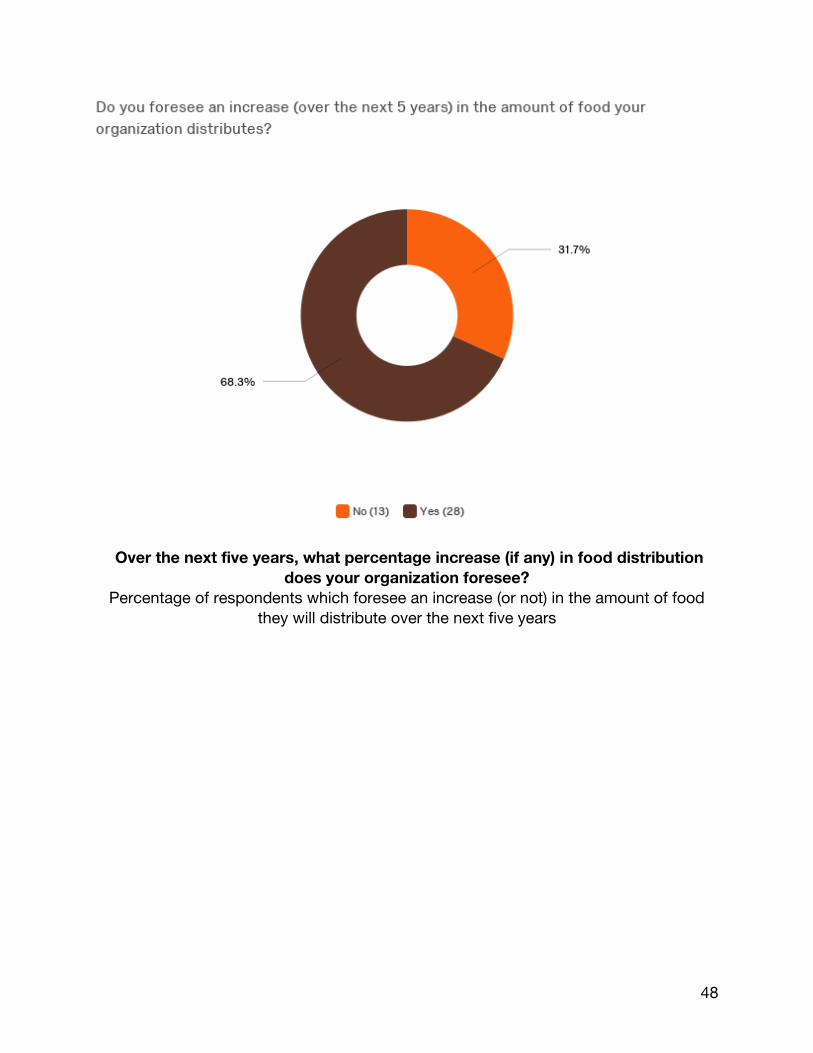
Over the next five years, what percentage increase (if any) in food distribution
does your organization foresee?
Percentage of respondents which foresee an increase (or not) in the amount of food
they will distribute over the next five years
49
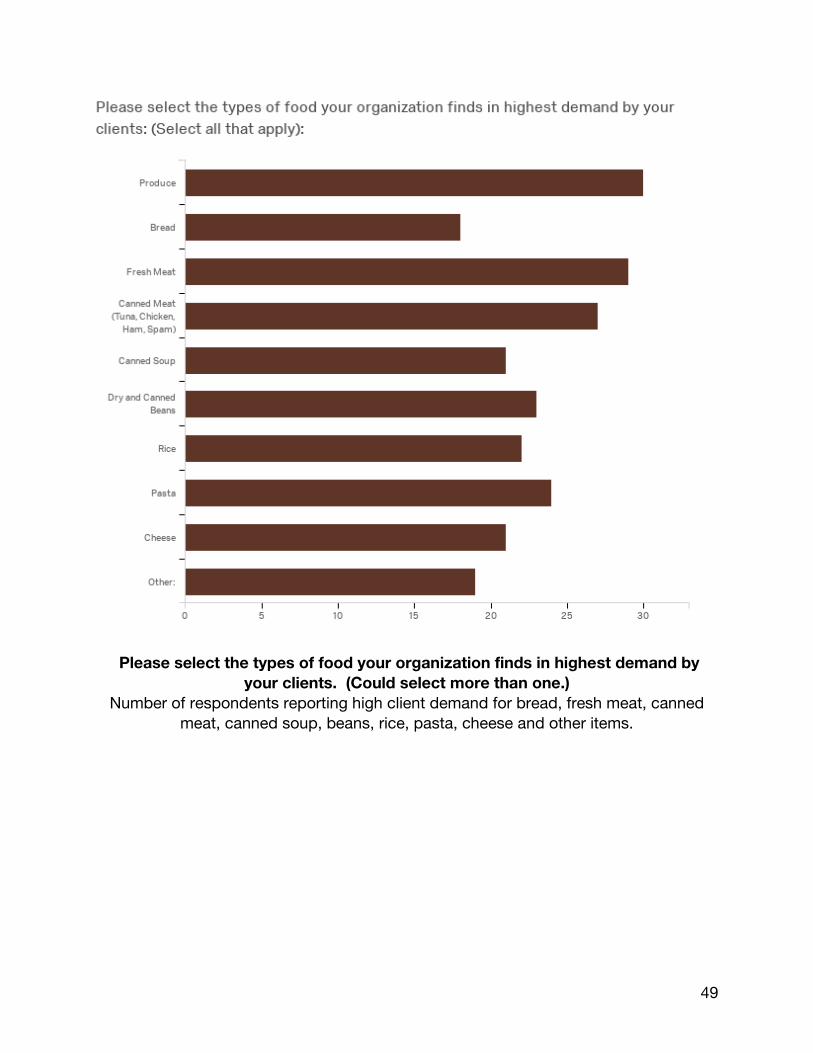
Please select the types of food your organization finds in highest demand by
your clients. (Could select more than one.)
Number of respondents reporting high client demand for bread, fresh meat, canned
meat, canned soup, beans, rice, pasta, cheese and other items.
50
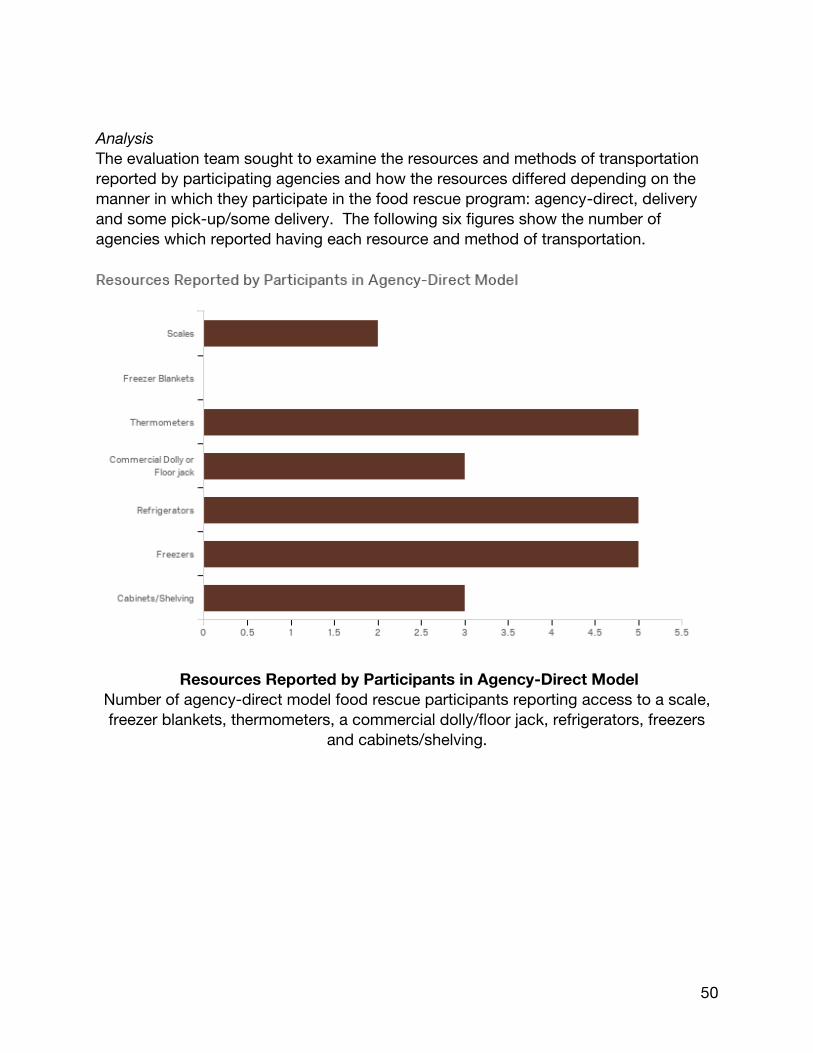
Analysis
The evaluation team sought to examine the resources and methods of transportation
reported by participating agencies and how the resources differed depending on the
manner in which they participate in the food rescue program: agency-direct, delivery
and some pick-up/some delivery. The following six figures show the number of
agencies which reported having each resource and method of transportation.
Resources Reported by Participants in Agency-Direct Model
Number of agency-direct model food rescue participants reporting access to a scale,
freezer blankets, thermometers, a commercial dolly/floor jack, refrigerators, freezers
and cabinets/shelving.
51
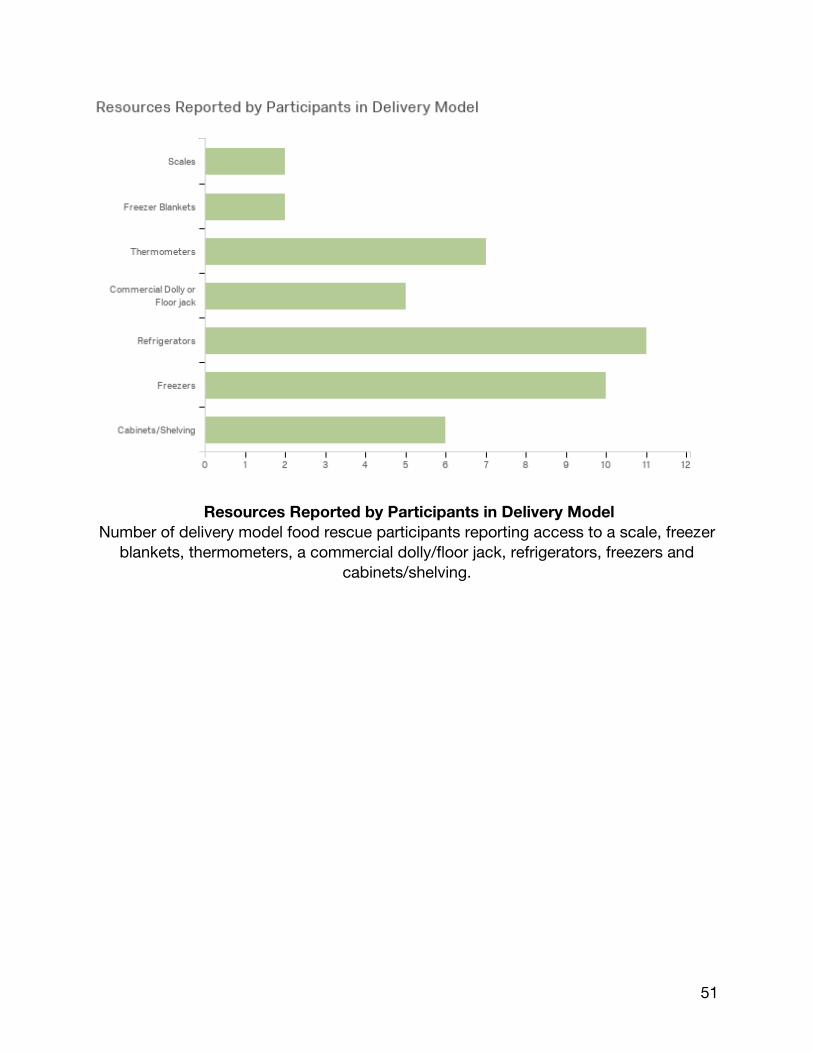
Resources Reported by Participants in Delivery Model
Number of delivery model food rescue participants reporting access to a scale, freezer
blankets, thermometers, a commercial dolly/floor jack, refrigerators, freezers and
cabinets/shelving.
52
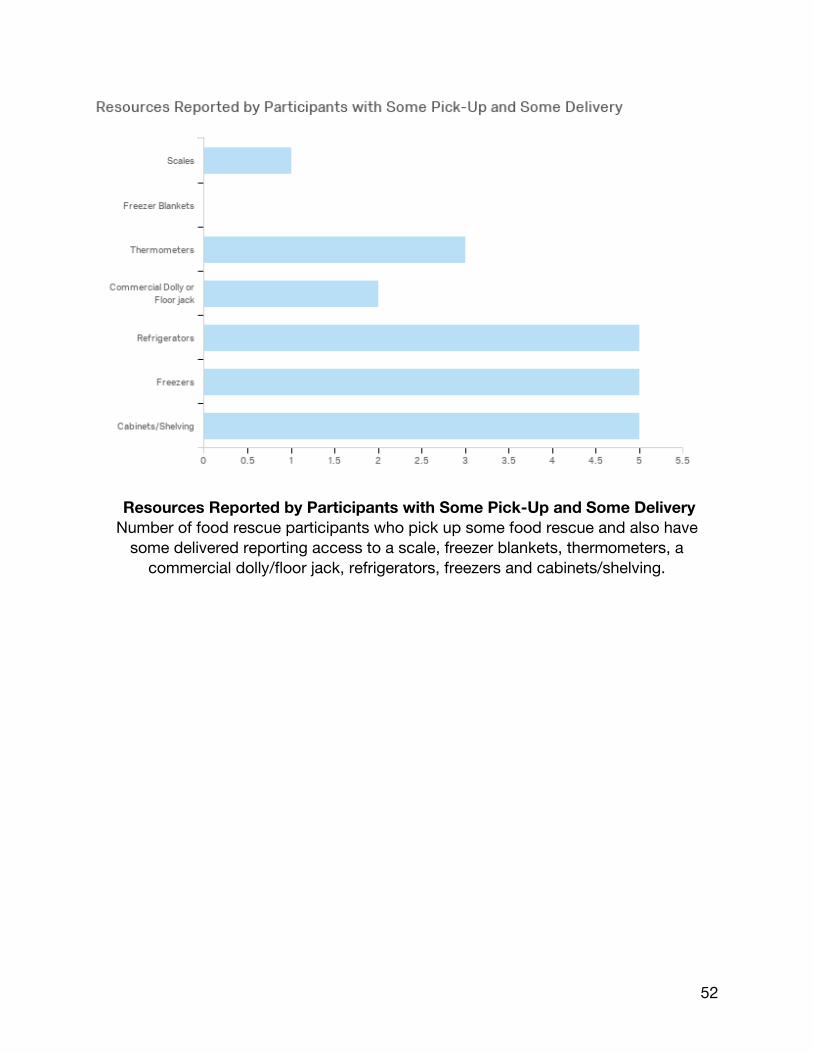
Resources Reported by Participants with Some Pick-Up and Some Delivery
Number of food rescue participants who pick up some food rescue and also have
some delivered reporting access to a scale, freezer blankets, thermometers, a
commercial dolly/floor jack, refrigerators, freezers and cabinets/shelving.
53
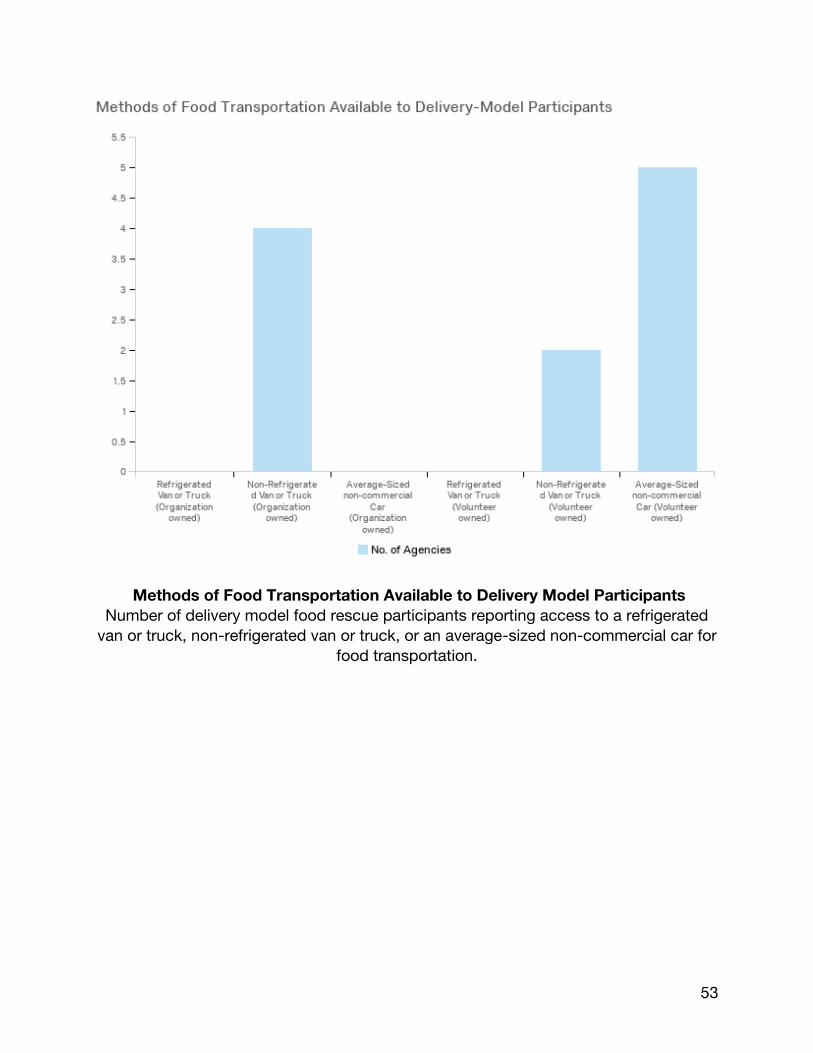
Methods of Food Transportation Available to Delivery Model Participants
Number of delivery model food rescue participants reporting access to a refrigerated
van or truck, non-refrigerated van or truck, or an average-sized non-commercial car for
food transportation.
54
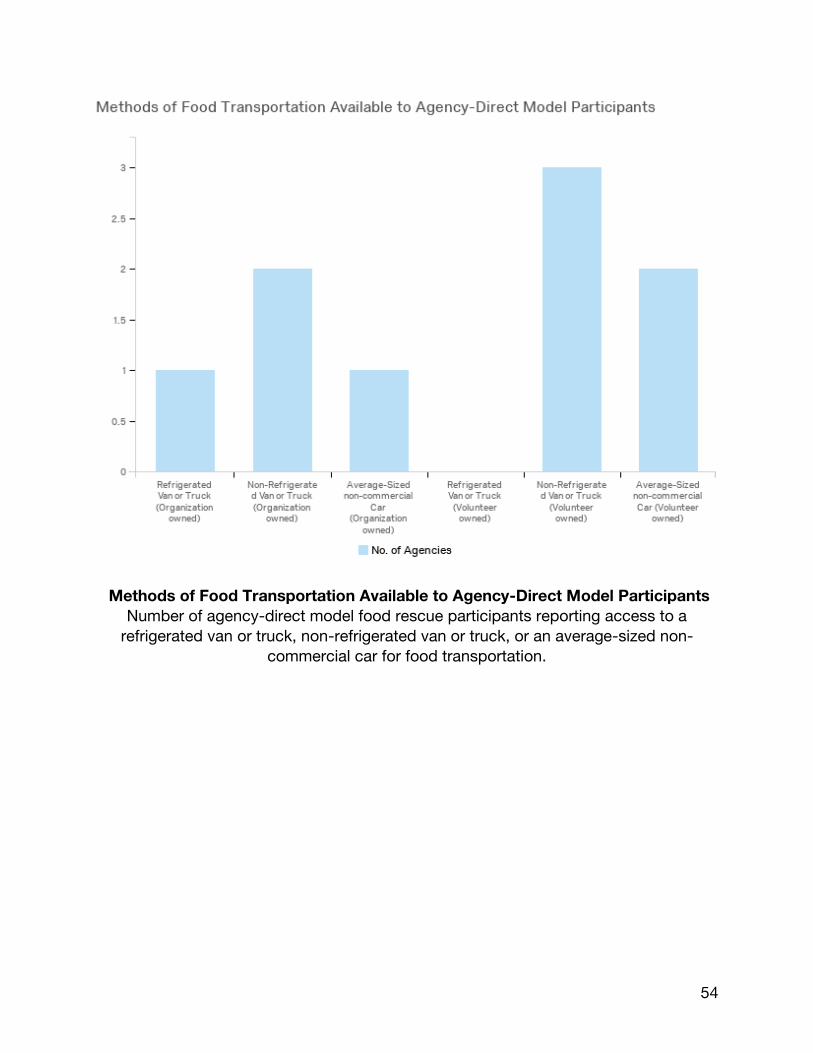
Methods of Food Transportation Available to Agency-Direct Model Participants
Number of agency-direct model food rescue participants reporting access to a
refrigerated van or truck, non-refrigerated van or truck, or an average-sized non-
commercial car for food transportation.
55
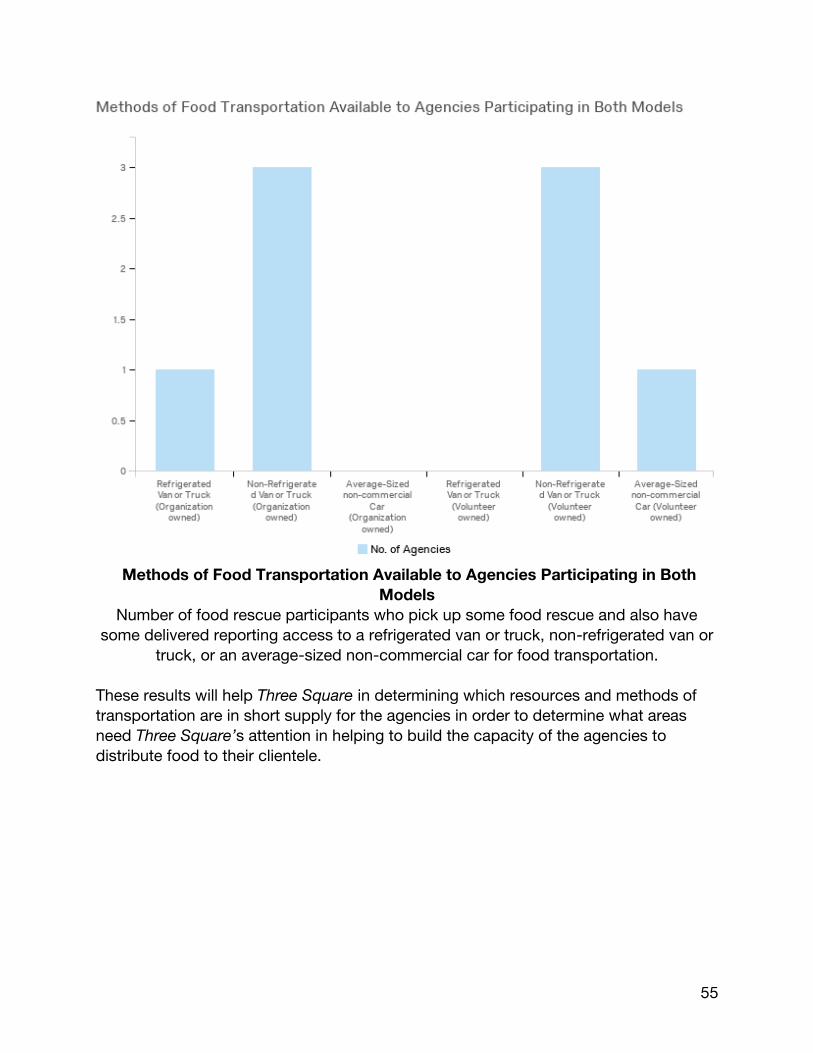
Methods of Food Transportation Available to Agencies Participating in Both
Models
Number of food rescue participants who pick up some food rescue and also have
some delivered reporting access to a refrigerated van or truck, non-refrigerated van or
truck, or an average-sized non-commercial car for food transportation.
These results will help Three Square in determining which resources and methods of
transportation are in short supply for the agencies in order to determine what areas
need Three Square’s attention in helping to build the capacity of the agencies to
distribute food to their clientele.
56
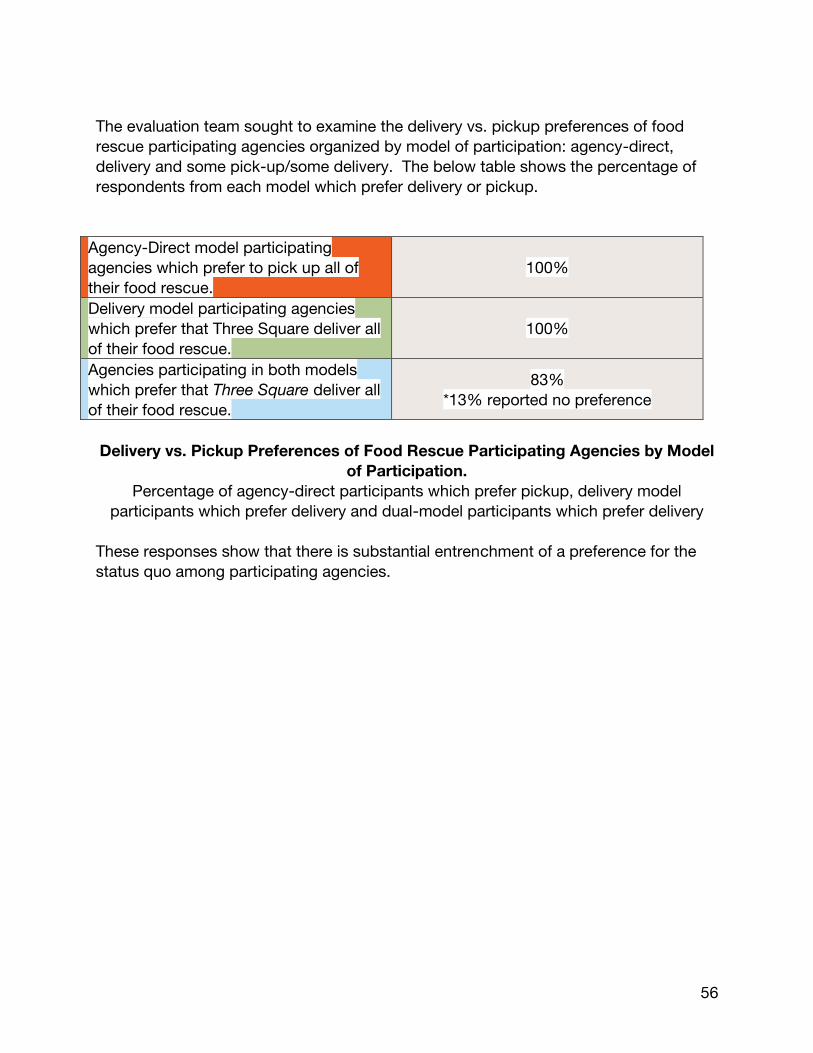
The evaluation team sought to examine the delivery vs. pickup preferences of food
rescue participating agencies organized by model of participation: agency-direct,
delivery and some pick-up/some delivery. The below table shows the percentage of
respondents from each model which prefer delivery or pickup.
Agency-Direct model participating
agencies which prefer to pick up all of
their food rescue.
100%
Delivery model participating agencies
which prefer that Three Square deliver all
of their food rescue.
100%
Agencies participating in both models
which prefer that Three Square deliver all
of their food rescue.
83%
*13% reported no preference
Delivery vs. Pickup Preferences of Food Rescue Participating Agencies by Model
of Participation.
Percentage of agency-direct participants which prefer pickup, delivery model
participants which prefer delivery and dual-model participants which prefer delivery
These responses show that there is substantial entrenchment of a preference for the
status quo among participating agencies.
57
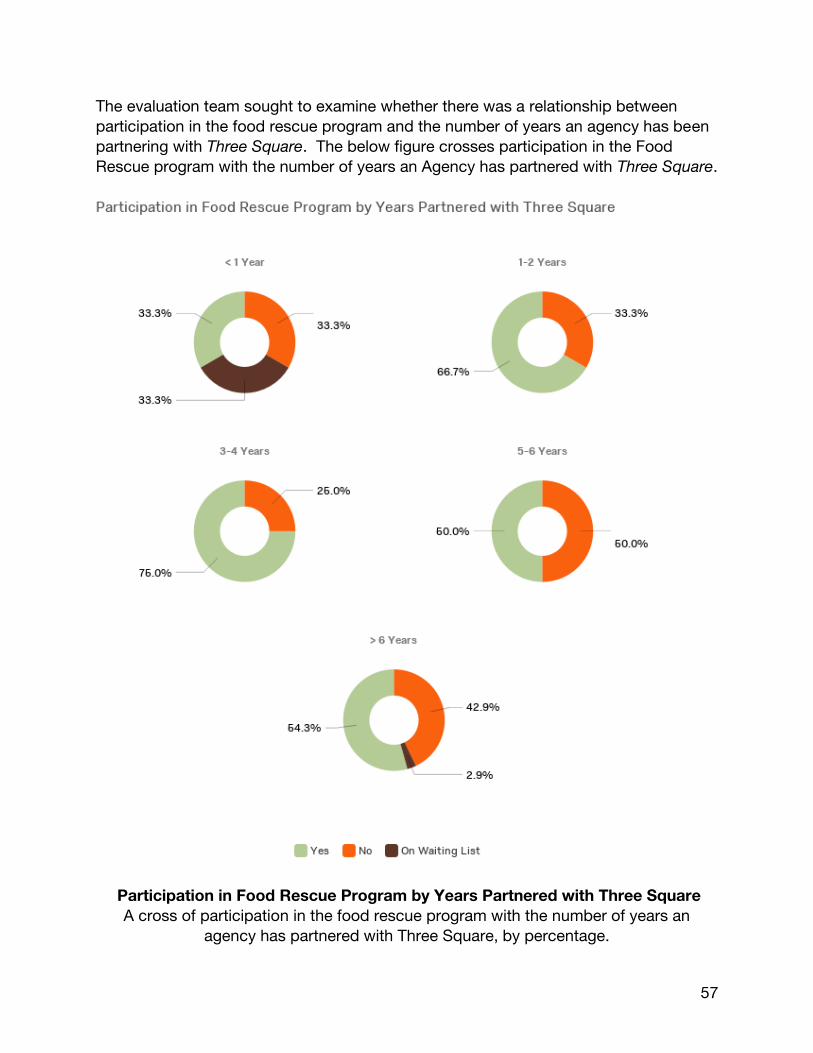
The evaluation team sought to examine whether there was a relationship between
participation in the food rescue program and the number of years an agency has been
partnering with Three Square. The below figure crosses participation in the Food
Rescue program with the number of years an Agency has partnered with Three Square.
Participation in Food Rescue Program by Years Partnered with Three Square
A cross of participation in the food rescue program with the number of years an
agency has partnered with Three Square, by percentage.
58
These results show that about a third of the newest partner agencies are participants
of food rescue, with a jump up of about two-thirds to three-quarters for the 1-year to 4-
year range, then settling back down to about half among the respondents who have
partnered with Three Square the longest. These results are significant for Three
Square since they can assist in determining where to focus relationship building and
management as well as promotion of the program itself.
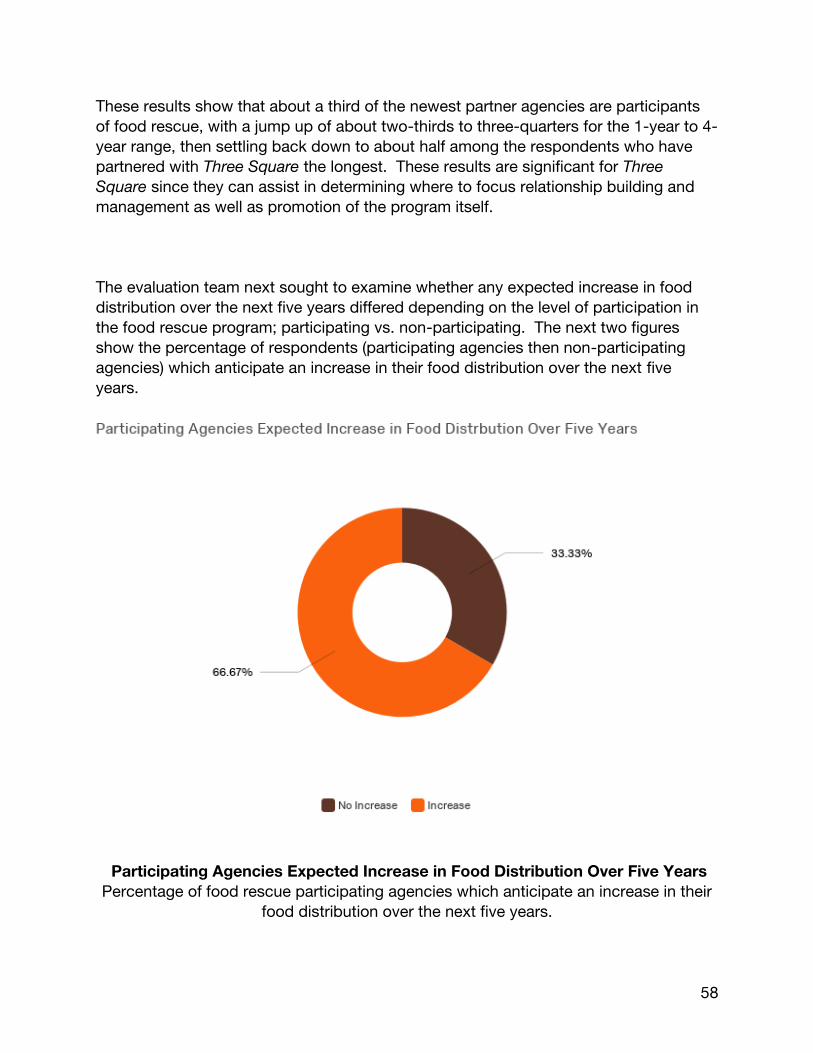
The evaluation team next sought to examine whether any expected increase in food
distribution over the next five years differed depending on the level of participation in
the food rescue program; participating vs. non-participating. The next two figures
show the percentage of respondents (participating agencies then non-participating
agencies) which anticipate an increase in their food distribution over the next five
years.
Participating Agencies Expected Increase in Food Distribution Over Five Years
Percentage of food rescue participating agencies which anticipate an increase in their
food distribution over the next five years.
59
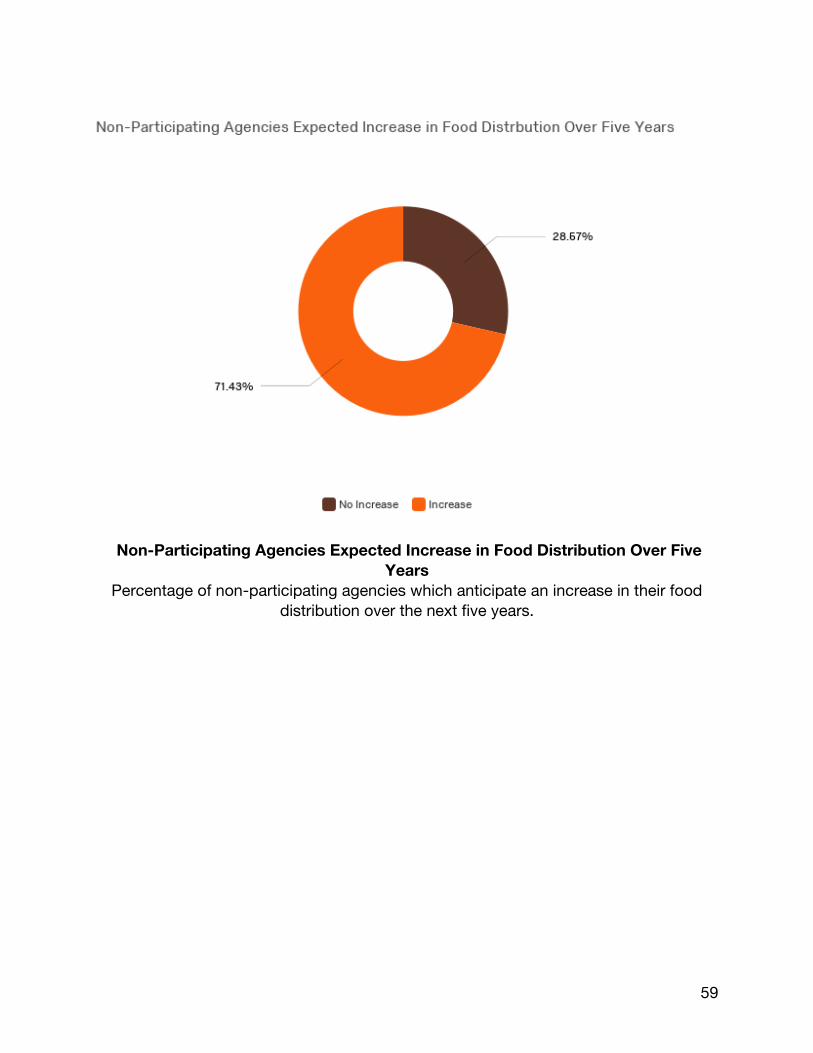
Non-Participating Agencies Expected Increase in Food Distribution Over Five
Years
Percentage of non-participating agencies which anticipate an increase in their food
distribution over the next five years.
60
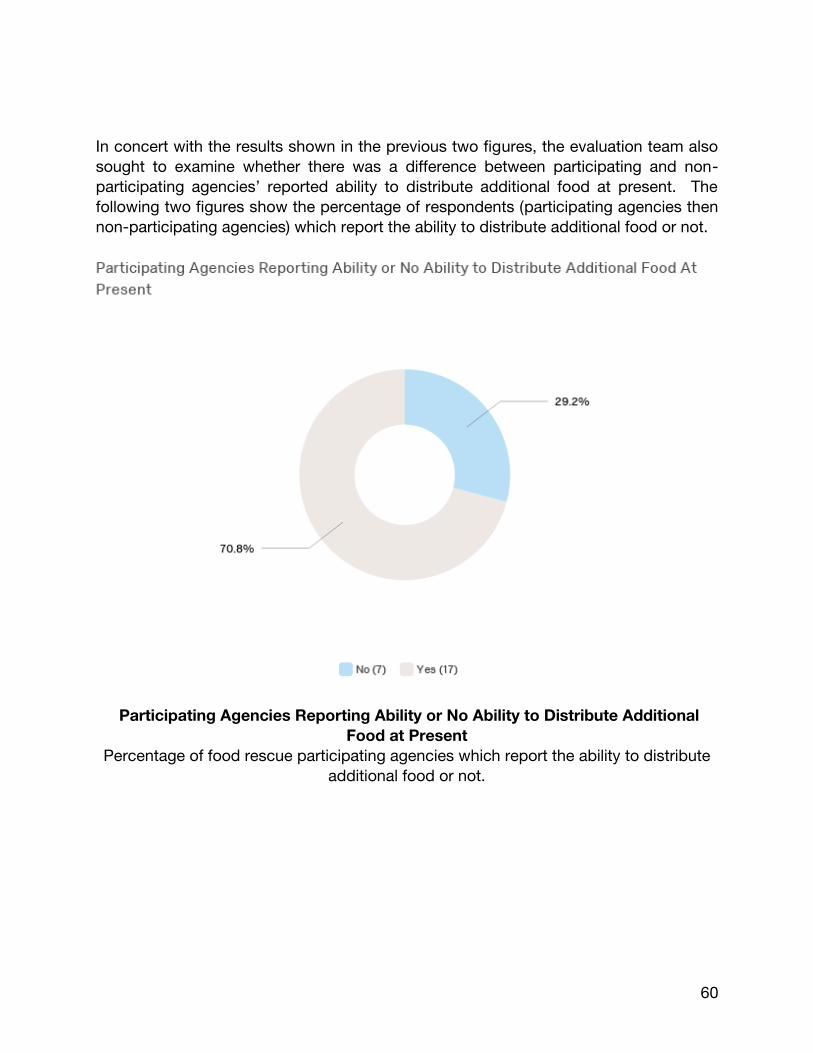
In concert with the results shown in the previous two figures, the evaluation team also
sought to examine whether there was a difference between participating and non-
participating agencies’ reported ability to distribute additional food at present. The
following two figures show the percentage of respondents (participating agencies then
non-participating agencies) which report the ability to distribute additional food or not.
Participating Agencies Reporting Ability or No Ability to Distribute Additional
Food at Present
Percentage of food rescue participating agencies which report the ability to distribute
additional food or not.
61
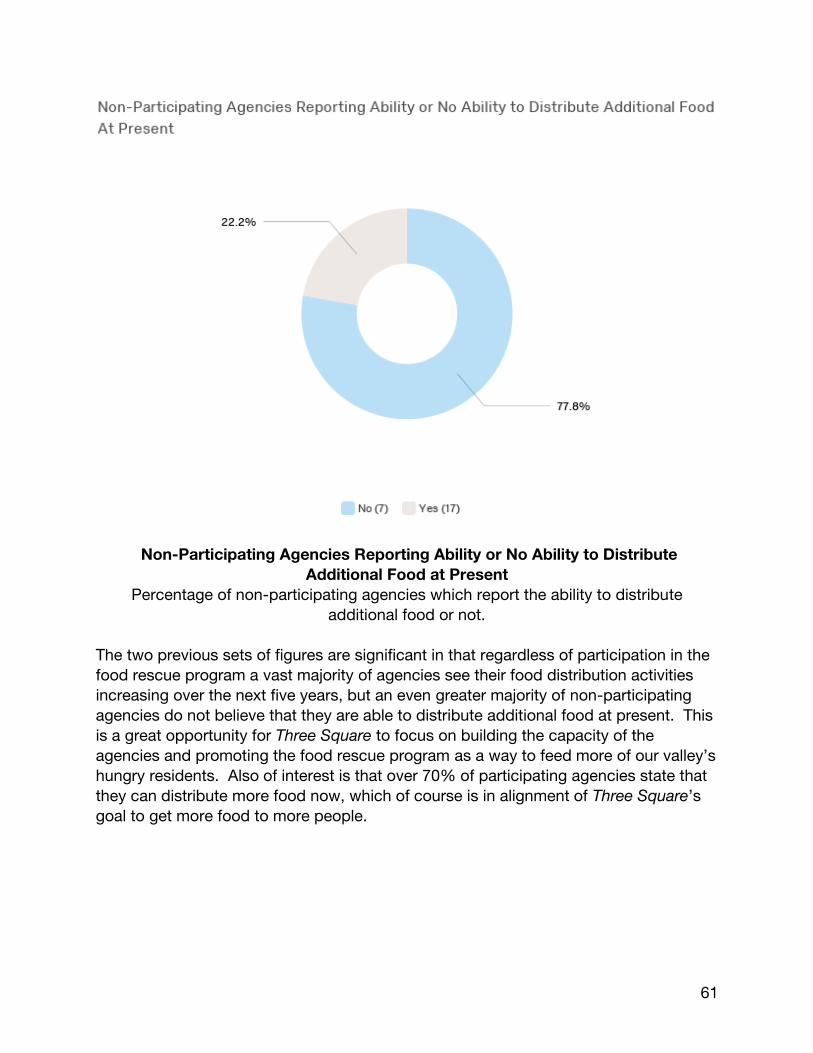
Non-Participating Agencies Reporting Ability or No Ability to Distribute
Additional Food at Present
Percentage of non-participating agencies which report the ability to distribute
additional food or not.
The two previous sets of figures are significant in that regardless of participation in the
food rescue program a vast majority of agencies see their food distribution activities
increasing over the next five years, but an even greater majority of non-participating
agencies do not believe that they are able to distribute additional food at present. This
is a great opportunity for Three Square to focus on building the capacity of the
agencies and promoting the food rescue program as a way to feed more of our valley’s
hungry residents. Also of interest is that over 70% of participating agencies state that
they can distribute more food now, which of course is in alignment of Three Square’s
goal to get more food to more people.
62
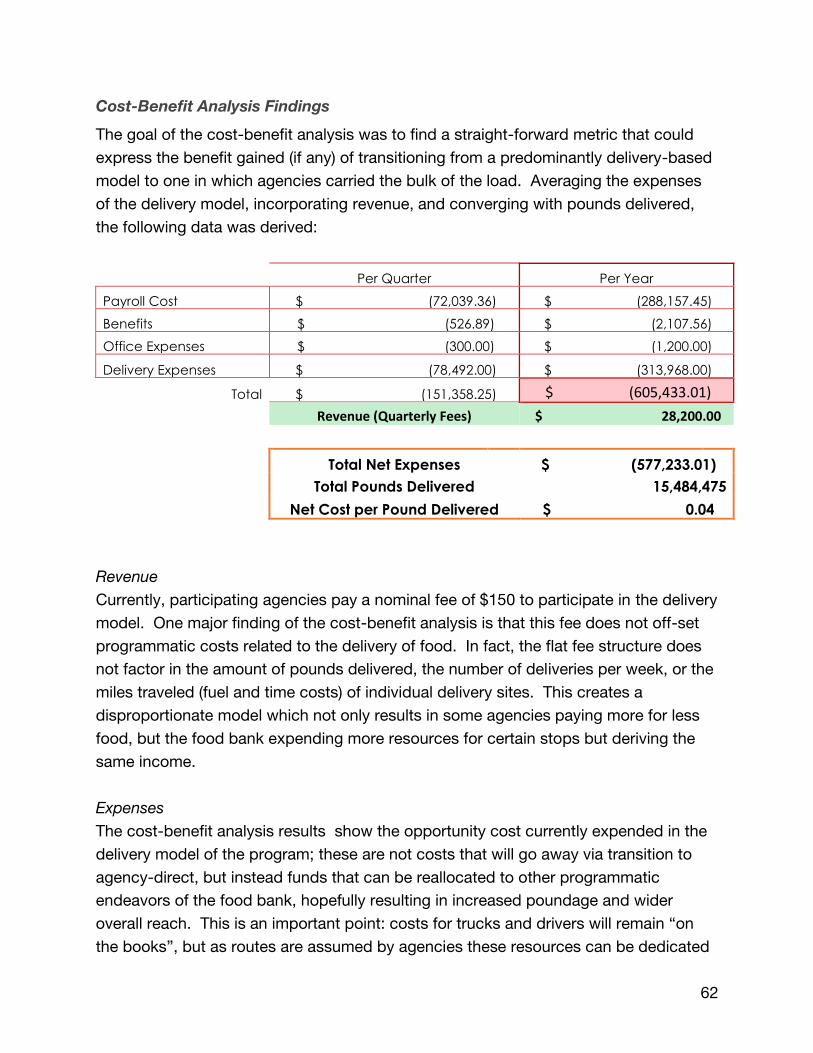
Cost-Benefit Analysis Findings
The goal of the cost-benefit analysis was to find a straight-forward metric that could
express the benefit gained (if any) of transitioning from a predominantly delivery-based
model to one in which agencies carried the bulk of the load. Averaging the expenses
of the delivery model, incorporating revenue, and converging with pounds delivered,
the following data was derived:
Per Quarter Per Year
Payroll Cost $ (72,039.36) $ (288,157.45)
Benefits $ (526.89) $ (2,107.56)
Office Expenses $ (300.00) $ (1,200.00)
Delivery Expenses $ (78,492.00) $ (313,968.00)
Total $ (151,358.25) $ (605,433.01)
Revenue (Quarterly Fees) $ 28,200.00
Total Net Expenses $ (577,233.01)
Total Pounds Delivered 15,484,475
Net Cost per Pound Delivered $ 0.04
Revenue
Currently, participating agencies pay a nominal fee of $150 to participate in the delivery
model. One major finding of the cost-benefit analysis is that this fee does not off-set
programmatic costs related to the delivery of food. In fact, the flat fee structure does
not factor in the amount of pounds delivered, the number of deliveries per week, or the
miles traveled (fuel and time costs) of individual delivery sites. This creates a
disproportionate model which not only results in some agencies paying more for less
food, but the food bank expending more resources for certain stops but deriving the
same income.
Expenses
The cost-benefit analysis results show the opportunity cost currently expended in the
delivery model of the program; these are not costs that will go away via transition to
agency-direct, but instead funds that can be reallocated to other programmatic
endeavors of the food bank, hopefully resulting in increased poundage and wider
overall reach. This is an important point: costs for trucks and drivers will remain “on
the books”, but as routes are assumed by agencies these resources can be dedicated
63
to other organizational goals. So while it is not appropriate to talk about savings in the
traditional sense, dollars that are re-allocated to the program, especially if rescue
poundage can sustain at current levels if agencies are performing the pickups.
Cost Reallocation
Calculations show that during the identified period (May 2015-May 2016), the average
cost to deliver one pound of food was roughly $0.04. This data point serves as
underlying support for the majority of the recommendations that follow.
Merging the Results Following the data collection and individual analysis in each respective methodology,
merging the results provides the ability to begin to synthesize the quantitative and
qualitative data stands. Utilizing the qualitative methodologies of the SWOT analysis
and benchmark study to extrapolate strategic issues, the qualitative data was reviewed
to further validate the ongoing concerns surrounding the processes of the program. In
merging the analyses found with each methodology, the evaluation team informally
began matching individual findings, prioritizing the issues thought to be of greatest risk
and reward to the long-term performance of the program. Utilizing the program theory
to review the relationships between inputs, activities, outputs, and outcomes,
synthesizing the quantitative and qualitative strands followed by further analysis allows
for the forming of recommendations to address ongoing programmatic concerns and
issues.
64
Final Recommendations While an analysis of the individual methodologies provides important value, as the
chosen methodologies produced a diverse set of perceptions, comparing the resulting
concerns with available resources allowed for the creation of recommendations
intended to solve critical issues facing the agency-direct model of the Food Rescue
Program. Collectively, the recommendations are intended to provide a guide for
program managers in overcoming current obstacles facing the Food Rescue Program
and organization. Framed with short-term, medium term, and long-term timeframes,
the recommendations are based on addressing current issues, while providing
initiatives to increase program performance. The recommendations include:
Short-term Recommendations
● Increased Promotion of Food Rescue Program
● Development of Training and Onboarding Curriculum
● Building of Agency Capacity
● Increased Focus on Relationship Management
Medium-term Recommendations
● Dedicated Food Rescue Manager
● Transition Away From Quarterly Fee Structure
Long-term Recommendations
● Development of Mobile-Accessible Software
Short-term Recommendations
An evaluation of the current characteristics of the Food Rescue Program found several
areas in which improvements may address current performance concerns and issues
within the program. The short-term recommendations are defined as solutions to
address short-term issues within the upcoming 18 months. The recommendations
focus on current program objectives and establish the foundation for longer-term
solutions. They include the following:
Increased Promotion of Food Rescue Program
Results from the agency survey indicate that there is substantial entrenchment of
preferences for the status quo within the Food Rescue Program, with 100% of single-
model participant respondents indicating a preference for the model in which they
65
currently participate. With the cost-benefit analysis showing a significantly greater
need for resources in the delivery model, increased promotion toward employing a
majority agency-direct model in Food Rescue Program operations provides leverage
toward a successful transition. As the SWOT analysis reveals the opportunity for
external partnerships, a focused marketing campaign targeted at agencies and
potential external partners is advisable during the initial stages of transition. The
desired effect of the marketing campaign is to utilize Three Square’s brand recognition
toward three-way partnerships to increase acceptance of the of the agency-direct
model and garner excitement from organizations traditionally unable to participate in
the food rescue program, such as commercial transportation businesses. Possible
strategies include:
● Press release focusing on the program, its origins, and current donors
● A local media feature (interview, on-location, etc.) featuring new exciting
partnerships and program highlights
● An increased, easily accessible web presence for the program, including:
○ Consideration of a dedicated Food Rescue webpage
○ A feature slide on the website homepage directing visitors to program
information
○ Updating the PDF program overview currently linked at:
https://www.threesquare.org/programs/food-bank-distribution
● Program spotlight via social media, targeting non-participating agencies with
new partnership opportunities
● Emphasis on Food Rescue Program during tours and volunteer events, as well
as official Three Square meetings and agency gatherings
These strategies will help create marketing ‘buzz’ for the program both internally and in
the community at-large. The hope is that resulting synergies culminate in additional
publicity, increasing the number of participating agencies, donors, and new external
partnerships.
Development of Training and Onboarding Curriculum
Data from benchmark food banks indicates that a formalized training and onboarding
curriculum is an essential element of a successful food rescue program, as evidenced
in the responses related to sharing best practices. As participating agencies in the
agency-direct model are seen as having inconsistency in relationship building skills,
increased training and onboarding curriculum has the ability to determine areas of
66
need and build organizational skills across the Food Rescue Program. Requiring
agencies to undergo formal training curriculum serves to provide essential information
(food safety, reporting requirements, operating procedure, rapport and relationship
skills), while reinforcing the legitimacy and importance of the program. Demonstrating
to participating agencies that Three Square has invested the time, not only in
developing policies and procedures, but also in creating a meaningful curriculum leads
to increased levels of commitment and abilities in participating agencies. The
training/onboarding curriculum should include the following:
● Partnership with agency relations staff. Multiple fully transitioned food banks
within the benchmark study indicate that involving staff members from their
agency relations department was a strength of their Food Rescue Program. As
the SWOT analysis show consistency in relationship building as a weakness,
establishing that partnership at the very beginning of the process will help foster
success and ensure that the content of the training appeals to agencies in a
format that will be effective.
● Focus on food safety. Communicating food safety guidelines is vital for the
transition to be successful, as food safety concerns are identified as both a
internal weakness and an external threat to programmatic success in the
benchmark data. In the agency-direct model, the risks and responsibilities
related to food safety remain constant with Three Square, but the level of direct
control by the organization decreases dramatically. Training should reinforce
important food safety policies and test retention through feedback mechanisms
(testing, etc.). Possible third party solutions include completion of ServSafe or
similar certification, with possible support provided by Three Square.
● Clearly articulated reporting standards. One of the biggest program weaknesses
evidenced in the benchmarking data is the failure of agencies to report data
accurately and timely. Given the importance of poundage to the overall Feeding
America network model, reporting requirements should be stressed during
training. This includes a hands-on walkthrough of reporting procedures and
clear communication of any punitive measures for failure to provide accurate
and timely reports.
● Program MOU/Waiver. Accountability is also an important aspect of the desired
model, and an MOU outlining expectations, policies, and procedures will ensure
that roles and responsibilities are clear from the beginning.
● Programmatic resource guide. Onboarding should also include a take-away
resource that agencies use and reference while participating in the Food Rescue
67
Program. A good resource will encompass all of the above aspects of training in
specific, step-by-step detail with cutout pages for agency use. An example of
such a guide from Feeding America San Diego is included in Appendix H.
Building Agency Capacity
Equipment resources were commonly referenced within the SWOT analysis,
benchmark study, and agency survey. A lack of necessary equipment in participating
agencies is seen as an external threat within the agency-direct model SWOT analysis,
similarly positioned food banks also referenced participating agencies’ lack of certain
types of equipment. With nearly 78% of responding non-participating agencies
reporting an inability to distribute additional food rescue poundage, the availability of
equipment resources in participating agencies is seen as limited. As Three Square
seeks to move toward an agency-direct model of food rescue in which specific types
of equipment seen as vital in food rescue operations, building agency capacity in
participating agencies is recommended to ensure a safe transition. The
recommendations include:
● Asset grants. Utilizing benchmark data regarding the type of equipment needed
by agencies, survey participants were asked about their access to seven types
of equipment. Results from the agency survey indicate many respondents lack
access to four distinct types equipment seen as necessary to ensure the ability
to rescue food safely. To address this need, creation of asset grants, either
internally provided by Three Square or externally through partnerships with an
outside organization(s), is recommended for the following items:
● Scales
● Freezer Blankets
● Dollies
● Thermometers
● Encouraging shared resources and partnerships. As participating agencies in
the agency-direct model face new logistical challenges, the possibility of shared
resources and partnerships offer significant benefit to agencies. As referenced
in the SWOT analysis, external partnerships between organization and agencies
for transportation, as well as inter-agency relationships, may allow for increased
collaboration and synergy. This includes sharing resources such as trucks,
volunteers, staffing, and storage. Utilizing temporary grants or fee subsidies
toward this effort could allow for greater efficiency for both the program and
retail donors.
68
Increased Focus on Relationship Management
Within the benchmark study, in-transition and fully transitioned food banks identified
strong relationship management as either a key strength of their program or an area
with an opportunity for improvement. The connection between donors and local
agency partners is shown to be highly beneficial, and is singled out on multiple
occasions in the benchmark data as the strength that external stakeholders most
identify with in the program. Furthermore, the need to establish stronger relationships
between program partners is indicated within the SWOT analysis and seen as
especially during any evolution in the Food Rescue Program. As the transition to
agency-direct model food rescue progresses, Three Square will see its role shift from
an emphasis on direct service (ie: picking up food and dropping it off) to an emphasis
on facilitation. As agencies begin to assume routes formerly serviced by Three Square,
it is critical that the food bank continues to serve as the bridge between agencies and
donors in order to maximize these benefits. Whether this takes the shape of a Three
Square staff member or a skilled volunteer, the “facilitator” role is recommended to
include:
● Introductions and establishment of agencies as an extension of Three
Square.
● Periodic check-ins with both donors and agencies to assess the relationship.
● Serving as the singular point of contact for both agencies and donors in case of
issues or disputes.
● Providing donors with feedback (thank you cards from families/agency, awards
and other recognition) and metrics on their performance (ie: pounds donated,
meals provided, families impacted, etc.) in order to foster participation and
thank them for their partnership.
● Administering measurement tool to monitor agency and donor experiences
Medium-term Recommendations
Spanning from 18 months to three years, medium-term recommendations are defined
as permanent solutions to current issues facing the Food Rescue Program. The
following recommendations are intended to provide a lasting solution, ensuring current
problems don’t manifest into the future.
69
Dedicated Food Rescue Manager
In order to maximize the benefits of the agency direct program model, a dedicated
staff member is recommended for assignment to coordinate food rescue. This is
consistent with the data received in the benchmark study, which identifies a key staff
person as a best practice and a strength within multiple food rescue programs, while
addressing an identified opportunity within the SWOT analysis. Ideally, an individual
with a retail background, this position is an evolution toward a permanent solution of
the relationship management component identified within the Short Term
Recommendations. Investment in a staffed position allows an expansion of
duties/focus for the facilitator role. In addition to the responsibilities previously
mentioned, a dedicated employee is recommended to:
● In conjunction with Agency Relations, provide additional agency oversight to
ensure program protocols are being followed.
● Work closely with donors to make sure they are maximizing pounds and product
type donated.
● Market to new agencies and donors not currently participating in the Food
Rescue Program to increase program capacity and overall poundage.
● Manage program specific metrics, reporting, and exposure for both internal and
external stakeholders
● Develop and innovate areas such as recognition (agency and donor), training
(agency and donor), and community outreach.
Transition Away From Quarterly Fee Structure
In ensuring an enduring and efficient Food Rescue Program, transitioning from a per-
agency fee based system toward either a per-delivery or per-pound metric is
recommended. Shown within the Cost-Effectiveness Analysis, the cost of providing
delivery services to participating agencies is significantly higher than current quarterly
fees are currently able to recover, providing a notable subsidy, particularly toward
smaller-than average pickups and deliveries. As the costs of resources for the delivery
model are known to the organization, represented as a substantial weakness in the
SWOT analysis, the resulting inefficiency remains a long-term threat and ongoing
strategic issue to the Food Rescue Program. While the approximate $0.04 per pound
cost of delivery appears small, the compounded dollar amount is significant in
representing an ongoing opportunity cost toward investment in providing future
services, as shown below:
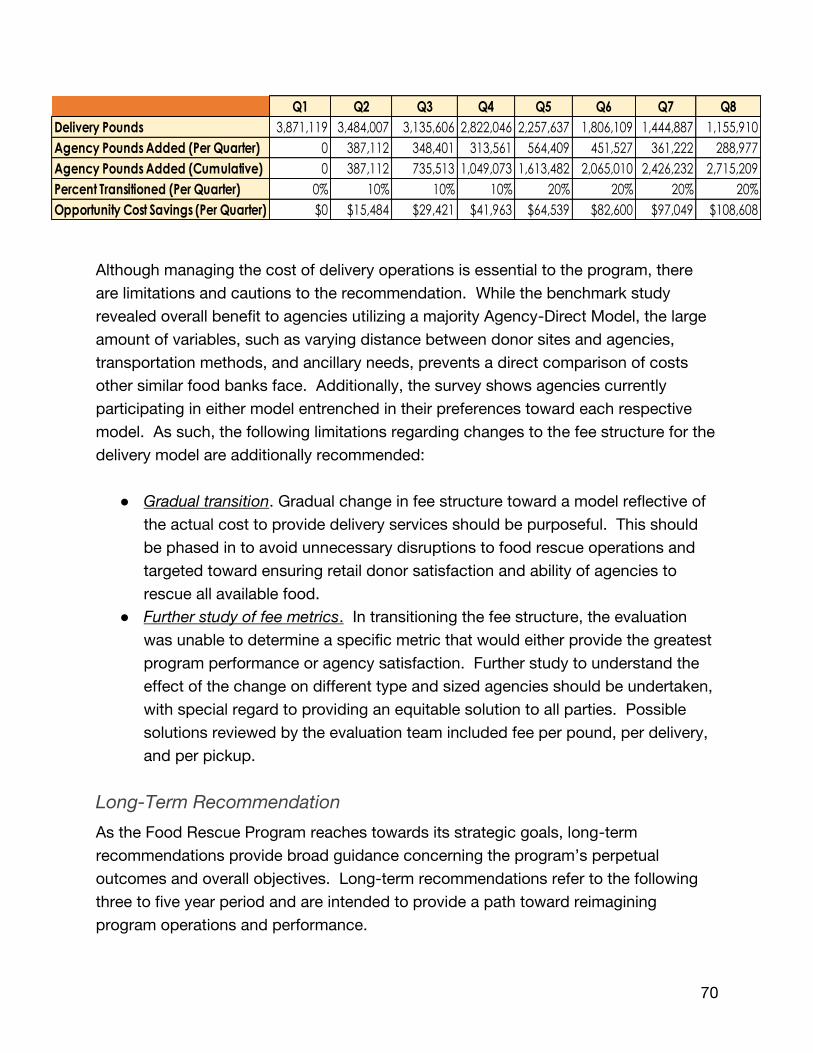
70
Q1 Q2 Q3 Q4 Q5 Q6 Q7 Q8
Delivery Pounds 3,871,119 3,484,007 3,135,606 2,822,046 2,257,637 1,806,109 1,444,887 1,155,910
Agency Pounds Added (Per Quarter) 0 387,112 348,401 313,561 564,409 451,527 361,222 288,977
Agency Pounds Added (Cumulative) 0 387,112 735,513 1,049,073 1,613,482 2,065,010 2,426,232 2,715,209
Percent Transitioned (Per Quarter) 0% 10% 10% 10% 20% 20% 20% 20%
Opportunity Cost Savings (Per Quarter) $0 $15,484 $29,421 $41,963 $64,539 $82,600 $97,049 $108,608
Although managing the cost of delivery operations is essential to the program, there
are limitations and cautions to the recommendation. While the benchmark study
revealed overall benefit to agencies utilizing a majority Agency-Direct Model, the large
amount of variables, such as varying distance between donor sites and agencies,
transportation methods, and ancillary needs, prevents a direct comparison of costs
other similar food banks face. Additionally, the survey shows agencies currently
participating in either model entrenched in their preferences toward each respective
model. As such, the following limitations regarding changes to the fee structure for the
delivery model are additionally recommended:
● Gradual transition. Gradual change in fee structure toward a model reflective of
the actual cost to provide delivery services should be purposeful. This should
be phased in to avoid unnecessary disruptions to food rescue operations and
targeted toward ensuring retail donor satisfaction and ability of agencies to
rescue all available food.
● Further study of fee metrics. In transitioning the fee structure, the evaluation
was unable to determine a specific metric that would either provide the greatest
program performance or agency satisfaction. Further study to understand the
effect of the change on different type and sized agencies should be undertaken,
with special regard to providing an equitable solution to all parties. Possible
solutions reviewed by the evaluation team included fee per pound, per delivery,
and per pickup.
Long-Term Recommendation
As the Food Rescue Program reaches towards its strategic goals, long-term
recommendations provide broad guidance concerning the program’s perpetual
outcomes and overall objectives. Long-term recommendations refer to the following
three to five year period and are intended to provide a path toward reimagining
program operations and performance.
71
Development of Mobile-Accessible Software
As both qualitative methodologies showed communication as a strategic issue,
increased development and use of technology is seen as a long-term recommendation,
offering a powerful solution to the identified strategic issue of communication facing
the Food Rescue Program. In order to address communication, seen as a common
theme in the benchmark study, combined with the need for stronger relationships
found in the SWOT analysis, technology provides an artificial tool to bind organizations
in a mutually beneficial manner. By addressing communication between the
organization, retail donors, and partner agencies through creation of software linking
the parties, provides Three Square an opportunity to fundamentally address larger
program outcomes. While the evaluation did not find the set amount of increase in
food rescue pounds expected with increased communication or use of technology, the
broader effect on program theory outcomes is expected in increased abilities to form
relationships and further engagement by program partners. Use of mobile-accessible
software, linked to Three Square databases, would theoretically enable all-sized
partners the ability to locate donors, exchange information regarding scheduling, type
of food, amount of food available, and communicate any concerns or issues. Toward
accomplishing overall program objectives, development of a hardware agnostic
mobile-accessible application is recommended to include the following features:
● Administrative oversight of communication within the software. The application
should provide the ability to program facilitators to communicate and coordinate
donor and agency activities.
● Geographic proximity. A overarching strategy addressing the logistical
obstacles, allowing matching features to:
○ Ability for retail donors to market available food.
○ Ability for participating agencies to quickly capture available food.
● Increased access to food supply chain (wholesale, retail ready to eat meals, etc.).
Application features should include the ability to capture food from additional
areas of the food supply chain, increasing donor capacity and furthering Three
Square’s mission.
● Ease of capturing food rescue data (type, pounds, organizations, location, etc.).
A central backend feature of the application should allow donors and agencies
the ability to input data from any device, giving program managers the ability to
monitor and adjust facilitation through data analysis.
72
Conclusions
The program evaluation ultimately finds the current resources utilized within the
delivery model of the Food Rescue Program as representing a significant and ongoing
opportunity cost, whereby limited program resources that could be utilized for other
organizational activities. Toward this effort, the transition toward a majority agency-
direct model of food rescue would be beneficial in capturing additional food waste and
commensurate with its mission, especially in regards to ensuring healthy, long-term
program performance. While this assumes additional food donor capacity, successful
transition remains contingent upon several additionally important factors. First, that
any transition should be incremental and undertaken in a manner that provides support
for participating agencies lacking needed resources to reasonably ensure food safety,
including providing appropriate training of personnel and assistance obtaining ancillary
equipment. Secondly, that any transition must be accompanied by a method that
allows Three Square to actively coordinate and oversee communication between retail
donors and participating agencies. Thirdly, that any transition capture relevant data
needed to monitor program impact and outcomes, with a mechanism that properly
validates the amount of food rescued. Lastly, that any transition should include a fee
structure reflective of the actual cost of delivery services, removing the entrenched
assumptions regarding delivery service costs.
Limitations
While the program evaluation uncovered several pertinent recommendations, it’s
important to acknowledge several limitations of the program evaluation. As time
constraints remained a constant challenge throughout the evaluation, addressing the
restriction within the research design resulted in particular limitations in findings. First,
as the evaluation wasn’t designed to obtain the perceptions of retail donors, significant
insight may be gained through future research of retail donors and food rescue.
Second, due to limited participation in SWOT data collection (one Three Square
staffer), the analysis is unable to ensure a broad internal/external perspective and could
be addressed through future efforts of the organization. Third, with limited
respondents, the agency survey sample size is insufficient in providing statistical
accuracy representative of the population. While still providing important insight into
participating agencies, further research, especially of agencies outside the geographic
region, could provide additional understanding of the preferences and needs of relief
agencies. Lastly, as referenced in the cost-benefit analysis, data collection was limited
to currently available internal data sources. The limitations include length of food
73
waste capture data collection, future changes to expenses such as fuel, and the cost
of logistical operations in participating agencies within the agency-direct model.
Additional targeted data collection in future processes of the Food Rescue Program
may provide significant benefit to the organization, participating agencies, and future
research.
Discussion
With an absence of current study concerning food rescue program theory, it remains
difficult to define effective and efficient program performance. In this regard, the
findings of this evaluation begin to reveal the challenges and complexity of food
rescue. Due to time and resource constraints, the program evaluation purposely
excluded the perspective of retail donors. Related to this perspective, two repeating
questions continue to arise concerning donors during the evaluation.
First, the needs and preferences concerning donor capacity, or the ability of local retail
donors to rescue greater amounts of food, remains largely unknown. While Three
Square estimates a majority of retail grocery stores participate in food rescue, the level
of participation, and more importantly, the effects of agency-direct model food rescue
operations on donors remains unknown. Secondly, while the evaluation generally
found the agency-direct model successful with other comparable food banks within the
evaluation, all but one (San Diego), is seen as having a significantly greater number
participating food donors than participating agencies. Future study incorporating food
rescue retail donor perspectives may be valuable in providing insight into matching
donor supply and agency food rescue capacity. Within this effort, as the program is
seen focusing retail grocery for the majority of food rescue, additional research
concerning the preferences and needs of other types of prospective donors within the
food supply chain may reveal additional donor capacity.
74
References
Bamberger, M., Rugh, J., & Mabry, L. (2012). RealWorld evaluation: Working under
budget, time, data, and political constraints (2nd ed.). Thousand Oaks, CA: SAGE.
Buzby, J. C., & Hyman, J. (2012). Total and per capita value of food loss in the United
States.Food Policy, 37(5), 561-570. doi:10.1016/j.foodpol.2012.06.002
Buzby, J. C., Wells, H. F., & Hyman, J. (2014). The estimated amount, value, and
calories of postharvest food losses at the retail and consumer levels in the United
States (EIB-121). Retrieved from United States Department of Agriculture website:
http://www.ers.usda.gov/media/1282296/eib121.pdf
Coleman-Jensen, A., Rabbit, M. P., Gregory, C., & Singh, A. (2015). Household Food
Security in the United States in 2014. Retrieved from U.S. Dept. of Agriculture,
Economic Research Service website:
http://www.ers.usda.gov/media/1896841/err194.pdf
Creswell, J. W., & Plano Clark, V. L. (2011). Designing and conducting mixed methods
research(2nd ed.). Thousand Oaks, CA: SAGE Publications.
Gundersen, C., Kreider, B., & Pepper, J. (2011). The economics of food insecurity in
the United States. Applied Economic Perspectives and Policy, 33(3), 281-303.
doi:10.1093/aepp/ppr022
Hall, K. D., Guo, J., Dore, M., & Chow, C. C. (2009). The progressive increase of food
waste in America and its environmental impact. PLoS ONE, 4(11), e7940.
doi:10.1371/journal.pone.0007940
Kearns, K. P. (1992). From comparative advantage to damage control: Clarifying
strategic issues using swot analysis. Nonprofit Management Leadership, 3(1), 3-22.
doi:10.1002/nml.4130030103
Rossi, P. H., Lipsey, M. W., & Freeman, H. E. (2004). Evaluation: A systematic
approach(7th ed.). Thousand Oaks, CA: Sage.
Three Square Food Bank. (2013). Three Square Strategic Plan 2013-2016. Retrieved
from http://www.threesquare.org/images/stories/Strategic_Plan_2013-2016.pdf
Three Square Food Bank. (2015). Map the meal gap. Retrieved from
https://www.threesquare.org/images/2015_food_insecurity_map.pdf
Three Square Food Bank. (2016). Three Square Overview. Retrieved from
http://www.threesquare.org/about-us/three-square-overview/mission
75
Tyson, J., Murua, C., & Toth, J. (2014). 2014 census report. Retrieved from Three
Square Food Bank website:
https://www.threesquare.org/images/2014_Census_Report.pdf
United States Department of Agriculture. (2015, September 8). Definitions of Food
Security. Retrieved from www.ers.usda.gov/topics/food-nutrition-assistance/food-
security-in-the-us/definitions-of-food-security.aspx
United States Environmental Protection Agency. (2015). Advancing sustainable
materials management: 2013 Fact Sheet. Retrieved from
https://www.epa.gov/sites/production/files/2015-
09/documents/2013_advncng_smm_fs.pdf
US EPA. (2016, March 31). Food recovery hierarchy. Retrieved from
https://www.epa.gov/sustainable-management-food/food-recovery-hierarchy
US EPA. (2016, June 6). United States 2030 food loss and waste reduction goal.
Retrieved from https://www.epa.gov/sustainable-management-food/united-states-
2030-food-loss-and-waste-reduction-goal
APPENDIX A: SWOT Analysis
Questionnaire Program-wide Related Questions
1. What internal assets or resources do you feel allows the food rescue program to
succeed? These could include unique physical assets, people, or resources. Are
there anything distinctive or unique to Three Square or the program? Please
describe.
2. What do you feel that the food rescue program does especially well toward
accomplishing Three Square's mission? This includes the specific activities or
behaviors key to the success of the program. Are there anything distinctive or
unique to Three Square or the program? Please describe.
3. What strengths do you believe others, outside of the organization, see of the food
rescue program? Please describe.
4. What do feel are the key internal factors to the success of the food rescue program?
What qualities of the program allow Three Square to convince stakeholders to
participate in the program? Please describe.
5. Where do you see areas for improvement within the program? Are there areas you
feel hinder growth or efficiency?
6. What capabilities or resources would be needed to make improvements in food
rescue program? These could include assets, resources, or people. Please explain.
7. What opportunities exist outside of the organization that you feel could assist the
food rescue program? What issues or aspects of food rescue do you see outsiders
as interested in developing/addressing? These could include new funding/donors,
partnerships, etc. Please explain.
8. What are the largest external threat(s) that you see to the food rescue program?
This could relate to efficiency or effectiveness of the program. Are there factors,
situations, changes to the world that you feel threaten accomplishing the mission of
Three Square? Please list the top three external threats to the food rescue program.
Delivery Related Questions
(description) The following questions are regarding Three Square providing delivery
services for agency partners.
9. What unique or distinct advantages do you see with Three Square providing delivery
services to retailers? Benefit(s) for retailers within the delivery Services model.
These could include physical assets, people, or resources. Please explain.
10. What unique or distinct advantages do you see with Three Square providing delivery
services to local relief agencies? Benefit(s) for local relief agencies within the
delivery services model. These could include physical assets, people, or resources.
Please explain.
11. What capabilities or resources involved in the delivery of rescued food help Three
Square accomplish its mission? These could include physical assets, people, or
resources. Please explain.
12. What deficiencies in resources or capabilities exist in the delivery of rescued food?
Please explain.
13. What aspects of delivery services hinders the Three Square mission? What factors
of delivery of rescued food should be avoided? Please explain.
14. What external opportunities exist in improving delivery of rescued food? These
could include assets, resources, relationships or people. Please explain.
15. Are there any trends or reoccurring tendencies by other organizations that may
provide increased efficiency or effectiveness of delivery services within the food
rescue program? (i.e. new best practices, industry standards, etc.) Please explain.
16. What new obstacles or challenges does Three Square face in providing delivery
services for the food rescue program? Please explain.
17. What external forces do you foresee affecting delivery services of the food rescue
program?
Agency-Direct Related Questions
(description) The following questions are regarding agency Partners who pick up food
rescue items directly from retailers.
18. What unique or distinct advantages for retailers do you see with retailers directly
providing rescued food to local relief agencies? Benefit(s) for retailers within the
agency-direct model. These could include physical assets, people, or resources.
Please explain.
19. What unique or distinct advantages for local relief agencies do you see with retailers
directly providing rescued food to local relief agencies? Benefit(s) for local relief
agencies within the agency-direct model. These could include physical assets,
people, or resources. Please explain.
20. What capabilities or resources specifically involving agency to retailer food rescue
help Three Square accomplish its mission? Please explain.
21. What deficiencies in resources or capabilities exist in the agency to retailer food
rescue model? What resources or capabilities currently hinder the efficiency or
effectiveness of agencies directly picking up food from retailers? Please explain.
22. What external opportunities exist in improving the relationships between agencies
and retailers? How might Three Square assist these efforts? Please explain.
23. Are there any trends or reoccurring tendencies by other organizations that may
provide increased efficiency or effectiveness in the agency-direct model? Please
explain.
24. What new obstacles or challenges does Three Square face in facilitating food rescue
pickup by local relief agencies from retailers? Please explain.
25. What external forces do you foresee affecting agency direct pickup?
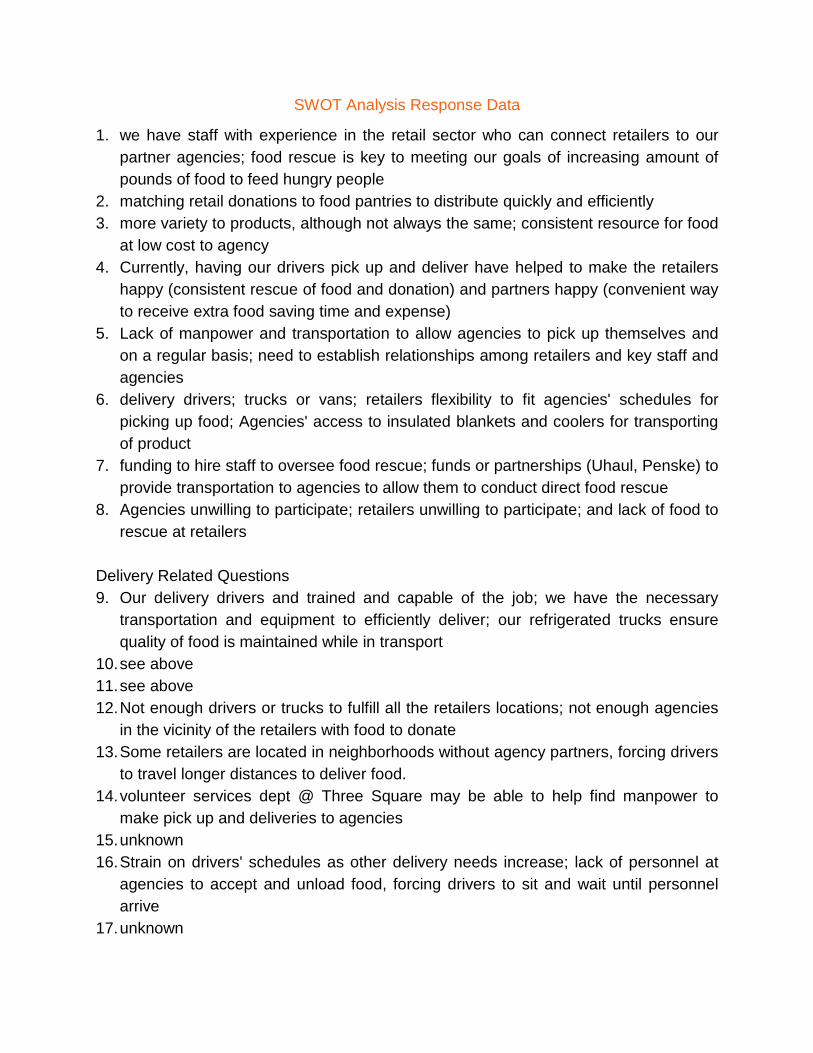
SWOT Analysis Response Data
1. we have staff with experience in the retail sector who can connect retailers to our
partner agencies; food rescue is key to meeting our goals of increasing amount of
pounds of food to feed hungry people
2. matching retail donations to food pantries to distribute quickly and efficiently
3. more variety to products, although not always the same; consistent resource for food
at low cost to agency
4. Currently, having our drivers pick up and deliver have helped to make the retailers
happy (consistent rescue of food and donation) and partners happy (convenient way
to receive extra food saving time and expense)
5. Lack of manpower and transportation to allow agencies to pick up themselves and
on a regular basis; need to establish relationships among retailers and key staff and
agencies
6. delivery drivers; trucks or vans; retailers flexibility to fit agencies' schedules for
picking up food; Agencies' access to insulated blankets and coolers for transporting
of product
7. funding to hire staff to oversee food rescue; funds or partnerships (Uhaul, Penske) to
provide transportation to agencies to allow them to conduct direct food rescue
8. Agencies unwilling to participate; retailers unwilling to participate; and lack of food to
rescue at retailers
Delivery Related Questions
9. Our delivery drivers and trained and capable of the job; we have the necessary
transportation and equipment to efficiently deliver; our refrigerated trucks ensure
quality of food is maintained while in transport
10. see above
11. see above
12. Not enough drivers or trucks to fulfill all the retailers locations; not enough agencies
in the vicinity of the retailers with food to donate
13. Some retailers are located in neighborhoods without agency partners, forcing drivers
to travel longer distances to deliver food.
14. volunteer services dept @ Three Square may be able to help find manpower to
make pick up and deliveries to agencies
15. unknown
16. Strain on drivers' schedules as other delivery needs increase; lack of personnel at
agencies to accept and unload food, forcing drivers to sit and wait until personnel
arrive
17. unknown
Agency-Direct Related Questions
18. Ability to have food rescued more often, freeing up storage space used to store food;
better connection to neighborhood served by partnering with neighborhood
agencies, leading to increased good will in the community
19. Once relationships are established, will hopefully lead to more consistency of food
available; retailers should have better understanding of agencies' needs in terms of
type of food to supply; increased visibility for agencies among retailers, possibly
leading to other resources - lower costs charged for purchased items. May lead to
additional opportunities, such as retail staff volunteering with agency.
20. Will free up trucks and drivers to utilize for providing delivery to additional programs
with food; added pounds of reported food rescue will contribute to our goal of 50
million pounds distributed to the community
21. lack of manpower, ability to measure pounds rescued, and lack of transportation to
adequately contain food; lack of relationship building skills on the part of the
agencies
22. Assist agencies by providing contacts and introductions; train agencies on
establishing and maintaining relationships; encourage retail staff to learn more about
the agency and its programs, facilitate volunteer opportunities.
23. Agency partner, St. Therese Center has regular food rescue throughout the valley
with staff and trucks dedicated to that purpose.
24. The simple fact that food rescue has been conducted by Three Square directly will
be the biggest hurdle for implementing new processes. "It's always been done that
way.”
25. Changes in agency leadership could possibly lead to less resistance to the proposed
new process.
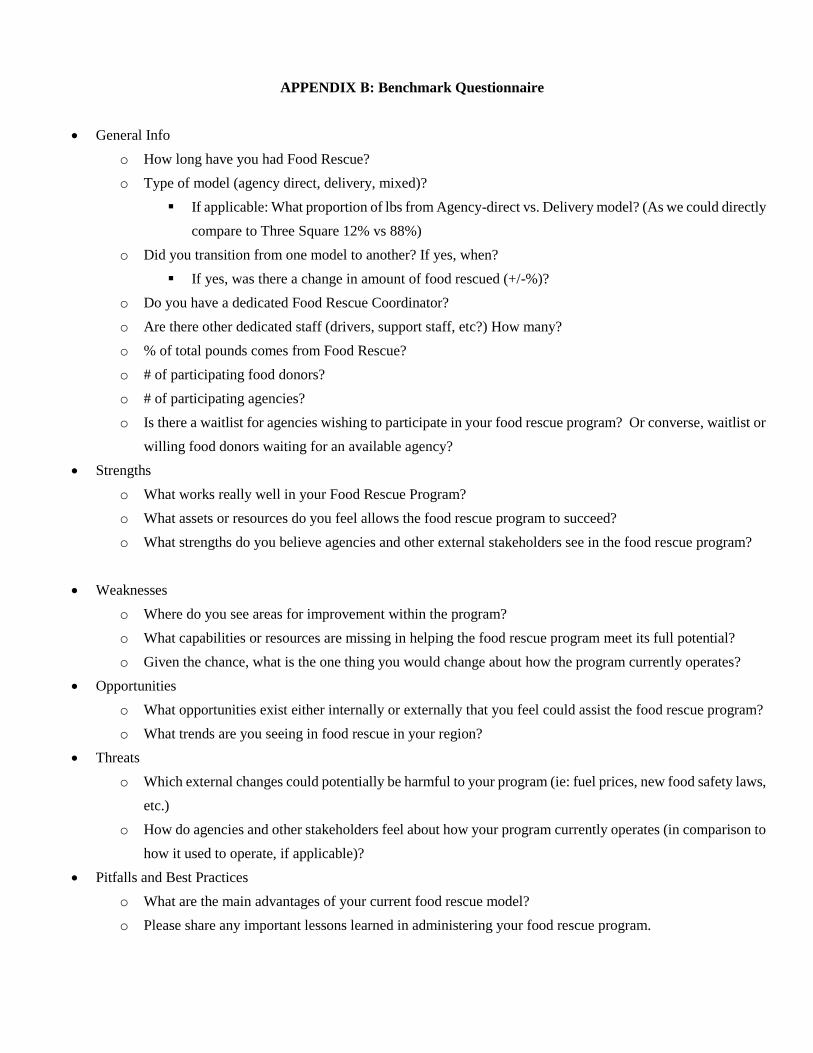
APPENDIX B: Benchmark Questionnaire
General Info
o How long have you had Food Rescue?
o Type of model (agency direct, delivery, mixed)?
If applicable: What proportion of lbs from Agency-direct vs. Delivery model? (As we could directly
compare to Three Square 12% vs 88%)
o Did you transition from one model to another? If yes, when?
If yes, was there a change in amount of food rescued (+/-%)?
o Do you have a dedicated Food Rescue Coordinator?
o Are there other dedicated staff (drivers, support staff, etc?) How many?
o % of total pounds comes from Food Rescue?
o # of participating food donors?
o # of participating agencies?
o Is there a waitlist for agencies wishing to participate in your food rescue program? Or converse, waitlist or
willing food donors waiting for an available agency?
Strengths
o What works really well in your Food Rescue Program?
o What assets or resources do you feel allows the food rescue program to succeed?
o What strengths do you believe agencies and other external stakeholders see in the food rescue program?
Weaknesses
o Where do you see areas for improvement within the program?
o What capabilities or resources are missing in helping the food rescue program meet its full potential?
o Given the chance, what is the one thing you would change about how the program currently operates?
Opportunities
o What opportunities exist either internally or externally that you feel could assist the food rescue program?
o What trends are you seeing in food rescue in your region?
Threats
o Which external changes could potentially be harmful to your program (ie: fuel prices, new food safety laws,
etc.)
o How do agencies and other stakeholders feel about how your program currently operates (in comparison to
how it used to operate, if applicable)?
Pitfalls and Best Practices
o What are the main advantages of your current food rescue model?
o Please share any important lessons learned in administering your food rescue program.
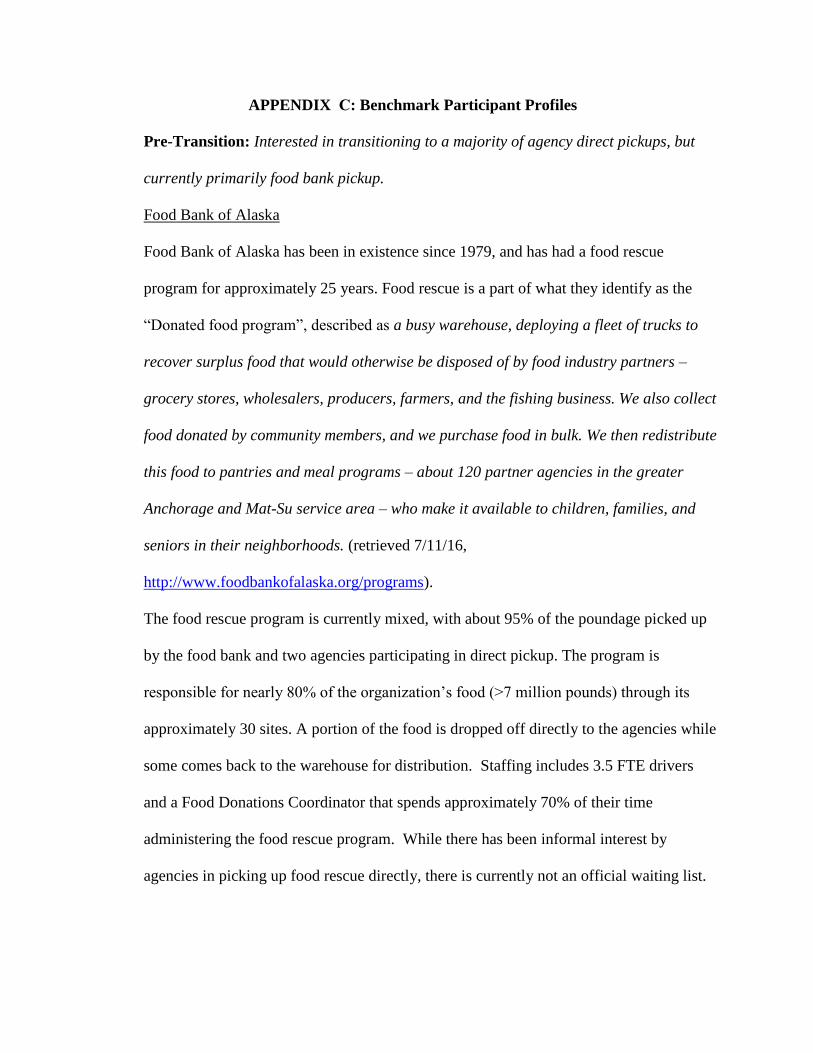
APPENDIX C: Benchmark Participant Profiles
Pre-Transition: Interested in transitioning to a majority of agency direct pickups, but
currently primarily food bank pickup.
Food Bank of Alaska
Food Bank of Alaska has been in existence since 1979, and has had a food rescue
program for approximately 25 years. Food rescue is a part of what they identify as the
“Donated food program”, described as a busy warehouse, deploying a fleet of trucks to
recover surplus food that would otherwise be disposed of by food industry partners –
grocery stores, wholesalers, producers, farmers, and the fishing business. We also collect
food donated by community members, and we purchase food in bulk. We then redistribute
this food to pantries and meal programs – about 120 partner agencies in the greater
Anchorage and Mat-Su service area – who make it available to children, families, and
seniors in their neighborhoods. (retrieved 7/11/16,
http://www.foodbankofalaska.org/programs).
The food rescue program is currently mixed, with about 95% of the poundage picked up
by the food bank and two agencies participating in direct pickup. The program is
responsible for nearly 80% of the organization’s food (>7 million pounds) through its
approximately 30 sites. A portion of the food is dropped off directly to the agencies while
some comes back to the warehouse for distribution. Staffing includes 3.5 FTE drivers
and a Food Donations Coordinator that spends approximately 70% of their time
administering the food rescue program. While there has been informal interest by
agencies in picking up food rescue directly, there is currently not an official waiting list.
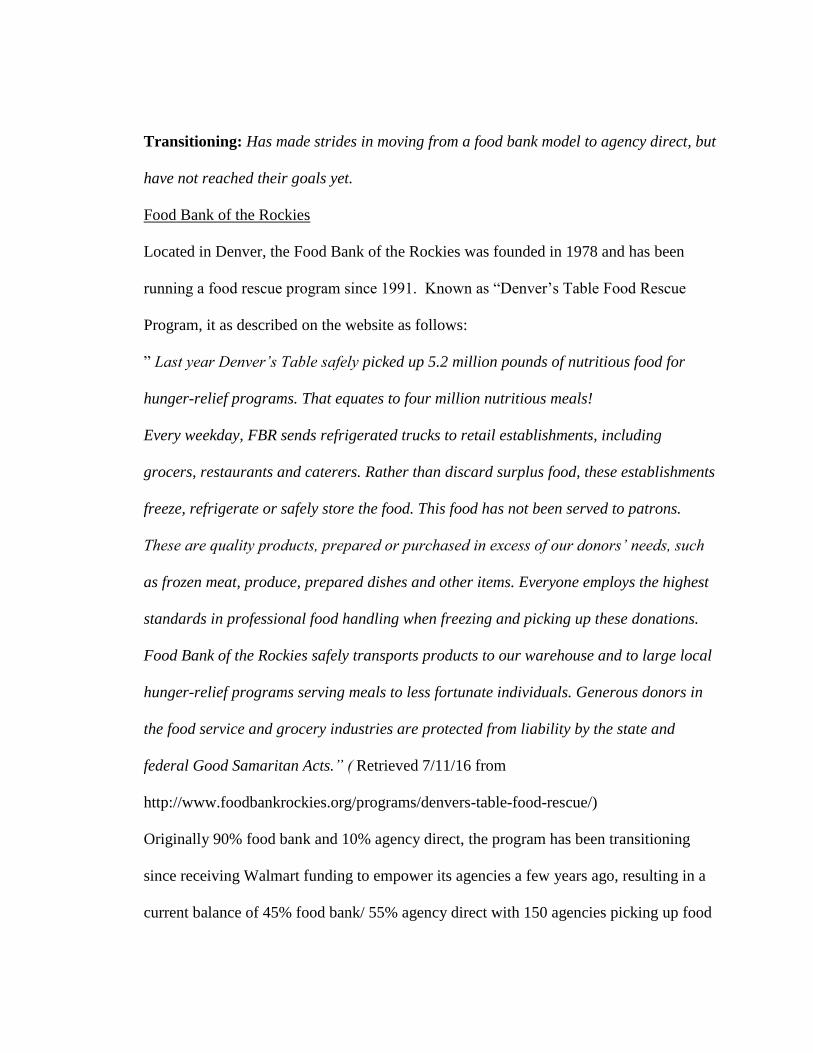
Transitioning: Has made strides in moving from a food bank model to agency direct, but
have not reached their goals yet.
Food Bank of the Rockies
Located in Denver, the Food Bank of the Rockies was founded in 1978 and has been
running a food rescue program since 1991. Known as “Denver’s Table Food Rescue
Program, it as described on the website as follows:
” Last year Denver’s Table safely picked up 5.2 million pounds of nutritious food for
hunger-relief programs. That equates to four million nutritious meals!
Every weekday, FBR sends refrigerated trucks to retail establishments, including
grocers, restaurants and caterers. Rather than discard surplus food, these establishments
freeze, refrigerate or safely store the food. This food has not been served to patrons.
These are quality products, prepared or purchased in excess of our donors’ needs, such
as frozen meat, produce, prepared dishes and other items. Everyone employs the highest
standards in professional food handling when freezing and picking up these donations.
Food Bank of the Rockies safely transports products to our warehouse and to large local
hunger-relief programs serving meals to less fortunate individuals. Generous donors in
the food service and grocery industries are protected from liability by the state and
federal Good Samaritan Acts.” ( Retrieved 7/11/16 from
http://www.foodbankrockies.org/programs/denvers-table-food-rescue/)
Originally 90% food bank and 10% agency direct, the program has been transitioning
since receiving Walmart funding to empower its agencies a few years ago, resulting in a
current balance of 45% food bank/ 55% agency direct with 150 agencies picking up food
themselves. Staffing includes a dedicated Food Rescue Coordinator (100% FTE) with
food retail management experience and 6 FTE drivers. Approximately 28% (15 million
pounds) of the food banks total food comes from the program’s 425 sites, and there is not
an official waitlist for agencies to join.
Care and Share Food Bank (Colorado Springs)
Serving southern Colorado since 1972, Care and Share has been running a food rescue
program for a minimum of 11 years. Labeled “Reclamation Food”, it is describe on the
organizational website as follows:
“This food comes from local grocery stores, restaurants, local farmers, and other
businesses. They have too much food and we know plenty of people that don’t have
enough. Our drivers pick up the food throughout the week and distribute it to our partner
agencies, who give it to people who need it.” Retrieved 7/11/16 via
http://careandshare.org/about/our-food-services/
In 2014, Care and Share Food Bank was 90% food bank/10% agency direct, with
agencies serving only the most remote locations. After a two year commitment to
ramping up agency direct poundage, the distribution has skewed to 65% food bank/ 35 %
agency direct. Staffing does not include a dedicated Food Rescue Coordinator, but
utilizes a Food Resource Manager at about 20-30% FTE. Additionally, there is an
Agency Relations staff member that spends time on the program, 3 drivers that are
approx.. 80% FTE on food rescue, and 2 volunteers that handle the agency-donor “meet
and greets” when relationships are formed. Approximately 20% (4.5 million pounds) of
the food bank’s food comes from the program via 137 donation sites, with 45 of the
organization’s 300 agencies picking up product directly. An official waitlist for
involvement has just been developed, and agencies are asked on their annual survey
whether they would be interested in coming aboard as an agency direct partner.
Fully Transitioned – have met their goals on agency direct pickups, or in the case of
FASD, started 100% agency direct and remain that way.
Regional Food Bank of Oklahoma (Oklahoma City)
The Regional Food Bank of Oklahoma officially joined the Feeding America network in
1980, and has been administering a food rescue program for more than 14 years. A
formal description was not available on the website, but the food bank’s 2015 Annual
Report notes that “In fiscal year 2015, more than 10.7 million pounds of food were
recovered through our Retail Food Recovery Program. The program reduces waste and
fills the shelves of our community pantries. Partners in the program include: Akins
Natural Food Market, Big Lots, Country Boy, Homeland, Natural Grocers, Sam’s
Wholesale Club, Sprouts Farmers Market, Target, United Supermarket, Walmart
Neighborhood Market, Walmart SuperCenter and Whole Foods. Currently the program is
95% agency direct pickup (130 agencies), with approx. 26% (13 million pounds) of the
organization’s total food coming via food rescue from 150 donation sites. There is a
dedicated Food Rescue Coordinator, and 3 drivers spend about 15% of their efforts on the
program. There is an official waitlist of 20-25 agencies actively waiting to be paired with
a donation site.
Great Plains Food Bank (North Dakota)
Founded in 1983, the Great Plains Food Bank has administered a food rescue program
since 1992. As described on the website, “Food industry donors team up with the Great
Plains Food Bank to get their surplus food to those who need it. Because of the
commitment of more than 200 socially responsible food industry partners, we are able to
distribute food for more than 11.4 million meals annually. Food industry donors are
critical to our distribution efforts. (retrieved 7/11/16 from
http://www.greatplainsfoodbank.org/our-partners/food-industry-partners.html )
The program is nearly a 50/50 split between agency direct and food bank pickup, after
beginning 100% agency direct. This case is an outlier in that they found that the agencies
did not have the capacity to capture all of the available food for rescue, so the food bank
invested in trucks and staff in order to maximize their poundage. 25 donor sites provide
21% (3 million pounds) of the total food the food bank receives, including 35 agencies
participating in direct pickup. Staffing includes a Food Resource Manager spending
approx. 80% of their time on food rescue, but targeting closer to 50% in the future.
Additionally, 4 drivers at 90% FTE support food bank pickup. There is currently no
waitlist; conversely, the food bank is actively seeking new agencies willing to participate
in agency direct pickup in order to rescue more food.
Feeding America San Diego
Established in 2007, Feeding America San Diego has been running a food rescue
program for seven years. Since its inception, the program has been 100% agency direct.
As described on its website: “Providing nearly half of the food distributed by FASD, our
Food Rescue program diverts quality food heading for the landfill to serve clients. FASD
partners with more than 180 local grocery stores and retailers, including Albertsons,
Food4Less, Ralphs, Target and Walmart, to rescue an average of nearly a million pounds
of fresh food each month. Produce, dairy, baked goods, meats and other perishable items
that would otherwise go to waste are generously donated and picked up directly by our
partner agencies. Recognized for its efficiency and effectiveness, this model enables
FASD to reduce food waste while providing nutritious food to the community.” (retrieved
7/11/16 from http://feedingamericasd.org/about/food-resources/
Almost exclusively agency direct, the food bank has stepped in and picked up routes
when agencies have been forced to drop them and currently makes 3 stops, though they
are attempting to match those stops with an agency partner. There is not a dedicated
position for coordination, instead it falls within the duties of the Food Resource
Coordinator, who is responsible for all food procurement activities. 50% (11.8 million
pounds) of FASD’s food comes from the program and its 64 sites. 206 agencies currently
are making active pickups and there is no formal waitlist.
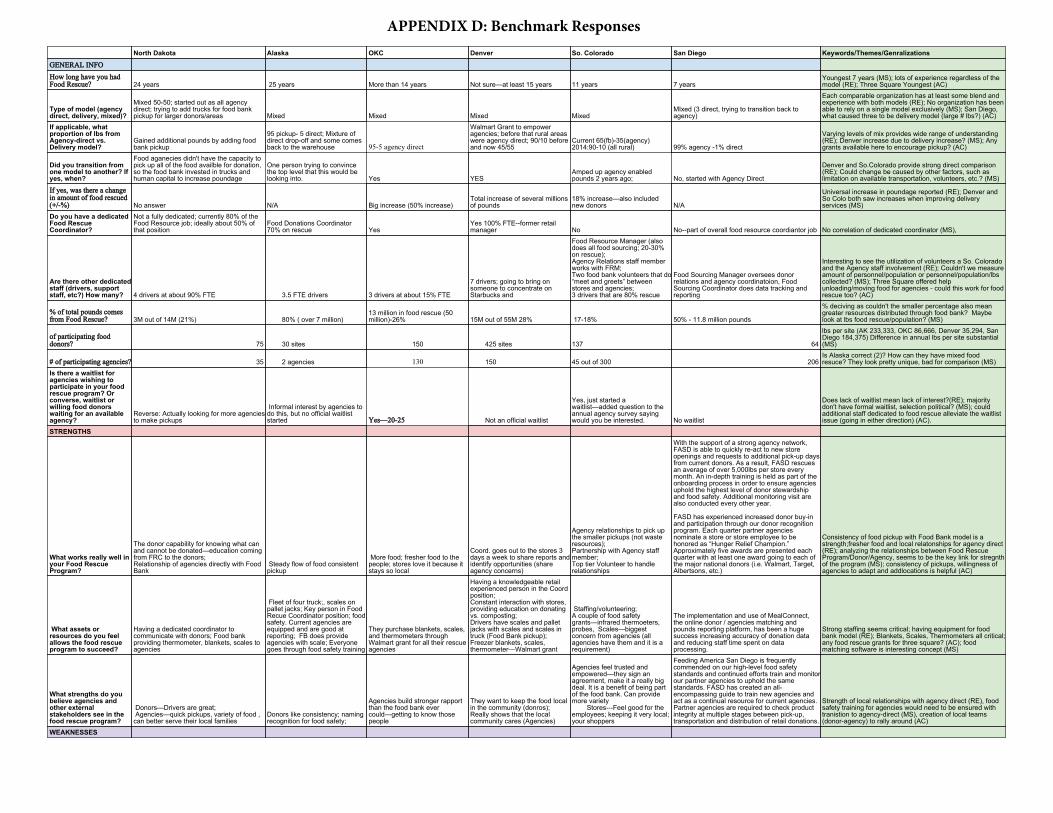
North Dakota Alaska OKC Denver So. Colorado San Diego Keywords/Themes/Genralizations
GENERAL INFOHow long have you hadFood Rescue? 24 years 25 years More than 14 years Not sure—at least 15 years 11 years 7 years
Youngest 7 years (MS); lots of experience regardless of themodel (RE); Three Square Youngest (AC)
Type of model (agencydirect, delivery, mixed)?
Mixed 50-50; started out as all agencydirect; trying to add trucks for food bankpickup for larger donors/areas Mixed Mixed Mixed Mixed
MIxed (3 direct, trying to transition back toagency)
Each comparable organization has at least some blend andexperience with both models (RE); No organization has beenable to rely on a single model exclusively (MS); San Diego,what caused three to be delivery model (large # lbs?) (AC)
If applicable, whatproportion of lbs fromAgency-direct vs.Delivery model?
Gained additional pounds by adding foodbank pickup
95 pickup- 5 direct; Mixture ofdirect drop-off and some comesback to the warehouse 95-5 agency direct
Walmart Grant to empoweragencies; before that rural areaswere agency direct; 90/10 beforeand now 45/55
Current 65(fb)-35(agency)2014:90-10 (all rural) 99% agency -1% direct
Varying levels of mix provides wide range of understanding(RE); Denver increase due to delivery increase? (MS); Anygrants available here to encourage pickup? (AC)
Did you transition fromone model to another? Ifyes, when?
Food aganecies didn't have the capacity topick up all of the food availble for donation,so the food bank invested in trucks andhuman capital to increase poundage
One person trying to convincethe top level that this would belooking into. Yes YES
Amped up agency enabledpounds 2 years ago; No, started with Agency Direct
Denver and So.Colorado provide strong direct comparison(RE); Could change be caused by other factors, such aslimitation on available transportation, volunteers, etc.? (MS)
If yes, was there a changein amount of food rescued(+/-%) No answer N/A Big increase (50% increase)
Total increase of several millionsof pounds
18% increase—also includednew donors N/A
Universal increase in poundage reported (RE); Denver andSo Colo both saw increases when improving deliveryservices (MS)
Do you have a dedicatedFood RescueCoordinator?
Not a fully dedicated; currently 80% of theFood Resource job; ideally about 50% ofthat position
Food Donations Coordinator70% on rescue Yes
Yes 100% FTE--former retailmanager No No--part of overall food resource coordiantor job No correlation of dedicated coordinator (MS),
Are there other dedicatedstaff (drivers, supportstaff, etc?) How many? 4 drivers at about 90% FTE 3.5 FTE drivers 3 drivers at about 15% FTE
7 drivers; going to bring onsomeone to concentrate onStarbucks and
Food Resource Manager (alsodoes all food sourcing; 20-30%on rescue);Agency Relations staff memberworks with FRM;Two food bank volunteers that do“meet and greets” betweenstores and agencies;3 drivers that are 80% rescue
Food Sourcing Manager oversees donorrelations and agency coordinatoion, FoodSourcing Coordinator does data tracking andreporting
Interesting to see the utilization of volunteers a So. Coloradoand the Agency staff involvement (RE); Couldn't we measureamount of personnel/population or personnel/population/lbscollected? (MS); Three Square offered helpunloading/moving food for agencies - could this work for foodrescue too? (AC)
% of total pounds comesfrom Food Rescue? 3M out of 14M (21%) 80% ( over 7 million)
13 million in food rescue (50million)-26% 15M out of 55M 28% 17-18% 50% - 11.8 million pounds
% deciving as couldn't the smaller percentage also meangreater resources distributed through food bank? Maybelook at lbs food rescue/population? (MS)
of participating fooddonors? 75 30 sites 150 425 sites 137 64
lbs per site (AK 233,333, OKC 86,666, Denver 35,294, SanDiego 184,375) Difference in annual lbs per site substantial(MS)
# of participating agencies? 35 2 agencies 130 150 45 out of 300 206Is Alaska correct (2)? How can they have mixed foodresuce? They look pretty unique, bad for comparison (MS)
Is there a waitlist foragencies wishing toparticipate in your foodrescue program? Orconverse, waitlist orwilling food donorswaiting for an availableagency?
Reverse: Actually looking for more agenciesto make pickups
Informal interest by agencies todo this, but no official waitliststarted Yes—20-25 Not an official waitlist
Yes, just started awaitlist—added question to theannual agency survey sayingwould you be interested. No waitlist
Does lack of waitlist mean lack of interest?(RE); majoritydon't have formal waitlist, selection political? (MS); couldadditional staff dedicated to food rescue alleviate the waitlistissue (going in either direction) (AC).
STRENGTHS
What works really well inyour Food RescueProgram?
The donor capability for knowing what canand cannot be donated—education comingfrom FRC to the donors;Relationship of agencies directly with FoodBank
Steady flow of food consistentpickup
More food; fresher food to thepeople; stores love it because itstays so local
Coord. goes out to the stores 3days a week to share reports andidentify opportunities (shareagency concerns)
Agency relationships to pick upthe smaller pickups (not wasteresources);Partnership with Agency staffmember;Top tier Volunteer to handlerelationships
With the support of a strong agency network,FASD is able to quickly re-act to new storeopenings and requests to additional pick-up daysfrom current donors. As a result, FASD rescuesan average of over 5,000lbs per store everymonth. An in-depth training is held as part of theonboarding process in order to ensure agenciesuphold the highest level of donor stewardshipand food safety. Additional monitoring visit arealso conducted every other year.
FASD has experienced increased donor buy-inand participation through our donor recognitionprogram. Each quarter partner agenciesnominate a store or store employee to behonored as “Hunger Relief Champion.”Approximately five awards are presented eachquarter with at least one award going to each ofthe major national donors (i.e. Walmart, Target,Albertsons, etc.)
Consistency of food pickup with Food Bank model is astrength;fresher food and local relatonships for agency direct(RE); analyzing the relationships between Food RescueProgram/Donor/Agency, seems to be the key link for stregnthof the program (MS); consistency of pickups, willingness ofagencies to adapt and addlocations is helpful (AC)
What assets orresources do you feelallows the food rescueprogram to succeed?
Having a dedicated coordinator tocommunicate with donors; Food bankproviding thermometer, blankets, scales toagencies
Fleet of four truck;, scales onpallet jacks; Key person in FoodRecue Coordinator position; foodsafety. Current agencies areequipped and are good atreporting; FB does provideagencies with scale; Everyonegoes through food safety training
They purchase blankets, scales,and thermometers throughWalmart grant for all their rescueagencies
Having a knowledgeable retailexperienced person in the Coordposition;Constant interaction with stores,providing education on donatingvs. composting;Drivers have scales and palletjacks with scales and scales intruck (Food Bank pickup);Freezer blankets, scales,thermometer—Walmart grant
Staffing/volunteering;A couple of food safetygrants—infrared thermoeters,probes, Scales—biggestconcern from agencies (allagencies have them and it is arequirement)
The implementation and use of MealConnect,the online donor / agencies matching andpounds reporting platform, has been a hugesuccess increasing accuracy of donation dataand reducing staff time spent on dataprocessing.
Strong staffing seems critical; having equipment for foodbank model (RE); Blankets, Scales, Thermometers all critical;any food rescue grants for three square? (AC); foodmatching software is interesting concept (MS)
What strengths do youbelieve agencies andother externalstakeholders see in thefood rescue program?
Donors—Drivers are great; Agencies—quick pickups, variety of food ,can better serve their local families
Donors like consistency; namingrecognition for food safety;
Agencies build stronger rapportthan the food bank evercould—getting to know thosepeople
They want to keep the food localin the community (donros);Really shows that the localcommunity cares (Agencies)
Agencies feel trusted andempowered—they sign anagreement, make it a really bigdeal. It is a benefit of being partof the food bank. Can providemore variety Stores---Feel good for theemployees; keeping it very local;your shoppers
Feeding America San Diego is frequentlycommended on our high-level food safetystandards and continued efforts train and monitorour partner agencies to uphold the samestandards. FASD has created an all-encompassing guide to train new agencies andact as a continual resource for current agencies.Partner agencies are required to check productintegrity at multiple stages between pick-up,transportation and distribution of retail donations.
Strength of local relationships with agency direct (RE), foodsafety training for agencies would need to be ensured withtranistion to agency-direct (MS), creation of local teams(donor-agency) to rally around (AC)
WEAKNESSES
APPENDIX D: Benchmark Responses
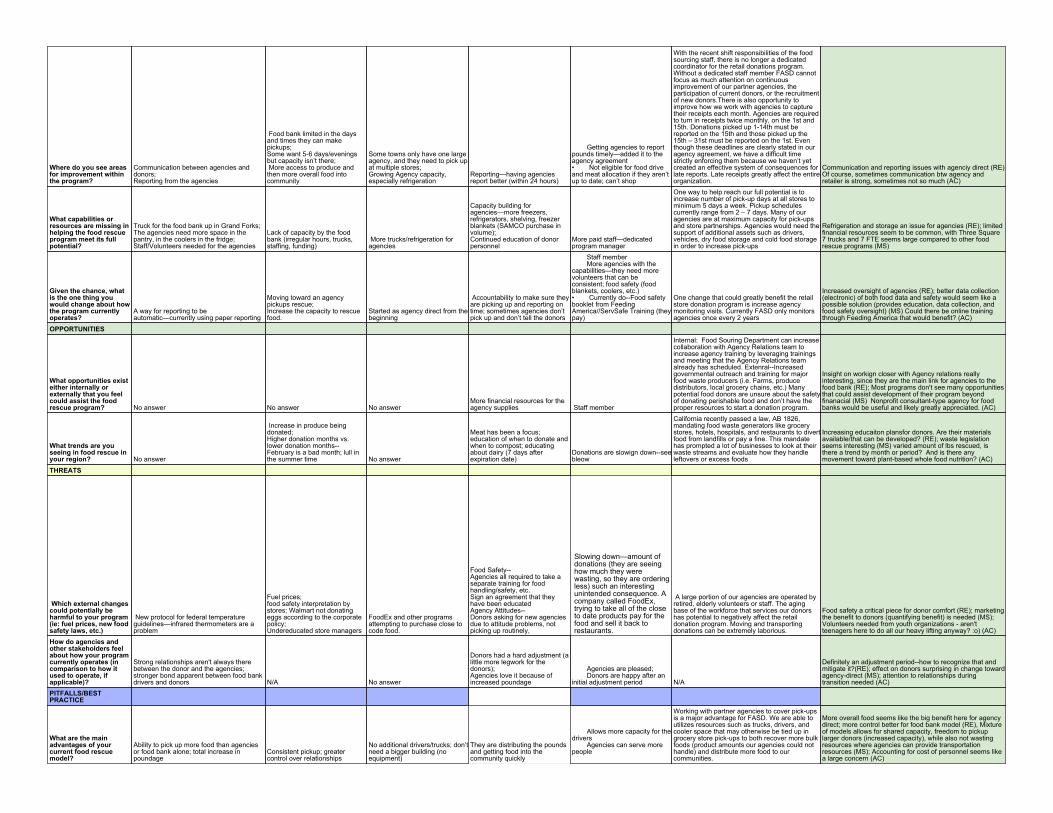
Where do you see areasfor improvement withinthe program?
Communication between agencies anddonors;Reporting from the agencies
Food bank limited in the daysand times they can makepickups;Some want 5-6 days/eveningsbut capacity isn’t there; More access to produce andthen more overall food intocommunity
Some towns only have one largeagency, and they need to pick upat multiple stores;Growing Agency capacity,especially refrigeration
Reporting—having agenciesreport better (within 24 hours)
Getting agencies to reportpounds timely—added it to theagency agreement• Not eligible for food driveand meat allocation if they aren’tup to date; can’t shop
With the recent shift responsibilities of the foodsourcing staff, there is no longer a dedicatedcoordinator for the retail donations program.Without a dedicated staff member FASD cannotfocus as much attention on continuousimprovement of our partner agencies, theparticipation of current donors, or the recruitmentof new donors.There is also opportunity toimprove how we work with agencies to capturetheir receipts each month. Agencies are requiredto turn in receipts twice monthly, on the 1st and15th. Donations picked up 1-14th must bereported on the 15th and those picked up the15th – 31st must be reported on the 1st. Eventhough these deadlines are clearly stated in ouragency agreement, we have a difficult timestrictly enforcing them because we haven’t yetcreated an effective system of consequences forlate reports. Late receipts greatly affect the entireorganization.
Communication and reporting issues with agenciy direct (RE)Of course, sometimes communication btw agency andretailer is strong, sometimes not so much (AC)
What capabilities orresources are missing inhelping the food rescueprogram meet its fullpotential?
Truck for the food bank up in Grand Forks;The agencies need more space in thepantry, in the coolers in the fridge;Staff/Volunteers needed for the agencies
Lack of capacity by the foodbank (irregular hours, trucks,staffing, funding)
More trucks/refrigeration foragencies
Capacity building foragencies—more freezers,refrigerators, shelving, freezerblankets (SAMCO purchase involume);Continued education of donorpersonnel
More paid staff—dedicatedprogram manager
One way to help reach our full potential is toincrease number of pick-up days at all stores tominimum 5 days a week. Pickup schedulescurrently range from 2 – 7 days. Many of ouragencies are at maximum capacity for pick-upsand store partnerships. Agencies would need thesupport of additional assets such as drivers,vehicles, dry food storage and cold food storagein order to increase pick-ups
Refrigeration and storage an issue for agencies (RE); limitedfinancial resources seem to be common, with Three Square7 trucks and 7 FTE seems large compared to other foodrescue programs (MS)
Given the chance, whatis the one thing youwould change about howthe program currentlyoperates?
A way for reporting to beautomatic—currently using paper reporting
Moving toward an agencypickups rescue;Increase the capacity to rescuefood.
Started as agency direct from thebeginning
Accountability to make sure theyare picking up and reporting ontime; sometimes agencies don’tpick up and don’t tell the donors
Staff member More agencies with thecapabilities—they need morevolunteers that can beconsistent; food safety (foodblankets, coolers, etc.)• Currently do--Food safetybooklet from FeedingAmerica//ServSafe Training (theypay)
One change that could greatly benefit the retailstore donation program is increase agencymonitoring visits. Currently FASD only monitorsagencies once every 2 years
Increased oversight of agencies (RE); better data collection(electronic) of both food data and safety would seem like apossible solution (provides education, data collection, andfood safety oversight) (MS) Could there be online trainingthrough Feeding America that would benefit? (AC)
OPPORTUNITIES
What opportunities existeither internally orexternally that you feelcould assist the foodrescue program? No answer No answer No answer
More financial resources for theagency supplies Staff member
Internal: Food Souring Department can increasecollaboration with Agency Relations team toincrease agency training by leveraging trainingsand meeting that the Agency Relations teamalready has scheduled. Extenral--Increasedgovernmental outreach and training for majorfood waste producers (i.e. Farms, producedistributors, local grocery chains, etc.) Manypotential food donors are unsure about the safetyof donating perishable food and don’t have theproper resources to start a donation program.
Insight on workign closer with Agency relations reallyinteresting, since they are the main link for agencies to thefood bank (RE); Most programs don't see many opportunitiesthat could assist development of their program beyondfinanacial (MS) Nonprofit consultant-type agency for foodbanks would be useful and likely greatly appreciated. (AC)
What trends are youseeing in food rescue inyour region? No answer
Increase in produce beingdonated;Higher donation months vs.lower donation months--February is a bad month; lull inthe summer time No answer
Meat has been a focus;education of when to donate andwhen to compost; educatingabout dairy (7 days afterexpiration date)
Donations are slowign down--seebleow
California recently passed a law, AB 1826,mandating food waste generators like grocerystores, hotels, hospitals, and restaurants to divertfood from landfills or pay a fine. This mandatehas prompted a lot of businesses to look at theirwaste streams and evaluate how they handleleftovers or excess foods
Increasing educaiton plansfor donors. Are their materialsavailable/that can be developed? (RE); waste legislationseems interesting (MS) varied amount of lbs rescued, isthere a trend by month or period? And is there anymovement toward plant-based whole food nutrition? (AC)
THREATS
Which external changescould potentially beharmful to your program(ie: fuel prices, new foodsafety laws, etc.)
New protocol for federal temperatureguidelines—infrared thermometers are aproblem
Fuel prices;food safety interpretation bystores; Walmart not donatingeggs according to the corporatepolicy;Undereducated store managers
FoodEx and other programsattempting to purchase close tocode food.
Food Safety--Agencies all required to take aseparate training for foodhandling/safety, etc.Sign an agreement that theyhave been educatedAgency Attitudes--Donors asking for new agenciesdue to attitude problems, notpicking up routinely,
Slowing down—amount of donations (they are seeing how much they were wasting, so they are ordering less) such an interesting unintended consequence. A company called FoodEx, trying to take all of the close to date products pay for the food and sell it back to restaurants.
A large portion of our agencies are operated byretired, elderly volunteers or staff. The agingbase of the workforce that services our donorshas potential to negatively affect the retaildonation program. Moving and transportingdonations can be extremely laborious.
Food safety a critical piece for donor comfort (RE); marketingthe benefit to donors (quantifying benefit) is needed (MS);Volunteers needed from youth organizations - aren'tteenagers here to do all our heavy lifting anyway? :o) (AC)
How do agencies andother stakeholders feelabout how your programcurrently operates (incomparison to how itused to operate, ifapplicable)?
Strong relationships aren't always therebetween the donor and the agencies;stronger bond apparent between food bankdrivers and donors N/A No answer
Donors had a hard adjustment (alittle more legwork for thedonors);Agencies love it because ofincreased poundage
Agencies are pleased; Donors are happy after aninitial adjustment period N/A
Definitely an adjustment period--how to recognize that andmitigate it?(RE); effect on donors surprising in change towardagency-direct (MS); attention to relationships duringtransition needed (AC)
PITFALLS/BESTPRACTICE
What are the mainadvantages of yourcurrent food rescuemodel?
Ability to pick up more food than agenciesor food bank alone; total increase inpoundage
Consistent pickup; greatercontrol over relationships
No additional drivers/trucks; don’tneed a bigger building (noequipment)
They are distributing the poundsand getting food into thecommunity quickly
Allows more capacity for thedrivers Agencies can serve morepeople
Working with partner agencies to cover pick-upsis a major advantage for FASD. We are able toutilizes resources such as trucks, drivers, andcooler space that may otherwise be tied up ingrocery store pick-ups to both recover more bulkfoods (product amounts our agencies could nothandle) and distribute more food to ourcommunities.
More overall food seems like the big benefit here for agencydirect; more control better for food bank model (RE), Mixtureof models allows for shared capacity, freedom to pickuplarger donors (increased capacity), while also not wastingresources where agencies can provide transportationresources (MS); Accounting for cost of personnel seems likea large concern (AC)
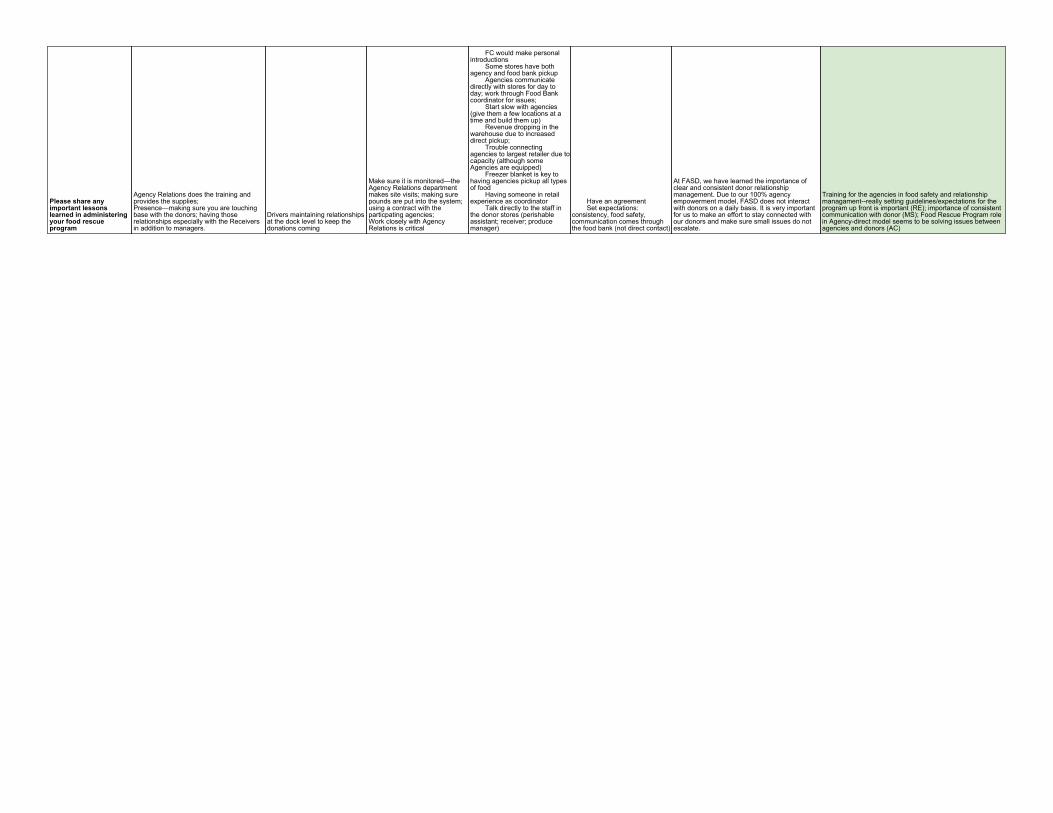
Please share anyimportant lessonslearned in administeringyour food rescueprogram
Agency Relations does the training andprovides the supplies;Presence—making sure you are touchingbase with the donors; having thoserelationships especially with the Receiversin addition to managers.
Drivers maintaining relationshipsat the dock level to keep thedonations coming
Make sure it is monitored—theAgency Relations departmentmakes site visits; making surepounds are put into the system;using a contract with theparticpating agencies;Work closely with AgencyRelations is critical
FC would make personalintroductions Some stores have bothagency and food bank pickup Agencies communicatedirectly with stores for day today; work through Food Bankcoordinator for issues; Start slow with agencies(give them a few locations at atime and build them up) Revenue dropping in thewarehouse due to increaseddirect pickup; Trouble connectingagencies to largest retailer due tocapacity (although someAgencies are equipped) Freezer blanket is key tohaving agencies pickup all typesof food Having someone in retailexperience as coordinator Talk directly to the staff inthe donor stores (perishableassistant; receiver; producemanager)
Have an agreement Set expectations:consistency, food safety,communication comes throughthe food bank (not direct contact)
At FASD, we have learned the importance ofclear and consistent donor relationshipmanagement. Due to our 100% agencyempowerment model, FASD does not interactwith donors on a daily basis. It is very importantfor us to make an effort to stay connected withour donors and make sure small issues do notescalate.
Training for the agencies in food safety and relationshipmanagament--really setting guidelines/expectations for theprogram up front is important (RE); importance of consistentcommunication with donor (MS); Food Rescue Program rolein Agency-direct model seems to be solving issues betweenagencies and donors (AC)
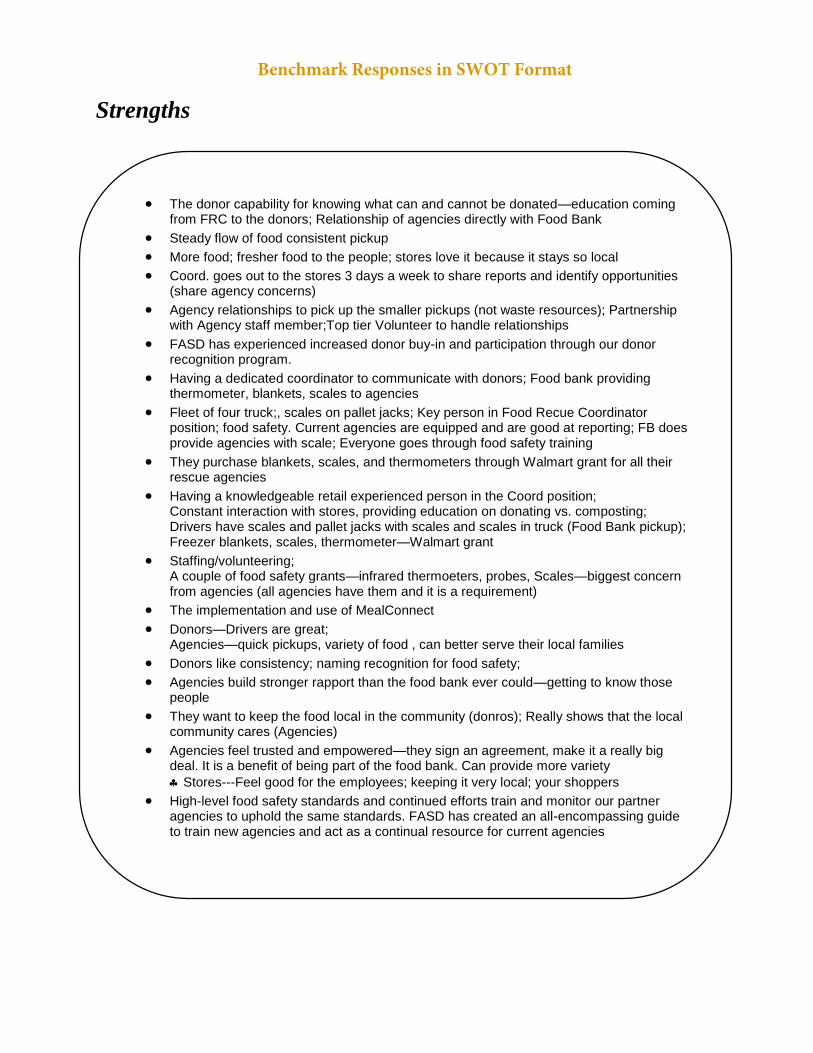
Strengths
The donor capability for knowing what can and cannot be donated—education comingfrom FRC to the donors; Relationship of agencies directly with Food Bank
Steady flow of food consistent pickup
More food; fresher food to the people; stores love it because it stays so local
Coord. goes out to the stores 3 days a week to share reports and identify opportunities(share agency concerns)
Agency relationships to pick up the smaller pickups (not waste resources); Partnershipwith Agency staff member;Top tier Volunteer to handle relationships
FASD has experienced increased donor buy-in and participation through our donorrecognition program.
Having a dedicated coordinator to communicate with donors; Food bank providingthermometer, blankets, scales to agencies
Fleet of four truck;, scales on pallet jacks; Key person in Food Recue Coordinatorposition; food safety. Current agencies are equipped and are good at reporting; FB doesprovide agencies with scale; Everyone goes through food safety training
They purchase blankets, scales, and thermometers through Walmart grant for all theirrescue agencies
Having a knowledgeable retail experienced person in the Coord position;Constant interaction with stores, providing education on donating vs. composting;Drivers have scales and pallet jacks with scales and scales in truck (Food Bank pickup);Freezer blankets, scales, thermometer—Walmart grant
Staffing/volunteering;A couple of food safety grants—infrared thermoeters, probes, Scales—biggest concernfrom agencies (all agencies have them and it is a requirement)
The implementation and use of MealConnect
Donors—Drivers are great;Agencies—quick pickups, variety of food , can better serve their local families
Donors like consistency; naming recognition for food safety;
Agencies build stronger rapport than the food bank ever could—getting to know thosepeople
They want to keep the food local in the community (donros); Really shows that the localcommunity cares (Agencies)
Agencies feel trusted and empowered—they sign an agreement, make it a really bigdeal. It is a benefit of being part of the food bank. Can provide more variety
Stores---Feel good for the employees; keeping it very local; your shoppers
High-level food safety standards and continued efforts train and monitor our partneragencies to uphold the same standards. FASD has created an all-encompassing guideto train new agencies and act as a continual resource for current agencies
Benchmark Responses in SWOT Format
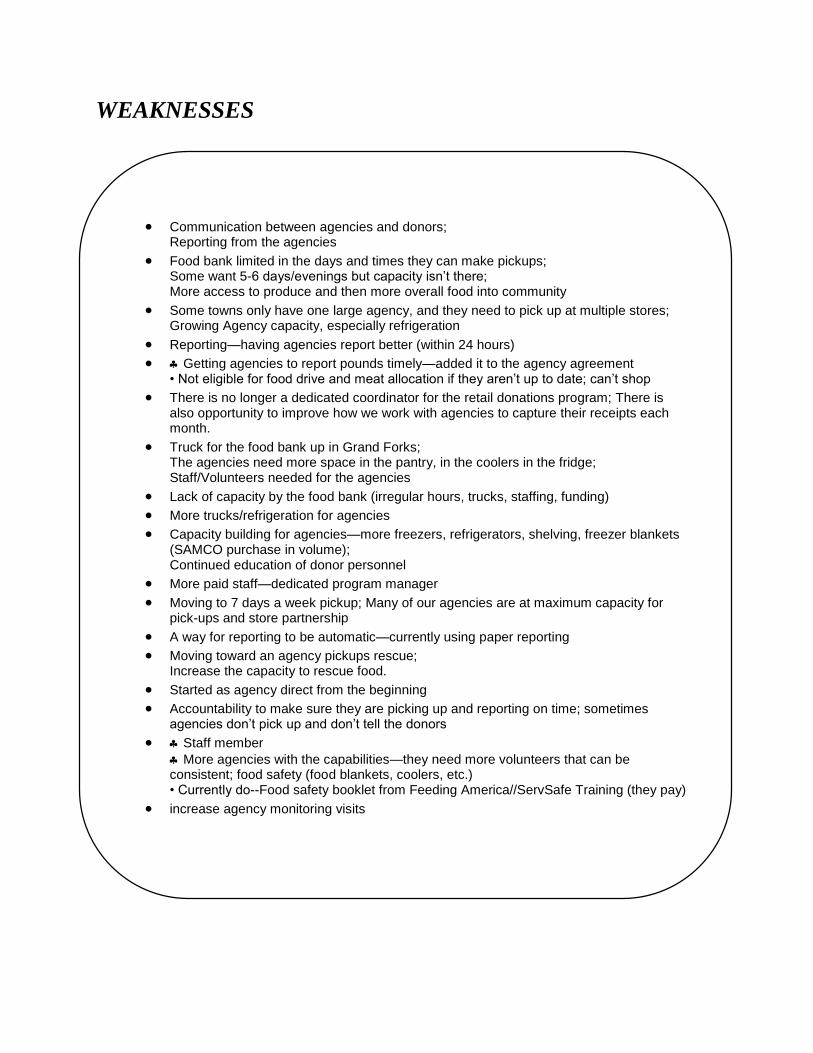
WEAKNESSES
Communication between agencies and donors;Reporting from the agencies
Food bank limited in the days and times they can make pickups;Some want 5-6 days/evenings but capacity isn’t there;More access to produce and then more overall food into community
Some towns only have one large agency, and they need to pick up at multiple stores;Growing Agency capacity, especially refrigeration
Reporting—having agencies report better (within 24 hours)
Getting agencies to report pounds timely—added it to the agency agreement • Not eligible for food drive and meat allocation if they aren’t up to date; can’t shop
There is no longer a dedicated coordinator for the retail donations program; There isalso opportunity to improve how we work with agencies to capture their receipts eachmonth.
Truck for the food bank up in Grand Forks;The agencies need more space in the pantry, in the coolers in the fridge;Staff/Volunteers needed for the agencies
Lack of capacity by the food bank (irregular hours, trucks, staffing, funding)
More trucks/refrigeration for agencies
Capacity building for agencies—more freezers, refrigerators, shelving, freezer blankets(SAMCO purchase in volume);Continued education of donor personnel
More paid staff—dedicated program manager
Moving to 7 days a week pickup; Many of our agencies are at maximum capacity forpick-ups and store partnership
A way for reporting to be automatic—currently using paper reporting
Moving toward an agency pickups rescue;Increase the capacity to rescue food.
Started as agency direct from the beginning
Accountability to make sure they are picking up and reporting on time; sometimesagencies don’t pick up and don’t tell the donors
Staff member
More agencies with the capabilities—they need more volunteers that can beconsistent; food safety (food blankets, coolers, etc.) • Currently do--Food safety booklet from Feeding America//ServSafe Training (they pay)
increase agency monitoring visits
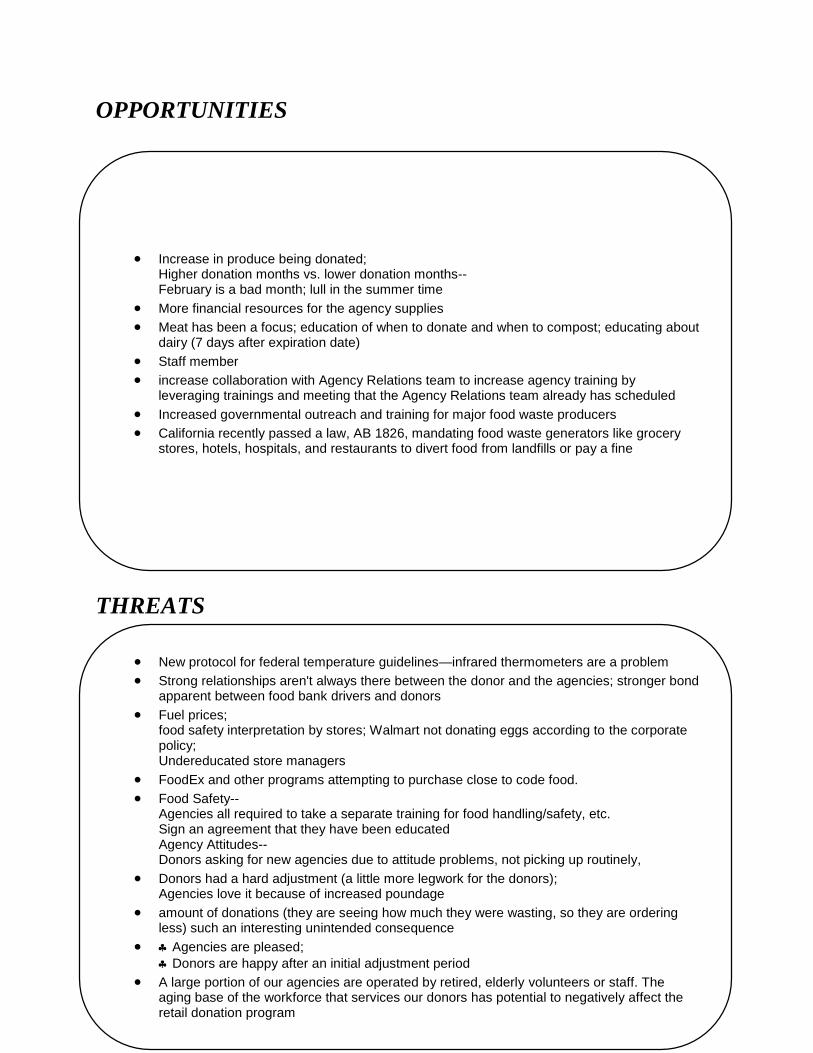
OPPORTUNITIES
THREATS
Increase in produce being donated;Higher donation months vs. lower donation months--February is a bad month; lull in the summer time
More financial resources for the agency supplies
Meat has been a focus; education of when to donate and when to compost; educating aboutdairy (7 days after expiration date)
Staff member
increase collaboration with Agency Relations team to increase agency training byleveraging trainings and meeting that the Agency Relations team already has scheduled
Increased governmental outreach and training for major food waste producers
California recently passed a law, AB 1826, mandating food waste generators like grocerystores, hotels, hospitals, and restaurants to divert food from landfills or pay a fine
New protocol for federal temperature guidelines—infrared thermometers are a problem
Strong relationships aren't always there between the donor and the agencies; stronger bondapparent between food bank drivers and donors
Fuel prices;food safety interpretation by stores; Walmart not donating eggs according to the corporatepolicy;Undereducated store managers
FoodEx and other programs attempting to purchase close to code food.
Food Safety--Agencies all required to take a separate training for food handling/safety, etc.Sign an agreement that they have been educatedAgency Attitudes--Donors asking for new agencies due to attitude problems, not picking up routinely,
Donors had a hard adjustment (a little more legwork for the donors);Agencies love it because of increased poundage
amount of donations (they are seeing how much they were wasting, so they are orderingless) such an interesting unintended consequence
Agencies are pleased;
Donors are happy after an initial adjustment period
A large portion of our agencies are operated by retired, elderly volunteers or staff. Theaging base of the workforce that services our donors has potential to negatively affect theretail donation program
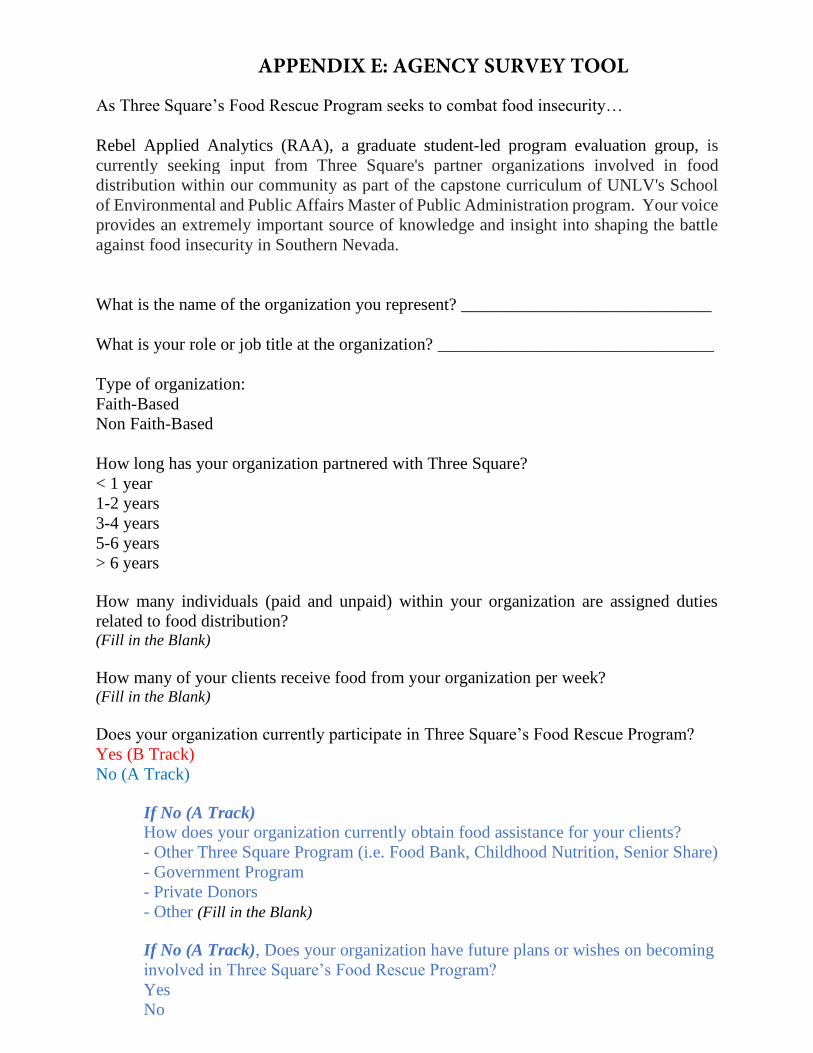
APPENDIX E: AGENCY SURVEY TOOL
As Three Square’s Food Rescue Program seeks to combat food insecurity…
Rebel Applied Analytics (RAA), a graduate student-led program evaluation group, is
currently seeking input from Three Square's partner organizations involved in food
distribution within our community as part of the capstone curriculum of UNLV's School
of Environmental and Public Affairs Master of Public Administration program. Your voice
provides an extremely important source of knowledge and insight into shaping the battle
against food insecurity in Southern Nevada.
What is the name of the organization you represent? _____________________________
What is your role or job title at the organization? ________________________________
Type of organization:
Faith-Based
Non Faith-Based
How long has your organization partnered with Three Square?
< 1 year
1-2 years
3-4 years
5-6 years
> 6 years
How many individuals (paid and unpaid) within your organization are assigned duties
related to food distribution? (Fill in the Blank)
How many of your clients receive food from your organization per week? (Fill in the Blank)
Does your organization currently participate in Three Square’s Food Rescue Program?
Yes (B Track)
No (A Track)
If No (A Track) How does your organization currently obtain food assistance for your clients?
- Other Three Square Program (i.e. Food Bank, Childhood Nutrition, Senior Share)
- Government Program
- Private Donors
- Other (Fill in the Blank)
If No (A Track), Does your organization have future plans or wishes on becoming
involved in Three Square’s Food Rescue Program?
Yes
No
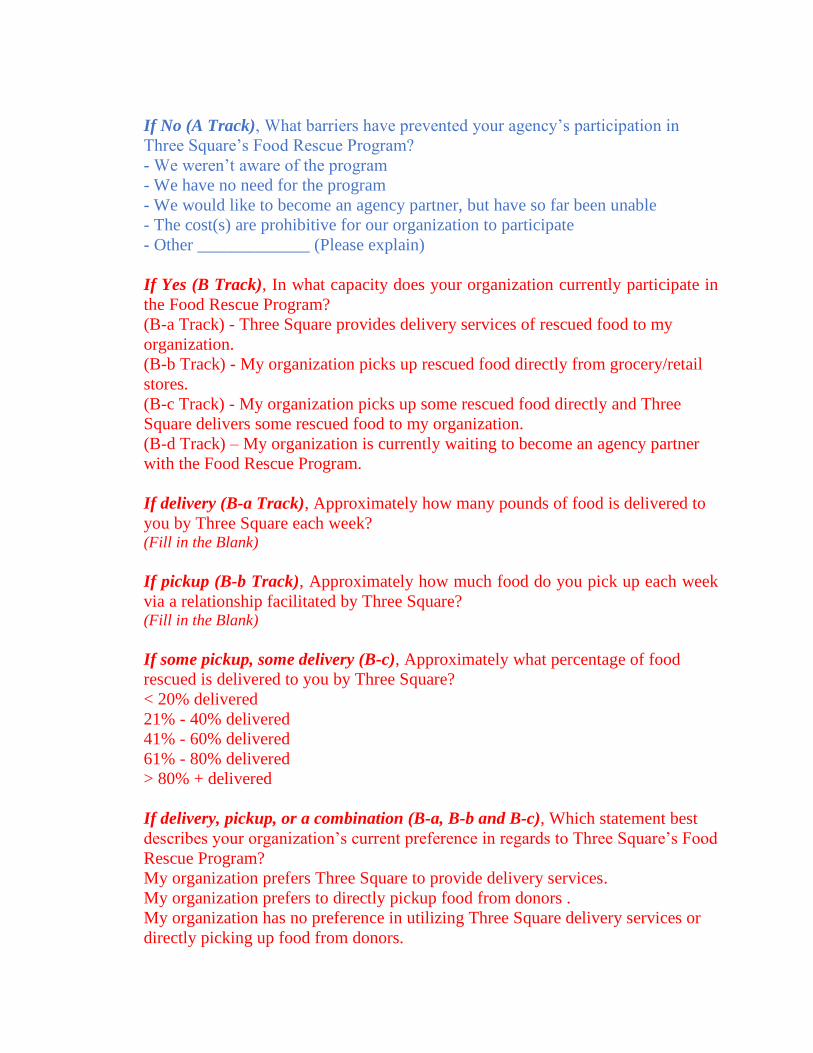
If No (A Track), What barriers have prevented your agency’s participation in
Three Square’s Food Rescue Program?
- We weren’t aware of the program
- We have no need for the program
- We would like to become an agency partner, but have so far been unable
- The cost(s) are prohibitive for our organization to participate
- Other _____________ (Please explain)
If Yes (B Track), In what capacity does your organization currently participate in
the Food Rescue Program?
(B-a Track) - Three Square provides delivery services of rescued food to my
organization.
(B-b Track) - My organization picks up rescued food directly from grocery/retail
stores.
(B-c Track) - My organization picks up some rescued food directly and Three
Square delivers some rescued food to my organization.
(B-d Track) – My organization is currently waiting to become an agency partner
with the Food Rescue Program.
If delivery (B-a Track), Approximately how many pounds of food is delivered to
you by Three Square each week? (Fill in the Blank)
If pickup (B-b Track), Approximately how much food do you pick up each week
via a relationship facilitated by Three Square? (Fill in the Blank)
If some pickup, some delivery (B-c), Approximately what percentage of food
rescued is delivered to you by Three Square?
< 20% delivered
21% - 40% delivered
41% - 60% delivered
61% - 80% delivered
> 80% + delivered
If delivery, pickup, or a combination (B-a, B-b and B-c), Which statement best
describes your organization’s current preference in regards to Three Square’s Food
Rescue Program?
My organization prefers Three Square to provide delivery services.
My organization prefers to directly pickup food from donors .
My organization has no preference in utilizing Three Square delivery services or
directly picking up food from donors.
If waitlist (B-d Track) or Track A from the beginning, In which of the following
ways would your agency be able to participate in Food Rescue, given the opportunity?
(Be able to check more than one box.)
As an agency partner with Three Square delivering rescued food
As an agency partner directly picking up food from donors facilitated through
Three Square
As an agency partner utilizing either Three Square delivery services or directly
picking up food from donors
Other ______________ (Please Explain)
If delivery or a combination (B-a, B-c), How would you describe your
organization’s experience with Three Square’s delivery services of rescued food?
Likert Scale Far from: Extremely Dissatisfied to Extremely Satisfied
If pickup or a combination (B-b, B-c), How would you describe your
organization’s experience with Three Square’s facilitation of direct pickup of
rescued food from retailers?
Likert Scale Far from Extremely Dissatisfied to Extremely Satisfied
At the current time, without implementing significant programmatic change, could
your organization distribute additional food from the Food Rescue Program if it
was available?
No
Yes: (fill in the blank) more pounds per week.
If Three Square currently delivers all or most of the rescued food you are able to
distribute (Tracks B-a and B-c), would you be able to switch to picking up the food
directly from the grocery/retail stores?
Yes
No
Maybe
Which methods of food transportation are currently available to your organization?
(Select all that apply):
Refrigerated Van or Truck (Organization owned)
Non-Refrigerated Van or Truck (Organization owned)
Average-Sized non-commercial Car (Organization owned)
Refrigerated Van or Truck (Volunteer owned)
Non-Refrigerated Van or Truck (Volunteer owned)
Average-Sized non-commercial Car (Volunteer owned)
Select all the items your organization currently utilizes (Select all that apply):
Food Weight Scale(s)
Freezer Blanket(s)
-How many? (fill in the blank)
Thermometer(s)
Commercial Dolly or Floor Jack
Refrigerator(s)
-How many? (fill in the blank)
Freezer(s)
-How many? (fill in the blank)
Cabinets/Shelving
-How much space? (fill in the blank)
Over the next five years, what percentage increase (if any) in food distribution does your
organization foresee?
None
(Fill in the blank %)
Produce
Bread
Fresh Meat
Canned Meat (Tuna, Chicken, Ham, Spam)
Canned Soup
Dry and Canned Beans
Rice
Pasta
Cheese
Other (Fill in the blank)
Do you have any other comments or suggestions related to Three Square’s Food Rescue
Program?
(Fill in the blank)
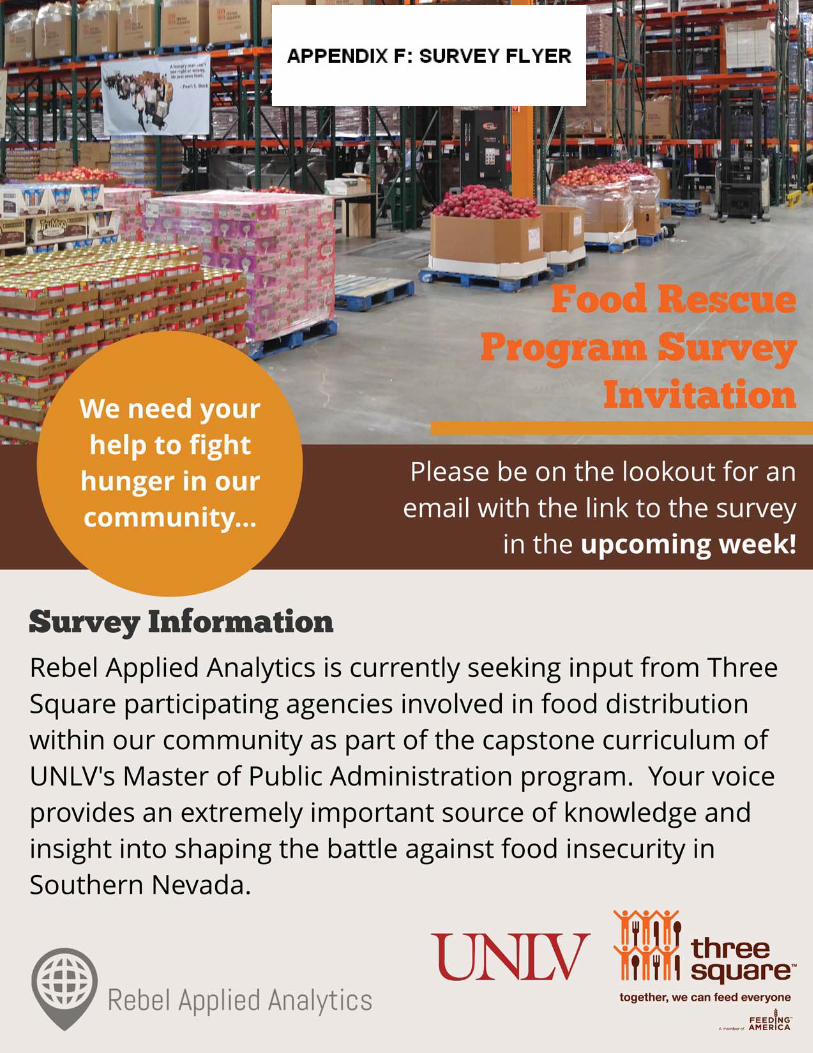
F
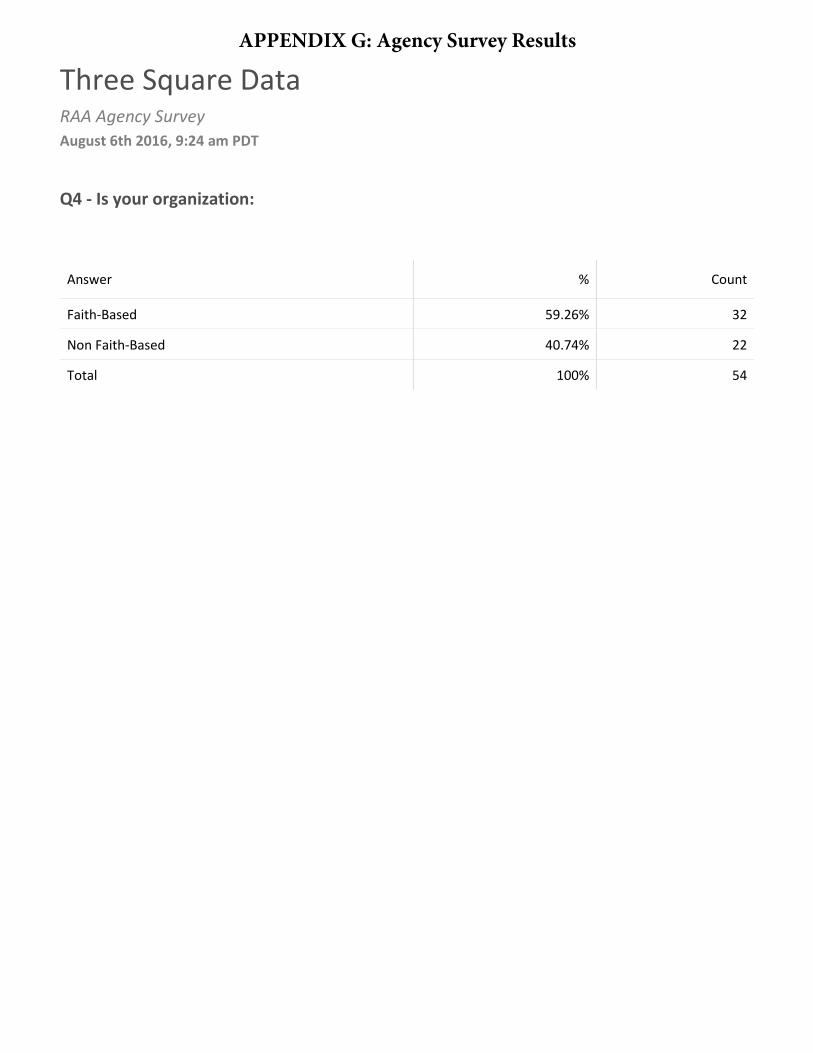
Three Square DataRAA Agency Survey
August 6th 2016, 9:24 am PDT
Q4 - Is your organization:
Answer % Count
Faith-Based 59.26% 32
Non Faith-Based 40.74% 22
Total 100% 54
APPENDIX G: Agency Survey Results
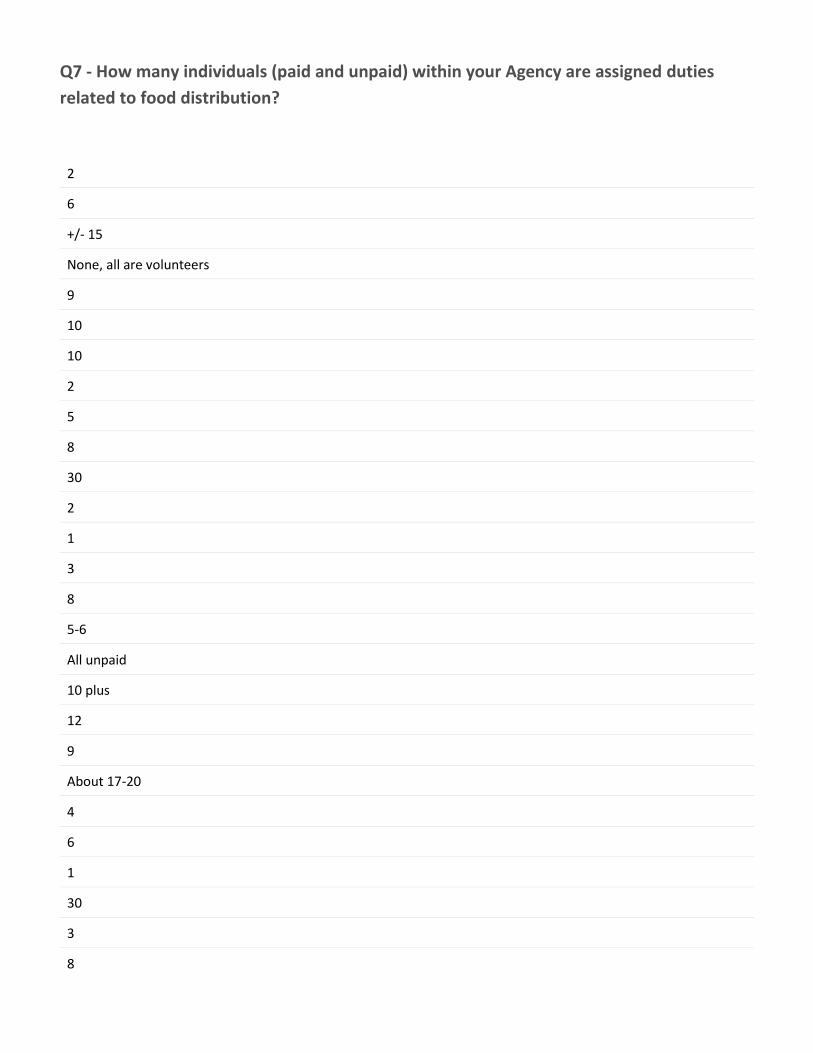
Q7 - How many individuals (paid and unpaid) within your Agency are assigned duties
related to food distribution?
2
6
+/- 15
None, all are volunteers
9
10
10
2
5
8
30
2
1
3
8
5-6
All unpaid
10 plus
12
9
About 17-20
4
6
1
30
3
8

2
35
12-15 unpaid 0 paid
100
60
20
4
12
25
13
3
six
5
10
25
n/a
two
12
10

Q8 - How many clients receive food from your Agency each week?
3
5-15
Approximately 150
125 to 150 families. 580 + individuals
45 to 5o families
75
12
10-12
150
16
8-10
over 800 clients
43 kids for the Meet and Eat up Program Pantry quarterly we serve 200 plus families
16
12
650
550
We have a closed program that delivers produce once a month to low income senior housing.
Average 214
75 families 200 people
350
525 to 600
At least 250 a month
30
113
150
110 to 125 on average
17
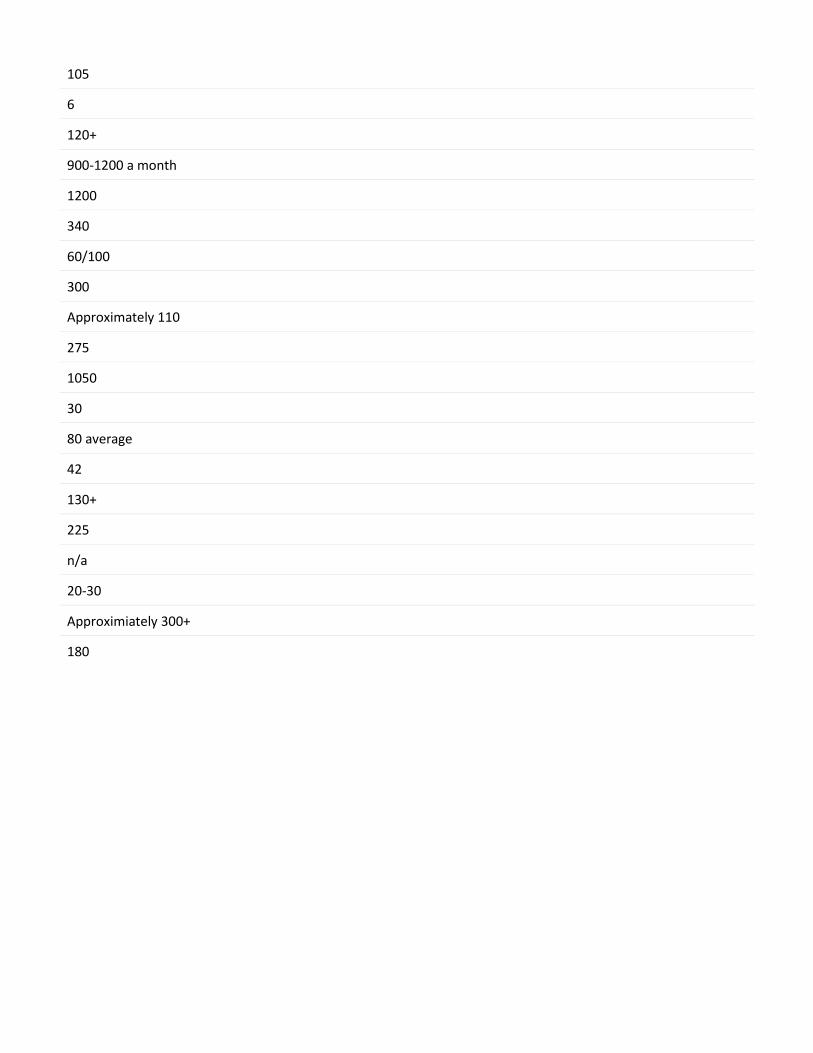
105
6
120+
900-1200 a month
1200
340
60/100
300
Approximately 110
275
1050
30
80 average
42
130+
225
n/a
20-30
Approximiately 300+
180
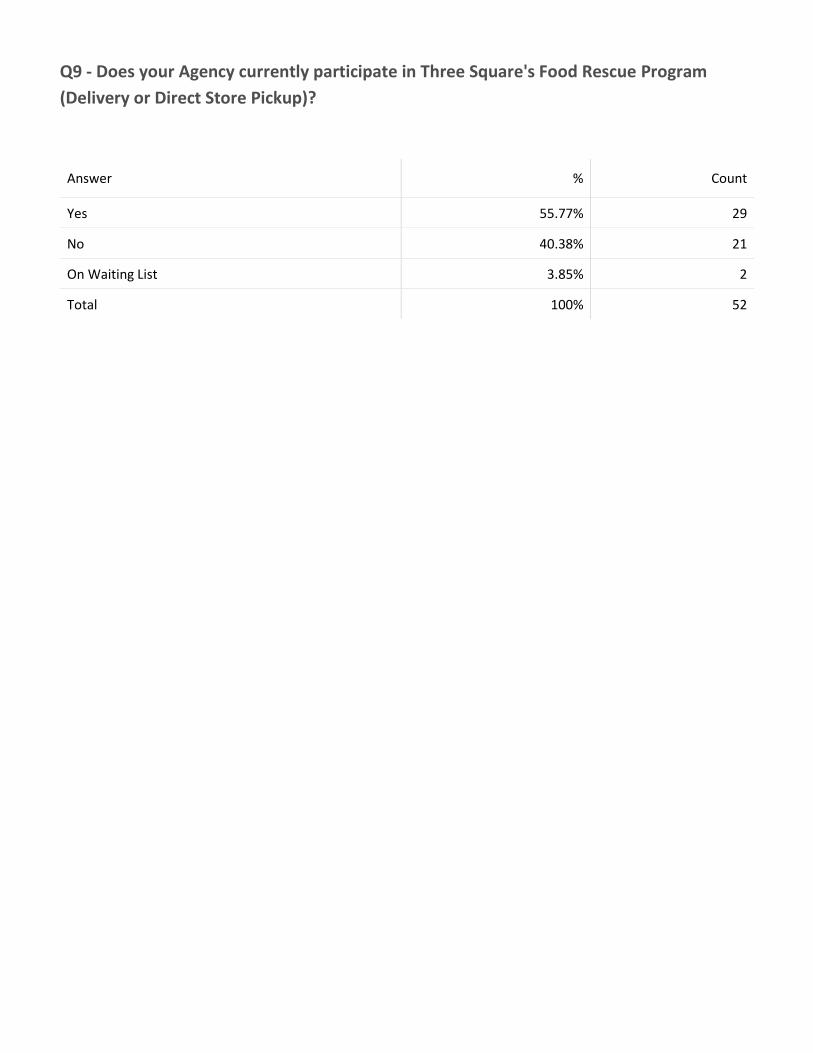
Q9 - Does your Agency currently participate in Three Square's Food Rescue Program
(Delivery or Direct Store Pickup)?
Answer % Count
Yes 55.77% 29
No 40.38% 21
On Waiting List 3.85% 2
Total 100% 52
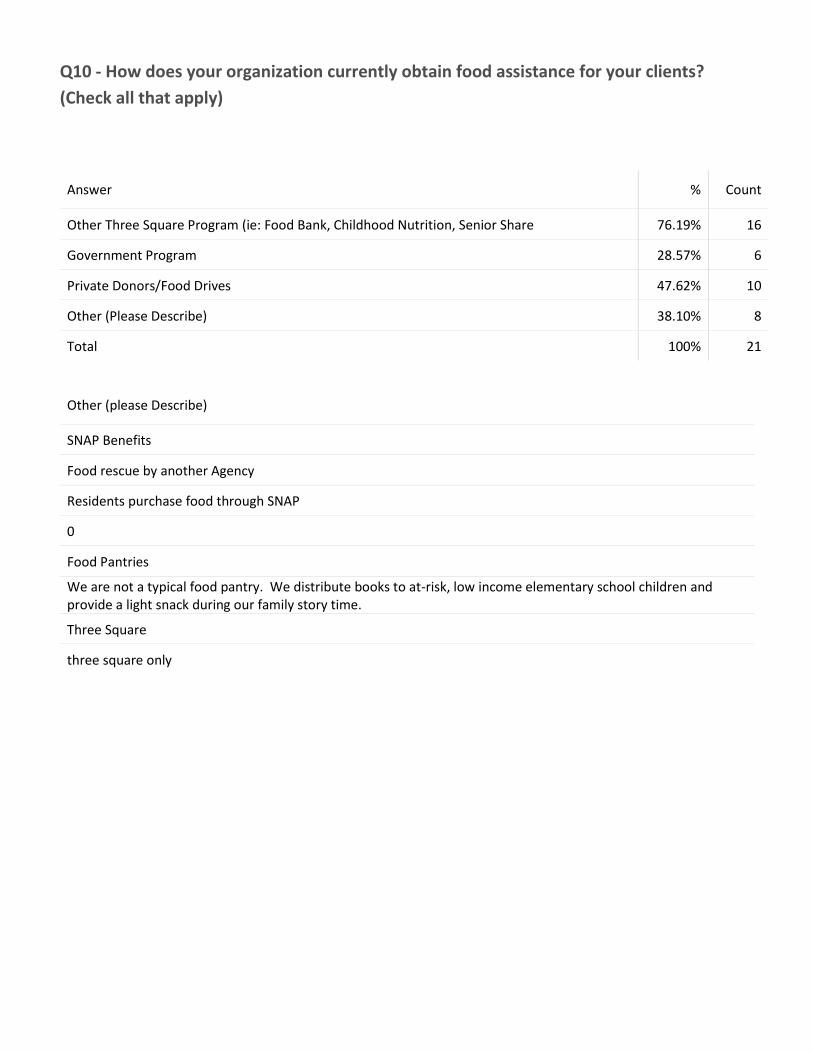
Q10 - How does your organization currently obtain food assistance for your clients?
(Check all that apply)
Answer % Count
Other Three Square Program (ie: Food Bank, Childhood Nutrition, Senior Share 76.19% 16
Government Program 28.57% 6
Private Donors/Food Drives 47.62% 10
Other (Please Describe) 38.10% 8
Total 100% 21
Other (please Describe)
SNAP Benefits
Food rescue by another Agency
Residents purchase food through SNAP
0
Food Pantries
We are not a typical food pantry. We distribute books to at-risk, low income elementary school children and provide a light snack during our family story time.
Three Square
three square only
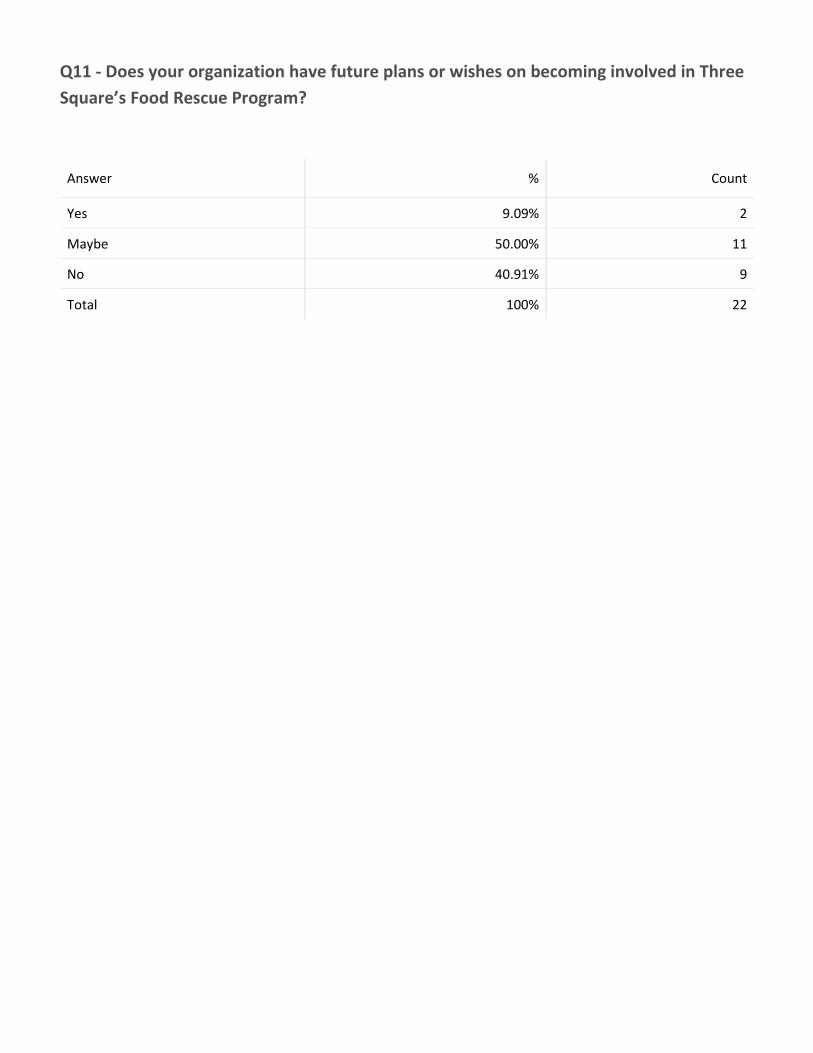
Q11 - Does your organization have future plans or wishes on becoming involved in Three
Square’s Food Rescue Program?
Answer % Count
Yes 9.09% 2
Maybe 50.00% 11
No 40.91% 9
Total 100% 22
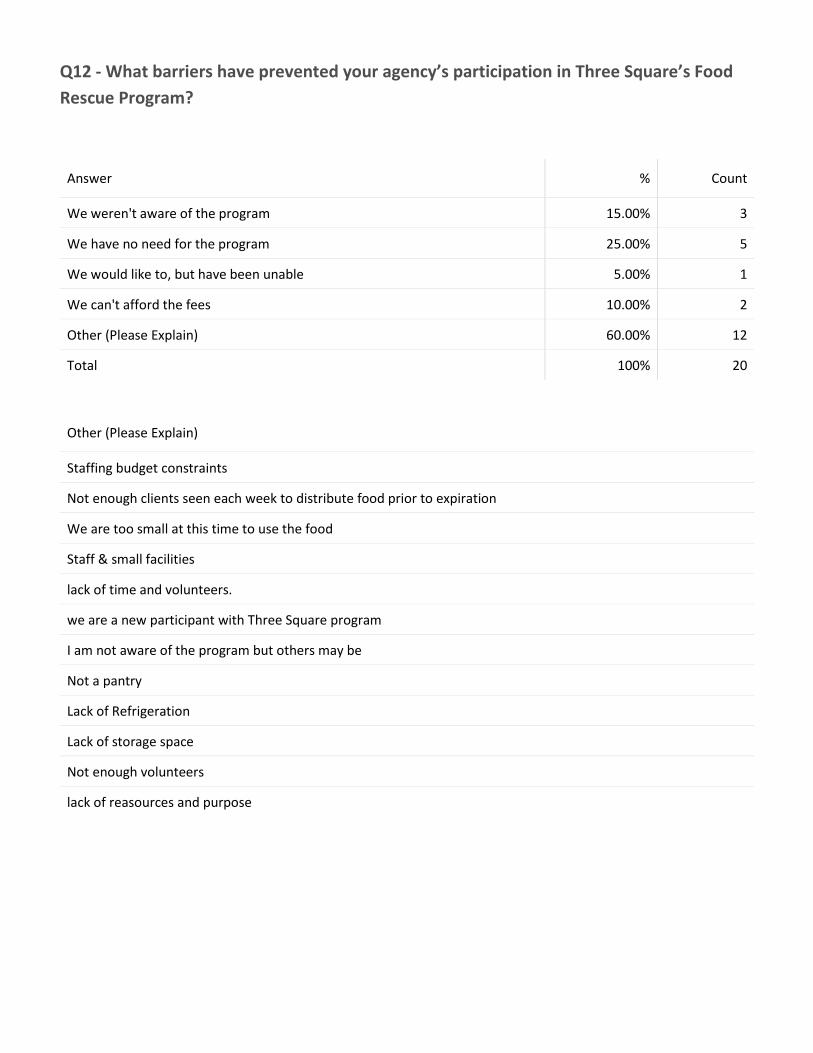
Q12 - What barriers have prevented your agency’s participation in Three Square’s Food
Rescue Program?
Answer % Count
We weren't aware of the program 15.00% 3
We have no need for the program 25.00% 5
We would like to, but have been unable 5.00% 1
We can't afford the fees 10.00% 2
Other (Please Explain) 60.00% 12
Total 100% 20
Other (Please Explain)
Staffing budget constraints
Not enough clients seen each week to distribute food prior to expiration
We are too small at this time to use the food
Staff & small facilities
lack of time and volunteers.
we are a new participant with Three Square program
I am not aware of the program but others may be
Not a pantry
Lack of Refrigeration
Lack of storage space
Not enough volunteers
lack of reasources and purpose
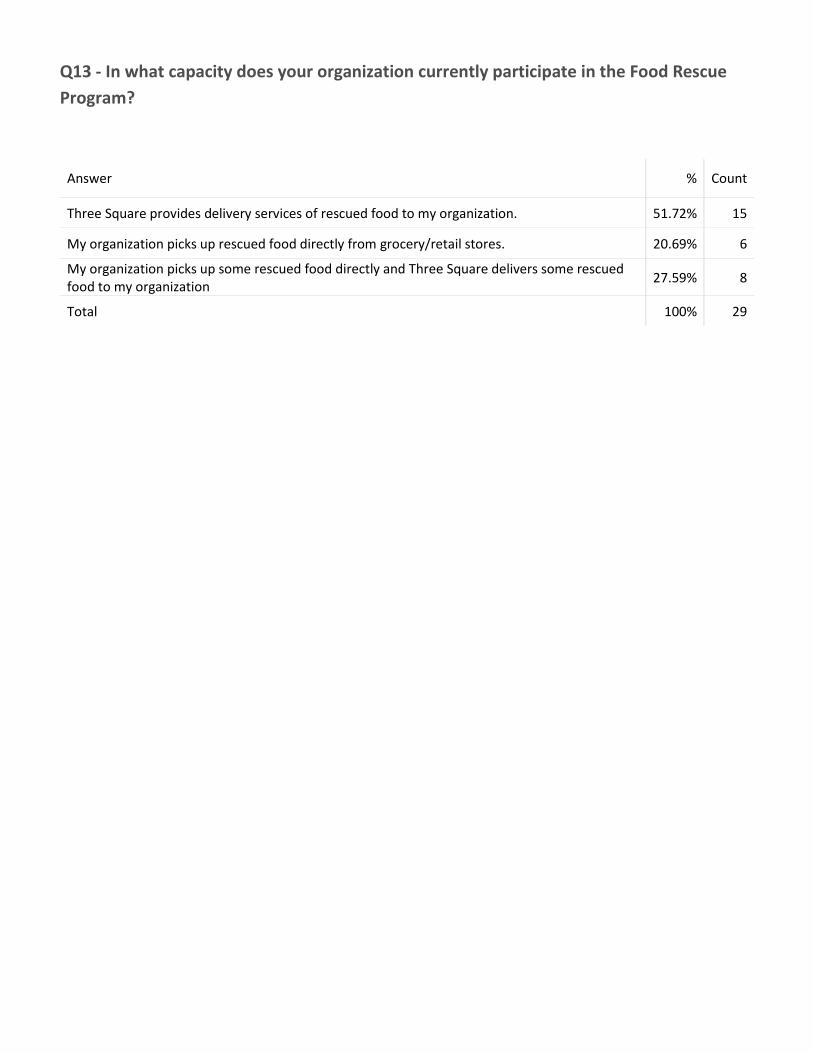
Q13 - In what capacity does your organization currently participate in the Food Rescue
Program?
Answer % Count
Three Square provides delivery services of rescued food to my organization. 51.72% 15
My organization picks up rescued food directly from grocery/retail stores. 20.69% 6
My organization picks up some rescued food directly and Three Square delivers some rescued food to my organization
27.59% 8
Total 100% 29
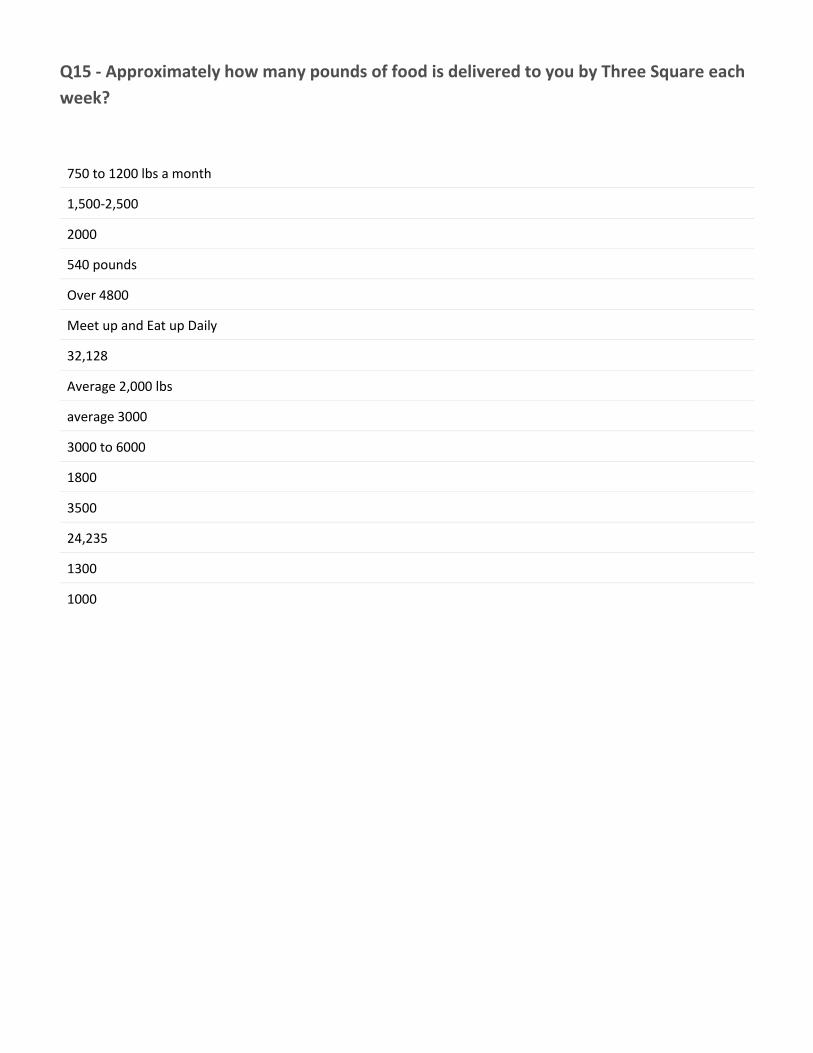
Q15 - Approximately how many pounds of food is delivered to you by Three Square each
week?
750 to 1200 lbs a month
1,500-2,500
2000
540 pounds
Over 4800
Meet up and Eat up Daily
32,128
Average 2,000 lbs
average 3000
3000 to 6000
1800
3500
24,235
1300
1000
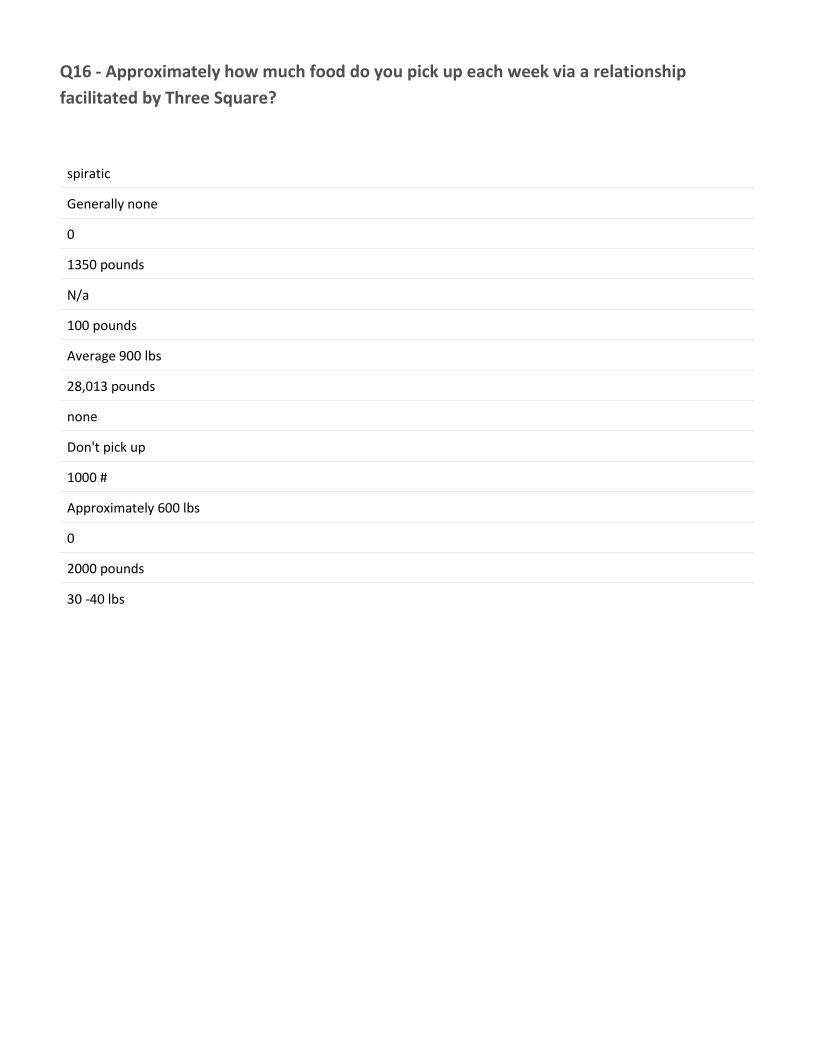
Q16 - Approximately how much food do you pick up each week via a relationship
facilitated by Three Square?
spiratic
Generally none
0
1350 pounds
N/a
100 pounds
Average 900 lbs
28,013 pounds
none
Don't pick up
1000 #
Approximately 600 lbs
0
2000 pounds
30 -40 lbs
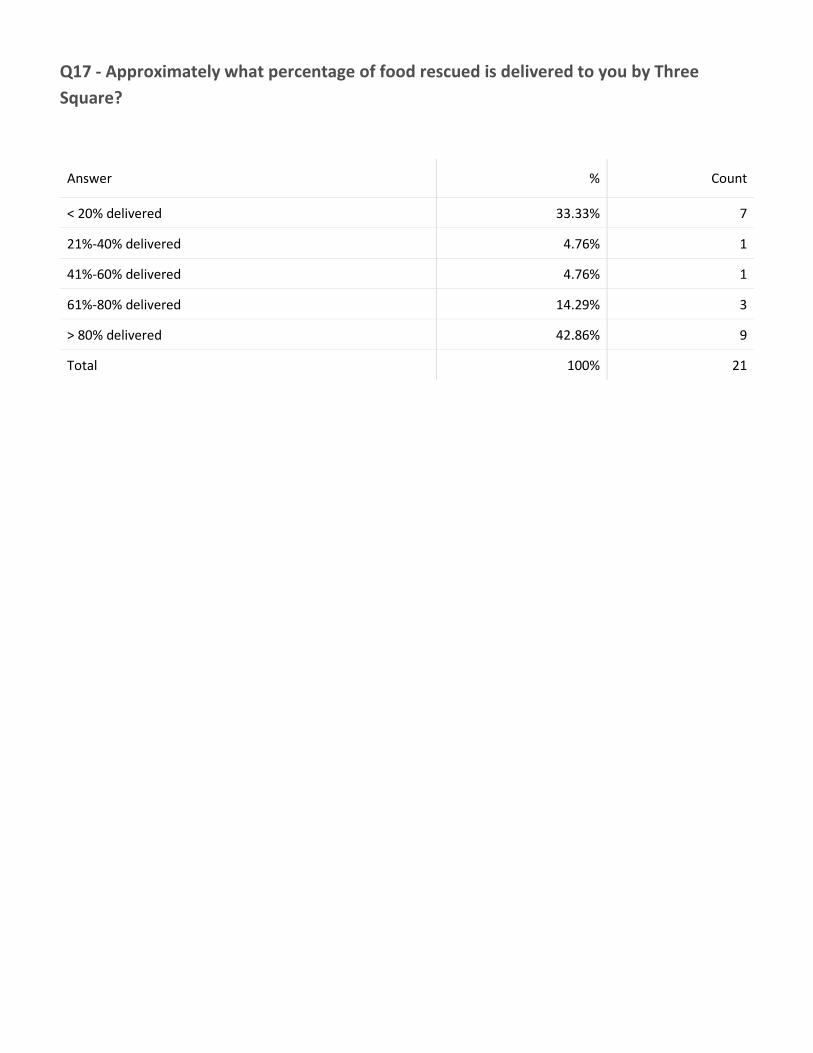
Q17 - Approximately what percentage of food rescued is delivered to you by Three
Square?
Answer % Count
< 20% delivered 33.33% 7
21%-40% delivered 4.76% 1
41%-60% delivered 4.76% 1
61%-80% delivered 14.29% 3
> 80% delivered 42.86% 9
Total 100% 21
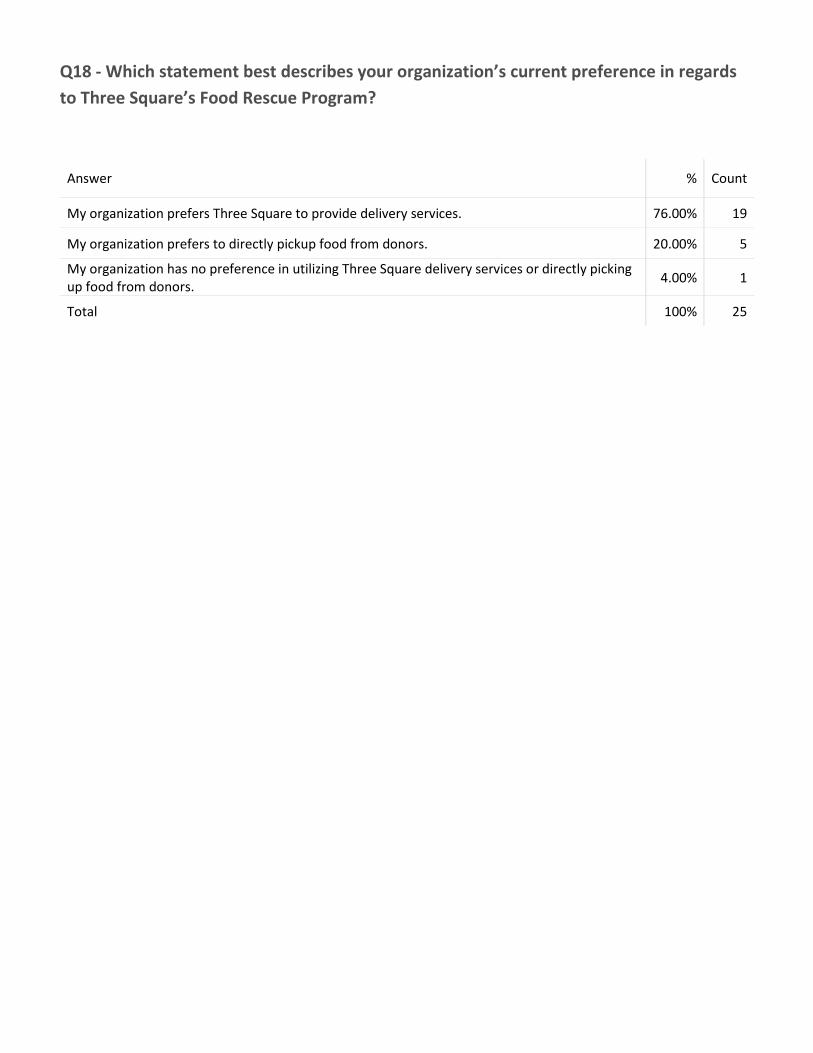
Q18 - Which statement best describes your organization’s current preference in regards
to Three Square’s Food Rescue Program?
Answer % Count
My organization prefers Three Square to provide delivery services. 76.00% 19
My organization prefers to directly pickup food from donors. 20.00% 5
My organization has no preference in utilizing Three Square delivery services or directly picking up food from donors.
4.00% 1
Total 100% 25
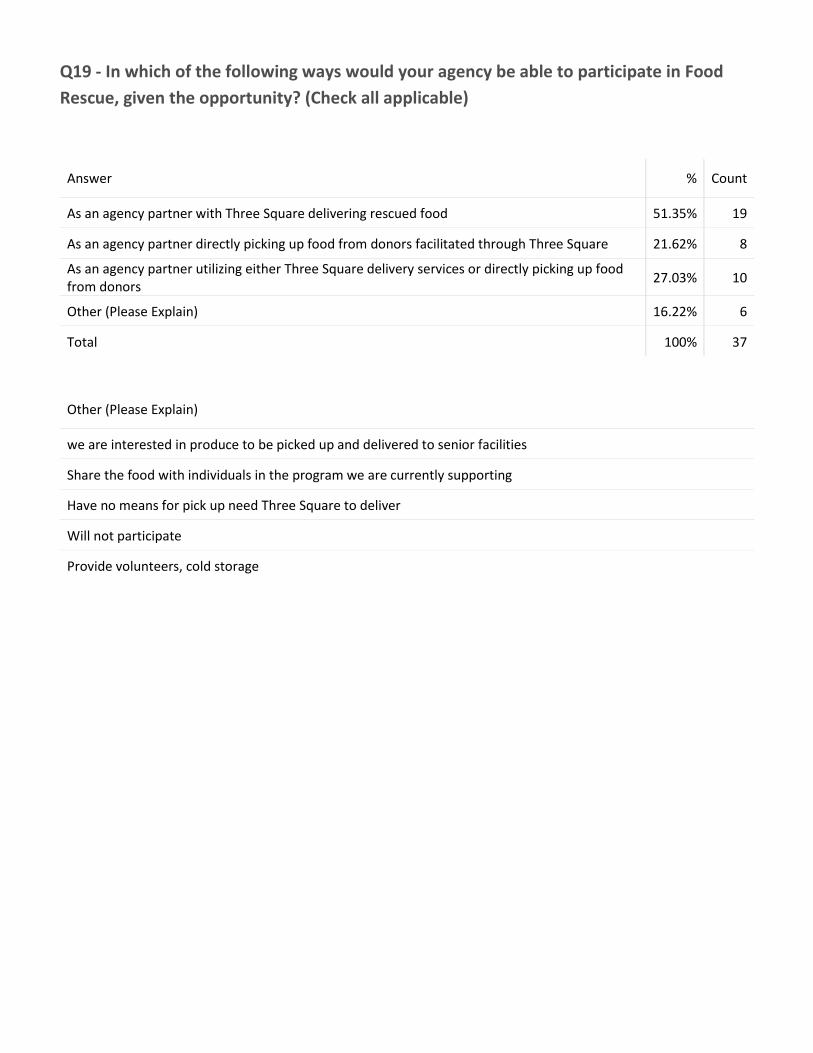
Q19 - In which of the following ways would your agency be able to participate in Food
Rescue, given the opportunity? (Check all applicable)
Answer % Count
As an agency partner with Three Square delivering rescued food 51.35% 19
As an agency partner directly picking up food from donors facilitated through Three Square 21.62% 8
As an agency partner utilizing either Three Square delivery services or directly picking up food from donors
27.03% 10
Other (Please Explain) 16.22% 6
Total 100% 37
Other (Please Explain)
we are interested in produce to be picked up and delivered to senior facilities
Share the food with individuals in the program we are currently supporting
Have no means for pick up need Three Square to deliver
Will not participate
Provide volunteers, cold storage
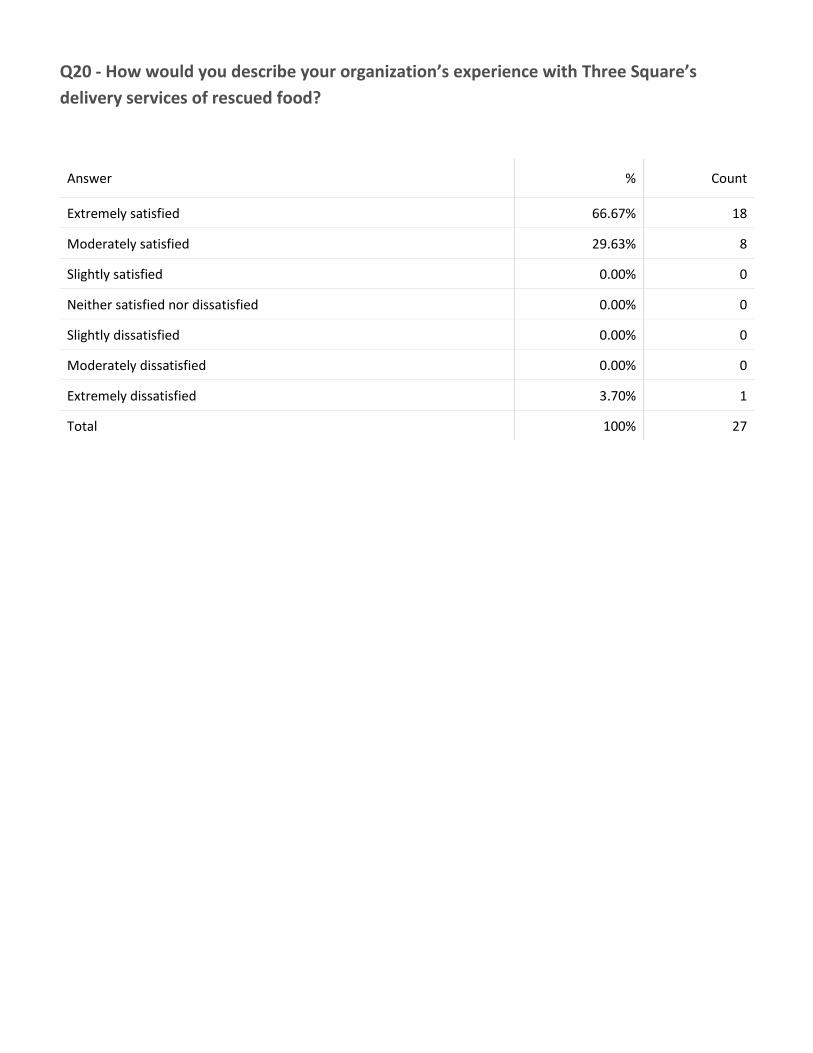
Q20 - How would you describe your organization’s experience with Three Square’s
delivery services of rescued food?
Answer % Count
Extremely satisfied 66.67% 18
Moderately satisfied 29.63% 8
Slightly satisfied 0.00% 0
Neither satisfied nor dissatisfied 0.00% 0
Slightly dissatisfied 0.00% 0
Moderately dissatisfied 0.00% 0
Extremely dissatisfied 3.70% 1
Total 100% 27
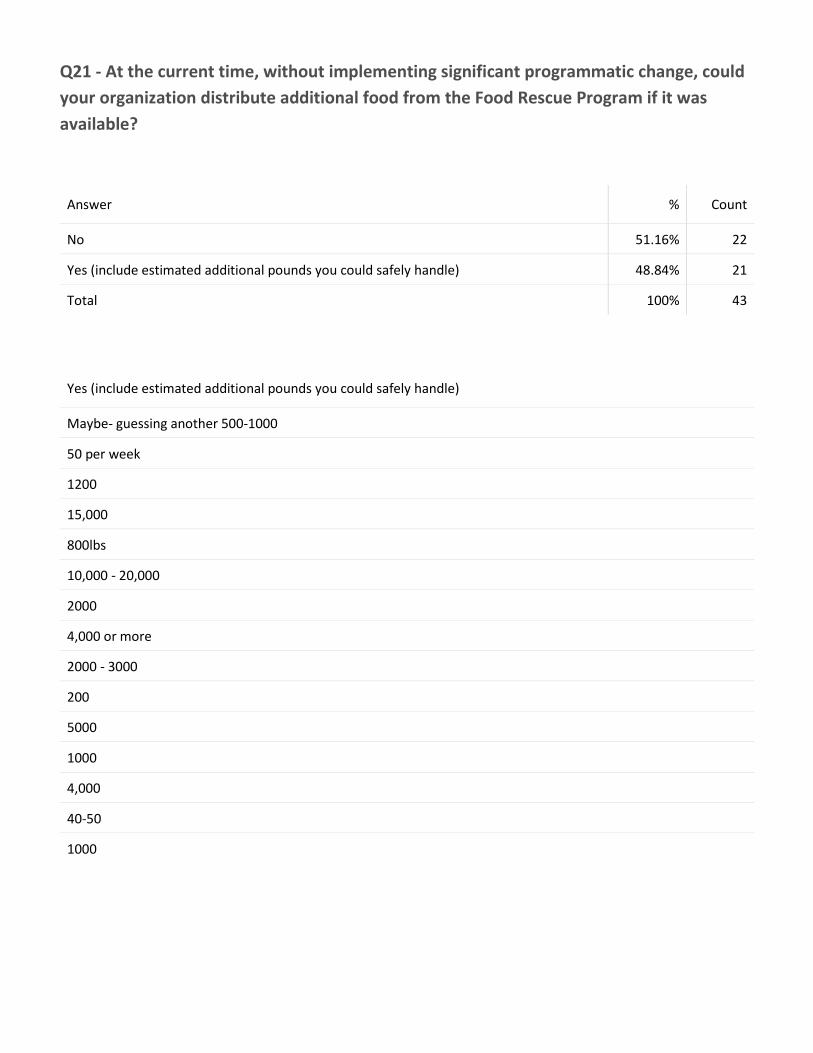
Q21 - At the current time, without implementing significant programmatic change, could
your organization distribute additional food from the Food Rescue Program if it was
available?
Answer % Count
No 51.16% 22
Yes (include estimated additional pounds you could safely handle) 48.84% 21
Total 100% 43
Yes (include estimated additional pounds you could safely handle)
Maybe- guessing another 500-1000
50 per week
1200
15,000
800lbs
10,000 - 20,000
2000
4,000 or more
2000 - 3000
200
5000
1000
4,000
40-50
1000
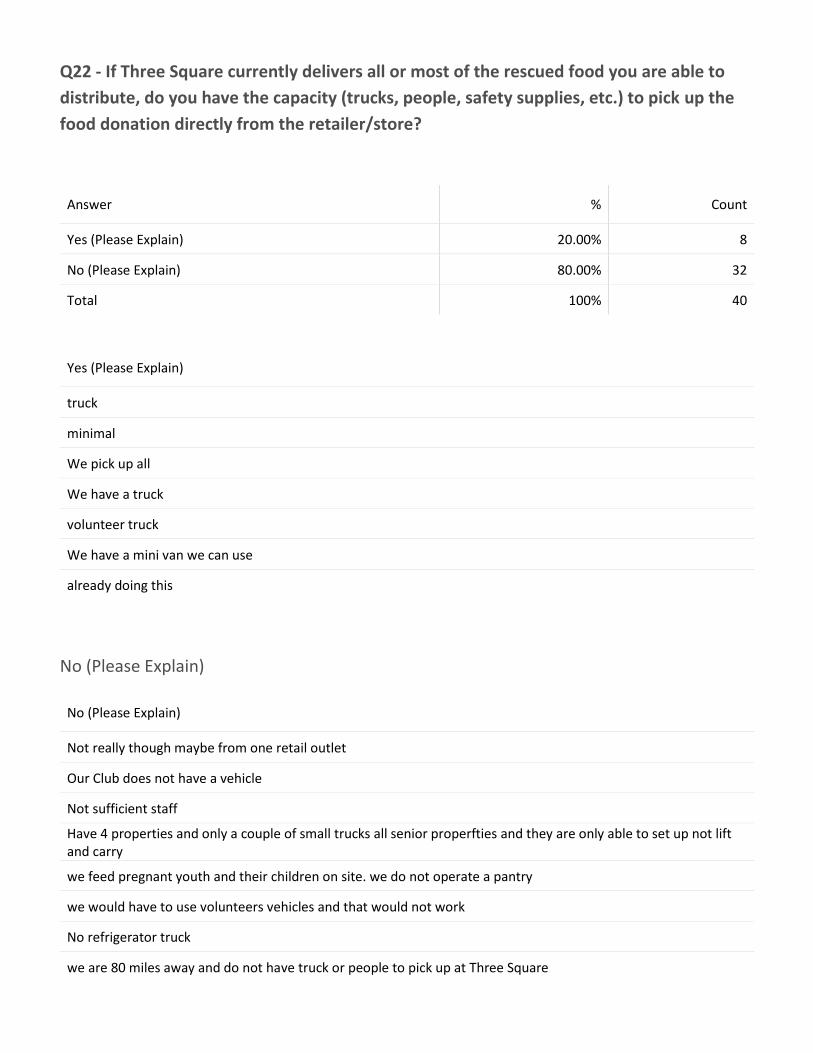
Q22 - If Three Square currently delivers all or most of the rescued food you are able to
distribute, do you have the capacity (trucks, people, safety supplies, etc.) to pick up the
food donation directly from the retailer/store?
Answer % Count
Yes (Please Explain) 20.00% 8
No (Please Explain) 80.00% 32
Total 100% 40
Yes (Please Explain)
truck
minimal
We pick up all
We have a truck
volunteer truck
We have a mini van we can use
already doing this
No (Please Explain)
No (Please Explain)
Not really though maybe from one retail outlet
Our Club does not have a vehicle
Not sufficient staff
Have 4 properties and only a couple of small trucks all senior properfties and they are only able to set up not lift and carry
we feed pregnant youth and their children on site. we do not operate a pantry
we would have to use volunteers vehicles and that would not work
No refrigerator truck
we are 80 miles away and do not have truck or people to pick up at Three Square
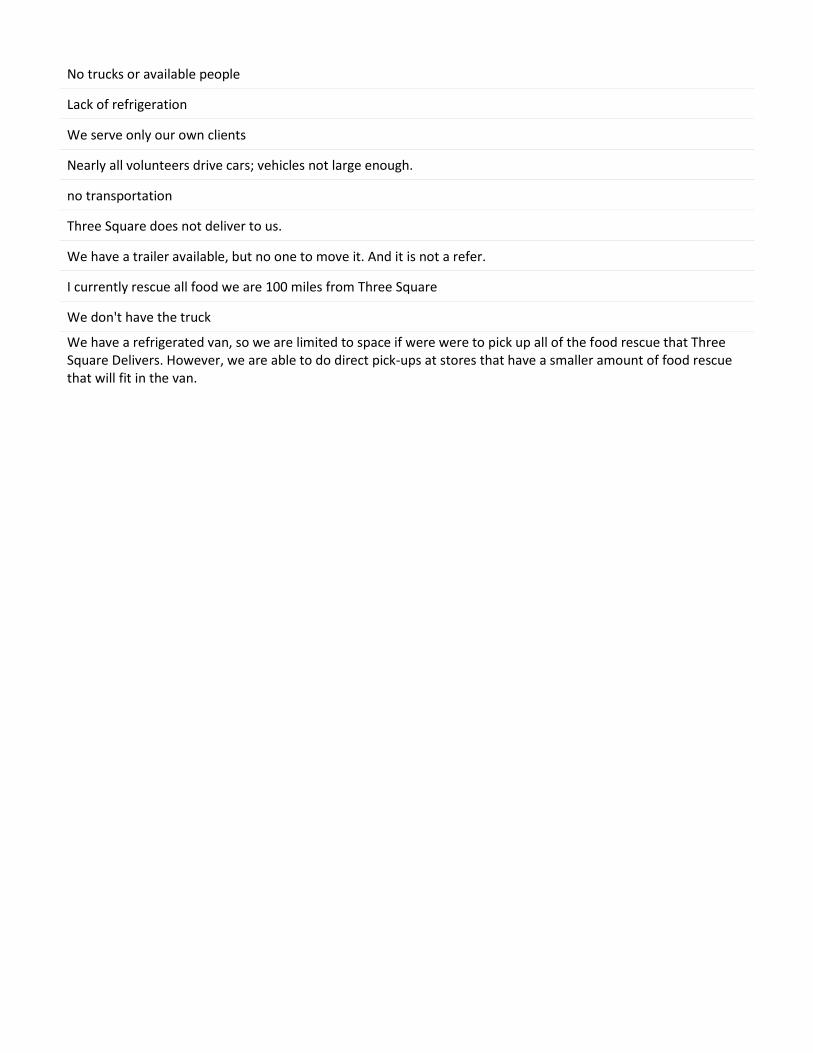
No trucks or available people
Lack of refrigeration
We serve only our own clients
Nearly all volunteers drive cars; vehicles not large enough.
no transportation
Three Square does not deliver to us.
We have a trailer available, but no one to move it. And it is not a refer.
I currently rescue all food we are 100 miles from Three Square
We don't have the truck
We have a refrigerated van, so we are limited to space if were were to pick up all of the food rescue that Three Square Delivers. However, we are able to do direct pick-ups at stores that have a smaller amount of food rescue that will fit in the van.
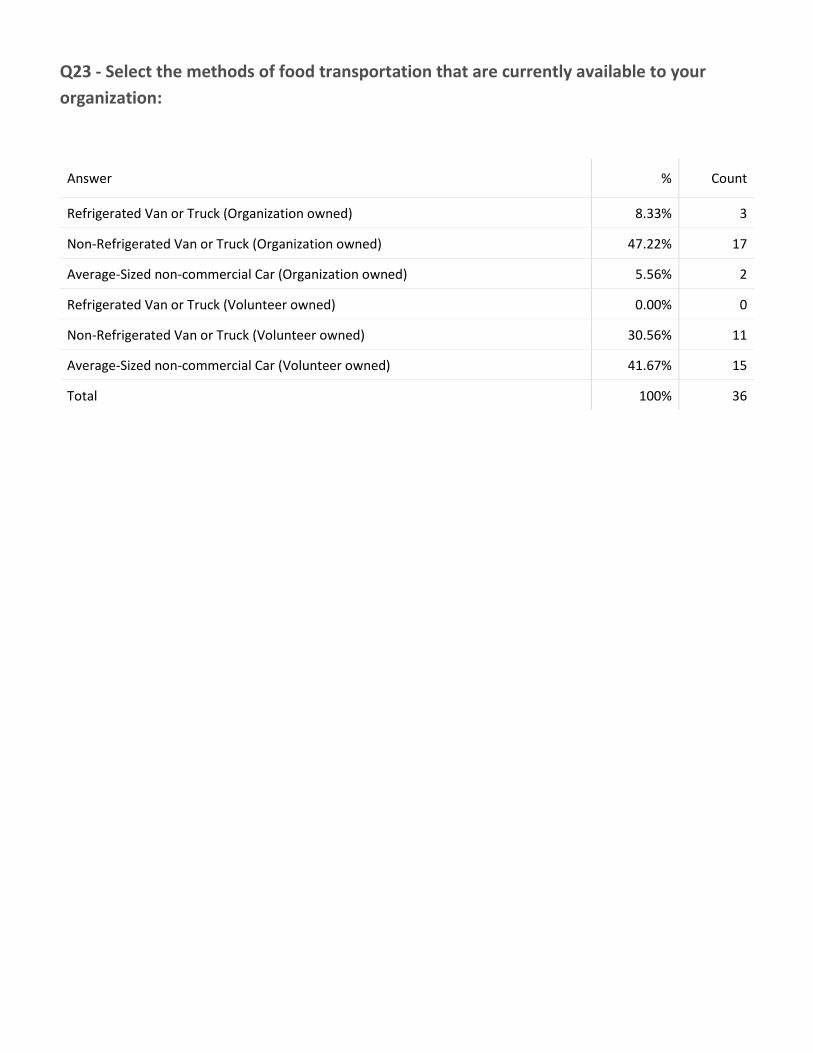
Q23 - Select the methods of food transportation that are currently available to your
organization:
Answer % Count
Refrigerated Van or Truck (Organization owned) 8.33% 3
Non-Refrigerated Van or Truck (Organization owned) 47.22% 17
Average-Sized non-commercial Car (Organization owned) 5.56% 2
Refrigerated Van or Truck (Volunteer owned) 0.00% 0
Non-Refrigerated Van or Truck (Volunteer owned) 30.56% 11
Average-Sized non-commercial Car (Volunteer owned) 41.67% 15
Total 100% 36
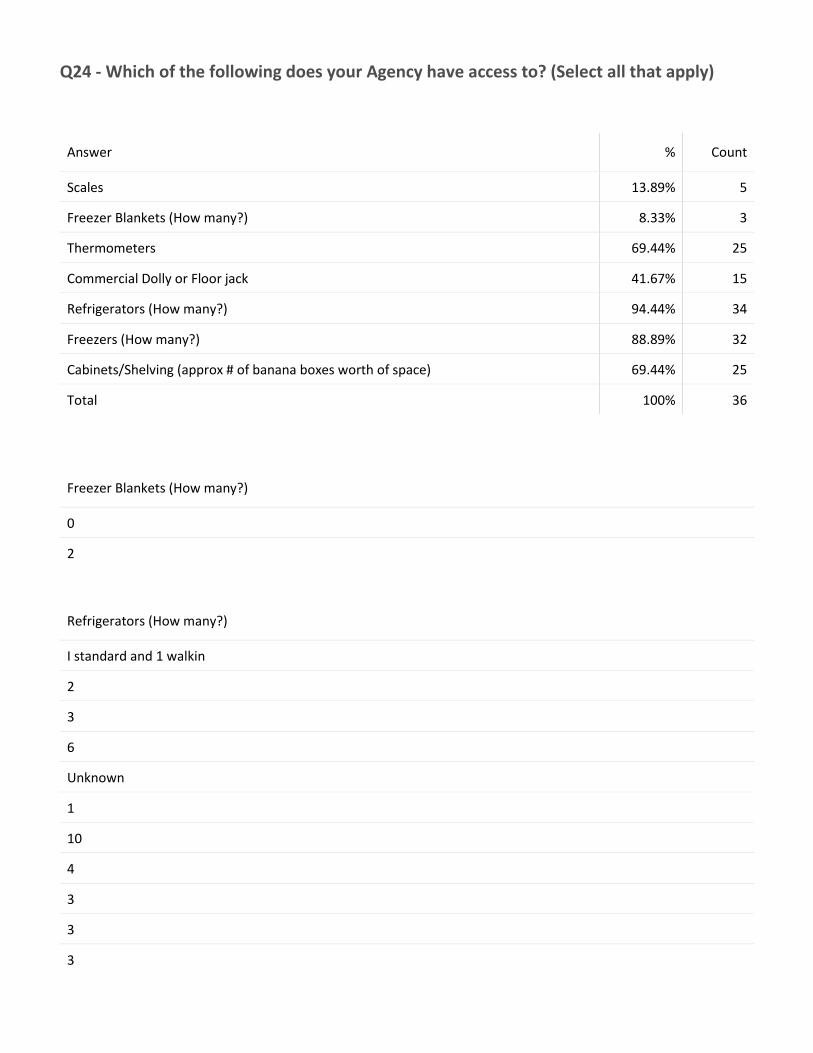
Q24 - Which of the following does your Agency have access to? (Select all that apply)
Answer % Count
Scales 13.89% 5
Freezer Blankets (How many?) 8.33% 3
Thermometers 69.44% 25
Commercial Dolly or Floor jack 41.67% 15
Refrigerators (How many?) 94.44% 34
Freezers (How many?) 88.89% 32
Cabinets/Shelving (approx # of banana boxes worth of space) 69.44% 25
Total 100% 36
Freezer Blankets (How many?)
0
2
Refrigerators (How many?)
I standard and 1 walkin
2
3
6
Unknown
1
10
4
3
3
3
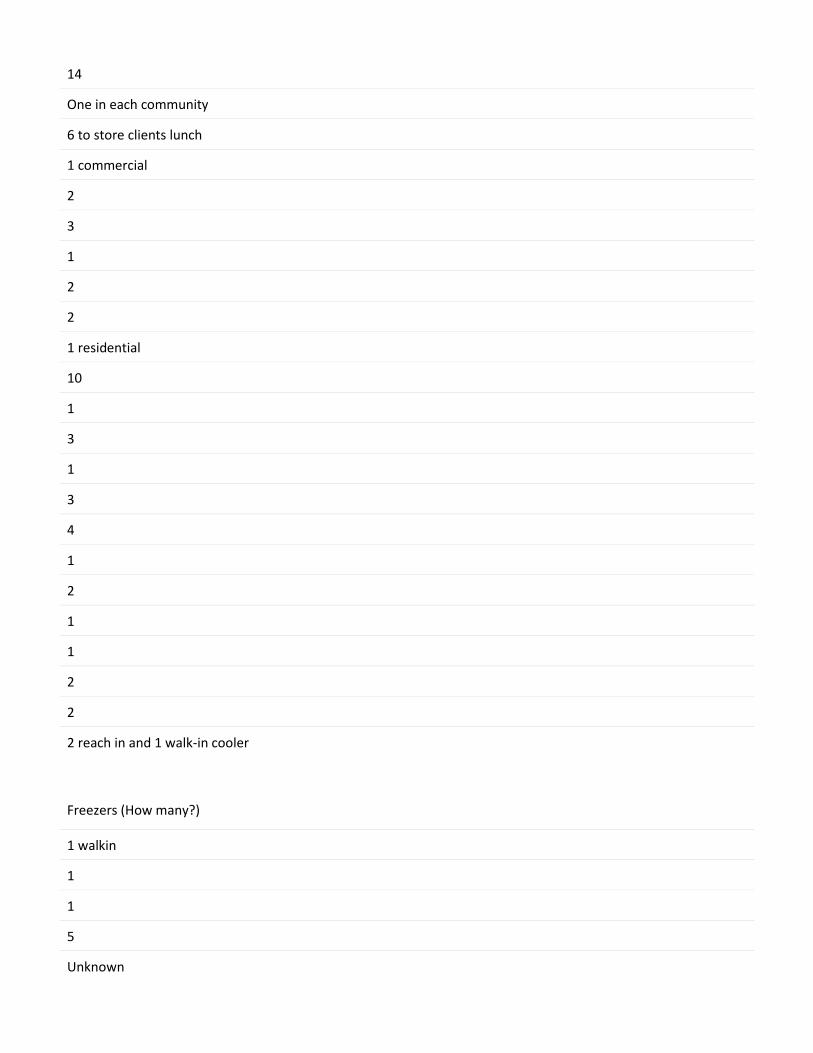
14
One in each community
6 to store clients lunch
1 commercial
2
3
1
2
2
1 residential
10
1
3
1
3
4
1
2
1
1
2
2
2 reach in and 1 walk-in cooler
Freezers (How many?)
1 walkin
1
1
5
Unknown
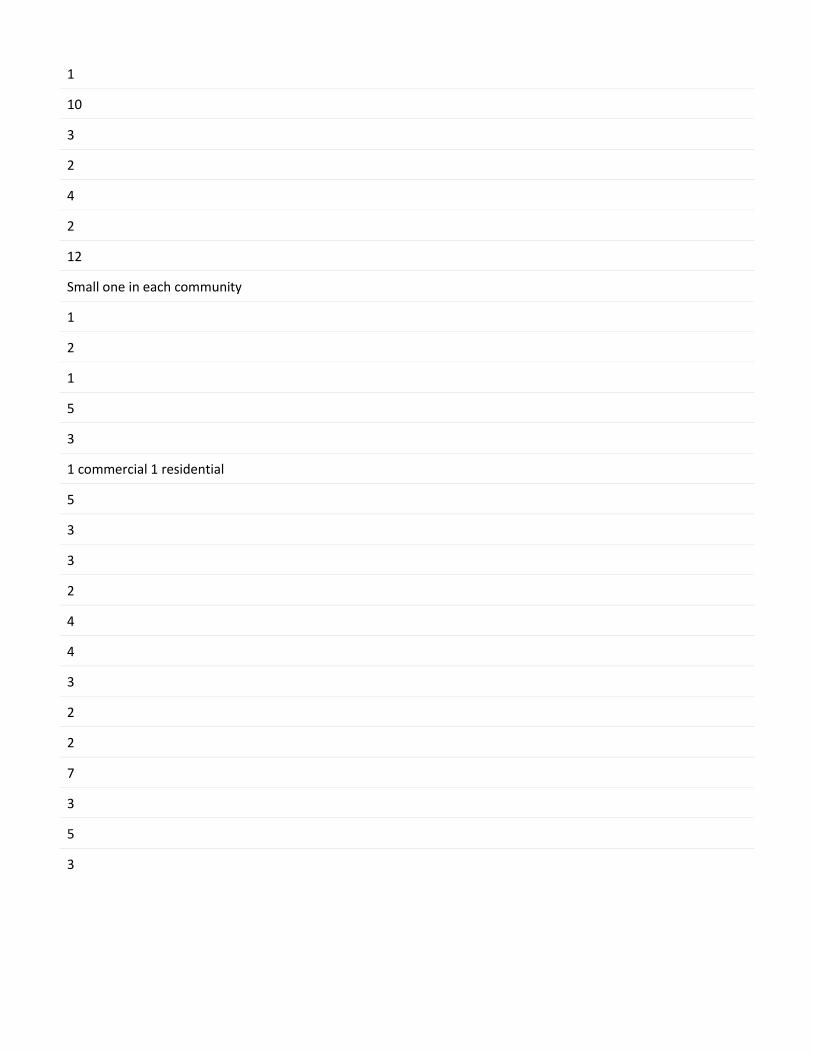
1
10
3
2
4
2
12
Small one in each community
1
2
1
5
3
1 commercial 1 residential
5
3
3
2
4
4
3
2
2
7
3
5
3
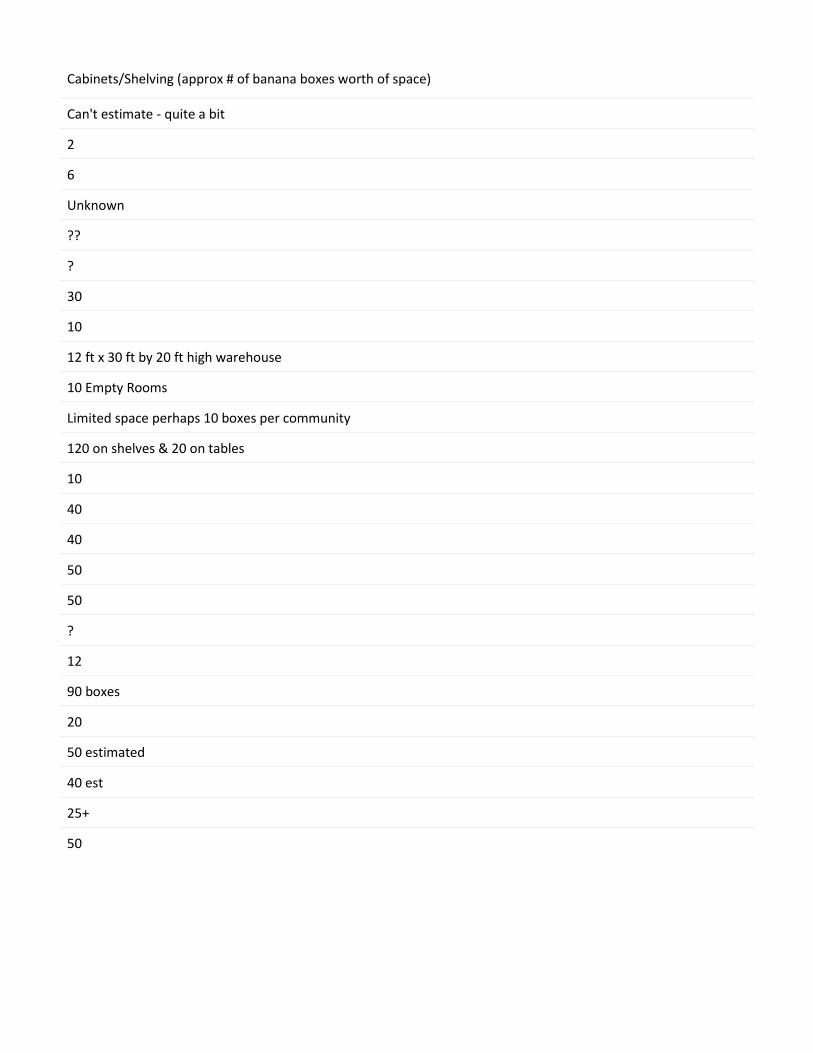
Cabinets/Shelving (approx # of banana boxes worth of space)
Can't estimate - quite a bit
2
6
Unknown
??
?
30
10
12 ft x 30 ft by 20 ft high warehouse
10 Empty Rooms
Limited space perhaps 10 boxes per community
120 on shelves & 20 on tables
10
40
40
50
50
?
12
90 boxes
20
50 estimated
40 est
25+
50
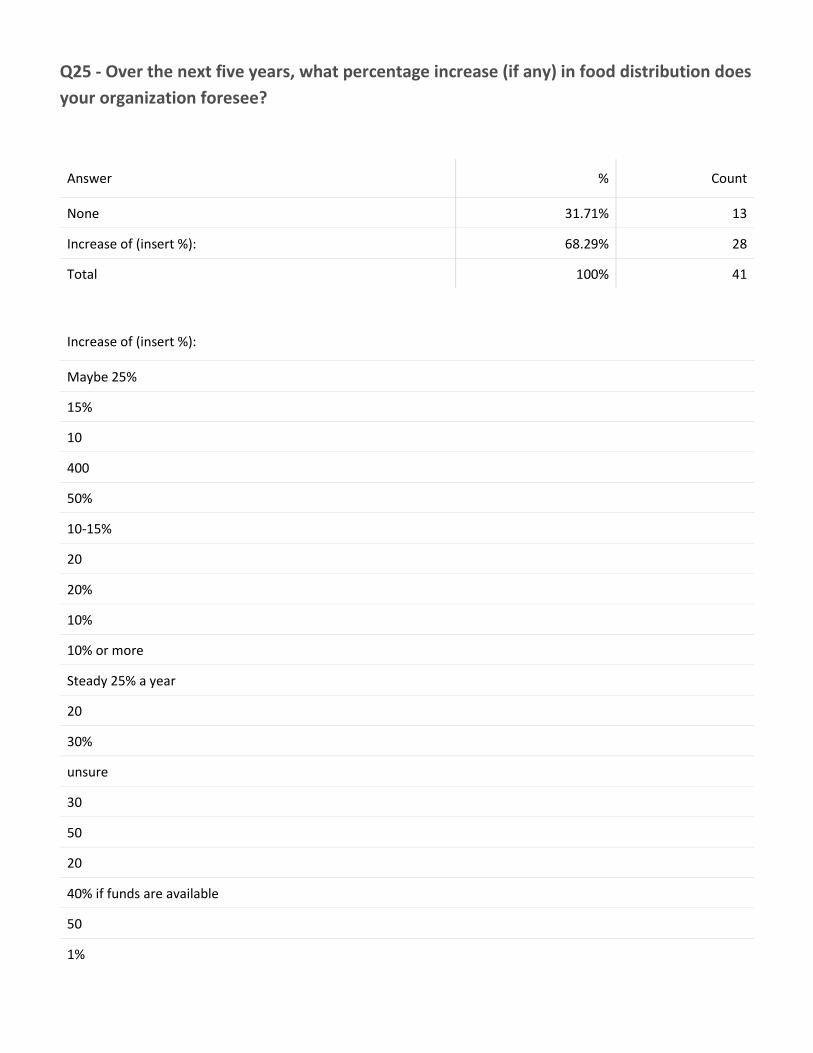
Q25 - Over the next five years, what percentage increase (if any) in food distribution does
your organization foresee?
Answer % Count
None 31.71% 13
Increase of (insert %): 68.29% 28
Total 100% 41
Increase of (insert %):
Maybe 25%
15%
10
400
50%
10-15%
20
20%
10%
10% or more
Steady 25% a year
20
30%
unsure
30
50
20
40% if funds are available
50
1%
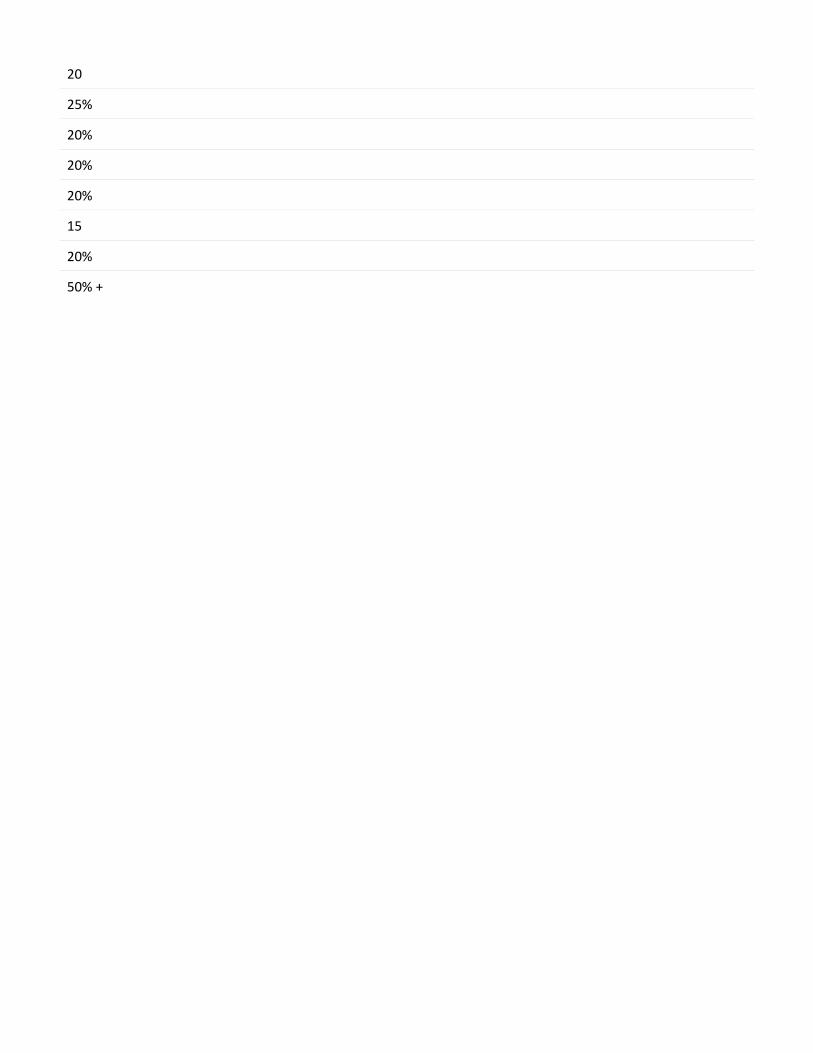
20
25%
20%
20%
20%
15
20%
50% +
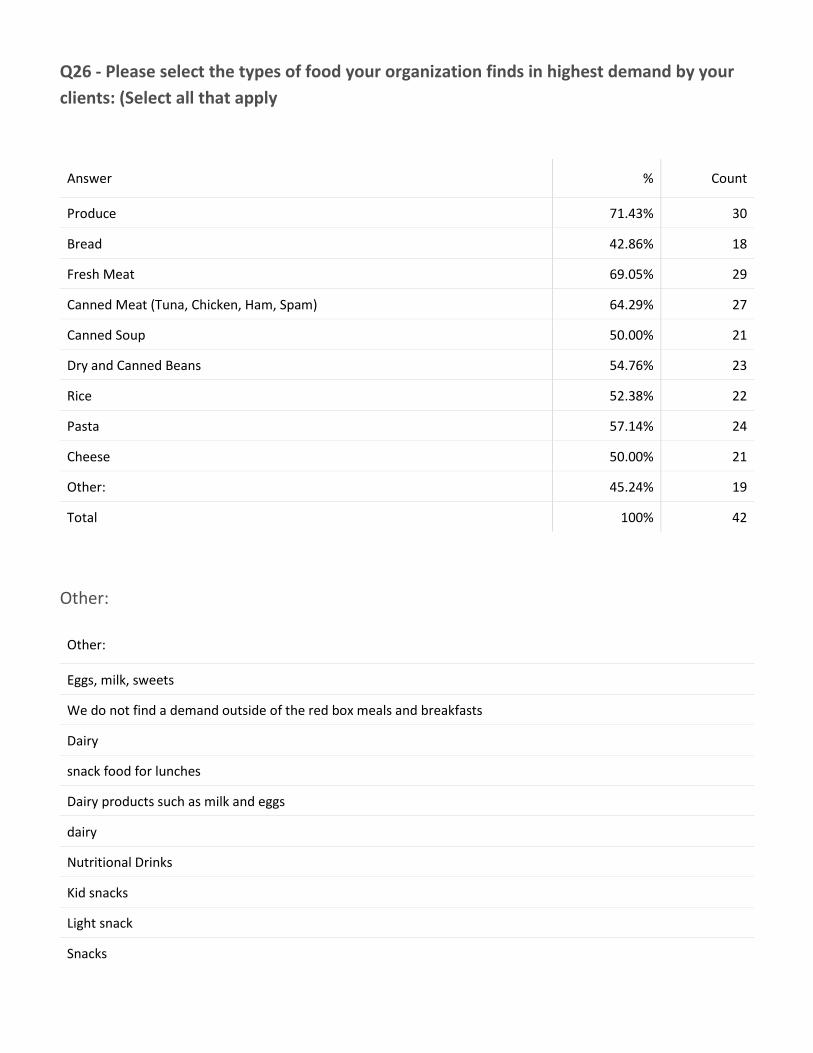
Q26 - Please select the types of food your organization finds in highest demand by your
clients: (Select all that apply
Answer % Count
Produce 71.43% 30
Bread 42.86% 18
Fresh Meat 69.05% 29
Canned Meat (Tuna, Chicken, Ham, Spam) 64.29% 27
Canned Soup 50.00% 21
Dry and Canned Beans 54.76% 23
Rice 52.38% 22
Pasta 57.14% 24
Cheese 50.00% 21
Other: 45.24% 19
Total 100% 42
Other:
Other:
Eggs, milk, sweets
We do not find a demand outside of the red box meals and breakfasts
Dairy
snack food for lunches
Dairy products such as milk and eggs
dairy
Nutritional Drinks
Kid snacks
Light snack
Snacks
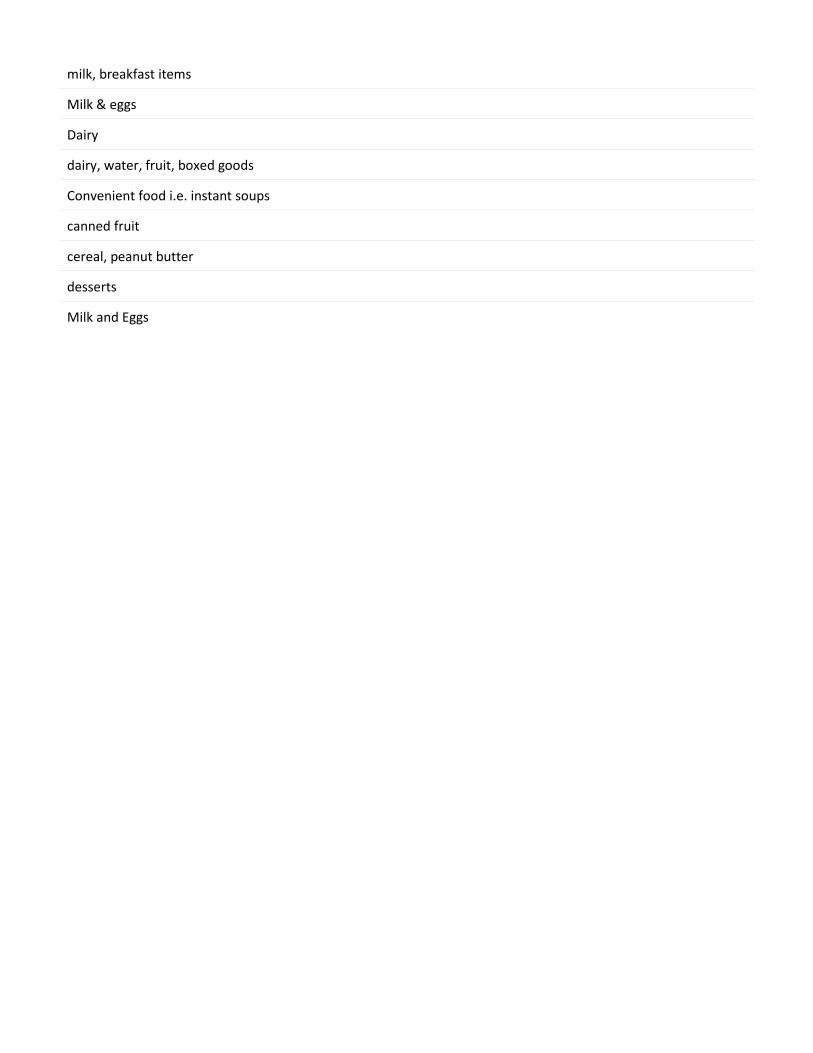
milk, breakfast items
Milk & eggs
Dairy
dairy, water, fruit, boxed goods
Convenient food i.e. instant soups
canned fruit
cereal, peanut butter
desserts
Milk and Eggs
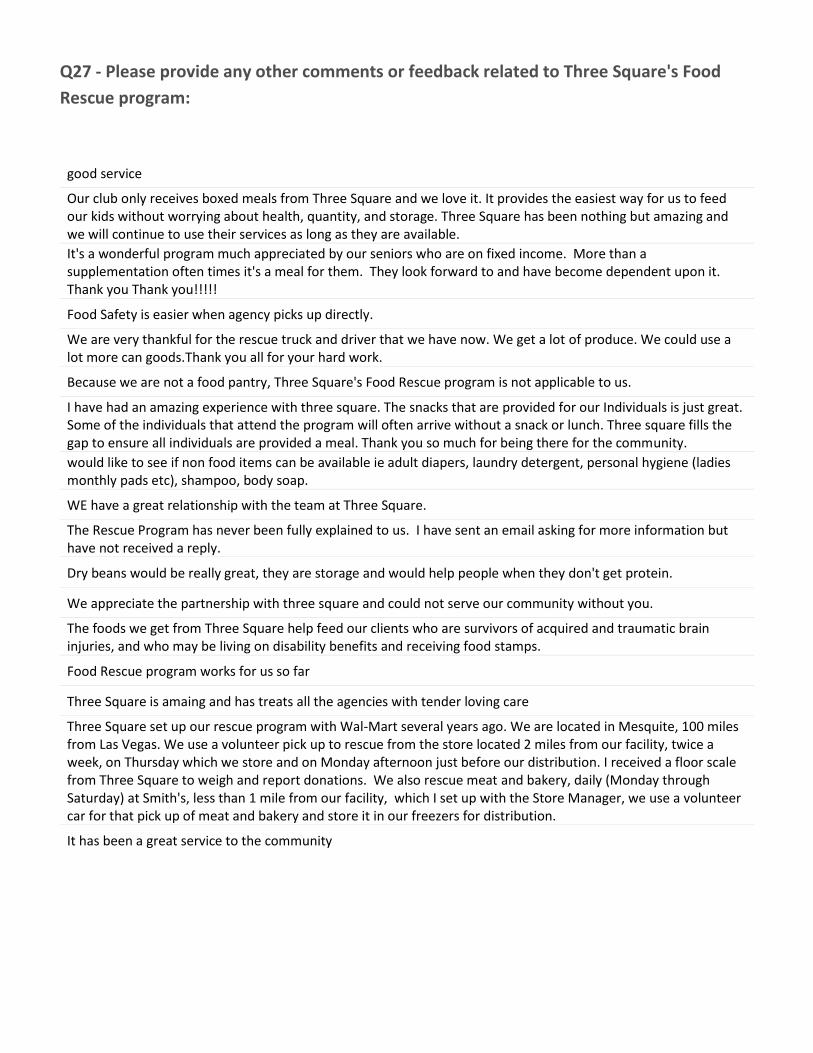
Q27 - Please provide any other comments or feedback related to Three Square's Food
Rescue program:
good service
Our club only receives boxed meals from Three Square and we love it. It provides the easiest way for us to feed our kids without worrying about health, quantity, and storage. Three Square has been nothing but amazing and we will continue to use their services as long as they are available.
It's a wonderful program much appreciated by our seniors who are on fixed income. More than a supplementation often times it's a meal for them. They look forward to and have become dependent upon it. Thank you Thank you!!!!!
Food Safety is easier when agency picks up directly.
We are very thankful for the rescue truck and driver that we have now. We get a lot of produce. We could use a lot more can goods.Thank you all for your hard work.
Because we are not a food pantry, Three Square's Food Rescue program is not applicable to us.
I have had an amazing experience with three square. The snacks that are provided for our Individuals is just great. Some of the individuals that attend the program will often arrive without a snack or lunch. Three square fills the gap to ensure all individuals are provided a meal. Thank you so much for being there for the community.
would like to see if non food items can be available ie adult diapers, laundry detergent, personal hygiene (ladies monthly pads etc), shampoo, body soap.
WE have a great relationship with the team at Three Square.
The Rescue Program has never been fully explained to us. I have sent an email asking for more information but have not received a reply.
Dry beans would be really great, they are storage and would help people when they don't get protein.
We appreciate the partnership with three square and could not serve our community without you.
The foods we get from Three Square help feed our clients who are survivors of acquired and traumatic brain injuries, and who may be living on disability benefits and receiving food stamps.
Food Rescue program works for us so far
Three Square is amaing and has treats all the agencies with tender loving care
Three Square set up our rescue program with Wal-Mart several years ago. We are located in Mesquite, 100 miles from Las Vegas. We use a volunteer pick up to rescue from the store located 2 miles from our facility, twice a week, on Thursday which we store and on Monday afternoon just before our distribution. I received a floor scale from Three Square to weigh and report donations. We also rescue meat and bakery, daily (Monday through Saturday) at Smith's, less than 1 mile from our facility, which I set up with the Store Manager, we use a volunteer car for that pick up of meat and bakery and store it in our freezers for distribution.
It has been a great service to the community

FOOD RESCUE
Agency Resource
Guide
APPENDIX H: Sample Resource Guide
2 | P a g e
Food Rescue Agency Resource Guide
Intro/Scope:
Feeding America San Diego’s agency partnerships are a key supportive link in the chain
between FASD, our donor partners, and the surrounding community in need. These
partnerships allow us to connect with more donors throughout San Diego County and to reach
thousands more community members in need.
Food Rescue Partner Agencies help to ensure the acquisition, transportation, storage, and
dignified distribution of non-marketable but wholesome, perishable, and non-perishable items
from our Retail Donors. Feeding America’s partner agencies cultivate and preserve positive and
respectful donor relationships by maintaining consistency, communication, and flexibility.
Together, we engage our community in the fight to end hunger.
Purpose: This packet will act as a guide for all Food Rescue Partner Agencies of Feeding
America San Diego. Agencies will use this packet to direct them through the Food Rescue
process upholding supply chain integrity and the highest levels of food safety.
The Guide is structured in the following manner:
I. Agreements (Food Donor, Agency, FASD) …………………….. page 3
II. Creating Successful Donor Relationships ……………………… page 4
III. Food Safety Requirements ………………………………………. page 5
a. Pick-up and Transportation……………………… page 5
a. Product Integrity Check …….………………….. page 6
b. Storage ……………………………………………page 8
c. Distribution ……………………………………….page 9
d. Recalls ……………………………………………page 9
e. Safety Logs ……………………………………….page 10IV. Record Keeping and Reporting ……………………………….. page 11
APPENDECIES…………………………………………………………...page 12 - 25
3 | P a g e
I. Agreements:
Acknowledging the expectations and agreements between FASD, our Food Rescue Partner
(FRP) agencies, and our Retail Donors will establish comprehensive guidelines for participation
in the Food Rescue Program. Each party is responsible for the following items:
Feeding America San Diego
As part of this contract, FRP agencies and Retail Donors can expect the following from FASD:
- Establish and coordinate the relationship between FRP agency and donor; pair FRP
agencies with Retail Donors in need
- Conduct orientation meeting with Retail Donor management, store receiver, and the
designated FRP agency during first visit to establish logistics and standards
- Ensure Retail Donors always have adequate and consistent pickup schedules
- Act as a mediator between FRP agency and Retail Donor when and if concerns arise
- Provide FRP agencies with adequate training in using the Food Rescue Resource Guide
including food rescue, food safety, and Online Marketplace reporting
- Report monthly pounds per store to corporate donor contacts
- Set goals, share opportunity and mobilize donors to give their full potential
Food Rescue Partner Agency
As part of this contract, FASD and Retail Donors can expect the following from Food Rescue
Partner agencies:
- Maintain consistent and clear communication with Retail Donor partners. This includes
setting and keeping a consistent schedule with assigned Retail Donor and notifying
donor partners if the agency will be arriving late or needs to reschedule
- Maintain accurate donation receipts detailing the total weight of donated product
received from Retail Donor (see Appendix VII. for receipt)
- Submit information from donation receipts to FASD through the Meal Connect on a
consistent basis with pounds reports due the 1st and 15th of each month (For more
information, see Section V. Recordkeeping and Reporting)
- Bring and maintain all required safety equipment to Retail Donor pickups including
temperature controlled devices and thermometers as outlined in the FRP Agreement
- Uphold temperature integrity of all donated product. Keep temperature logs throughout
transportation process (see Appendix I.)
- Bring the designated identification badges issued by FASD to donation pickups
- Build positive relationships with Retail Donor partner contacts by being consistent,
flexible, and respectful
Retail Donor
As part of this contract, FASD and FRP agencies can expect the following from our Retail
Donors
- Handle donations in a food safe manner ensuring all donated product is fit for human
consumption
- Maintain consistent and clear communication with the FRP pickup agency
Communication includes informing FRP agency where to park, whom to speak to upon
arrival, where to go to retrieve donations, and what times work best for donation pickups
4 | P a g e
- Notify the FASD Food Rescue Coordinator of any issues or concerns that arise with FRP
agencies and/or the donation program within the Retail Donor partner
- Agree to follow the guidelines set by your corporation in regards to participation in the
Food Rescue Donation Program
II. Creating Successful Donor Relations
Creating and maintaining successful donor relations is essential to ensuring continued support
from our Retail Donor partners. FRP agencies must remain mindful and appreciative of the
valuable time and effort that Retail Donor partners have invested into the food donation
program. Establishing clear communication and guidelines at the beginning of the relationship
between the FRP agency and the Retail Donor partner will help to ensure a successful
relationship.
Four Steps to Donor Relationships (Communicate, Appreciate, Respect, Support)
1. Communicate Clearly
o Communicate your organization’s daily pick-up schedule and ask about their
daily break schedule.
Understand that each of the parties may face barriers in making the pre-
determined pickup time (i.e. previous pickup ran late, receiver had to take
late lunch break because of large load)
o If you ever suspect you may be late to a pick-up or you are not able to make a
scheduled pick-up day, always CALL the store to let them know.
o If there are any questions as to whether or not product that you are picking up
was meant to be donated, be sure to ask the department manager or the store
receiver before taking the product.
2. Show Appreciation
o Appreciate that Retail Donors are taking the time to donate product, and be
specific when showing appreciation.
o Using the appropriate language can make your “Thank You” more impactful
Try saying: “Thank you for taking the time to sort product for our
organization. Many of our clients don’t have access to fresh produce and
nutritious food and they really appreciate your donated product.”
Instead of: “Thanks for the produce.”
3. Be Respectful, but stand firm on food safety
o Let your Retail Donor know that food safety is important to your organization and
clients. For example:
If a Retail Donor is cross-contaminating food product, politely inform them
that you cannot distribute any product to clients that has been cross-
contaminated.
5 | P a g e
For example you might say, “Unfortunately, when we receive food
product and non-food product mixed in the same box we have to
discard it. If possible, would you please create a separate
donation box when you have non-food product for us. Thank you,
we really appreciate your hard work and understanding.”
If perishable product is sitting outside of a cooler or freezer when you
arrive ask:
“Do you know how long this product has been out of refrigeration?
Would you mind if I check the temperature of the product?”
o IMPORTANT: If your donor continues to handle food donation in an unsafe
manner, contact FASD Food Rescue Coordinator.
4. Support your Retail Donor
o Make the Retail Donor aware that if they ever in need of additional donation
pickups to please contact you.
o Inquire if there is any particular product that they are having to discard frequently
that could instead be donated.
o Be available to accommodate special requests from your donor.
III. FOOD SAFETY REQUIREMENTS
This section will guide you through the necessary steps in order to ensure food rescue
donations are handled in a food safe manner at all times.
A. Pick up and Transportation ……………………………………..page 4 B. Product Integrity Check / Reclamation…………………………page 5 C. Storage …………………………………………………………... page 7 D. Distribution ………………………………………………………. page 8 E. Recall …………………………………………………………….. page 8 F. Safety Logs ………………………………………………………. page 9
A. Pick-up and transportation
1. Keep referunit running,OR…
2. Use FreezerBlanket
3. Watch yourtravel time
4. Recordfood
temperatures
5. Separatefood by type
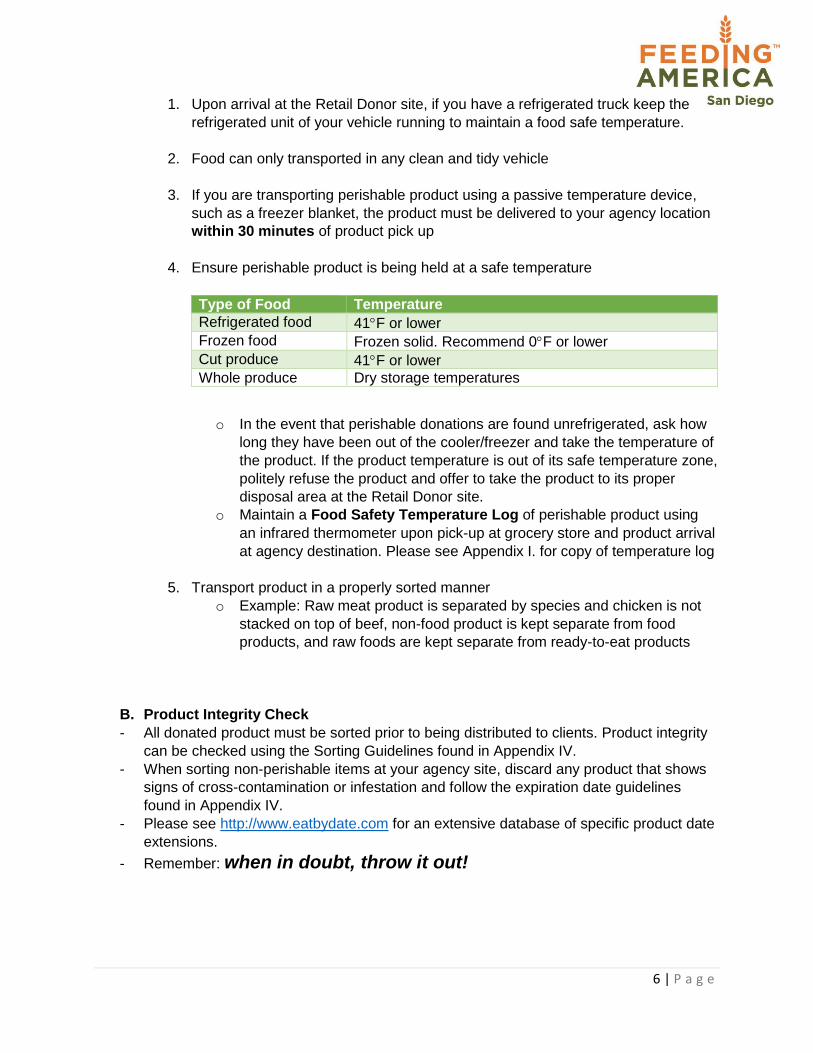
6 | P a g e
1. Upon arrival at the Retail Donor site, if you have a refrigerated truck keep the
refrigerated unit of your vehicle running to maintain a food safe temperature.
2. Food can only transported in any clean and tidy vehicle
3. If you are transporting perishable product using a passive temperature device,
such as a freezer blanket, the product must be delivered to your agency location
within 30 minutes of product pick up
4. Ensure perishable product is being held at a safe temperature
Type of Food Temperature
Refrigerated food 41F or lower
Frozen food Frozen solid. Recommend 0F or lower
Cut produce 41F or lower
Whole produce Dry storage temperatures
o In the event that perishable donations are found unrefrigerated, ask how
long they have been out of the cooler/freezer and take the temperature of
the product. If the product temperature is out of its safe temperature zone,
politely refuse the product and offer to take the product to its proper
disposal area at the Retail Donor site.
o Maintain a Food Safety Temperature Log of perishable product using
an infrared thermometer upon pick-up at grocery store and product arrival
at agency destination. Please see Appendix I. for copy of temperature log
5. Transport product in a properly sorted manner
o Example: Raw meat product is separated by species and chicken is not
stacked on top of beef, non-food product is kept separate from food
products, and raw foods are kept separate from ready-to-eat products
B. Product Integrity Check
- All donated product must be sorted prior to being distributed to clients. Product integrity
can be checked using the Sorting Guidelines found in Appendix IV.
- When sorting non-perishable items at your agency site, discard any product that shows
signs of cross-contamination or infestation and follow the expiration date guidelines
found in Appendix IV.
- Please see http://www.eatbydate.com for an extensive database of specific product date
extensions.
- Remember: when in doubt, throw it out!
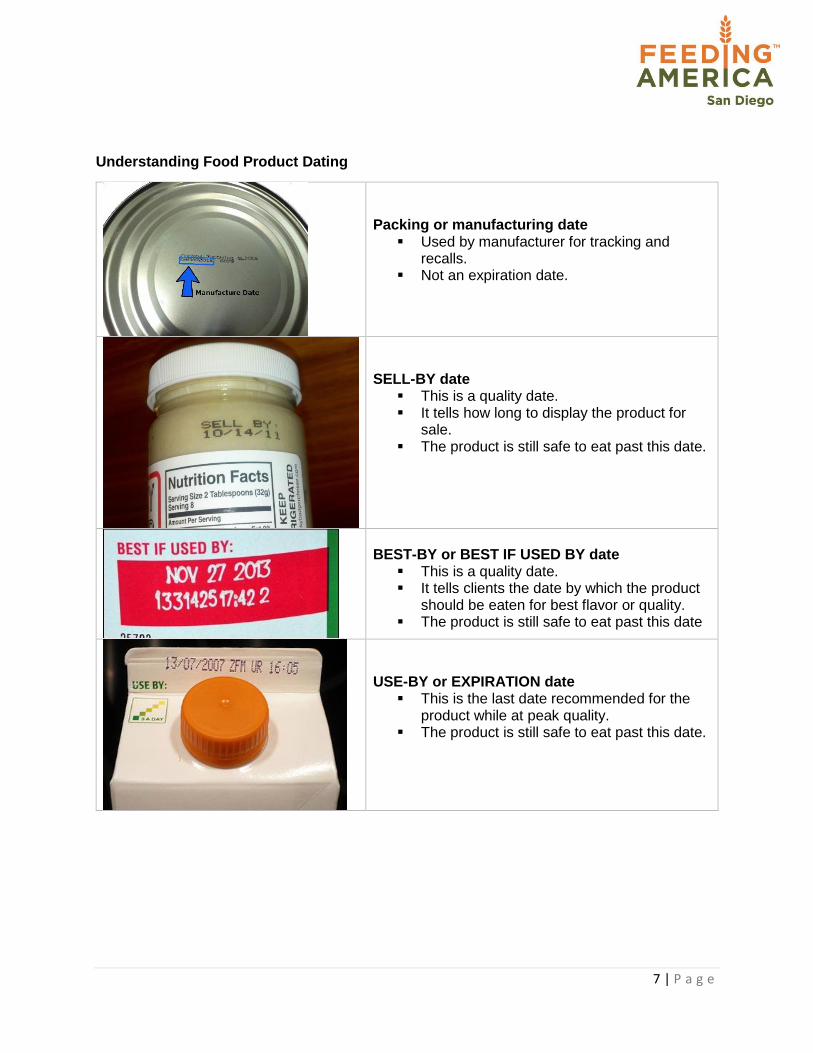
7 | P a g e
Understanding Food Product Dating
Packing or manufacturing date
Used by manufacturer for tracking and recalls.
Not an expiration date.
SELL-BY date
This is a quality date. It tells how long to display the product for
sale. The product is still safe to eat past this date.
BEST-BY or BEST IF USED BY date
This is a quality date. It tells clients the date by which the product
should be eaten for best flavor or quality. The product is still safe to eat past this date
USE-BY or EXPIRATION date
This is the last date recommended for the product while at peak quality.
The product is still safe to eat past this date.
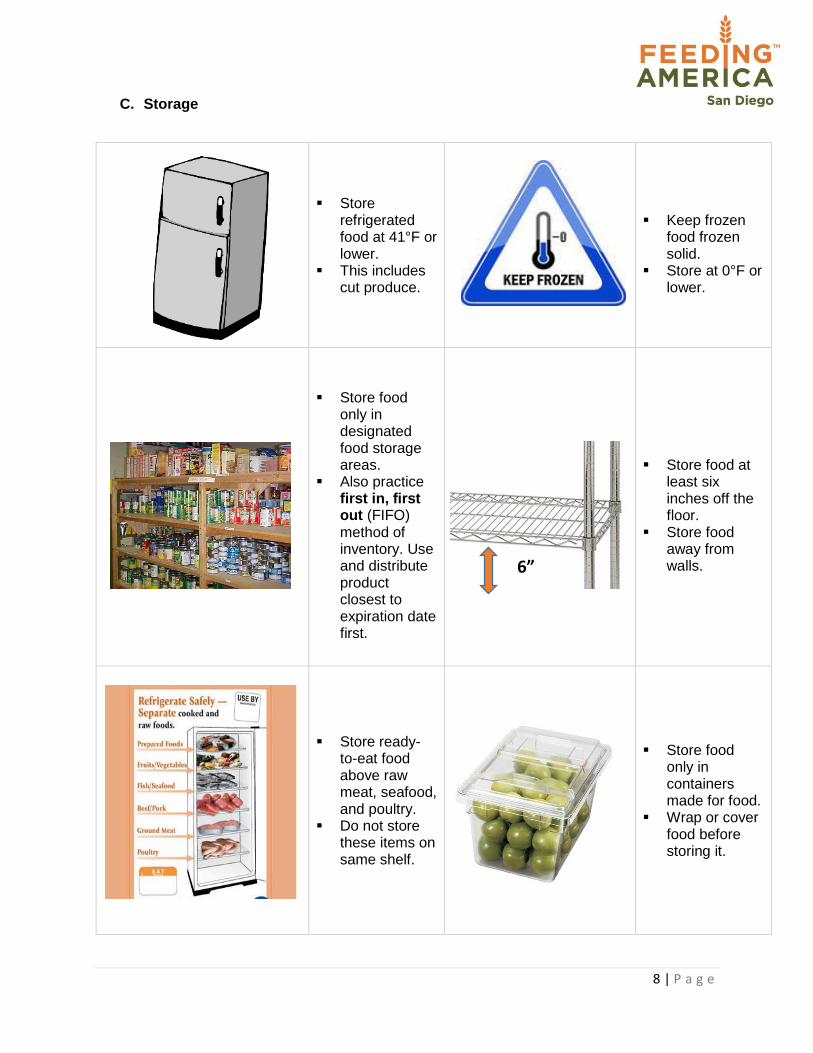
8 | P a g e
C. Storage
Store refrigerated food at 41°F or lower.
This includes cut produce.
Keep frozen
food frozen solid.
Store at 0°F or lower.
Store food
only in designated food storage areas.
Also practice first in, first out (FIFO) method of inventory. Use and distribute product closest to expiration date first.
Store food at
least six inches off the floor.
Store food away from walls.
Store ready-to-eat food above raw meat, seafood, and poultry.
Do not store these items on same shelf.
Store food only in containers made for food.
Wrap or cover food before storing it.
6”
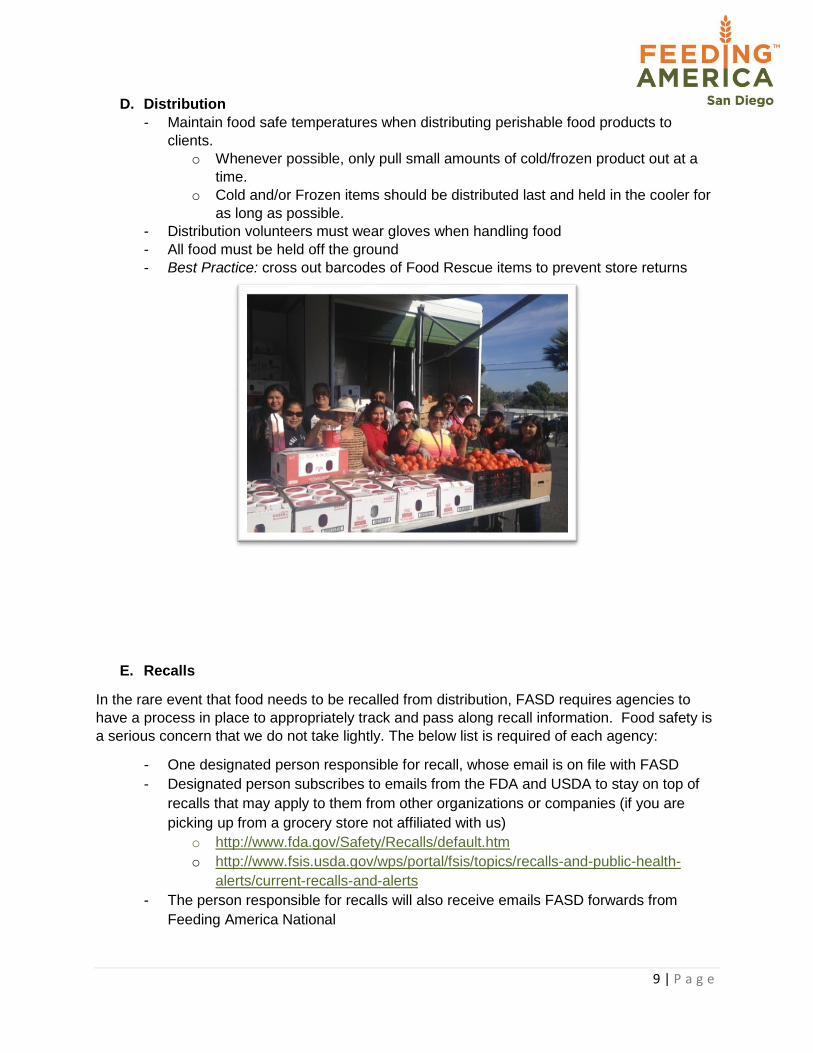
9 | P a g e
D. Distribution
- Maintain food safe temperatures when distributing perishable food products to
clients.
o Whenever possible, only pull small amounts of cold/frozen product out at a
time.
o Cold and/or Frozen items should be distributed last and held in the cooler for
as long as possible.
- Distribution volunteers must wear gloves when handling food
- All food must be held off the ground
- Best Practice: cross out barcodes of Food Rescue items to prevent store returns
E. Recalls
In the rare event that food needs to be recalled from distribution, FASD requires agencies to
have a process in place to appropriately track and pass along recall information. Food safety is
a serious concern that we do not take lightly. The below list is required of each agency:
- One designated person responsible for recall, whose email is on file with FASD
- Designated person subscribes to emails from the FDA and USDA to stay on top of
recalls that may apply to them from other organizations or companies (if you are
picking up from a grocery store not affiliated with us)
o http://www.fda.gov/Safety/Recalls/default.htm
o http://www.fsis.usda.gov/wps/portal/fsis/topics/recalls-and-public-health-
alerts/current-recalls-and-alerts
- The person responsible for recalls will also receive emails FASD forwards from
Feeding America National
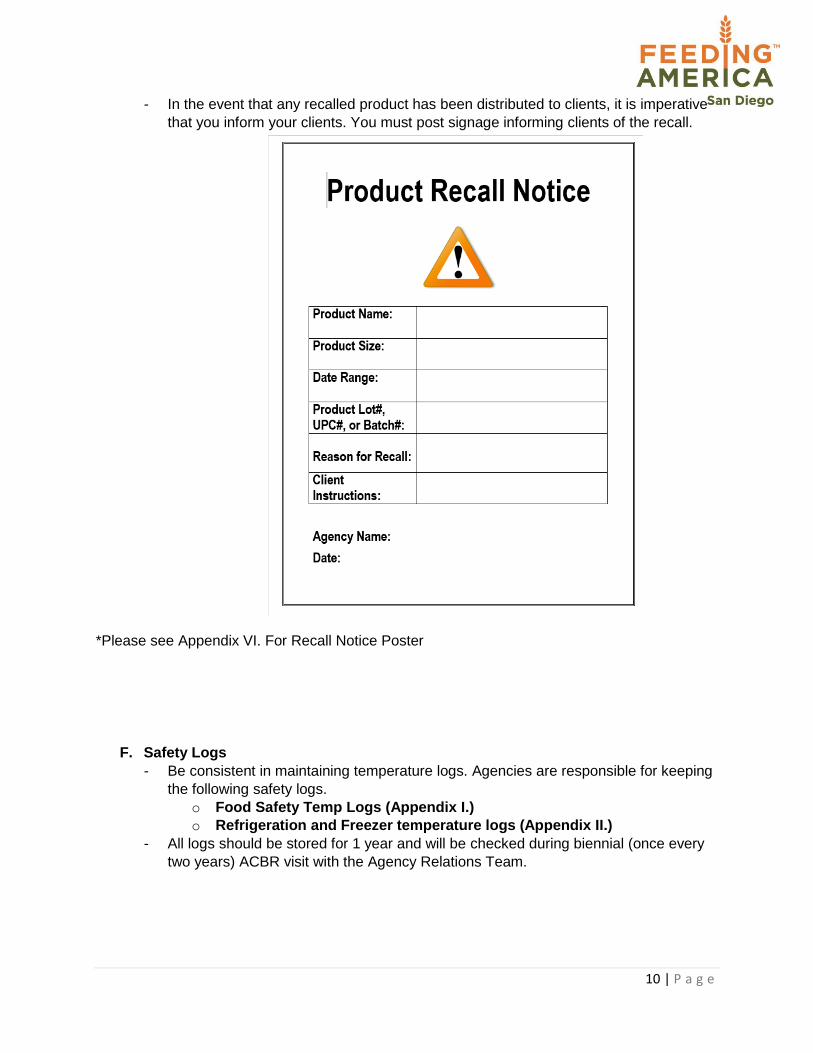
10 | P a g e
- In the event that any recalled product has been distributed to clients, it is imperative
that you inform your clients. You must post signage informing clients of the recall.
*Please see Appendix VI. For Recall Notice Poster
F. Safety Logs
- Be consistent in maintaining temperature logs. Agencies are responsible for keeping
the following safety logs.
o Food Safety Temp Logs (Appendix I.)
o Refrigeration and Freezer temperature logs (Appendix II.)
- All logs should be stored for 1 year and will be checked during biennial (once every
two years) ACBR visit with the Agency Relations Team.
11 | P a g e
IV. Record Keeping and Reporting
All Food Rescue Partner Agencies are required to keep accurate and timely reports of pounds
donated. Agencies must report pounds received on a twice a month using the Meal Connect
(MC) web platform.
- Agencies must submit pounds via Meal Connect no later than the 1st and 15th
of each month
The MC platform provides an online arena in which agencies can easily input and submit their
food rescue pounds reports to Feeding America San Diego. Along with outward reporting, all
data is saved in the MC website and can be conveniently accessed by the reporting agency.
FASD will provide initial training to partner agencies in Meal Connect use. Please see our
agency website for additional information and training videos for more support.
If you have any questions about information in this guide or requirements, please don’t hesitate
to reach out to:
Kelly Stokwitz Food Sourcing Manager
619.240.0627 cell
858.452.3663 x120 office
feedingamericasd.org
9455 Waples St, Ste 135
San Diego CA 92121
Help fuel summer for kids and families in need. Give today — every dollar provides four meals.
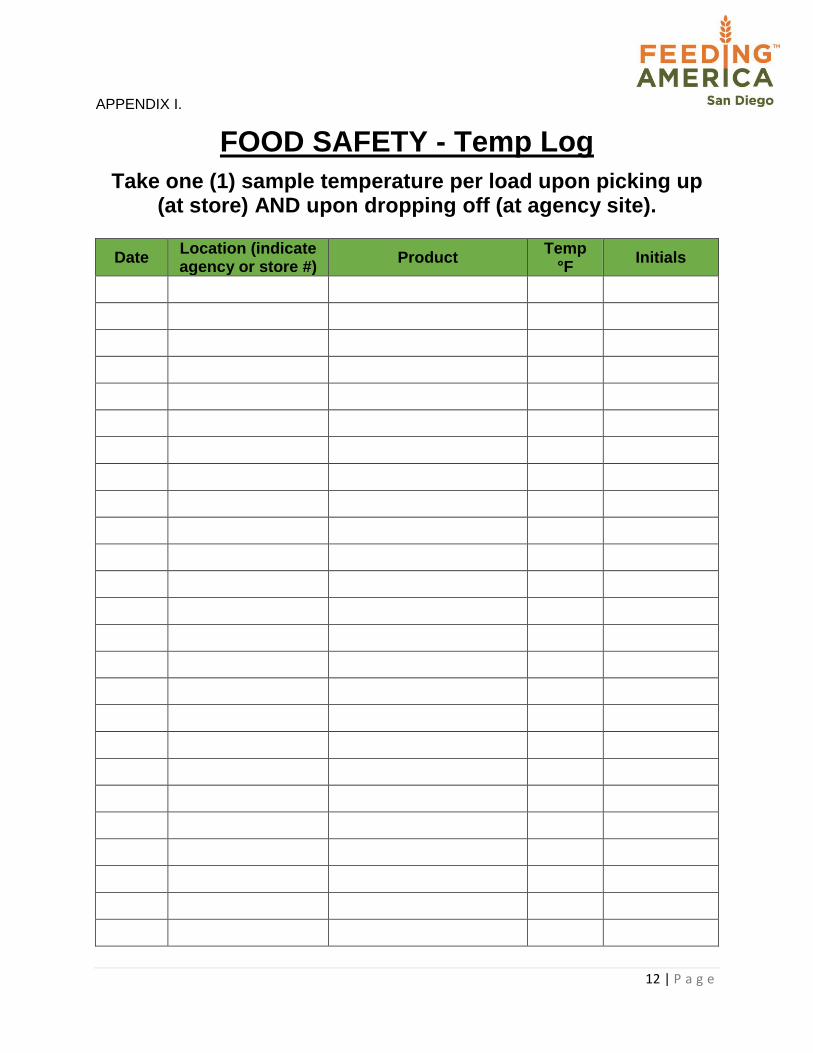
12 | P a g e
APPENDIX I.
FOOD SAFETY - Temp Log
Take one (1) sample temperature per load upon picking up (at store) AND upon dropping off (at agency site).
Date Location (indicate agency or store #)
Product Temp
°F Initials
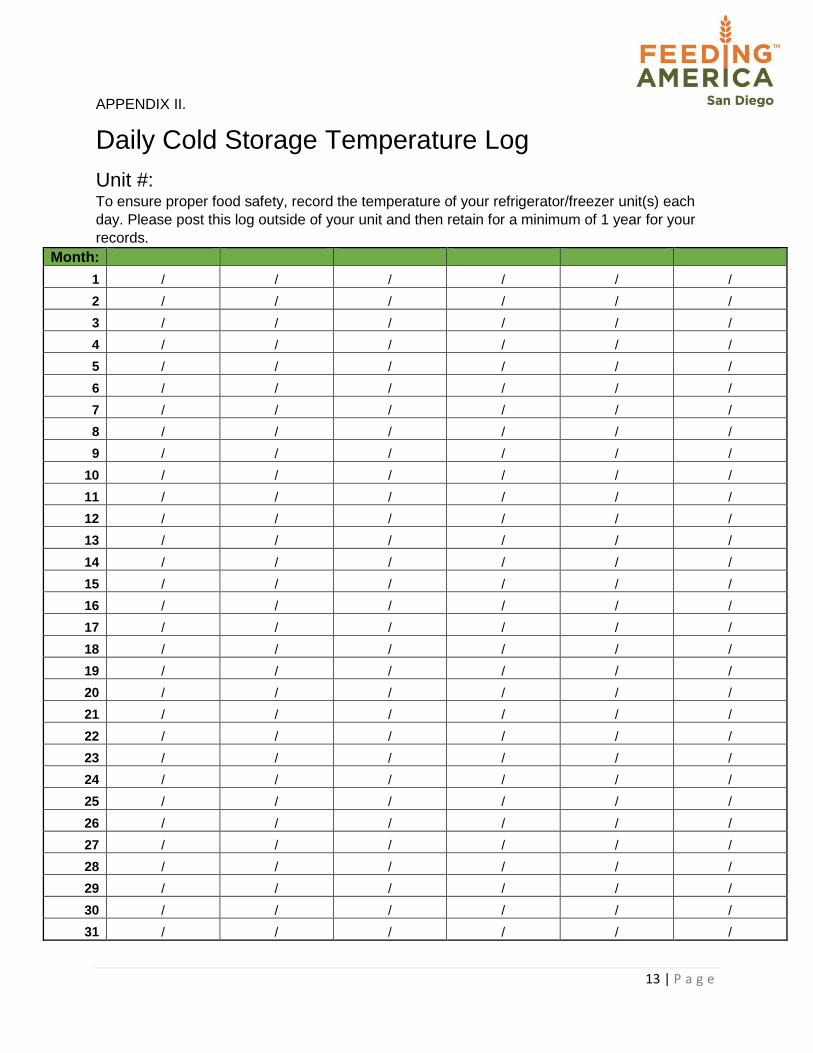
13 | P a g e
APPENDIX II.
Daily Cold Storage Temperature Log
Unit #: To ensure proper food safety, record the temperature of your refrigerator/freezer unit(s) each
day. Please post this log outside of your unit and then retain for a minimum of 1 year for your
records.
Month:
1 / / / / / /
2 / / / / / /
3 / / / / / /
4 / / / / / /
5 / / / / / /
6 / / / / / /
7 / / / / / /
8 / / / / / /
9 / / / / / /
10 / / / / / /
11 / / / / / /
12 / / / / / /
13 / / / / / /
14 / / / / / /
15 / / / / / /
16 / / / / / /
17 / / / / / /
18 / / / / / /
19 / / / / / /
20 / / / / / /
21 / / / / / /
22 / / / / / /
23 / / / / / /
24 / / / / / /
25 / / / / / /
26 / / / / / /
27 / / / / / /
28 / / / / / /
29 / / / / / /
30 / / / / / /
31 / / / / / /
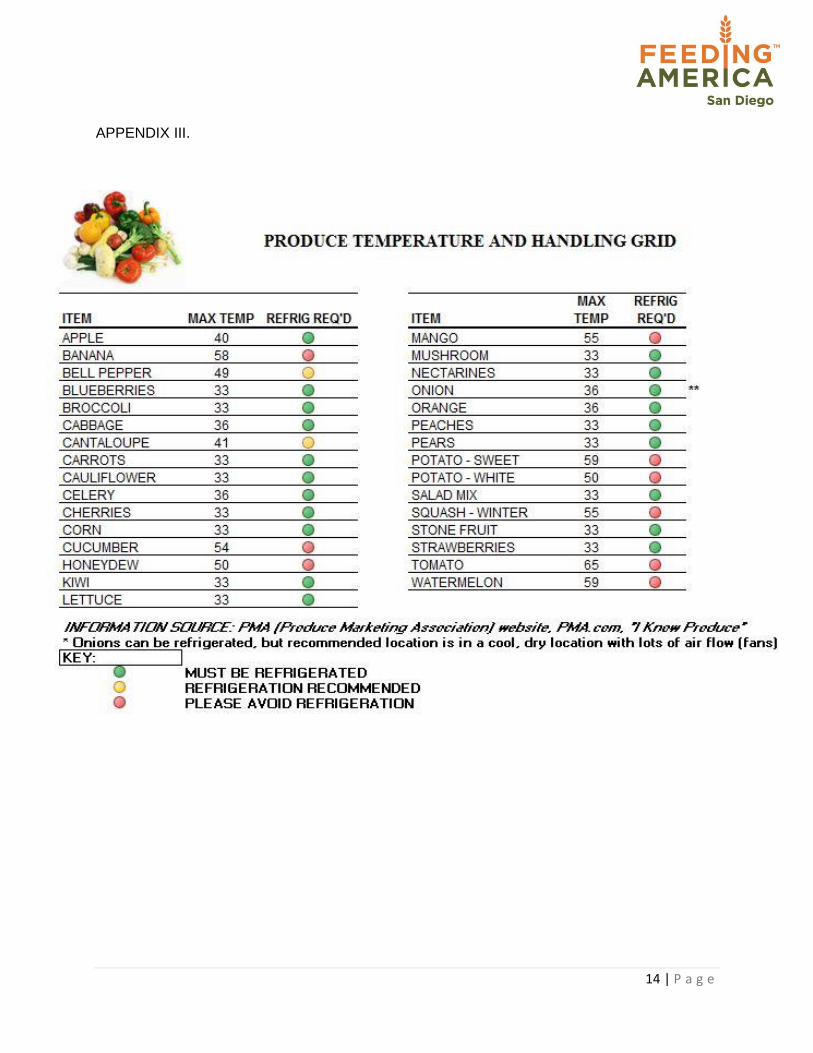
14 | P a g e
APPENDIX III.
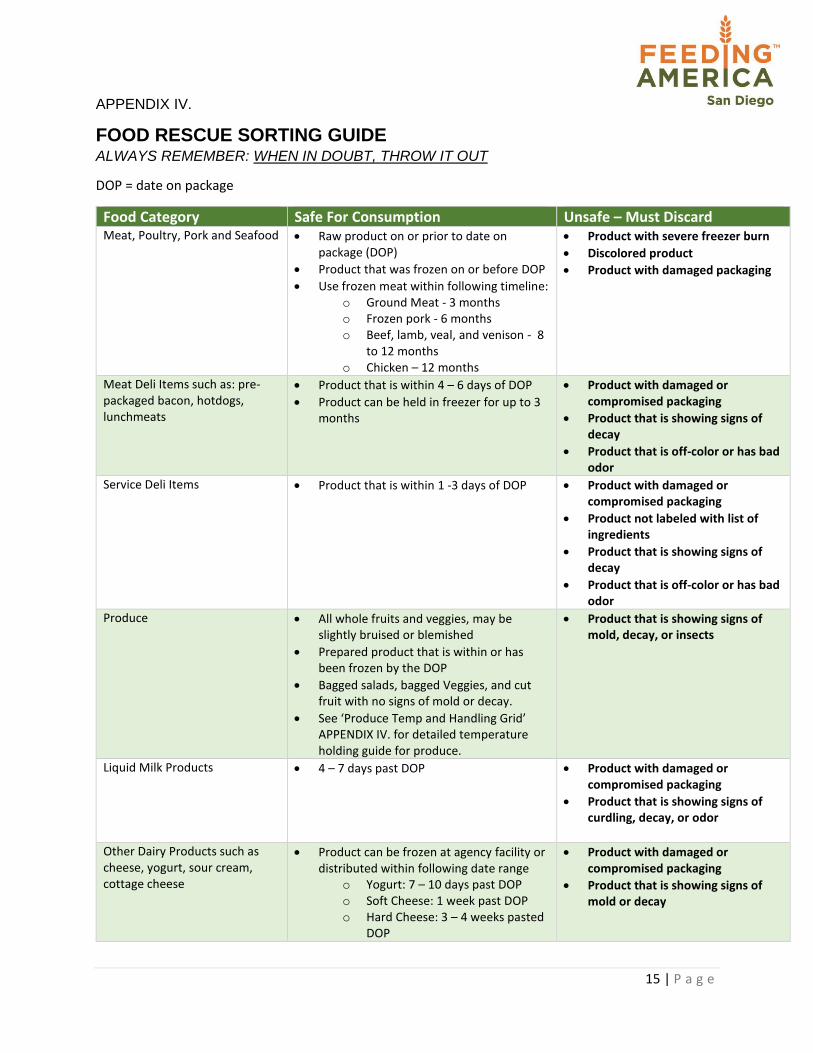
15 | P a g e
APPENDIX IV.
FOOD RESCUE SORTING GUIDE ALWAYS REMEMBER: WHEN IN DOUBT, THROW IT OUT
DOP = date on package
Food Category Safe For Consumption Unsafe – Must Discard Meat, Poultry, Pork and Seafood Raw product on or prior to date on
package (DOP)
Product that was frozen on or before DOP
Use frozen meat within following timeline: o Ground Meat - 3 months o Frozen pork - 6 months o Beef, lamb, veal, and venison - 8
to 12 months o Chicken – 12 months
Product with severe freezer burn
Discolored product
Product with damaged packaging
Meat Deli Items such as: pre-packaged bacon, hotdogs, lunchmeats
Product that is within 4 – 6 days of DOP
Product can be held in freezer for up to 3 months
Product with damaged or compromised packaging
Product that is showing signs of decay
Product that is off-color or has bad odor
Service Deli Items Product that is within 1 -3 days of DOP Product with damaged or compromised packaging
Product not labeled with list of ingredients
Product that is showing signs of decay
Product that is off-color or has bad odor
Produce All whole fruits and veggies, may be slightly bruised or blemished
Prepared product that is within or has been frozen by the DOP
Bagged salads, bagged Veggies, and cut fruit with no signs of mold or decay.
See ‘Produce Temp and Handling Grid’ APPENDIX IV. for detailed temperature holding guide for produce.
Product that is showing signs of mold, decay, or insects
Liquid Milk Products 4 – 7 days past DOP Product with damaged or compromised packaging
Product that is showing signs of curdling, decay, or odor
Other Dairy Products such as cheese, yogurt, sour cream, cottage cheese
Product can be frozen at agency facility or distributed within following date range
o Yogurt: 7 – 10 days past DOP o Soft Cheese: 1 week past DOP o Hard Cheese: 3 – 4 weeks pasted
DOP
Product with damaged or compromised packaging
Product that is showing signs of mold or decay
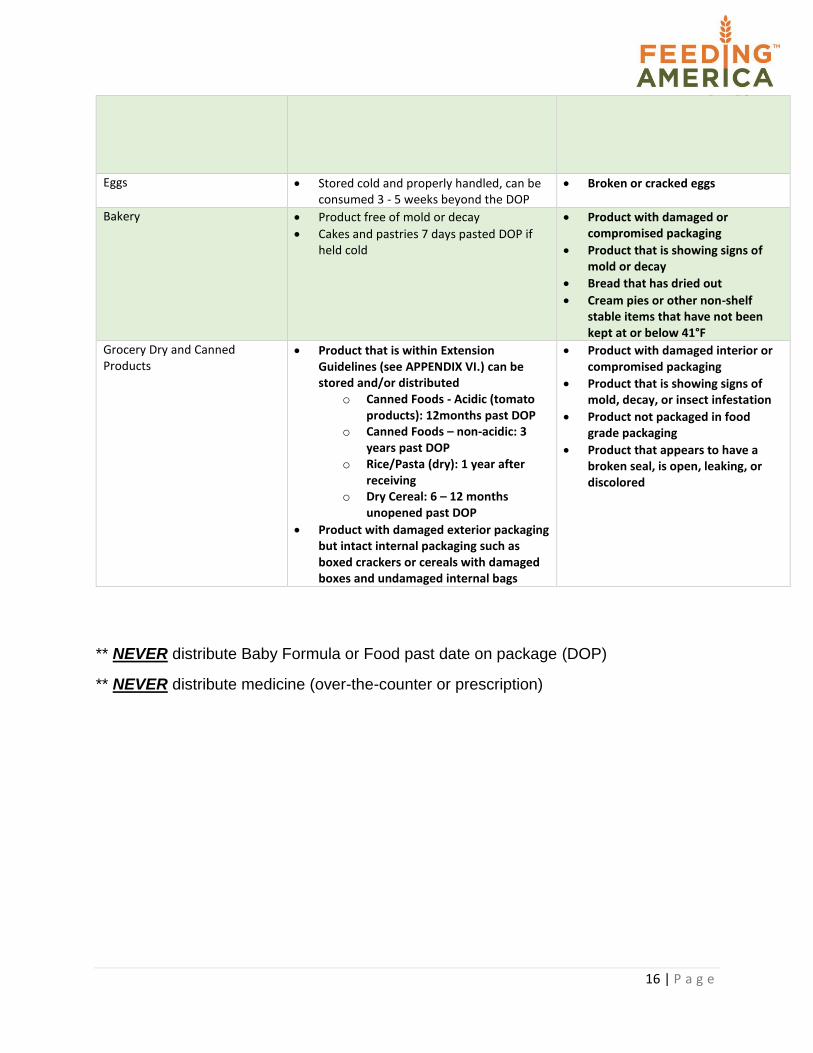
16 | P a g e
Eggs Stored cold and properly handled, can beconsumed 3 - 5 weeks beyond the DOP
Broken or cracked eggs
Bakery Product free of mold or decay
Cakes and pastries 7 days pasted DOP ifheld cold
Product with damaged orcompromised packaging
Product that is showing signs ofmold or decay
Bread that has dried out
Cream pies or other non-shelfstable items that have not beenkept at or below 41°F
Grocery Dry and Canned Products
Product that is within ExtensionGuidelines (see APPENDIX VI.) can bestored and/or distributed
o Canned Foods - Acidic (tomatoproducts): 12months past DOP
o Canned Foods – non-acidic: 3years past DOP
o Rice/Pasta (dry): 1 year afterreceiving
o Dry Cereal: 6 – 12 monthsunopened past DOP
Product with damaged exterior packagingbut intact internal packaging such asboxed crackers or cereals with damagedboxes and undamaged internal bags
Product with damaged interior orcompromised packaging
Product that is showing signs ofmold, decay, or insect infestation
Product not packaged in foodgrade packaging
Product that appears to have abroken seal, is open, leaking, ordiscolored
** NEVER distribute Baby Formula or Food past date on package (DOP)
** NEVER distribute medicine (over-the-counter or prescription)
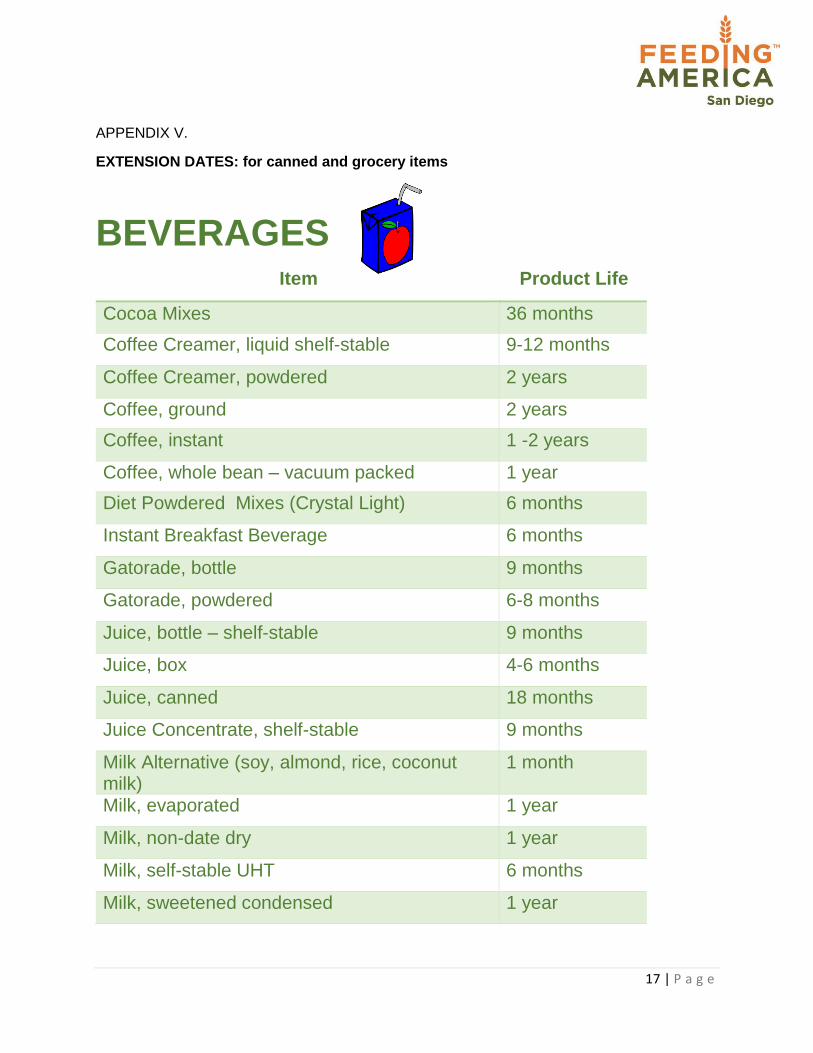
17 | P a g e
APPENDIX V.
EXTENSION DATES: for canned and grocery items
BEVERAGES
Item Product Life
Cocoa Mixes 36 months
Coffee Creamer, liquid shelf-stable 9-12 months
Coffee Creamer, powdered 2 years
Coffee, ground 2 years
Coffee, instant 1 -2 years
Coffee, whole bean – vacuum packed 1 year
Diet Powdered Mixes (Crystal Light) 6 months
Instant Breakfast Beverage 6 months
Gatorade, bottle 9 months
Gatorade, powdered 6-8 months
Juice, bottle – shelf-stable 9 months
Juice, box 4-6 months
Juice, canned 18 months
Juice Concentrate, shelf-stable 9 months
Milk Alternative (soy, almond, rice, coconut milk)
1 month
Milk, evaporated 1 year
Milk, non-date dry 1 year
Milk, self-stable UHT 6 months
Milk, sweetened condensed 1 year
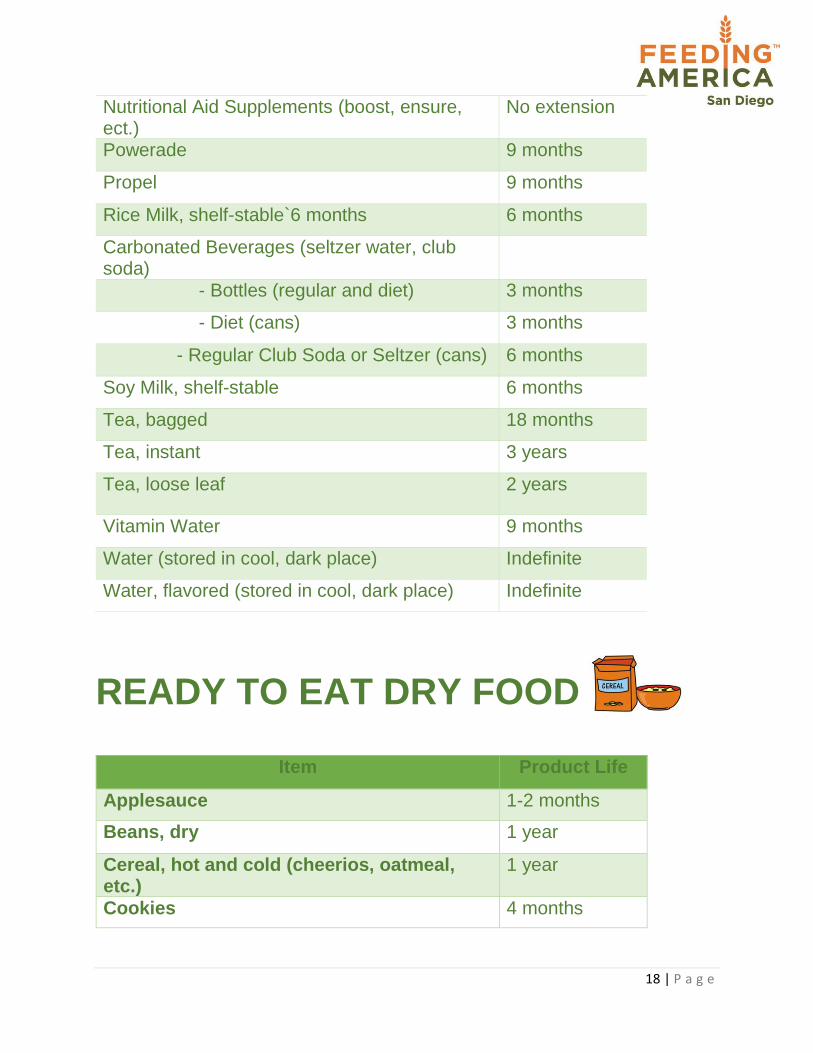
18 | P a g e
Nutritional Aid Supplements (boost, ensure, ect.)
No extension
Powerade 9 months
Propel 9 months
Rice Milk, shelf-stable`6 months 6 months
Carbonated Beverages (seltzer water, club soda)
- Bottles (regular and diet) 3 months
- Diet (cans) 3 months
- Regular Club Soda or Seltzer (cans) 6 months
Soy Milk, shelf-stable 6 months
Tea, bagged 18 months
Tea, instant 3 years
Tea, loose leaf 2 years
Vitamin Water 9 months
Water (stored in cool, dark place) Indefinite
Water, flavored (stored in cool, dark place) Indefinite
READY TO EAT DRY FOOD
Item Product Life
Applesauce 1-2 months
Beans, dry 1 year
Cereal, hot and cold (cheerios, oatmeal, etc.)
1 year
Cookies 4 months
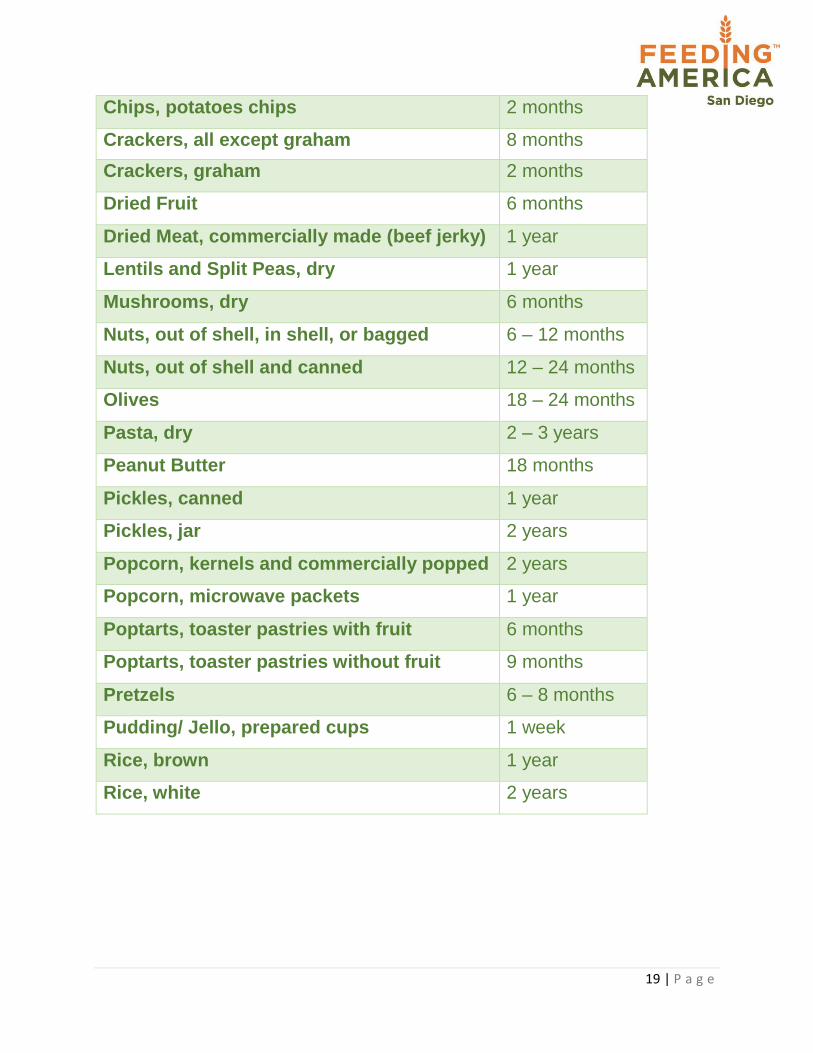
19 | P a g e
Chips, potatoes chips 2 months
Crackers, all except graham 8 months
Crackers, graham 2 months
Dried Fruit 6 months
Dried Meat, commercially made (beef jerky) 1 year
Lentils and Split Peas, dry 1 year
Mushrooms, dry 6 months
Nuts, out of shell, in shell, or bagged 6 – 12 months
Nuts, out of shell and canned 12 – 24 months
Olives 18 – 24 months
Pasta, dry 2 – 3 years
Peanut Butter 18 months
Pickles, canned 1 year
Pickles, jar 2 years
Popcorn, kernels and commercially popped 2 years
Popcorn, microwave packets 1 year
Poptarts, toaster pastries with fruit 6 months
Poptarts, toaster pastries without fruit 9 months
Pretzels 6 – 8 months
Pudding/ Jello, prepared cups 1 week
Rice, brown 1 year
Rice, white 2 years
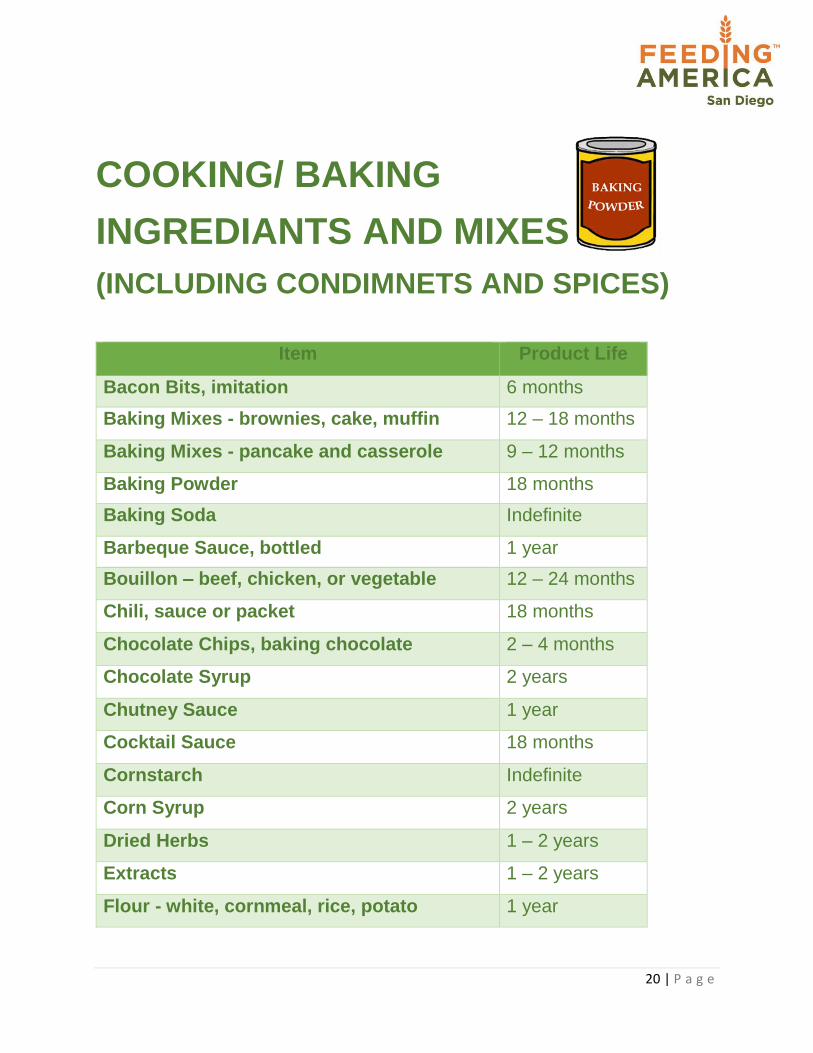
20 | P a g e
COOKING/ BAKING
INGREDIANTS AND MIXES
(INCLUDING CONDIMNETS AND SPICES)
Item Product Life
Bacon Bits, imitation 6 months
Baking Mixes - brownies, cake, muffin 12 – 18 months
Baking Mixes - pancake and casserole 9 – 12 months
Baking Powder 18 months
Baking Soda Indefinite
Barbeque Sauce, bottled 1 year
Bouillon – beef, chicken, or vegetable 12 – 24 months
Chili, sauce or packet 18 months
Chocolate Chips, baking chocolate 2 – 4 months
Chocolate Syrup 2 years
Chutney Sauce 1 year
Cocktail Sauce 18 months
Cornstarch Indefinite
Corn Syrup 2 years
Dried Herbs 1 – 2 years
Extracts 1 – 2 years
Flour - white, cornmeal, rice, potato 1 year
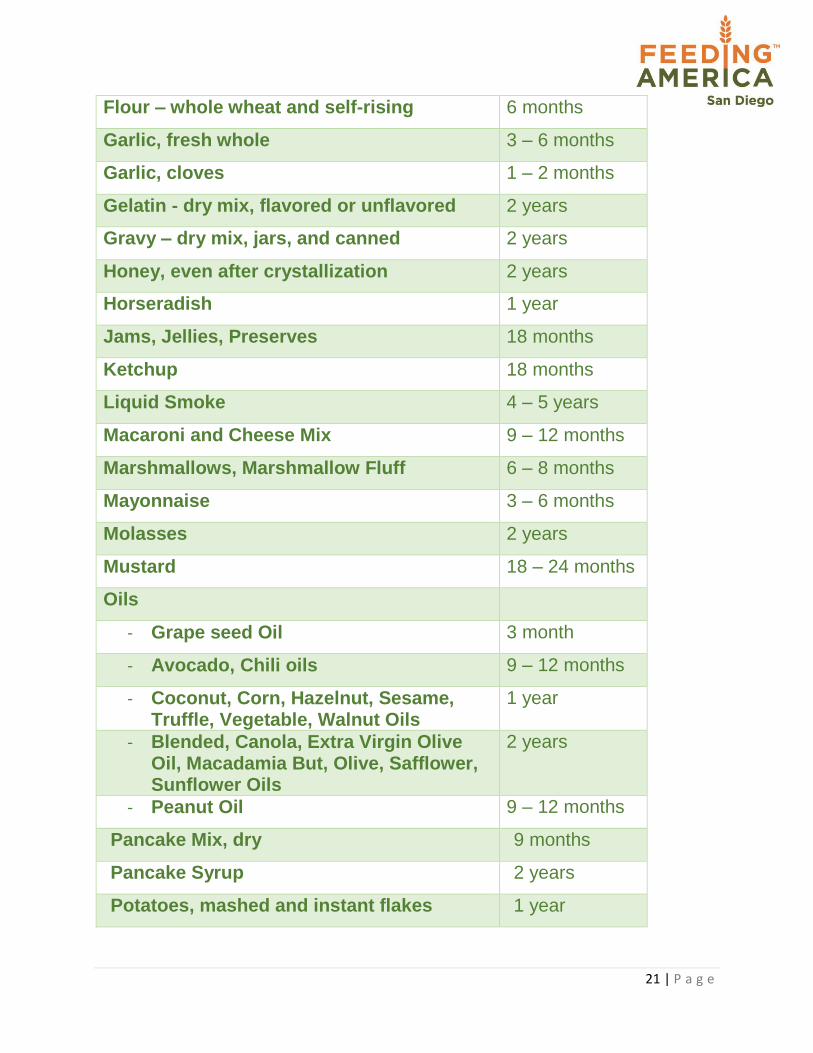
21 | P a g e
Flour – whole wheat and self-rising 6 months
Garlic, fresh whole 3 – 6 months
Garlic, cloves 1 – 2 months
Gelatin - dry mix, flavored or unflavored 2 years
Gravy – dry mix, jars, and canned 2 years
Honey, even after crystallization 2 years
Horseradish 1 year
Jams, Jellies, Preserves 18 months
Ketchup 18 months
Liquid Smoke 4 – 5 years
Macaroni and Cheese Mix 9 – 12 months
Marshmallows, Marshmallow Fluff 6 – 8 months
Mayonnaise 3 – 6 months
Molasses 2 years
Mustard 18 – 24 months
Oils
- Grape seed Oil 3 month
- Avocado, Chili oils 9 – 12 months
- Coconut, Corn, Hazelnut, Sesame, Truffle, Vegetable, Walnut Oils
1 year
- Blended, Canola, Extra Virgin Olive Oil, Macadamia But, Olive, Safflower, Sunflower Oils
2 years
- Peanut Oil 9 – 12 months
Pancake Mix, dry 9 months
Pancake Syrup 2 years
Potatoes, mashed and instant flakes 1 year
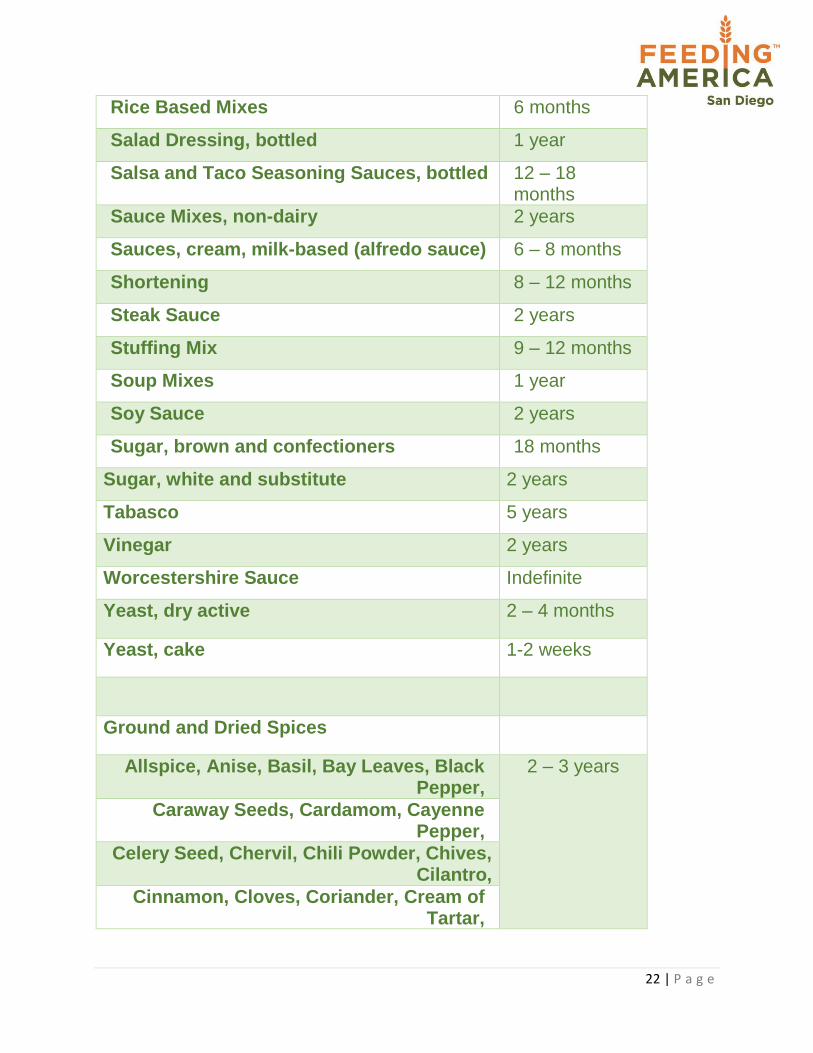
22 | P a g e
Rice Based Mixes 6 months
Salad Dressing, bottled 1 year
Salsa and Taco Seasoning Sauces, bottled 12 – 18 months
Sauce Mixes, non-dairy 2 years
Sauces, cream, milk-based (alfredo sauce) 6 – 8 months
Shortening 8 – 12 months
Steak Sauce 2 years
Stuffing Mix 9 – 12 months
Soup Mixes 1 year
Soy Sauce 2 years
Sugar, brown and confectioners 18 months
Sugar, white and substitute 2 years
Tabasco 5 years
Vinegar 2 years
Worcestershire Sauce Indefinite
Yeast, dry active 2 – 4 months
Yeast, cake 1-2 weeks
Ground and Dried Spices
Allspice, Anise, Basil, Bay Leaves, Black Pepper,
2 – 3 years
Caraway Seeds, Cardamom, Cayenne Pepper,
Celery Seed, Chervil, Chili Powder, Chives, Cilantro,
Cinnamon, Cloves, Coriander, Cream of Tartar,
23 | P a g e
Cumin, Curry, Dill, Fennel, Garlic, Italian Seasoning,
Jalapenos, Jerk Seasoning, Lavender, Lemon Grass,
Liquid Smoke, Mace, Maple, Marjoram, Mustard,
Nutmeg, Onion, Oregano, Paprika, Parsley,
Peppercorn, Pickling Spice, Poppy Seeds, Poultry
Seasoning, Pumpkin Pie Spice
Ground and Dried Spices
Oranges, Mint 1 – 3 years
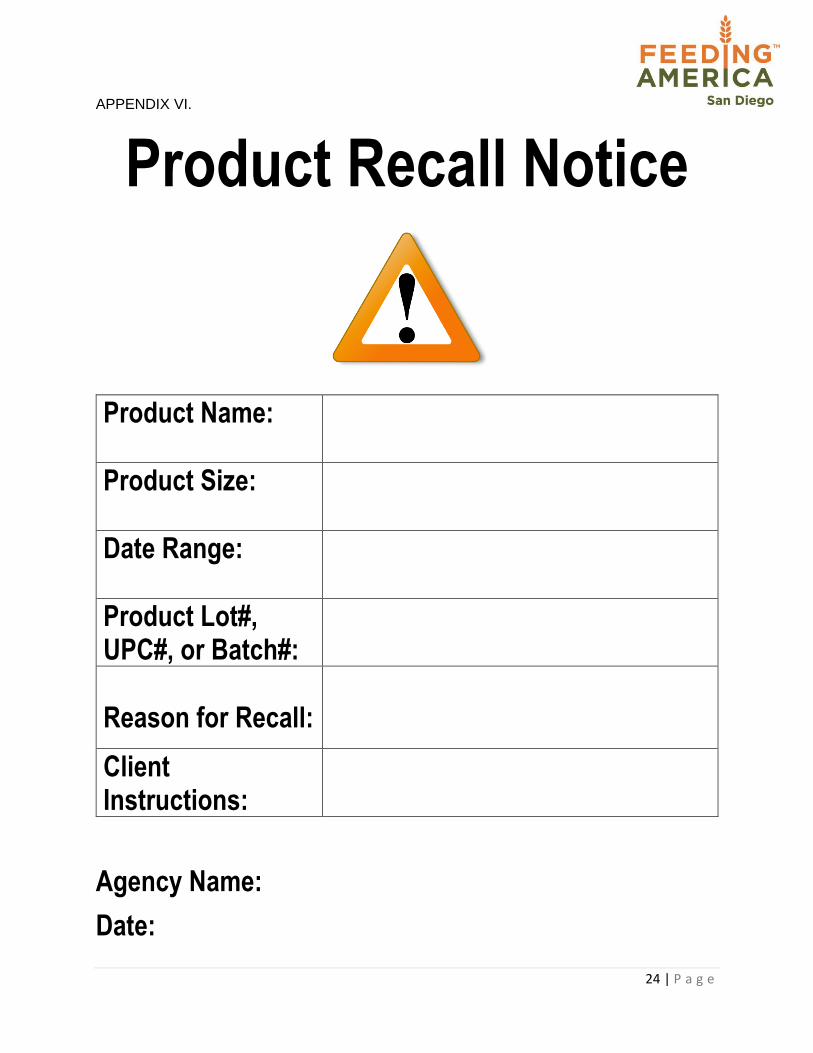
24 | P a g e
APPENDIX VI.
Product Recall Notice
Product Name:
Product Size:
Date Range:
Product Lot#, UPC#, or Batch#:
Reason for Recall:
Client Instructions:
Agency Name:
Date:
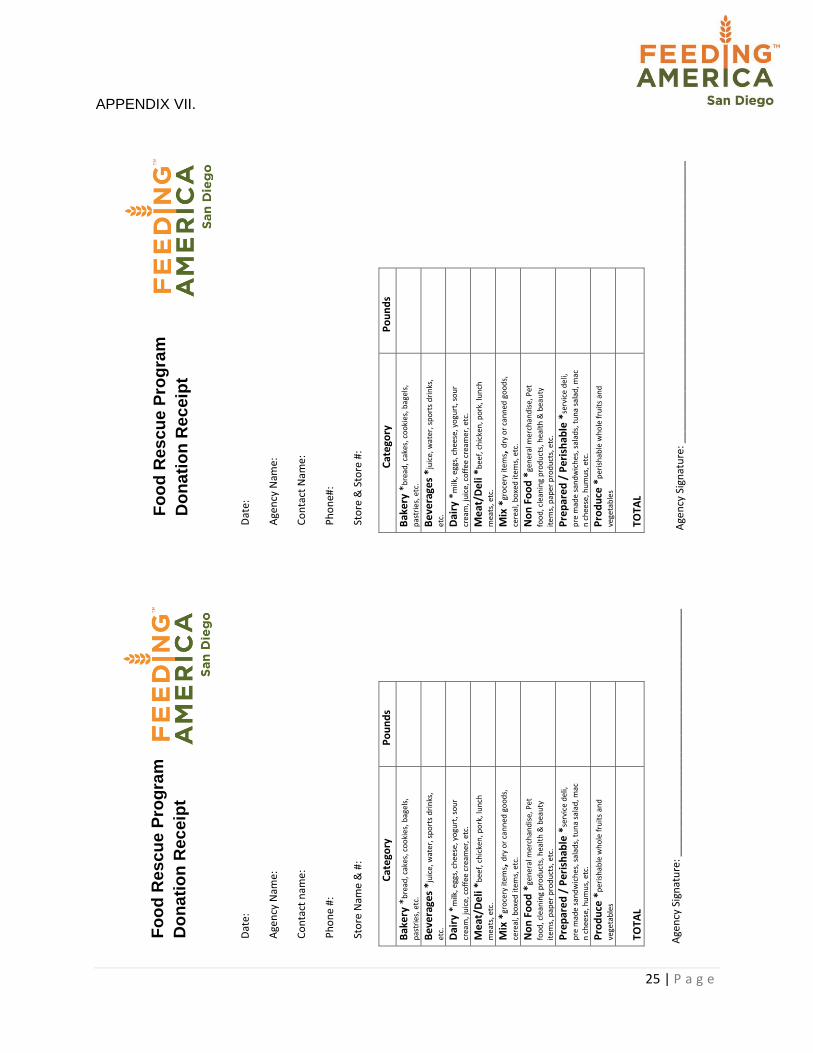
25 | P a g e
APPENDIX VII.
Dat
e:
Age
ncy
Nam
e:
Co
nta
ct n
ame:
P
ho
ne
#:
Sto
re N
ame
& #
:
Cat
ego
ry
Po
un
ds
Bak
ery
*b
read
, cak
es, c
oo
kies
, bag
els,
pas
trie
s, e
tc.
Be
vera
ges
*ju
ice,
wat
er, s
po
rts
dri
nks
,
etc.
Dai
ry *
milk
, egg
s, c
hee
se, y
ogu
rt, s
ou
r
crea
m, j
uic
e, c
off
ee c
ream
er, e
tc.
Me
at/D
eli
*b
eef,
ch
icke
n, p
ork
, lu
nch
mea
ts, e
tc.
Mix
*gr
oce
ry it
ems,
dry
or
can
ned
go
od
s,
cere
al, b
oxe
d it
ems,
etc
.
No
n F
oo
d *
gen
eral
mer
chan
dis
e, P
et
foo
d, c
lean
ing
pro
du
cts,
hea
lth
& b
eau
ty
item
s, p
aper
pro
du
cts,
etc
.
Pre
par
ed
/ P
eris
hab
le *
serv
ice
del
i,
pre
mad
e sa
nd
wic
hes
, sal
ads,
tu
na
sala
d, m
ac
n c
hee
se, h
um
us,
etc
.
Pro
du
ce *
per
ish
able
wh
ole
fru
its
and
vege
tab
les
TO
TAL
Age
ncy
Sig
nat
ure
: __
___
___
____
___
___
___
____
____
___
____
___
___
_
Dat
e:
Age
ncy
Nam
e:
Co
nta
ct N
ame:
Ph
on
e#:
Sto
re &
Sto
re #
:
Cat
ego
ry
Po
un
ds
Bak
ery
*b
read
, cak
es, c
oo
kies
, bag
els,
pas
trie
s, e
tc.
Be
vera
ges
*ju
ice,
wat
er, s
po
rts
dri
nks
,
etc.
Dai
ry *
milk
, egg
s, c
hee
se, y
ogu
rt, s
ou
r
crea
m, j
uic
e, c
off
ee c
ream
er, e
tc.
Me
at/D
eli
*b
eef,
ch
icke
n, p
ork
, lu
nch
mea
ts, e
tc.
Mix
*gr
oce
ry it
ems,
dry
or
can
ned
go
od
s,
cere
al, b
oxe
d it
ems,
etc
. N
on
Fo
od
*ge
ner
al m
erch
and
ise,
Pet
foo
d, c
lean
ing
pro
du
cts,
hea
lth
& b
eau
ty
item
s, p
aper
pro
du
cts,
etc
.
Pre
par
ed
/ P
eris
hab
le *
serv
ice
del
i,
pre
mad
e sa
nd
wic
hes
, sal
ads,
tu
na
sala
d, m
ac
n c
hee
se, h
um
us,
etc
. P
rod
uce
*p
eris
hab
le w
ho
le f
ruit
s an
d
vege
tab
les
TO
TAL
Age
ncy
Sig
nat
ure
: __
___
___
___
___
___
___
___
___
____
____
___
___
___
____
__
Fo
od
Re
sc
ue
Pro
gra
m
Do
na
tio
n R
ec
eip
t
Fo
od
Re
sc
ue
Pro
gra
m
Do
na
tio
n R
ec
eip
t


