ECONOMIC FOOTPRINT OF SWEDISH VENTURE CAPITAL
May 2019
Swedish Private Equity & Venture Capital Association (SVCA)
Overview of report
2
PART 3:
PART 1:
PART 2:
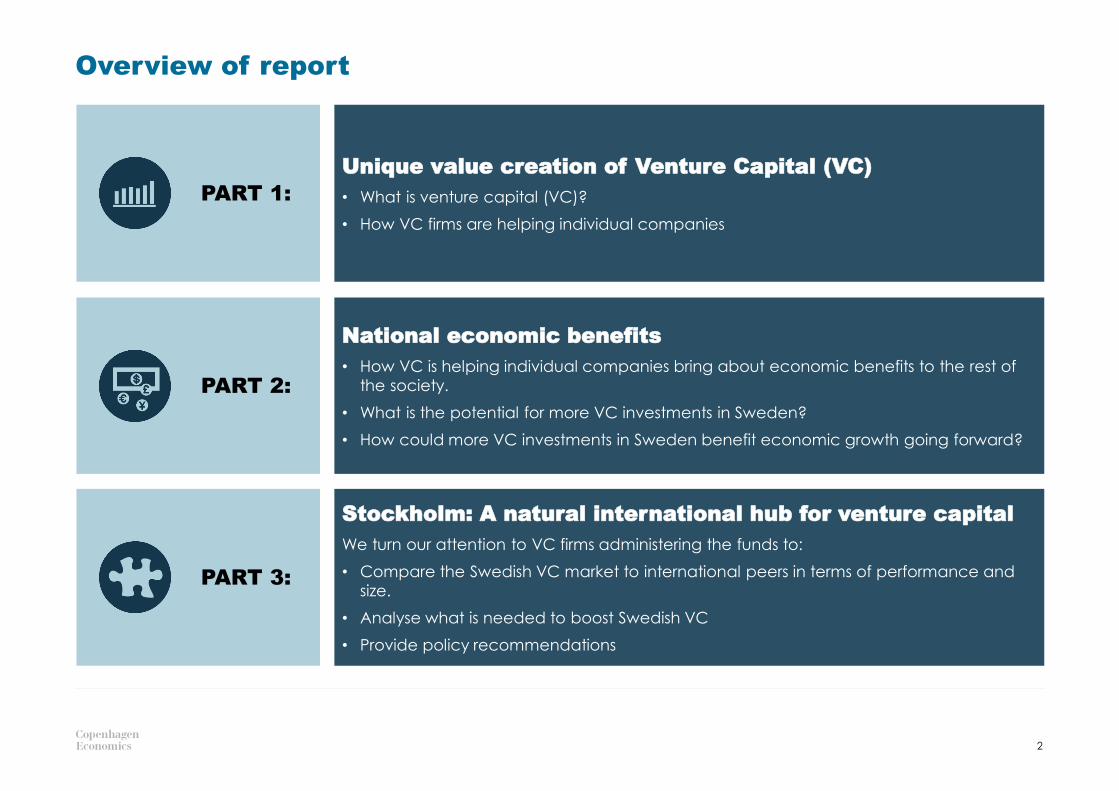
Stockholm: A natural international hub for venture capital
We turn our attention to VC firms administering the funds to:
• Compare the Swedish VC market to international peers in terms of performance and
size.
• Analyse what is needed to boost Swedish VC
• Provide policy recommendations
Unique value creation of Venture Capital (VC)
• What is venture capital (VC)?
• How VC firms are helping individual companies
National economic benefits
• How VC is helping individual companies bring about economic benefits to the rest of
the society.
• What is the potential for more VC investments in Sweden?
• How could more VC investments in Sweden benefit economic growth going forward?

1UNIQUE VALUE CREATION OF VENTURE CAPITAL
How are venture capital firms helping companies to succeed?
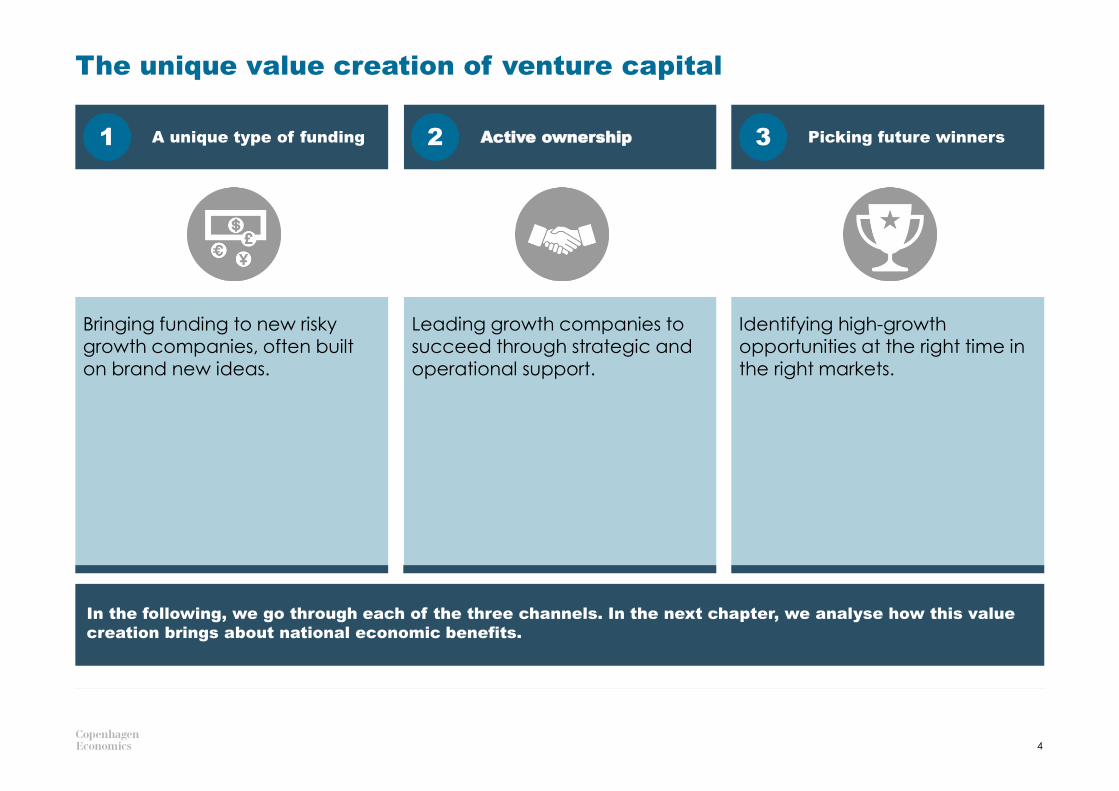
The unique value creation of venture capital
4
A unique type of funding Active ownership Picking future winners1 2 3
Bringing funding to new risky growth companies, often built
on brand new ideas.
Leading growth companies to succeed through strategic and
operational support.
Identifying high-growth opportunities at the right time in
the right markets.
In the following, we go through each of the three channels. In the next chapter, we analyse how this value
creation brings about national economic benefits.
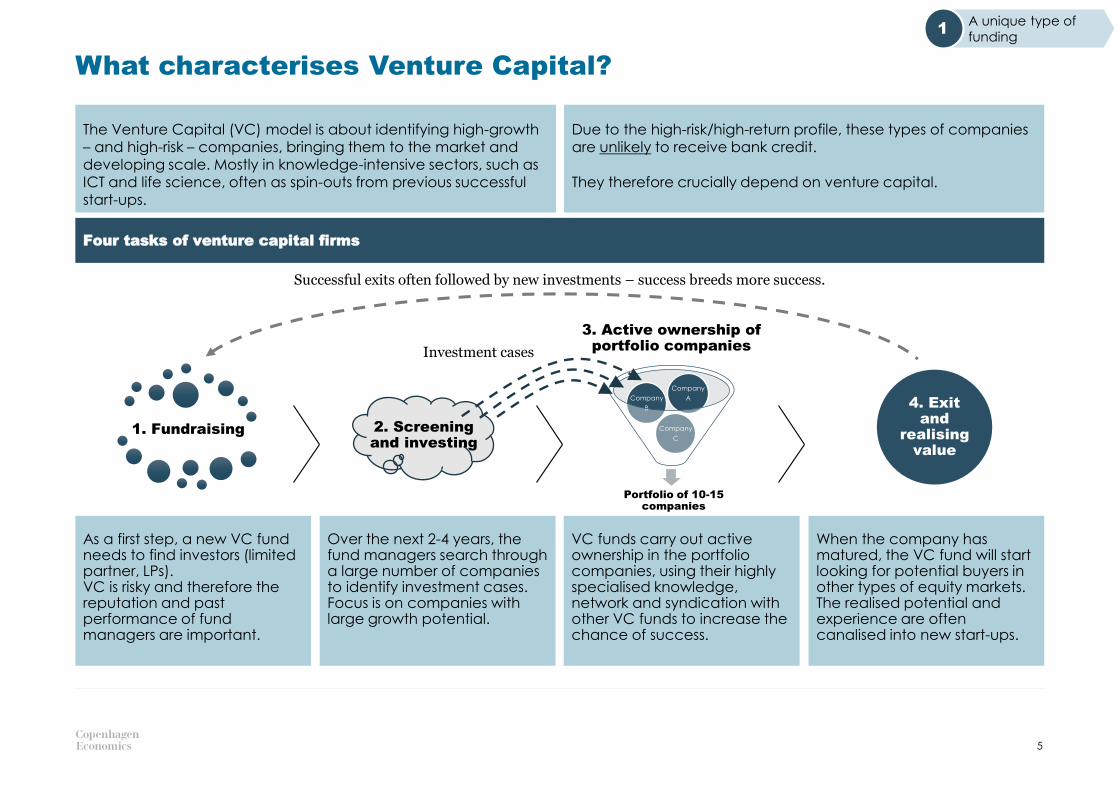
What characterises Venture Capital?
5
The Venture Capital (VC) model is about identifying high-growth – and high-risk – companies, bringing them to the market and developing scale. Mostly in knowledge-intensive sectors, such as ICT and life science, often as spin-outs from previous successful
start-ups.
Four tasks of venture capital firms
When the company has matured, the VC fund will start looking for potential buyers in other types of equity markets. The realised potential and experience are often canalised into new start-ups.
As a first step, a new VC fund needs to find investors (limited partner, LPs).VC is risky and therefore the reputation and past performance of fund managers are important.
Over the next 2-4 years, the fund managers search through a large number of companies to identify investment cases.Focus is on companies with large growth potential.
VC funds carry out active ownership in the portfolio companies, using their highly specialised knowledge, network and syndication with other VC funds to increase the chance of success.
1. Fundraising 2. Screening and investing
4. Exit and
realising value
Portfolio of 10-15 companies
Company
C
Company
B
Company
A
3. Active ownership of portfolio companiesInvestment cases
Successful exits often followed by new investments – success breeds more success.
Due to the high-risk/high-return profile, these types of companies are unlikely to receive bank credit.
They therefore crucially depend on venture capital.
A unique type of
funding1
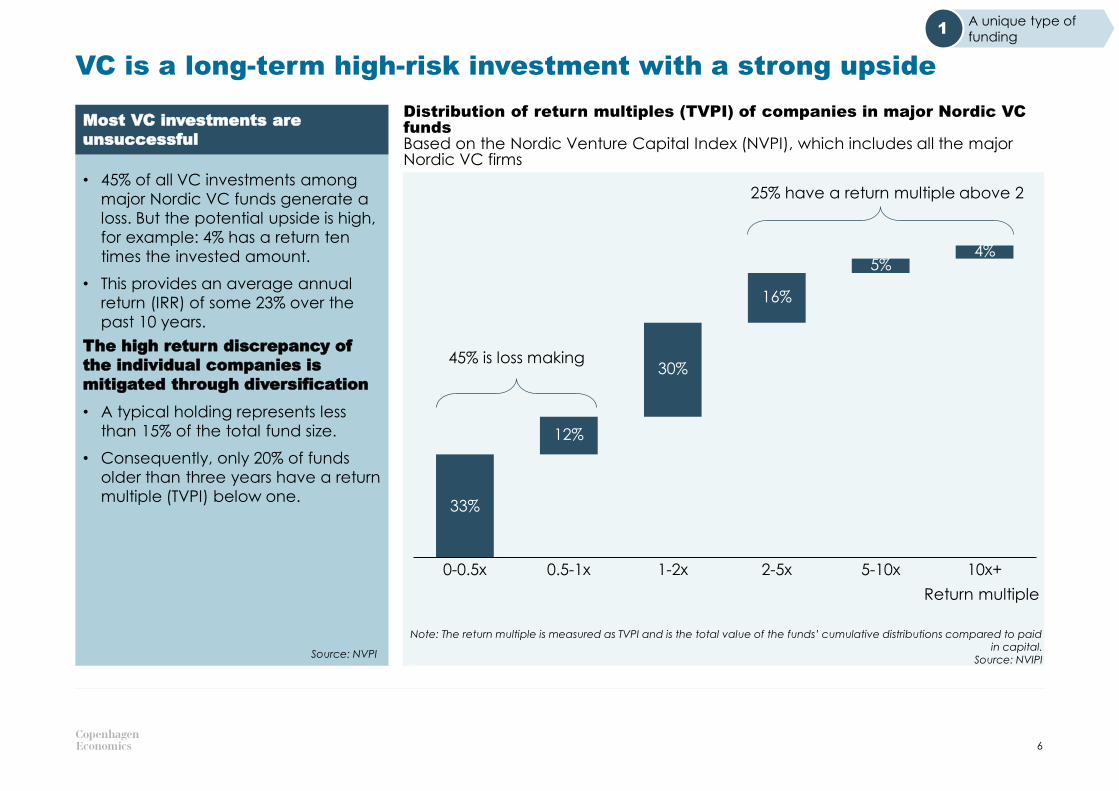
VC is a long-term high-risk investment with a strong upside
Note: The return multiple is measured as TVPI and is the total value of the funds’ cumulative distributions compared to paid in capital.
Source: NVIPI
6
• 45% of all VC investments among
major Nordic VC funds generate a
loss. But the potential upside is high,
for example: 4% has a return ten
times the invested amount.
• This provides an average annual
return (IRR) of some 23% over the
past 10 years.
The high return discrepancy of
the individual companies is
mitigated through diversification
• A typical holding represents less
than 15% of the total fund size.
• Consequently, only 20% of funds
older than three years have a return
multiple (TVPI) below one.
Most VC investments are
unsuccessful
Return multiple
16%
30%
4%5%
Source: NVPI
33%
2-5x0.5-1x0-0.5x
5%
12%
30%
1-2x 5-10x
16%
4%
10x+
A unique type of
funding1
45% is loss making
25% have a return multiple above 2
Distribution of return multiples (TVPI) of companies in major Nordic VC funds Based on the Nordic Venture Capital Index (NVPI), which includes all the major Nordic VC firms
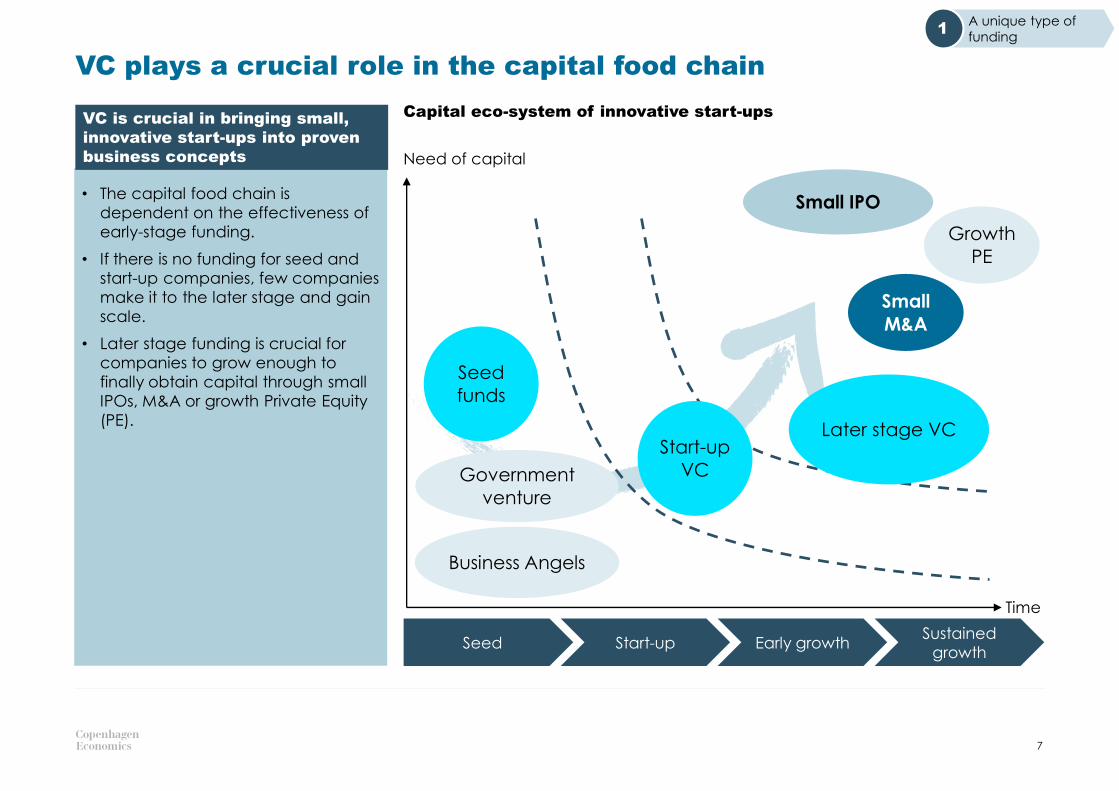
• The capital food chain is
dependent on the effectiveness of
early-stage funding.
• If there is no funding for seed and
start-up companies, few companies
make it to the later stage and gain
scale.
• Later stage funding is crucial for
companies to grow enough to
finally obtain capital through small
IPOs, M&A or growth Private Equity
(PE).
7
Seed Start-up Early growthSustained
growth
Small
M&A
Growth
PE
Government
venture
Start-up
VC
Business Angels
Seed
funds
Later stage VC
Small IPO
Time
Need of capital
Capital eco-system of innovative start-ups VC is crucial in bringing small,
innovative start-ups into proven
business concepts
A unique type of
funding1
VC plays a crucial role in the capital food chain
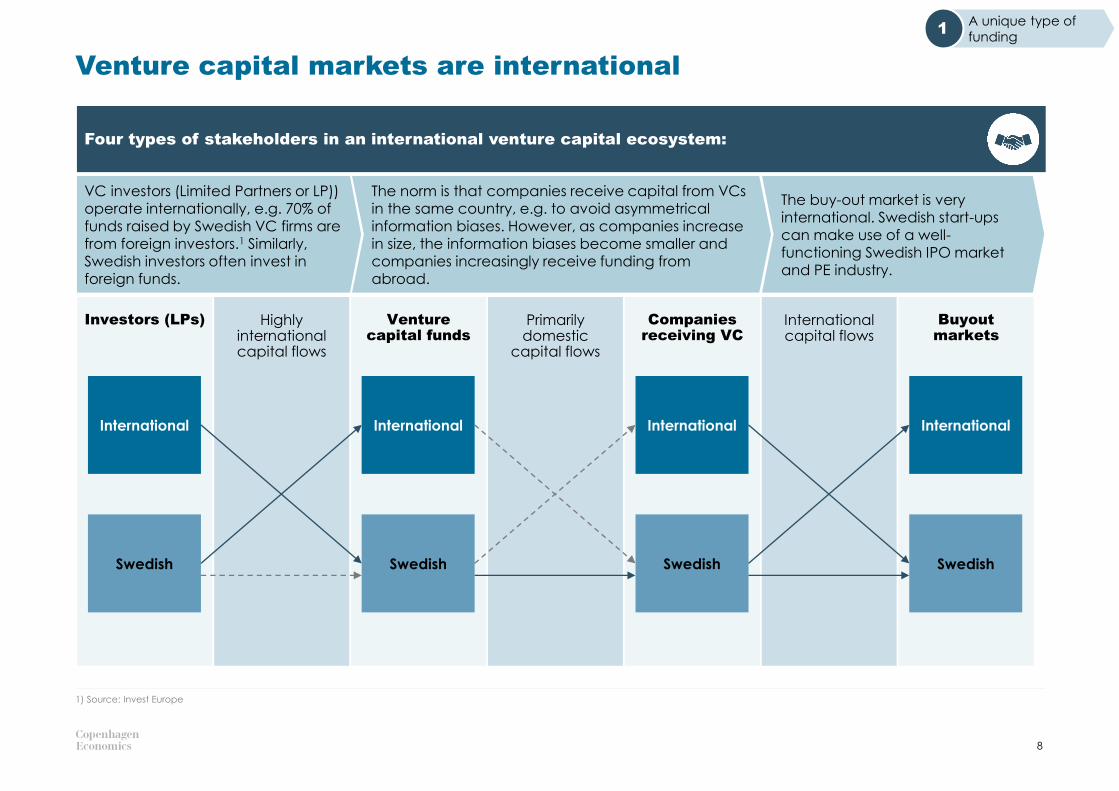
Venture capital markets are international
8
1) Source: Invest Europe
A unique type of
funding1
Four types of stakeholders in an international venture capital ecosystem:
The buy-out market is very international. Swedish start-ups can make use of a well-functioning Swedish IPO market and PE industry.
The norm is that companies receive capital from VCs in the same country, e.g. to avoid asymmetrical
information biases. However, as companies increase in size, the information biases become smaller and companies increasingly receive funding from abroad.
VC investors (Limited Partners or LP)) operate internationally, e.g. 70% of
funds raised by Swedish VC firms are from foreign investors.1 Similarly, Swedish investors often invest in foreign funds.
International capital flows
Highly internationalcapital flows
Venture capital funds
Primarily domestic
capital flows
Companies receiving VC
Investors (LPs) Buyout markets
International International International International
Swedish SwedishSwedishSwedish
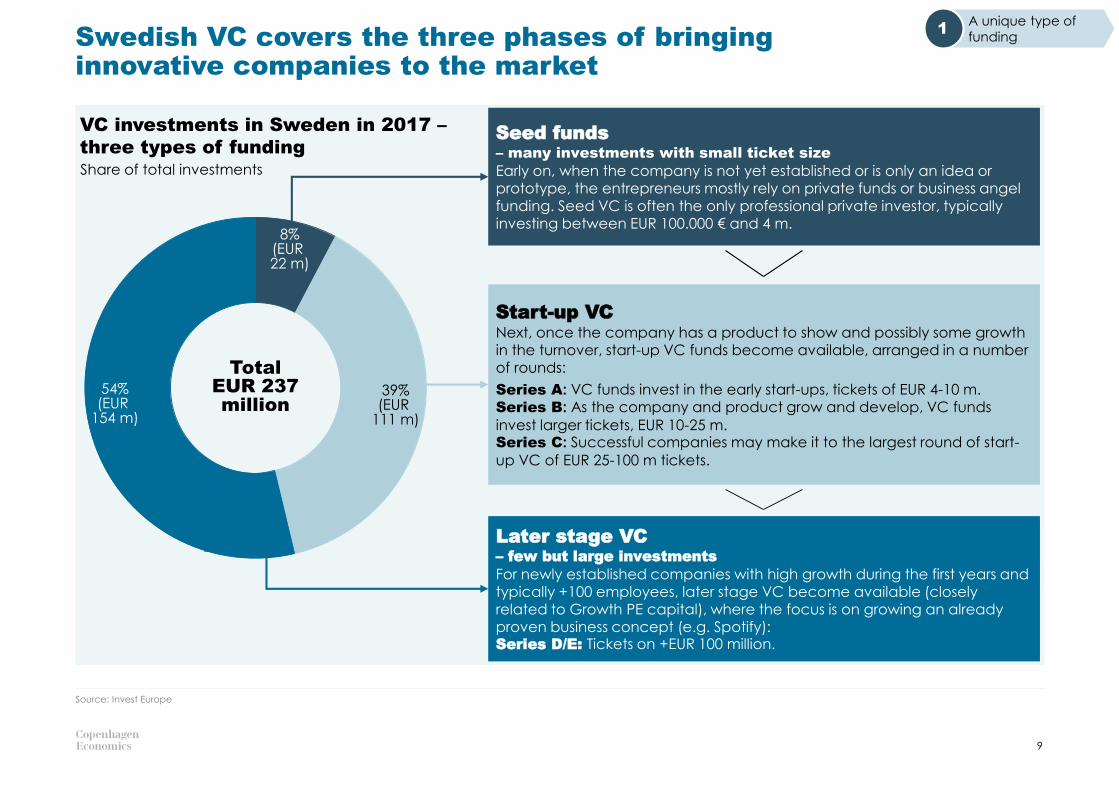
Swedish VC covers the three phases of bringing innovative companies to the market
VC investments in Sweden in 2017 –
three types of funding
9
Share of total investments
Source: Invest Europe
Large
Start-up VCNext, once the company has a product to show and possibly some growth in the turnover, start-up VC funds become available, arranged in a number of rounds:
Series A: VC funds invest in the early start-ups, tickets of EUR 4-10 m. Series B: As the company and product grow and develop, VC funds
invest larger tickets, EUR 10-25 m.Series C: Successful companies may make it to the largest round of start-
up VC of EUR 25-100 m tickets.
A unique type of
funding1
8%(EUR 22 m)
39%(EUR
111 m)
54%(EUR
154 m)
Total EUR 237 million
Seed funds– many investments with small ticket size
Early on, when the company is not yet established or is only an idea or prototype, the entrepreneurs mostly rely on private funds or business angel funding. Seed VC is often the only professional private investor, typically investing between EUR 100.000 € and 4 m.
Later stage VC – few but large investments
For newly established companies with high growth during the first years and typically +100 employees, later stage VC become available (closely related to Growth PE capital), where the focus is on growing an already proven business concept (e.g. Spotify): Series D/E: Tickets on +EUR 100 million.
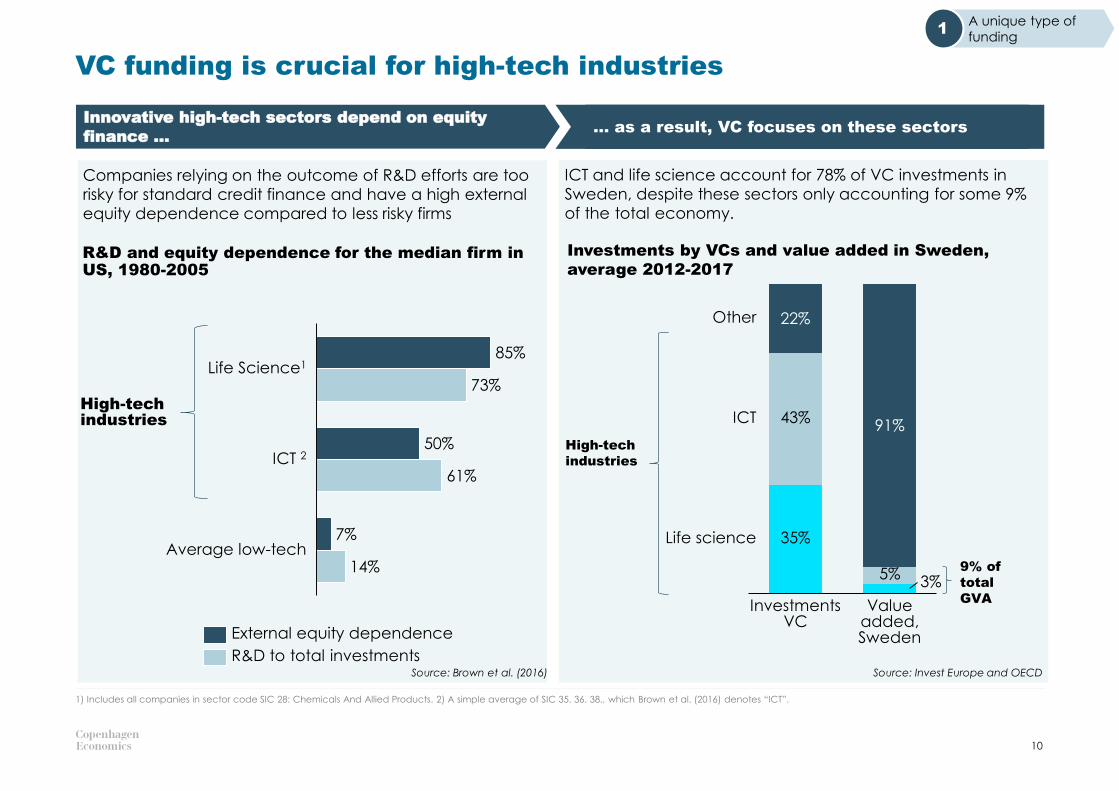
R&D and equity dependence for the median firm in US, 1980-2005
Companies relying on the outcome of R&D efforts are too
risky for standard credit finance and have a high external
equity dependence compared to less risky firms
Investments by VCs and value added in Sweden,
average 2012-2017
Innovative high-tech sectors depend on equity
finance …… as a result, VC focuses on these sectors
VC funding is crucial for high-tech industries
10
85%
50%
7%
73%
61%
14%
Life Science1
ICT 2
Average low-tech
External equity dependence
R&D to total investments
22%
91%
35%
43%
Investments VC
Life science
Other
5%
Value added, Sweden
3%
ICT
High-tech
industries
9% of
total
GVA
High-techindustries
1) Includes all companies in sector code SIC 28: Chemicals And Allied Products. 2) A simple average of SIC 35. 36. 38., which Brown et al. (2016) denotes “ICT”.
Source: Invest Europe and OECDSource: Brown et al. (2016)
A unique type of
funding1
ICT and life science account for 78% of VC investments in
Sweden, despite these sectors only accounting for some 9%
of the total economy.
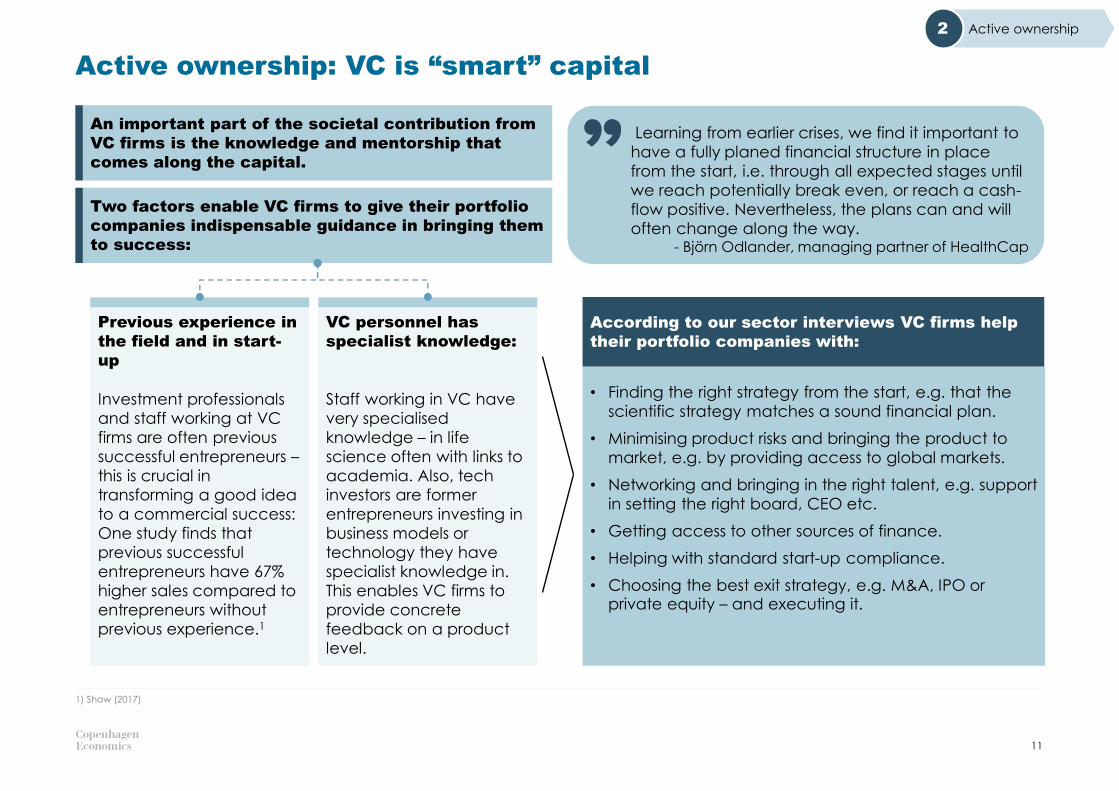
• Finding the right strategy from the start, e.g. that the
scientific strategy matches a sound financial plan.
• Minimising product risks and bringing the product to
market, e.g. by providing access to global markets.
• Networking and bringing in the right talent, e.g. support
in setting the right board, CEO etc.
• Getting access to other sources of finance.
• Helping with standard start-up compliance.
• Choosing the best exit strategy, e.g. M&A, IPO or private equity – and executing it.
Active ownership: VC is “smart” capital
11
1) Shaw (2017)
Active ownership2
According to our sector interviews VC firms help
their portfolio companies with:
VC personnel has
specialist knowledge:
Staff working in VC have
very specialised
knowledge – in life
science often with links to
academia. Also, tech
investors are former
entrepreneurs investing in
business models or
technology they have
specialist knowledge in.
This enables VC firms to
provide concrete
feedback on a product
level.
Previous experience in
the field and in start-
up
Investment professionals
and staff working at VC
firms are often previous
successful entrepreneurs –
this is crucial in
transforming a good idea
to a commercial success:
One study finds that
previous successful
entrepreneurs have 67%
higher sales compared to
entrepreneurs without
previous experience.1
An important part of the societal contribution from
VC firms is the knowledge and mentorship that
comes along the capital.
Two factors enable VC firms to give their portfolio
companies indispensable guidance in bringing them
to success:
Learning from earlier crises, we find it important to
have a fully planed financial structure in place
from the start, i.e. through all expected stages until
we reach potentially break even, or reach a cash-
flow positive. Nevertheless, the plans can and will
often change along the way. - Björn Odlander, managing partner of HealthCap
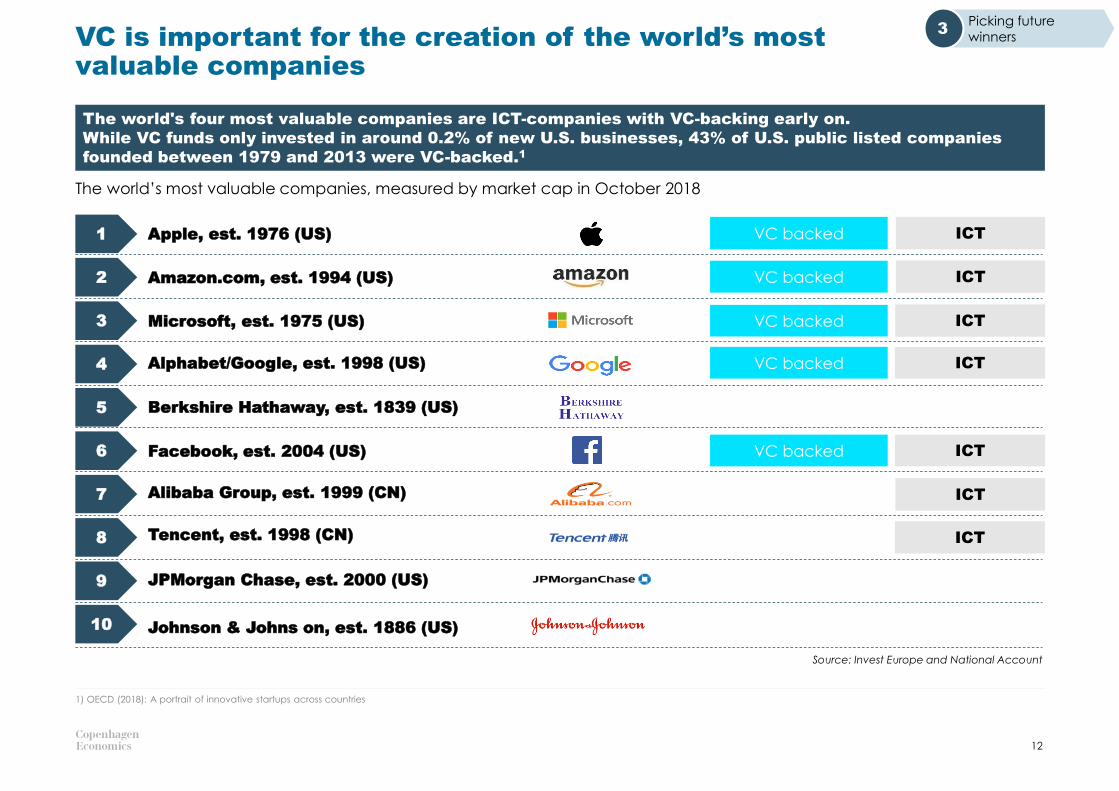
VC is important for the creation of the world’s most valuable companies
12
1) OECD (2018): A portrait of innovative startups across countries
The world’s most valuable companies, measured by market cap in October 2018
Apple, est. 1976 (US)
Amazon.com, est. 1994 (US)
Microsoft, est. 1975 (US)
Alphabet/Google, est. 1998 (US)
Johnson & Johns on, est. 1886 (US)
Facebook, est. 2004 (US)
Berkshire Hathaway, est. 1839 (US)
Alibaba Group, est. 1999 (CN)
Tencent, est. 1998 (CN)
1
2
3
4
10
6
5
7
8
9 JPMorgan Chase, est. 2000 (US)
VC backed ICT
VC backed ICT
VC backed ICT
VC backed ICT
VC backed ICT
ICT
ICT
The world's four most valuable companies are ICT-companies with VC-backing early on.
While VC funds only invested in around 0.2% of new U.S. businesses, 43% of U.S. public listed companies
founded between 1979 and 2013 were VC-backed.1
Source: Invest Europe and National Account
Picking future
winners3
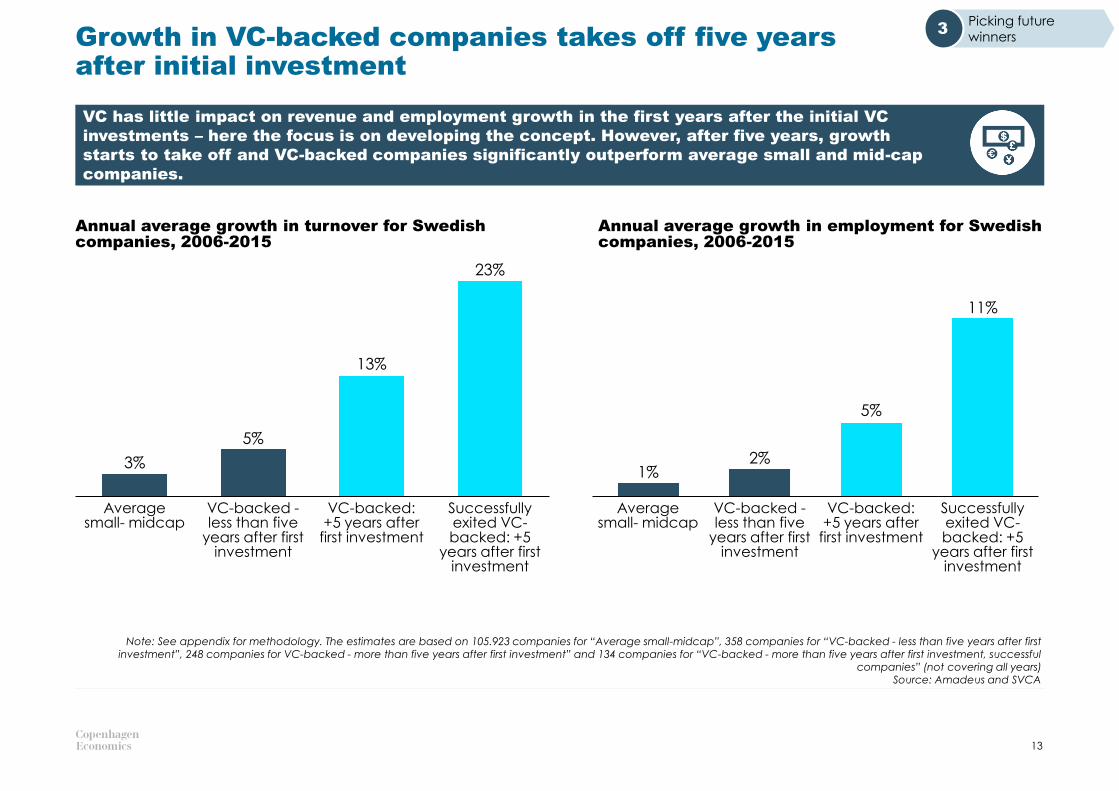
Growth in VC-backed companies takes off five years after initial investment
Annual average growth in employment for Swedish companies, 2006-2015
Note: See appendix for methodology. The estimates are based on 105.923 companies for “Average small-midcap”, 358 companies for “VC-backed - less than five years after first investment”, 248 companies for VC-backed - more than five years after first investment” and 134 companies for “VC-backed - more than five years after first investment, successful
companies” (not covering all years)Source: Amadeus and SVCA
13
VC has little impact on revenue and employment growth in the first years after the initial VC
investments – here the focus is on developing the concept. However, after five years, growth
starts to take off and VC-backed companies significantly outperform average small and mid-cap
companies.
Annual average growth in turnover for Swedish companies, 2006-2015
3%
5%
23%
VC-backed: +5 years after
first investment
Average small- midcap
Successfully exited VC-backed: +5
years after first investment
VC-backed -less than five
years after first investment
13%
1%2%
11%
VC-backed: +5 years after
first investment
5%
VC-backed -less than five
years after first investment
Average small- midcap
Successfully exited VC-backed: +5
years after first investment
Picking future
winners3
2NATIONAL ECONOMIC BENEFITS
In part 1, we showed that venture capital firms help companies to succeed: • How does this benefit Swedish society as a whole?• How can VC contribute to future economic growth in Sweden?
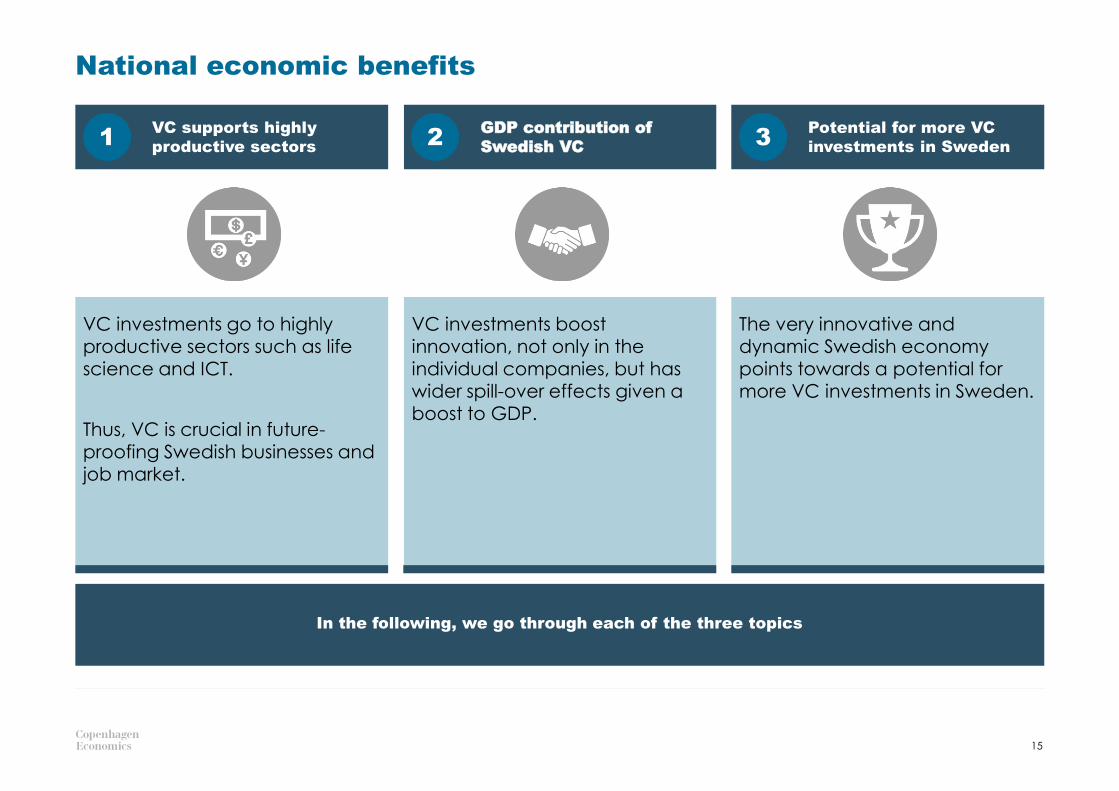
National economic benefits
15
VC supports highly
productive sectors
GDP contribution of
Swedish VC
Potential for more VC
investments in Sweden1 2 3
VC investments go to highly productive sectors such as life
science and ICT.
Thus, VC is crucial in future-proofing Swedish businesses and job market.
VC investments boost innovation, not only in the
individual companies, but has wider spill-over effects given a boost to GDP.
The very innovative and dynamic Swedish economy
points towards a potential for more VC investments in Sweden.
In the following, we go through each of the three topics
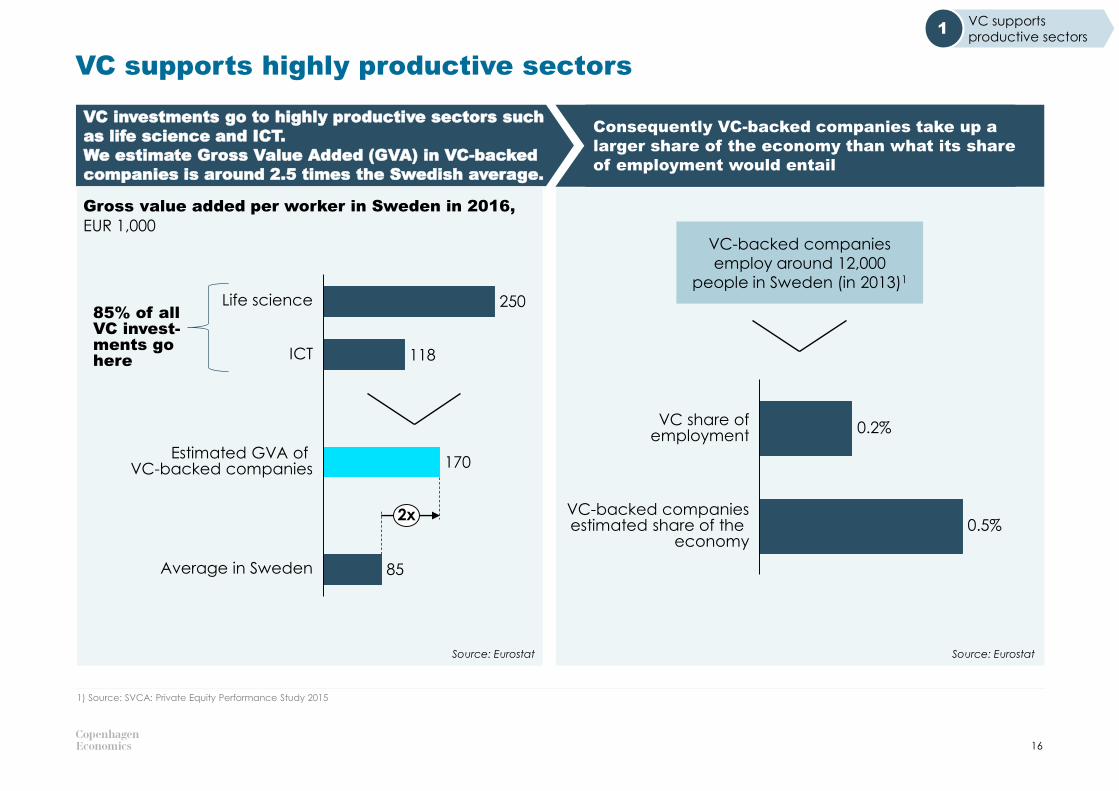
VC investments go to highly productive sectors such
as life science and ICT.
We estimate Gross Value Added (GVA) in VC-backed
companies is around 2.5 times the Swedish average.
Consequently VC-backed companies take up a
larger share of the economy than what its share
of employment would entail
VC supports highly productive sectors
1) Source: SVCA: Private Equity Performance Study 2015
16
250
118
170
85Average in Sweden
Life science
ICT
Estimated GVA of VC-backed companies
2x
85% of all VC invest-ments go here
VC-backed companies
employ around 12,000
people in Sweden (in 2013)1
0.2%
VC-backed companiesestimated share of the
economy
VC share ofemployment
0.5%
Gross value added per worker in Sweden in 2016,
EUR 1,000
VC supports
productive sectors1
Source: EurostatSource: Eurostat
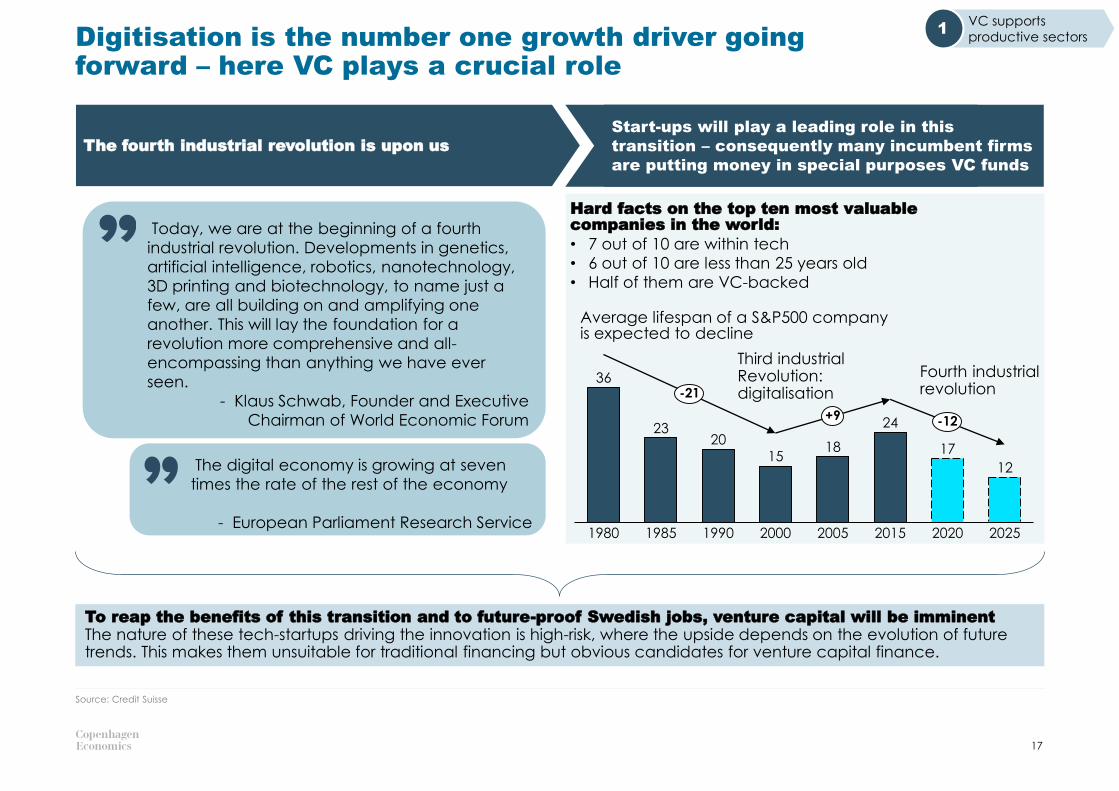
Digitisation is the number one growth driver going forward – here VC plays a crucial role
17
Source: Credit Suisse
Average lifespan of a S&P500 company is expected to decline
Hard facts on the top ten most valuable companies in the world:
• 7 out of 10 are within tech
• 6 out of 10 are less than 25 years old
• Half of them are VC-backed
36
2320
1518
24
17
12
1980 20001985 1990 2005 2015 2020 2025
-21
+9 -12
Third industrial Revolution: digitalisation
Fourth industrial revolution
To reap the benefits of this transition and to future-proof Swedish jobs, venture capital will be imminentThe nature of these tech-startups driving the innovation is high-risk, where the upside depends on the evolution of future trends. This makes them unsuitable for traditional financing but obvious candidates for venture capital finance.
VC supports
productive sectors1
The fourth industrial revolution is upon us
Start-ups will play a leading role in this
transition – consequently many incumbent firms
are putting money in special purposes VC funds
Today, we are at the beginning of a fourth
industrial revolution. Developments in genetics,
artificial intelligence, robotics, nanotechnology,
3D printing and biotechnology, to name just a
few, are all building on and amplifying one
another. This will lay the foundation for a
revolution more comprehensive and all-
encompassing than anything we have ever
seen.
- Klaus Schwab, Founder and Executive
Chairman of World Economic Forum
The digital economy is growing at seven
times the rate of the rest of the economy
- European Parliament Research Service
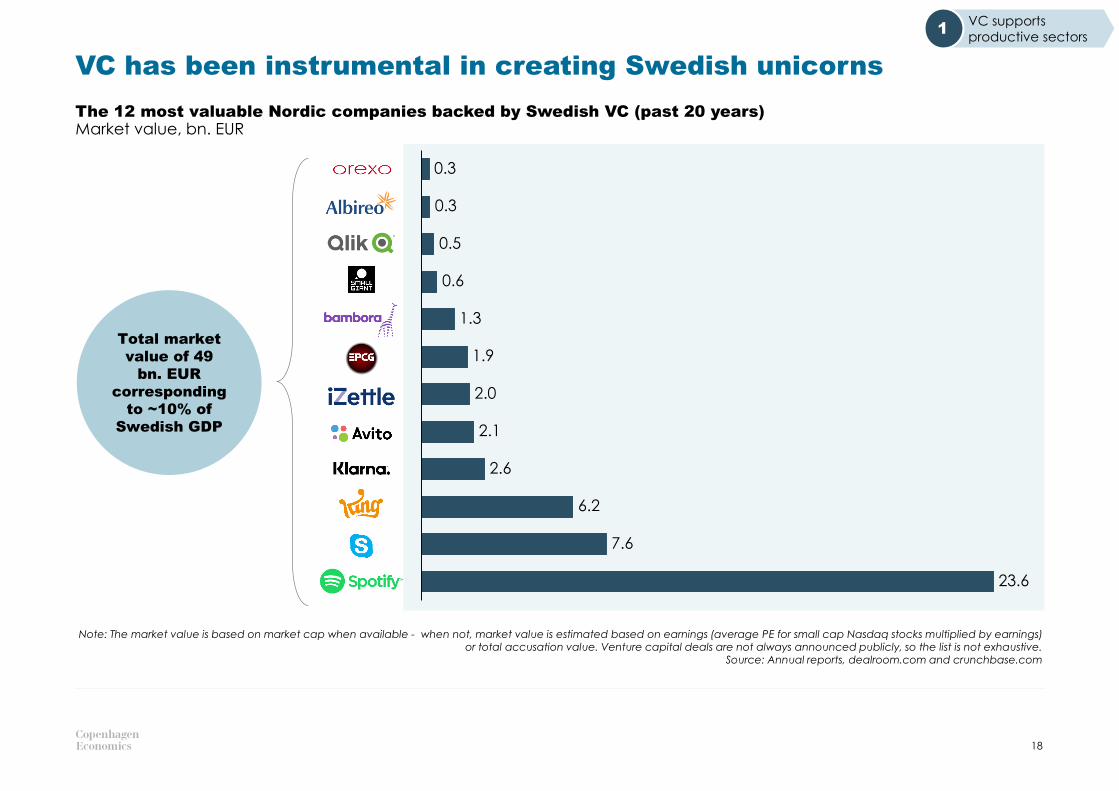
VC has been instrumental in creating Swedish unicorns
The 12 most valuable Nordic companies backed by Swedish VC (past 20 years)
18
Note: The market value is based on market cap when available - when not, market value is estimated based on earnings (average PE for small cap Nasdaq stocks multiplied by earnings) or total accusation value. Venture capital deals are not always announced publicly, so the list is not exhaustive.
Source: Annual reports, dealroom.com and crunchbase.com
Market value, bn. EUR
Total market
value of 49
bn. EUR
corresponding
to ~10% of
Swedish GDP 2.1
0.5
7.6
0.3
2.0
0.3
0.6
1.9
2.6
1.3
6.2
23.6
VC supports
productive sectors1
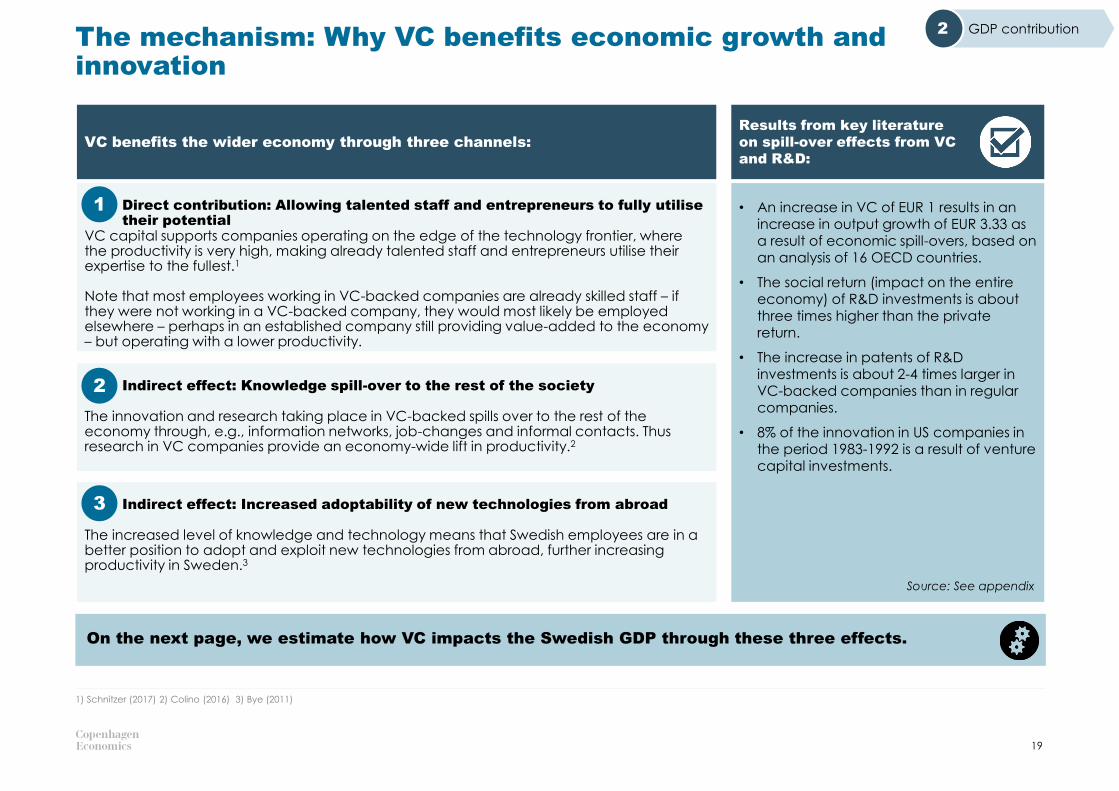
The mechanism: Why VC benefits economic growth and innovation
19
1) Schnitzer (2017) 2) Colino (2016) 3) Bye (2011)
Results from key literature
on spill-over effects from VC
and R&D:
• An increase in VC of EUR 1 results in an increase in output growth of EUR 3.33 as a result of economic spill-overs, based on an analysis of 16 OECD countries.
• The social return (impact on the entire economy) of R&D investments is about three times higher than the private return.
• The increase in patents of R&D investments is about 2-4 times larger in VC-backed companies than in regular companies.
• 8% of the innovation in US companies in the period 1983-1992 is a result of venture capital investments.
Direct contribution: Allowing talented staff and entrepreneurs to fully utilise their potential
VC capital supports companies operating on the edge of the technology frontier, where the productivity is very high, making already talented staff and entrepreneurs utilise their expertise to the fullest.1
Note that most employees working in VC-backed companies are already skilled staff – if they were not working in a VC-backed company, they would most likely be employed elsewhere – perhaps in an established company still providing value-added to the economy – but operating with a lower productivity.
Indirect effect: Knowledge spill-over to the rest of the society
The innovation and research taking place in VC-backed spills over to the rest of the economy through, e.g., information networks, job-changes and informal contacts. Thus research in VC companies provide an economy-wide lift in productivity.2
Indirect effect: Increased adoptability of new technologies from abroad
The increased level of knowledge and technology means that Swedish employees are in a better position to adopt and exploit new technologies from abroad, further increasing productivity in Sweden.3
1
2
3
Source: See appendix
On the next page, we estimate how VC impacts the Swedish GDP through these three effects.
VC benefits the wider economy through three channels:
GDP contribution2
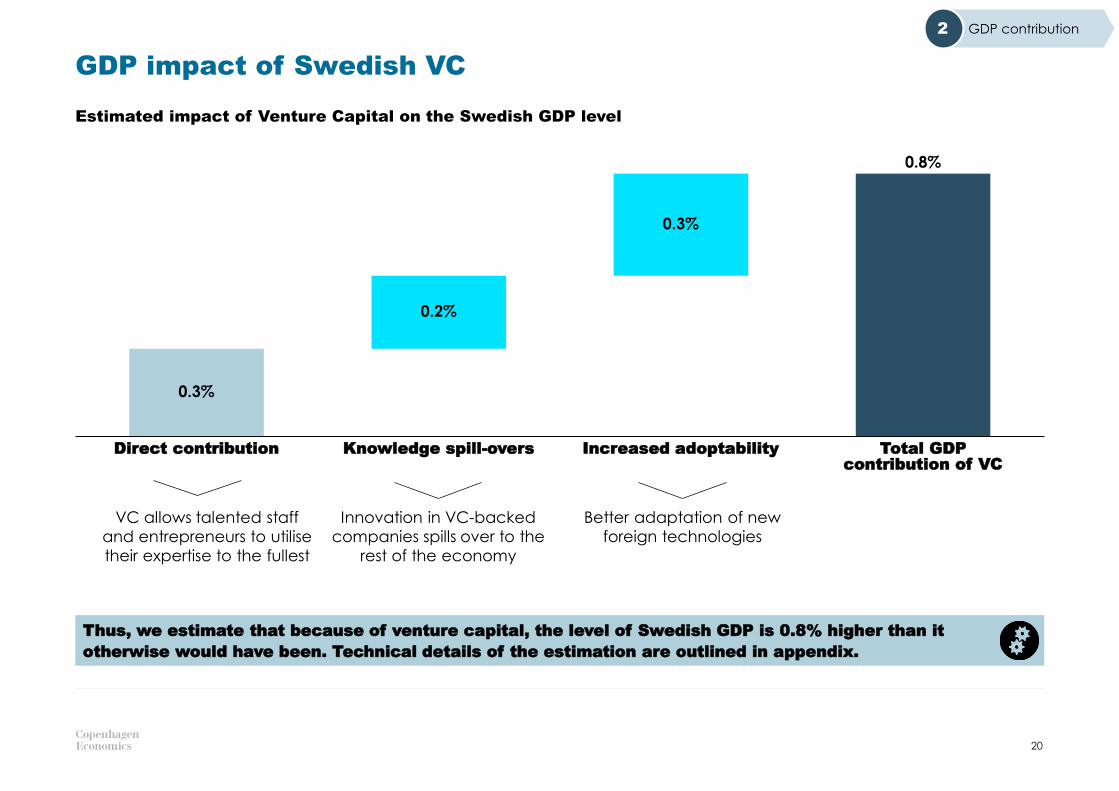
GDP impact of Swedish VC
Estimated impact of Venture Capital on the Swedish GDP level
20
Thus, we estimate that because of venture capital, the level of Swedish GDP is 0.8% higher than it
otherwise would have been. Technical details of the estimation are outlined in appendix.
0.3%
0.2%
VC allows talented staff
and entrepreneurs to utilise
their expertise to the fullest
Innovation in VC-backed
companies spills over to the
rest of the economy
Better adaptation of new
foreign technologies
0.3%
Increased adoptability
0.3%
Knowledge spill-oversDirect contribution Total GDP contribution of VC
0.2%
0.8%
GDP contribution2
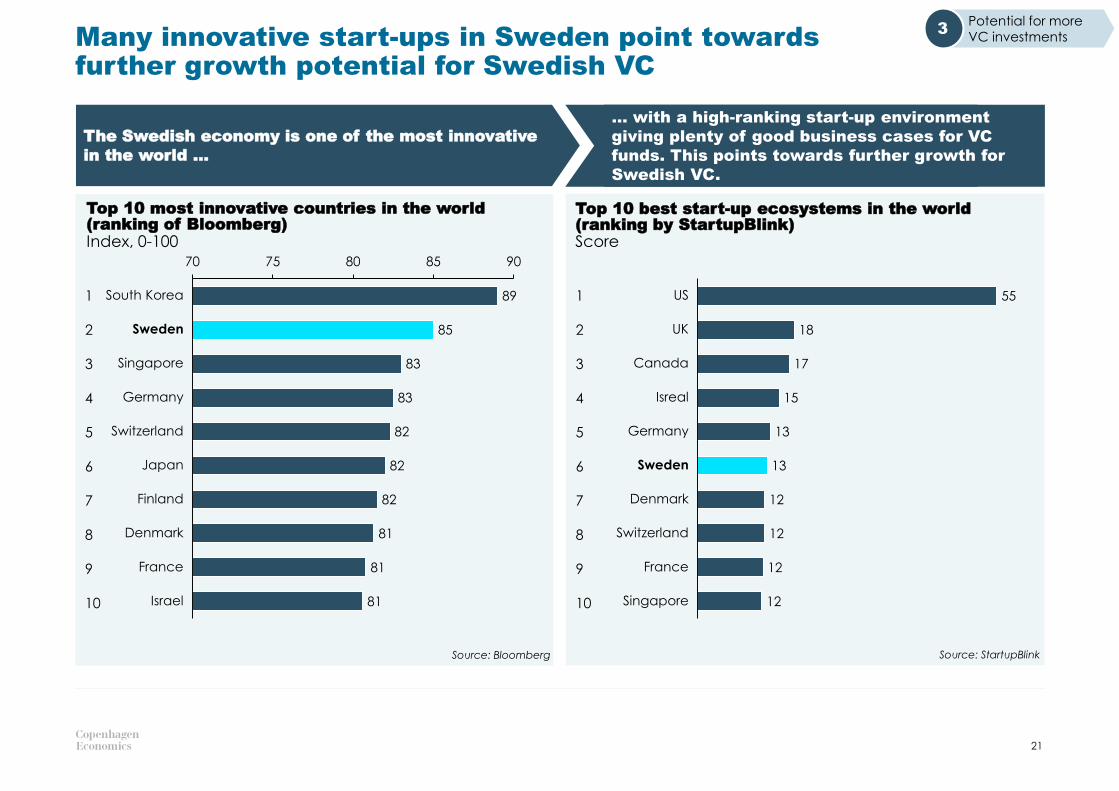
Many innovative start-ups in Sweden point towards further growth potential for Swedish VC
21
Potential for more
VC investments3
The Swedish economy is one of the most innovative
in the world …
… with a high-ranking start-up environment
giving plenty of good business cases for VC
funds. This points towards further growth for
Swedish VC.
Source: Bloomberg
Top 10 most innovative countries in the world (ranking of Bloomberg)
89
85
83
83
82
82
82
81
81
81
70 75 80 85 90
Switzerland
Finland
Japan
South Korea
Sweden
Singapore
Germany
Denmark
France
Israel
1
2
3
4
5
6
7
8
9
10
55
18
17
15
13
13
12
12
12
12
Switzerland
US
Canada
UK
Denmark
Isreal
Sweden
Germany
France
Singapore
Top 10 best start-up ecosystems in the world (ranking by StartupBlink)
Source: StartupBlink
1
2
3
4
5
6
7
8
9
10
Index, 0-100 Score
VC investments as a share
of GDP and potential based
on size of ICT and life
science sector in Sweden
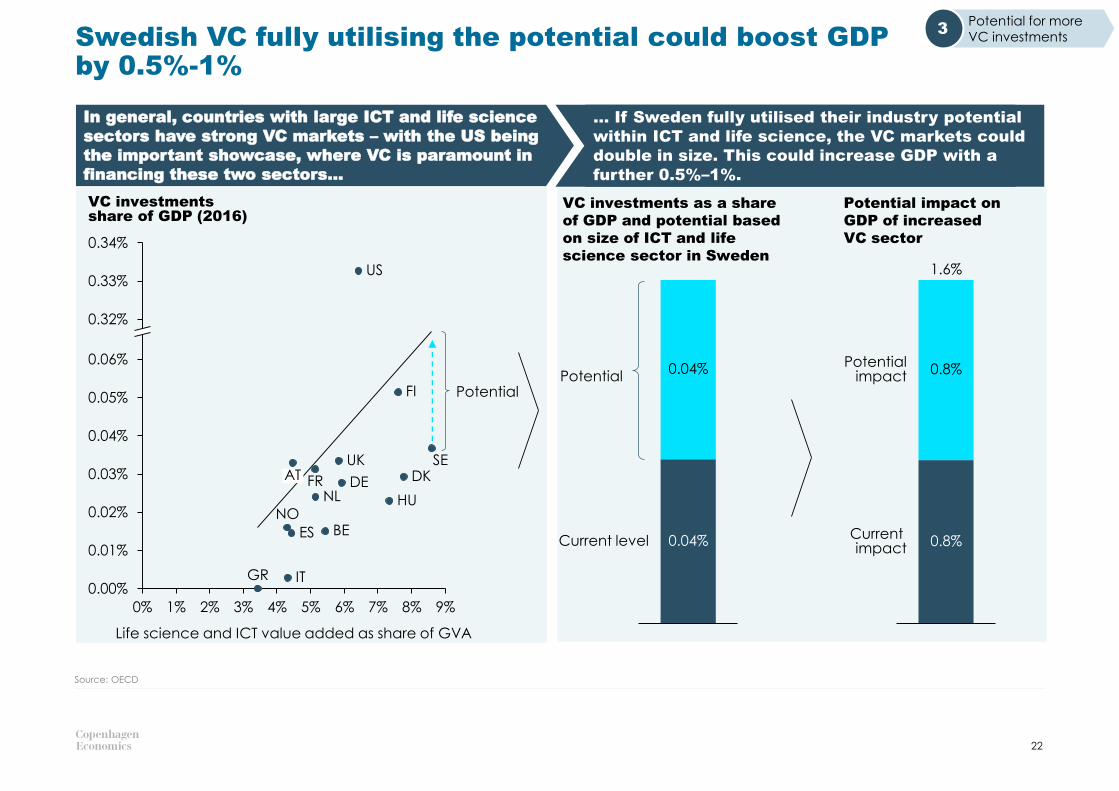
Swedish VC fully utilising the potential could boost GDPby 0.5%-1%
22
Source: OECD
1%
0.33%
3%2% 4%0% 5% 6% 7% 8%
0.03%
9%
0.00%
0.01%
0.04%
0.05%
0.02%
0.32%
0.06%
0.34%
ES
VC investmentsshare of GDP (2016)
US
DEFR
Life science and ICT value added as share of GVA
GR
SE
BE
AT DK
FI
HUNL
NO
UK
IT
0.04%
0.04%
Current level
PotentialPotential
Potential impact on
GDP of increased
VC sector
0.8%
0.8%Potential
impact
Current impact
1.6%
In general, countries with large ICT and life science
sectors have strong VC markets – with the US being
the important showcase, where VC is paramount in
financing these two sectors…
… If Sweden fully utilised their industry potential
within ICT and life science, the VC markets could
double in size. This could increase GDP with a
further 0.5%–1%.
Potential for more
VC investments3
3STOCKHOLM: A NATURAL INTERNATIONAL HUB FOR VENTURE CAPITAL
In part 1 and 2, we examined how VC helps companies and the economic benefits this
entails. Now we turn our attention to the VC firms administering the funds:
• How does the Swedish VC market compare to international peers?
• What does it take for Stockholm to become an international hub for venture capital?
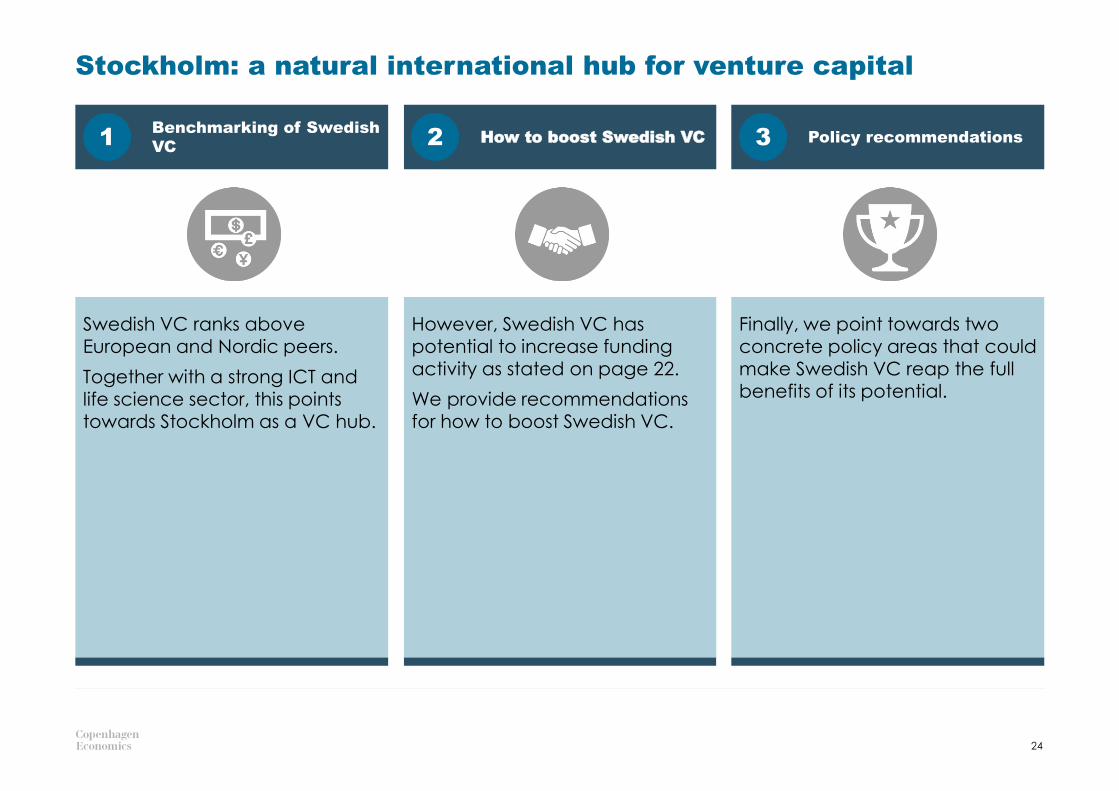
Stockholm: a natural international hub for venture capital
24
Benchmarking of Swedish
VCHow to boost Swedish VC Policy recommendations1 2 3
Swedish VC ranks above European and Nordic peers.
Together with a strong ICT and life science sector, this points towards Stockholm as a VC hub.
However, Swedish VC has potential to increase funding
activity as stated on page 22.
We provide recommendations for how to boost Swedish VC.
Finally, we point towards two concrete policy areas that could
make Swedish VC reap the full benefits of its potential.
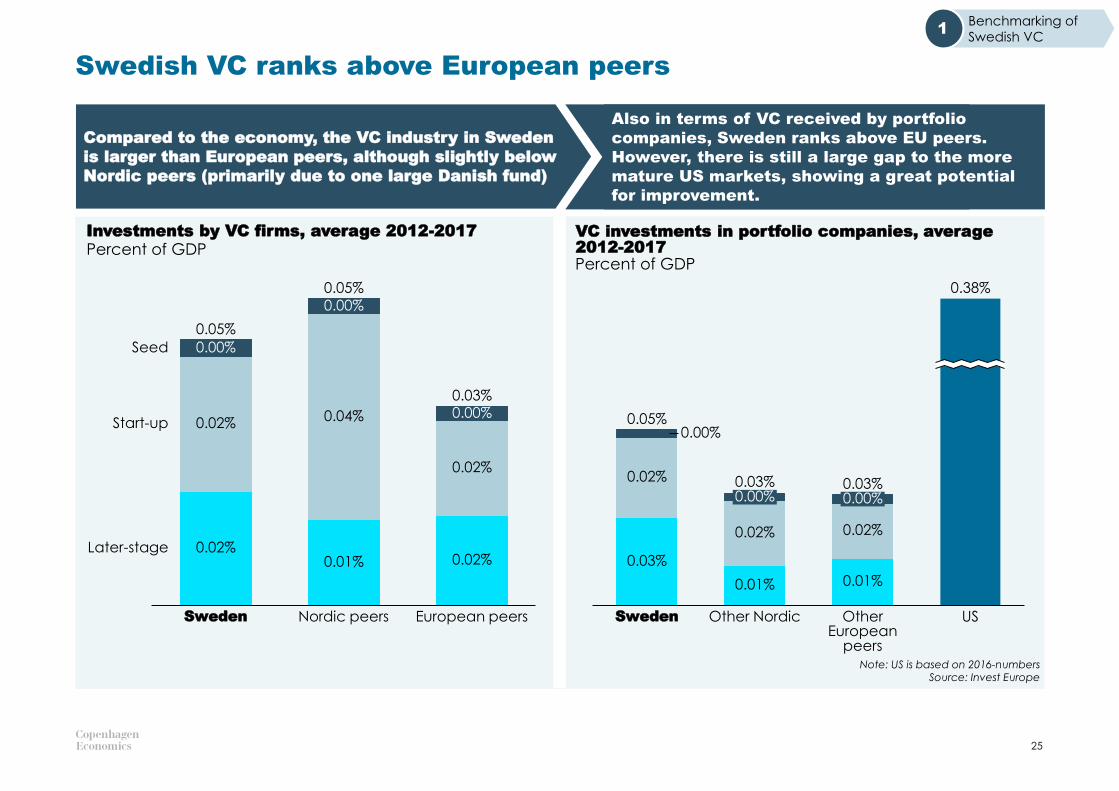
Swedish VC ranks above European peers
25
Compared to the economy, the VC industry in Sweden
is larger than European peers, although slightly below
Nordic peers (primarily due to one large Danish fund)
Also in terms of VC received by portfolio
companies, Sweden ranks above EU peers.
However, there is still a large gap to the more
mature US markets, showing a great potential
for improvement.
Investments by VC firms, average 2012-2017 VC investments in portfolio companies, average 2012-2017
Note: US is based on 2016-numbersSource: Invest Europe
Percent of GDPPercent of GDP
Benchmarking of
Swedish VC1
Sweden
0.00%
0.01%
0.05%
0.02%
0.02%
0.00%
0.04%
Nordic peers
Seed
0.00%
0.02%
0.02%
European peers
Start-up
Later-stage
0.05%
0.03%
0.03%
Sweden
0.02%
0.00%
0.00%
0.01%
0.02%
0.03%
Other Nordic
0.00%
0.02%
0.01%
Other European
peers
US
0.05%
0.03%
0.38%
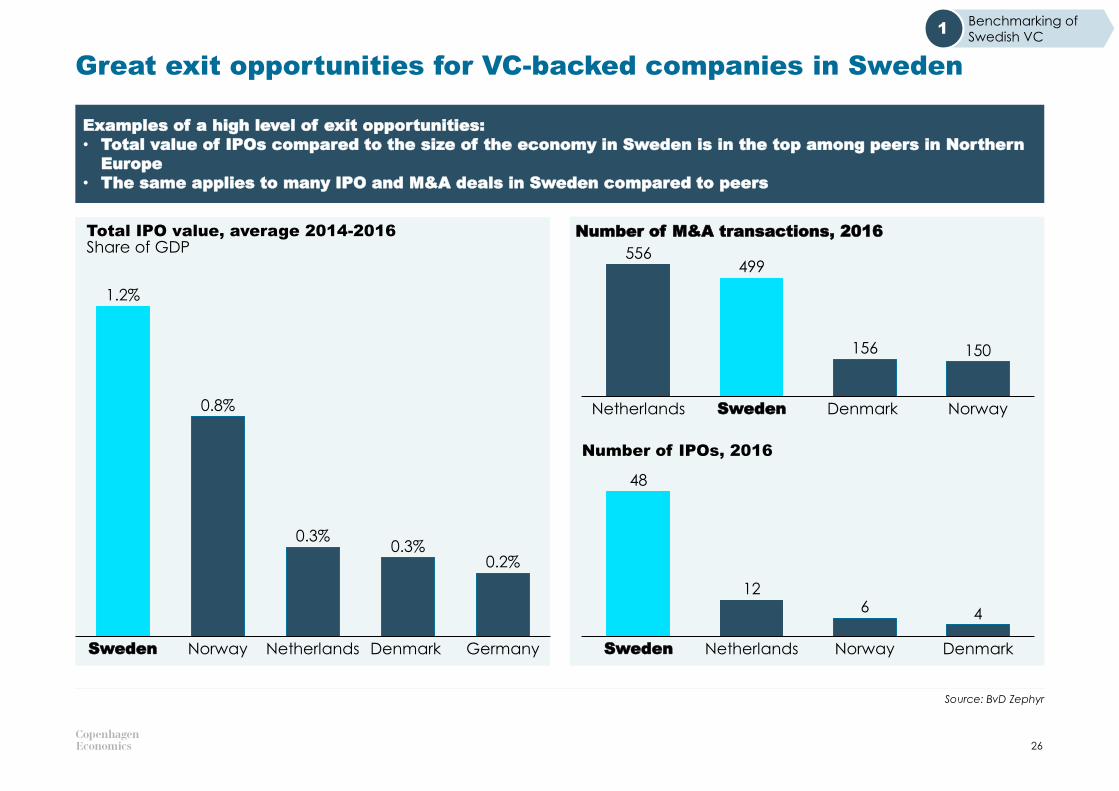
Total IPO value, average 2014-2016Share of GDP
Great exit opportunities for VC-backed companies in Sweden
26
Source: BvD Zephyr
Examples of a high level of exit opportunities:
• Total value of IPOs compared to the size of the economy in Sweden is in the top among peers in Northern
Europe
• The same applies to many IPO and M&A deals in Sweden compared to peers
Number of IPOs, 2016
Germany
1.2%
Sweden
0.8%
DenmarkNorway Netherlands
0.3%0.3%
0.2%
150
499
NorwayNetherlands
556
Sweden
156
Denmark
4
Sweden
12
Netherlands Norway Denmark
6
48
Benchmarking of
Swedish VC1
Number of M&A transactions, 2016
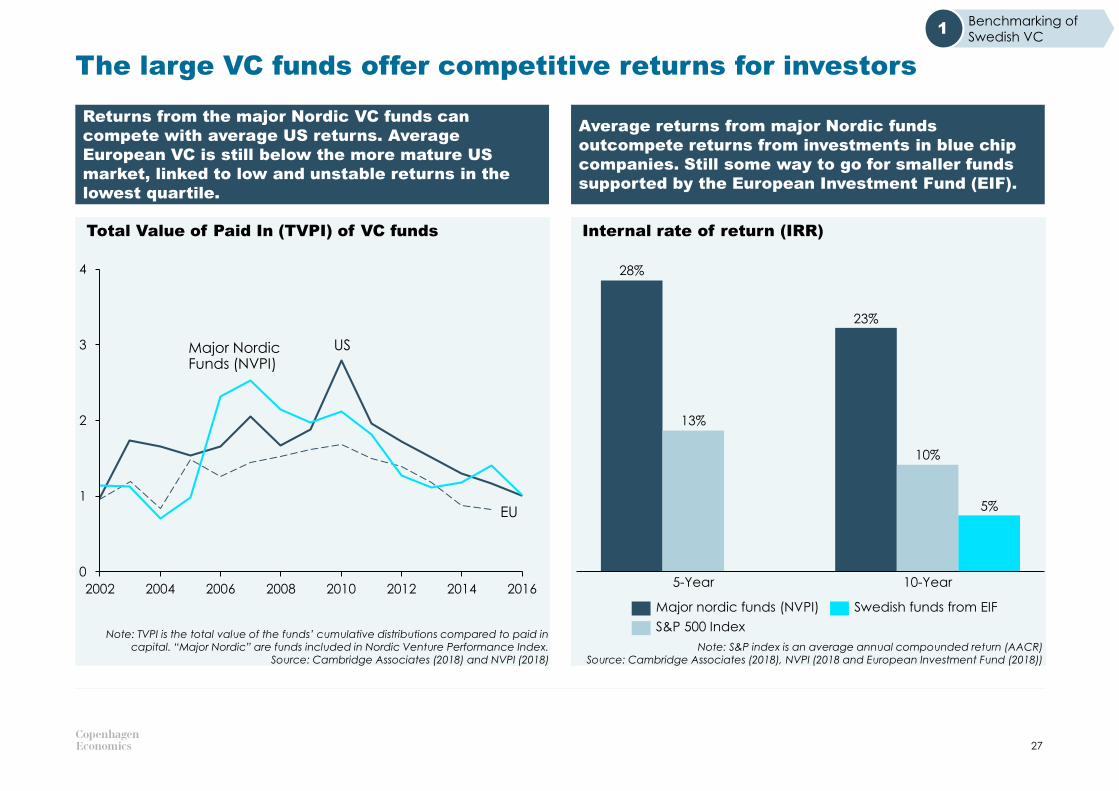
Internal rate of return (IRR) Total Value of Paid In (TVPI) of VC funds
The large VC funds offer competitive returns for investors
Note: S&P index is an average annual compounded return (AACR)Source: Cambridge Associates (2018), NVPI (2018 and European Investment Fund (2018))
27
Returns from the major Nordic VC funds can
compete with average US returns. Average
European VC is still below the more mature US
market, linked to low and unstable returns in the
lowest quartile.
Average returns from major Nordic funds
outcompete returns from investments in blue chip
companies. Still some way to go for smaller funds
supported by the European Investment Fund (EIF).
Note: TVPI is the total value of the funds’ cumulative distributions compared to paid in capital. “Major Nordic” are funds included in Nordic Venture Performance Index.
Source: Cambridge Associates (2018) and NVPI (2018)
2002 2004 2006 2008 2010 2012 2014 2016
4
0
1
2
3 Major Nordic Funds (NVPI)
US
EU
23%
5%
28%
5-Year 10-Year
10%
13%
Major nordic funds (NVPI) Swedish funds from EIF
S&P 500 Index
Benchmarking of
Swedish VC1
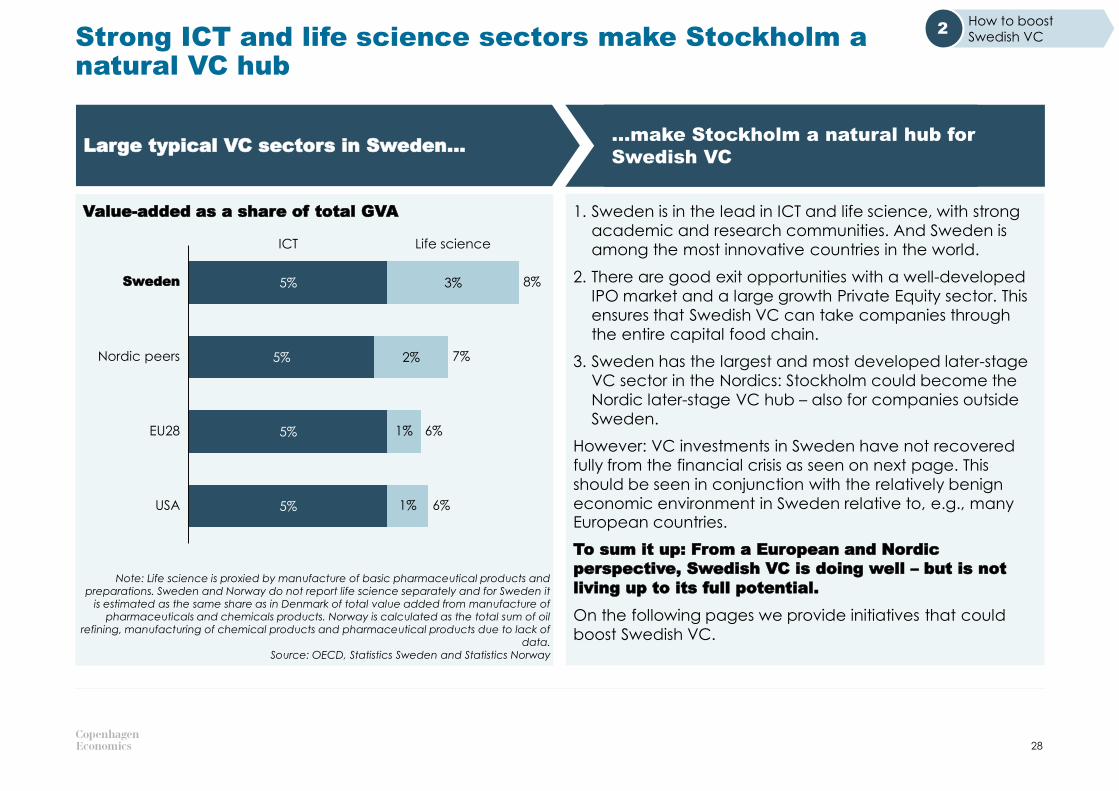
Strong ICT and life science sectors make Stockholm a natural VC hub
28
Large typical VC sectors in Sweden……make Stockholm a natural hub for
Swedish VC
1. Sweden is in the lead in ICT and life science, with strong
academic and research communities. And Sweden is
among the most innovative countries in the world.
2. There are good exit opportunities with a well-developed
IPO market and a large growth Private Equity sector. This
ensures that Swedish VC can take companies through
the entire capital food chain.
3. Sweden has the largest and most developed later-stage
VC sector in the Nordics: Stockholm could become the
Nordic later-stage VC hub – also for companies outside
Sweden.
However: VC investments in Sweden have not recovered
fully from the financial crisis as seen on next page. This
should be seen in conjunction with the relatively benign
economic environment in Sweden relative to, e.g., many European countries.
To sum it up: From a European and Nordic
perspective, Swedish VC is doing well – but is not
living up to its full potential.
On the following pages we provide initiatives that could
boost Swedish VC.
Value-added as a share of total GVA
Note: Life science is proxied by manufacture of basic pharmaceutical products and preparations. Sweden and Norway do not report life science separately and for Sweden it
is estimated as the same share as in Denmark of total value added from manufacture of pharmaceuticals and chemicals products. Norway is calculated as the total sum of oil
refining, manufacturing of chemical products and pharmaceutical products due to lack of data.
Source: OECD, Statistics Sweden and Statistics Norway
How to boost
Swedish VC2
5%
5%
5%
5%
3%
2%
ICT
Nordic peers
Sweden
1%
8%
Life science
EU28
USA 1%
7%
6%
6%
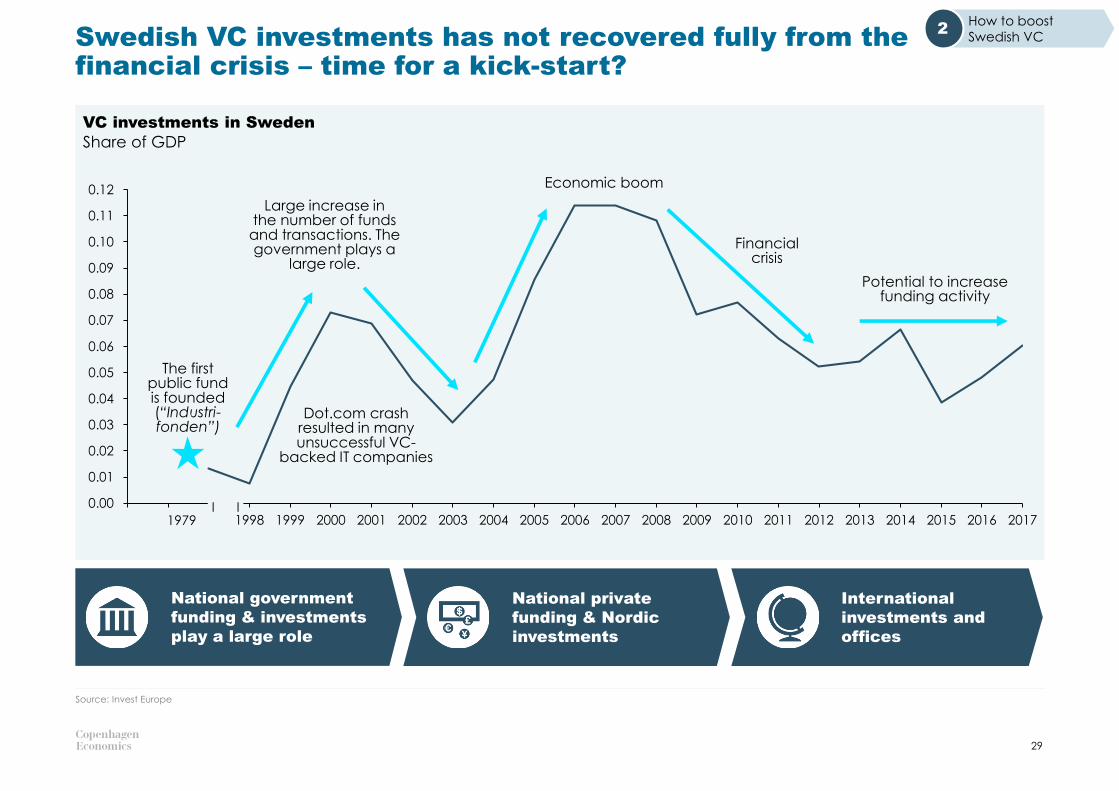
VC investments in Sweden
Share of GDP
Swedish VC investments has not recovered fully from the financial crisis – time for a kick-start?
29
Source: Invest Europe
Economic boom
National government
funding & investments
play a large role
National private
funding & Nordic
investments
International
investments and
offices
2000 20031998
0.06
2004
0.05
1999 2002 20072001 2005
0.07
2006 2008 20162012
0.03
2010 20152011 2013 2014 2017
0.00
0.01
0.02
0.04
0.08
0.09
0.10
0.11
0.12
2009I I
1979
The first public fund is founded (“Industri-fonden”)
Financial crisis
Potential to increase funding activity
Dot.com crash resulted in many unsuccessful VC-
backed IT companies
Large increase inthe number of fundsand transactions. The government plays a
large role.
How to boost
Swedish VC2
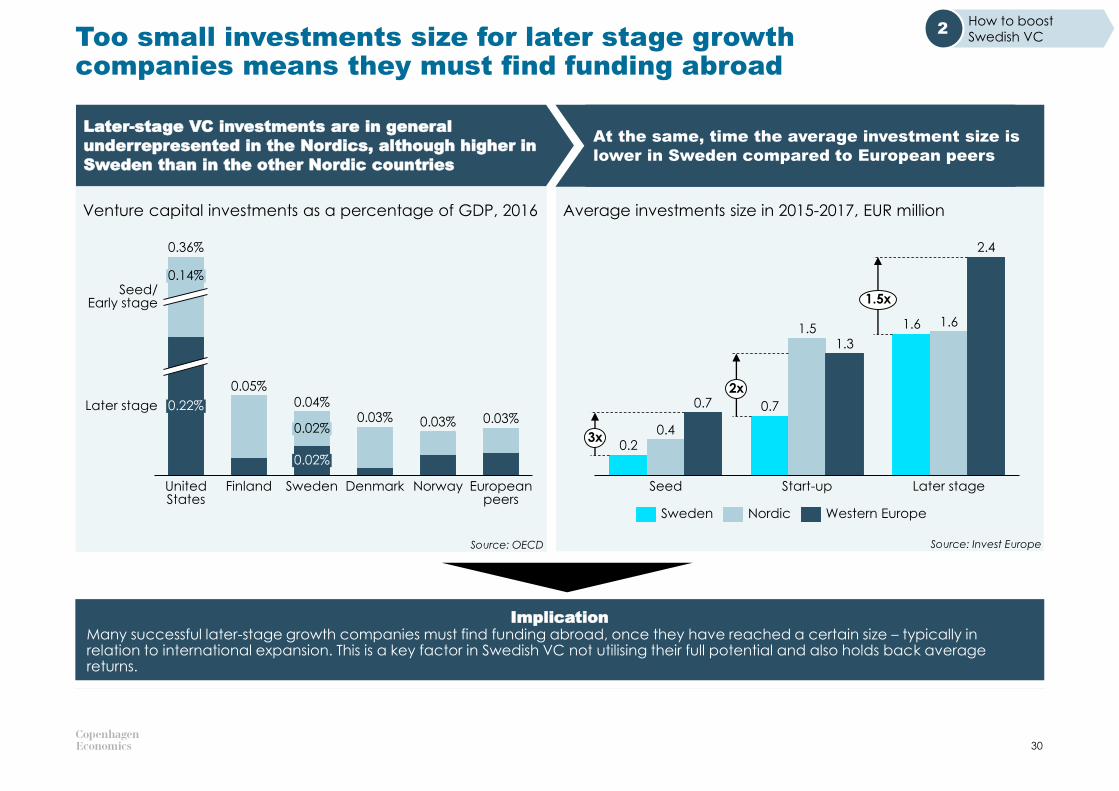
Too small investments size for later stage growth companies means they must find funding abroad
30
Seed
0.7
Start-up Later stage
1.6
0.20.4
0.7
1.51.3
1.6
2.4
3x
2x
1.5x
Sweden Nordic Western Europe
Source: Invest EuropeSource: OECD
Norway
0.04%
0.14%
0.22%
0.36%
United States
Finland
0.02%
0.02%
Sweden
0.03%
Denmark European peers
Seed/Early stage
Later stage
0.05%
0.03% 0.03%
Later-stage VC investments are in general
underrepresented in the Nordics, although higher in
Sweden than in the other Nordic countries
At the same, time the average investment size is
lower in Sweden compared to European peers
Average investments size in 2015-2017, EUR million Venture capital investments as a percentage of GDP, 2016
ImplicationMany successful later-stage growth companies must find funding abroad, once they have reached a certain size – typically in relation to international expansion. This is a key factor in Swedish VC not utilising their full potential and also holds back average returns.
How to boost
Swedish VC2
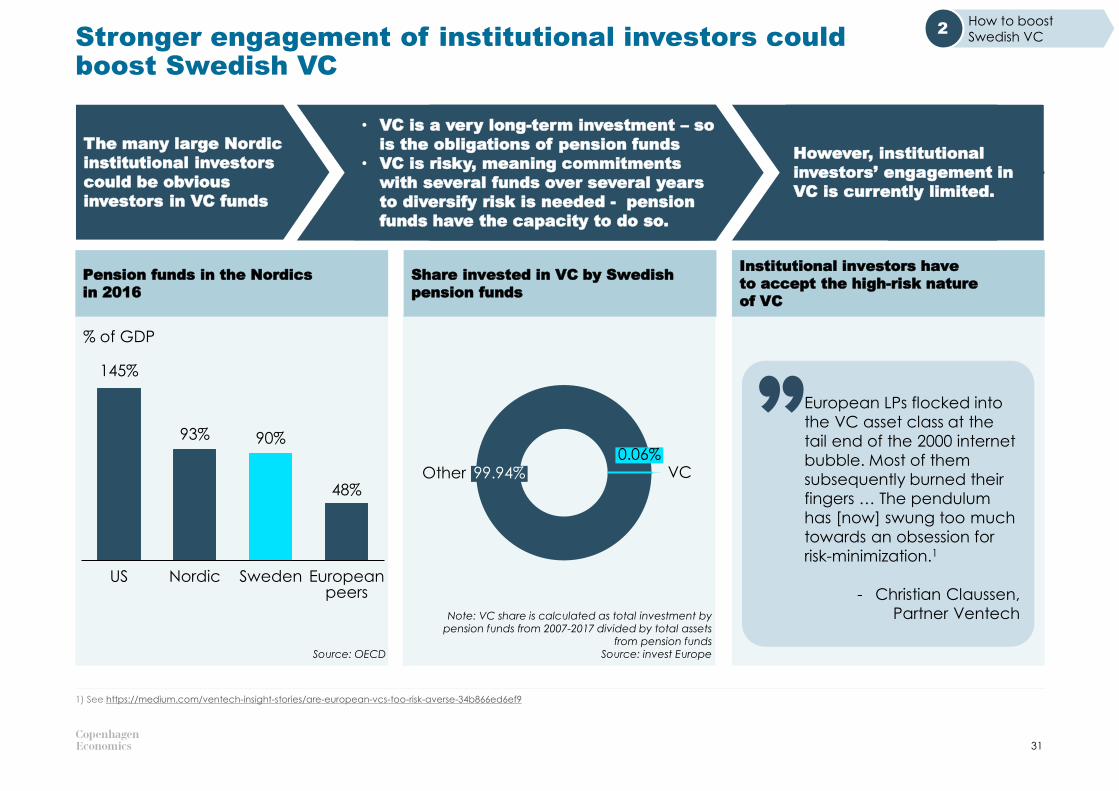
Stronger engagement of institutional investors could boost Swedish VC
31
1) See https://medium.com/ventech-insight-stories/are-european-vcs-too-risk-averse-34b866ed6ef9
How to boost
Swedish VC2
90%
SwedenNordic
145%
US European peers
93%
48%
Note: VC share is calculated as total investment by pension funds from 2007-2017 divided by total assets
from pension fundsSource: invest EuropeSource: OECD
99.94%0.06%
VCOther
European LPs flocked into
the VC asset class at the
tail end of the 2000 internet
bubble. Most of them
subsequently burned their
fingers … The pendulum
has [now] swung too much
towards an obsession for
risk-minimization.1
- Christian Claussen,
Partner Ventech
Pension funds in the Nordics
in 2016
Share invested in VC by Swedish
pension funds
Institutional investors have
to accept the high-risk nature
of VC
% of GDP
The many large Nordic
institutional investors
could be obvious
investors in VC funds
• VC is a very long-term investment – so
is the obligations of pension funds
• VC is risky, meaning commitments
with several funds over several years
to diversify risk is needed - pension
funds have the capacity to do so.
H
However, institutional
investors’ engagement in
VC is currently limited.
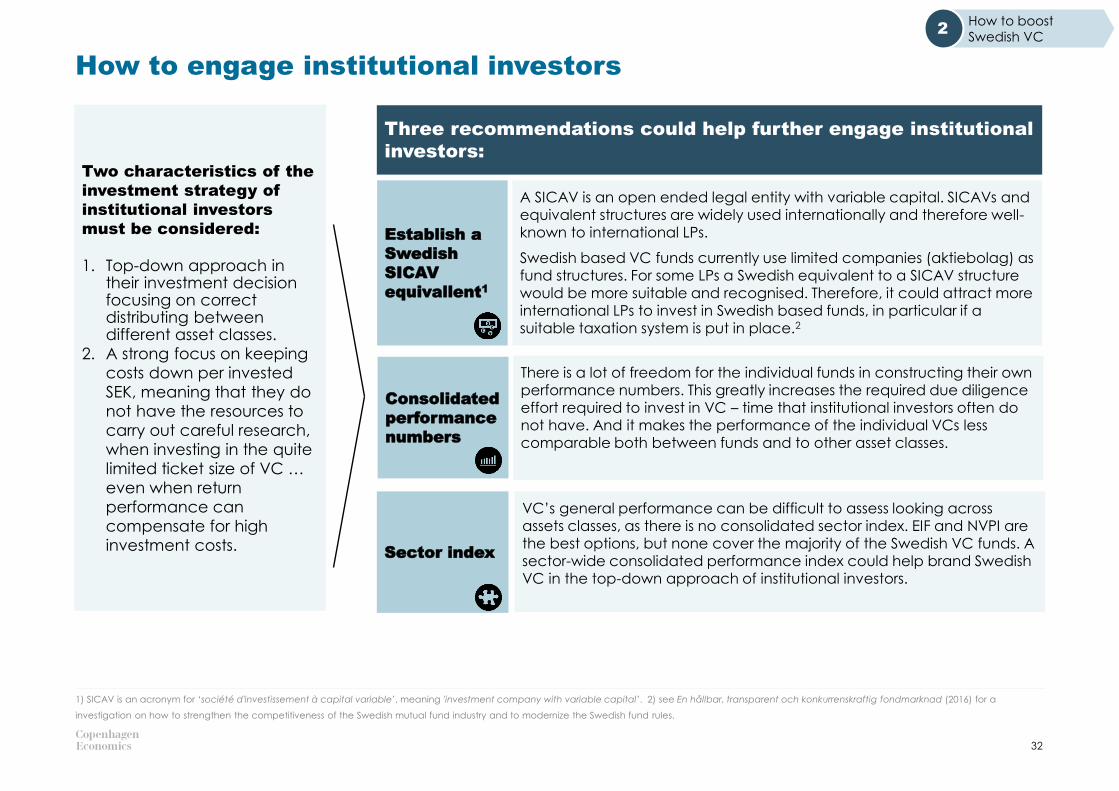
How to engage institutional investors
32
1) SICAV is an acronym for ‘société d'investissement à capital variable’, meaning 'investment company with variable capital’. 2) see En hållbar, transparent och konkurrenskraftig fondmarknad (2016) for a
investigation on how to strengthen the competitiveness of the Swedish mutual fund industry and to modernize the Swedish fund rules.
Three recommendations could help further engage institutional
investors:
Establish a
Swedish
SICAV
equivallent1
A SICAV is an open ended legal entity with variable capital. SICAVs and equivalent structures are widely used internationally and therefore well-known to international LPs.
Swedish based VC funds currently use limited companies (aktiebolag) as fund structures. For some LPs a Swedish equivalent to a SICAV structure
would be more suitable and recognised. Therefore, it could attract more international LPs to invest in Swedish based funds, in particular if a suitable taxation system is put in place.2
There is a lot of freedom for the individual funds in constructing their own performance numbers. This greatly increases the required due diligence effort required to invest in VC – time that institutional investors often do not have. And it makes the performance of the individual VCs less comparable both between funds and to other asset classes.
VC’s general performance can be difficult to assess looking across assets classes, as there is no consolidated sector index. EIF and NVPI are the best options, but none cover the majority of the Swedish VC funds. A sector-wide consolidated performance index could help brand Swedish VC in the top-down approach of institutional investors.
Consolidated
performance
numbers
Sector index
Two characteristics of the
investment strategy of
institutional investors
must be considered:
1. Top-down approach in their investment decision focusing on correct distributing between different asset classes.
2. A strong focus on keeping
costs down per invested
SEK, meaning that they do
not have the resources to
carry out careful research,
when investing in the quite
limited ticket size of VC …
even when return
performance can
compensate for high
investment costs.
How to boost
Swedish VC2
Swedish portfolio companies need better access to highly skilled international staff
33
Lower current thresholds for the required educational
level and guaranteed income level as well as making
the application process less bureaucratic.
Reform emigration laws – less restrictive to
attract foreign experts: Access to highly skilled staff
To make a good idea grow into a proven business
concept, not only capital is needed – also highly
specialised staff.
This is not always available within Swedish borders –
Swedish start-ups must be able to attract specialised
foreign staff. However, this is often blocked by rigid and
bureaucratic emigration laws.
Furthermore lack of stock option incentives makes it
much harder to compete with other countries for
attracting specialists (see next page).
Policy
recommendations3
Reform capital income taxation using revenue from lower government business subsidies
34
1) See also forthcoming report by Copenhagen Economics: “Undersøgelse af vækstiværksættere”. 2) See Ratio (2018): “Innovationspolitik för tillväxt”
Policy
recommendations3
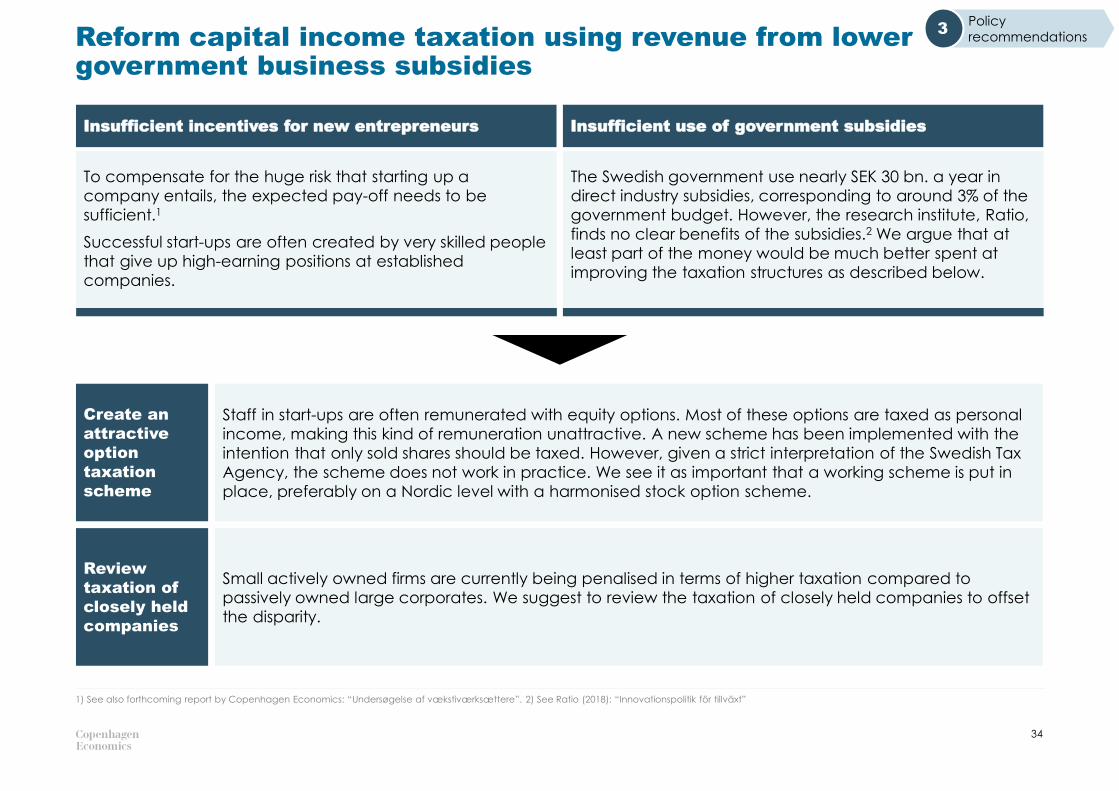
Insufficient incentives for new entrepreneurs
To compensate for the huge risk that starting up a
company entails, the expected pay-off needs to be
sufficient.1
Successful start-ups are often created by very skilled people
that give up high-earning positions at established
companies.
Insufficient use of government subsidies
The Swedish government use nearly SEK 30 bn. a year in
direct industry subsidies, corresponding to around 3% of the
government budget. However, the research institute, Ratio,
finds no clear benefits of the subsidies.2 We argue that at
least part of the money would be much better spent at
improving the taxation structures as described below.
Create an
attractive
option
taxation
scheme
Staff in start-ups are often remunerated with equity options. Most of these options are taxed as personal
income, making this kind of remuneration unattractive. A new scheme has been implemented with the
intention that only sold shares should be taxed. However, given a strict interpretation of the Swedish Tax
Agency, the scheme does not work in practice. We see it as important that a working scheme is put in
place, preferably on a Nordic level with a harmonised stock option scheme.
Review
taxation of
closely held
companies
Small actively owned firms are currently being penalised in terms of higher taxation compared to
passively owned large corporates. We suggest to review the taxation of closely held companies to offset
the disparity.
Obstacles to be addressed on an EU level: High compliance costs from AIFMD
35
1) Based on survey by Copenhagen Economics conducted in preparation of the report “The role of venture capital for economic growth in the Nordic region”.
Policy
recommendations3
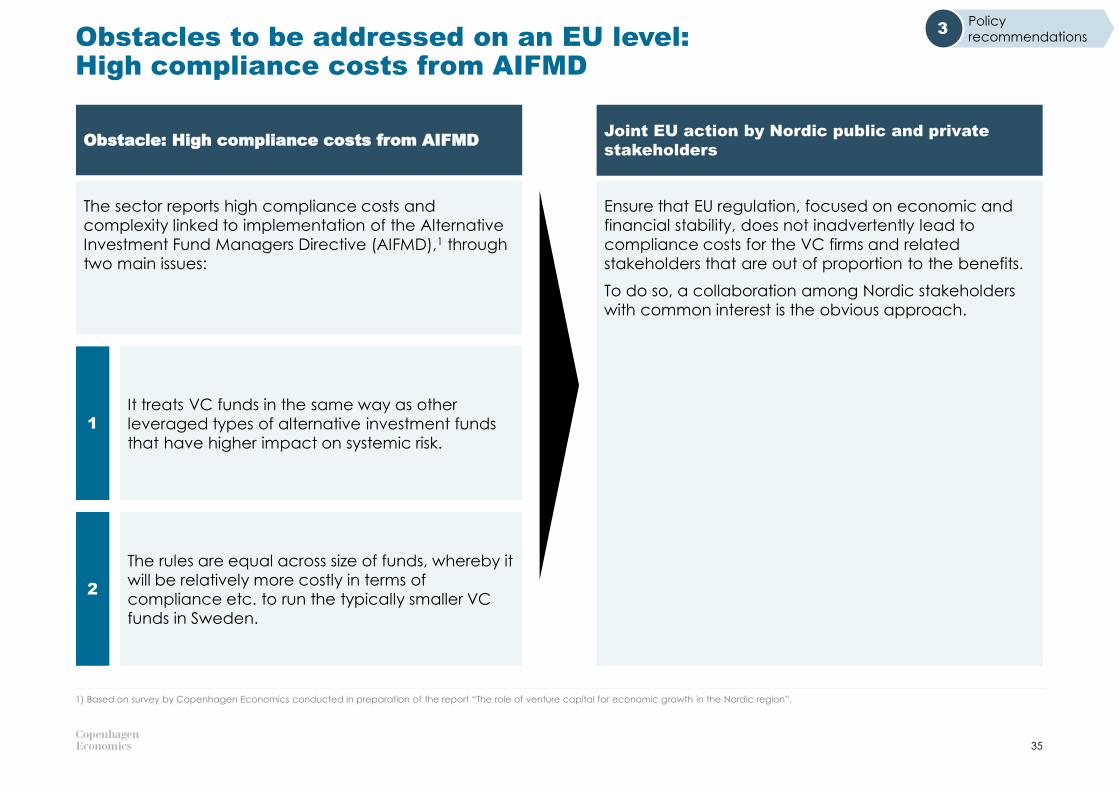
Ensure that EU regulation, focused on economic and
financial stability, does not inadvertently lead to
compliance costs for the VC firms and related
stakeholders that are out of proportion to the benefits.
To do so, a collaboration among Nordic stakeholders
with common interest is the obvious approach.
Joint EU action by Nordic public and private
stakeholdersObstacle: High compliance costs from AIFMD
The sector reports high compliance costs and
complexity linked to implementation of the Alternative
Investment Fund Managers Directive (AIFMD),1 through
two main issues:
It treats VC funds in the same way as other
leveraged types of alternative investment funds
that have higher impact on systemic risk.
The rules are equal across size of funds, whereby it
will be relatively more costly in terms of
compliance etc. to run the typically smaller VC
funds in Sweden.
1
2
Andersson, M. & Klepper, S. (2013): Characteristics and performance of new firms and spinoffs in Sweden. Industrial and Corporate Change, Volume 22, Issue 1, 245-280
Asoni, A., & Sanandaji, T. (2014): Taxation and the quality of entrepreneurship. Journal of Economics, 113(2), 101-123
Baldock, R. O., North D. & an Bhaird, C. M. (2016): The Role of Government Venture Capital Funds –Recent lessons from the UK experience
Brown, J. R, Martinsson, G & Petersen, B. C., (2016): Stock Markets, Credit Markets, and Technology-Led Growth, Swedish House of Finance Research Paper No 16-12
Caprile, M., Palmen, R., Sanz, P. & Dente, G., 2015. Encouraging STEM studies for the Labour Market, s.l.: European Parliament, EMPL Committee.
Copenhagen Economics (2017): Hovedstadsregionensom finansielt finansielt centrum – muligheder ogbarrierer
Cambridge Associates (2018): US Venture CapitalIndex and Selected Benchmark Statistics
Colino, D. (2016): Cumulative Innovation andDynamic R&D Spillovers
Cornell University, INSEAD and World Intellectual Property Organization (WIPO) (2018): Global Innovation Index 2018 – Energizing the
World with Innovation
Corrado, C., Haskel, J., & Jona-Lasinio, C. (2016). Intangibles, ICT and industry productivity growth: Evidence from the EU. In The World Economy: Growth or Stagnation? (pp. 319-346). Cambridge University Press.
Dackehag, M. & Hansson, Å. (2015): Taxation of Dividend Income and Economic Growth: The Case of Europe, IFN Working Paper No. 1081, 2015
Dahl, M. S., & Sorenson, O. (2014): The Who, Why And How Of Spinoffs
European Investment Fund (2017): European Investment Fund Venture Capital Portfolio, Performance – EIF own resources Vintage and Team Location as at 30/06/17
Kortum, S. & Lerner, J. (2000): Assesing theContribution of Venture Capital to Innovation
Lerner, J. & Tåg, J. (2013): Institutions and VentureCapital, Industrial and Corporate Change, Volume22, Number 1, pp. 153-182
Menon Economics (2018): Vekstvilkår for norskescale-ups
Nanda, R., Samila, S., & Sørenson, O. (2018): ThePersistent Effect of Initial Success: Evidence fromVenture Capital. NBER Working Paper Series, 24887OECD (2017), Entrepreneurship at a Glance 2017
OECD (2018): A portrait of innovative startupsacross countries
Phillips, D. J. (2002): A genealogical approach toorganizational life chances: The parent-progenytransfer among Silicon Valley law firms.Administrative Science Quarterly 47, 474-506
Pitchbook (2017), Global PE & VC Fund PerformanceReportRomain, A. & van Pottelsberghe, B. (2004): TheEconomic Impact of Venture Capital
Schnitzer, M. & Watzinger, M. (2017): Measuring the Spillovers of Venture Capital
Shaw, K., & Sørensen, A. (2017). The Productivity Advantage of Serial Entrepreneurs. NBER Working Paper Series, 23320
Sigurd Næss-Schmidt, Presentation, (2018): Challenges in taxing the Digitalising Economy –Designing robust national and international tax system for the future, slide 4
Sorensen, O. (2018): Social networks and the geography of entrepreneurship, Small Bus Econ 51:527–537
StartupBlink (2017), Startup Ecosystem RankingOctober 2017
World Economic Forum (2018), The Europe 2020Competitiveness Report
36
References

APPENDIX
Impact on GDP of Swedish VC
38
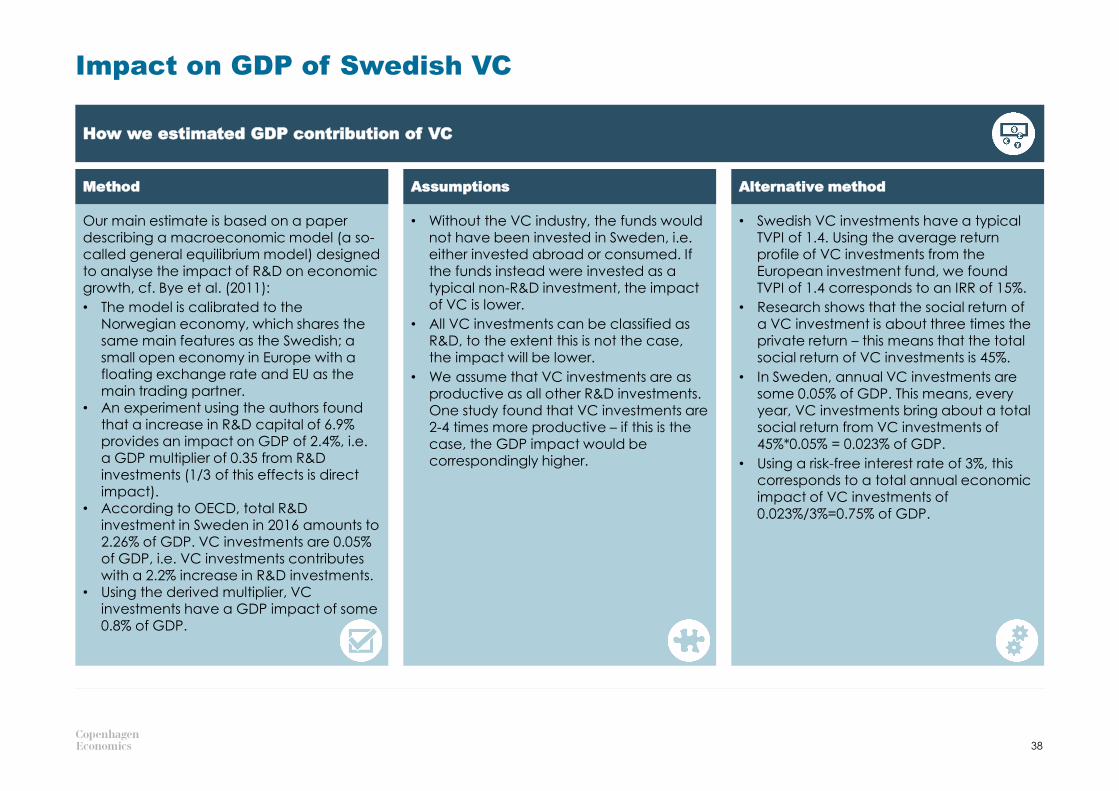
How we estimated GDP contribution of VC
Our main estimate is based on a paper describing a macroeconomic model (a so-called general equilibrium model) designed to analyse the impact of R&D on economic growth, cf. Bye et al. (2011):
• The model is calibrated to the Norwegian economy, which shares the same main features as the Swedish; a small open economy in Europe with a floating exchange rate and EU as the main trading partner.
• An experiment using the authors found that a increase in R&D capital of 6.9% provides an impact on GDP of 2.4%, i.e. a GDP multiplier of 0.35 from R&D investments (1/3 of this effects is direct impact).
• According to OECD, total R&D investment in Sweden in 2016 amounts to 2.26% of GDP. VC investments are 0.05% of GDP, i.e. VC investments contributes with a 2.2% increase in R&D investments.
• Using the derived multiplier, VC investments have a GDP impact of some 0.8% of GDP.
• Without the VC industry, the funds would not have been invested in Sweden, i.e. either invested abroad or consumed. If the funds instead were invested as a typical non-R&D investment, the impact of VC is lower.
• All VC investments can be classified as R&D, to the extent this is not the case, the impact will be lower.
• We assume that VC investments are as productive as all other R&D investments. One study found that VC investments are 2-4 times more productive – if this is the case, the GDP impact would be correspondingly higher.
• Swedish VC investments have a typical TVPI of 1.4. Using the average return profile of VC investments from the European investment fund, we found TVPI of 1.4 corresponds to an IRR of 15%.
• Research shows that the social return of a VC investment is about three times the private return – this means that the total social return of VC investments is 45%.
• In Sweden, annual VC investments are some 0.05% of GDP. This means, every year, VC investments bring about a total social return from VC investments of 45%*0.05% = 0.023% of GDP.
• Using a risk-free interest rate of 3%, this corresponds to a total annual economic impact of VC investments of 0.023%/3%=0.75% of GDP.
Method Assumptions Alternative method
Methodology for calculating revenue and employment growth for Swedish VC-backed companies
39
1) https://www.bvdinfo.com/en-us/our-products/data/international/amadeus /
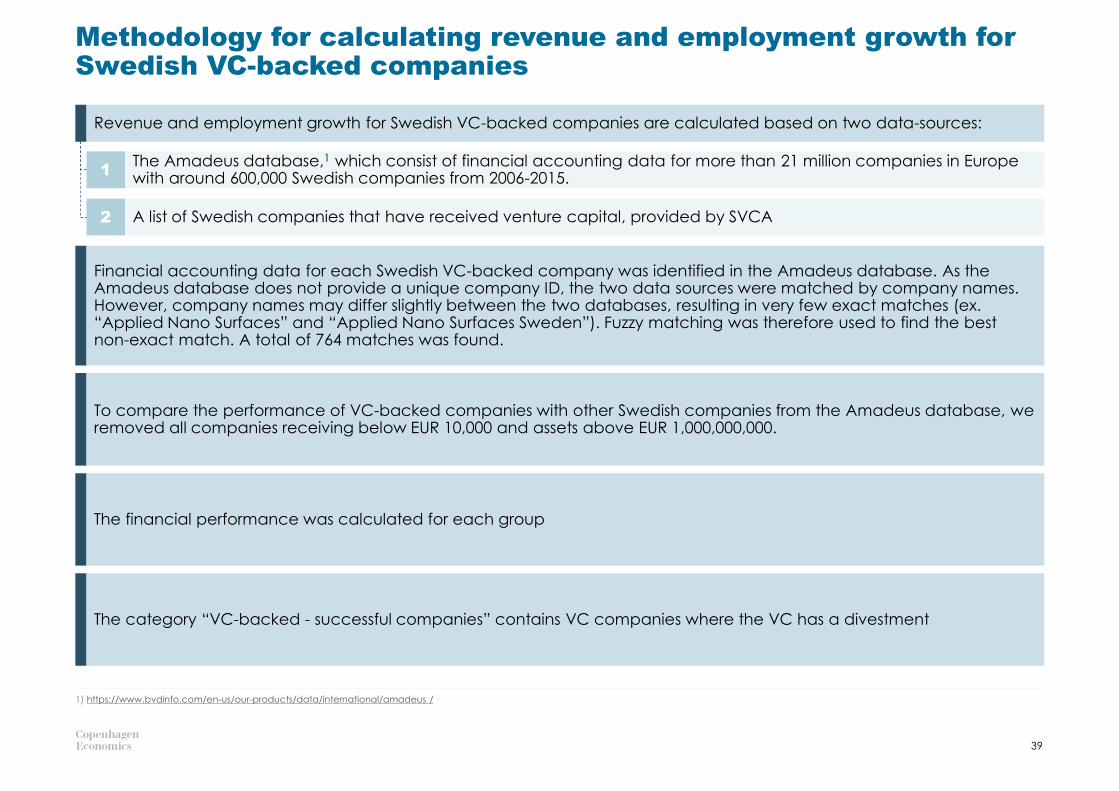
Revenue and employment growth for Swedish VC-backed companies are calculated based on two data-sources:
Financial accounting data for each Swedish VC-backed company was identified in the Amadeus database. As the Amadeus database does not provide a unique company ID, the two data sources were matched by company names. However, company names may differ slightly between the two databases, resulting in very few exact matches (ex. “Applied Nano Surfaces” and “Applied Nano Surfaces Sweden”). Fuzzy matching was therefore used to find the best non-exact match. A total of 764 matches was found.
To compare the performance of VC-backed companies with other Swedish companies from the Amadeus database, we removed all companies receiving below EUR 10,000 and assets above EUR 1,000,000,000.
The financial performance was calculated for each group
The category “VC-backed - successful companies” contains VC companies where the VC has a divestment
1The Amadeus database,1 which consist of financial accounting data for more than 21 million companies in Europe with around 600,000 Swedish companies from 2006-2015.
2 A list of Swedish companies that have received venture capital, provided by SVCA
Innovation created by VC-backed companies creates large spill-overs to the wider economy
40
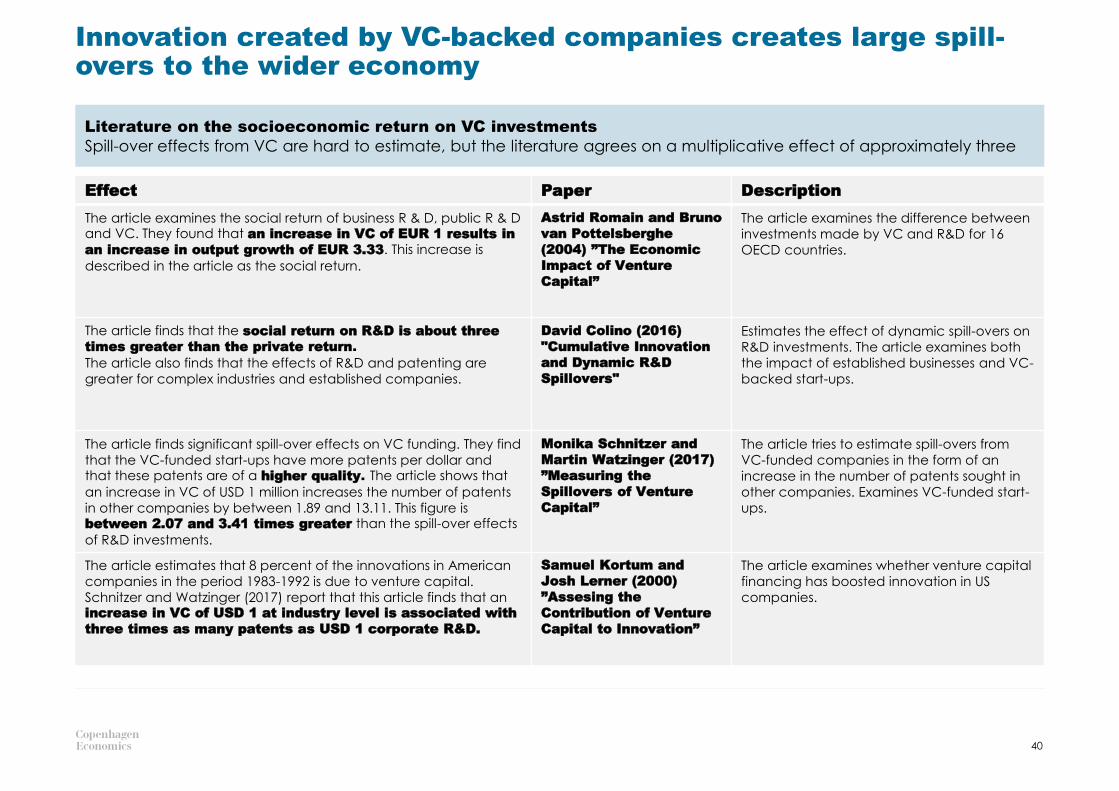
Effect Paper Description
The article examines the social return of business R & D, public R & D and VC. They found that an increase in VC of EUR 1 results in
an increase in output growth of EUR 3.33. This increase is
described in the article as the social return.
Astrid Romain and Bruno
van Pottelsberghe
(2004) ”The Economic
Impact of Venture
Capital”
The article examines the difference between
investments made by VC and R&D for 16
OECD countries.
The article finds that the social return on R&D is about three
times greater than the private return.
The article also finds that the effects of R&D and patenting are
greater for complex industries and established companies.
David Colino (2016)
"Cumulative Innovation
and Dynamic R&D
Spillovers"
Estimates the effect of dynamic spill-overs on
R&D investments. The article examines both
the impact of established businesses and VC-
backed start-ups.
The article finds significant spill-over effects on VC funding. They find
that the VC-funded start-ups have more patents per dollar and that these patents are of a higher quality. The article shows that
an increase in VC of USD 1 million increases the number of patents
in other companies by between 1.89 and 13.11. This figure is between 2.07 and 3.41 times greater than the spill-over effects
of R&D investments.
Monika Schnitzer and
Martin Watzinger (2017)
”Measuring the
Spillovers of Venture
Capital”
The article tries to estimate spill-overs from
VC-funded companies in the form of an
increase in the number of patents sought in
other companies. Examines VC-funded start-
ups.
The article estimates that 8 percent of the innovations in American
companies in the period 1983-1992 is due to venture capital.
Schnitzer and Watzinger (2017) report that this article finds that an increase in VC of USD 1 at industry level is associated with
three times as many patents as USD 1 corporate R&D.
Samuel Kortum and
Josh Lerner (2000)
”Assesing the
Contribution of Venture
Capital to Innovation”
The article examines whether venture capital
financing has boosted innovation in US
companies.
Literature on the socioeconomic return on VC investments
Spill-over effects from VC are hard to estimate, but the literature agrees on a multiplicative effect of approximately three

© Copenhagen Economics A/S
AUTHORS
Sigurd Næss-SchmidtJonas Bjarke Jensen

Hard facts. Clear stories.
ABOUT COPENHAGEN ECONOMICS
Copenhagen Economics is one of the leading economics firms in Europe. Founded in 2000, we currently employ more than 85 staff operating from our offices in Copenhagen, Stockholm, Helsinki, and Brussels. The Global Competition Review (GCR) lists Copenhagen Economics among the Top-20 economic consultancies in the world, and has done so since 2006.
copenhageneconomics.dk


