
FORD UNIVERSITY Stuart Rowley
Vice President and Controller
March 17, 2014

SLIDE 2
Agenda for today’s discussion • Automotive Segment Reporting
• Production compared with Wholesales
• Automotive Segment and Joint Venture Profits
• Fixed Asset Depreciation and Impairment Policy
• Taxes
• Pension Sensitivities
• Annual Incentive Compensation Plan (AICP)
- - - - - Topics from prior Ford University Presentations are included in the reference section at the end of the slide deck. Also posted for your reference is the updated Ford Credit University deck
FORD UNIVERSITY
SLIDE 3
AGENDA
• Automotive Segment Reporting
• Production compared with Wholesales
• Automotive Segment and Joint Venture Profits
• Fixed Asset Depreciation and Impairment Policy
• Taxes
• Pension Sensitivities
• Annual Incentive Compensation Plan (AICP)
SLIDE 4
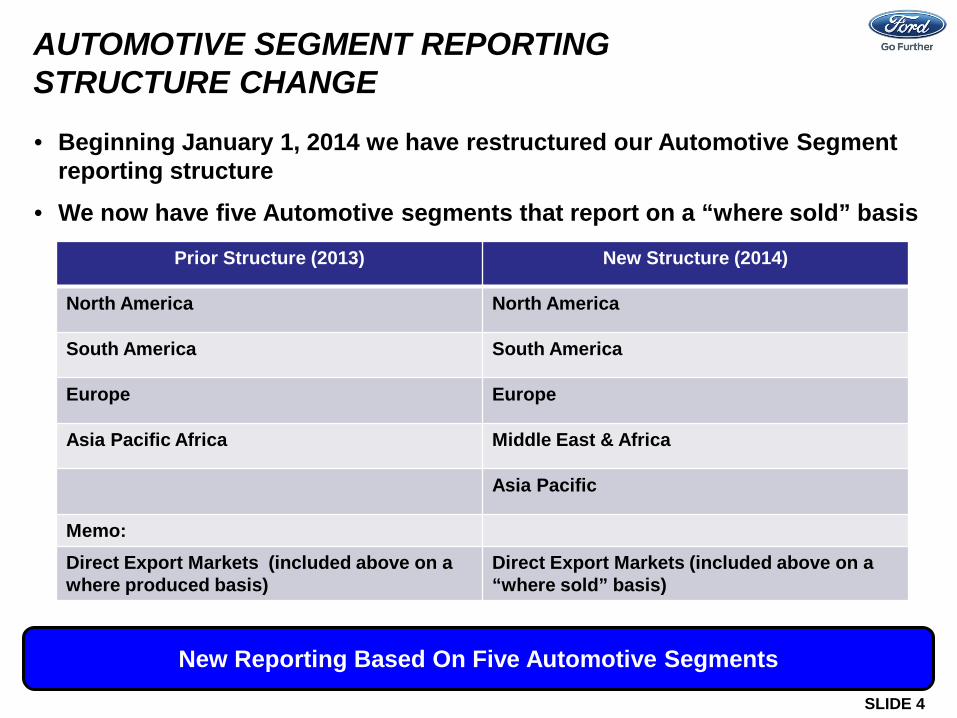
AUTOMOTIVE SEGMENT REPORTING STRUCTURE CHANGE • Beginning January 1, 2014 we have restructured our Automotive Segment
reporting structure
• We now have five Automotive segments that report on a “where sold” basis
Impact
New Reporting Based On Five Automotive Segments
Prior Structure (2013) New Structure (2014)
North America North America
South America South America
Europe Europe
Asia Pacific Africa Middle East & Africa
Asia Pacific
Memo: Direct Export Markets (included above on a where produced basis)
Direct Export Markets (included above on a “where sold” basis)
SLIDE 5
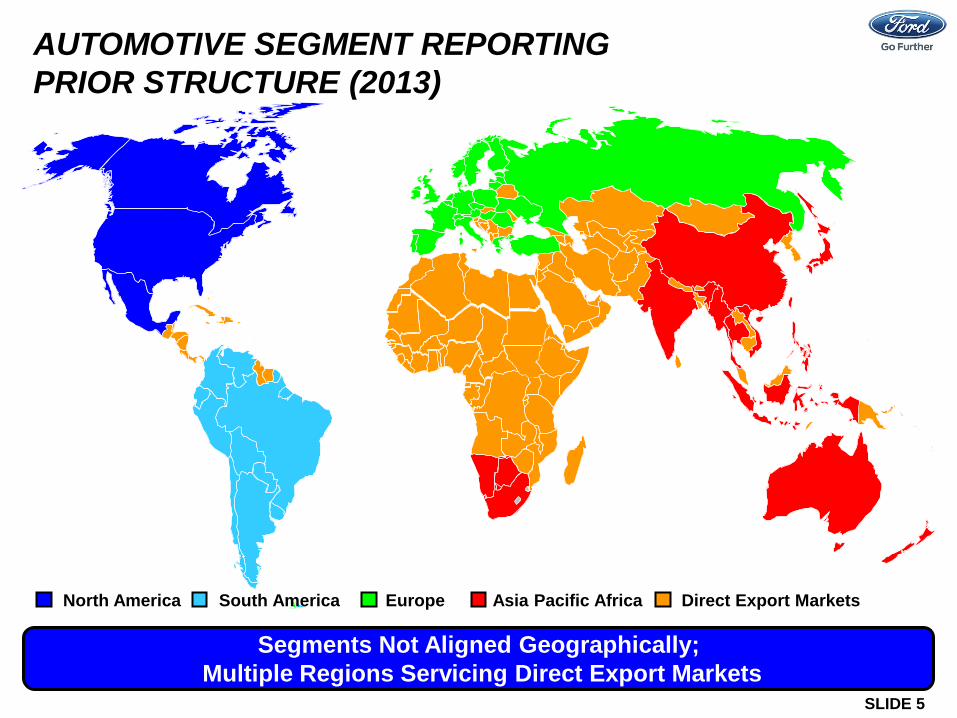
Segments Not Aligned Geographically;
Multiple Regions Servicing Direct Export Markets
Direct Export Markets South America North America Europe Asia Pacific Africa
AUTOMOTIVE SEGMENT REPORTING PRIOR STRUCTURE (2013)
SLIDE 6
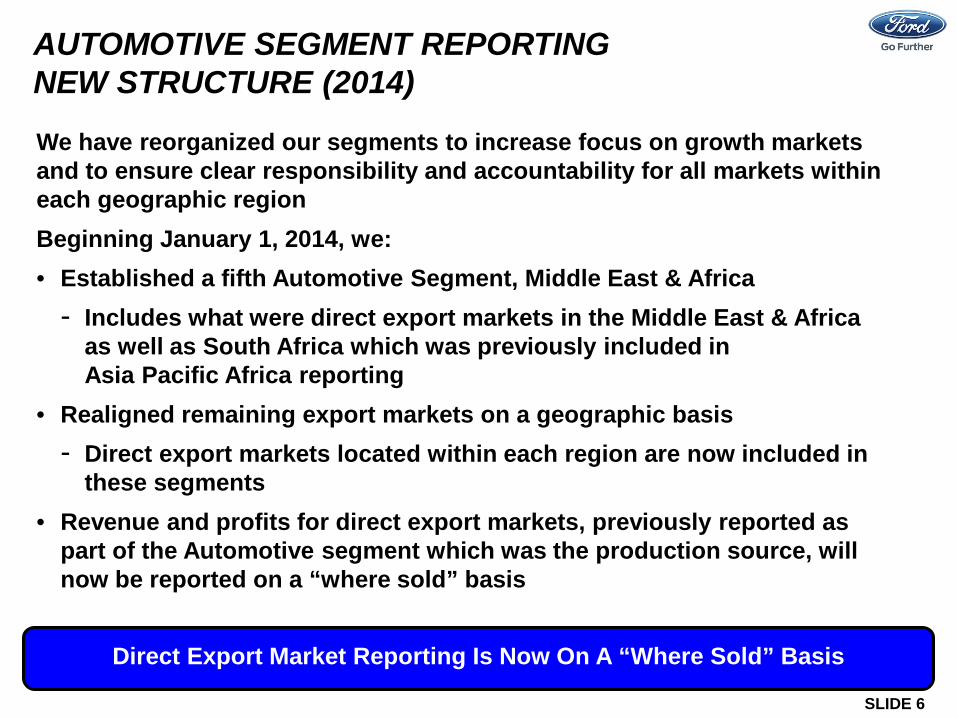
We have reorganized our segments to increase focus on growth markets and to ensure clear responsibility and accountability for all markets within each geographic region Beginning January 1, 2014, we: • Established a fifth Automotive Segment, Middle East & Africa
- Includes what were direct export markets in the Middle East & Africa as well as South Africa which was previously included in Asia Pacific Africa reporting
• Realigned remaining export markets on a geographic basis - Direct export markets located within each region are now included in
these segments • Revenue and profits for direct export markets, previously reported as
part of the Automotive segment which was the production source, will now be reported on a “where sold” basis
Impact
Direct Export Market Reporting Is Now On A “Where Sold” Basis
AUTOMOTIVE SEGMENT REPORTING NEW STRUCTURE (2014)
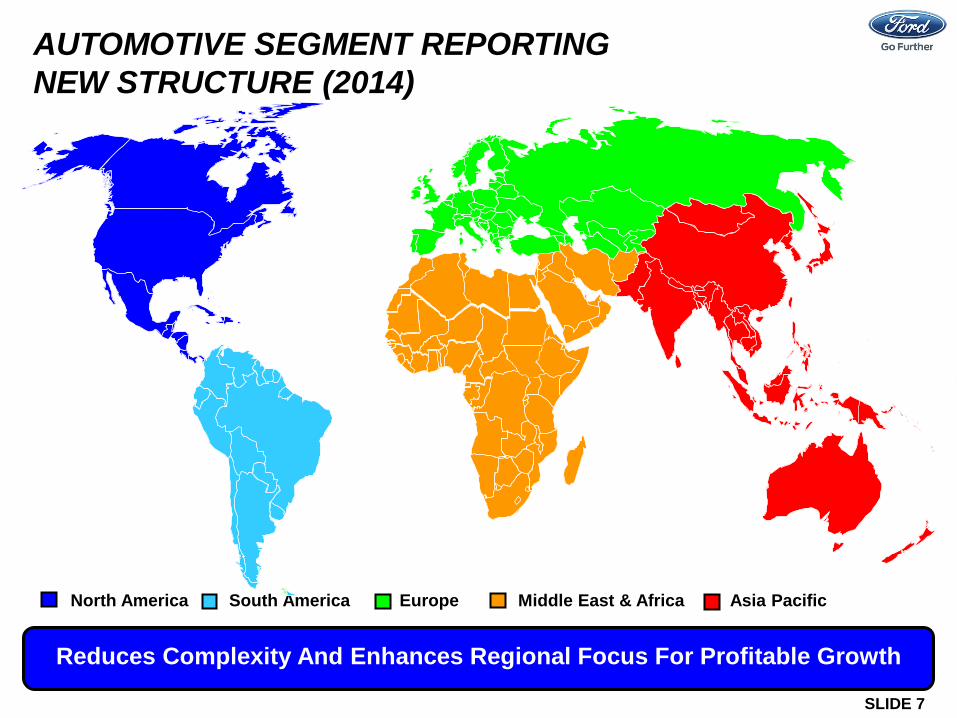
SLIDE 7
Asia Pacific Europe South America
Reduces Complexity And Enhances Regional Focus For Profitable Growth
North America Middle East & Africa
AUTOMOTIVE SEGMENT REPORTING NEW STRUCTURE (2014)
SLIDE 8
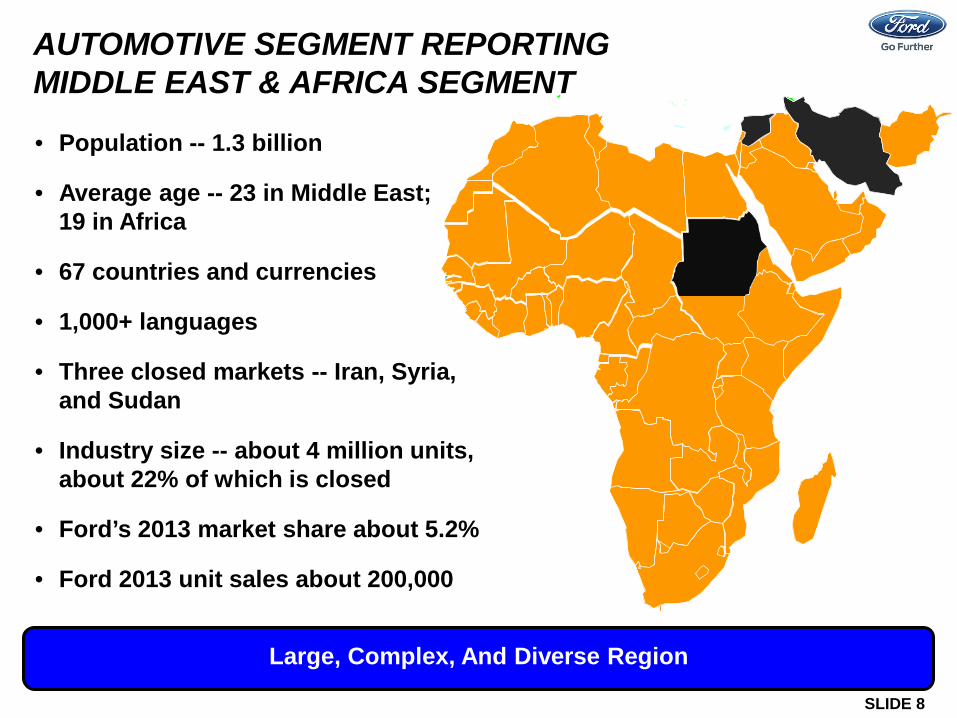
Large, Complex, And Diverse Region
AUTOMOTIVE SEGMENT REPORTING MIDDLE EAST & AFRICA SEGMENT • Population -- 1.3 billion
• Average age -- 23 in Middle East; 19 in Africa
• 67 countries and currencies
• 1,000+ languages
• Three closed markets -- Iran, Syria, and Sudan
• Industry size -- about 4 million units, about 22% of which is closed
• Ford’s 2013 market share about 5.2%
• Ford 2013 unit sales about 200,000
SLIDE 9
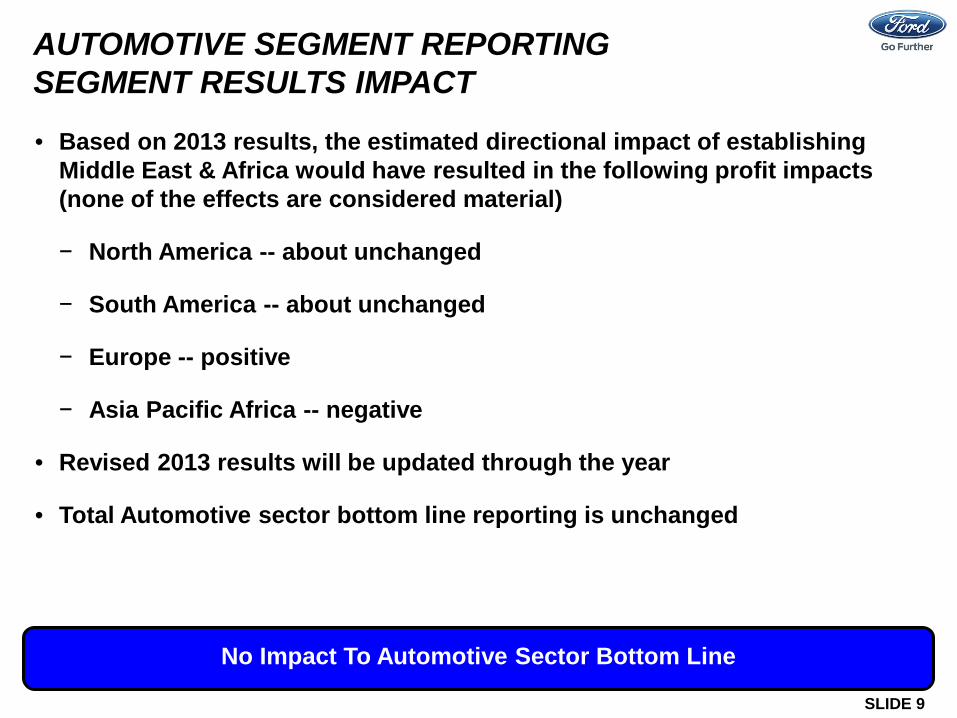
Impact
No Impact To Automotive Sector Bottom Line
AUTOMOTIVE SEGMENT REPORTING SEGMENT RESULTS IMPACT • Based on 2013 results, the estimated directional impact of establishing
Middle East & Africa would have resulted in the following profit impacts (none of the effects are considered material)
− North America -- about unchanged
− South America -- about unchanged
− Europe -- positive
− Asia Pacific Africa -- negative
• Revised 2013 results will be updated through the year
• Total Automotive sector bottom line reporting is unchanged
SLIDE 10
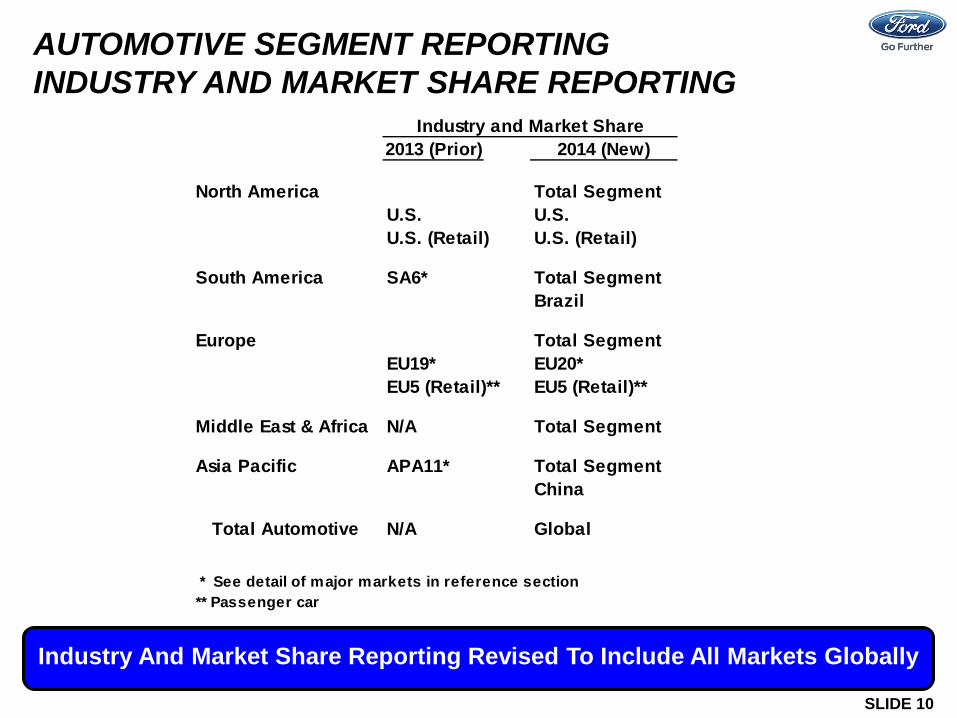
Impact
Industry And Market Share Reporting Revised To Include All Markets Globally
AUTOMOTIVE SEGMENT REPORTING INDUSTRY AND MARKET SHARE REPORTING
2013 (Prior) 2014 (New)
North America Total SegmentU.S. U.S.U.S. (Retail) U.S. (Retail)
South America SA6* Total SegmentBrazil
Europe Total SegmentEU19* EU20*EU5 (Retail)** EU5 (Retail)**
Middle East & Africa N/A Total Segment
Asia Pacific APA11* Total SegmentChina
Total Automotive N/A Global
* See detail of major markets in reference section** Passenger car
Industry and Market Share
SLIDE 11
• Automotive Segment Reporting
• Production compared with Wholesales
• Automotive Segment and Joint Venture Profits
• Fixed Asset Depreciation and Impairment Policy
• Taxes
• Pension Sensitivities
• Annual Incentive Compensation Plan (AICP)
AGENDA
SLIDE 12
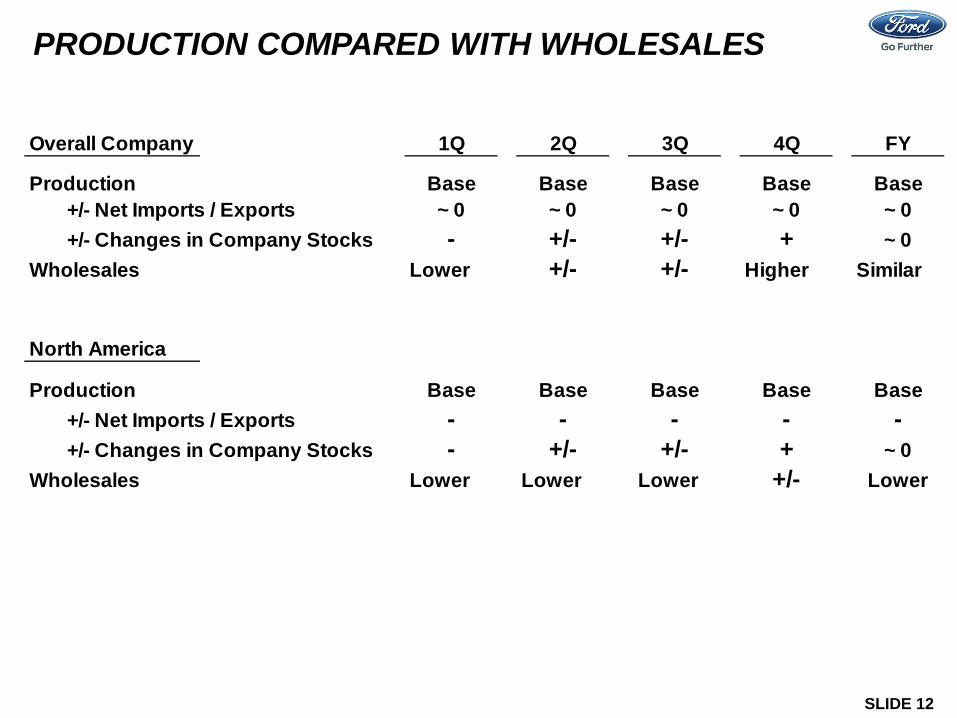
PRODUCTION COMPARED WITH WHOLESALES Overall Company 1Q 2Q 3Q 4Q FY
Production Base Base Base Base Base+/- Net Imports / Exports ~ 0 ~ 0 ~ 0 ~ 0 ~ 0+/- Changes in Company Stocks - +/- +/- + ~ 0
Wholesales Lower +/- +/- Higher Similar
North America
Production Base Base Base Base Base+/- Net Imports / Exports - - - - -+/- Changes in Company Stocks - +/- +/- + ~ 0
Wholesales Lower Lower Lower +/- Lower
SLIDE 13
• Automotive Segment Reporting
• Production compared with Wholesales
• Automotive Segment and Joint Venture Profits
• Fixed Asset Depreciation and Impairment Policy
• Taxes
• Pension Sensitivities
• Annual Incentive Compensation Plan (AICP)
AGENDA
SLIDE 14
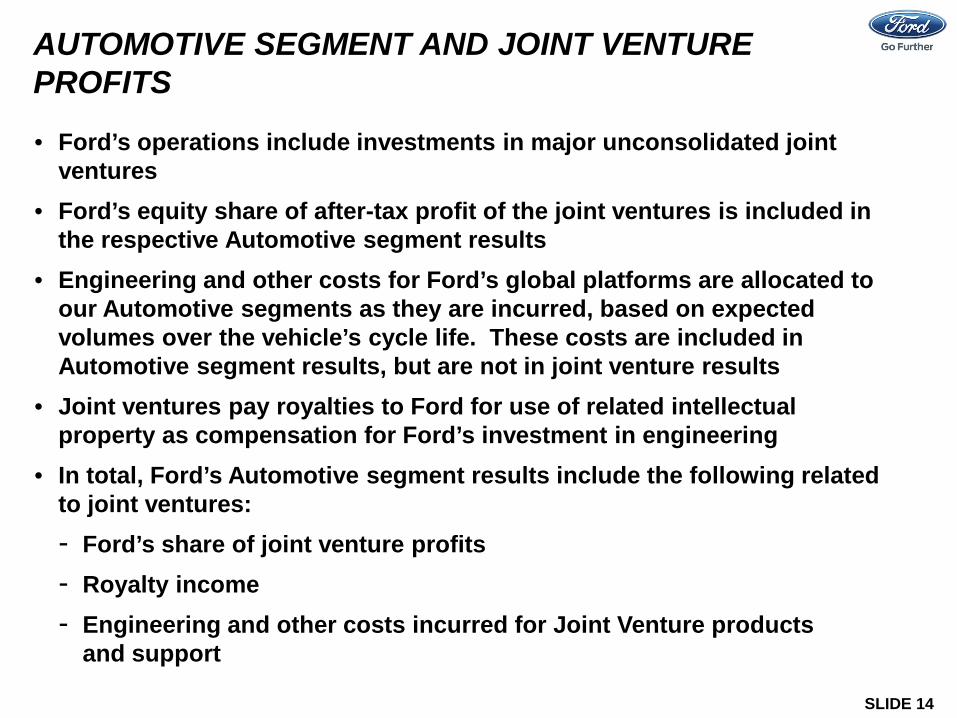
Impact AUTOMOTIVE SEGMENT AND JOINT VENTURE PROFITS • Ford’s operations include investments in major unconsolidated joint
ventures • Ford’s equity share of after-tax profit of the joint ventures is included in
the respective Automotive segment results • Engineering and other costs for Ford’s global platforms are allocated to
our Automotive segments as they are incurred, based on expected volumes over the vehicle’s cycle life. These costs are included in Automotive segment results, but are not in joint venture results
• Joint ventures pay royalties to Ford for use of related intellectual property as compensation for Ford’s investment in engineering
• In total, Ford’s Automotive segment results include the following related to joint ventures: - Ford’s share of joint venture profits - Royalty income - Engineering and other costs incurred for Joint Venture products
and support
SLIDE 15
• Automotive Segment Reporting
• Production compared with Wholesales
• Automotive Segment and Joint Venture Profits
• Fixed Asset Depreciation and Impairment Policy
• Taxes
• Pension Sensitivities
• Annual Incentive Compensation Plan (AICP)
AGENDA
SLIDE 16
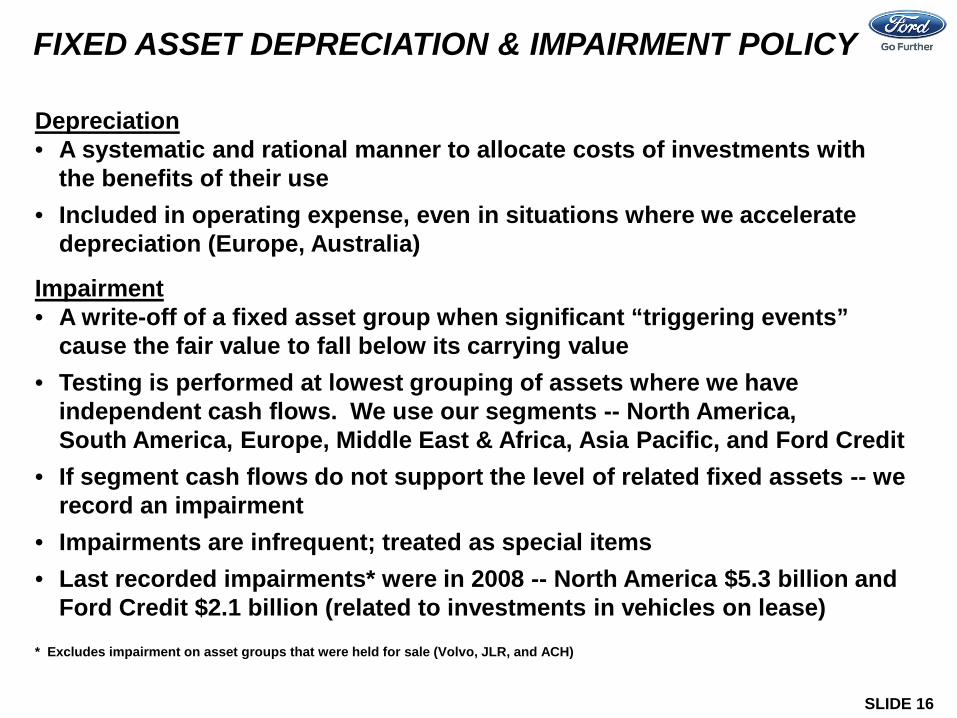
Depreciation • A systematic and rational manner to allocate costs of investments with
the benefits of their use • Included in operating expense, even in situations where we accelerate
depreciation (Europe, Australia)
Impairment • A write-off of a fixed asset group when significant “triggering events”
cause the fair value to fall below its carrying value • Testing is performed at lowest grouping of assets where we have
independent cash flows. We use our segments -- North America, South America, Europe, Middle East & Africa, Asia Pacific, and Ford Credit
• If segment cash flows do not support the level of related fixed assets -- we record an impairment
• Impairments are infrequent; treated as special items • Last recorded impairments* were in 2008 -- North America $5.3 billion and
Ford Credit $2.1 billion (related to investments in vehicles on lease)
FIXED ASSET DEPRECIATION & IMPAIRMENT POLICY
* Excludes impairment on asset groups that were held for sale (Volvo, JLR, and ACH)
SLIDE 17
• Automotive Segment Reporting
• Production compared with Wholesales
• Automotive Segment and Joint Venture Profits
• Fixed Asset Depreciation and Impairment Policy
• Taxes
• Pension Sensitivities
• Annual Incentive Compensation Plan (AICP)
AGENDA

SLIDE 18
Equity In Net Income Of Affiliated Companies Excluded From Denominator In Our Calculation Of An Operating Effective Tax Rate
(Provision for) / Benefit from income taxes
Adjusted pre-tax results = Effective tax rate
TAXES OPERATING EFFECTIVE TAX RATE
1Q 2Q 3Q 4Q FY(Mils.) (Mils.) (Mils.) (Mils.) (Mils.)
Operating results*Pre-tax results 2,146$ 2,555$ 2,589$ 1,279$ 8,569$ ALess: Equity in net income ofaffiliated companies** 214 273 293 289 1,069 BAdjusted pre-tax results 1,932$ 2,282$ 2,296$ 990$ 7,500$ C
(Provision for) / Benefit fromincome taxes (503)$ (721)$ (767)$ (19)$ (2,010)$ D
Effective tax rate 26.0 % 31.6 % 33.4 % 1.9 % 26.8 % E
* Excludes special items; see reference section for detail and reconciliation to GAAP** Available in Appendix 4 of Earnings Review and page FS-2 of 2013 Form 10-K
2013 Actual
Reference
Calculation
E = C D
SLIDE 19
Cash Taxes Remain Low
TAXES CASH TAXES • Worldwide cash taxes to remain low for a number of years
• Worldwide tax assets generated in prior periods reduce current period
cash tax liabilities
SLIDE 20
• Automotive Segment Reporting
• Production compared with Wholesales
• Automotive Segment and Joint Venture Profits
• Fixed Asset Depreciation and Impairment Policy
• Taxes
• Pension Sensitivities
• Annual Incentive Compensation Plan (AICP)
AGENDA
SLIDE 21
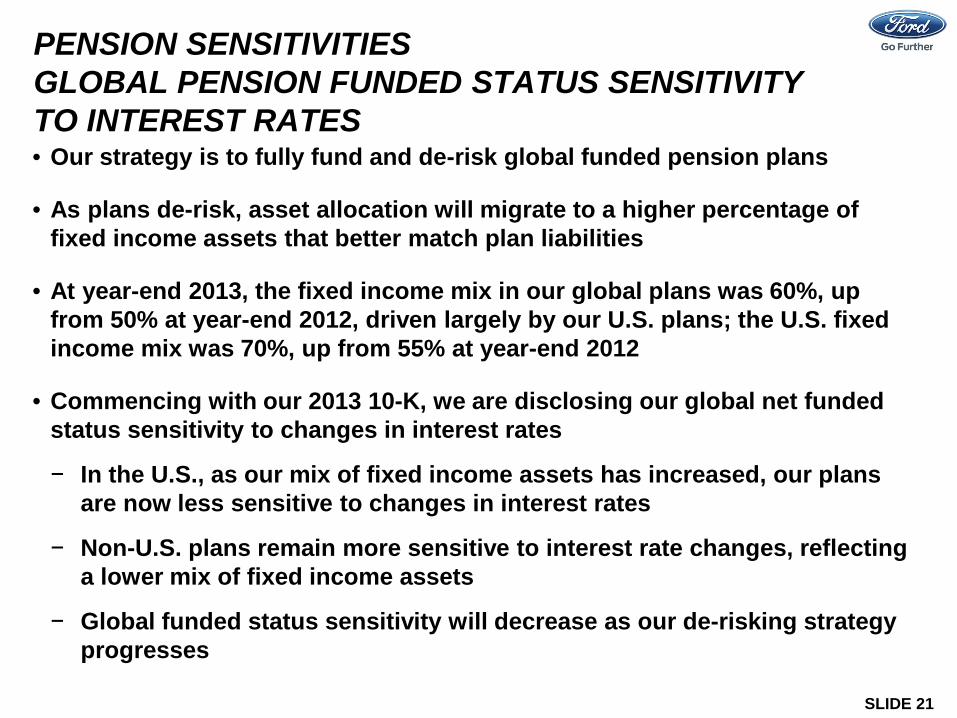
PENSION SENSITIVITIES GLOBAL PENSION FUNDED STATUS SENSITIVITY TO INTEREST RATES • Our strategy is to fully fund and de-risk global funded pension plans
• As plans de-risk, asset allocation will migrate to a higher percentage of fixed income assets that better match plan liabilities
• At year-end 2013, the fixed income mix in our global plans was 60%, up from 50% at year-end 2012, driven largely by our U.S. plans; the U.S. fixed income mix was 70%, up from 55% at year-end 2012
• Commencing with our 2013 10-K, we are disclosing our global net funded status sensitivity to changes in interest rates
− In the U.S., as our mix of fixed income assets has increased, our plans are now less sensitive to changes in interest rates
− Non-U.S. plans remain more sensitive to interest rate changes, reflecting a lower mix of fixed income assets
− Global funded status sensitivity will decrease as our de-risking strategy progresses
SLIDE 22
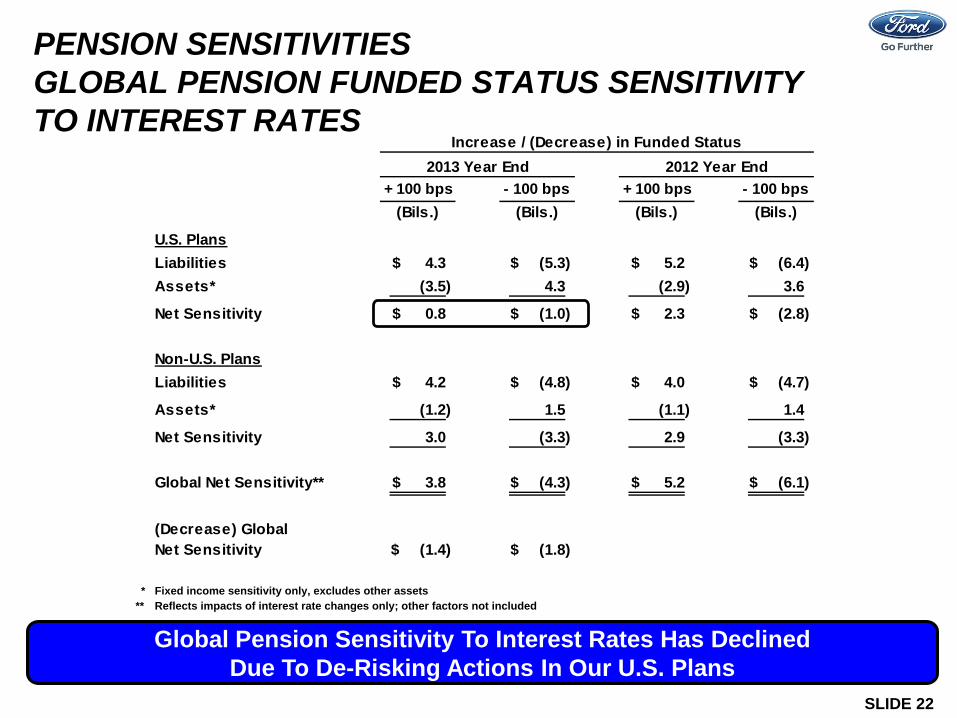
+ 100 bps - 100 bps + 100 bps - 100 bps(Bils.) (Bils.) (Bils.) (Bils.)
U.S. PlansLiabilities 4.3$ (5.3)$ 5.2$ (6.4)$ Assets* (3.5) 4.3 (2.9) 3.6
Net Sensitivity 0.8$ (1.0)$ 2.3$ (2.8)$
Non-U.S. PlansLiabilities 4.2$ (4.8)$ 4.0$ (4.7)$
Assets* (1.2) 1.5 (1.1) 1.4
Net Sensitivity 3.0 (3.3) 2.9 (3.3)
Global Net Sensitivity** 3.8$ (4.3)$ 5.2$ (6.1)$
(Decrease) Global Net Sensitivity (1.4)$ (1.8)$
* Fixed income sensitivity only, excludes other assets** Reflects impacts of interest rate changes only; other factors not included
2013 Year End 2012 Year EndIncrease / (Decrease) in Funded Status
Global Pension Sensitivity To Interest Rates Has Declined Due To De-Risking Actions In Our U.S. Plans
PENSION SENSITIVITIES GLOBAL PENSION FUNDED STATUS SENSITIVITY TO INTEREST RATES
SLIDE 23
• Automotive Segment Reporting
• Production compared with Wholesales
• Automotive Segment and Joint Venture Profits
• Fixed Asset Depreciation and Impairment Policy
• Taxes
• Pension Sensitivities
• Annual Incentive Compensation Plan (AICP)
AGENDA
SLIDE 24
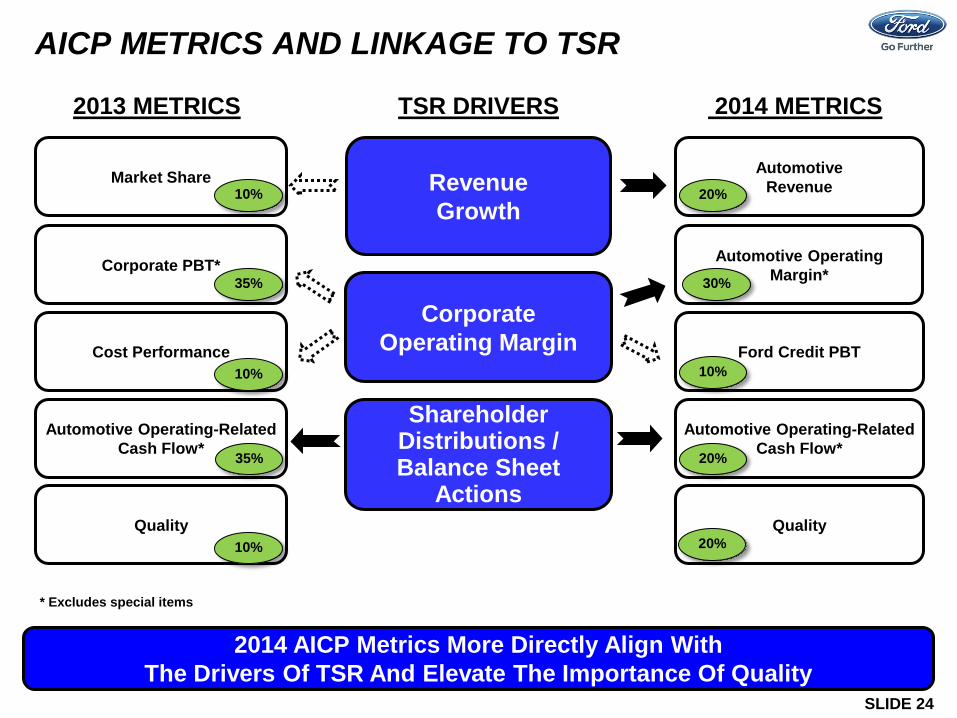
AICP METRICS AND LINKAGE TO TSR
Automotive Revenue
TSR DRIVERS 2014 METRICS
Automotive Operating-Related Cash Flow*
Quality
Automotive Operating Margin*
Ford Credit PBT
2013 METRICS
Shareholder Distributions / Balance Sheet
Actions
Market Share
Corporate PBT*
Cost Performance
Automotive Operating-Related Cash Flow*
Quality
Corporate Operating Margin
Revenue Growth
2014 AICP Metrics More Directly Align With The Drivers Of TSR And Elevate The Importance Of Quality
10%
35%
10%
35%
10%
20%
30%
10%
20%
20%
* Excludes special items
SLIDE 25
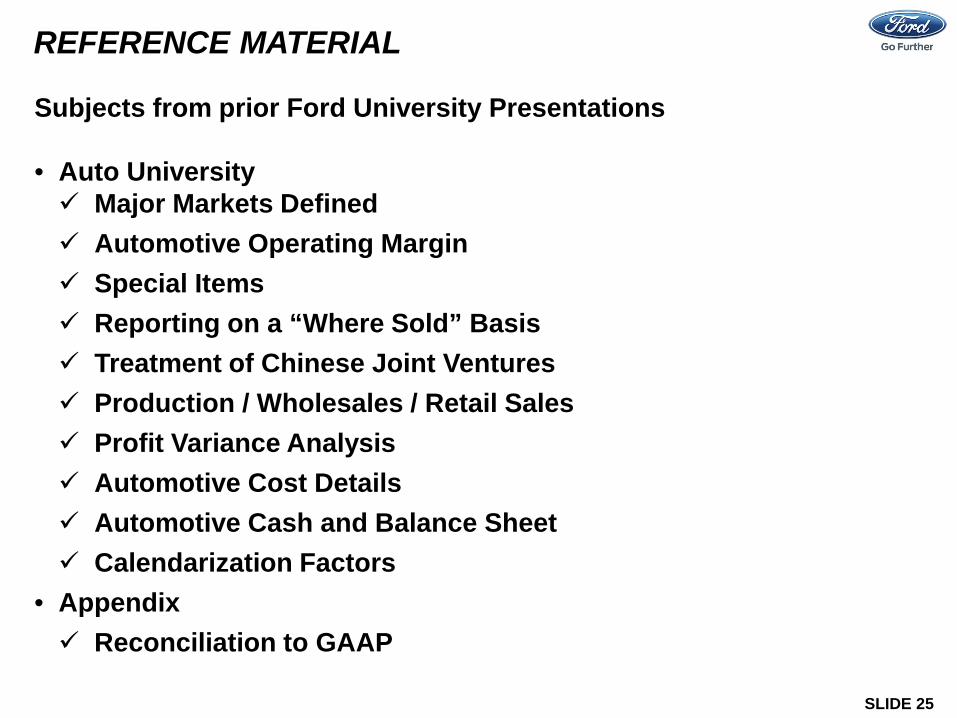
REFERENCE MATERIAL Subjects from prior Ford University Presentations • Auto University Major Markets Defined Automotive Operating Margin Special Items Reporting on a “Where Sold” Basis Treatment of Chinese Joint Ventures Production / Wholesales / Retail Sales Profit Variance Analysis Automotive Cost Details Automotive Cash and Balance Sheet Calendarization Factors
• Appendix Reconciliation to GAAP
- 26 -
- 27 -
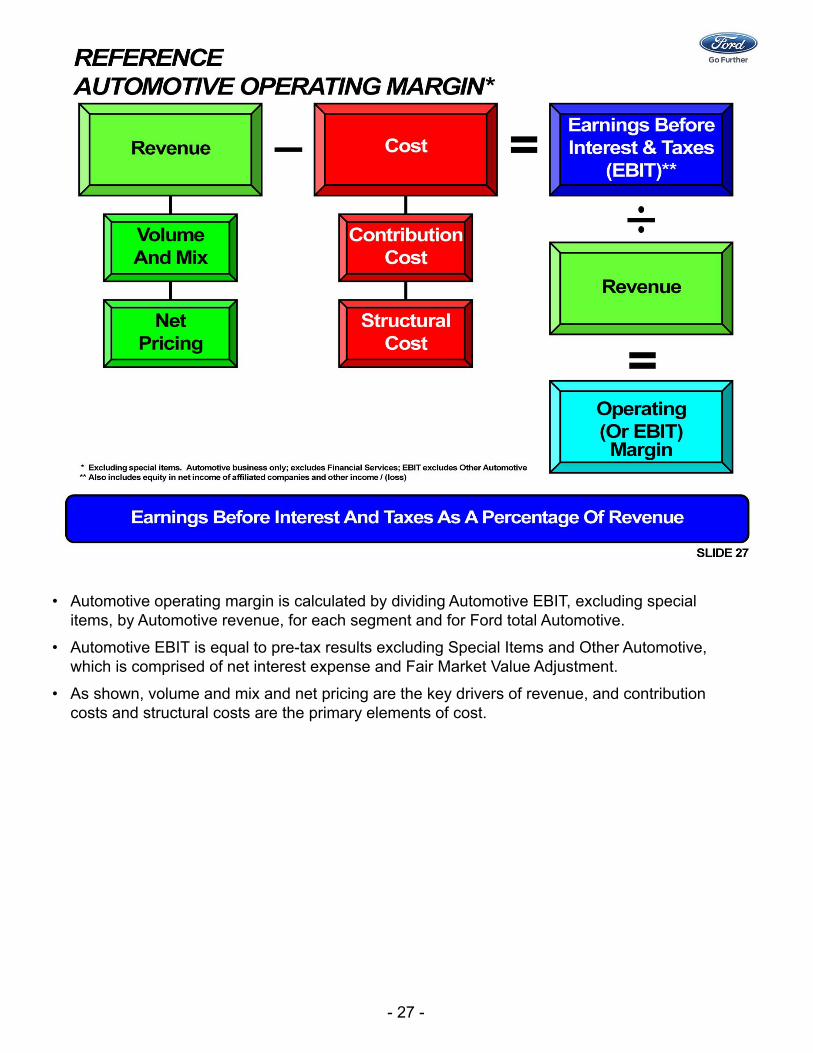
• Automotive operating margin is calculated by dividing Automotive EBIT, excluding special items, by Automotive revenue, for each segment and for Ford total Automotive.
• Automotive EBIT is equal to pre-tax results excluding Special Items and Other Automotive, which is comprised of net interest expense and Fair Market Value Adjustment.
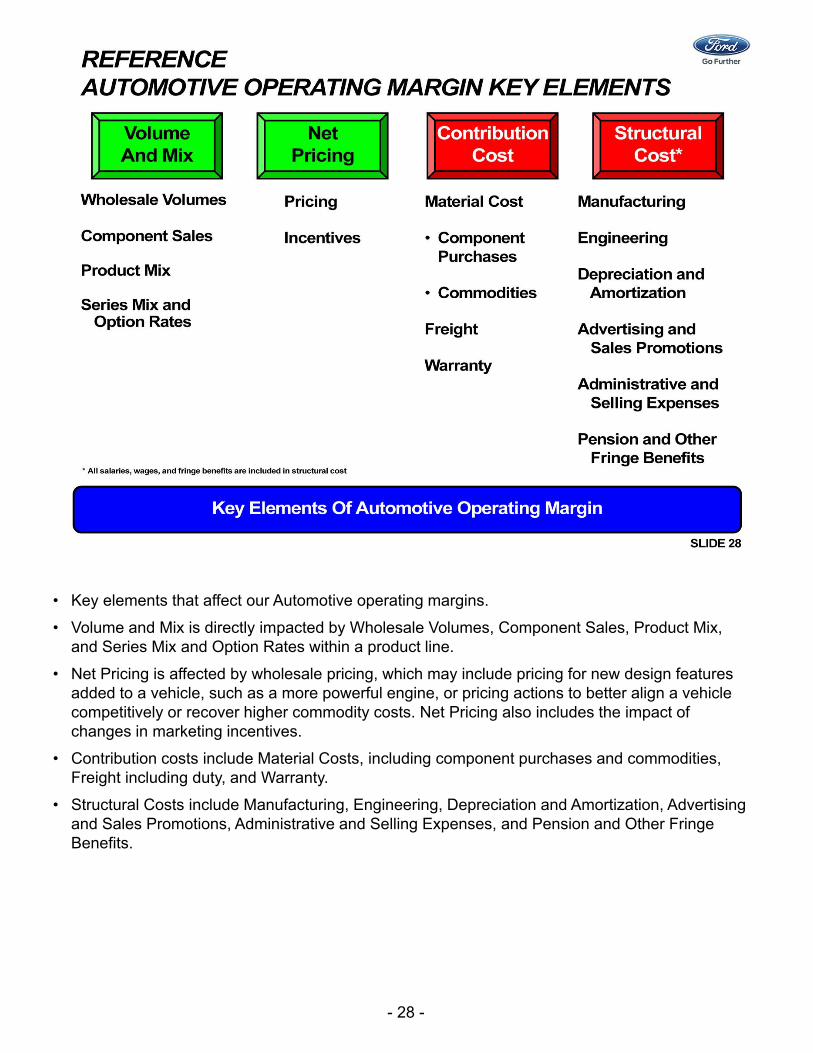
• As shown, volume and mix and net pricing are the key drivers of revenue, and contribution costs and structural costs are the primary elements of cost.
- 28 -
• Key elements that affect our Automotive operating margins.
• Volume and Mix is directly impacted by Wholesale Volumes, Component Sales, Product Mix, and Series Mix and Option Rates within a product line.
• Net Pricing is affected by wholesale pricing, which may include pricing for new design features added to a vehicle, such as a more powerful engine, or pricing actions to better align a vehicle competitively or recover higher commodity costs. Net Pricing also includes the impact of changes in marketing incentives.
• Contribution costs include Material Costs, including component purchases and commodities, Freight including duty, and Warranty.
• Structural Costs include Manufacturing, Engineering, Depreciation and Amortization, Advertising and Sales Promotions, Administrative and Selling Expenses, and Pension and Other Fringe Benefits.
- 29 -
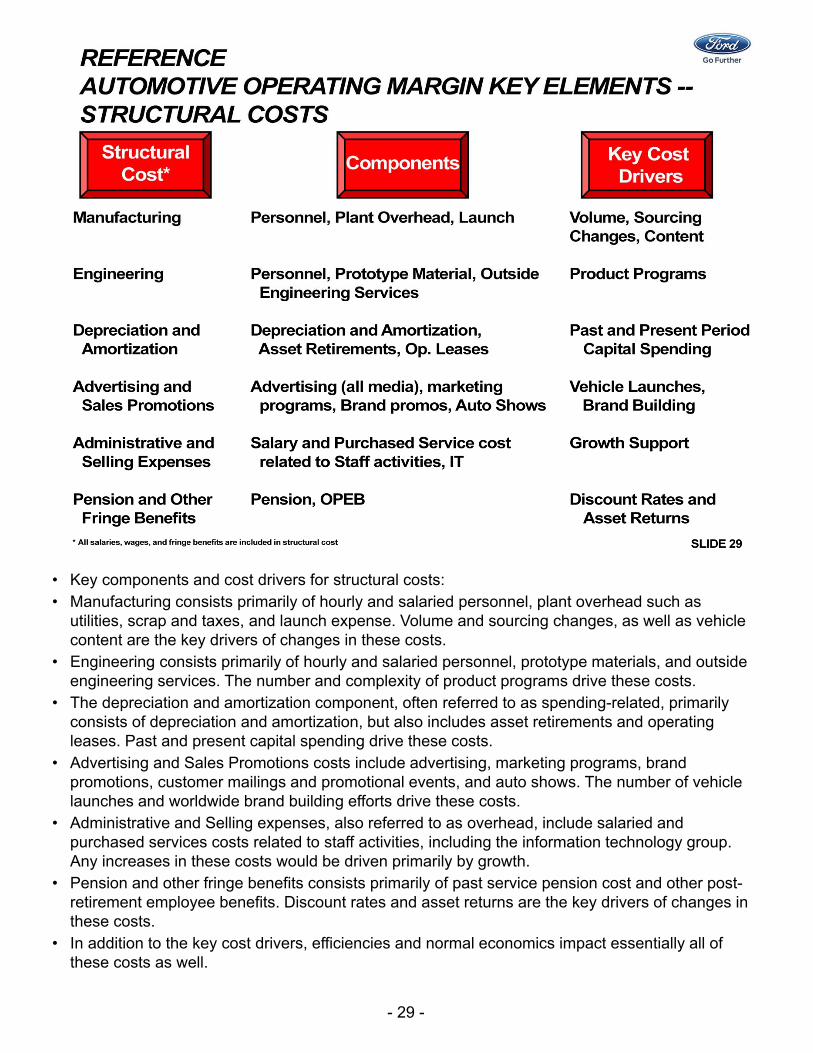
• Key components and cost drivers for structural costs:• Manufacturing consists primarily of hourly and salaried personnel, plant overhead such as
utilities, scrap and taxes, and launch expense. Volume and sourcing changes, as well as vehicle content are the key drivers of changes in these costs.
• Engineering consists primarily of hourly and salaried personnel, prototype materials, and outside engineering services. The number and complexity of product programs drive these costs.
• The depreciation and amortization component, often referred to as spending-related, primarily consists of depreciation and amortization, but also includes asset retirements and operating leases. Past and present capital spending drive these costs.
• Advertising and Sales Promotions costs include advertising, marketing programs, brand promotions, customer mailings and promotional events, and auto shows. The number of vehicle launches and worldwide brand building efforts drive these costs.
• Administrative and Selling expenses, also referred to as overhead, include salaried and purchased services costs related to staff activities, including the information technology group. Any increases in these costs would be driven primarily by growth.
• Pension and other fringe benefits consists primarily of past service pension cost and other post-retirement employee benefits. Discount rates and asset returns are the key drivers of changes in these costs.
• In addition to the key cost drivers, efficiencies and normal economics impact essentially all of these costs as well.
- 30 -
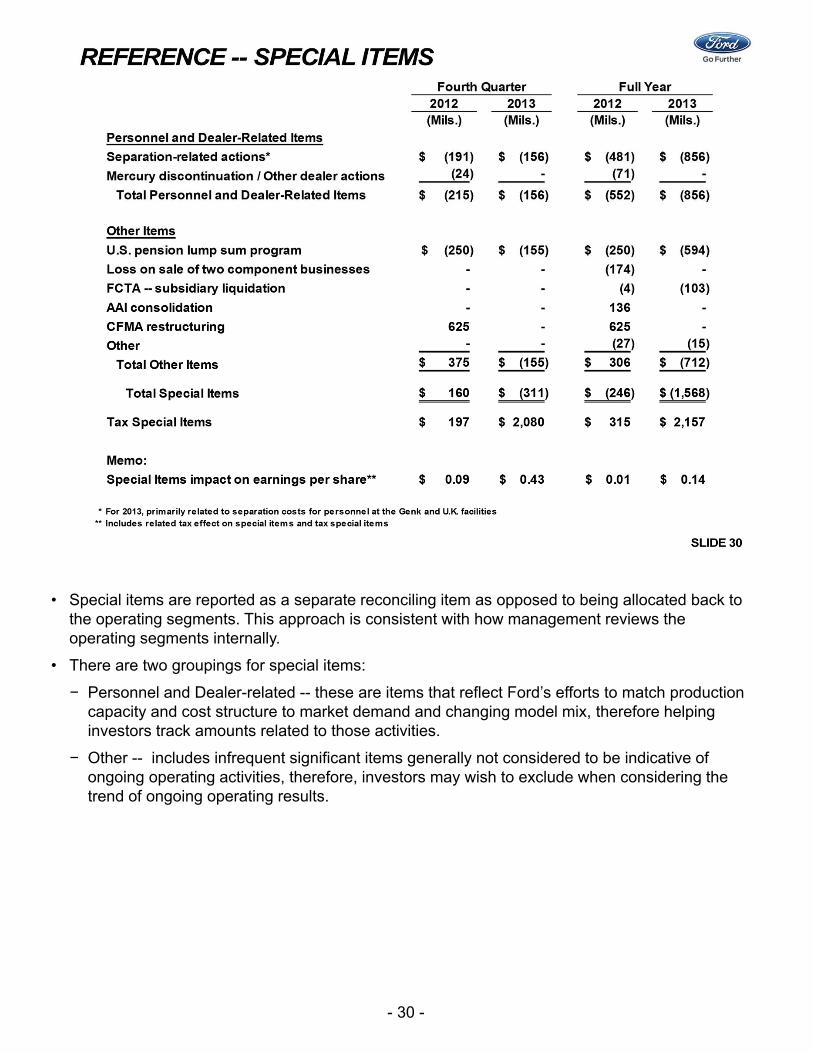
• Special items are reported as a separate reconciling item as opposed to being allocated back to the operating segments. This approach is consistent with how management reviews the operating segments internally.
• There are two groupings for special items:
− Personnel and Dealer-related -- these are items that reflect Ford’s efforts to match production capacity and cost structure to market demand and changing model mix, therefore helping investors track amounts related to those activities.
− Other -- includes infrequent significant items generally not considered to be indicative of ongoing operating activities, therefore, investors may wish to exclude when considering the trend of ongoing operating results.
- 31 -
- 32 -
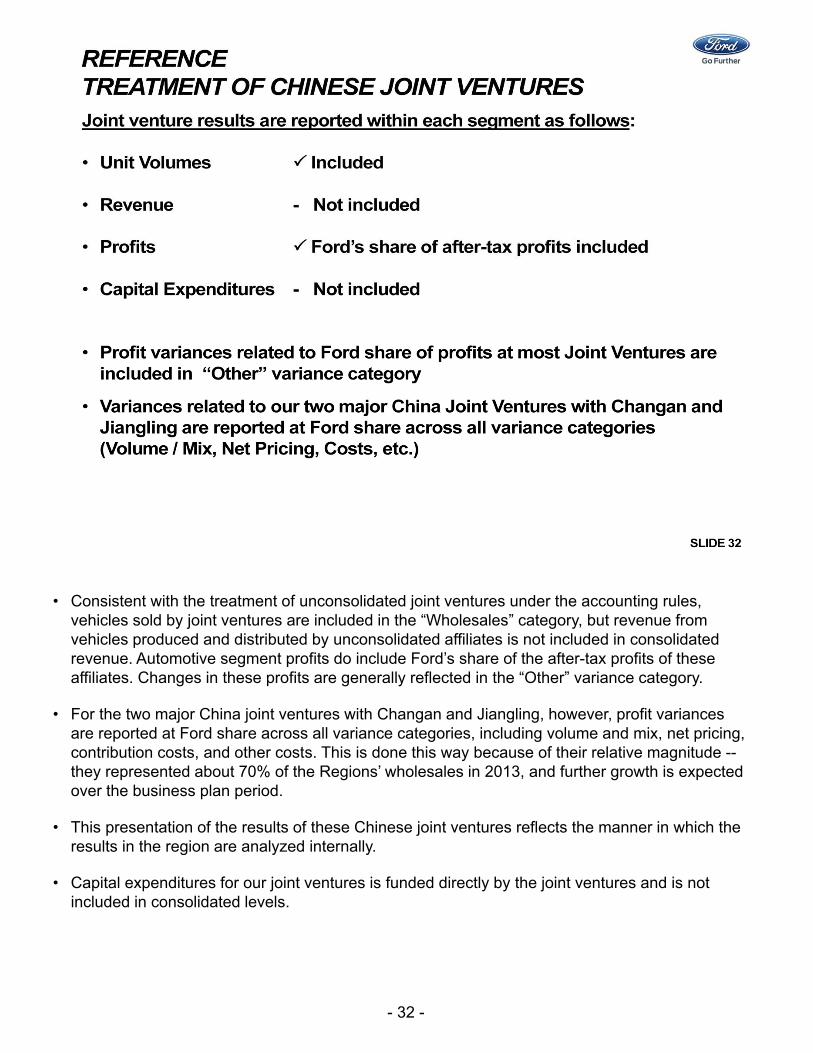
• Consistent with the treatment of unconsolidated joint ventures under the accounting rules, vehicles sold by joint ventures are included in the “Wholesales” category, but revenue from vehicles produced and distributed by unconsolidated affiliates is not included in consolidated revenue. Automotive segment profits do include Ford’s share of the after-tax profits of these affiliates. Changes in these profits are generally reflected in the “Other” variance category.
• For the two major China joint ventures with Changan and Jiangling, however, profit variances are reported at Ford share across all variance categories, including volume and mix, net pricing, contribution costs, and other costs. This is done this way because of their relative magnitude --they represented about 70% of the Regions’ wholesales in 2013, and further growth is expected over the business plan period.
• This presentation of the results of these Chinese joint ventures reflects the manner in which the results in the region are analyzed internally.
• Capital expenditures for our joint ventures is funded directly by the joint ventures and is not included in consolidated levels.
- 33 -
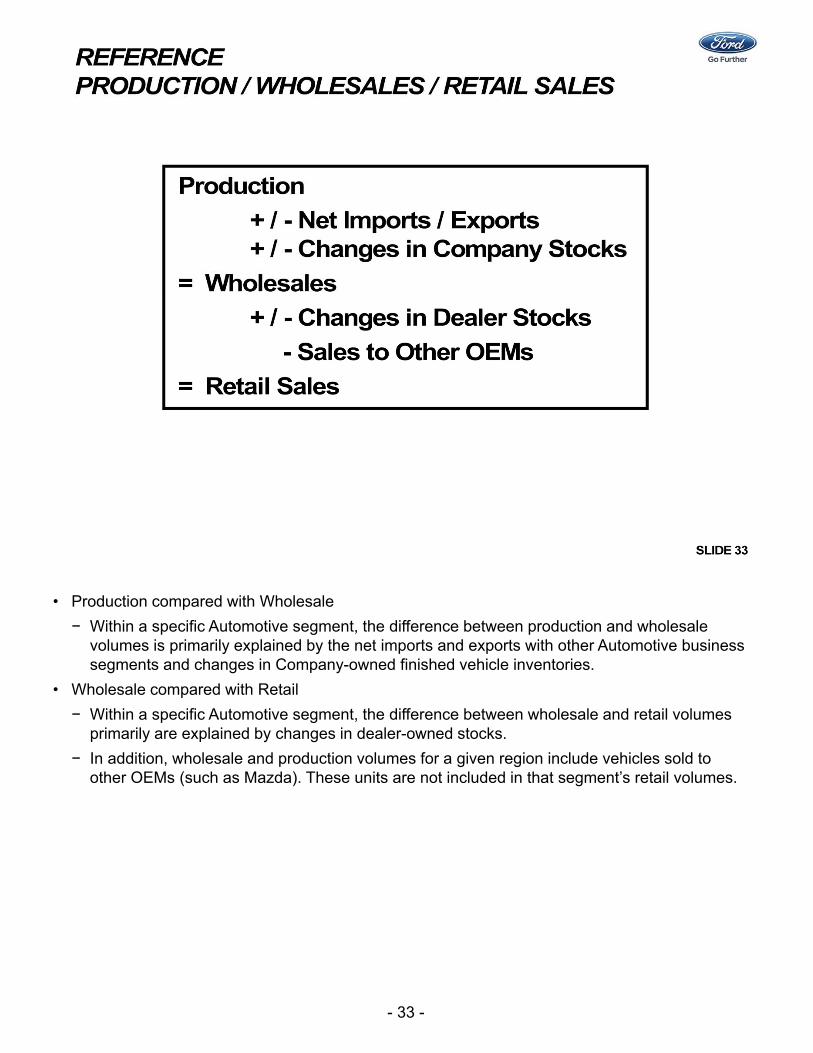
• Production compared with Wholesale
− Within a specific Automotive segment, the difference between production and wholesale volumes is primarily explained by the net imports and exports with other Automotive business segments and changes in Company-owned finished vehicle inventories.
• Wholesale compared with Retail
− Within a specific Automotive segment, the difference between wholesale and retail volumes primarily are explained by changes in dealer-owned stocks.
− In addition, wholesale and production volumes for a given region include vehicles sold to other OEMs (such as Mazda). These units are not included in that segment’s retail volumes.
- 34 -
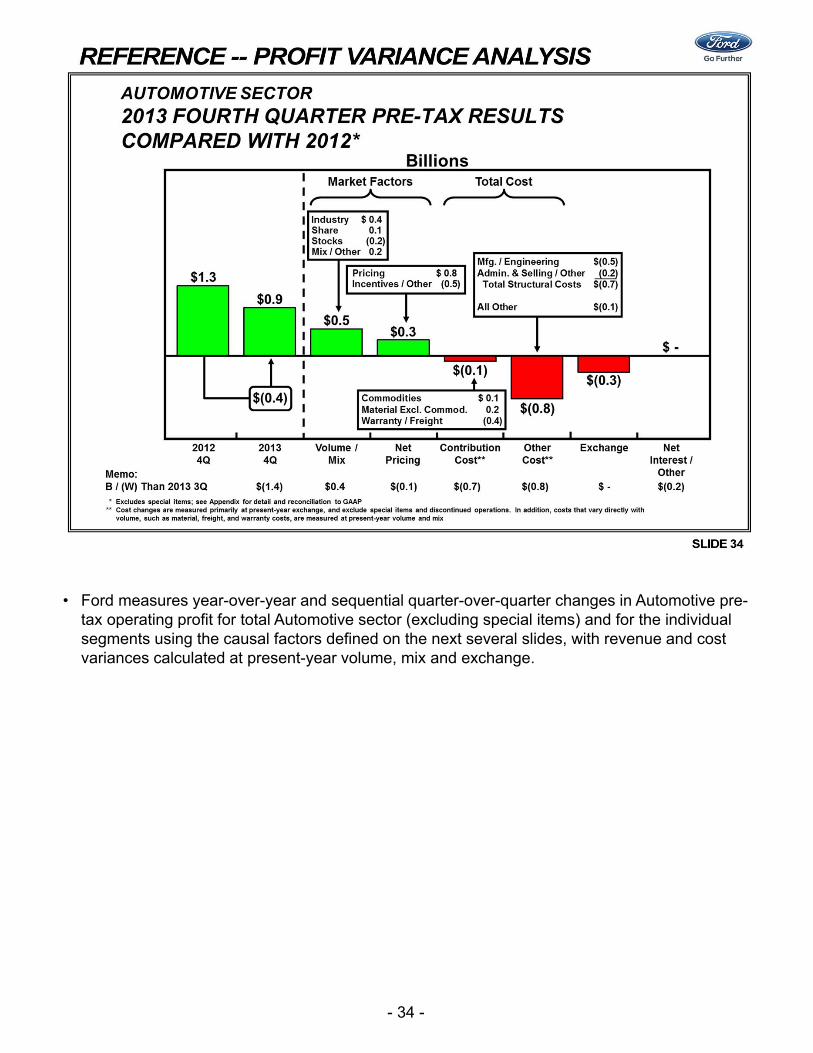
• Ford measures year-over-year and sequential quarter-over-quarter changes in Automotive pre-tax operating profit for total Automotive sector (excluding special items) and for the individual segments using the causal factors defined on the next several slides, with revenue and cost variances calculated at present-year volume, mix and exchange.
- 35 -
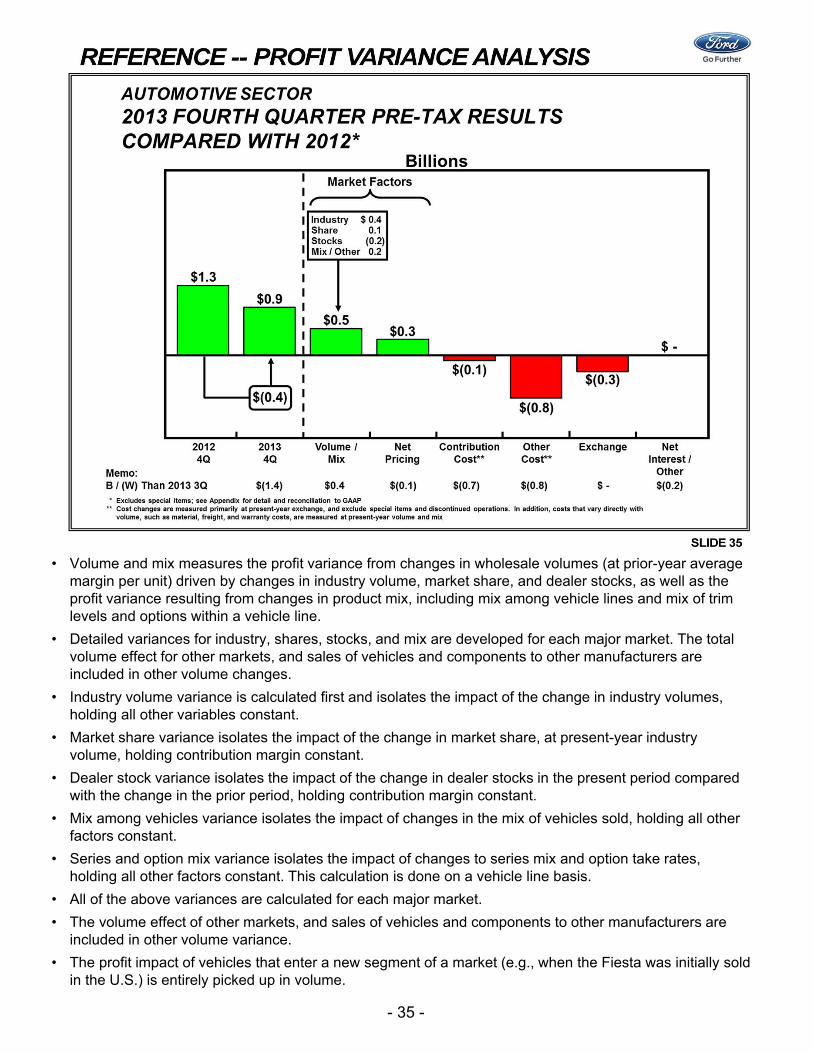
• Volume and mix measures the profit variance from changes in wholesale volumes (at prior-year average margin per unit) driven by changes in industry volume, market share, and dealer stocks, as well as the profit variance resulting from changes in product mix, including mix among vehicle lines and mix of trim levels and options within a vehicle line.
• Detailed variances for industry, shares, stocks, and mix are developed for each major market. The total volume effect for other markets, and sales of vehicles and components to other manufacturers are included in other volume changes.
• Industry volume variance is calculated first and isolates the impact of the change in industry volumes, holding all other variables constant.
• Market share variance isolates the impact of the change in market share, at present-year industry volume, holding contribution margin constant.
• Dealer stock variance isolates the impact of the change in dealer stocks in the present period compared with the change in the prior period, holding contribution margin constant.
• Mix among vehicles variance isolates the impact of changes in the mix of vehicles sold, holding all other factors constant.
• Series and option mix variance isolates the impact of changes to series mix and option take rates, holding all other factors constant. This calculation is done on a vehicle line basis.
• All of the above variances are calculated for each major market.
• The volume effect of other markets, and sales of vehicles and components to other manufacturers are included in other volume variance.
• The profit impact of vehicles that enter a new segment of a market (e.g., when the Fiesta was initially sold in the U.S.) is entirely picked up in volume.
- 36 -
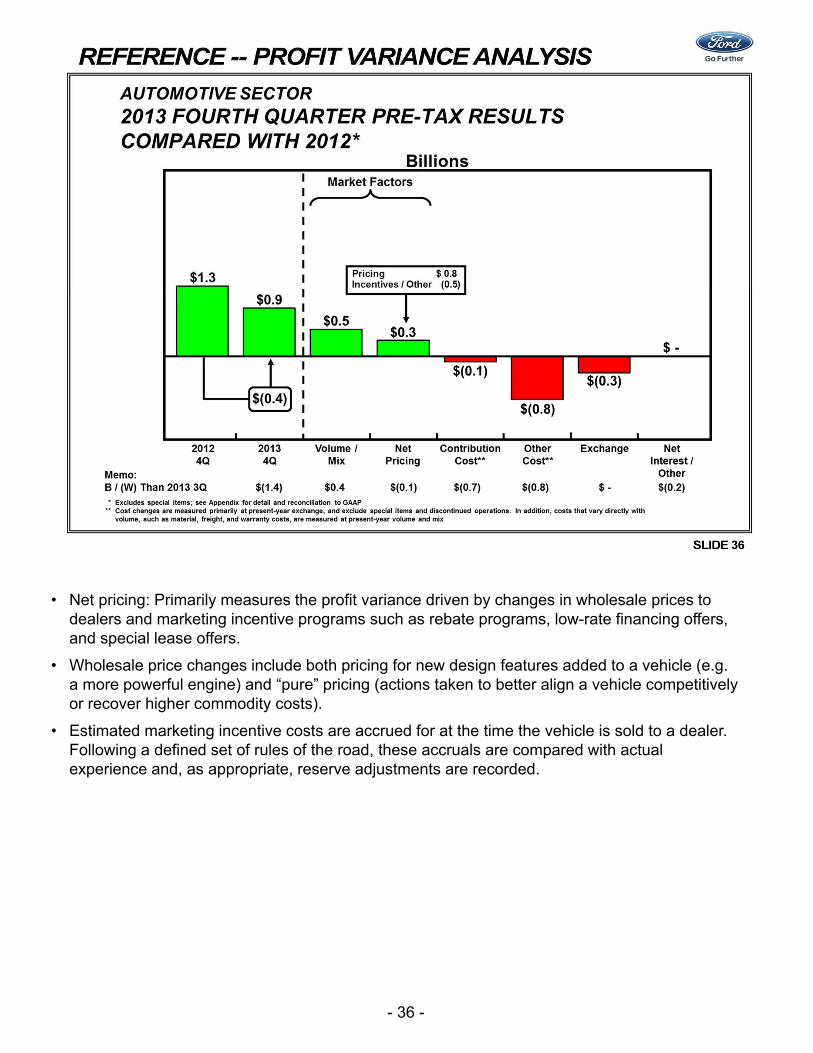
• Net pricing: Primarily measures the profit variance driven by changes in wholesale prices to dealers and marketing incentive programs such as rebate programs, low-rate financing offers, and special lease offers.
• Wholesale price changes include both pricing for new design features added to a vehicle (e.g. a more powerful engine) and “pure” pricing (actions taken to better align a vehicle competitively or recover higher commodity costs).
• Estimated marketing incentive costs are accrued for at the time the vehicle is sold to a dealer. Following a defined set of rules of the road, these accruals are compared with actual experience and, as appropriate, reserve adjustments are recorded.
- 37 -
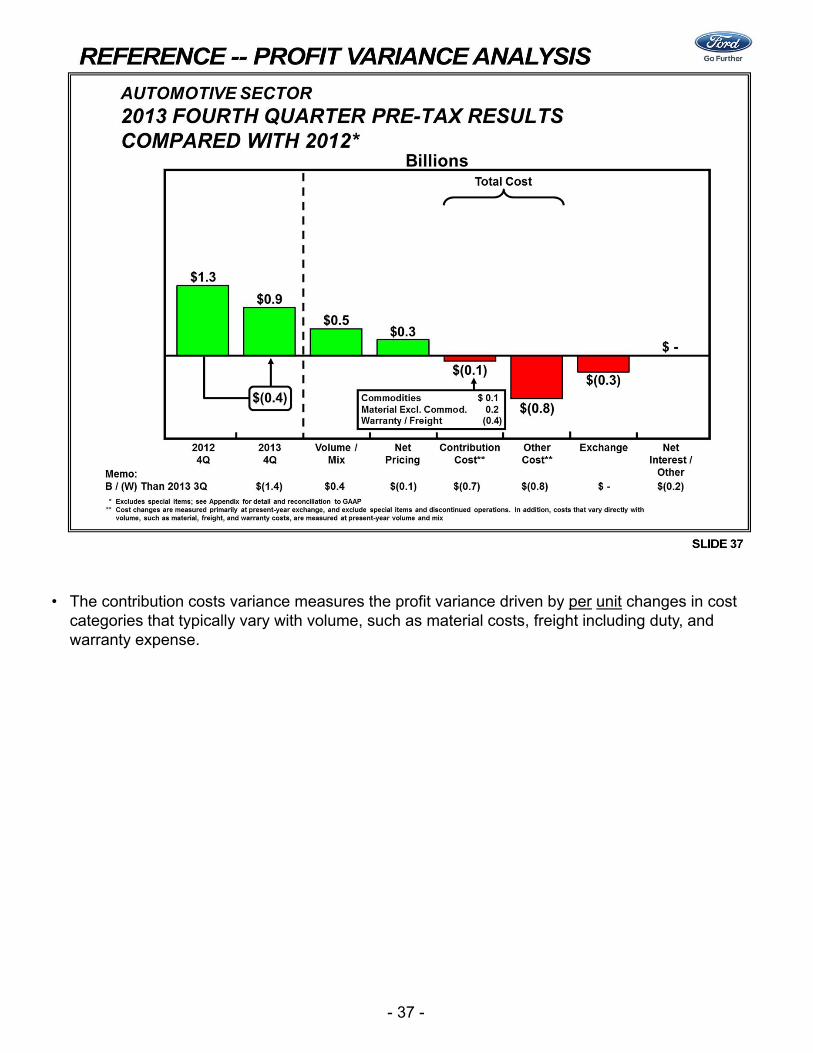
• The contribution costs variance measures the profit variance driven by per unit changes in cost categories that typically vary with volume, such as material costs, freight including duty, and warranty expense.
- 38 -
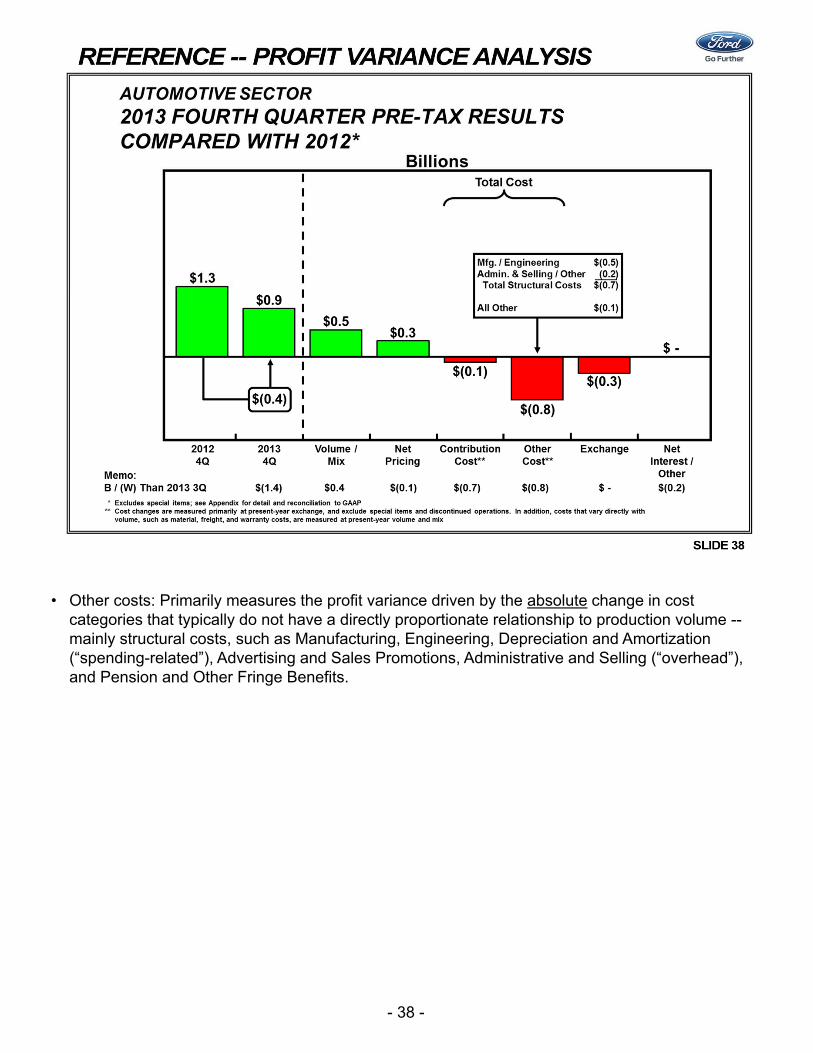
• Other costs: Primarily measures the profit variance driven by the absolute change in cost categories that typically do not have a directly proportionate relationship to production volume --mainly structural costs, such as Manufacturing, Engineering, Depreciation and Amortization (“spending-related”), Advertising and Sales Promotions, Administrative and Selling (“overhead”), and Pension and Other Fringe Benefits.
- 39 -
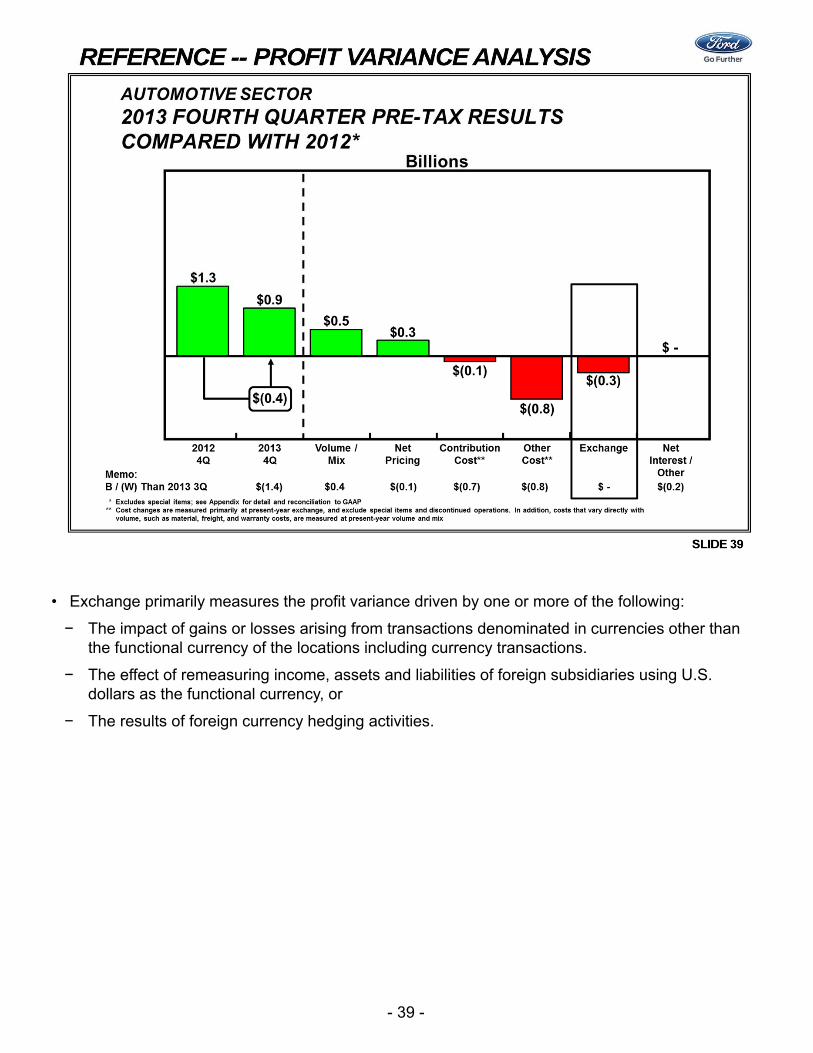
• Exchange primarily measures the profit variance driven by one or more of the following:
− The impact of gains or losses arising from transactions denominated in currencies other than the functional currency of the locations including currency transactions.
− The effect of remeasuring income, assets and liabilities of foreign subsidiaries using U.S. dollars as the functional currency, or
− The results of foreign currency hedging activities.
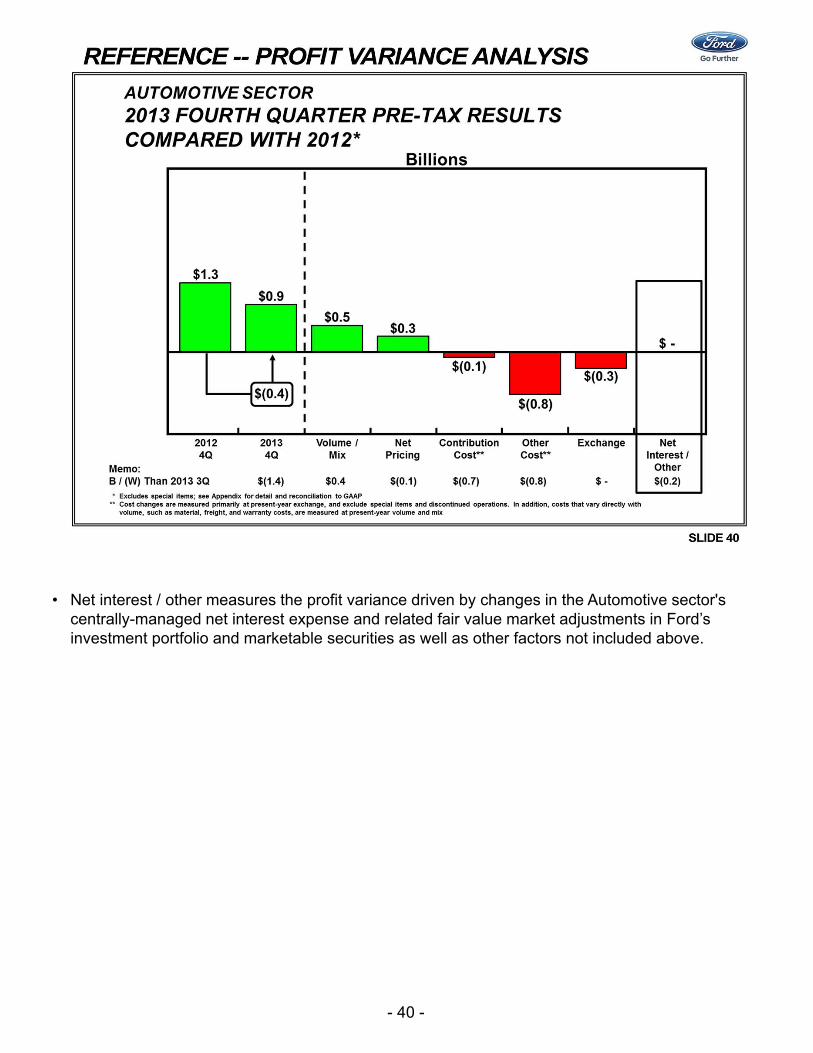
- 40 -
• Net interest / other measures the profit variance driven by changes in the Automotive sector's centrally-managed net interest expense and related fair value market adjustments in Ford’s investment portfolio and marketable securities as well as other factors not included above.
- 41 -
- 42 -
- 43 -
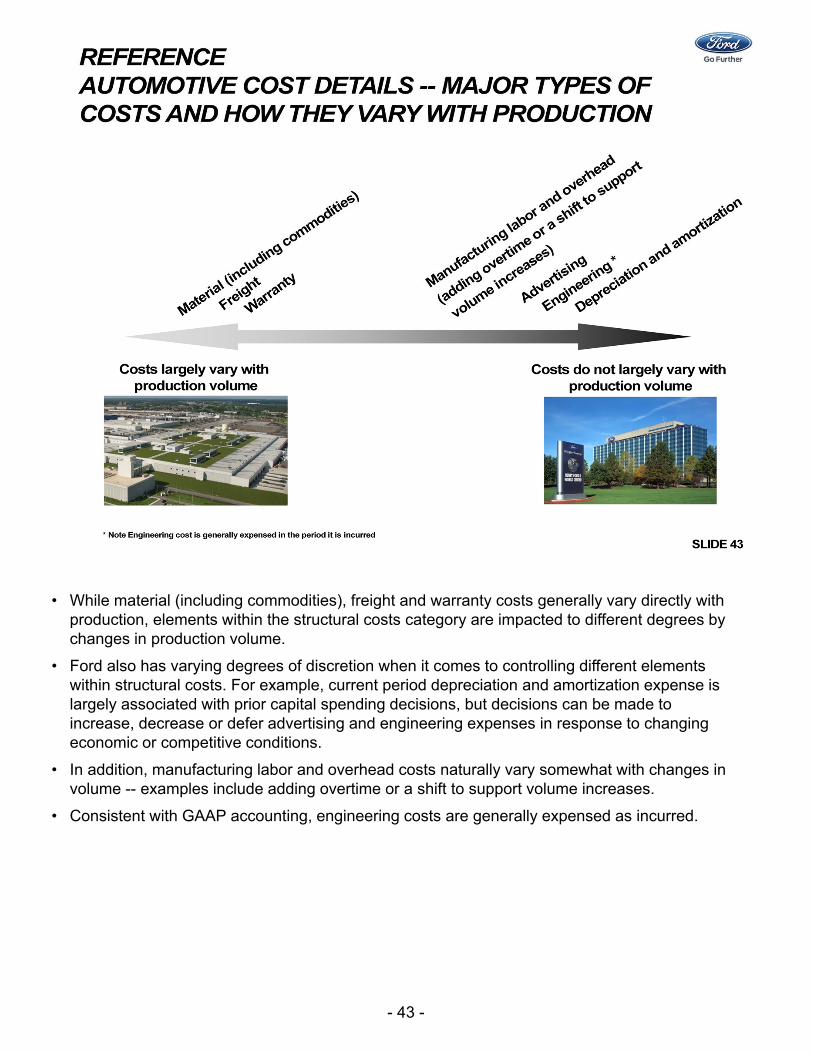
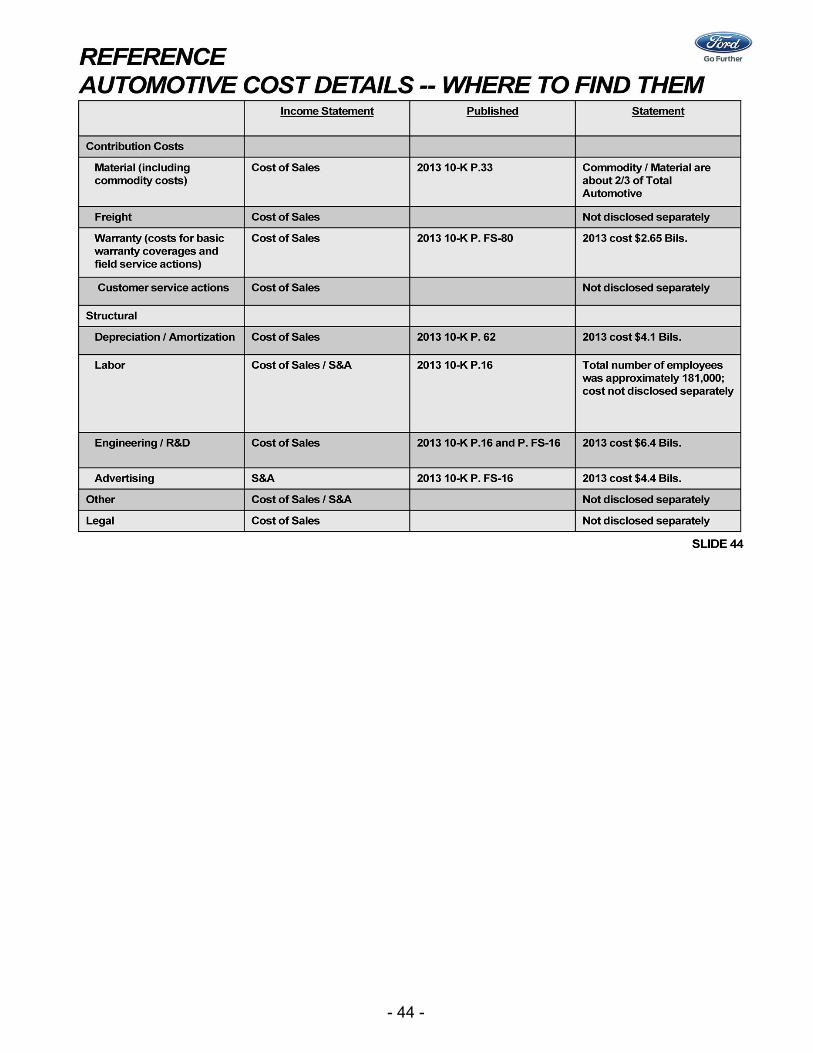
• While material (including commodities), freight and warranty costs generally vary directly with production, elements within the structural costs category are impacted to different degrees by changes in production volume.
• Ford also has varying degrees of discretion when it comes to controlling different elements within structural costs. For example, current period depreciation and amortization expense is largely associated with prior capital spending decisions, but decisions can be made to increase, decrease or defer advertising and engineering expenses in response to changing economic or competitive conditions.
• In addition, manufacturing labor and overhead costs naturally vary somewhat with changes in volume -- examples include adding overtime or a shift to support volume increases.
• Consistent with GAAP accounting, engineering costs are generally expensed as incurred.
- 44 -
- 45 -
- 46 -
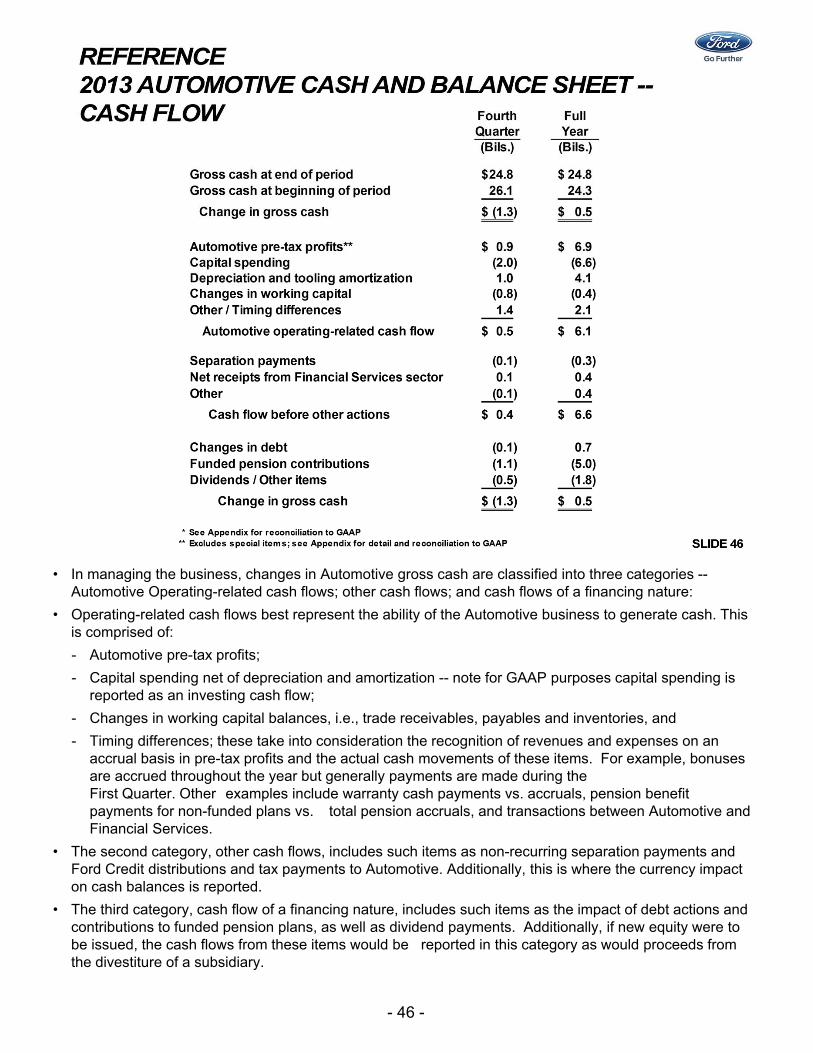
• In managing the business, changes in Automotive gross cash are classified into three categories --Automotive Operating-related cash flows; other cash flows; and cash flows of a financing nature:
• Operating-related cash flows best represent the ability of the Automotive business to generate cash. This is comprised of:
- Automotive pre-tax profits;
- Capital spending net of depreciation and amortization -- note for GAAP purposes capital spending is reported as an investing cash flow;
- Changes in working capital balances, i.e., trade receivables, payables and inventories, and
- Timing differences; these take into consideration the recognition of revenues and expenses on an accrual basis in pre-tax profits and the actual cash movements of these items. For example, bonuses are accrued throughout the year but generally payments are made during the First Quarter. Other examples include warranty cash payments vs. accruals, pension benefit payments for non-funded plans vs. total pension accruals, and transactions between Automotive and Financial Services.
• The second category, other cash flows, includes such items as non-recurring separation payments and Ford Credit distributions and tax payments to Automotive. Additionally, this is where the currency impact on cash balances is reported.
• The third category, cash flow of a financing nature, includes such items as the impact of debt actions and contributions to funded pension plans, as well as dividend payments. Additionally, if new equity were to be issued, the cash flows from these items would be reported in this category as would proceeds from the divestiture of a subsidiary.
- 47 -
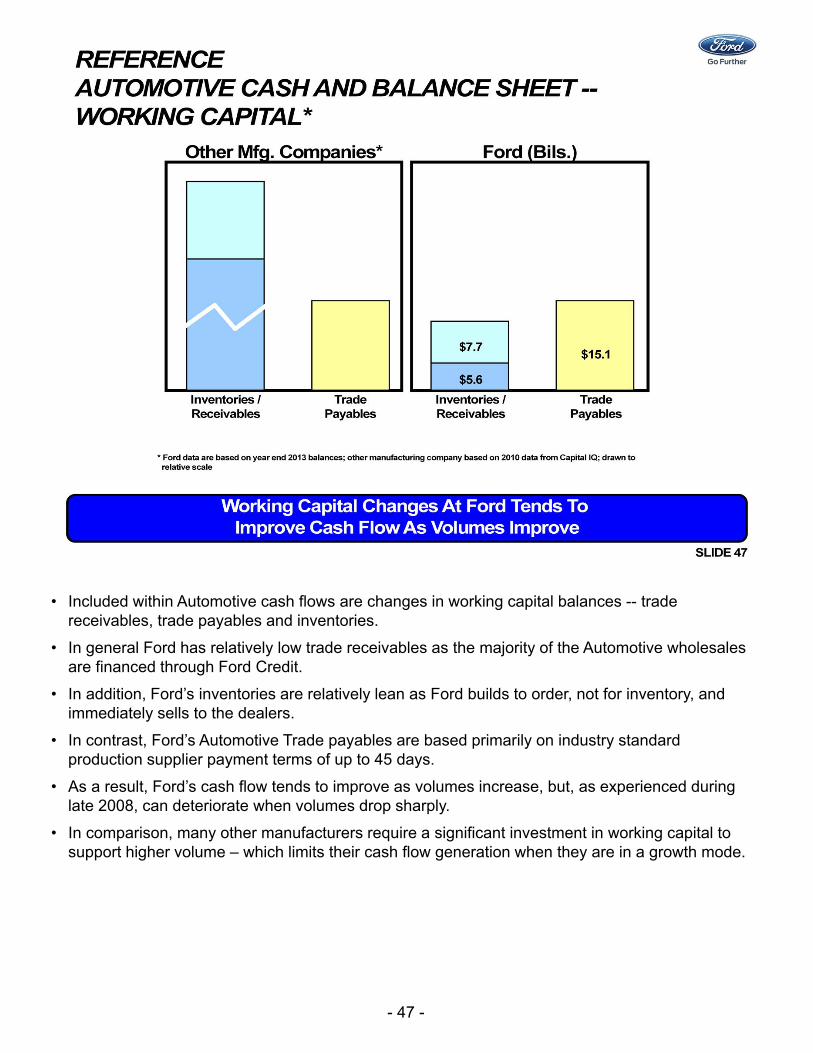
• Included within Automotive cash flows are changes in working capital balances -- trade receivables, trade payables and inventories.
• In general Ford has relatively low trade receivables as the majority of the Automotive wholesales are financed through Ford Credit.
• In addition, Ford’s inventories are relatively lean as Ford builds to order, not for inventory, and immediately sells to the dealers.
• In contrast, Ford’s Automotive Trade payables are based primarily on industry standard production supplier payment terms of up to 45 days.
• As a result, Ford’s cash flow tends to improve as volumes increase, but, as experienced during late 2008, can deteriorate when volumes drop sharply.
• In comparison, many other manufacturers require a significant investment in working capital to support higher volume – which limits their cash flow generation when they are in a growth mode.
- 48 -
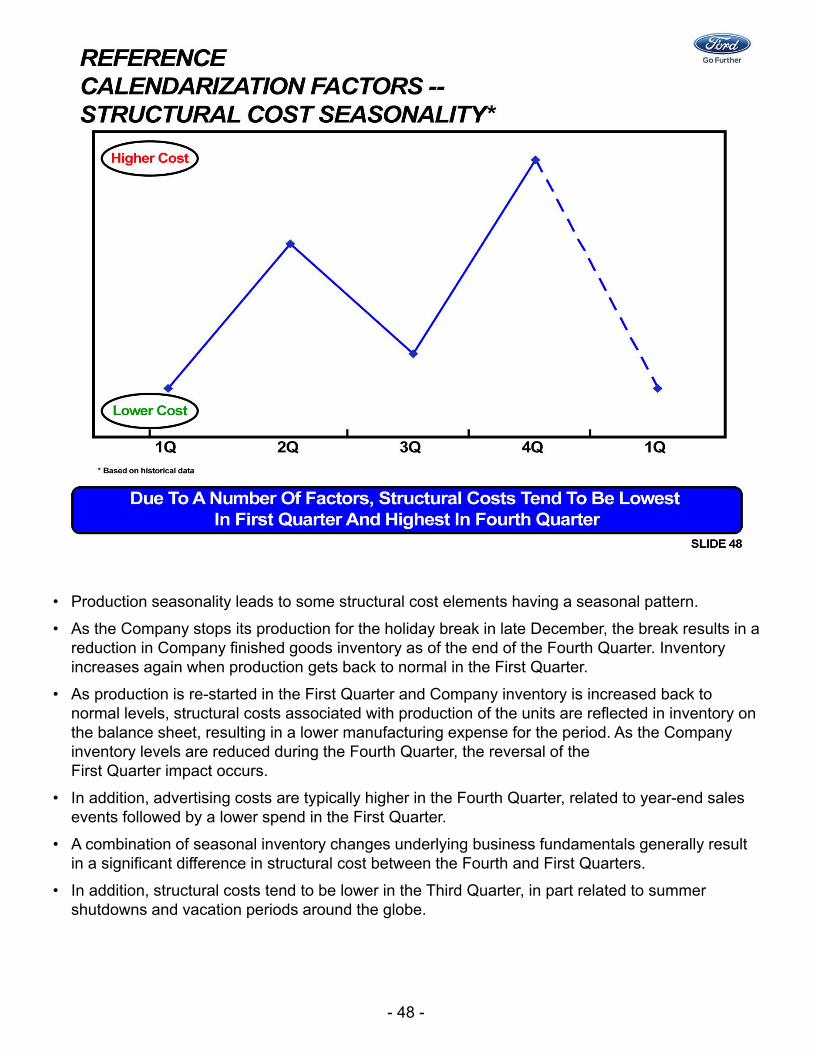
• Production seasonality leads to some structural cost elements having a seasonal pattern.
• As the Company stops its production for the holiday break in late December, the break results in a reduction in Company finished goods inventory as of the end of the Fourth Quarter. Inventory increases again when production gets back to normal in the First Quarter.
• As production is re-started in the First Quarter and Company inventory is increased back to normal levels, structural costs associated with production of the units are reflected in inventory on the balance sheet, resulting in a lower manufacturing expense for the period. As the Company inventory levels are reduced during the Fourth Quarter, the reversal of the First Quarter impact occurs.
• In addition, advertising costs are typically higher in the Fourth Quarter, related to year-end sales events followed by a lower spend in the First Quarter.
• A combination of seasonal inventory changes underlying business fundamentals generally result in a significant difference in structural cost between the Fourth and First Quarters.
• In addition, structural costs tend to be lower in the Third Quarter, in part related to summer shutdowns and vacation periods around the globe.
- 49 -
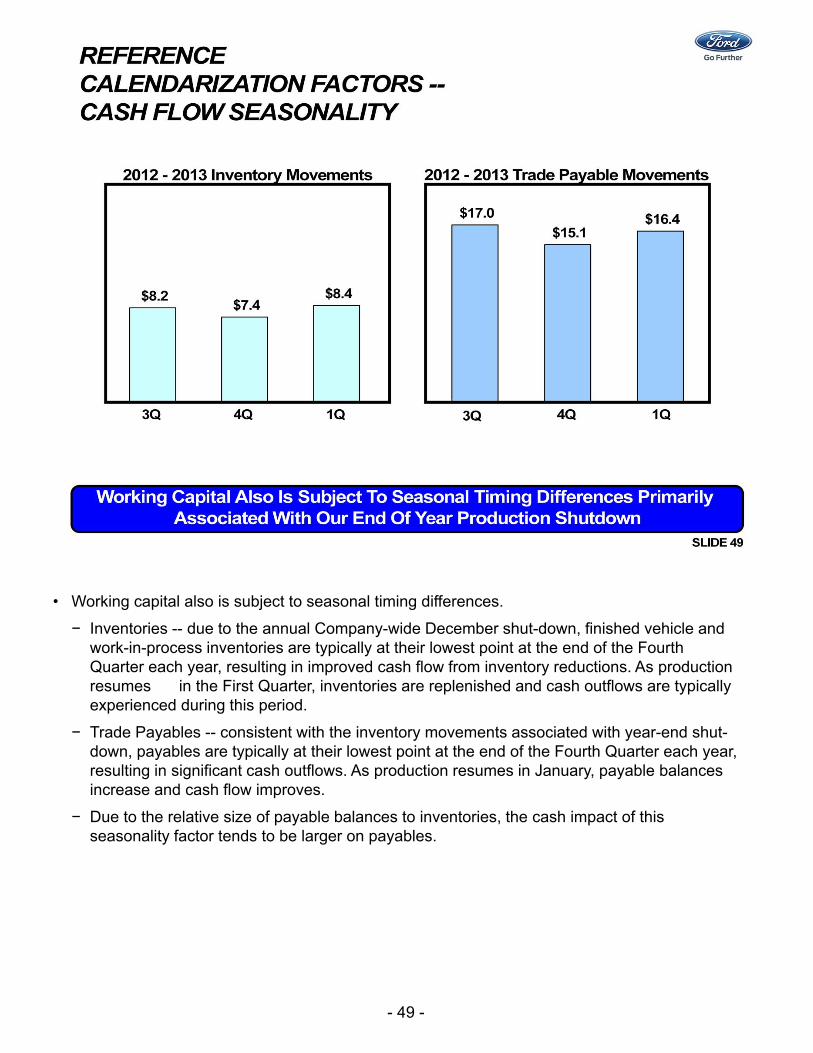
• Working capital also is subject to seasonal timing differences.
− Inventories -- due to the annual Company-wide December shut-down, finished vehicle and work-in-process inventories are typically at their lowest point at the end of the Fourth Quarter each year, resulting in improved cash flow from inventory reductions. As production resumes in the First Quarter, inventories are replenished and cash outflows are typically experienced during this period.
− Trade Payables -- consistent with the inventory movements associated with year-end shut-down, payables are typically at their lowest point at the end of the Fourth Quarter each year, resulting in significant cash outflows. As production resumes in January, payable balances increase and cash flow improves.
− Due to the relative size of payable balances to inventories, the cash impact of this seasonality factor tends to be larger on payables.
- 50 -
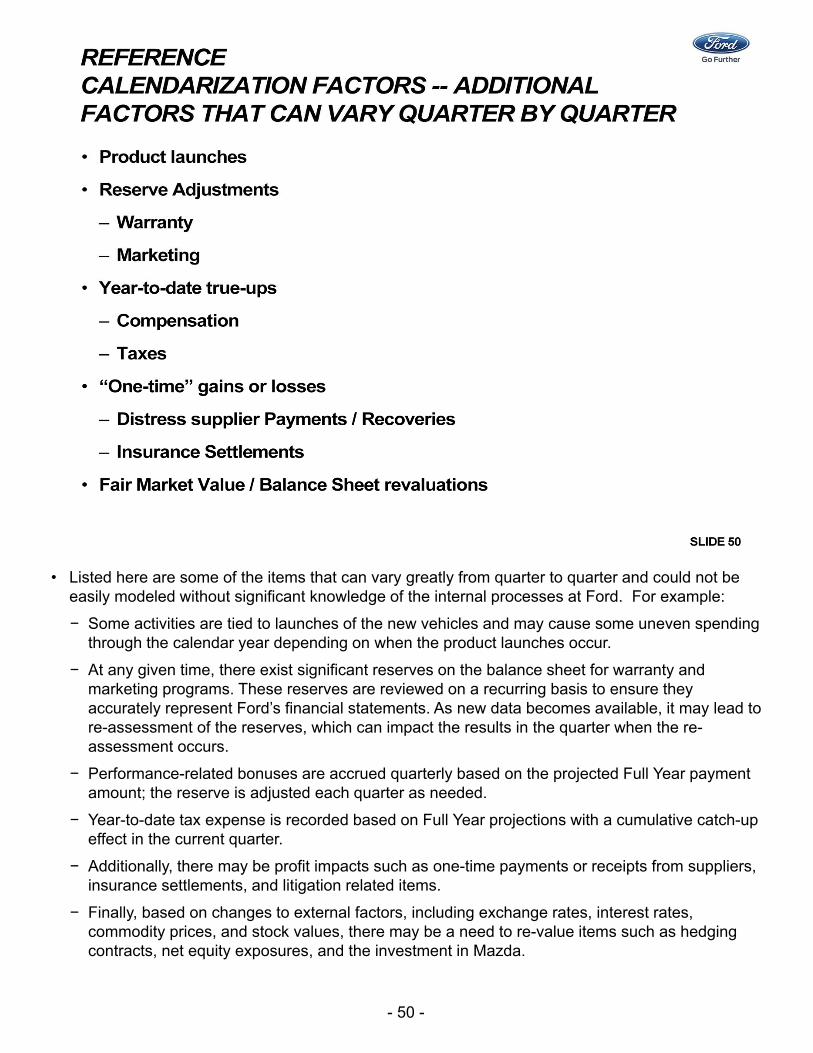
• Listed here are some of the items that can vary greatly from quarter to quarter and could not be easily modeled without significant knowledge of the internal processes at Ford. For example:
− Some activities are tied to launches of the new vehicles and may cause some uneven spending through the calendar year depending on when the product launches occur.
− At any given time, there exist significant reserves on the balance sheet for warranty and marketing programs. These reserves are reviewed on a recurring basis to ensure they accurately represent Ford’s financial statements. As new data becomes available, it may lead to re-assessment of the reserves, which can impact the results in the quarter when the re-assessment occurs.
− Performance-related bonuses are accrued quarterly based on the projected Full Year payment amount; the reserve is adjusted each quarter as needed.
− Year-to-date tax expense is recorded based on Full Year projections with a cumulative catch-up effect in the current quarter.
− Additionally, there may be profit impacts such as one-time payments or receipts from suppliers, insurance settlements, and litigation related items.
− Finally, based on changes to external factors, including exchange rates, interest rates, commodity prices, and stock values, there may be a need to re-value items such as hedging contracts, net equity exposures, and the investment in Mazda.
- 51 -
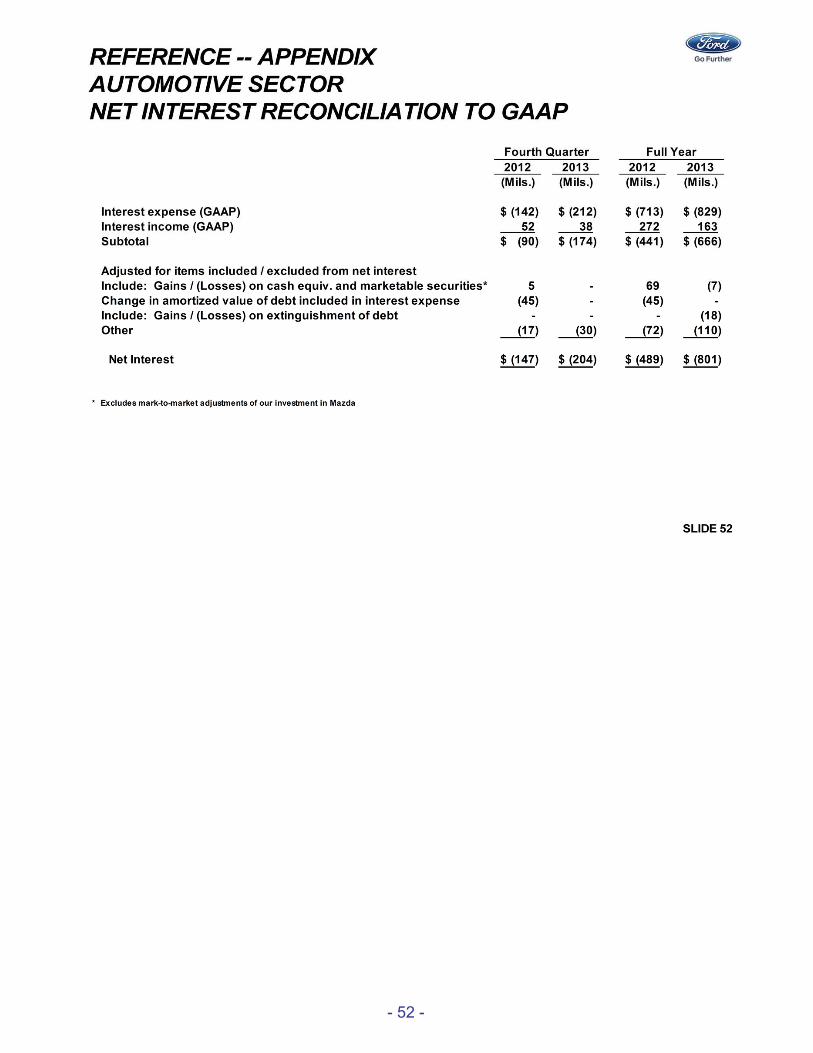
- 52 -
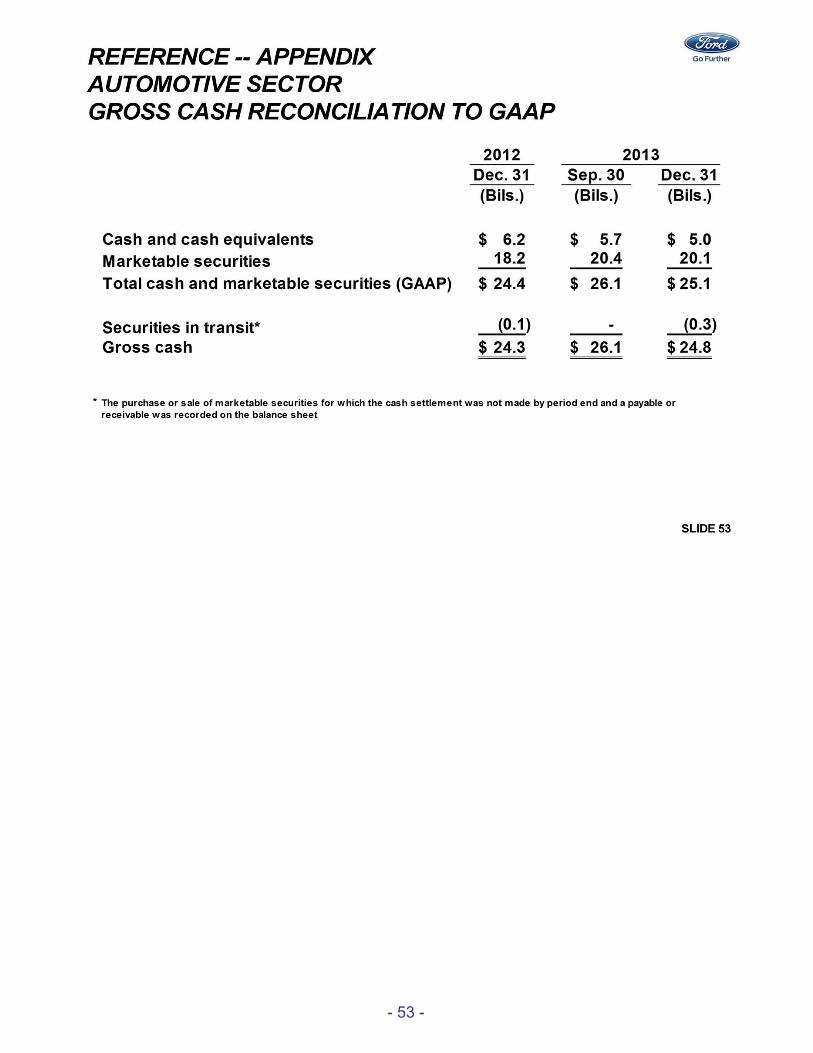
- 53 -
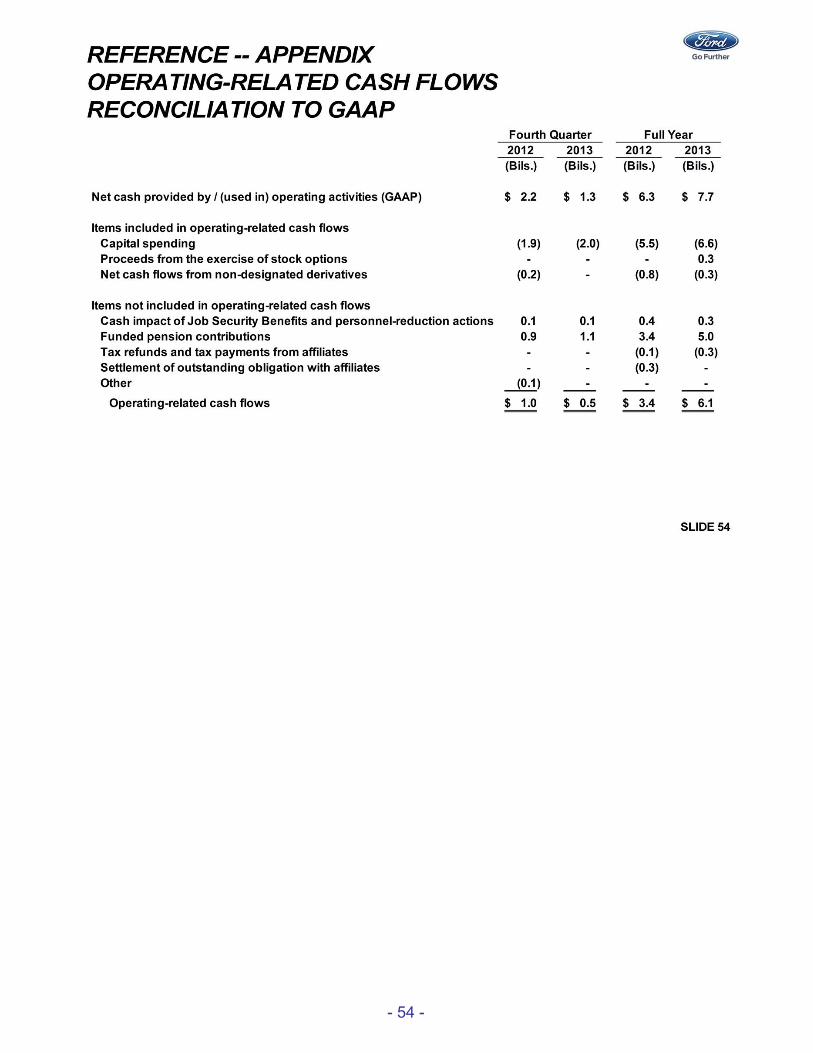
- 54 -
- 55 -


