
IZA DP No. 2108
Friendship in a Public Good Experiment
Marco HaanPeter KooremanTineke Riemersma
DI
SC
US
SI
ON
PA
PE
R S
ER
IE
S
Forschungsinstitutzur Zukunft der ArbeitInstitute for the Studyof Labor
April 2006

Friendship in a Public Good Experiment
Marco Haan
University of Groningen
Peter Kooreman University of Groningen
and IZA Bonn
Tineke Riemersma University of Groningen
Discussion Paper No. 2108 April 2006
IZA
P.O. Box 7240 53072 Bonn
Germany
Phone: +49-228-3894-0 Fax: +49-228-3894-180
Email: [email protected]
Any opinions expressed here are those of the author(s) and not those of the institute. Research disseminated by IZA may include views on policy, but the institute itself takes no institutional policy positions. The Institute for the Study of Labor (IZA) in Bonn is a local and virtual international research center and a place of communication between science, politics and business. IZA is an independent nonprofit company supported by Deutsche Post World Net. The center is associated with the University of Bonn and offers a stimulating research environment through its research networks, research support, and visitors and doctoral programs. IZA engages in (i) original and internationally competitive research in all fields of labor economics, (ii) development of policy concepts, and (iii) dissemination of research results and concepts to the interested public. IZA Discussion Papers often represent preliminary work and are circulated to encourage discussion. Citation of such a paper should account for its provisional character. A revised version may be available directly from the author.

IZA Discussion Paper No. 2108 April 2006
ABSTRACT
Friendship in a Public Good Experiment We conduct a public good experiment with high school teenagers. Some groups exclusively consist of students that we know to be friends. Other groups exclusively consist of students that we know not to be friends, and that are mere classmates. We find that ‘friends’ contribute more to the public good than ‘classmates’ do. Contributions of ‘classmates’ sharply decrease in the last round, in line with the literature on public good experiments. However, contributions of ‘friends’ sharply increase in the last round. JEL Classification: C91, C92, H41 Keywords: experimental economics, public goods, friendship Corresponding author: Marco Haan Department of Economics University of Groningen P.O. Box 800 9700 AV Groningen The Netherlands Email: [email protected]

2
1. Introduction
A wealth of experimental literature has documented the behavior of individuals in public
good experiments. From this literature, a number of stylized facts have emerged (see. e.g.
the survey by Ledyard, 1995). First, experimental subjects do contribute to public goods,
and do so to a much larger extent than what the standard model of rational selfish utility-
maximizing behavior predicts. Second, in a repeated game, contributions ‘decay’ over time:
in a repeated game, average contributions to the public good go down with every repetition.
Third, there is a pronounced final-round effect, in the sense that contributions in the final
round sharply decrease, over and above the more gradual decline in earlier rounds. Hence,
the final round has the lowest contributions to the public good on average. These effects are
also found outside the laboratory (Haan and Kooreman, 2002).
Evidence is mixed, however, with respect to the effect of group composition. In a seminal
paper, Andreoni (1988) introduces the celebrated ‘Partners’ vs. ‘Strangers’ treatment. In the
Partners treatment, group composition remains fixed over the course of an experiment. In
the Strangers treatment, group composition changes after each round, so experimental
subjects play the public good game with different players in each round. If subjects behave
strategically, one would expect Partners to give more than Strangers. Doing so, they may be
able to secure cooperation at least in the earlier rounds, using the same logic as Kreps et al.
(1981). Surprisingly however, Andreoni (1988) finds that in each round the Strangers
contribute more to the public good than Partners do. Yet, replications of this study yield
mixed results. Both Croson (1996) and Keser and van Winden (2000) find that Partners do
indeed contribute more than Strangers in each round. Weimann (1994) finds no significant
difference in the behavior of the two groups.

3
In this paper, we take Andreoni’s (1988) analysis one step further. Rather than looking at
‘Partners’ in the sense of experimental subjects that happen to form a group in a repeated
public good game, we look at ‘true’ Partners: subjects that know each other, and that we
know to be close friends. We conduct the experiment with teenagers in a high school, as
friendships are most easily observed in such an environment. One of the authors
(Riemersma) had taught these students for over a year, and was therefore able to determine
which students regarded each other as ‘friends’. As a control group, we take teenagers that
we know not to be friends, but that only happen to be classmates.
Our work is related to van Dijk et al. (2002). They study the extent to which social ties
are formed during an experiment. The authors find that subjects become more friendly
towards others if their interaction with them in a public good experiment has been
advantageous, and less friendly if that interaction has been less advantageous. In our
experiment, we do not look at social ties that are formed during the experiment. Rather, we
study how social ties that are already in place influence behavior during the experiment.
Thus, where van Dijk et al. (2002) look at the effect of cooperation on social ties, we study
the effect of social ties on cooperation.
We find that friendship dramatically affects individuals’ contributions to public goods.
Friends contribute more than mere classmates. The contributions of ‘classmates’ sharply
decrease in the final round, which is in line with the literature. Most surprisingly, however,
we find that contributions of ‘friends’ sharply increase in the final round.
The remainder of this paper is structured as follows. In section 2, we describe the set-up
of the experiment. Section 3 studies the results. In section 4, we give an interpretation and
discussion of the results. We argue that the sharp increase in contribution in the final round

4
that is observed among friends, is consistent with the ‘Peak and End Evaluation’ bias that is
found in the psychology literature. When evaluating an event, subjects tend to focus mainly
on the peak experience and on the experience at the end of the event. Hence, by
substantially increasing their contributions in the final round, the subjects in our experiment
can make sure that, after the experiment, friends feel good about each other’s behavior,
without having to compromise their monetary payoff by too much.
2. The experiment
The experiment was conducted in a number of classes in a high school in Groningen, the
Netherlands, with students that were around the age of 15. These were all students that had
followed economics classes for over a year. The experiment was conducted during the final
economics class before the Christmas break. One of the authors (Riemersma) had taught
these students for over a year, and was therefore well aware of the social dynamics among
them. Hence, she was able to determine which students regarded each other as ‘friends’ (i.e.
students that were part of a larger social group that often interacted with each other on a
friendly basis, both inside and outside the classroom), and for which students this was not
the case. We used this information for the set-up of our experiment. Note that we
deliberately did not ask students to self-identify, for example by asking them who their
closest friends are. Doing so would give a strong indication of the purpose of our
experiment and hence was likely to affect the results. Also, asking students who their
friends are is likely to yield socially acceptable answers, and to induce them to identify

5
many more friends than they actually have. Our method allows us to identify a subject’s
‘revealed friends’, rather than his or her ‘stated friends’.
Subjects were partitioned in groups of four. The groups were composed in such a
manner that some of them consisted exclusively of students that were ‘friends’ of each
other, while other groups consisted exclusively of students that did not have any friendship
ties amongst each other whatsoever, i.e. ‘non-friends’ or, as we will refer to them in the
remainder of this paper, ‘Classmates’. The groups were not labelled as such during the
experiments, and the students were never informed that they were part of either a ‘Friends’
or a ‘Classmates’ group. Neither did we reveal that the purpose of the experiment was to
study the difference in giving between ‘Friends’ and ‘Classmates’. Note that the
‘Classmates’ still knew each other well – they were simply not part of the same social
circle.
For the set-up of the experiment, we largely followed Holt and Laury’s (1997)
suggestion as to how to set up a public good classroom experiment. In each round, each
subject is endowed with two tokens. Each token invested in the individual account yields a
return of one unit to the individual, while each token invested in the group account yields a
return of 0.5 units to each individual in the group. Hence, it is a dominant strategy to always
submit zero tokens, while the payoff to all participants would be maximized if all group
members contributed two tokens in each round.
To implement this, each subject was endowed with two ‘red’ playing cards and two
‘black’ playing cards. In each round, each subject was asked to anonimously hand in two
cards of his or her own choosing. Each black card that was handed in represented a
contribution of one token to the private account, while each red card represented a

6
contribution of one token to the group account. After each round, the total number of red
cards per group that were handed in, was determined and announced by an assistant. Group
composition did not change between rounds. Hence, in the terminology of Andreoni (1988),
we had a ‘Partners’ treatment for both the ‘Friends’ and the ‘Classmates’ groups.
- - - I N S E R T F I G U R E 1 A B O U T H E R E - - -
The classroom layout that we used is depicted in Figure 1. Each experimental group was
placed in one row in the classroom. Group members were placed at individual tables behind
each other. After each round, playing cards were collected by an assistant, and the total
amount of red cards handed in, was written down on a poster in front of the group. Hence,
after each round, group members received feedback on the contributions of others. There
were also able to observe the contributions in all other groups.
Unfortunately, the school board did not allow us to pay the subjects in cash. Instead,
subjects were paid in ‘dropmunten’ (literally: ‘liquorice coins’) which is a type of candy
popular in the Netherlands. Conveniently, this candy is manufactured to resemble actual
coins, hence it is as close as we can get to paying real cash without actually doing so. We
use an exchange rate of one ‘dropmunt’ for each unit of experimental earnings. Subjects
seemed highly motivated by the prospect of earning ‘dropmunten’. Hence we do not feel
that using ‘dropmunten’ rather than real money will affect our results. Throughout the
experiment, students exhibited a thorough understanding of the problem they were facing
and showed a keen interest in performing well. Before the experiment, the subjects received
written instructions that are reproduced in the appendix. They also received oral instructions

7
and had the opportunity to pose questions before the start of the actual experiment. Subjects
were paid after the final round of the experiment. In determining the total number of
‘dropmunten’ an individual was entitled to, half coins were rounded to the next highest
integer.
In total, 102 subjects participated in the experiment, from four different classes. Not all
classes had a number of students that is a multiple of 4. We therefore also had to use groups
with 3 subjects, but we do not use the data generated by these groups in our analysis. For the
purposes of our analysis, we have 80 subjects. A total of 44 subjects are in groups entirely
made up of ‘Friends’, while the remaining 36 subjects are in groups entirely made up of
‘Classmates’. Each group plays a total of 10 rounds, of which the first two rounds are
treated and interpreted as a practice round. That leaves us with a total of 8 rounds for the
analysis. Table 1 gives an overview of the composition of the groups. The first row gives
the group number, the second row reflects whether a group consists of Friends (F) or
Classmates (C), while the third row gives the number of female students in a group.
- - - I N S E R T T A B L E 1 A B O U T H E R E - - -
Our experiment is somewhat unorthodox in a number of ways. First, as noted above, we
were not able to pay the subjects in real money, but had to resort to artificial cash. Second,
our experiment was not anonymous, in the sense that subjects knew the composition of their
group, and often knew the other group members very well. But indeed, that is the whole
point of our experiment. Of course, the individual contributions were kept anonymous. Note
that both Andreoni and Petrie (2004) and Rege and Telle (2004) also allow group members

8
to identify their group members, and find that this increases contributions to the public
good. We also tried to keep payment after the experiment as private as possible, but of
course we could not avoid subjects talking and bragging about their earnings after the
experiment, or even sharing those earnings. Third, subjects were endowed with only 2
tokens in each round. It is more common to have, say, 10 tokens available. Still, we feel that
our set-up with 2 tokens captures the essence of the choice that subjects face in these
experiments: full free riding, full cooperation, or something inbetween.
3. Results
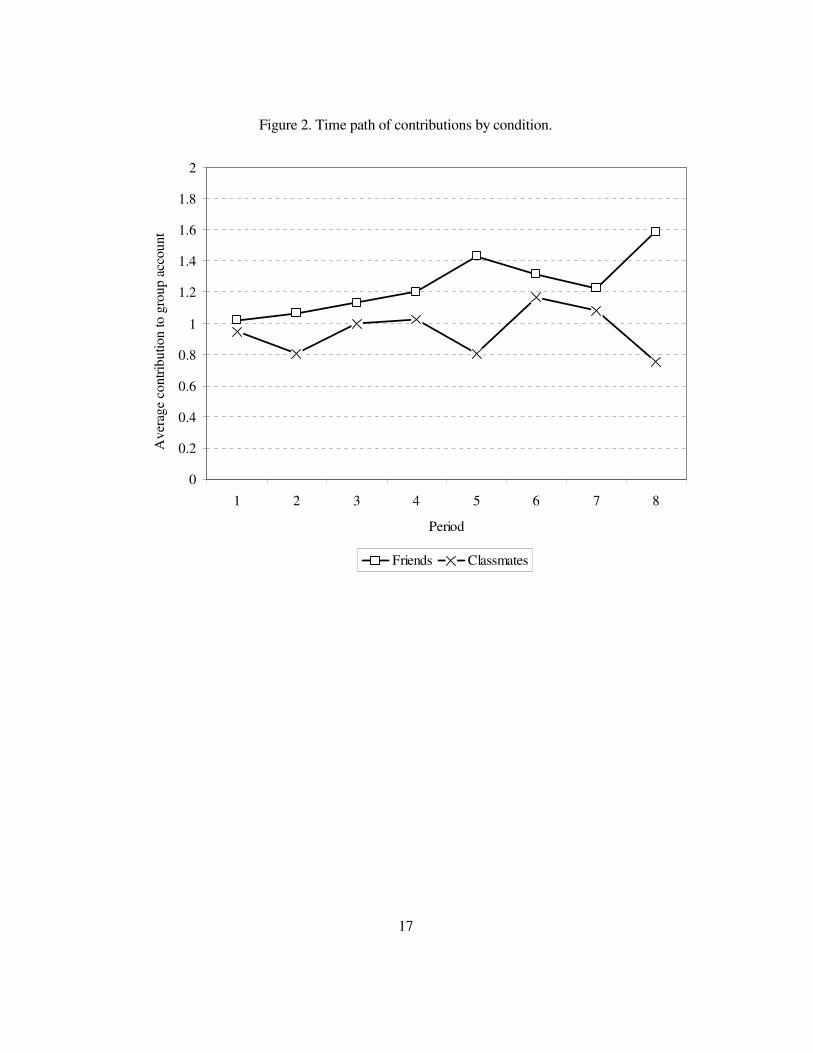
- - - I N S E R T F I G U R E 2 A B O U T H E R E - - -
Figure 2 shows the time paths of the average contribution to the public good in the ‘Friends’
condition and the ‘Classmates’ condition. Some results stand out. First, note that average
individual contributions are very much in line with other studies: some 40-60%. Second,
‘Friends’ contribute more than ‘Classmates’ in every round.1 This is in line with what one
would expect: Friends behave more cooperatively, and hence are inclined to contribute
more to a public good that benefits their friends. As a third observation, note that, over the
first 7 rounds, contributions are roughly constant over time. Other studies typically find a
steady decline. This difference is most likely due to the fact that, in our experiment, the
number of rounds is relatively small. Fourth, other studies typically find an end-game effect:
1 These differences are only statistically significant in individual rounds 5 (p-value: 0.0041) and 8 (p-value:
0.0002) when using a two-sided Mann-Whitney U-test for the data on the level of individual contributions. If
we look at the combined data for all 8 periods, then the difference is highly significant (p-value: 0.0000).

9
in the final round, contributions drop considerably. For the ‘Classmates’, we also find such
an effect. For ‘Friends’, however, we find a sharp increase in contributions in the final
round. Applying a Mann-Whitney U-test for the data on the level of individual
contributions, we can reject the null hypothesis of no difference in the contributions in
rounds 7 and 8 for Friends at the 10 percent level (two-sided test. p-value: 0.076). The same
holds for Classmates: we also reject the null hypothesis of no differences in their
contributions in round 7 and 8 (p-value: 0.099).
- - - I N S E R T F I G U R E 3 A B O U T H E R E - - -
Figure 3 provides some additional information as to what exactly happens in the final
round. We have plotted the frequency distribution of the change in contribution in the final
round for all experimental subjects in our study. A substantial number of ‘Classmates’,
some 18%, decrease their contribution by 2 units in the final round. This implies that these
‘Classmates’ switch from the highest possible contribution of 2 units, to the lowest possible
contribution of 0 units. Only 3% of ‘Friends’ exhibit such behavior. In total, 39% of
‘Classmates’ decrease their contribution in the final round, while 25% of ‘Friends’ do. On
the other end of the spectrum, 11% of ‘Classmates’ increase their contribution in the final
round, while 42% of ‘Friends’ do.
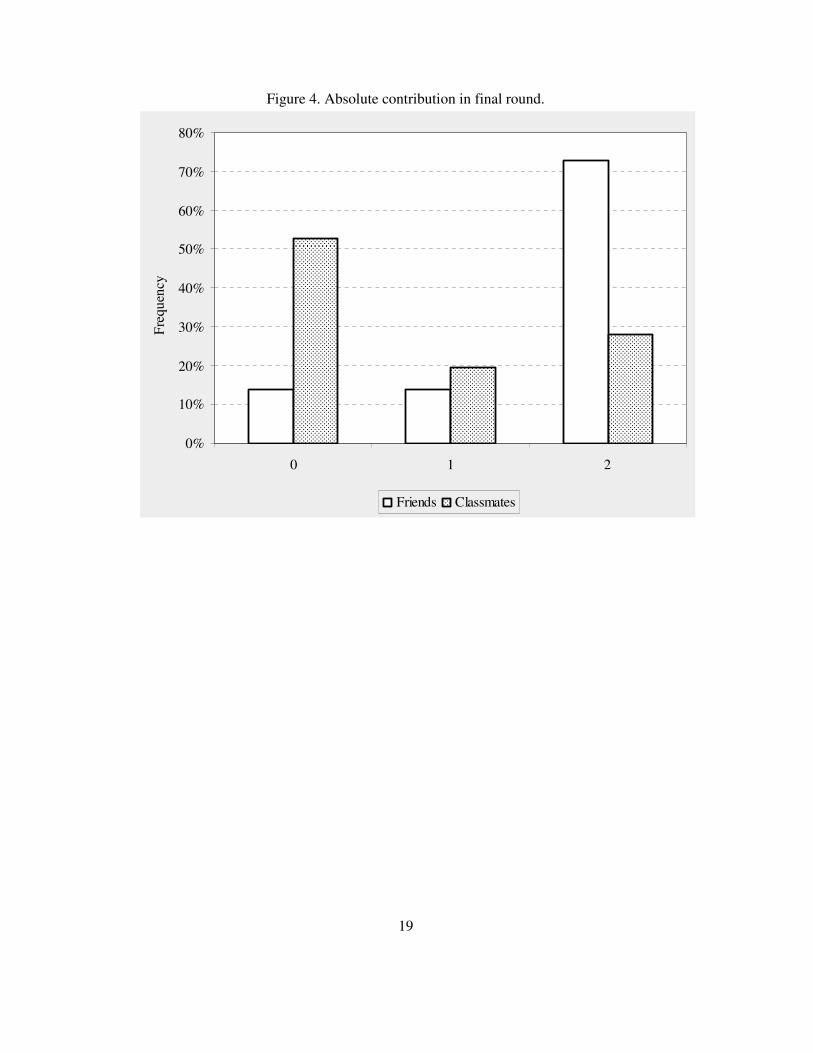
- - - I N S E R T F I G U R E 4 A B O U T H E R E - - -
Figure 4 provides an even clearer indication of the opposite final-round effects that we find.

10
While 53% of ‘Classmates’ contribute nothing to the public good in the final round, 73% of
‘Friends’ contribute their entire endowment.
- - - I N S E R T F I G U R E 5 A B O U T H E R E - - -
To try to obtain some further insight into what exactly drives our results, we also look at
gender differences. In Figure 5, we again give the time path of contributions, but now
differentiate between both condition and gender. The figure shows that the absolute final-
round effects are driven primarily by male students. Males in ‘Classmate’ groups decrease
their contribution in the final round by 0.7 units on average, while males in ‘Friend’ groups
increase their contribution by almost the same amount. The male ‘Classmate’ decrease is
significant at the 1%-level, while the male ‘Friend’ effect is at the 5%-level.2 Surprisingly,
we also find an increase in contributions of female ‘Classmates’ in the final round, although
this is statistically insignificant3. The absolute increase in average contributions of female
‘Friends’ in the final round is relatively small (and statistically insignificant4), but this is due
to the fact that these contributions already are very high in the penultimate round.
- - - I N S E R T F I G U R E 5 A B O U T H E R E - - -
Figure 6 shows the frequency distribution of the change in contribution in the final
round differentiated by gender and condition. More than 25% of male ‘Classmates’ switch
from the highest possible to the lowest possible contribution in the final round, while over
2 Again using a two-sided Mann-Whitney U-test. p-values: 0.0089 and 0.0357. 3 p-value: 0.317. 4 p-value: 0.511.

11
30% of male ‘Friends’ switch in the opposite direction. Female behavior is much less
extreme; the proportion of females that switch 2 units in either direction is always below
10%.
Figure 7 depicts the absolute contributions in the final round. Most strikingly, over 70%
of male ‘Classmates’ contribute nothing, while only 15% of female ‘Classmates’ do. On the
other hand, almost 90% of female ‘Friends’ contribute their entire endowment, while less
than 60% of male ‘Friends’ do.
4. Conclusion and discussion
In this paper, we used high school students to study a public good experiment in which
group members are friends. We find that friends contribute more than non-friends in every
round. More surprisingly, we find that friends sharply increase their contribution in the final
round of the experiment. Other experiments typically find a sharp decrease in giving in the
final round. Indeed, that is also what we find in groups that are not composed of friends.
Our main result seems primarily driven by the behavior of the male subjects. Female friends
do increase their contribution on average in the final round, but since their contributions
already are very high in earlier rounds, this increase is relatively small.
One can expect people to care more about their friends than they do about non-friends.
Hence, one can expect them to indeed contribute more to a public good that they share with
their friends. Yet, that still leaves the question why contributions sharply increase in the last
round. If people do care about their friends, why don’t they simply increase contributions in

12
each round to the same extent, rather than doing so primarily in the last round? The
psychology literature may shed some light on this.
There is evidence that, in retrospective evaluations of unpleasant experiences, individuals
are primarily influenced by the worst and the final moments of the procedure, and not by its
duration. This effect is coined Peak and End evaluation. At the same time, there is Duration
Neglect: the duration of the episode has little direct effect on total remembered discomfort
(see e.g. Fredrickson and Kahneman, 1993). Redelmeier and Kahneman (1996) find these
effects in the retrospective evaluations of patients undergoing colonoscopy and lithotripsy,
both intrusive and painful medical procedures. Kahneman et al. (1993) conduct an
experiment in which subjects immersed one hand in water of a moderately painful low
temperature for 60 seconds. In a separate trial, a period of 30 seconds is added in which the
water is slightly warmer, but still uncomfortably cold. Thus, the long trial included all the
discomfort of the short trial, plus an extra period of slowly diminishing discomfort. Yet,
after enduring both trials, a majority of subjects indicated a preference for the longer trial.
Suppose that Peak and End evaluation applies not only to negative experiences, but also
to positive ones. Subjects’ ex post evaluation as to how their friends treated them (and also
as to how they treated their friends) will then be largely influenced by behavior in the last
round, as this is the Peak round (i.e. the round with the highest contribution) as well as the
End round.5 In such an environment, it makes perfect sense to free-ride to some extent in
earlier rounds of the experiment, but to sharply increase contributions in the last round.
Such behavior will give a high monetary payoff as well as a positive feeling among friends
after the experiment. It is exactly the behavior that we find.
5 Note that van Dijk et al. (2002) also find that behavior in the final round has a strong effect on social ties
that are formed during a public good experiment.

13
Appendix: instructions [Translated from Dutch]
During this class meeting, we will play a game. The same game will be played 8 times in a
row. You can earn liquorice coins, which will be given to you at the end of the meeting. It
is important that you don’t reveal to others which cards you hand in. Also, it is
absolutely forbidden to talk to each other.
The game:
You will receive two red cards and two black cards. The game will be played 8 times. At
the start of a round I will come to you and ask you to give me two of those four cards, by
handing them to me with the colors facing down. The number of liquorice coins that you
will earn depends on how you handle your red cards.
For every red card you keep, you earn 1 liquorice coin for yourself. For every red card you
hand in, you earn 2 liquorice coins for your group. After each round, the total number of red
cards handed in by your group will be determined. This number will be written down on the
poster in front of your group. Hence, you will not learn who made which decision. At the
end of each round, your own cards will be returned to you. We will do this 8 times.
Summarizing:
Out of the four cards you receive, you have to hand in two, and keep two yourself. It is
crucial what you do with your red cards:
� For every red card you DO NOT hand in, you earn 1 liquorice coin for
yourself
� For every red card you DO hand in, you earn two coins for your group. The
coins earned by your group will be evenly distributed at the end of the
meeting among all the members in your group.
Mark the number of RED cards you HANDED IN on the separe sheet that you also
received, by ticking the appropriate box.
Good Luck!!

14
References
Andreoni J. (1988), “Why Free Ride?”, Journal of Public Economics, 37, 291-234.
Andreoni, J., and R. Petrie (2004), “Public Goods Experiments without Confidentiality: a
Glimpse into Fund-Raising”, Journal of Public Economics, 88, 1605-1623.
Croson, R.T.A. (1996), “Partners and Strangers Revisited”, Economics Letters, 53, 25-32.
van Dijk, F., J. Sonnemans, and F. van Winden (2002), “Social Ties in a Public Good
Experiment”, Journal of Public Economics, 85, 275-299.
Fredrickson, B.L. and D. Kahneman (1993), “Duration Neglect in Retrospective
Evaluations of Affective Episodes”, Journal of Personality and Social Psychology,
65(1), pp. 45-55.
Haan, M.A., and P. Kooreman (2002), “Free Riding and the Provision of Candy Bars”,
Journal of Public Economics, 83(2), pp. 279-293.
Holt, C.A., and S.K. Laury (1997), “Classroom Games: Voluntary Provision of a Public
Good”, Journal of Economic Perspectives, 11(4), 209-215.
Kahneman, D., B.L. Fredrickson, C.A. Schreiber, and D.A. Redelmeier (1993), “When
More Pain is Preferred to Less: Adding a Better End”, Psychological Science, 4(6), 401-
406.
Keser, C., and F. van Winden (2000), “Conditional Cooperation and Voluntary
Contributions to Public Goods”, Scandinavian Journal of Economics, 102(1), 23-39.
Kreps, D.M., P. Milgrom, J. Roberts, and R. Wilson (1981), “Rational Cooperation in the
Finitely Repeated Prisoners Dilemma”, Journal of Economic Theory, 27, 245-252.
Ledyard, J. (1995), “Public Goods: A Survey of Experimental Research”, in A.E. Roth and
J. Kagel (eds.), Handbook of Experimental Economics, Princeton University Press,
Princeton, NJ.
Marwell, G. and R. Ames (1979), “Experiments on the Provision of Public Goods I:
Resources, Interest, Group Size, and the Free Rider Problem”, American Journal of
Sociology, 84, 1335-1360.
Marwell, G. and R. Ames (1980), “Experiments on the Provision of Public Goods II:
Provision Points, Stakes, Experience, and the Free Rider Problem”, American Journal of
Sociology, 85, 926-937.
Redelmeier, D.A., and D. Kahneman (1996), “Patients’ Memories of Painful Medical

15
Treatments: Real-time and Retrospective Evaluations of Two Minimally Invasive
Procedures”, Pain, 66, 3-8.
Rege, M. and K. Telle (2004), “The Impact of Social Approval and Framing on
Cooperation in Public Good Situations”. Journal of Public Economics, 88, 1625-1644.
Weimann J. (1994), “Individual Behaviour in a Free Riding Experiment”, Journal of Public
Economics, 54(2), 185-200.

16
Table 1: Group Composition
___________________________________________________________________________________
Group # 1 2 3 4 5 6 7 8 9 10 11 12 13 14 15 16 17 18 19 20
Type F F F F F F F F F F F C C C C C C C C C
# Female 3 4 1 2 0 4 1 3 4 0 0 4 0 0 4 0 2 0 3 0
Figure 1: Class Layout
1
2
3
4
1
2
3
4
1
2
3
4
1
2
3
4
1
2
3
4
1
2
3
4
desk
poster poster poster poster poster poster
Group 1 Group 2 Group 3 Group 4 Group 5 Group 6
17
Figure 2. Time path of contributions by condition.
0
0.2
0.4
0.6
0.8
1
1.2
1.4
1.6
1.8
2
1 2 3 4 5 6 7 8
Period
Av
erag
e co
ntr
ibuti
on
to
gro
up
acc
ou
nt
..
Friends Classmates

18
Figure 3. Change in contribution in final round, relative frequency.
0%
10%
20%
30%
40%
50%
-2 -1 0 1 2
Fre
qu
ency
Friends Classmates
19
Figure 4. Absolute contribution in final round.
0%
10%
20%
30%
40%
50%
60%
70%
80%
0 1 2
Fre
qu
ency
Friends Classmates

20
Figure 5. Time path of contributions by condition and gender.
0
0.2
0.4
0.6
0.8
1
1.2
1.4
1.6
1.8
2
1 2 3 4 5 6 7 8
Period
Aver
age
contr
ibuti
on
to
gro
up
acc
oun
t ..
Female Friends Male Friends Female Classmates Male Classmates

21
Figure 6. Change in contribution in final round, relative frequency.
0%
5%
10%
15%
20%
25%
30%
35%
40%
-2 -1 1 2
Fre
qu
ency
Female Friends Male Friends Female Classmates Male Classmates

22
Figure 7. Absolute contribution in final round, by condition and gender.
0%
10%
20%
30%
40%
50%
60%
70%
80%
90%
100%
0 1 2
Fre
qu
ency
Female Friends Male Friends Female Classmates Male Classmates


