
Toxicology Research
PAPER
Cite this: Toxicol. Res., 2015, 4, 494
Received 7th October 2014,Accepted 28th January 2015
DOI: 10.1039/c4tx00160e
www.rsc.org/toxicology
Functional xenobiotic metabolism and effluxtransporters in trout hepatocyte spheroid cultures
Chibuzor Uchea,a,b Stewart F. Owen*b and J. Kevin Chipmana
Prediction of xenobiotic fate in fish is important for the regulatory assessment of chemicals under current
legislation. Trout hepatocyte spheroids are a promising in vitro model for this assessment. In this investi-
gation, the gene expression and function for xenobiotic metabolism and cellular efflux were character-
ised. Using fluorescence, transport and real time PCR analysis, the expression and functionality of a variety
of genes related to xenobiotic metabolism and drug efflux were assessed in a range of trout hepatocyte
culture preparations. Significantly greater levels of expression of genes involved in xenobiotic metabolism
and efflux were measured in spheroids (which have been shown to remain viable in excess of 30 days),
compared to hepatocytes cultured using conventional suspension and monolayer culture techniques.
A transient decline in the expression of genes related to both xenobiotic metabolism and transport was
determined during spheroid development, with a subsequent recovery in older spheroids. The most
mature spheroids also exhibited an expression profile most comparable to that reported in vivo. Functio-
nality of efflux transporters in spheroids was also demonstrated using fluorescent markers and specific
inhibitors. In conclusion, the more physiologically relevant architecture in spheroid cultures provides a
high functional integrity in relation to xenobiotic metabolism and efflux. Together with the enhanced
gene expression and longevity of the model, hepatocytes in spheroid culture may prove to be an accurate
alternative model to study the mechanisms of these processes in fish liver and provide an assay to deter-
mine the bioaccumulation potential of environmental contaminants.
Introduction
Recently, there has been a significant focus on the benefits of3D cell cultures, shown to provide an in vitro model system cir-cumventing the major limitations (short lived nature and lossof differentiation with time) of traditional monolayer primarycell cultures, maintaining cellular specificity andhomeostasis.1–5 The environment created within 3D culturesinvolving hepatocytes appears more representative of that inwhich cells exist in native liver. Hepatocytes are surrounded byother interacting cells, maintaining cell shape and polarity.Together with the development of a more elaborate extracellu-lar matrix, these are features necessary for many specialisedfunctions and potentially responsible for the conserved differ-entiation status and longevity in spheroids.6–8 The mainten-ance of polarity in hepatocyte spheroid culture is also thoughtto have a key role in the re-formation of bile canaliculi in thesystem.6 Vast differences in the cellular responses of hepato-cyte spheroids to chemical exposure have also been described
compared to those of conventional cultures. For example,higher resistance to anticancer drugs in 3D tumour cell spher-oids in comparison to the same cells in 2D culture has beenreported.9 The toxic potential of cadmium and silver nanopar-ticles has also been reported to be significantly reduced inspheroid culture of HepG2 cells when compared to dataobtained from conventional cell culture.10 These cell responsesin spheroid culture are thought to be more reflective of thoseexhibited in vivo, enhancing the predictive power of in vitrotoxicity testing and use of the system in drug screening hasbeen promoted.3,11,12 Indeed, spheroids are now routinelyused as in vitro models in cancer and pharmaceutical testing.9
Based on their enhanced cytochrome P450 (CYP) activitytowards ethoxyresorufin, the potential for 3D spheroid aggre-gates of trout hepatocytes to be used as a superior in vitroalternative to currently used subcellular fractions and mono-layer cultures in studies of the metabolism and bioaccumula-tion of environmental compounds in aquatic organisms hasrecently been demonstrated.13 Alongside these findings, trouthepatocyte spheroids have been shown to outperform 2D cul-tures biochemically, with significantly enhanced glucose pro-duction and albumin synthesis and reduced lactatedehydrogenase leakage.14 These studies have also reported thepotential benefits of extended longevity (spheroids have been
aUniversity of Birmingham, School of Biosciences, Birmingham, B15 2TT, UKbAstraZeneca, Alderley Park, Macclesfield, Cheshire, SK10 4TF, UK.
E-mail: [email protected]
494 | Toxicol. Res., 2015, 4, 494–507 This journal is © The Royal Society of Chemistry 2015
Ope
n A
cces
s A
rtic
le. P
ublis
hed
on 2
9 Ja
nuar
y 20
15. D
ownl
oade
d on
1/1
5/20
22 1
:38:
50 P
M.
Thi
s ar
ticle
is li
cens
ed u
nder
a C
reat
ive
Com
mon
s A
ttrib
utio
n 3.
0 U
npor
ted
Lic
ence
.
View Article OnlineView Journal | View Issue

maintained viable and active for over 30 days in our labora-tories) conferred by 3D cultures in chronic exposureassessments.
The maintenance of drug metabolism capabilities in spher-oids is likely due to well retained gene expression and studiesusing human hepatocyte spheroid cultures have demonstratedthe stable expression of membrane transporters and enzymesrelated to drug metabolism.15 This may arise from theenhanced inter-cellular connectivity of cells and the extendedstabilisation period afforded to hepatocytes in this cultureform, during which, metabolic activity, levels of geneexpression and other features influencing cellular phenotypecan be recovered following the cell isolation process.5,16 Rathepatocyte spheroids have been reported to undergo an initialperiod of biochemical and functional turbulence as theymature in early culture and after about 6 days, functionalstatus is said to recover and stabilise.17
Another advantage of the use of hepatocytes in spheroidculture for the assessment of bioaccumulation of xenobioticsis the potential incorporation of measurements of transporterfunction in these preparations. As with the enhanced meta-bolic performance of hepatocyte spheroids,13 we hypothesisedthat the functional activity of efflux transporters may also besuperior in 3D cultures. Proteins of the ATP binding cassette(ABC) facilitate the excretory function in organisms, transport-ing exogenous and endogenous compounds and/or theirmetabolites out of cells.18 ABC proteins are heavily expressedin the liver, which is a major site for compound elimination.
In recent years, greater recognition of the role of hepatictransporters on the disposition and elimination of com-pounds, and how these features combine with the metabolicaspects of hepatic clearance, has led to the development ofeffective methods to accurately assess substrate specificity andaffinity for efflux transporters.19,20 Conventional measure-ments of hepatic clearance using subcellular fractions, as con-ducted in environmental bioaccumulation assessment, mustassume the cellular uptake of compounds and efficient effluxactivity of hepatic transporters. These processes which directlyaffect bioaccumulation are compound- and species-specificand cannot be assessed using subcellular fractions alone.
Enhanced xenobiotic capabilities have been reported inhepatocyte spheroids isolated from mammalian species. Main-tenance of ethoxyresorufin-O-deethylation (EROD) activity andthe expression of a range of genes important to hepatocytefunction in rat hepatocyte spheroids have been demon-strated.21,22 An enhanced level of UDP-glucuronosyltransferase(UGT), CYP1A2, CYP2E1 and CYP3A4 activities, as well asMultidrug resistance associated protein 2 (MRP2) expressionin a range of hepatocyte cell lines cultured as spheroids com-pared to those of cells in 2D culture have also beenmeasured.23–25 Not only are these activities greater in compari-son to conventional cultures, but they are also maintained forextensive periods with viability in spheroid culture.4
In contrast, very few studies on the use of fish hepatocytesin spheroid culture exist in the literature.14,26,27 The limitedinformation on trout hepatocytes in spheroid culture includes
evidence that vitellogenin mRNA expression and secretion ismaintained for up to a month in culture and the system hasbeen shown to be responsive to the effects of classical modu-lators of gene expression.26
In fish, as in mammals, proteins of the ABC superfamilyplay a critical role in the transport of compounds and meta-bolites into bile.28–30 This process results in the reduced intra-cellular concentration and lower toxic potential of compounds,as well as a reduced potential for bioaccumulation.31,32 ABCtransporters are membrane bound proteins consisting of twotransmembrane domains, which confer substrate specificityand form the transmembrane channel, and two nucleotidebinding domains, which bind and hydrolyse ATP, resulting inthe active transport of a wide range of substrates from the cyto-plasm and out of cells.33–35 These proteins are highly con-served and are expressed in a wide range of cell types of allknown existing species, suggesting similar, fundamental physio-logical roles.36,37 However, despite the physiological importanceof the process in fish, relatively little is known about the func-tion and expression of efflux transporters in comparison totheir mammalian counterparts,38 ABC transporter subtypes arehighly expressed in tissues that make up internal and externalbody boundaries and those involved in excretion, such as liver,intestine and kidney tissue.38 These proteins are termed multidrug resistance proteins (MDR) for their role in protectingtumour cells from a wide range of structurally unrelatedchemotherapeutics.18,39,40 The diversity of the substrates thatproteins of the ABC transporter subfamily can export fromcells (including metabolic products of xenobiotic compounds,as well as the parent and some endogenous compounds) is akey feature of their biological importance.
Human ABC proteins are separated into seven subfamilies(A–G) based on their sequence homology.41,42 In fish, anadditional subfamily (H), with one member has also beenidentified.34 The most toxicologically relevant transporters inmammalian species have been identified as the multidrugresistance protein (MDR1, ABCB1), bile salt export pump(BSEP, ABCB11), multidrug resistance-associated proteins 1–3(MRP1-3, ABCC1-3) and breast cancer resistance protein(BCRP, ABCG2).19,43 Recent publications have shown that avariety of toxicologically relevant ABC efflux transporters areexpressed in trout, with a wide tissue distributionpattern.29,34,44 MDR1, MRP2, BSEP and BCRP have been identi-fied as the efflux transporters with the highest levels ofexpression in trout liver.29,34,44–46
These transporters can be susceptible to inhibition by anumber of compounds, affecting their ability to eliminatexenobiotics and resulting in the intracellular accumulation ofcompounds and possible toxic effects. This is a key issue inaquatic toxicology as a wide range of environmental contami-nants are specific inhibitors of ABC transporters and so canincrease the sensitivity of organisms to further chemicalinsult; especially important in the aquatic environment due tothe effects of the vast mixtures of chemicals to which orga-nisms are exposed.29,47–50 These interactions will also affectthe bioaccumulation potential of compounds, due to potential
Toxicology Research Paper
This journal is © The Royal Society of Chemistry 2015 Toxicol. Res., 2015, 4, 494–507 | 495
Ope
n A
cces
s A
rtic
le. P
ublis
hed
on 2
9 Ja
nuar
y 20
15. D
ownl
oade
d on
1/1
5/20
22 1
:38:
50 P
M.
Thi
s ar
ticle
is li
cens
ed u
nder
a C
reat
ive
Com
mon
s A
ttrib
utio
n 3.
0 U
npor
ted
Lic
ence
.View Article Online

reductions in clearance efficiency. Despite this knowledge,there is very little information on the retention of such trans-porter systems in fish hepatocyte spheroids and indeed littlein spheroids of any species.
Here we test the hypothesis that drug efflux transporterswere functionally active and expressed to a greater extent introut hepatocyte spheroids when compared to conventionalsuspension and monolayer cultures and related to expressionin whole liver tissue. This may support the inclusion of assess-ments of compound elimination from hepatocyte spheroids,providing a more accurate comparison to in vivo hepatic clear-ance and enhancing the utilisation of in vitro alternatives inchemical safety assessment. To enable their use in suchassessments, the system must also be metabolically compe-tent. Therefore the possibility that enhanced xenobiotic meta-bolism is related to enhanced expression of relevant genesassociated with maintenance of the differentiation status inspheroids was tested. The expression of genes related to xeno-biotic metabolism and transport was measured during spher-oid maturation and compared to freshly isolated hepatocytesand in monolayer culture.
Materials and methodsFish and maintenance
Female, diploid immature rainbow trout (Oncorhynchusmykiss), with a wet weight range between 300 g–500 g wereheld for a minimum 15 day acclimation period at the Univer-sity of Birmingham prior to first use and fed floating proprie-tary pellets (GP Pellets, Cheshire, UK), daily. These stock fishwere held with permission from the UK Home Office underthe Animals (Scientific Procedures) Act 1986 and thereforeunder authorisation by the University Ethics Committee. Theaquaculture conditions were 15 ± 1 °C; 12L:12D photoperiod;non re-circulated water at pH 7.5, hardness >150 mg l−1 CaCO3
and >80% oxygen saturation. Trout were fasted for 24 hoursprior to use. Fish were euthanised following the Schedule I pro-tocol of the Animals (Scientific Procedures) Act 1986 – renderedunconscious by a sharp blow to the head, with subsequentdestruction of the brain via pithing; following which they weredissected to allow access to the liver. This study complied withregulatory and ethical standards in the UK and the globalethical standards required by the industrial partner AstraZeneca.
Isolation and culture of hepatocytes
Hepatocytes were isolated using a modified version of the col-lagenase perfusion technique51 in which trout livers were per-fused in situ through the hepatic portal vein at a flow rate of2 ml min−1, firstly with calcium-free Hanks’ balanced salt solu-tion (Sigma-Aldrich, Poole, UK) for approximately 20 minutesand then with a dissociating solution containing 6.7 mMCaCl2, 3.15 mM KCl, 0.3 mM Na2HPO4, 11.76 mM HEPES,160 mM NaCl and 260 mg l−1 collagenase D (Roche AppliedScience, 11088858001) for approximately 15 minutes. A finalperfusion with Dulbecco’s Modified Eagle’s Medium/nutrient
mixture F-12 Ham supplemented with L-glutamine, 15 mMHEPES (DMEM [Sigma-Aldrich]) was then provided for approxi-mately 5 minutes to clear the collagenase from the liver. Allsolutions were pre-incubated at 15 °C. Once digested, liverswere removed and cells were isolated from the organ mechani-cally into DMEM and passed through a 100 μm nylon cell strai-ner (BD falcon, Massachusetts, USA). Cells were washed 3 timesin DMEM following 3 periods of centrifugation (30g, 5 minutes,15 °C) and viability (consistently ≥95%) was measured based onexclusion of 0.04% trypan blue. Isolated primary hepatocyteswere plated at a density of 1 × 10⁶ cells cm−2 on 24-well collagentype I coated microplates (Iwaki, Japan) and stored in a 15 °Cstationary incubator. Hepatocytes in suspension were purifiedto 1 × 10⁶ cells ml−1 in centrifuge tubes, transferred to 50 mlconical flasks and kept in a 15 °C shaking incubator at 90 rpm(Infors-HT, Bottmingen, Switzerland).
Hepatocyte spheroid culture
Hepatocyte spheroids were prepared using a method pre-viously described in our laboratory which yielded viable spher-oids that were able to be maintained in excess of 30 days.13
Cells isolated following hepatocyte purification were re-sus-pended in DMEM which was additionally supplemented withserum replacement 3 (20 ml L−1) (Sigma-Aldrich) and an anti-biotic/antimycotic solution (10 ml L−1) (Sigma-Aldrich,MFCD00130520) at a concentration of 5 × 10⁶ cells ml−1. Cellsuspensions (5 ml) were plated in sterile, non-treated 50 ×18 mm petri dishes (Sterilin, Newport, UK) and placed on agyratory shaker (Stuart Scientific, Stone, UK) to aggregate at 50rpm and 17 °C ± 1 °C. Cell culture medium was changed every2 days and spheroids were used for gene expression analysis ata range of time points. During spheroid formation, hepato-cytes merge together, forming loose cellular aggregates whichlater develop into larger, variable, asymmetrical clusters.Between days 5–7 post isolation, structures became moreuniform in shape, with larger diameters and by day 8, little tono change in their morphological arrangements when com-pared to earlier time points is evident. At this stage, spheroidsin this study exhibited a more homogeneous shape with indi-vidual cells no longer clearly visible; a feature considered as amarker of morphological maturity. In this study, day 10 wasselected as the first time-point of maturity, to ensure that themorphological maturation process was complete. A number ofreports in the literature suggest the optimal diameter for mam-malian spheroids in the region of 100–150 µm to alloweffective diffusion of oxygen, ensuring that the inner coreenvironment does not become hypoxic.9,52,53 Size analysis ofspheroid preparations using flow cytometry showed that thespheroids used in this study ranged from 90–110 µm).
RNA extraction
Whole liver sections (100 mg) excised during the hepatocyteisolation process, freshly isolated hepatocytes, hepatocytes inmonolayer culture and spheroids at a range of time pointswere collected, washed with PBS (cells) and stored in RNA later(Sigma-Aldrich) at −20 °C.
Paper Toxicology Research
496 | Toxicol. Res., 2015, 4, 494–507 This journal is © The Royal Society of Chemistry 2015
Ope
n A
cces
s A
rtic
le. P
ublis
hed
on 2
9 Ja
nuar
y 20
15. D
ownl
oade
d on
1/1
5/20
22 1
:38:
50 P
M.
Thi
s ar
ticle
is li
cens
ed u
nder
a C
reat
ive
Com
mon
s A
ttrib
utio
n 3.
0 U
npor
ted
Lic
ence
.View Article Online
Total RNA was extracted from stored samples using thetrizol, chloroform, glycogen extraction method. Briefly, RNAlater was completely removed from samples and whole tissuesor cells were homogenised in trizol solution (1 ml, Sigma-Aldrich) in RNase free microcentrifuge tubes (Axygen, Califor-nia, USA). Following a 5 minute incubation at room tempera-ture, chloroform (200 µl, Sigma-Aldrich) was added and aftervigorous shaking, the mixture was centrifuged (12 000g,15 minutes, 4 °C). The upper aqueous phase (500 µl) of the bi-phasic solution was transferred to a fresh microcentrifuge tubeand glycogen (10 µg, Fermentas, UK) was added. The aqueousphase was mixed with 70% isopropanol (500 µl, Sigma-Aldrich), incubated at room temperature for 10 minutes andcentrifuged (12 000g, 10 minutes, 4 °C). The resulting pelletwas washed with 75% ethanol (Fisher Scientific, Loughbo-rough, UK), air dried for 10 minutes, re-suspended in RNase-free water (50 µl, Qiagen, Crawley, UK) and incubated at 60 °Cfor 15 minutes. RNA quality was assessed by agarose gel elec-trophoresis and quantified by spectrophotometry using aNanodrop ND1000 (Thermo Scientific, LabTech, East Sussex,UK) and DNA contamination was removed by treatment with agenomic DNA-free treatment kit (Ambion, Austin, U.S.A.).Storage of RNA was at −80 °C.
cDNA synthesis
Total RNA was used for first-strand cDNA synthesis using theSuperScript II Reverse Transcriptase kit (Invitrogen, Paisley,U.K.) in a thermocycler (Eppendorf Mastercycler Gradient;
Eppendorf, Cambridge, UK). The cDNA produced was quanti-fied by spectrophotometry and stored at −20 °C.
Polymerase chain reaction (PCR)
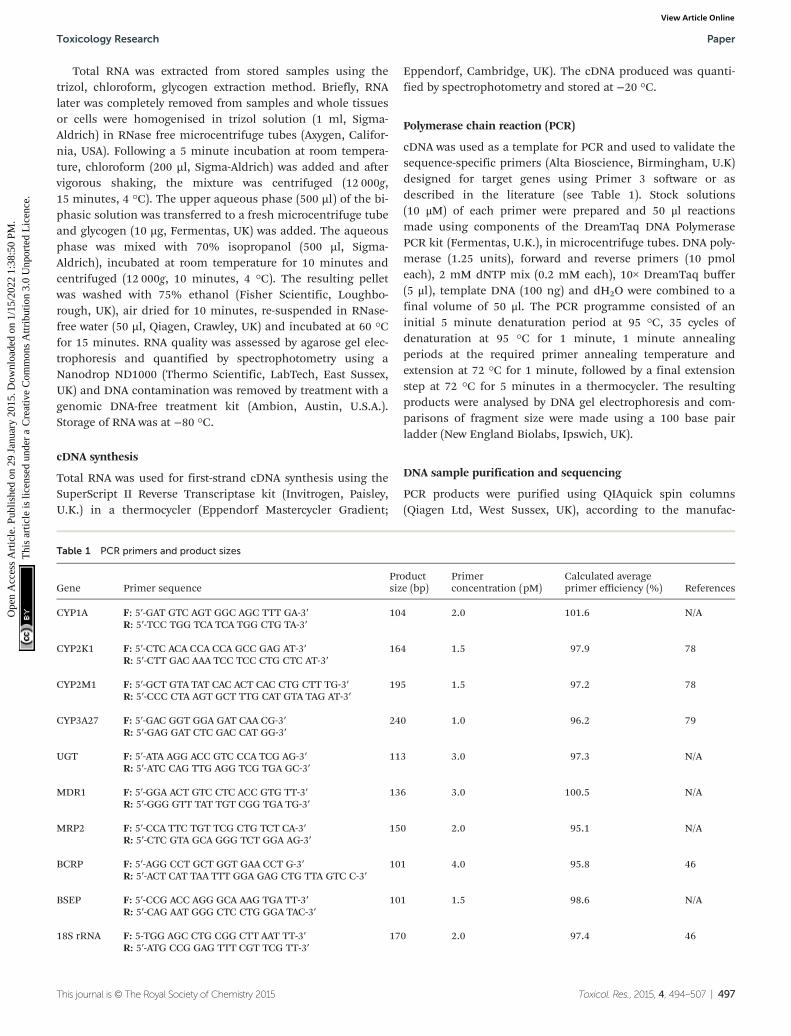
cDNA was used as a template for PCR and used to validate thesequence-specific primers (Alta Bioscience, Birmingham, U.K)designed for target genes using Primer 3 software or asdescribed in the literature (see Table 1). Stock solutions(10 μM) of each primer were prepared and 50 μl reactionsmade using components of the DreamTaq DNA PolymerasePCR kit (Fermentas, U.K.), in microcentrifuge tubes. DNA poly-merase (1.25 units), forward and reverse primers (10 pmoleach), 2 mM dNTP mix (0.2 mM each), 10× DreamTaq buffer(5 μl), template DNA (100 ng) and dH2O were combined to afinal volume of 50 μl. The PCR programme consisted of aninitial 5 minute denaturation period at 95 °C, 35 cycles ofdenaturation at 95 °C for 1 minute, 1 minute annealingperiods at the required primer annealing temperature andextension at 72 °C for 1 minute, followed by a final extensionstep at 72 °C for 5 minutes in a thermocycler. The resultingproducts were analysed by DNA gel electrophoresis and com-parisons of fragment size were made using a 100 base pairladder (New England Biolabs, Ipswich, UK).
DNA sample purification and sequencing
PCR products were purified using QIAquick spin columns(Qiagen Ltd, West Sussex, UK), according to the manufac-
Table 1 PCR primers and product sizes
Gene Primer sequenceProductsize (bp)
Primerconcentration (pM)
Calculated averageprimer efficiency (%) References
CYP1A F: 5′-GAT GTC AGT GGC AGC TTT GA-3′ 104 2.0 101.6 N/AR: 5′-TCC TGG TCA TCA TGG CTG TA-3′
CYP2K1 F: 5′-CTC ACA CCA CCA GCC GAG AT-3′ 164 1.5 97.9 78R: 5′-CTT GAC AAA TCC TCC CTG CTC AT-3′
CYP2M1 F: 5′-GCT GTA TAT CAC ACT CAC CTG CTT TG-3′ 195 1.5 97.2 78R: 5′-CCC CTA AGT GCT TTG CAT GTA TAG AT-3′
CYP3A27 F: 5′-GAC GGT GGA GAT CAA CG-3′ 240 1.0 96.2 79R: 5′-GAG GAT CTC GAC CAT GG-3′
UGT F: 5′-ATA AGG ACC GTC CCA TCG AG-3′ 113 3.0 97.3 N/AR: 5′-ATC CAG TTG AGG TCG TGA GC-3′
MDR1 F: 5′-GGA ACT GTC CTC ACC GTG TT-3′ 136 3.0 100.5 N/AR: 5′-GGG GTT TAT TGT CGG TGA TG-3′
MRP2 F: 5′-CCA TTC TGT TCG CTG TCT CA-3′ 150 2.0 95.1 N/AR: 5′-CTC GTA GCA GGG TCT GGA AG-3′
BCRP F: 5′-AGG CCT GCT GGT GAA CCT G-3′ 101 4.0 95.8 46R: 5′-ACT CAT TAA TTT GGA GAG CTG TTA GTC C-3′
BSEP F: 5′-CCG ACC AGG GCA AAG TGA TT-3′ 101 1.5 98.6 N/AR: 5′-CAG AAT GGG CTC CTG GGA TAC-3′
18S rRNA F: 5-TGG AGC CTG CGG CTT AAT TT-3′ 170 2.0 97.4 46R: 5′-ATG CCG GAG TTT CGT TCG TT-3′
Toxicology Research Paper
This journal is © The Royal Society of Chemistry 2015 Toxicol. Res., 2015, 4, 494–507 | 497
Ope
n A
cces
s A
rtic
le. P
ublis
hed
on 2
9 Ja
nuar
y 20
15. D
ownl
oade
d on
1/1
5/20
22 1
:38:
50 P
M.
Thi
s ar
ticle
is li
cens
ed u
nder
a C
reat
ive
Com
mon
s A
ttrib
utio
n 3.
0 U
npor
ted
Lic
ence
.View Article Online

turer’s protocol. Following elution, DNA was quantified byspectrophotometry.
Purified DNA samples were then sequenced using anABI3730 DNA analyser (Applied Biosystems, UK) by the Func-tional Genomics and Proteomics Unit, University of Birming-ham, Birmingham, UK. The sequencing results of theamplified DNA fragments obtained were used in BLASTsearches (www.ncbi.nlm.nih.gov/blast) to confirm that theprimers amplified the selected genes of interest.
Real-time PCR
Real-time PCR was conducted using an ABI Prism 7000Sequence Detection System (Applied Biosystems, USA). cDNAprepared from RNA extracted from various tissue and cellsamples were used as the template for reactions with the Sensi-Fast SYBR Hi-Rox kit (Bioline, UK). Five biological replicateswere used for each of the target genes, with each individualassessed in triplicate. Samples were run in 96 well plates, eachsample containing cDNA (90 ng), 2× sensiFast SYBR (10 μl)using forward and reverse primers at various concentrations (arange of 1–5 pM) dependant on primer efficiency values calcu-lated during optimisation runs, and nuclease free water in afinal volume of 20 μl. PCR cycle parameters were: 95 °C, 30seconds for denaturation; and 60 °C, 30 seconds for combinedannealing and extension. No-template controls were also runusing sterile dH2O.
Melt curves for all samples were plotted and analysed usingthe ABI Prism 7000 SDS software to ensure only a singleproduct was amplified and primer dimers were not formed.PCR primer efficiencies were calculated using absolute fluo-rescence values measured in each well and the LinRegPCRsoftware as described by ref. 54, as there can be a significanteffect on fold difference calculations using Ct values calculatedfrom primers with unequal PCR efficiencies. Threshold cycle(Ct) values were recorded for each sample in the linear phaseof amplification. Differences in Ct values were assessed by oneway ANOVA (SPSS v16.0).
Assays of uptake and elimination of fluorescent probes
To assess the role of transporters through the use of inhibitors,the accumulation of fluorescent compounds known to be sub-strates of particular drug efflux transporters (see Table 2) wasassessed following pre-incubations with specific transporterinhibitors. Substrates and inhibitors were dissolved in varioussolvents as noted and appropriate vehicle controls were usedfor each. Hepatocyte spheroids were washed twice in PBS and
re-suspended in PBS. Inhibitors at a range of concentrations(detailed in Table 3) were added to cultures and incubated for10 minutes on a gyratory shaker at 50 rpm, following which,the appropriate volume of fluorescent substrate was added toreach the desired concentration. Total solvent concentrationsdid not exceed 0.5% (v/v) and appropriate solvent controlswere always used. Spheroids were incubated in the dark, at17 °C, on a gyratory platform at 50 rpm, for 60 minutes. Afterincubation, cells were kept on ice, washed three times in PBS,re-suspended and lysed in 0.1% Triton X-100 in PBS using anultrasonic water bath (Camlab Transsonic T460, Cambridge,UK) in the dark. Lysate was loaded onto fluorescence 96 wellplates (BD Falcon) and fluorescence measured at the relevantwavelength for each substrate (Table 2) using a Bio-Tek FL600fluorescence plate reader. Fluorescent dye accumulation wasmeasured and compared to control cells exposed to the relevantfluorescent substrate in the absence of the specific inhibitor.
Confocal microscopy
Cells exposed to various fluorescent compounds were washedin PBS and re-suspended in phenol red free PBS. Suspendedcells were pipetted into glass bottom culture dishes (MatTekCorporation, Massachusetts, USA) for imaging. Images wereacquired using a Leica TCS SP2 confocal microscope (LeicaMicrosystems, Milton Keynes, UK) with a 63× oil immersionobjective lens. Fluorochromes were excited using an argonlaser at the wavelengths described previously.
Statistical analysis
Statistical analysis was conducted using SPSS version 16.0.Tests for normality and homogeneity of variance were con-ducted using the Shapiro Wilk and Levene’s tests respectively.Data meeting the assumption criteria for parametric tests wereanalysed using the Independent samples T-test and data notmeeting these criteria were analysed using the Kruskal-Wallisand Mann-Whitney U test (non parametric). P values <0.05were deemed significant.
Table 3 Specific inhibitors used in efflux transporter inhibition studies
Effluxtransporter Inhibitor
Concentrationrange (µM)
Solvent(maximumconcentration)
MDR1 Cyclosporine A 0.01–20 DMSO (0.1%)MRP2 Probenecid 0.5–1000 NaOH (0.01%)BCRP Sodium taurocholate 1–1500 Sterile dH2OBSEP Ko 143 0.01–20 DMSO (0.4%)
Table 2 Fluorescent compounds used in spheroid uptake and elimination studies
Fluorescent compoundEffluxtransporter
Concentration(μM)
Solvent (maximumconcentration)
Fluorescencewavelengths
Calcein AM MRP2 10 DMSO (0.4%) λex: 494 nm; λem 517 nmCholyl-lysyl-fluorescein BSEP 5 Sterile dH2O λex: 485 nm; λem 520 nm2′,7′-Dichlorodihydrofluorescein diacetate BSEP 10 DMSO (0.05%) λex: 495 nm; λem 530 nmHoechst 33342 BCRP 10 Sterile dH2O λex: 340 nm; λem 510 nmRhodamine 123 MDR1 10 DMSO (0.05%) λex: 511 nm; λem 534 nm
Paper Toxicology Research
498 | Toxicol. Res., 2015, 4, 494–507 This journal is © The Royal Society of Chemistry 2015
Ope
n A
cces
s A
rtic
le. P
ublis
hed
on 2
9 Ja
nuar
y 20
15. D
ownl
oade
d on
1/1
5/20
22 1
:38:
50 P
M.
Thi
s ar
ticle
is li
cens
ed u
nder
a C
reat
ive
Com
mon
s A
ttrib
utio
n 3.
0 U
npor
ted
Lic
ence
.View Article Online

Results
Investigations were conducted on hepatic preparations derivedfrom the same subset of fish. Gene expression analyses wereconducted on cells isolated from the same five individual fishand functional transporter assays using specific inhibitionwere conducted using three individual fish. The confocalimages provided are representative.
To provide a temporal overview of the changes in geneexpression during the various stages in spheroid development,expression data is presented in the form of heat maps display-ing the range of expression levels of each gene, recorded ineach of the types of hepatocyte preparation. Values recordedare cycle threshold (Ct) values, which display an inverserelationship to the amount of nucleic acid measured insamples, representing absolute expression. Therefore, thelowest extreme Ct values, represent the highest level ofexpression. The scale bars above the maps indicate the rangeof recorded Ct values (from lowest to highest).
Status of efflux transporter gene expression in hepatocytepreparations
Differences in transcript levels of the transporters of interest(MDR1, BSEP, MRP2 and BCRP) were seen in the different hep-atocyte cultures assessed (freshly isolated suspensions, mono-layer cultures 24 and 48 hours post isolation and spheroidcultures 5, 7, 10, 15 and 25 days post isolation) (Fig. 1).Expression levels of BSEP and BCRP in monolayer culture werelower than those measured in freshly isolated hepatocytes and,following a recovery in early spheroid culture, an increase inexpression was evident in mature spheroids.
In conventional monolayer culture, there was a decline inthe expression of both BSEP and BCRP at 24 and 48 hours postisolation, when compared to the level measured in freshly iso-lated hepatocytes. This was seen by an increase in Ct value anda corresponding fold change of 0.55 ± 0.18 (p < 0.05, Mann-Whitney U test) and 0.63 ± 0.13 (p < 0.05, Mann-WhitneyU test) for BSEP and BCRP respectively in monolayer culture24 hours post isolation and 0.51 ± 0.20 (p < 0.05, Mann-Whitney U test) and 0.79 ± 0.13 (p > 0.05, Mann-WhitneyU test) respectively in monolayer culture 48 hours post iso-lation (Fig. 1). In contrast to these declines, increases in theexpression of MRP2 and MDR1, relative to levels measured infreshly isolated hepatocytes, were measured in monolayer cul-tures at the same time points. MRP2 expression in hepatocytes48 hours post isolation exhibited a significant fold change of2.07 ± 0.44 (p < 0.05, Mann-Whitney U test) in comparison tofreshly isolated hepatocytes and there were also significantfold changes of 1.52 ± 0.25 and 2.09 ± 0.49 (p < 0.05, Mann-Whitney U test) in the expression of MDR1 in monolayer cul-tures 24 hours and 48 hours post isolation respectively, whencompared to freshly isolated hepatocytes (Fig. 1).
Efflux transporter expression levels measured in hepato-cytes in spheroid culture were greater than, or equal to, levelsmeasured in conventional primary hepatocyte cultures. Duringthe development of spheroid structures (between 5–10 dayspost isolation), expression of genes for efflux transportersremained relatively stable (with the exception of BCRPexpression in spheroids 10 days post isolation) although,gradual increases in the expression of MRP2 and MDR1 wereseen. This increase in MRP2 expression in early spheroids,continued at subsequent time points. The highest levels ofexpression of all efflux transporters were measured in maturespheroids, with significant increases in the expression ofMRP2 and MDR1 (7.88 ± 1.02 and 2.59 ± 0.28 fold respectively)recorded in spheroids 25 days post isolation.
In all hepatocyte preparations and at all time points, BSEPwas the efflux transporter exhibiting the greatest level ofexpression (Fig. 1). This observation was in accordance withthe expression of BSEP in whole liver samples taken from thesame individual fish and in accord with published data.34 Incontrast, MRP2 exhibited the lowest level of expression infreshly isolated hepatocytes and hepatocytes in monolayerculture (comparable to the expression in whole liver) and thelevel of MDR1 expression was lowest in hepatocyte spheroidscompared to other preparations at all time points. The patternof expression of the transporters of interest was constant at allstages of spheroid culture.
Functional activity of efflux transporters in spheroidhepatocytes
The functions of the efflux transporters of interest wereassessed using fluorescent substrates and inhibitors success-fully employed in other studies (e.g. ref. 29, 32, 46, 49 and 55).The fluorescent substrates used were calcein-acetoxymethyles-ter (Ca-AM), rhodamine 123 (Rh123), hoechst 33342 (H33342)and 2′,7′-dichlorodihydrofluorescein diacetate (DHFDA). The
Fig. 1 Expression levels of genes related to ABC efflux transporters infreshly isolated hepatocytes, hepatocytes in monolayer culture (24 and48 hours post isolation) and hepatocyte spheroids. The bar above theheat map indicates the scale of Ct values measured in cell samples withred representing the lowest extreme Ct value, therefore the greatestlevel of expression; blue representing the highest extreme Ct value,therefore the lowest level of expression; and black representing themedian level of expression (n = 5 fish).
Toxicology Research Paper
This journal is © The Royal Society of Chemistry 2015 Toxicol. Res., 2015, 4, 494–507 | 499
Ope
n A
cces
s A
rtic
le. P
ublis
hed
on 2
9 Ja
nuar
y 20
15. D
ownl
oade
d on
1/1
5/20
22 1
:38:
50 P
M.
Thi
s ar
ticle
is li
cens
ed u
nder
a C
reat
ive
Com
mon
s A
ttrib
utio
n 3.
0 U
npor
ted
Lic
ence
.View Article Online

intracellular presence and accumulation of these compoundsin spheroids was observed and confirmed by confocalmicroscopy (Fig. 2). Increases in intracellular accumulation ofsubstrates as a result of specific inhibition were quantifiedusing a fluorescence plate reader and compared to the fluo-rescence measurements recorded in control cells. All inhibi-tors investigated caused significant changes in substrateaccumulation.
The highest maximal fluorescence accumulation in spher-oids was seen with sodium taurocholate, used to inhibit BSEP.A 3.70 fold increase in DHFDA accumulation was measured at1.0 and 1.5 mM concentrations of sodium taurocholate. Inhi-bition of DHFDA efflux was not significant below concen-trations of 500 µM (Fig. 3A). In comparison, fluorescenceaccumulation as a result of BCRP inhibition by Ko143 was con-siderably lower, with a maximum 1.38 fold increase in H33342accumulation. BCRP inhibition by Ko143 caused significantincreases in fluorescence at concentrations of 2 µM and above(p < 0.05, Mann-Whitney U test) however, a distinct concen-tration-dependent increase of H33342 was not evident as aresult of BCRP inhibition (Fig. 3B).
In contrast, inhibition of MDR1 activity was seen at cyclo-sporin A concentrations of 10 and 20 µM with concentration-dependent increase in intracellular rhodamine 123 accumu-lation of 1.5 fold and 1.8 fold respectively (Fig. 3C). Probenecidproduced concentration-dependent increases of calcein-AMaccumulation, through the inhibition of MRP2 in spheroids(Fig. 3D). A significant increase in fluorescence accumulation(p < 0.05, individual samples T test) was measured in cellsexposed to concentrations of 100 µM and above, with amaximum 2.95 fold accumulation measured at 1 mM.
Re-formation of bile canaliculi in spheroid hepatocytes
The fluorescent bile acid cholyl-lysyl-fluorescein (CLF) wasfound to be taken up into spheroids and subsequently releasedwith time. Spheroids were treated with fluorescent CLF andallowed to efflux the marker over a period of 30 minutes,revealing some evidence of the concentration of pools of punc-tate fluorescence, which did not correspond to the structure ofwhole cells (Fig. 4). It is possible that this punctate labelling isreflective of the presence of canalicular structures from whichbile release from spheroids is mediated.
Changes in the expression of genes involved in xenobioticmetabolism in different hepatocyte preparations
The transcript levels of CYP1A, CYP2K1, CYP2M1, CYP3A27and UGT were also assessed and compared in the same hep-atocyte preparations as used in transporter assessments. Anumber of gene specific changes in expression levels indifferent hepatocyte preparations were identified (Fig. 5). Adecline in the expression of UGT, CYP2K1 and CYP2M1 wasevident in early monolayer culture, followed by a recovery inlate monolayer culture and early stages of spheroid culture.Expression levels of CYP1A and CYP3A27 gradually increasedin this timeframe; with a sharp decline in CYP1A expressionevident in spheroids 5 days post isolation. Levels of expressionof the genes of interest appeared to be relatively more stable inmore mature spheroids (Fig. 5).
With the exception of CYP1A and CYP3A27, the expressionlevels of all genes in monolayer culture 24 hours post isolationwere less than, or equal to, those measured in freshly isolatedhepatocytes. However, in monolayer cultures 48 hours post
Fig. 2 Representative visualisation of the accumulation of DHFDA (A), H33342 (B), calcein-AM (C) and rhodamine 123 (D) in hepatocytes in spheroidcultures. A–D 1 show representative controls and A–D 2 show representative spheroids following treatment with sodium taurocholate (A), Ko143 (B),probenecid (C) and cyclosporin A (D). The intracellular accumulation of fluorescent probes in spheroids was observed using confocal microscopy. Atthe maximum concentrations of inhibitors used, a greater accumulation of fluorescence was observed in spheroids, in comparison to untreated cellsin each case. Spheroids used from 15 days post isolation. Images from left to right: fluorescence channel; Bright field scan; merged image. All scalebars indicate 100 µm.
Paper Toxicology Research
500 | Toxicol. Res., 2015, 4, 494–507 This journal is © The Royal Society of Chemistry 2015
Ope
n A
cces
s A
rtic
le. P
ublis
hed
on 2
9 Ja
nuar
y 20
15. D
ownl
oade
d on
1/1
5/20
22 1
:38:
50 P
M.
Thi
s ar
ticle
is li
cens
ed u
nder
a C
reat
ive
Com
mon
s A
ttrib
utio
n 3.
0 U
npor
ted
Lic
ence
.View Article Online

isolation, expression increased to a level greater than thatmeasured in freshly isolated hepatocytes (with the exception ofUGT expression). In the majority of cases, expression levelsmeasured in hepatocyte spheroids were greater than measuredin freshly isolated hepatocytes and hepatocytes in monolayerculture. The expression of CYP1A was the exception to this,with the level of expression lower at all stages of spheroidmaturation, than measured in monolayer culture and lessthan, or equal to, the level recorded in freshly isolated hepato-cytes. Experience in our laboratory has also demonstrateddifficulty in replicating in vivo activity of CYP1A (via EROD)using primary monolayer cultures.56
In spheroid culture, expression levels of genes related toxenobiotic metabolism were generally highest at 5 and 7 days
post isolation, with a small decline at 10 and 15 days post iso-lation; with the exception of CYP1A and CYP3A27 at 10 dayspost isolation and CYP1A in spheroids 15 days post isolation.However, expression levels remained greater than that
Fig. 4 Confocal imaging of cholyl-lysyl-fluorescein (CLF) distributionwithin spheroids. Spheroids were treated with CLF for 30 minutes andimages show evidence of the concentration of the fluorescent com-pound in these structures. Staining was punctate and did not corres-pond to a pan-cellular localisation within individual cells. This mayreflect the presence, in part, of canalicular structures between cellsfrom which bile release from hepatocyte spheroids is mediated. Spher-oids used from 15 days post isolation. Images from left to right: fluor-escence channel; Bright field scan; merged image. All scale bars indicate100 µm.
Fig. 5 Relative expression levels of genes related to xenobiotic meta-bolism in freshly isolated hepatocytes, hepatocytes in monolayer culture(24 and 48 hours post isolation) and hepatocyte spheroids. The barabove the heat map indicates the scale of Ct values measured in cellsamples with red representing the lowest extreme Ct value, thereforethe greatest level of expression; blue representing the highest extremeCt value, therefore the lowest level of expression; and black representingthe median level of expression.
Fig. 3 The effect of sodium taurocholate (A), Ko143 (B), probenecid (C) and cyclosporin A (D) on the accumulation of the substrates shown in eachcase within hepatocyte spheroid cultures. Data represent mean fluorescence accumulation relative to uninhibited controls and expressed as a per-centage increase ±SEM. Control fluorescence accumulation = 100%; *p < 0.05 (significantly greater than control), Mann-Whitney U test (n = 3 fish).
Toxicology Research Paper
This journal is © The Royal Society of Chemistry 2015 Toxicol. Res., 2015, 4, 494–507 | 501
Ope
n A
cces
s A
rtic
le. P
ublis
hed
on 2
9 Ja
nuar
y 20
15. D
ownl
oade
d on
1/1
5/20
22 1
:38:
50 P
M.
Thi
s ar
ticle
is li
cens
ed u
nder
a C
reat
ive
Com
mon
s A
ttrib
utio
n 3.
0 U
npor
ted
Lic
ence
.View Article Online

measured in freshly isolated hepatocytes. Gene expressionlater increased at 25 days post isolation (with the exception ofCYP1A), to levels greater than measured at 10 days post iso-lation and less than but closer in comparison to those detectedat 5 and 7 days post isolation. Mature spheroids (10, 15 and 25days post isolation) appeared to retain the most similarpattern of expression in comparison to that observed in thewhole liver (Fig. 5). However, caution must be exercised whenmaking such comparisons as a smaller proportion of hepato-cytes (in the region of 80%), contribute to the total liverprotein in whole liver.
Principal component analyses
The principal component analysis plot (Fig. 6) demonstratesthe overall predominant similarity of spheroids to whole liverwith respect to drug efflux transporters.
Discussion
The transport of compounds through cell membranes is animportant feature of xenobiotic detoxification, having a keyinfluence on the absorption, distribution, elimination, toxicityand efficacy of compounds. For the majority of compounds,transport and metabolism must be assessed together to allowaccurate predictions of in vivo disposition, physiological effectsand xenobiotic fate to be made.2,57 Importantly, this feature is
lacking in assays currently used for the assessment of thebioaccumulation potential of environmental contaminants,conducted using subcellular fractions, where the cellularuptake and elimination of a xenobiotic is assumed.58 The aimof the present investigation was to explore the potential advan-tages of the use of hepatocyte spheroids (pertaining to thegreater expression and activity of drug transporters), makingsuch assays more informative, with respect to the evaluation ofbioaccumulation potential and therefore more relevant to thedetoxification of compounds in vivo.
In this study, the expression and activity of all of the effluxtransporters of interest was identified in hepatocyte spheroidsat different stages of maturity. Although some variation inexpression levels was evident at different time points, tran-script levels were generally greater than those measured inconventional cultures. A general down-regulation of expressionin monolayer culture was evident, most likely to be associatedwith cellular de-differentiation in these cultures. Following arecovery period in early spheroid culture, an increase in theexpression of genes related to xenobiotic metabolism andtransport was evident in mature spheroids, reaching thehighest values in aggregates 25 days post isolation.
The 3D structure of hepatocytes, with enhanced cell–celland cell-extracellular matrix interactions is thought to beresponsible for the restoration and maintenance of cellularpolarisation and differentiation, lost during the isolationprocess and in conventional culture.17,59 De-differentiationand the ensuing loss of gene expression and specific cellularfunctions has traditionally been problematic in conventionalcultures.2 Cellular differentiation is known to be mediatedthrough extracellular signals via locally acting moleculeswithin the extracellular matrix and from adjacent cells. Theseinteractions directly affect cell function and behaviour, regu-lated at gene expression level.60 The importance of differen-tiation status on the expression of the uptake transporterorganic anion transporter polypeptide (OATP) and the effluxtransporter MRP1 has previously been shown in trout celllines.34,61 Therefore, maintenance of cellular differentiation asseen in spheroid hepatocytes, confers significant advantages,making this model an attractive alternative for in vitro studiesof drug transporters.
In common with expression in whole liver samples, in allin vitro preparations and at all time points in culture, theexpression of BSEP was the greatest of all transporters investi-gated. This is in accordance with a study in which BSEPexpression in trout liver tissue was measured as 750 fold and114 fold greater than MDR1 and MRP2 respectively.29 Highhepatic BSEP expression is also a common feature measuredin mammalian systems, however in contrast, expression of thetransporter in a study using a variety of trout cell lines (includ-ing 3 of hepatic origin) was among the lowest of those investi-gated.46 In addition, no functional activity of BSEP or BCRPwas identified in trout hepatocyte-derived cell lines, despitebeing the highest expressed transporters in vivo. This is a keyissue for these cell lines and has significant implications forusing that model in examining xenobiotic metabolism and
Fig. 6 Principal components analysis (PCA) scores plot for the profileof expression of genes related to xenobiotic efflux in whole liver and allhepatocyte preparations. The plot shows separation of in vivo andin vitro preparations along the PC2 and PC3 axes. There was a clear sep-aration of hepatocytes in monolayer culture at the greatest extreme(bottom left quadrant) from the whole liver sample. In comparison, theexpression profile of freshly isolated hepatocytes was closer to that ofthe whole liver than to the other conventional cell culture types. Varia-bility existed in the expression profile of spheroid hepatocytes accordingto stage of culture, however, spheroids at all time points displayed abetter resemblance to the expression profile of the whole liver. Spheroidhepatocytes 5, 7 and 25 days post isolation showed the best similarity tothe expression profile in vivo. FIH: freshly isolated hepatocytes; H24:monolayer culture 24 hpi; H48: monolayer culture 48 hpi; S5: spheroidculture 5 dpi; S7: spheroid culture 7 dpi; S10: spheroid culture 10 dpi;S15: spheroid culture 15 dpi; S25: spheroid culture 25 dpi.
Paper Toxicology Research
502 | Toxicol. Res., 2015, 4, 494–507 This journal is © The Royal Society of Chemistry 2015
Ope
n A
cces
s A
rtic
le. P
ublis
hed
on 2
9 Ja
nuar
y 20
15. D
ownl
oade
d on
1/1
5/20
22 1
:38:
50 P
M.
Thi
s ar
ticle
is li
cens
ed u
nder
a C
reat
ive
Com
mon
s A
ttrib
utio
n 3.
0 U
npor
ted
Lic
ence
.View Article Online

transport. BSEP is involved in the efflux of a wide range ofendogenous and exogenous compounds, with a particular rolein the secretion of bile acids into the bile canaliculus.34,62 Thelack of OATP which imports bile acids into hepatocytes andthe absence of a canalicular structure has been suggested as acause for the low expression and lack of BSEP function in troutcell lines.46,63 Rat hepatocyte couplets exhibit bile canalicularstructures into which bile constituents are secreted64,65 indi-cating the importance of cell–cell structural interactions. Inthe current investigation, it was observed that hepatocytes con-nected via spheroid structure retain BSEP expression and func-tion and there is some evidence of canalicular structure(Fig. 4), similar to structures observed in rat hepatocyte spher-oids.6 The uptake and release of CLF, occurred in trout spher-oids where release was inhibited by sodium taurocholate. Theconcentration of punctate fluorescent staining which did notcorrespond to the structure of whole cells suggested the pres-ence of functional canalicular structures (Fig. 4). These find-ings again present advantageous features of spheroids for usein studies of xenobiotic transport compared to the use of hep-atocyte derived cell lines lacking such structures.
Similar to the expression of genes related to transport,expression of genes related to xenobiotic metabolism weregenerally greater in spheroids than in freshly isolated hepato-cytes or in monolayer culture. With the exception of CYP1A,expression levels in spheroids did not fall below thosemeasured in other hepatocyte preparations.
Temporal differences were evident in the profile ofexpression of all genes (both metabolism and transportrelated) in hepatocyte spheroids, with cells 10 days post iso-lation showing the greatest deviation with respect to the in vivoprofile and spheroids 25 days post isolation demonstrating thegreatest analogy. In this study, the point at which little to nochange in microscopic structural arrangements were seen wasused as the indicator of morphological maturation. At thisstage, spheroids exhibited a more homogeneous shape thanthose of earlier time points. It may be possible that thismarker of morphological maturation does not necessarilymatch a similar period of gene expression, where levels areexpected to stabilise. It has been reported that in rat hepato-cyte spheroids, biochemical and functional turbulence occursas spheroids mature in early culture, recovering and stabilisingafter about 6 days.17 The expression profile of spheroids in thisstudy at 10 days post isolation was markedly different fromthat of other spheroids. The temporal and transient decline ingene expression measured at this stage may be reflective of asimilar period of turbulence and instability. Indeed, changesin cellular protein content, increases in levels of albumin syn-thesis and changes in metabolism, to levels more reflective ofthose measured in intact tissue has been reported during thetransition from immature to mature spheroids.14 The exactstage at which gene expression stabilises in trout hepatocytespheroids may be later than that of the observed morphologi-cal maturation, potentially explaining the expression differ-ences observed at 10 days post isolation. It remains unclearhowever, exactly at which stage trout hepatocytes can be noted
as mature and it has been suggested that despite classifyingspheroids as mature after a period of 6–8 days, the fusion ofcells may continue up to 16 days.14 Functional stability mayprove to be a better indicator of maturity for use of spheroidsin specific assays. Also, xenobiotic metabolism activities in rathepatocyte spheroids remained significantly higher than in rathepatocyte monolayer cultures.4
It is difficult to directly compare expression levels betweenisolated hepatocyte preparations and whole liver due to differ-ences in cellular composition. Hepatocytes have been shownto be quantitatively dominant in trout liver, contributingaround 80–85% liver volume.66,67 Whole liver samples includeat least 10 other, non-parenchymal cell types68 which play arole in the function, differentiation and gene regulation ofhepatocytes, through inter-cellular signalling.69,70 It has beenreported that co-culture systems maintaining parenchymal andnon-parenchymal cells concurrently, show improved morpho-logical characteristics and increased drug metabolismcapabilities71–73 and this could be applied to trout hepatocytespheroids in the future. Despite this, hepatocyte spheroidsretained a more representative profile of gene expressionrelated to the xenobiotic detoxification process than the mono-layer cultures.
To assess functionality of the transporter proteins encodedby the genes of interest in spheroid cultures, transporter activi-ties were investigated using specific fluorescent substrates andinhibitors used in mammalian efflux transporter assays, manyof which have been used in previous studies involving fishin vitro hepatic preparations.32,46,55 Significant differences inthe accumulation of substrates were seen in spheroids at thehighest inhibitory concentrations of all compounds used,suggesting that the transporters of interest identified in spher-oids were functional and susceptible to inhibition. In commonwith the high expression of BSEP in spheroids, its inhibitionresulted in the greatest substrate accumulation. High levels ofDHFDA accumulation in spheroids was in agreement with theinhibition of BSEP in trout hepatocyte monolayer cultures,29
highlighting the potential importance of biliary excretion path-ways in rainbow trout, as demonstrated by the detection ofxenobiotics and metabolites in bile collected from wholefish.74
A lack of knowledge of the exact specificities of inhibitorsand the broad and overlapping substrate specificities of effluxtransporters proves problematic in the accuracy of functionaltransporter assays. Especially for the assessment of transpor-ters in fish as the assumption of activities is based on themammalian literature. Recent studies have highlighted therelatedness of MDR1, BSEP and MRP-group transporters,raising questions on the inhibitory specificity of cyclosporin Aand the transporter specificities of rhodamine 123 andcalcein-Am among others.29,32,46,75 An important feature toexplore further in hepatocyte spheroids is the use of transpor-ter inhibitor co-exposure, to block multiple efflux pathways, tocircumvent the lack of knowledge of transporter substratespecificity. The expression of individual transporters couldalso be down-regulated using RNAi, however problems with
Toxicology Research Paper
This journal is © The Royal Society of Chemistry 2015 Toxicol. Res., 2015, 4, 494–507 | 503
Ope
n A
cces
s A
rtic
le. P
ublis
hed
on 2
9 Ja
nuar
y 20
15. D
ownl
oade
d on
1/1
5/20
22 1
:38:
50 P
M.
Thi
s ar
ticle
is li
cens
ed u
nder
a C
reat
ive
Com
mon
s A
ttrib
utio
n 3.
0 U
npor
ted
Lic
ence
.View Article Online

transfection efficiency in primary cells, especially those ofpiscine origin, have been reported.76,77 It may also be possiblethat inhibition of individual transporters can result in the up-regulation of other, closely related transporters, with overlap-ping specificity. Nevertheless, irrespective of the precise speci-ficity of inhibitors, it is clear that transporter efflux wasmeasurable and susceptible to inhibition (Fig. 3).
A number of environmentally relevant compounds havebeen shown to modify the expression and function of effluxtransporters in aquatic organisms as well as genes involved inxenobiotic metabolism.20,36,46 Both may contribute to theaccumulation of compounds in organisms when exposed tomixtures of environmental contaminants.32,47 As a result,information on the efflux of compounds and their potential toinhibit transporter function should be included in the assess-ment of environmental contaminants. In this study, emphasishas been placed on the efflux of compounds. However, in theprediction of the potential of a compound to bioaccumulate,the kinetics of uptake, influenced by factors such as lipid solu-bility and intestinal transporter activity should also be con-sidered in association with xenobiotic metabolic capacityanalysis. Information gained experimentally in this area couldbe used to develop further predictive models that mightsupport the environmental risk assessment of xenobiotics andindustrial chemicals.
This study is the first to assess trout ABC transporters inlong term culture, showing the improved expression of the keyefflux transporters, in comparison to other cell culture models.The spheroidal system has the potential to be adapted forroutine use in the assessment of environmental contaminantsas this would not only confer advantages of longevity andmaintained metabolic activity, but will also enable the incor-poration of measurements of efflux and inhibition, affirmingsuch cultures as a much more informative model for thescreening of bioaccumulation potential. The system will be ofhigh interest in the context of potential industrial use in arange of in vitro metabolic and transport assessments ofchemical safety (especially with respect to assessments ofchronic exposure) and overcomes the de-differentiation associ-ated with more conventional hepatocyte cultures that hasplagued researchers for many years.
Liver tissues used in this study were derived from freshlyeuthanised rainbow trout supplied from stocks at the Univer-sity of Birmingham. These stock fish were held with per-mission from the UK Home Office under the Animals(Scientific Procedures) Act 1986 and therefore under authoris-ation by the University Ethics Committee. Since they werekilled under a schedule 1 method, they did not undergo ascientific procedure by definition of the Act. This study com-plied with regulatory and ethical standards in the UK and theglobal ethical standards required by the industrial partnerAstraZeneca. One of the principle aims of this work was toestablish and characterise an in vitro model that will poten-tially reduce the numbers of fish used in future environmentaltests required by regulatory authorities. Currently approxi-mately 30 000 fish are used per year in the UK alone, more in
other countries; and these tests are required by regulatoryauthorities around the world (see https://www.gov.uk/govern-ment/publications/user-guide-to-home-office-statistics-of-scien-tific-procedures-on-living-animals). By developing these in vitroorganoid models, we hope to contribute to reducing thesenumbers in the future. Furthermore, since the fish used inthis study are not exposed to chemicals whilst alive, this rep-resents a significant refinement in the methodology, and likelyreduces the effects of endogenous stress responses. This studyrepresents a significant step towards developing future modelsthat will be acceptable to regulatory authorities, and thereforeis a key contribution towards our endeavours to further the3Rs (Reduction, Refinement, Replacement) of vertebrateanimals in toxicology.
Conflict of interest
C. Uchea was in receipt of a scholarship co-funded by the Bio-technology and Biological Sciences Research Council (BBSRC)and AstraZeneca (Safety Health and Environment ResearchProgramme) to J. K. Chipman, an employee of the Universityof Birmingham. S. F. Owen is an employee of AstraZeneca.AstraZeneca is a bio-pharmaceutical manufacturer that dis-covers, develops, manufactures and markets a wide range ofpharmaceuticals that necessarily require an environmentalrisk assessment including the potential to bioaccumulate inaquatic species. The authors declare no conflicts of interest.
Acknowledgements
The authors thank Peter Jones (The University of Birmingham,UK) for fish husbandry.
Notes and references
1 T. M. Walker, P. C. Rhodes and C. Westmoreland, Thedifferential cytotoxicity of methotrexate in rat hepatocytemonolayer and spheroid cultures, Toxicol. in Vitro, 2000,14(5), 475–485.
2 E. F. Brandon, C. D. Raap, I. Meijerman, J. H. Beijnen andJ. H. Schellens, An update on in vitro test methods inhuman hepatic drug biotransformation research pros andcons, Toxicol. Appl. Pharmacol., 2003, 189(3), 233–246.
3 F. Pampaloni, E. G. Reynaud and E. H. Stelzer, The thirddimension bridges the gap between cell culture and livetissue, Nat. Rev. Mol. Cell Biol., 2007, 8(10), 839–845.
4 C. M. Brophy, J. L. Luebke-Wheeler, B. P. Amiot, H. Khan,R. P. Remmel, P. Rinaldo, et al., Rat hepatocyte spheroidsformed by rocked technique maintain differentiated hep-atocyte gene expression and function, Hepatology, 2009,49(2), 578–586.
5 E. L. LeCluyse, R. P. Witek, M. E. Andersen andM. J. Powers, Organotypic liver culture models: meeting
Paper Toxicology Research
504 | Toxicol. Res., 2015, 4, 494–507 This journal is © The Royal Society of Chemistry 2015
Ope
n A
cces
s A
rtic
le. P
ublis
hed
on 2
9 Ja
nuar
y 20
15. D
ownl
oade
d on
1/1
5/20
22 1
:38:
50 P
M.
Thi
s ar
ticle
is li
cens
ed u
nder
a C
reat
ive
Com
mon
s A
ttrib
utio
n 3.
0 U
npor
ted
Lic
ence
.View Article Online
current challenges in toxicity testing, Crit. Rev. Toxicol.,2012, 42(6), 501–548.
6 S. F. Abu-Absi, J. R. Friend, L. K. Hansen and W. S. Hu,Structural polarity and functional bile canaliculi in rat hep-atocyte spheroids, Exp. Cell Res., 2002, 274(1), 56–67.
7 J. Fukuda, Y. Sakai and K. Nakazawa, Novel hepatocyteculture system developed using microfabrication and col-lagen/polyethylene glycol microcontact printing, Bio-materials, 2006, 27(7), 1061–1070.
8 S. Sanoh, M. Santoh, M. Takagi, T. Kanayama, K. Sugihara,Y. Kotake, et al., Fluorometric assessment of acetamino-phen-induced toxicity in rat hepatocyte spheroids seededon micro-space cell culture plates, Toxicol. in Vitro, 2014,28(6), 1176–1182.
9 M. M. Stevens, Toxicology: Testing in the third dimension,Nat. Nanotechnol., 2009, 4(6), 342–343.
10 J. Lee, G. D. Lilly, R. C. Doty, P. Podsiadlo and N. A. Kotov,In vitro toxicity testing of nanoparticles in 3D cell culture,Small, 2009, 5(10), 1213–1221.
11 L. A. Kunz-Schughart, J. Doetsch, W. Mueller-Klieser andK. Groebe, Proliferative activity and tumorigenic conver-sion: impact on cellular metabolism in 3-D culture,Am. J. Physiol.: Cell Physiol., 2000, 278(4), C765–C780.
12 W. Mueller-Klieser, Tumor biology and experimental thera-peutics, Crit. Rev. Oncol. Hematol., 2000, 36(2–3), 123–139.
13 C. Uchea, S. Sarda, T. Schulz-Utermoehl, S. Owen andK. J. Chipman, In vitro models of xenobiotic metabolism introut for use in environmental bioaccumulation studies,Xenobiotica, 2013, 43(5), 421–431.
14 M. G. Baron, W. M. Purcell, S. K. Jackson, S. F. Owen andA. N. Jha, Towards a more representative in vitro methodfor fish ecotoxicology: morphological and biochemicalcharacterisation of three-dimensional spheroidal hepato-cytes, Ecotoxicology, 2012, 21(8), 2419–2429.
15 M. Nishimura, Y. Ejiri, S. Kishimoto, S. Suzuki, T. Satoh,T. Horie, et al., Expression levels of drug-metabolizingenzyme, transporter, and nuclear receptor mRNAs in anovel three-dimensional culture system for human hepato-cytes using micro-space plates, Drug Metab. Pharmacokinet.,2011, 26(2), 137–144.
16 M. C. Wright and A. J. Paine, Evidence that the loss of ratliver cytochrome P450 in vitro is not solely associated withthe use of collagenase, the loss of cell-cell contacts and/orthe absence of an extracellular matrix, Biochem. Pharmacol.,1992, 43(2), 237–243.
17 M. Ma, J. Xu and W. M. Purcell, Biochemical and func-tional changes of rat liver spheroids during spheroid for-mation and maintenance in culture: I. morphologicalmaturation and kinetic changes of energy metabolism,albumin synthesis, and activities of some enzymes, J. CellBiochem., 2003, 90(6), 1166–1175.
18 K. N. Faber, M. Muller and P. L. Jansen, Drug transport pro-teins in the liver, Adv. Drug Delivery Rev., 2003, 55(1), 107–124.
19 P. Chandra and K. L. Brouwer, The complexities of hepaticdrug transport: current knowledge and emerging concepts,Pharm. Res., 2004, 21(5), 719–735.
20 G. Szakacs, A. Varadi, C. Ozvegy-Laczka and B. Sarkadi, Therole of ABC transporters in drug absorption, distribution,metabolism, excretion and toxicity (ADME-Tox), Drug Dis-covery Today, 2008, 13(9–10), 379–393.
21 Y. Sakai, T. Tanaka, J. Fukuda and K. Nakazawa, Alkoxyre-sorufin O-dealkylase assay using a rat hepatocyte spheroidmicroarray, J. Biosci. Bioeng., 2010, 109(4), 395–399.
22 Y. Sakai, S. Yamagami and K. Nakazawa, Comparative ana-lysis of gene expression in rat liver tissue and monolayer-and spheroid-cultured hepatocytes, Cells Tissues Organs,2010, 191(4), 281–288.
23 T. Elkayam, S. Amitay-Shaprut, M. Dvir-Ginzberg, T. Hareland S. Cohen, Enhancing the drug metabolism activities ofC3A–a human hepatocyte cell line–by tissue engineeringwithin alginate scaffolds, Tissue Eng., 2006, 12(5), 1357–1368.
24 S. B. Leite, I. Wilk-Zasadna, J. M. Zaldivar, E. Airola,M. A. Reis-Fernandes, M. Mennecozzi, et al., Three-dimen-sional HepaRG model as an attractive tool for toxicitytesting, Toxicol. Sci., 2012, 130(1), 106–116.
25 P. Gunness, D. Mueller, V. Shevchenko, E. Heinzle,M. Ingelman-Sundberg and F. Noor, 3D organotypic cul-tures of human HepaRG cells: a tool for in vitro toxicitystudies, Toxicol. Sci., 2013, 133(1), 67–78.
26 G. Flouriot, C. Vaillant, G. Salbert, C. Pelissero,J. M. Guiraud and Y. Valotaire, Monolayer and aggregatecultures of rainbow trout hepatocytes: long-term and stableliver-specific expression in aggregates, J. Cell Sci., 1993,105(Pt 2), 407–416.
27 G. Flouriot, F. Pakdel, B. Ducouret and Y. Valotaire, Influ-ence of xenobiotics on rainbow trout liver estrogen receptorand vitellogenin gene expression, J. Mol. Endocrinol., 1995,15(2), 143–151.
28 A. M. Guarino, Aquatic versus mammalian toxicology:applications of the comparative approach, Environ. HealthPerspect., 1987, 71, 17–24.
29 R. Zaja, V. Munic, R. S. Klobucar, A. Ambriovic-Ristov andT. Smital, Cloning and molecular characterization of apicalefflux transporters (ABCB1, ABCB11 and ABCC2) inrainbow trout (Oncorhynchus mykiss) hepatocytes, Aquat.Toxicol., 2008, 90(4), 322–332.
30 M. Ferreira, J. Costa and M. A. Reis-Henriques, ABC trans-porters in fish species: a review, Front. Physiol., 2014, 5,266.
31 R. van der Oost, J. Beyer and N. P. Vermeulen, Fish bioaccu-mulation and biomarkers in environmental risk assess-ment: a review, Environ. Toxicol. Pharmacol., 2003, 13(2),57–149.
32 D. Caminada, R. Zaja, T. Smital and K. Fent, Human phar-maceuticals modulate P-gp1 (ABCB1) transport activity inthe fish cell line PLHC-1, Aquat. Toxicol., 2008, 90(3), 214–222.
33 M. Dean, A. Rzhetsky and R. Allikmets, The human ATP-binding cassette (ABC) transporter superfamily, GenomeRes., 2001, 11(7), 1156–1166.
34 J. Loncar, M. Popovic, R. Zaja and T. Smital, Geneexpression analysis of the ABC efflux transporters in
Toxicology Research Paper
This journal is © The Royal Society of Chemistry 2015 Toxicol. Res., 2015, 4, 494–507 | 505
Ope
n A
cces
s A
rtic
le. P
ublis
hed
on 2
9 Ja
nuar
y 20
15. D
ownl
oade
d on
1/1
5/20
22 1
:38:
50 P
M.
Thi
s ar
ticle
is li
cens
ed u
nder
a C
reat
ive
Com
mon
s A
ttrib
utio
n 3.
0 U
npor
ted
Lic
ence
.View Article Online

rainbow trout (Oncorhynchus mykiss), Comp. Biochem.Physiol., Part C: Toxicol. Pharmacol., 2010, 151(2),209–215.
35 P. M. Jones and A. M. George, Mechanism of the ABC trans-porter ATPase domains: catalytic models and the biochemi-cal and biophysical record, Crit. Rev. Biochem. Mol. Biol.,2013, 48(1), 39–50.
36 H. Glavinas, P. Krajcsi, J. Cserepes and B. Sarkadi, The roleof ABC transporters in drug resistance, metabolism andtoxicity, Curr. Drug Delivery, 2004, 1(1), 27–42.
37 B. Sarkadi, C. Ozvegy-Laczka, K. Nemet and A. Varadi,ABCG2 – a transporter for all seasons, FEBS Lett., 2004,567(1), 116–120.
38 T. Luckenbach, S. Fischer and A. Sturm, Current advanceson ABC drug transporters in fish, Comp. Biochem. Physiol.,Part C: Toxicol. Pharmacol., 2014, 165, 28–52.
39 I. B. Roninson, H. T. Abelson, D. E. Housman, N. Howelland A. Varshavsky, Amplification of specific DNAsequences correlates with multi-drug resistance in Chinesehamster cells, Nature, 1984, 309(5969), 626–628.
40 P. Gros, J. Croop and D. Housman, Mammalian multidrugresistance gene: complete cDNA sequence indicates stronghomology to bacterial transport proteins, Cell, 1986, 47(3),371–380.
41 R. Barbet, I. Peiffer, J. R. Hutchins, A. Hatzfeld, E. Garridoand J. A. Hatzfeld, Expression of the 49 human ATPbinding cassette (ABC) genes in pluripotent embryonicstem cells and in early- and late-stage multipotentmesenchymal stem cells: possible role of ABC plasmamembrane transporters in maintaining human stem cellpluripotency, Cell Cycle, 2012, 11(8), 1611–1620.
42 I. Ieiri, Functional significance of genetic polymorphismsin P-glycoprotein (MDR1, ABCB1) and breast cancer resist-ance protein (BCRP, ABCG2), Drug Metab. Pharmacokinet.,2012, 27(1), 85–105.
43 E. M. Leslie, R. G. Deeley and S. P. Cole, Multidrug resist-ance proteins: role of P-glycoprotein, MRP1, MRP2, andBCRP (ABCG2) in tissue defense, Toxicol. Appl. Pharmacol.,2005, 204(3), 216–237.
44 J. L. Hildebrand, O. S. Bains, D. S. Lee and C. J. Kennedy,Functional and energetic characterization of P-gp-mediateddoxorubicin transport in rainbow trout (Oncorhynchusmykiss) hepatocytes, Comp. Biochem. Physiol., Part C:Toxicol. Pharmacol., 2009, 149(1), 65–72.
45 R. Zaja, V. Munic and T. Smital, Cloning and mRNAexpression analysis of an ABCG2 (BCRP) efflux transporterin rainbow trout (Oncorhynchus mykiss) liver and primaryhepatocytes, Mar. Environ. Res., 2008, 66(1), 77–79.
46 S. Fischer, J. Loncar, R. Zaja, S. Schnell, K. Schirmer,T. Smital, et al., Constitutive mRNA expression and proteinactivity levels of nine ABC efflux transporters in seven per-manent cell lines derived from different tissues of rainbowtrout (Oncorhynchus mykiss), Aquat. Toxicol., 2011, 101(2),438–446.
47 C. G. Daughton and T. A. Ternes, Pharmaceuticals and per-sonal care products in the environment: agents of subtle
change?, Environ. Health Perspect., 1999, 107(Suppl 6),907–938.
48 T. Smital, T. Luckenbach, R. Sauerborn, A. M. Hamdoun,R. L. Vega and D. Epel, Emerging contaminants–pesticides,PPCPs, microbial degradation products and natural sub-stances as inhibitors of multixenobiotic defense in aquaticorganisms, Mutat. Res., 2004, 552(1–2), 101–117.
49 R. Zaja, D. Caminada, J. Loncar, K. Fent and T. Smital,Development and characterization of P-glycoprotein 1(Pgp1, ABCB1)-mediated doxorubicin-resistant PLHC-1hepatoma fish cell line, Toxicol. Appl. Pharmacol., 2008,227(2), 207–218.
50 L. Zhang, J. M. Strong, W. Qiu, L. J. Lesko and S. M. Huang,Scientific perspectives on drug transporters and their role indrug interactions, Mol. Pharm., 2006, 3(1), 62–69.
51 J. E. Klaunig, R. J. Ruch and P. J. Goldblatt, Trout hepato-cyte culture: isolation and primary culture, In Vitro Cell.Dev. Biol., 1985, 21(4), 221–228.
52 S. F. Abu-Absi, L. K. Hansen and W. S. Hu, Three-dimen-sional co-culture of hepatocytes and stellate cells, Cytotech-nology, 2004, 45(3), 125–140.
53 R. Glicklis, J. C. Merchuk and S. Cohen, Modeling masstransfer in hepatocyte spheroids via cell viability, spheroidsize, and hepatocellular functions, Biotechnol. Bioeng.,2004, 86(6), 672–680.
54 C. Ramakers, J. M. Ruijter, R. H. Deprez andA. F. Moorman, Assumption-free analysis of quantitativereal-time polymerase chain reaction (PCR) data, Neurosci.Lett., 2003, 339(1), 62–66.
55 R. Zaja, R. S. Klobucar and T. Smital, Detection and func-tional characterization of Pgp1 (ABCB1) and MRP3(ABCC3) efflux transporters in the PLHC-1 fish hepatomacell line, Aquat. Toxicol., 2007, 81(4), 365–376.
56 A. E. Bartram, M. J. Winter, D. B. Huggett, P. McCormack,L. A. Constantine, M. J. Hetheridge, et al., In vivo and invitro liver and gill EROD activity in rainbow trout (Oncor-hynchus mykiss) exposed to the beta-blocker propranolol,Environ. Toxicol., 2012, 27(10), 573–582.
57 R. B. Kim, Transporters and xenobiotic disposition, Toxi-cology, 2002, 181–182, 291–297.
58 K. Johanning, G. Hancock, B. Escher, A. Adekola,M. J. Bernhard, C. Cowan-Ellsberry, et al., Assessment ofmetabolic stability using the rainbow trout (Oncorhynchusmykiss) liver S9 fraction, Curr. Protoc. Toxicol., 2012, 1–28,Chapter 14:Unit 14 0.
59 J. Landry, D. Bernier, C. Ouellet, R. Goyette andN. Marceau, Spheroidal aggregate culture of rat liver cells:histotypic reorganization, biomatrix deposition, and main-tenance of functional activities, J. Cell Biol., 1985, 101(3),914–923.
60 C. Streuli, Extracellular matrix remodelling and cellulardifferentiation, Curr. Opin. Cell Biol., 1999, 11(5), 634–640.
61 D. A. Boaru, N. Dragos and K. Schirmer, Microcystin-LRinduced cellular effects in mammalian and fish primaryhepatocyte cultures and cell lines: a comparative study,Toxicology, 2006, 218(2–3), 134–148.
Paper Toxicology Research
506 | Toxicol. Res., 2015, 4, 494–507 This journal is © The Royal Society of Chemistry 2015
Ope
n A
cces
s A
rtic
le. P
ublis
hed
on 2
9 Ja
nuar
y 20
15. D
ownl
oade
d on
1/1
5/20
22 1
:38:
50 P
M.
Thi
s ar
ticle
is li
cens
ed u
nder
a C
reat
ive
Com
mon
s A
ttrib
utio
n 3.
0 U
npor
ted
Lic
ence
.View Article Online
62 E. J. Wang, C. N. Casciano, R. P. Clement andW. W. Johnson, Fluorescent substrates of sister-P-glyco-protein (BSEP) evaluated as markers of active transport andinhibition: evidence for contingent unequal binding sites,Pharm. Res., 2003, 20(4), 537–544.
63 W. A. Alrefai and R. K. Gill, Bile acid transporters: struc-ture, function, regulation and pathophysiological impli-cations, Pharm. Res., 2007, 24(10), 1803–1823.
64 R. Coleman and M. G. Roma, Hepatocyte couplets,Biochem. Soc. Trans., 2000, 28(2), 136–140.
65 D. J. Orsler, J. Ahmed-Choudhury, J. K. Chipman,T. Hammond and R. Coleman, ANIT-induced disruption ofbiliary function in rat hepatocyte couplets, Toxicol. Sci.,1999, 47(2), 203–210.
66 J. A. Hampton, R. C. Lantz and D. E. Hinton, Functionalunits in rainbow trout (Salmo gairdneri, Richardson) liver:III. Morphometric analysis of parenchyma, stroma, andcomponent cell types, Am. J. Anat., 1989, 185(1), 58–73.
67 H. Segner, Isolation and primary culture of teleost hepato-cytes, Comp. Biochem. Physiol., Part A: Mol. Integr. Physiol.,1998, 120, 71–81.
68 S. M. Lester, T. A. Braunbeck, S. J. Teh, J. J. Stegeman,M. R. Miller and D. E. Hinton, Hepatic cellular distributionof cytochrome P-450 IA1 in rainbow trout (Oncorhynchusmykiss): an immunohisto- and cytochemical study, CancerRes., 1993, 53(16), 3700–3706.
69 J. G. Altin and F. L. Bygrave, Non-parenchymal cells asmediators of physiological responses in liver, Mol. Cell.Biochem., 1988, 83(1), 3–14.
70 C. Tateno and K. Yoshizato, Growth and differentiation ofadult rat hepatocytes regulated by the interaction betweenparenchymal and non-parenchymal liver cells, J. Gastroen-terol. Hepatol., 1998, 13(Suppl), S83–S92.
71 T. J. Van Berkel and A. Van Tol, Role of parenchymal andnon-parenchymal rat liver cells in the uptake of cholestero-lester-labeled serum lipoproteins, Biochem. Biophys. Res.Commun., 1979, 89(4), 1097–1101.
72 C. R. Padgham and A. J. Paine, Altered expression of cyto-chrome P-450 mRNAs, and potentially of other transcriptsencoding key hepatic functions, are triggered during theisolation of rat hepatocytes, Biochem. J., 1993, 289(Pt 3),621–624.
73 D. M. Cross and M. K. Bayliss, A commentary on the use ofhepatocytes in drug metabolism studies during drug dis-covery and development, Drug Metab. Rev., 2000, 32(2),219–240.
74 M. Lahti, J. M. Brozinski, A. Jylha, L. Kronberg andA. Oikari, Uptake from water, biotransformation, andbiliary excretion of pharmaceuticals by rainbow trout,Environ. Toxicol. Chem., 2011, 30(6), 1403–1411.
75 M. Qadir, K. L. O’Loughlin, S. M. Fricke, N. A. Williamson,W. R. Greco, H. Minderman, et al., Cyclosporin A is abroad-spectrum multidrug resistance modulator, Clin.Cancer Res., 2005, 11(6), 2320–2326.
76 K. Romoren, X. T. Fjeld, A. B. Poleo, G. Smistad, B. J. Thuand O. Evensen, Transfection efficiency and cytotoxicity ofcationic liposomes in primary cultures of rainbow trout(Oncorhynchus mykiss) gill cells, Biochim. Biophys. Acta,2005, 1717(1), 50–57.
77 B. L. Schiotz, E. G. Rosado, E. S. Baekkevold, M. Lukacs,S. Mjaaland, H. Sindre, et al., Enhanced transfection of celllines from Atlantic salmon through nucoleofection andantibiotic selection, BMC Res. Notes, 2011, 4, 136.
78 A. Y. Matsuo, E. P. Gallagher, M. Trute, P. L. Stapleton,R. Levado and D. Schlenk, Characterization of Phase I bio-transformation enzymes in coho salmon (Oncorhynchuskisutch), Comp. Biochem. Physiol., Part C: Toxicol. Pharma-col., 2008, 147(1), 78–84.
79 E. Randelli, V. Rossini, I. Corsi, S. Focardi, A. M. Fausto,F. Buonocore, et al., Effects of the polycyclic ketone tona-lide (AHTN) on some cell viability parameters and tran-scription of P450 and immunoregulatory genes inrainbow trout RTG-2 cells, Toxicol. in Vitro, 2011, 25(8),1596–1602.
Toxicology Research Paper
This journal is © The Royal Society of Chemistry 2015 Toxicol. Res., 2015, 4, 494–507 | 507
Ope
n A
cces
s A
rtic
le. P
ublis
hed
on 2
9 Ja
nuar
y 20
15. D
ownl
oade
d on
1/1
5/20
22 1
:38:
50 P
M.
Thi
s ar
ticle
is li
cens
ed u
nder
a C
reat
ive
Com
mon
s A
ttrib
utio
n 3.
0 U
npor
ted
Lic
ence
.View Article Online


