
FUND ACCOUNTING TRAINING
The University of Texas System
Module 7
Financial Statements

2
OBJECTIVES
Identify three principal financial statements of colleges and universities
Describe basic content and layout of three principal financial statements
Identify interrelated elements among these statements
Explain Annual Financial Report preparation process
Identify principal users of financial information
U. T. System Office of the Controller

3
FINANCIAL STATEMENTS ‐ OVERVIEW
Balance Sheet Statement of Revenues, Expenses, and Changes in Net Assets
Statement of Cash Flows
U. T. System Office of the Controller

4
FINANCIAL STATEMENTS – OVERVIEW (CONTINUED)
U. T. System Office of the Controller
Colleges and universities use three principal financial statements:
Statement ofRevenues, Expenses,
and Changesin NetAssets
(SRECNA)
Statement ofRevenues, Expenses,
and Changesin NetAssets
(SRECNA)
Statement ofCash FlowsStatement ofCash Flows
BalanceSheetBalanceSheet
Principal Statements

5
NOTES TO FINANCIAL STATEMENTS
Another important component of the financial statement is the Notes to the Financial Statements. The Notes describe in greater detail various data presented in the statements themselves. For example, some of the topics of the Notes included in the U. T. System’s Consolidated Financial Statements are:
Reporting Entities Summary of Significant Accounting Policies Deposits and Investments Bonds Payable Pending Lawsuits and Claims Capital Lease Obligations
U. T. System Office of the Controller

6
FINANCIAL STATEMENTS
Notes to the financial statements are an integral part of the financial statements. Their ultimate purpose is to facilitate the reader’s understanding of financial information.
Preceding the primary financial statements is the Management’s Discussion and Analysis (MD&A), which provides an overview of the financial position and activities of U. T. System.
U. T. System Office of the Controller

7
FINANCIAL STATEMENTS (CONTINUED)
There are two different approaches to presenting information in the financial statements. The first is reporting information as of a particular date . . . a snapshot in time.
U. T. System Office of the Controller
A snapshotin time
BalanceSheetAs of
August 31, 20xx
The Balance Sheet is reported as of a particular date. One can think of the Balance Sheets as a “snapshot” of the financial position of an institution on the reporting date.

8
FINANCIAL STATEMENTS (CONTINUED)
U. T. System Office of the Controller
Both the Statement of Revenues, Expenses, and Changes in Net Assets (SRECNA) and the Statement of Cash Flows report activityfor the entire year. These statements show the “flow” of resources into , and out of, the institution.
Statement of Revenues,
Expenses, and Changes in Net
Assets
Statement of Cash Flows
For the Year EndedAugust 31, 20XX
Flow of Activities

9
FINANCIAL STATEMENTS – BALANCE SHEET
The first statement we will examine is the Balance Sheet. This statement is presented as “Exhibit A” in the completed report.
Unlike the SRECNA and the Statement of Cash Flows, this statement reports information as of a particular date. After the statement’s title, the reporting time frame of the statement is identified: As of August 31, 20XX
The Balance Sheet reports the financial position of the institution at the report date.
U. T. System Office of the Controller
BalanceSheet
10
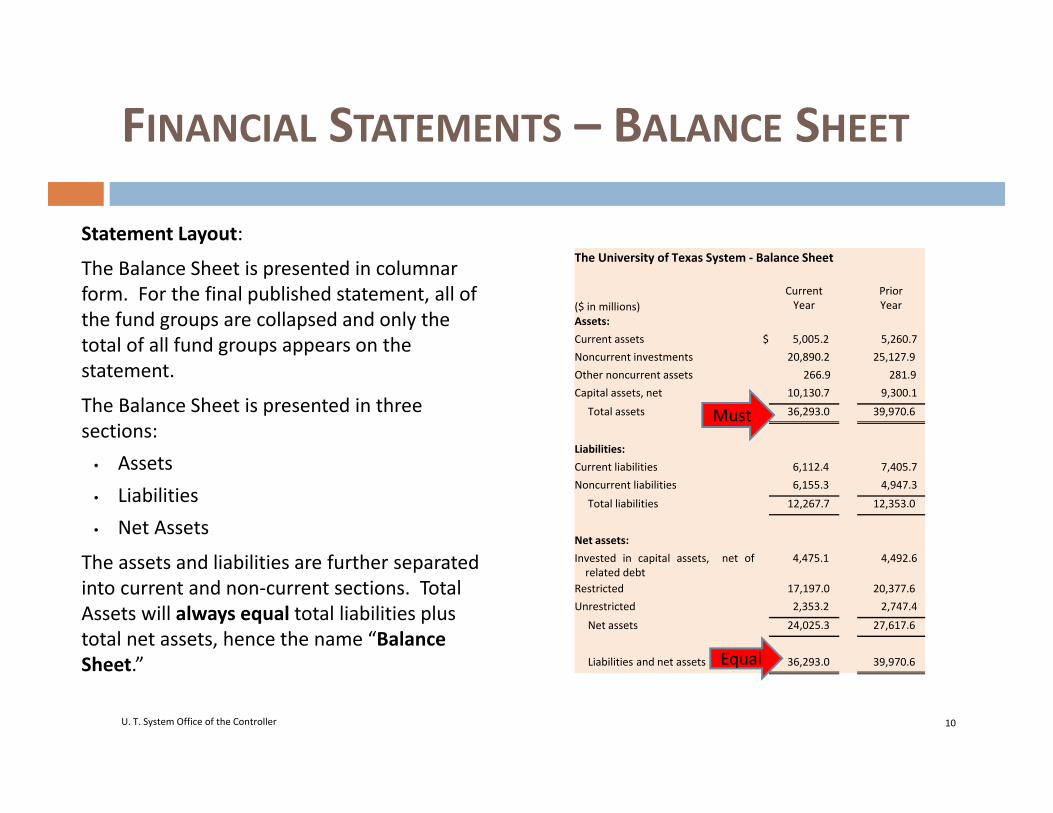
FINANCIAL STATEMENTS – BALANCE SHEET
Statement Layout:
The Balance Sheet is presented in columnar form. For the final published statement, all of the fund groups are collapsed and only the total of all fund groups appears on the statement.
The Balance Sheet is presented in three sections:
• Assets• Liabilities• Net Assets
The assets and liabilities are further separated into current and non‐current sections. Total Assets will always equal total liabilities plus total net assets, hence the name “Balance Sheet.”
U. T. System Office of the Controller
The University of Texas System ‐ Balance Sheet
($ in millions)Current Year
Prior Year
Assets:Current assets $ 5,005.2 5,260.7 Noncurrent investments 20,890.2 25,127.9 Other noncurrent assets 266.9 281.9 Capital assets, net 10,130.7 9,300.1
Total assets 36,293.0 39,970.6
Liabilities:Current liabilities 6,112.4 7,405.7 Noncurrent liabilities 6,155.3 4,947.3
Total liabilities 12,267.7 12,353.0
Net assets:Invested in capital assets, net ofrelated debt
4,475.1 4,492.6
Restricted 17,197.0 20,377.6 Unrestricted 2,353.2 2,747.4
Net assets 24,025.3 27,617.6
Liabilities and net assets $ 36,293.0 39,970.6
Must
Equal

11
FINANCIAL STATEMENTS – SRECNA
U. T. System Office of the Controller
SRECNA:Of the three primary financial statements, the Statement of Revenues, Expenses and Changes in Net Assets is the most detailed statement. The statement is presented as “Exhibit B” in the completed report.
To determine exactly what is reported in the statement, let’s dissect the statement’s title:
Statement of [REVENUES] [EXPENSES] and [CHANGES] in [NET ASSETS]
Statement of Revenues,
Expenses, and Changes in Net
Assets
NetAssets

12
FINANCIAL STATEMENTS – SRECNA (CONTINUED)
U. T. System Office of the Controller
As discussed earlier, the SRECNA reports activity for the year. After the statement’s title, the reporting time frame of the statement is identified:
For the Year Ended August 31, 20XX
So, we can conclude that this statement reports activity (in‐flows or Revenues, out‐flows or Expenses, and the impact on net assets) for all funds for the fiscal year September 1, 20XX through August 31, 20XX.

13
FINANCIAL STATEMENTS – SRECNA (CONTINUED)
U. T. System Office of the Controller
Changes in Net Assets
Operating ExpensesNonoperating ExpensesTransfer Out
Operating RevenuesNonoperating RevenuesTransfer In

14
FINANCIAL STATEMENTS – SRECNA
Statement Layout:
The SRECNA is presented in columnar form and all the fund groups are collapsed. The statement is divided into the following sections:
• Operating Revenues• Operating Expenses• Nonoperating Revenues
(Expenses)• Other Revenues, Expenses,
Gains/(Losses) and Transfers (not labeled)
• Net Assets
U. T. System Office of the Controller
The University of Texas System ‐ SRECNA
($ in millions)
Current Year
Prior Year
Operating revenues:
Net student tuition and fees $1,104.3 1,024.0
Sponsored programs2,517.0 2,408.8
Net patient care revenues4,123.0 3,999.3
Net auxiliary enterprises372.3 342.1
Other447.6 389.1
Total operating revenues8,564.2 8,163.3
Total operating expenses(11,775.2) (11,015.7)
Operating loss(3,211.0) (2,852.4)
Nonoperating revenues (expenses):
State appropriations2,115.0 1,956.7
Nonexchange Sponsored Programs189.1 ‐
Gift contributions289.6 368.8
Net investment income (loss) (1,304.9) 1,648.3
Net inc. (dec.) in fair value of investments(1,332.9) (1,880.6)
Interest expense on capital asset financings(158.9) (161.7)
Net other nonoperating revenues (expenses)26.9 (28.9)
Income before other revenues, expenses, gains or losses
(3,387.1) (949.8)
Capital appropriations – Higher EducationAssistance Fund (HEAF)
17.5 17.1 Capital gifts and grants, additions to permanentendowments and extraordinary items
165.4 338.7 Net Transfers to other State entities
(388.1) (138.0)Change in net assets
(3,592.3) (732.0)
Net assets, beginning of the year27,617.6 28,349.6
Net assets, end of the year $24,025.3 27,617.6

15
STATEMENT OF REVENUES, EXPENSES, ANDCHANGES IN NET ASSETS
U. T. System Office of the Controller
Beginning Net Assets (Restated)
Operating Revenues
Operating Expenses
NonoperatingRevenue and Expenses
TransfersEnding Net Assets
+ or ‐Net Increase (Decrease)
for the Fiscal Year
==
+ or -
-

16
FINANCIAL STATEMENTS ‐ STATEMENT OFCASH FLOWS
U. T. System Office of the Controller
Statement of Cash Flows:
The final statement of the three principal financial statements we will examine is the Statement of Cash Flows. This statement is presented as “Exhibit C” in the completed report.
As discussed earlier, this statement also reports activity for the year. After the statement’s title, the reporting time frame of the statement is identified:
For the Year Ended August 31, 20XX
So, we can conclude that this statement reports the major sources and uses of cash. The reporting period includes the fiscal year 9/1/20XX through 8/31/20XX.
Statement of Cash flows

17
FINANCIAL STATEMENTS ‐ STATEMENT OFCASH FLOWS (CONTINUED)
Statement Layout:The Statement of Cash Flows is presented in the following sections:
• Cash Flows from Operating Activities• Cash Flows from Noncapital Financial
Activities• Cash Flows from Capital and Related
Financing Activities• Cash Flows from Investing Activities• Net Change in Cash and Cash
Equivalents• Reconciliation of Operating Revenues
(Expenses) to Net Cash Provided (Used) by Operating Activities (not illustrated)
The objective of this statement is to show the changes in the cash and cash equivalents that occurred throughout the fiscal year. To accomplish this objective, the statement first tells the reader the major sources and uses of cash by activity.
U. T. System Office of the Controller
The University of Texas System ‐ Cash Flows
($ in millions)
Current Year
Prior Year
Cash flows:
Cash received from operations $ 8,816.8 8,237.9 Cash expended for operations (10,731.3) (9,940.5)Net cash used in operating activities (1,914.5) (1,702.6)
Net cash provided by noncapital financing activities 2,398.8 2,067.3 Net cash used in capital and related financing activities
(790.3) (758.0)Net cash (used in)/provided by investing activities 706.4 456.0 Net (decrease)/increase in cash and cash equivalents
400.4 62.7 Cash and cash equivalents, beginning of year 1,944.3 1,881.6 Cash and cash equivalents, end of year $ 2,344.7 1,944.3

18
FINANCIAL STATEMENTS ‐ STATEMENT OFCASH FLOWS (CONTINUED)
Statement Layout (continued):
Next, the change in cash is computed based upon the sources (inflows) and uses (outflows) of cash throughout the year. This change in cash is used to determine the amount of cash and cash equivalents at year end.
Then a reconciliation of net operating revenues (expenses) to net cash provided (used) by operating activities is performed.
A list of non‐cash transaction that do not impact the inflows and outflows of cash is provided at the bottom of the statement.
U. T. System Office of the Controller
The University of Texas System ‐ Cash Flows (Continued)
($ in millions)
Current Year
Prior Year
Reconciliation of Net Operating Revenues (Expenses) toNet Cash Provided (Used) by Operating Activities:
Operating Loss $ (3,211.0) (2,852.4)Adjustments to Reconcile Operating Loss to Net Cash:
Depreciation, Impairment, and Bad Debt Expense 1,018.7 920.3 Op. Income & Cash Flow Categories Classification
Differences (66.3) ‐Changes in Assets and Liabilities 344.1 229.5
Total Adjustments 1,296.5 1,149.8 Net Cash Provided (Used) by Operating Activities: $ (1,914.5) (1,702.6)
Noncash Transactions:
Net Increase (Decrease) in Fair Value of Investments (1,332.9) (1,880.6)Donated Capital Assets 20.7 72.5 Capital Assets Acquired Under Capital Lease Purchases 0.5 3.5 Miscellaneous Noncash Transactions 9.2 (23.9)

19
FINANCIAL STATEMENTS
U. T. System Office of the Controller
Interrelated Elements:
The Annual Financial Report consists of numerous schedules and statements that are interrelated. The scope of this presentation is limited to three primary statements; the explanation of interrelated elements will also be limited to these three statements.

20
FINANCIAL STATEMENTS (CONTINUED)
U. T. System Office of the Controller
Balance Sheet – The sum of cash and cash equivalents (unrestricted and restricted) reported as both current and non‐current assets must equal the cash and cash equivalents at year end on the Statement of Cash Flows.
The University of Texas System ‐ Balance Sheet
($ in millions)Current Year
Prior Year
Assets:Cash and cash equivalents $ 2,344.7 1,944.3 Current assets 2,660.5 3,316.6 Noncurrent investments 20,890.2 25,127.9 Other noncurrent assets 266.9 281.7 Capital assets, net 10,130.7 9,300.1
Total assets 36,293.0 39,970.6
Liabilities:Current liabilities 6,112.4 7,405.7 Noncurrent liabilities 6,155.3 4,947.3
Total liabilities 12,267.7 12,353.0
Net assets:Invested in capital assets, net ofrelated debt
4,475.1 4,492.6
Restricted 17,197.0 20,377.6 Unrestricted 2,353.2 2,747.4
Net assets 24,025.3 27,617.6
Liabilities and net assets $ 36,293.0 39,970.6
The University of Texas System ‐ Cash Flows
($ in millions)Current Year
Prior Year
Cash flows:Cash received from operations $ 8,816.8 8,237.9 Cash expended for operations (10,731.3) (9,940.5)Net cash used in operating activities (1,914.5) (1,702.6)
Net cash provided by noncapital financing activities 2,398.8 2,067.3 Net cash used in capital and related financing activities
(790.3) (758.0)Net cash (used in)/provided by investing activities 706.4 456.0 Net (decrease)/increase in cash and cash equivalents
400.4 62.7 Cash and cash equivalents, beginning of year 1,944.3 1,881.6 Cash and cash equivalents, end of year $ 2,344.7 1,944.3

21
FINANCIAL STATEMENTS (CONTINUED)
U. T. System Office of the Controller
Interrelated Elements:The ending net assets from the SRECNA must agree to the ending net assets reported on the balance sheet.
The University of Texas System ‐ SRECNA
($ in millions)
Current Year
Prior Year
Operating revenues:
Net student tuition and fees $ 1,104.3 1,024.0 Sponsored programs 2,517.0 2,408.8 Net patient care revenues 4,123.0 3,999.3 Net auxiliary enterprises 372.3 342.1 Other
447.6 389.1 Total operating revenues 8,564.2 8,163.3 Total operating expenses
(11,775.2) (11,015.7)Operating loss (3,211.0) (2,852.4)
Nonoperating revenues (expenses):
State appropriations 2,115.0 1,956.7 Nonexchange Sponsored Programs 189.1 ‐Gift contributions 289.6 368.8 Net investment income (loss) (1,304.9) 1,648.3 Net inc. (dec.) in fair value of investments (1,332.9) (1,880.6)Interest expense on capital asset financings (158.9) (161.7)Net other nonoperating revenues (expenses)
26.9 (28.9)Income before other revenues, expenses, gains or losses
(3,387.1) (949.8)
Capital appropriations – Higher EducationAssistance Fund (HEAF) 17.5 17.1
Capital gifts and grants, additions to permanentendowments and extraordinary items 165.4 338.7
Net Transfers to other State entities(388.1) (138.0)
Change in net assets(3,592.3) (732.0)
Net assets, beginning of the year27,617.6 28,349.6
Net assets, end of the year $24,025.3 27,617.6
The University of Texas System ‐ Balance Sheet
($ in millions)Current Year
Prior Year
Assets:Cash and cash equivalents $ 2,344.7 1,944.3 Current assets 2,660.5 3,316.6 Noncurrent investments 20,890.2 25,127.9 Other noncurrent assets 266.9 281.7 Capital assets, net 10,130.7 9,300.1
Total assets 36,293.0 39,970.6
Liabilities:Current liabilities 6,112.4 7,405.7 Noncurrent liabilities 6,155.3 4,947.3
Total liabilities 12,267.7 12,353.0
Net assets:Invested in capital assets, net ofrelated debt
4,475.1 4,492.6
Restricted 17,197.0 20,377.6 Unrestricted 2,353.2 2,747.4
Net assets 24,025.3 27,617.6
Liabilities and net assets $ 36,293.0 39,970.6

22
FINANCIAL STATEMENTS (CONTINUED)
U. T. System Office of the Controller
A reader can look at the Balance Sheet and determine the amount of the net assets for each fund group. However, if the reader wants to analyze the changes in the net assets since the last reporting period, they should look at the SRECNA.
The University of Texas System ‐ Balance Sheet
($ in millions)Current Year
Prior Year
Assets:Cash and cash equivalents $ 2,344.7 1,944.3 Current assets 2,660.5 3,316.6 Noncurrent investments 20,890.2 25,127.9 Other noncurrent assets 266.9 281.7 Capital assets, net 10,130.7 9,300.1
Total assets 36,293.0 39,970.6
Liabilities:Current liabilities 6,112.4 7,405.7 Noncurrent liabilities 6,155.3 4,947.3
Total liabilities 12,267.7 12,353.0
Net assets:Invested in capital assets, net ofrelated debt
4,475.1 4,492.6
Restricted 17,197.0 20,377.6 Unrestricted 2,353.2 2,747.4
Net assets 24,025.3 27,617.6
Liabilities and net assets $ 36,293.0 39,970.6
The University of Texas System ‐ SRECNA
($ in millions)
Current Year
Prior Year
Operating revenues:
Net student tuition and fees $1,104.3 1,024.0
Sponsored programs2,517.0 2,408.8
Net patient care revenues4,123.0 3,999.3
Net auxiliary enterprises372.3 342.1
Other447.6 389.1
Total operating revenues8,564.2 8,163.3
Total operating expenses(11,775.2) (11,015.7)
Operating loss(3,211.0) (2,852.4)
Nonoperating revenues (expenses):
State appropriations2,115.0 1,956.7
Nonexchange Sponsored Programs189.1 ‐
Gift contributions289.6 368.8
Net investment income (loss) (1,304.9) 1,648.3
Net inc. (dec.) in fair value of investments(1,332.9) (1,880.6)
Interest expense on capital asset financings(158.9) (161.7)
Net other nonoperating revenues (expenses)26.9 (28.9)
Income before other revenues, expenses, gains or losses
(3,387.1) (949.8)
Capital appropriations – Higher EducationAssistance Fund (HEAF)
17.5 17.1 Capital gifts and grants, additions to permanentendowments and extraordinary items
165.4 338.7 Net Transfers to other State entities
(388.1) (138.0)Change in net assets
(3,592.3) (732.0)
Net assets, beginning of the year27,617.6 28,349.6
Net assets, end of the year $24,025.3 27,617.6

23
FINANCIAL STATEMENTS (CONTINUED)
U. T. System Office of the Controller
Interrelated Elements: The SRECNA is also interrelated with the Statement of Cash Flows. Total operating income (loss), as well as depreciation and amortization expense, flows to the reconciliation section of the Statement of Cash Flows.
The University of Texas System ‐ SRECNA
($ in millions)
Current Year
Prior Year
Operating revenues:
Net student tuition and fees $ 1,104.3 1,024.0 Sponsored programs 2,517.0 2,408.8 Net patient care revenues 4,123.0 3,999.3 Net auxiliary enterprises 372.3 342.1 Other
447.6 389.1 Total operating revenues 8,564.2 8,163.3 Total operating expenses
(11,775.2) (11,015.7)Operating loss (3,211.0) (2,852.4)
Nonoperating revenues (expenses):
State appropriations 2,115.0 1,956.7 Nonexchange Sponsored Programs 189.1 ‐Gift contributions 289.6 368.8 Net investment income (loss) (1,304.9) 1,648.3 Net inc. (dec.) in fair value of investments (1,332.9) (1,880.6)Interest expense on capital asset financings (158.9) (161.7)Net other nonoperating revenues (expenses)
26.9 (28.9)Income before other revenues, expenses, gains or losses
(3,387.1) (949.8)
Capital appropriations – Higher EducationAssistance Fund (HEAF)
17.5 17.1 Capital gifts and grants, additions to permanentendowments and extraordinary items
165.4 338.7 Net Transfers to other State entities
(388.1) (138.0)Change in net assets
(3,592.3) (732.0)
Net assets, beginning of the year27,617.6 28,349.6
Net assets, end of the year $24,025.3 27,617.6
The University of Texas System ‐ Cash Flows
($ in millions)Current Year
Prior Year
Cash flows:Cash received from operations $ 8,816.8 8,237.9 Cash expended for operations (10,731.3) (9,940.5)Net cash used in operating activities (1,914.5) (1,702.6)
Net cash provided by noncapital financing activities 2,398.8 2,067.3 Net cash used in capital and related financing activities
(790.3) (758.0)Net cash (used in)/provided by investing activities 706.4 456.0 Net (decrease)/increase in cash and cash equivalents
400.4 62.7 Cash and cash equivalents, beginning of year 1,944.3 1,881.6 Cash and cash equivalents, end of year $ 2,344.7 1,944.3 Reconciliation of Net Operating Revenues (Expenses) to
Net Cash Provided (Used) by Operating Activities:Operating Loss $ (3,211.0) (2,852.4)Adjustments to Reconcile Operating Loss to Net Cash:
Depreciation, Impairment, and Bad Debt Expense 1,018.7 920.3 Op. Income & Cash Flow Categories Classification
Differences (66.3) ‐Changes in Assets and Liabilities 344.1 229.5
Total Adjustments 1,296.5 1,149.8 Net Cash Provided (Used) by Operating Activities: $ (1,914.5) (1,702.6)

24
FINANCIAL STATEMENTS (CONTINUED)
Preparation of the Annual Financial Report
The Texas Education Code requires U. T. System to submit the Consolidated Primary Financial Statements to the Texas State Comptroller’s Office each fiscal year. The Financial Reporting division of the Office of the Controller at U. T. System Administration consolidates the individual institution annual reports into the consolidated Systemwidereport. The Financial Reporting division also acts as a liaison to the Texas Comptroller of Pubic Accounts regarding reporting changes or questions concerning the preparation of the report.
The Financial Reporting staff assists the institutions in preparation of their reports by conducting the AFR workshop. Each year, employees from the U. T. institutions who are responsible for preparing the institution’s annual financial report are invited to attend a meeting or videoconference to discuss topics relevant to the preparation process.
U. T. System Office of the Controller

25
FINANCIAL STATEMENTS (CONTINUED)
Preparation of the Annual Financial Report (continued)
After August 31st, the close of the fiscal year, institution employees prepare all annual report financial statements and supporting schedules for their institution; then they forward a copy to U. T. System Administration. The Financial Reporting staff review these reports primarily to determine if the principal statements and the supporting schedules tie appropriately. Any inconsistencies are communicated to the appropriate person at the institution, and revisions or corrections are made by the institution as necessary.
The Financial Reporting staff also examines any significant fluctuations in account balances from one year to the next. If an account balance changes between two years by a large percentage, the Financial Reporting staff asks the institution’s staff to investigate the reason for the significant change. The main purpose of this verification is to detect possible reporting errors. State auditors and the Comptroller’s Office also request fluctuation analysis for significant line items.
U. T. System Office of the Controller

26
FINANCIAL STATEMENTS (CONTINUED)
Preparation of the Annual Financial Report (continued)
When the institution completes all revisions, they begin work on preparing a final “print‐ready” copy of their report. It is sent to the Financial Reporting division, which coordinates printing of the individual institution’s Annual Financial Report. Meanwhile, the Financial Reporting staff is also charged with the task of consolidating the principal (or primary) statements of all institutions and producing the Consolidated Primary Financial Statements.
The Consolidated Financial Statements are forwarded to the Texas State Comptroller’s office, which consolidates this financial information into the CAFR.
U. T. System Office of the Controller

27
FINANCIAL STATEMENTS (CONTINUED)
U. T. System Office of the Controller
U. T. Arlington
AFR
U. T.AustinAFR
U. T.Anywhere
AFR
U. T. System Administration
ConsolidatedAnnualReport
Texas State Comptroller
Institutions

28
FINANCIAL STATEMENTS (CONTINUED)
U. T. System Office of the Controller
Texas Lottery Commission
Texas Water Development
Board
U. T. System
TDCJ InstitutionsDivision
ComprehensiveAnnualFinancialReport(CAFR)
PrimaryExhibits
A Schedules
B Schedules
C Schedules
D Schedules
S Schedules
Proprietary Funds

29
FINANCIAL STATEMENTS (CONTINUED)
The reporting objectives discussed above are set forth in the:
GASB (Governmental Accounting Standards Board) Statements and Interpretations
NACUBO (National Association of College and University Business Officers) Financial Account and Reporting Manual for Higher Education
AICPA (American Institute of Certified Public Accountants) Audits of Colleges and Universities
Texas State Comptroller of Pubic Accounts’ Annual Financial Reporting Requirements for Colleges and Universities
These publications were developed to increase uniformity and adequate disclosure in institutional accounting and reporting practices. They are the primary authoritative guidance for the preparation of the U. T. System’s financial statements.
U. T. System Office of the Controller

30
FINANCIAL STATEMENTS (CONTINUED)
The Annual Financial Report for the entire U. T. System is prepared in accordance with Generally Accepted Accounting Principles (GAAP) and the Texas State Comptroller’s guidelines.
A number of people rely on U. T. System’s financial reports.
The Legislative Budget Board uses the Legislative Appropriations Request report to recommend budget cuts (or enhancements) to the legislators.
The Board of Regents and investment managers rely on various financial reports to make important planning decisions, like whether or not the U. T. System can afford to issue more bonds.
U. T. System Office of the Controller

31
FINANCIAL STATEMENTS (CONTINUED)
Various managers use the reports to determine if there are enough resources available to fund operations for the fiscal year.
The reports influence the decisions made at every level of management throughout the U. T. System. Accurate, reliable information will facilitate sound management decisions.
U. T. System Office of the Controller

32
CONCLUSION
U. T. System Office of the Controller
You have completed the Fund Accounting Training. Exit the training by clicking the link below and access the exam.
http://www.utsystem.edu/cont/training.html


