ORIGINAL ARTICLE
Genetic seascape of the threatened Caribbean elkhorncoral, Acropora palmata, on the Puerto Rico ShelfPascal M�ege1, Nikolaos V. Schizas2, Joselyd Garcia Reyes2 & Tomas Hrbek1,3
1 Department of Biology, University of Puerto Rico-R�ıo Piedras, San Juan, Puerto Rico
2 Department of Marine Sciences, University of Puerto Rico-Mayag€uez, Mayag€uez, Puerto Rico
3 Laborat�orio de Evoluc�~ao e Gen�etica Animal, Universidade Federal do Amazonas, Manaus, Brazil
Keywords
Acropora palmata; isolation by distance;
microsatellite; population structure; Puerto
Rico; reduced major axis regression.
Correspondence
Pascal M�ege, Department of Biology,
University of Puerto Rico-R�ıo Piedras, San
Juan, Puerto Rico.
E-mail: [email protected]
Accepted: 22 November 2013
doi: 10.1111/maec.12135
Abstract
It has been proposed that the elkhorn coral Acropora palmata is genetically sep-
arated into two distinct provinces in the Caribbean, an eastern and a western
population admixing in Western Puerto Rico and around the Mona Passage.
In this study, the genetic structure of A. palmata sampled at 11 Puerto Rican
localities and localities from Curac�ao, the Bahamas and Guadeloupe were
examined. Analyses using five microsatellite markers showed that 75% of sam-
pled colonies had unique genotypes, the rest being clone mates. Genetic diver-
sity among genets was high (HE = 0.761) and consistent across localities
(0.685–0.844). FST ranged from �0.011 to 0.047, supporting low but significant
genetic differentiation between localities within the previously reported eastern
and western genetic provinces. Plots of genetic per geographic distances and
significant Mantel tests supported isolation-by-distance (IBD) within Puerto
Rico. Analysis with the software STRUCTURE favored a scenario with weak
differentiation between two populations, assigning Eastern Puerto Rican loca-
tions (Fajardo and Culebra), Guadeloupe and Curac�ao to the Caribbean east-
ern population and Western Puerto Rican locations (west of Vega Baja and
Ponce), Mona and the Bahamas to the Caribbean western population. Vieques
and San Juan area harbored admixed profiles. Standardized FST per 1000 km
unit further supported higher differentiation between localities belonging to
different STRUCTURE populations, with IBD being stronger within Puerto
Rico than on larger regional scales. This stronger genetic transition seems to
separate localities between putative eastern and western provinces in the East-
ern Puerto Rican region, but not around the Mona Passage.
Introduction
Genetic diversity and structure in scleractinian corals vary
significantly, reflecting the evolutionary differences between
species, but also the type of genetic markers employed, mi-
crosatellite markers being more successful at detecting weak
genetic structure than mitochondrial markers, ITS or allo-
zymes (Palumbi 2003; Vollmer & Palumbi 2004; Van Op-
pen & Gates 2006). Interestingly, even related species with
similar life histories and dispersal potentials may exhibit
different population structure (Severance & Karl 2006;
Hemond & Vollmer 2010). With a few exceptions (Benzie
et al. 1995; Ayre & Hughes 2000), panmixia is generally
observed within small distances (tens of kilometers; Ng &
Morton 2003; Magalon et al. 2005), where connectivity is
assured over one-generation spawning events (Palumbi
2003). In contrast, varying patterns of genetic structuring
are generally the rule over larger geographic distances and
are characterized by a combination of discrete populations
with isolation-by-distance (IBD, MacKenzie et al. 2004;
Maier et al. 2005). Studies in the Caribbean are less numer-
ous than in the Indo-Pacific but have typically shown sig-
nificant genetic structuring, perhaps as a result of limited
gene flow (Vollmer & Palumbi 2007).
Marine Ecology 36 (2015) 195–209 ª 2014 Blackwell Verlag GmbH 195
Marine Ecology. ISSN 0173-9565
With over 100 species, Acropora is one of the most
broadly distributed coral genera (Wallace 1999; Veron &
Stafford-Smith 2000). Acropora species harbor diverse pat-
terns of genetic structuring (e.g. Benzie et al. 1995; Ayre &
Hughes 2000; MacKenzie et al. 2004; Baums et al. 2005b).
Despite the extreme diversity of acroporids in the Indo-
Pacific Ocean, there are only two species in the Caribbean,
Acropora palmata and Acropora cervicornis (Van Oppen
et al. 2000; Vollmer & Palumbi 2002). While molecular
data of A. cervicornis across the Caribbean has supported
significant genetic divergence between regions separated
by several hundreds of kilometers or more (e.g. Florida
versus the Bahamas versus Curac�ao), genetic differentia-
tion between reefs separated by a few kilometers is gener-
ally not significant, except when introgression of
Acropora palmata alleles is observed (Vollmer & Palumbi
2007; Garcia Reyes & Schizas 2010; Hemond & Vollmer
2010). On the other hand, such short-scale structure was
recently evidenced in A. cervicornis using spatial autocorre-
lation of nuclear and mtDNA data (Palumbi et al. 2012).
Microsatellite analysis of A. palmata sampled through-
out the Caribbean in STRUCTURE, a software that has
been widely used to find the number of biological popu-
lations in a given dataset (Evanno et al. 2005), suggested
that the species comprised an eastern and a western pop-
ulation (Baums et al. 2005b, 2006a,b). The population
break in the Southern Caribbean seemed to occur at the
Guajira Peninsula, Colombia, whereas in the Northern
Caribbean, the break was located around Puerto Rico.
Depending on the model used, Western Puerto Rican
localities either clustered with the western population or
presented admixed genotypes reminiscent of a hybrid
zone between populations (Baums et al. 2005b, 2006a),
suggesting that the Mona channel might act as a natural
filter in A. palmata, as was reported for several other
marine species (Colin 2003; Dennis et al. 2005; Galindo
et al. 2006; Taylor & Hellberg 2006; Andras et al. 2013).
Further genetic characterization of elkhorn corals
around Puerto Rico is necessary because it is unclear where
the two proposed populations stop or merge. Indeed, it is
debatable whether one can assume two well differentiated
biological populations based on STRUCTURE results, since
the existence of discrete populations is an implicit assump-
tion of STRUCTURE, which makes its use inadequate to
describe continuously distributed genetic differentiation
such as in the case of isolation-by-distance (Pritchard et al.
2000). Furthermore, only a few Puerto Rican reefs have
been studied and they only represented the west and south
coasts of the island (Baums et al. 2005b, 2006b). Addition-
ally, a detailed description of the genetic diversity and
structure of A. palmata in Puerto Rican reefs might
improve local management of the species, following the
example of the Tres Palmas Marine Reserve, implemented
in 2004 to protect elkhorn coral stands (Vald�es-Pizzini
et al. 2009). To obtain this much needed and improved
understanding of genetic structure on the Puerto Rico
Shelf, we sampled A. palmata around Puerto Rico by alter-
nating small geographic distances between reefs (few kilo-
meters) and moderate distances (tens of kilometers)
between neighboring reefs as recommended by Guillot
et al. (2009). Samples from the Bahamas, Curac�ao and
Guadeloupe were also included to represent distant reefs
(hundreds to thousands of kilometers), representing both
inferred populations of the eastern and western regions
(Baums et al. 2005b, 2006b). We assessed clonality and
genetic diversity within these reefs, and explored patterns
of IBD versus patterns of population structuring resulting
from the existence of discrete populations in the dataset.
Material and Methods
Sampling
Twenty-four reefs were located in Puerto Rico (including
Mona, Culebra and Vieques) (Fig. 1, Table 1). Special
effort was dedicated to (i) alternate small geographic dis-
tances (few kilometers) with moderate distances (tens of
kilometers) between reefs and (ii) select reefs from areas
all over the Puerto Rican archipelago in a comprehensive
design. The other six reefs represented samples from the
eastern (Curac�ao, Guadeloupe) and western populations
(the Bahamas). All samples were taken between 2006 and
2009 and were collected opportunistically (non-random-
ized pattern). Particular efforts were made to sample both
potential clone colonies (various ramets of a same genet)
and potentially different genotypes. Hence, for each reef
we sampled tissue from colonies within a 5-m radius
(likely to be clones) as well as colonies separated by tens
to hundreds of meters (unlikely to be clones). Whenever
possible, 20–50 colonies per reef were collected, preferen-
tially by snapping the tip of branches. Samples from 412
colonies were obtained, including 86 from Garcia Reyes
& Schizas (2010).
Molecular techniques
From each sample, 5–10 polyps were cut off and total
genomic DNA was extracted with the DNeasy Blood &
Tissue Kit (Qiagen, Valencia, CA, USA) following the
manufacturer’s animal tissue protocol. Each sample was
then screened for five polymorphic microsatellite markers,
following a modified protocol from Baums et al. (2005a).
The selected markers (#166, #181, #182, #192 and #207)
were the same as those used in Baums et al. (2005a,
2006a,b). PCR amplifications were done in 10-ll reac-
tions, containing 1 ll genomic DNA (5–15 ng�ll�1),
196 Marine Ecology 36 (2015) 195–209 ª 2014 Blackwell Verlag GmbH
Genetic seascape of threatened Caribbean elkhorn coral M�ege, Schizas, Garcia Reyes & Hrbek
0.8 mM dNTPs, 0.1 lM of forward primer with M13 tail,
0.1 lM of M13 fluorescently labeled with FAM (markers
#166 and #182) or HEX (markers #181, #192 and #207),
0.2 lM of reverse primer, MgCl2 (2 mM), 0.3 ll of
1 U�ll�1 Taq DNA polymerase (Fermentas, Vilnius,
Lithuania), and 19 of the PCR buffer. Temperature
cycling was performed by denaturing 1 min at 94 °C, fol-lowed by 20 cycles of 20 s at 94 °C, 35 s at 56 °C and
30 s at 72 °C, 15 cycles of 20 s at 94 °C, 35 s at 50 °Cand 30 s at 72 °C and a 10-min extension step at 72 °C.Amplicons were diluted up to 509 to approach 10–20 ng�ll�1, pooled whenever possible (#166 with #207 and
#182 with #192) and were run on an ABI3130xl Genetic
Analyzer with ROX-labeled size standards. Microsatellite
alleles were scored using the software GENEMAPPER� 4.0
(Applied Biosystems, Carlsbad, CA, USA).
Genetic diversity and structure
The probability of identity (PI) is the probability that
two genetically different samples have identical multilocus
genotypes given a set of genetic markers. Computation of
PI was performed in GENALEX 6.1 (Peakall & Smouse
2006). Identical multilocus genotypes were then consid-
ered ramets of the same genet (clones of a same geno-
type) with a confidence probability PI. All subsequent
analyses were performed by reducing the dataset to the
number of unique genets. Because ramets were repre-
sented by a single genet, the final dataset had no further
information on genotype frequency. Genetic indices of
diversity, tests of linkage disequilibrium (50,000 permuta-
tions), pairwise FST between localities (50,000 permuta-
tions) and Hardy–Weinberg disequilibrium (HWE,
10,000 burn-in, 1,000,000 permutations) were estimated
in ARLEQUIN 3.5 (Excoffier & Lischer 2010) and P-val-
ues were adjusted to control for false discovery rate
(FDR; Benjamini & Hochberg 1995) with the stats pack-
age in R (R Development Core Team 2010). FST was pre-
ferred to RST because it is a more suitable measure of
genetic distance between populations when the number
of markers is <20 (Gaggiotti et al. 1999). The number of
K populations was estimated in STRUCTURE 2.3.3
km0 250 500 1000
km0 5 10 20
0 20 40 80km
0 1 2 4km
LUI SON
PUN
PINESCCHASHA
TRE
CAJGUI
SAR
FOR
MAR
ELP
ATR
LAUMED TUR
ENR
LEE
CUR
GRA
POR
ANS
POI
Mona
RAT CAY
SUN PIRSEC
Rincón
Isabela Vega BajaSan Juan area
FajardoCulebra
ViequesPonce
Guánica
Lajas
The Bahamas
Curaçao
Guadeloupe
PUERTO RICO
N
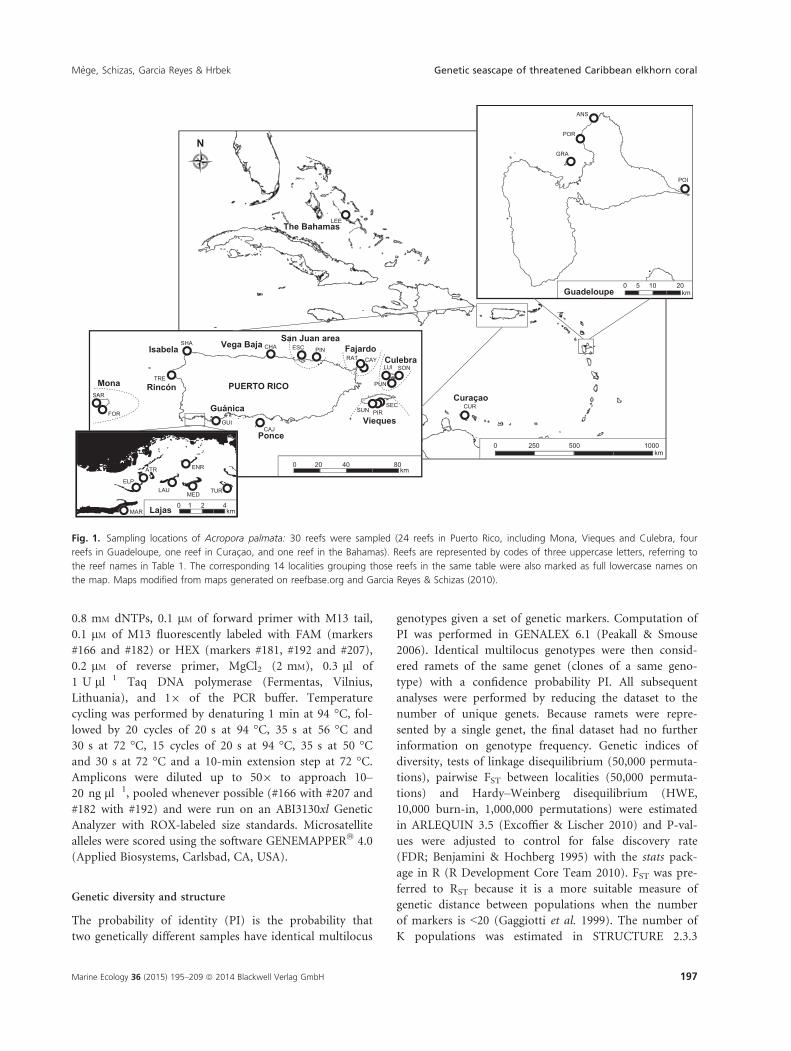
Fig. 1. Sampling locations of Acropora palmata: 30 reefs were sampled (24 reefs in Puerto Rico, including Mona, Vieques and Culebra, four
reefs in Guadeloupe, one reef in Curac�ao, and one reef in the Bahamas). Reefs are represented by codes of three uppercase letters, referring to
the reef names in Table 1. The corresponding 14 localities grouping those reefs in the same table were also marked as full lowercase names on
the map. Maps modified from maps generated on reefbase.org and Garcia Reyes & Schizas (2010).
Marine Ecology 36 (2015) 195–209 ª 2014 Blackwell Verlag GmbH 197
M�ege, Schizas, Garcia Reyes & Hrbek Genetic seascape of threatened Caribbean elkhorn coral
(Pritchard et al. 2000; Hubisz et al. 2009) and repeated
10 times for each value of K, ranging from K = 1 to
K = 5. Using the FullSearch algorithm in CLUMPP 1.1.2
we permuted the independent replicate runs (Jakobsson
& Rosenberg 2007). The mean of the permuted matrices
across replicates was visualized in DISTRUCT 1.1 (Rosen-
berg 2004). To find the number of discrete populations
in the dataset, we used STRUCTURE under three differ-
ent models. The model ADM used only allelic informa-
tion to find population structure. In contrast, the model
POPINFO added a priori population assignments for
some individuals to assign the remaining individuals to
the a priori populations. Finally, the LOCPRIOR model
enabled the incorporation of the sampling locations as a
priori information. While these analyses were performed
assuming 14 sampling localities (see Table 1), analyses
were also repeated using the alternate ‘reef’, ‘region’ and
‘island’ grouping for the LOCPRIOR model. STRUC-
TURE analyses, including the different methods to select
the number of populations K that best describe the
dataset, are further detailed in the Supporting Informa-
tion (Data S1 and accompanying Figs S1 and S2). A
matrix of genetic distances FST/(1�FST) was generated
and tested against the geographic distance matrix to
explore IBD patterns. Reflecting the short pelagic life of
their larvae, Acropora palmata populations seem to be lar-
gely self-recruiting, and connectivity across large distances
seems to approximate a rather one-dimensional path fol-
lowing shallow water habitats (Baums et al. 2006b), in
particular along the Lesser Antilles. Hence we generated a
geographic distance matrix based on the shortest shallow
nautical (SSN) distances in Google EARTH 6.2.1.6014 at
the 1,000,000:1 scale. Alternatively, another matrix based
on the shortest nautical (SN) distances was constructed
to explore IBD patterns involving direct connectivity, in
particular for distant reefs such as the Bahamas, Guade-
loupe and Curac�ao. Matrices are appended in Table S1.
Significance of IBD patterns was tested with Mantel tests
(30,000 permutations) and reduced major axis (RMA)
regressions were used to estimate the strength of genetic
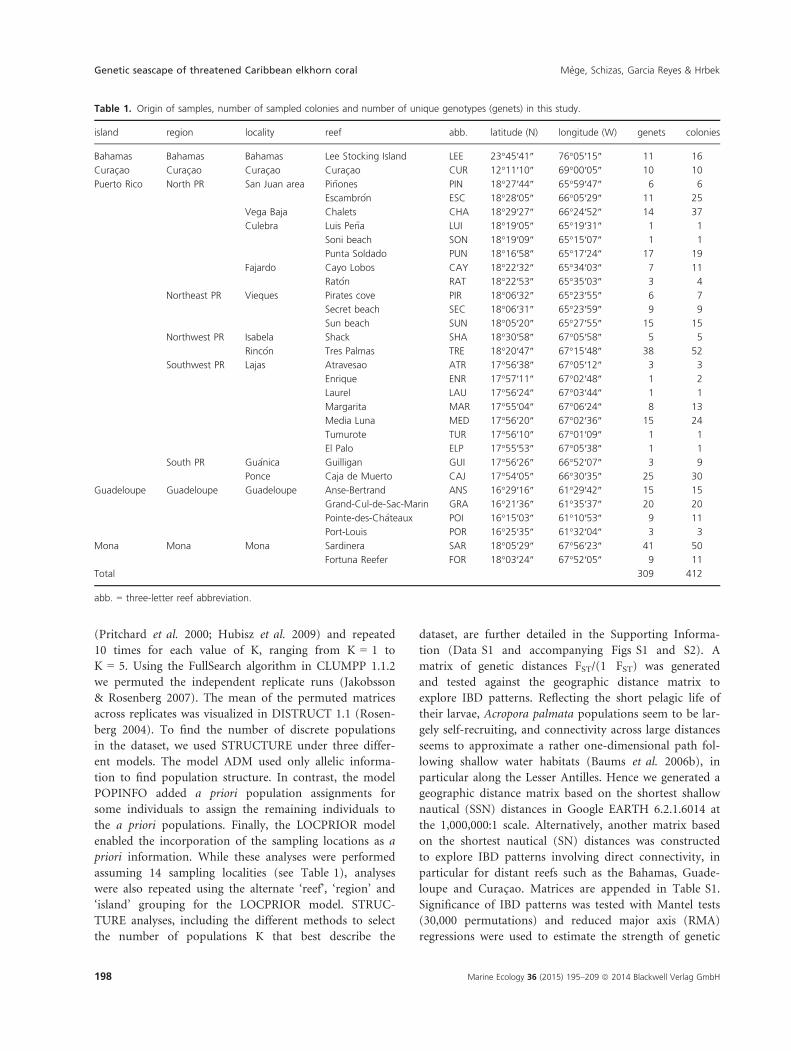
Table 1. Origin of samples, number of sampled colonies and number of unique genotypes (genets) in this study.
island region locality reef abb. latitude (N) longitude (W) genets colonies
Bahamas Bahamas Bahamas Lee Stocking Island LEE 23°45′41″ 76°05′15″ 11 16
Curac�ao Curac�ao Curac�ao Curac�ao CUR 12°11′10″ 69°00′05″ 10 10
Puerto Rico North PR San Juan area Pi~nones PIN 18°27′44″ 65°59′47″ 6 6
Escambr�on ESC 18°28′05″ 66°05′29″ 11 25
Vega Baja Chalets CHA 18°29′27″ 66°24′52″ 14 37
Culebra Luis Pe~na LUI 18°19′05″ 65°19′31″ 1 1
Soni beach SON 18°19′09″ 65°15′07″ 1 1
Punta Soldado PUN 18°16′58″ 65°17′24″ 17 19
Fajardo Cayo Lobos CAY 18°22′32″ 65°34′03″ 7 11
Rat�on RAT 18°22′53″ 65°35′03″ 3 4
Northeast PR Vieques Pirates cove PIR 18°06′32″ 65°23′55″ 6 7
Secret beach SEC 18°06′31″ 65°23′59″ 9 9
Sun beach SUN 18°05′20″ 65°27′55″ 15 15
Northwest PR Isabela Shack SHA 18°30′58″ 67°05′58″ 5 5
Rinc�on Tres Palmas TRE 18°20′47″ 67°15′48″ 38 52
Southwest PR Lajas Atravesao ATR 17°56′38″ 67°05′12″ 3 3
Enrique ENR 17°57′11″ 67°02′48″ 1 2
Laurel LAU 17°56′24″ 67°03′44″ 1 1
Margarita MAR 17°55′04″ 67°06′24″ 8 13
Media Luna MED 17°56′20″ 67°02′36″ 15 24
Tumurote TUR 17°56′10″ 67°01′09″ 1 1
El Palo ELP 17°55′53″ 67°05′38″ 1 1
South PR Gu�anica Guilligan GUI 17°56′26″ 66°52′07″ 3 9
Ponce Caja de Muerto CAJ 17°54′05″ 66°30′35″ 25 30
Guadeloupe Guadeloupe Guadeloupe Anse-Bertrand ANS 16°29′16″ 61°29′42″ 15 15
Grand-Cul-de-Sac-Marin GRA 16°21′36″ 61°35′37″ 20 20
Pointe-des-Chateaux POI 16°15′03″ 61°10′53″ 9 11
Port-Louis POR 16°25′35″ 61°32′04″ 3 3
Mona Mona Mona Sardinera SAR 18°05′29″ 67°56′23″ 41 50
Fortuna Reefer FOR 18°03′24″ 67°52′05″ 9 11
Total 309 412
abb. = three-letter reef abbreviation.
198 Marine Ecology 36 (2015) 195–209 ª 2014 Blackwell Verlag GmbH
Genetic seascape of threatened Caribbean elkhorn coral M�ege, Schizas, Garcia Reyes & Hrbek
differentiation (RMA slope, jackknife 95% CI). Because
the data are only known with error, RMA was favored
over ordinary least-square regression (Hellberg 1994;
Jensen et al. 2005). Mantel tests and RMA calculations
were performed in IBDWS (Jensen et al. 2005) by com-
paring the matrix of pairwise Slatkin’s FST (FST/1�FST)
with the geographic distance matrices after setting genetic
distances of <0–0. A log10 transformation was applied to
the SN matrix to account for bi-dimensionality (Slatkin
1993; Rousset 1997). On the other hand, connectivity
between distant reefs in the SSN matrix was rather one-
dimensional since it followed shallow water habitats
(from one island to the next) and thus no logarithmic
transformation was applied to the SSN matrix (Rousset
1997). Comparisons were first made with all studied
localities but because some populations had fewer indi-
viduals (n < 15), part of the observed patterns were not
highly supported (Cornuet et al. 1999). As a balance
between improved statistical confidence and data loss, the
results were compared again by including only localities
with a certain minimum of different genotypes (n = 15,
n = 20 and n = 30). When the data could not be shaped
into a usable matrix for IBDWS, RMA for JAVA (Boho-
nak & Van Der Linde 2004) was used instead (one-delete
jackknife with 30,000 bootstraps for 95% CI), as was the
case for RMA calculations excluding within-Puerto Rico
pair-wise comparisons or to obtain the regression slopes
between a specific location (Mona or Culebra) and main-
land Puerto Rico.
Results
Clonality and genetic diversity
Based on our dataset, the probability for two genetically
different samples to have identical multilocus genotypes
by chance (PI) using the five microsatellite markers was
approximately 1.48 9 10�7, which closely matched the
approximately 1.5 9 10�7 estimate in Baums et al.
(2005b, 2006a). Therefore, it was a reasonable assumption
that identical genotypes represented biological clones. We
identified 309 unique microsatellite multilocus genotypes
(genets; 75%) and an additional 103 clones (25.0%) from
a total of 412 colonies (Table 1). To avoid artificial, mis-
leading signals resulting from the presence of those clones
in our dataset, the remaining analyses, including esti-
mates of genetic diversity and population structure, were
based on the 309 unique genets identified in this study.
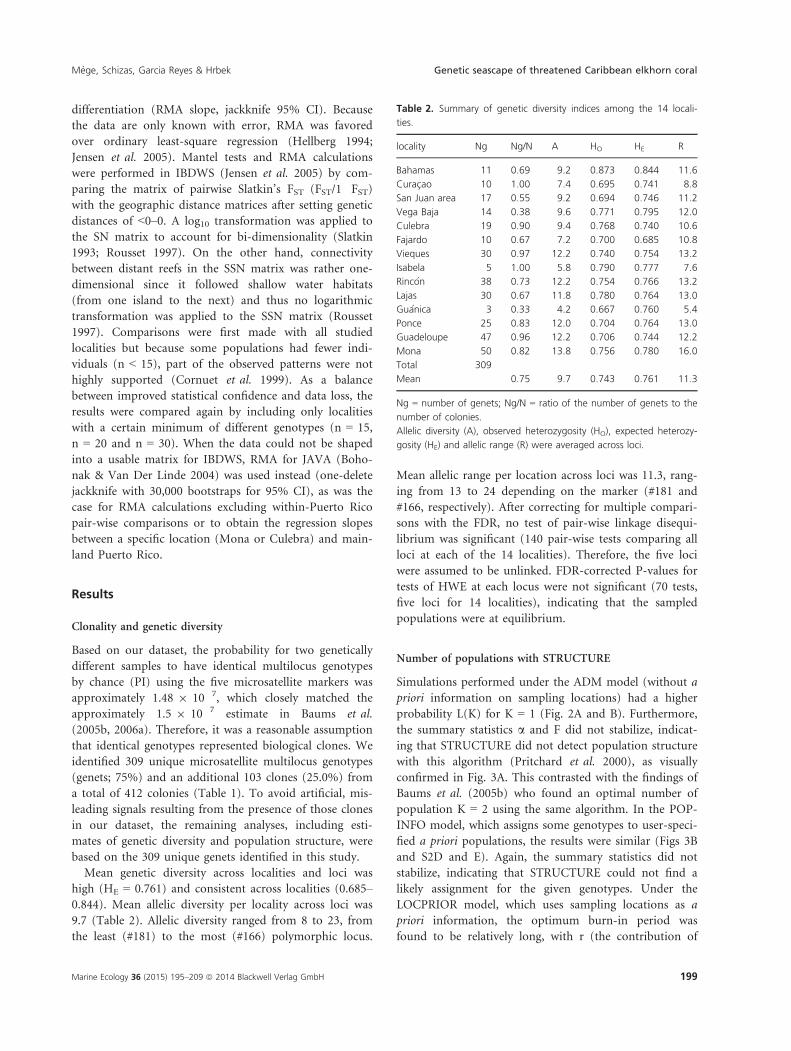
Mean genetic diversity across localities and loci was
high (HE = 0.761) and consistent across localities (0.685–0.844). Mean allelic diversity per locality across loci was
9.7 (Table 2). Allelic diversity ranged from 8 to 23, from
the least (#181) to the most (#166) polymorphic locus.
Mean allelic range per location across loci was 11.3, rang-
ing from 13 to 24 depending on the marker (#181 and
#166, respectively). After correcting for multiple compari-
sons with the FDR, no test of pair-wise linkage disequi-
librium was significant (140 pair-wise tests comparing all
loci at each of the 14 localities). Therefore, the five loci
were assumed to be unlinked. FDR-corrected P-values for
tests of HWE at each locus were not significant (70 tests,
five loci for 14 localities), indicating that the sampled
populations were at equilibrium.
Number of populations with STRUCTURE
Simulations performed under the ADM model (without a
priori information on sampling locations) had a higher
probability L(K) for K = 1 (Fig. 2A and B). Furthermore,
the summary statistics a and F did not stabilize, indicat-
ing that STRUCTURE did not detect population structure
with this algorithm (Pritchard et al. 2000), as visually
confirmed in Fig. 3A. This contrasted with the findings of
Baums et al. (2005b) who found an optimal number of
population K = 2 using the same algorithm. In the POP-
INFO model, which assigns some genotypes to user-speci-
fied a priori populations, the results were similar (Figs 3B
and S2D and E). Again, the summary statistics did not
stabilize, indicating that STRUCTURE could not find a
likely assignment for the given genotypes. Under the
LOCPRIOR model, which uses sampling locations as a
priori information, the optimum burn-in period was
found to be relatively long, with r (the contribution of
Table 2. Summary of genetic diversity indices among the 14 locali-
ties.
locality Ng Ng/N A HO HE R
Bahamas 11 0.69 9.2 0.873 0.844 11.6
Curac�ao 10 1.00 7.4 0.695 0.741 8.8
San Juan area 17 0.55 9.2 0.694 0.746 11.2
Vega Baja 14 0.38 9.6 0.771 0.795 12.0
Culebra 19 0.90 9.4 0.768 0.740 10.6
Fajardo 10 0.67 7.2 0.700 0.685 10.8
Vieques 30 0.97 12.2 0.740 0.754 13.2
Isabela 5 1.00 5.8 0.790 0.777 7.6
Rinc�on 38 0.73 12.2 0.754 0.766 13.2
Lajas 30 0.67 11.8 0.780 0.764 13.0
Gu�anica 3 0.33 4.2 0.667 0.760 5.4
Ponce 25 0.83 12.0 0.704 0.764 13.0
Guadeloupe 47 0.96 12.2 0.706 0.744 12.2
Mona 50 0.82 13.8 0.756 0.780 16.0
Total 309
Mean 0.75 9.7 0.743 0.761 11.3
Ng = number of genets; Ng/N = ratio of the number of genets to the
number of colonies.
Allelic diversity (A), observed heterozygosity (HO), expected heterozy-
gosity (HE) and allelic range (R) were averaged across loci.
Marine Ecology 36 (2015) 195–209 ª 2014 Blackwell Verlag GmbH 199
M�ege, Schizas, Garcia Reyes & Hrbek Genetic seascape of threatened Caribbean elkhorn coral
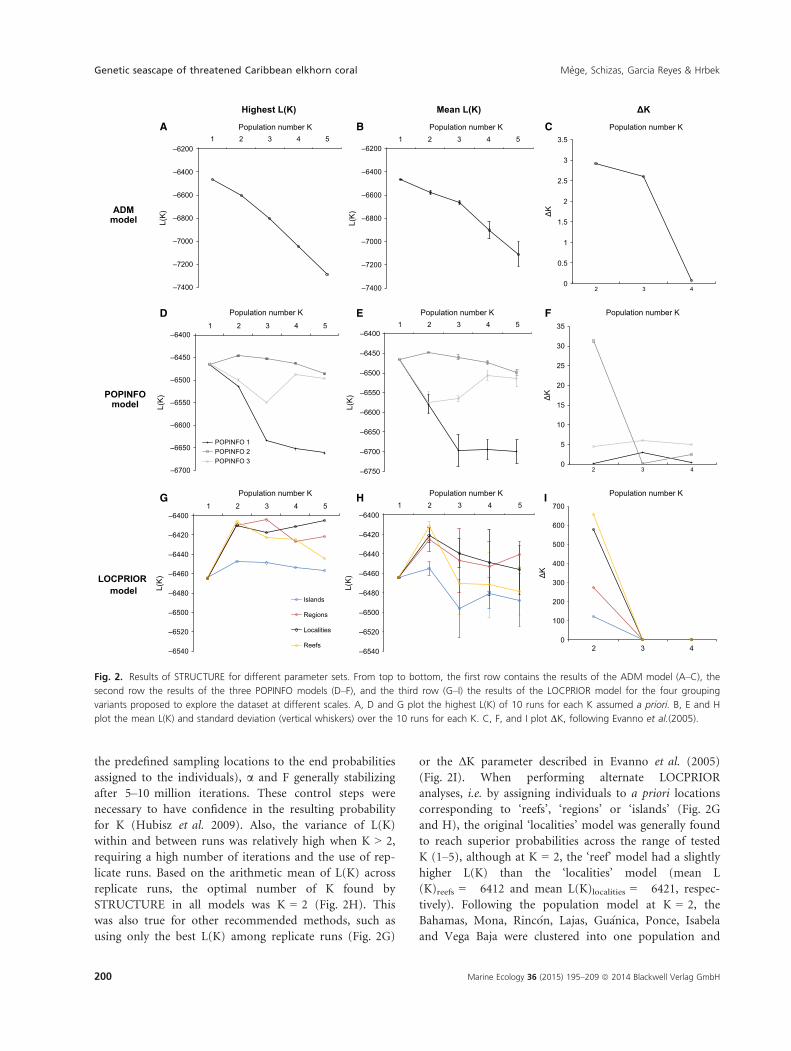
the predefined sampling locations to the end probabilities
assigned to the individuals), a and F generally stabilizing
after 5–10 million iterations. These control steps were
necessary to have confidence in the resulting probability
for K (Hubisz et al. 2009). Also, the variance of L(K)
within and between runs was relatively high when K > 2,
requiring a high number of iterations and the use of rep-
licate runs. Based on the arithmetic mean of L(K) across
replicate runs, the optimal number of K found by
STRUCTURE in all models was K = 2 (Fig. 2H). This
was also true for other recommended methods, such as
using only the best L(K) among replicate runs (Fig. 2G)
or the ΔK parameter described in Evanno et al. (2005)
(Fig. 2I). When performing alternate LOCPRIOR
analyses, i.e. by assigning individuals to a priori locations
corresponding to ‘reefs’, ‘regions’ or ‘islands’ (Fig. 2G
and H), the original ‘localities’ model was generally found
to reach superior probabilities across the range of tested
K (1–5), although at K = 2, the ‘reef’ model had a slightly
higher L(K) than the ‘localities’ model (mean L
(K)reefs = �6412 and mean L(K)localities = �6421, respec-
tively). Following the population model at K = 2, the
Bahamas, Mona, Rinc�on, Lajas, Gu�anica, Ponce, Isabela
and Vega Baja were clustered into one population and
–6700
–6650
–6600
–6550
–6500
–6450
–6400
–6750
–6700
–6650
–6600
–6550
–6500
–6450
–64001 2 3 4 5
POPINFO 1POPINFO 2POPINFO 3
1 2 3 4 5
0
5
10
15
20
25
30
35
2 3 4
–6540
–6520
–6500
–6480
–6460
–6440
–6420
–6400
–6540
–6520
–6500
–6480
–6460
–6440
–6420
–64001 2 3 4 5
Islands
Regions
Localities
Reefs
1 2 3 4 5
0
100
200
300
400
500
600
700
2 3 4
–7400
–7200
–7000
–6800
–6600
–6400
–6200
–7400
–7200
–7000
–6800
–6600
–6400
–62001 2 3 4 5
L(K
)
Population number K1 2 3 4 5
L(K
)
0
0.5
1
1.5
2
2.5
3
3.5
2 3 4
ΔK
ΔKMean L(K)Highest L(K)
POPINFOmodel
ADMmodel
LOCPRIOR model
Population number K Population number K
Population number K Population number K Population number K
Population number K Population number K Population number K
L(K
)
L(K
) ΔK
L(K
)
L(K
) ΔK
A B C
D E F
G H I
Fig. 2. Results of STRUCTURE for different parameter sets. From top to bottom, the first row contains the results of the ADM model (A–C), the
second row the results of the three POPINFO models (D–F), and the third row (G–I) the results of the LOCPRIOR model for the four grouping
variants proposed to explore the dataset at different scales. A, D and G plot the highest L(K) of 10 runs for each K assumed a priori. B, E and H
plot the mean L(K) and standard deviation (vertical whiskers) over the 10 runs for each K. C, F, and I plot DK, following Evanno et al.(2005).
200 Marine Ecology 36 (2015) 195–209 ª 2014 Blackwell Verlag GmbH
Genetic seascape of threatened Caribbean elkhorn coral M�ege, Schizas, Garcia Reyes & Hrbek
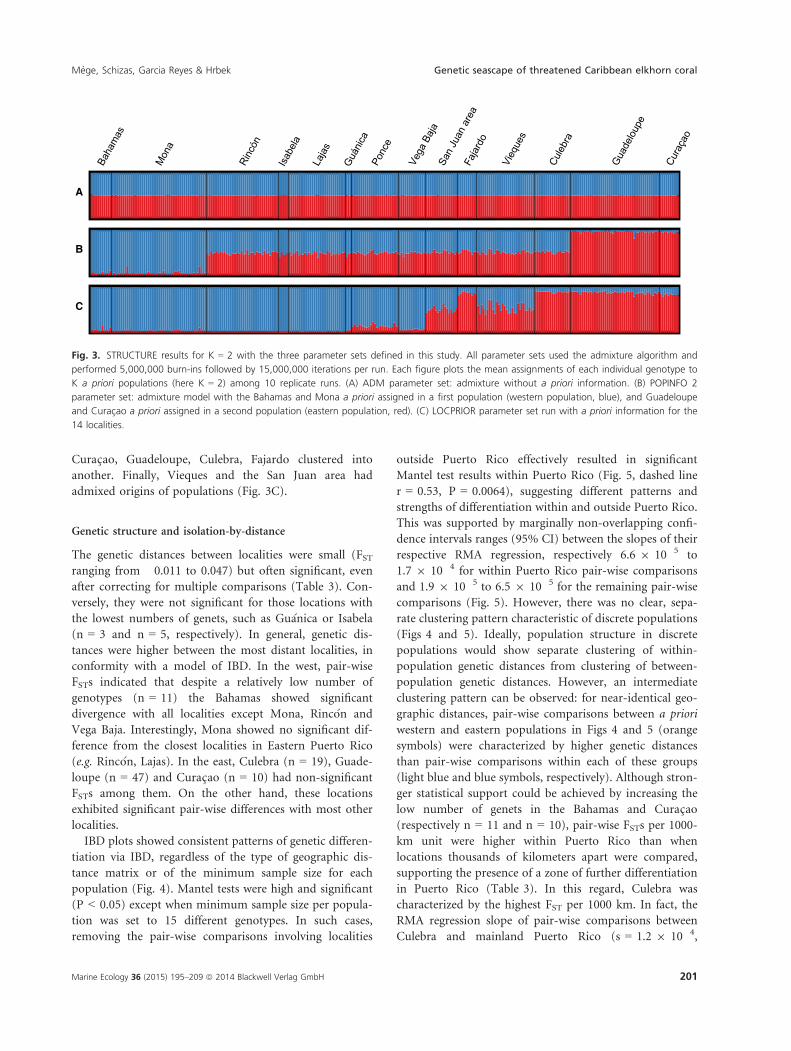
Curac�ao, Guadeloupe, Culebra, Fajardo clustered into
another. Finally, Vieques and the San Juan area had
admixed origins of populations (Fig. 3C).
Genetic structure and isolation-by-distance
The genetic distances between localities were small (FSTranging from �0.011 to 0.047) but often significant, even
after correcting for multiple comparisons (Table 3). Con-
versely, they were not significant for those locations with
the lowest numbers of genets, such as Gu�anica or Isabela
(n = 3 and n = 5, respectively). In general, genetic dis-
tances were higher between the most distant localities, in
conformity with a model of IBD. In the west, pair-wise
FSTs indicated that despite a relatively low number of
genotypes (n = 11) the Bahamas showed significant
divergence with all localities except Mona, Rinc�on and
Vega Baja. Interestingly, Mona showed no significant dif-
ference from the closest localities in Eastern Puerto Rico
(e.g. Rinc�on, Lajas). In the east, Culebra (n = 19), Guade-
loupe (n = 47) and Curac�ao (n = 10) had non-significant
FSTs among them. On the other hand, these locations
exhibited significant pair-wise differences with most other
localities.
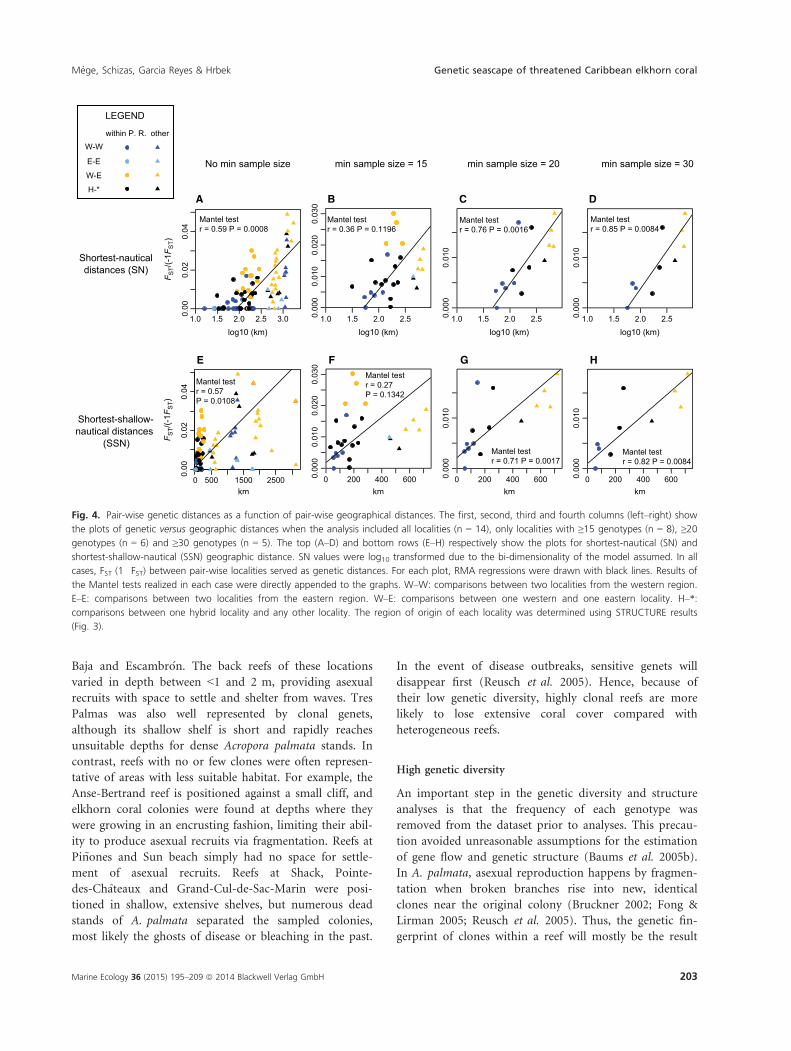
IBD plots showed consistent patterns of genetic differen-
tiation via IBD, regardless of the type of geographic dis-
tance matrix or of the minimum sample size for each
population (Fig. 4). Mantel tests were high and significant
(P < 0.05) except when minimum sample size per popula-
tion was set to 15 different genotypes. In such cases,
removing the pair-wise comparisons involving localities
outside Puerto Rico effectively resulted in significant
Mantel test results within Puerto Rico (Fig. 5, dashed line
r = 0.53, P = 0.0064), suggesting different patterns and
strengths of differentiation within and outside Puerto Rico.
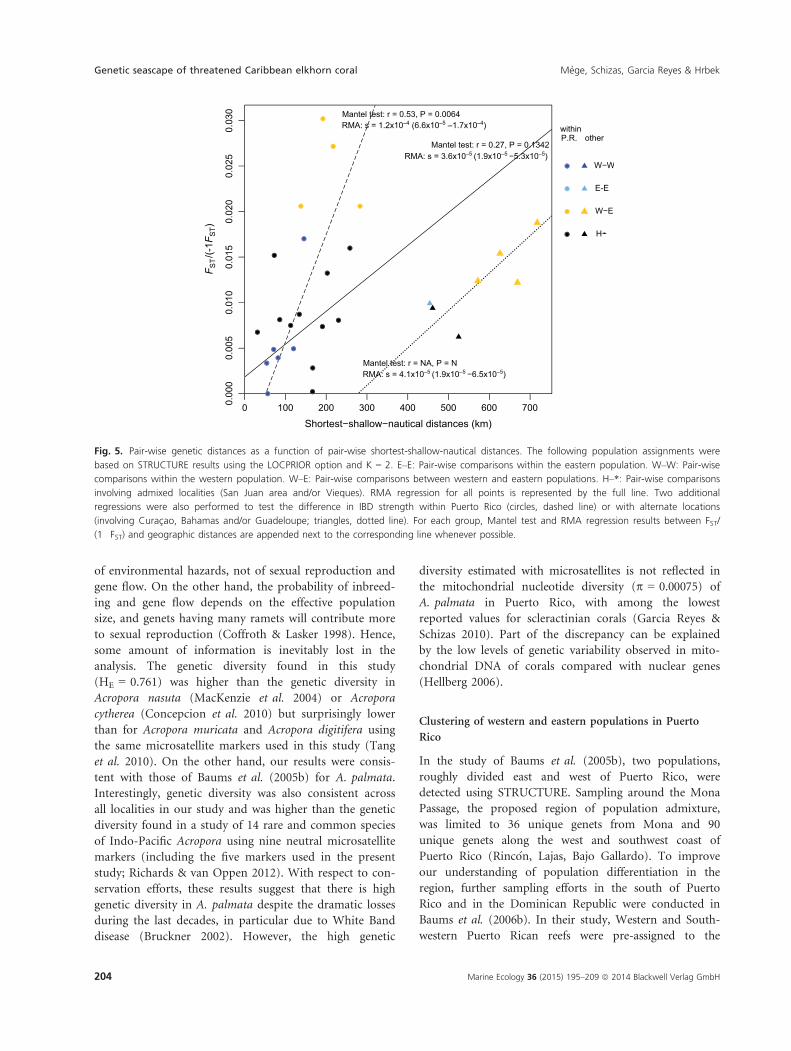
This was supported by marginally non-overlapping confi-
dence intervals ranges (95% CI) between the slopes of their
respective RMA regression, respectively 6.6 9 10�5 to
1.7 9 10�4 for within Puerto Rico pair-wise comparisons
and 1.9 9 10�5 to 6.5 9 10�5 for the remaining pair-wise
comparisons (Fig. 5). However, there was no clear, sepa-
rate clustering pattern characteristic of discrete populations
(Figs 4 and 5). Ideally, population structure in discrete
populations would show separate clustering of within-
population genetic distances from clustering of between-
population genetic distances. However, an intermediate
clustering pattern can be observed: for near-identical geo-
graphic distances, pair-wise comparisons between a priori
western and eastern populations in Figs 4 and 5 (orange
symbols) were characterized by higher genetic distances
than pair-wise comparisons within each of these groups
(light blue and blue symbols, respectively). Although stron-
ger statistical support could be achieved by increasing the
low number of genets in the Bahamas and Curac�ao(respectively n = 11 and n = 10), pair-wise FSTs per 1000-
km unit were higher within Puerto Rico than when
locations thousands of kilometers apart were compared,
supporting the presence of a zone of further differentiation
in Puerto Rico (Table 3). In this regard, Culebra was
characterized by the highest FST per 1000 km. In fact, the
RMA regression slope of pair-wise comparisons between
Culebra and mainland Puerto Rico (s = 1.2 9 10�4,
Baha
mas
Mon
a
Rinc
ón
Laja
s
Guá
nica
Isab
ela
Ponc
e
Vega
Baj
aSa
n Ju
an a
rea
Faja
rdo
Cule
bra
Vieq
ues
Gua
delo
upe
Cura
çao
A
B
C
Fig. 3. STRUCTURE results for K = 2 with the three parameter sets defined in this study. All parameter sets used the admixture algorithm and
performed 5,000,000 burn-ins followed by 15,000,000 iterations per run. Each figure plots the mean assignments of each individual genotype to
K a priori populations (here K = 2) among 10 replicate runs. (A) ADM parameter set: admixture without a priori information. (B) POPINFO 2
parameter set: admixture model with the Bahamas and Mona a priori assigned in a first population (western population, blue), and Guadeloupe
and Curac�ao a priori assigned in a second population (eastern population, red). (C) LOCPRIOR parameter set run with a priori information for the
14 localities.
Marine Ecology 36 (2015) 195–209 ª 2014 Blackwell Verlag GmbH 201
M�ege, Schizas, Garcia Reyes & Hrbek Genetic seascape of threatened Caribbean elkhorn coral
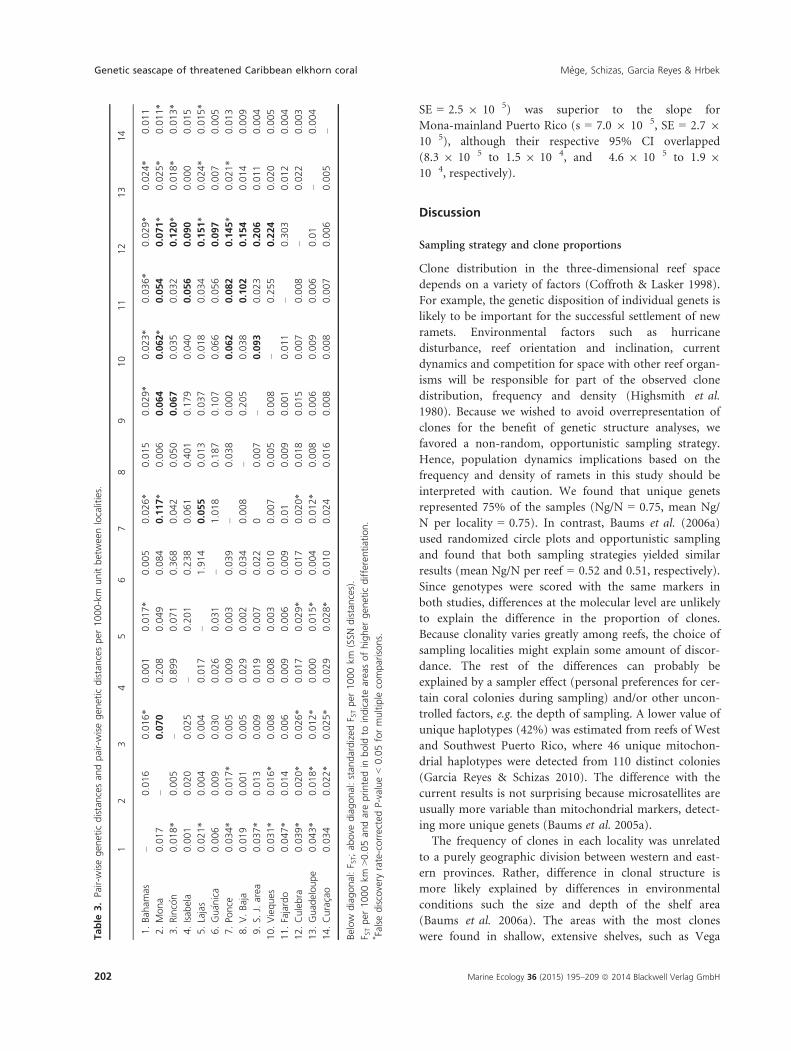
SE = 2.5 9 10�5) was superior to the slope for
Mona-mainland Puerto Rico (s = 7.0 9 10�5, SE = 2.7 9
10�5), although their respective 95% CI overlapped
(8.3 9 10�5 to 1.5 9 10�4, and �4.6 9 10�5 to 1.9 9
10�4, respectively).
Discussion
Sampling strategy and clone proportions
Clone distribution in the three-dimensional reef space
depends on a variety of factors (Coffroth & Lasker 1998).
For example, the genetic disposition of individual genets is
likely to be important for the successful settlement of new
ramets. Environmental factors such as hurricane
disturbance, reef orientation and inclination, current
dynamics and competition for space with other reef organ-
isms will be responsible for part of the observed clone
distribution, frequency and density (Highsmith et al.
1980). Because we wished to avoid overrepresentation of
clones for the benefit of genetic structure analyses, we
favored a non-random, opportunistic sampling strategy.
Hence, population dynamics implications based on the
frequency and density of ramets in this study should be
interpreted with caution. We found that unique genets
represented 75% of the samples (Ng/N = 0.75, mean Ng/
N per locality = 0.75). In contrast, Baums et al. (2006a)
used randomized circle plots and opportunistic sampling
and found that both sampling strategies yielded similar
results (mean Ng/N per reef = 0.52 and 0.51, respectively).
Since genotypes were scored with the same markers in
both studies, differences at the molecular level are unlikely
to explain the difference in the proportion of clones.
Because clonality varies greatly among reefs, the choice of
sampling localities might explain some amount of discor-
dance. The rest of the differences can probably be
explained by a sampler effect (personal preferences for cer-
tain coral colonies during sampling) and/or other uncon-
trolled factors, e.g. the depth of sampling. A lower value of
unique haplotypes (42%) was estimated from reefs of West
and Southwest Puerto Rico, where 46 unique mitochon-
drial haplotypes were detected from 110 distinct colonies
(Garcia Reyes & Schizas 2010). The difference with the
current results is not surprising because microsatellites are
usually more variable than mitochondrial markers, detect-
ing more unique genets (Baums et al. 2005a).
The frequency of clones in each locality was unrelated
to a purely geographic division between western and east-
ern provinces. Rather, difference in clonal structure is
more likely explained by differences in environmental
conditions such the size and depth of the shelf area
(Baums et al. 2006a). The areas with the most clones
were found in shallow, extensive shelves, such as VegaTable
3.Pair-w
isegen
etic
distancesan
dpair-wisegen
etic
distancesper
1000-km
unitbetweenlocalities.
12
34
56
78
910
11
12
13
14
1.Bah
amas
–0.016
0.016*
0.001
0.017*
0.005
0.026*
0.015
0.029*
0.023*
0.036*
0.029*
0.024*
0.011
2.Mona
0.017
–0.070
�0.208
0.049
�0.084
0.117*
0.006
0.064
0.062*
0.054
0.071*
0.025*
0.011*
3.Rinc� on
0.018*
0.005
–�0
.899
�0.071
�0.368
0.042
�0.050
0.067
0.035
0.032
0.120*
0.018*
0.013*
4.Isab
ela
0.001
�0.020
�0.025
–�0
.201
�0.238
�0.061
�0.401
�0.179
0.040
0.056
0.090
0.000
0.015
5.Lajas
0.021*
0.004
�0.004
�0.017
–�1
.914
0.055
�0.013
0.037
0.018
0.034
0.151*
0.024*
0.015*
6.Gu� an
ica
0.006
�0.009
�0.030
�0.026
�0.031
–�1
.018
�0.187
�0.107
�0.066
�0.056
0.097
0.007
0.005
7.Po
nce
0.034*
0.017*
0.005
�0.009
0.003
�0.039
–�0
.038
0.000
0.062
0.082
0.145*
0.021*
0.013
8.V.Baja
0.019
0.001
�0.005
�0.029
�0.002
�0.034
�0.008
–�0
.205
0.038
0.102
0.154
0.014
0.009
9.S.
J.area
0.037*
0.013
0.009
�0.019
0.007
�0.022
0�0
.007
–0.093
0.023
0.206
0.011
0.004
10.Vieques
0.031*
0.016*
0.008
0.008
0.003
�0.010
0.007
0.005
0.008
–�0
.255
0.224
0.020
0.005
11.Fajardo
0.047*
0.014
0.006
0.009
0.006
�0.009
0.01
0.009
0.001
�0.011
–�0
.303
�0.012
�0.004
12.Culebra
0.039*
0.020*
0.026*
0.017
0.029*
0.017
0.020*
0.018
0.015
0.007
�0.008
–0.022
�0.003
13.Guad
eloupe
0.043*
0.018*
0.012*
0.000
0.015*
0.004
0.012*
0.008
0.006
0.009
�0.006
0.01
–0.004
14.Curac �ao
0.034
0.022*
0.025*
0.029
0.028*
0.010
0.024
0.016
0.008
0.008
�0.007
�0.006
0.005
–
Below
diagonal:F S
T;ab
ove
diagonal:stan
dardized
F STper
1000km
(SSN
distances).
F STper
1000km
>0.05an
dareprintedin
bold
toindicateareasofhigher
gen
etic
differentiation.
*Falsediscovery
rate-correctedP-value<0.05formultiple
comparisons.
202 Marine Ecology 36 (2015) 195–209 ª 2014 Blackwell Verlag GmbH
Genetic seascape of threatened Caribbean elkhorn coral M�ege, Schizas, Garcia Reyes & Hrbek
Baja and Escambr�on. The back reefs of these locations
varied in depth between <1 and 2 m, providing asexual
recruits with space to settle and shelter from waves. Tres
Palmas was also well represented by clonal genets,
although its shallow shelf is short and rapidly reaches
unsuitable depths for dense Acropora palmata stands. In
contrast, reefs with no or few clones were often represen-
tative of areas with less suitable habitat. For example, the
Anse-Bertrand reef is positioned against a small cliff, and
elkhorn coral colonies were found at depths where they
were growing in an encrusting fashion, limiting their abil-
ity to produce asexual recruits via fragmentation. Reefs at
Pi~nones and Sun beach simply had no space for settle-
ment of asexual recruits. Reefs at Shack, Pointe-
des-Chateaux and Grand-Cul-de-Sac-Marin were posi-
tioned in shallow, extensive shelves, but numerous dead
stands of A. palmata separated the sampled colonies,
most likely the ghosts of disease or bleaching in the past.
In the event of disease outbreaks, sensitive genets will
disappear first (Reusch et al. 2005). Hence, because of
their low genetic diversity, highly clonal reefs are more
likely to lose extensive coral cover compared with
heterogeneous reefs.
High genetic diversity
An important step in the genetic diversity and structure
analyses is that the frequency of each genotype was
removed from the dataset prior to analyses. This precau-
tion avoided unreasonable assumptions for the estimation
of gene flow and genetic structure (Baums et al. 2005b).
In A. palmata, asexual reproduction happens by fragmen-
tation when broken branches rise into new, identical
clones near the original colony (Bruckner 2002; Fong &
Lirman 2005; Reusch et al. 2005). Thus, the genetic fin-
gerprint of clones within a reef will mostly be the result
Shortest-nauticaldistances (SN)
No min sample size min sample size = 15 min sample size = 20 min sample size = 30
Shortest-shallow-nautical distances
(SSN)
DCBA
HGFE
within P. R. other
W-W
E-E
W-E
H-*
LEGEND
Mantel testr = 0.59 P = 0.0008
Mantel testr = 0.36 P = 0.1196
Mantel testr = 0.76 P = 0.0016
Mantel testr = 0.85 P = 0.0084
Mantel testr = 0.57P = 0.0108
Mantel testr = 0.27P = 0.1342
Mantel testr = 0.71 P = 0.0017
Mantel testr = 0.82 P = 0.0084
F ST/
(-1F
ST)
F ST/
(-1F
ST)
Fig. 4. Pair-wise genetic distances as a function of pair-wise geographical distances. The first, second, third and fourth columns (left–right) show
the plots of genetic versus geographic distances when the analysis included all localities (n = 14), only localities with ≥15 genotypes (n = 8), ≥20genotypes (n = 6) and ≥30 genotypes (n = 5). The top (A–D) and bottom rows (E–H) respectively show the plots for shortest-nautical (SN) and
shortest-shallow-nautical (SSN) geographic distance. SN values were log10 transformed due to the bi-dimensionality of the model assumed. In all
cases, FST (1�FST) between pair-wise localities served as genetic distances. For each plot, RMA regressions were drawn with black lines. Results of
the Mantel tests realized in each case were directly appended to the graphs. W–W: comparisons between two localities from the western region.
E–E: comparisons between two localities from the eastern region. W–E: comparisons between one western and one eastern locality. H–*:
comparisons between one hybrid locality and any other locality. The region of origin of each locality was determined using STRUCTURE results
(Fig. 3).
Marine Ecology 36 (2015) 195–209 ª 2014 Blackwell Verlag GmbH 203
M�ege, Schizas, Garcia Reyes & Hrbek Genetic seascape of threatened Caribbean elkhorn coral
of environmental hazards, not of sexual reproduction and
gene flow. On the other hand, the probability of inbreed-
ing and gene flow depends on the effective population
size, and genets having many ramets will contribute more
to sexual reproduction (Coffroth & Lasker 1998). Hence,
some amount of information is inevitably lost in the
analysis. The genetic diversity found in this study
(HE = 0.761) was higher than the genetic diversity in
Acropora nasuta (MacKenzie et al. 2004) or Acropora
cytherea (Concepcion et al. 2010) but surprisingly lower
than for Acropora muricata and Acropora digitifera using
the same microsatellite markers used in this study (Tang
et al. 2010). On the other hand, our results were consis-
tent with those of Baums et al. (2005b) for A. palmata.
Interestingly, genetic diversity was also consistent across
all localities in our study and was higher than the genetic
diversity found in a study of 14 rare and common species
of Indo-Pacific Acropora using nine neutral microsatellite
markers (including the five markers used in the present
study; Richards & van Oppen 2012). With respect to con-
servation efforts, these results suggest that there is high
genetic diversity in A. palmata despite the dramatic losses
during the last decades, in particular due to White Band
disease (Bruckner 2002). However, the high genetic
diversity estimated with microsatellites is not reflected in
the mitochondrial nucleotide diversity (p = 0.00075) of
A. palmata in Puerto Rico, with among the lowest
reported values for scleractinian corals (Garcia Reyes &
Schizas 2010). Part of the discrepancy can be explained
by the low levels of genetic variability observed in mito-
chondrial DNA of corals compared with nuclear genes
(Hellberg 2006).
Clustering of western and eastern populations in Puerto
Rico
In the study of Baums et al. (2005b), two populations,
roughly divided east and west of Puerto Rico, were
detected using STRUCTURE. Sampling around the Mona
Passage, the proposed region of population admixture,
was limited to 36 unique genets from Mona and 90
unique genets along the west and southwest coast of
Puerto Rico (Rinc�on, Lajas, Bajo Gallardo). To improve
our understanding of population differentiation in the
region, further sampling efforts in the south of Puerto
Rico and in the Dominican Republic were conducted in
Baums et al. (2006b). In their study, Western and South-
western Puerto Rican reefs were pre-assigned to the
0 100 200 300 400 500 600 7000.00
00.
005
0.01
00.
015
0.02
00.
025
0.03
0
Shortest−shallow−nautical distances (km)
Mantel test: r = 0.27, P = 0.1342RMA: s = 3.6x10⁻⁵ (1.9x10⁻⁵ −5.3x10⁻⁵)
Mantel test: r = 0.53, P = 0.0064RMA: s = 1.2x10⁻⁴ (6.6x10⁻⁵ –1.7x10⁻⁴)
Mantel test: r = NA, P = NRMA: s = 4.1x10⁻⁵ (1.9x10⁻⁵ −6.5x10⁻⁵)
W−W
E-E
W−E
H−*
P.R. otherwithin
F ST/(-
1FS
T)
Fig. 5. Pair-wise genetic distances as a function of pair-wise shortest-shallow-nautical distances. The following population assignments were
based on STRUCTURE results using the LOCPRIOR option and K = 2. E–E: Pair-wise comparisons within the eastern population. W–W: Pair-wise
comparisons within the western population. W–E: Pair-wise comparisons between western and eastern populations. H–*: Pair-wise comparisons
involving admixed localities (San Juan area and/or Vieques). RMA regression for all points is represented by the full line. Two additional
regressions were also performed to test the difference in IBD strength within Puerto Rico (circles, dashed line) or with alternate locations
(involving Curac�ao, Bahamas and/or Guadeloupe; triangles, dotted line). For each group, Mantel test and RMA regression results between FST/
(1�FST) and geographic distances are appended next to the corresponding line whenever possible.
204 Marine Ecology 36 (2015) 195–209 ª 2014 Blackwell Verlag GmbH
Genetic seascape of threatened Caribbean elkhorn coral M�ege, Schizas, Garcia Reyes & Hrbek
eastern population via the POPINFO option in STRUC-
TURE, in disagreement with the initial STRUCTURE
results of Baums et al. (2005b), where the same Puerto
Rican reefs clustered with the western population when no
a priori assignments were made. The added samples from
the Dominican Republic clustered with the western popu-
lation (Baums et al. 2006b) but the a priori assignment of
Western and Southwestern Puerto Rican samples to the
eastern cluster did little to improve our understanding of
population differentiation around Puerto Rico. By includ-
ing new samples and locations around the proposed
region of population admixture (Baums et al. 2005b), in
particular where sampling was missing (Northern and
Eastern Puerto Rico), the present study further details the
population structure of elkhorn coral in this region of
particular interest.
In the present study, in accordance with high genetic
diversity and low estimates of population structure (FST,
AMOVA analyses presented in Supporting Information in
Data S2 and accompanying Table S2), genetic differentia-
tion was detected with STRUCTURE but was weak: the
basic admixture model (ADM) in STRUCTURE was not
able to detect population structure in the data, and a high
number of iterations were needed to reach statistical
stability and determine population structure when using
prior information on locations via the LOCPRIOR model,
recommended in case of weak population structure
(Hubisz et al. 2009). In contrast, Baums et al. (2005b)
were able to find population structure separating a western
from an eastern population using the same markers and
admixture model without a priori information, and thus
suggested that two populations of Acropora palmata meet
at Puerto Rico. Differences between the two studies might
be due to the more extensive geographic coverage and lar-
ger number of unique genotypes in Baums et al. (2005b)
than in this study (n = 709 and n = 309, respectively) or
user-related differences in the assessment of marker states.
Baums et al. (2005b) performed additional runs in
STRUCTURE, using the built-in POPINFO option to
define a priori assignments of non-Puerto Rican localities
to their respective eastern or western cluster, allowing the
software to estimate population admixture of the unas-
signed Puerto Rican genotypes. The resulting assignments
of evenly admixed Puerto Rican colonies were then inter-
preted as hybrid genotypes between the eastern and the
western populations. Similarly, we used the POPINFO
option to define a priori assignments of selected locations.
Various configurations combining western and eastern a
priori assignments invariably resulted in (i) lack of stabil-
ization of control parameters during the runs and (ii)
similar patterns of totally admixed genotypes, in equal
proportions between K populations, for all individuals
that were not assigned to a priori cluster. This pattern
suggests that those admixed assignments resulted from a
lack of discriminative power of the algorithm, and repre-
sented undecided assignments rather than perfectly
admixed genotypes (with 1:1 proportions of each popula-
tion of origin in the case of K = 2; Pritchard et al. 2000).
Using the LOCPRIOR option in STRUCTURE, which
was not available when Baums et al. (2005b, 2006b) pub-
lished, we further detailed the population structure of
A. palmata in Puerto Rico. Our results agree with Baums
et al. (2005b), with K = 2 having the highest probability
to explain the data, even when reefs outside Puerto Rico
were not included. In Puerto Rico, the western popula-
tion would include Mona Island and the west coast of
Puerto Rico, as was described in Baums et al. (2005b).
The western population most likely extends (i) northwest
and north of Puerto Rico reaching past Vega Baja; (ii)
southwest and south past Lajas and Gu�anica, reaching
past Ponce. In contrast, the eastern population probably
includes Culebra and reaches past Fajardo. A transitional
area occurs somewhere between Vega Baja and Fajardo in
the north, explaining the admixed profiles of the San
Juan area. In the south/southeast of the island, the transi-
tional area is located between Ponce, Fajardo and
Vieques. Keeping in mind that the low number of genets
for some of these localities might affect our results
(Cornuet et al. 1999), we also find significant FST and
AMOVA results supporting the genetic structure
evidenced by our STRUCTURE results.
Patterns of IBD versus discrete populations
STRUCTURE explicitly allocates individuals into an a
priori number of groups that are discrete and whose
members minimally violate the assumptions of HWE
(Pritchard et al. 2000). In instances where genetic differ-
entiation is correlated with geographic distance, individu-
als separated by sufficiently large geographic distances
may violate the assumptions of a population at HWE
when placed into one group, and therefore two or more
groups may better explain the clustering of these individ-
uals. However, this does not mean that these groups are
discrete, and that individuals with intermediate genotypes
represent admixed individuals between two discrete pop-
ulations, but rather indicates that the program is forcing
continuous variation into discrete and discontinuous
clusters. Because Bayesian clustering programs such as
STRUCTURE can overestimate the number of clusters in
datasets characterized by IBD, IBD should also be tested
and interpretations based on the results of all analyses
(Frantz et al. 2009).
STRUCTURE analyses indicate two clusters with geneti-
cally intermediate individuals and localities occurring
in Western Puerto Rico (Fig. 3). This result is broadly
Marine Ecology 36 (2015) 195–209 ª 2014 Blackwell Verlag GmbH 205
M�ege, Schizas, Garcia Reyes & Hrbek Genetic seascape of threatened Caribbean elkhorn coral
comparable to that of Baums et al. (2005b, 2006a). How-
ever, our interpretation, based mainly on the addition of
localities and samples in the proposed area of admixture,
differs slightly. Analyses of pair-wise FST and of correlations
between genetic and geographic distances suggested a pat-
tern of IBD, which normally characterizes populations with
limited connectivity, such as in a stepping stone model
(Hellberg 2007). This is consistent with what is now known
of limited larvae dispersal in corals and other marine spe-
cies (Palumbi 2003; Cowen et al. 2006; Galindo et al. 2006;
Hellberg 2007; Andras et al. 2013). Furthermore, the
choice of a different geographic distance matrix or limiting
analyses to localities with a certain minimum sample size
(no minimum, 15, 20 or 30 genotypes) did not affect the
interpretation of genetic differentiation by IBD. Our data
suggests that the strength of IBD measured as the slope of
the correlation between genetic and geographic distances
differs along the studied seascape inhabited by A. palmata.
The slope was steeper in comparisons involving the small
geographic distances around Puerto Rico than Caribbean-
wide comparisons, suggesting that IBD is much stronger
within the region of Puerto Rico than outside this region.
This could reflect the stronger genetic changes associating
with the hybridization of the western and eastern popula-
tions in the Puerto Rican region (Baums et al. 2005b).
While STRUCTURE consistently placed the Bahamas
within the putative western population along several
Puerto Rican localities, the Bahamas were found to be sig-
nificantly differentiated from almost all other locations in
this study, a result reminiscent of the genetic separation of
the Bahamas from other Caribbean locations in A. cervicor-
nis (Galindo et al. 2006; Vollmer & Palumbi 2007; Garcia
Reyes & Schizas 2010; Hemond & Vollmer 2010) or Orbi-
cella (previously Montastraea) annularis (Foster et al.
2012). East of Puerto Rico (Culebra, Guadeloupe and Cur-
ac�ao) there was little genetic divergence between localities,
suggesting near-panmixia within the eastern region
(Table 3), a result largely consistent with the eastern cluster
described by Baums et al. (2005b) but also with the strong
separation of eastern locations from the west in both exper-
imental data and dispersal models in O. annularis (Foster
et al. 2012).
Although our findings within Puerto Rico were well
supported, further studies should be conducted to con-
firm our observations regarding non-Puerto Rican locali-
ties because of the low number of sites (n = 3) and
genets per site (n = 11 in the Bahamas and n = 10 in
Curac�ao) analyzed outside of Puerto Rico in this study.
Re-assessing population structure in the elkhorn coral
Genetic structure in this study was characterized by a non-
uniform IBD across the seascape inhabited by A. palmata,
suggesting that connectivity, at least among some
A. palmata reefs, is limited. IBD seemed to be stronger
among localities from Puerto Rico, in particular in Eastern
Puerto Rico. IBD was weaker to insignificant outside of
the Puerto Rico Shelf, as suggested by mostly non-signifi-
cant genetic structuring within the eastern population.
When the distribution of the genetic diversity is inter-
preted in the framework of a discrete population structure
as implemented in STRUCTURE, one then observes a
zone of transition in Eastern Puerto Rico between two
apparently discrete genetic groups. This zone of transition
did not seem to associate directly with the Mona Passage,
west of Puerto Rico, which was suggested to be a signifi-
cant barrier to gene flow in A. palmata (Baums et al.
2006b). Foster et al. (2012) also found an east–west breakin the genetic structure of O. annularis but noted that its
location was ambiguous, since their results pointed to a
separation between the British Virgin Islands and Domi-
nica. Understanding why the genetic transition should be
more pronounced in the east of Puerto Rico, as suggested
by the slopes of RMA regressions between mainland
Puerto Rico and Mona versus mainland Puerto Rico and
Culebra, is an intriguing challenge. The filtering effect of
the Mona Passage, coupled with asymmetric net gene flow
in the easterly direction, as is generally the case for surface
currents during the spawning season on the north coast of
Puerto Rico, could provide an explanation. Admittedly,
the genetic structure in the south of the island would then
be expected to respond to gene flow following opposite
currents in the westerly direction, which does not seem to
be the case, unless gene flow in the southeast is hindered
by another, unidentified barrier. Residual genetic structure
inherited from historical shifts in the geographical ranges
of Caribbean species during the late Quaternary (Lighty
et al. 1982; Toscano & Macintyre 2003) could explain
some of the present genetic patterns, as did the last glacia-
tion event on Indo-Pacific population dynamics of marine
species (Benzie 1999). Fewer than 15 genotypes were
recovered from two of the three non-Puerto Rican locali-
ties in this study (Curac�ao and the Bahamas). Because
STRUCTURE and other analyses of population structuring
are context-dependent, adding molecular markers, new
locations in the larger Caribbean and increasing sample
size per population seem essential for further improved
analyses (e.g. when assigning individuals to populations of
origin, see Cornuet et al. 1999). These additions will likely
provide us with a better understanding of possible IBD
and other genetic structuring of A. palmata populations
outside of Puerto Rico. New sampling efforts concentrated
in the northeast, southeast and east of Puerto Rico are also
needed to identify more accurately the location(s) of the
strongest genetic shift(s) between eastern and western
populations. Meanwhile, building on the knowledge that
206 Marine Ecology 36 (2015) 195–209 ª 2014 Blackwell Verlag GmbH
Genetic seascape of threatened Caribbean elkhorn coral M�ege, Schizas, Garcia Reyes & Hrbek
most of the extant genetic diversity of A. palmata is pres-
ent on the Puerto Rico Shelf, we exhort local decision-
makers to implement new conservation measures for the
elkhorn coral, as effective protection at a local scale could
be beneficial for preserving the global genetic diversity of
A. palmata.
Acknowledgements
We thank Jenny Acevedo, Silvia Planas, Ximena Velez
Zuazo, Juan Marrero and Elsie Rivera for their help,
Claude Bouchon and Olivier Gros for their logistic sup-
port in Guadeloupe, and Edwin Hernandez for providing
samples from Mona. The manuscript was also greatly
improved by the comments of various reviewers. Funding
was provided by a Caribbean Coral Reef Institute Grant
(NA04NOS4260205), a CMRC Program Development
Grant (05-PRKS-01-05A) awarded to N.V.S. and via
NIH-SCORE grant S06GM08102 and NSF-HRD grants
0734826 and 0931659 to T.H. Collection permits were
issued by PR–D.N.E.R. and D.R.A.M. of Guadeloupe.
References
Andras J.P., Rypien K.L., Harvell C.D. (2013) Range-wide
population genetic structure of the Caribbean sea fan coral,
Gorgonia ventalina. Molecular Ecology, 22, 56–73.
Ayre D.J., Hughes T.P. (2000) Genotypic diversity and gene
flow in brooding and spawning corals along the Great
Barrier Reef, Australia. Evolution, 54, 1590–1605.
Baums I.B., Hugues C.R., Hellberg R.E. (2005a) Mendelian
microsatellite loci for the Caribbean coral Acropora palmata.
Marine Ecology Progress Series, 288, 115–127.
Baums I.B., Miller M.W., Hellberg R.E. (2005b) Regionally
isolated populations of an imperiled Caribbean coral,
Acropora palmata. Molecular Ecology, 14, 1377–1390.
Baums I.B., Miller M.W., Hellberg R.E. (2006a) Geographic
variation in clonal structure in a reefbuilding Caribbean coral,
Acropora palamata. Ecological Monographs, 76, 503–519.
Baums I.B., Paris C.B., Ch�erubin L.M. (2006b) A
bio-oceanographic filter to larval dispersal in a
reef-building coral. Limnology and Oceanography, 15,
1969–1981.
Benjamini Y., Hochberg Y. (1995) Controlling the false
discovery rate: a practical and powerful approach to
multiple testing. Journal of the Royal Statistical Society. Series
B, Statistical Methodology, 57, 289–300.
Benzie J.A.H. (1999) Genetic structure of coral reef
organisms: ghosts of dispersal past. American Zoologist, 39,
131–145.
Benzie J., Haskell A., Lehman H. (1995) Variation in the
genetic composition of coral (Pocillopora damicornis and
Acropora palifera) populations from different reef habitats.
Marine Biology, 121, 731–739.
Bohonak A., Van Der Linde K. (2004) RMA: software for
reduced major axis regression, Java version 3.21. Available
at: http://ibdws.sdsu.edu (accessed February 2012).
Bruckner A.W. (2002) Proceedings of the Caribbean Acropora
Workshop – Potential Application of the US Endangered
Species Act as a Conservation Strategy. NOAA Technical
Memorandum NMSF-OPR-24, Silver Spring, MD: 199 pp.
Coffroth M.A., Lasker H.R. (1998) Population structure of a
clonal gorgonian coral: the interplay between clonal
reproduction and disturbance. Evolution, 52, 379–393.
Colin P.L. (2003) Larvae retention: genes or oceanography?
Science, 300, 1657–1659.
Concepcion G.T., Polato N.R., Baums I.B., Toonen R.J. (2010)
Development of microsatellite markers from four Hawaiian
corals: Acropora cytherea, Fungia scutaria, Montipora capitata
and Porites lobata. Conservation Genetics Resources, 2, 11–15.
Cornuet J.-M., Piry S., Luikart G., Estoup A., Solignac M.
(1999) New methods employing multilocus genotypes to
select or exclude populations as origins of individuals.
Genetics, 153, 1989–2000.
Cowen R.K., Paris C.B., Srinivasan A. (2006) Scaling of
connectivity in marine populations. Science, 311, 522–527.
Dennis G.D., Smith-Vaniz W.F., Colin P.L., Hensley D.A.,
McGehee M.A. (2005) Shore fishes from the islands of the
Mona Passage, Greater Antilles with comments on their
zoogeography. Caribbean Journal of Science, 41, 716–743.
Evanno G., Regnaut S., Goudet J. (2005) Detecting the
number of clusters of individuals using the software
STRUCTURE: a simulation study. Molecular Ecology, 14,
2611–2620.
Excoffier L., Lischer H.E.L. (2010) Arlequin suite ver 3.5: a
new series of programs to perform population genetics
analyses under Linux and Windows. Molecular Ecology
Resources, 10, 564–567.
Fong P., Lirman D. (1995) Hurricanes cause population
expansion of the branching coral Acropora palmata
(Scleractinia): wound healing and growth patterns of
asexual recruits. Marine Ecology, 16, 317–335.
Foster N.L., Paris C.B., Kool J.T., Baums I.B., Stevens J.R.,
Sanchez J.A., Bastidas C., Agudelo C., Bush P., Day O.
(2012) Connectivity of Caribbean coral populations:
complementary insights from empirical and modelled gene
flow. Molecular Ecology, 21, 1143–1157.
Frantz A.C., Cellina S., Krier A., Schley L., Burke T. (2009) Using
spatial Bayesian methods to determine the genetic structure of
a continuously distributed population: clusters or isolation by
distance? Journal of Applied Ecology, 46, 493–505.
Gaggiotti O., Lange O., Rassmann K., Gliddon C. (1999) A
comparison of two indirect methods for estimating average
levels of gene flow using microsatellite data. Molecular
Ecology, 8, 1513–1520.
Galindo H.M., Olson D.B., Palumbi S.R. (2006) Seascape
genetics: a coupled oceanographic-genetic model predicts
population structure of Caribbean corals. Current Biology,
16, 1622–1626.
Marine Ecology 36 (2015) 195–209 ª 2014 Blackwell Verlag GmbH 207
M�ege, Schizas, Garcia Reyes & Hrbek Genetic seascape of threatened Caribbean elkhorn coral
Garcia Reyes J., Schizas N.V. (2010) No two reefs are created
equal: fine-scale population structure in the threatened coral
species Acropora palmata and A. cervicornis. Aquatic Biology,
10, 69–83.
Guillot G., Leblois R., Coulon A., Frantz A.C. (2009) Statistical
methods in spatial genetics. Molecular Ecology, 18, 4734–
4756.
Hellberg M.E. (1994) Relationships between inferred levels of
gene flow and geographic distance in a philopatric coral,
Balanophyllia elegans. Evolution, 48, 1829–1854.
Hellberg M.E. (2006) No variation and low synonymous
substitution rates in coral mtDNA despite high nuclear
variation. BMC Evolutionary Biology, 6, 24.
Hellberg M.E. (2007) Footprints on water: the genetic wake of
dispersal among reefs. Coral Reefs, 26, 463–473.
Hemond E.M., Vollmer S.V. (2010) Genetic diversity and
connectivity in the threatened staghorn coral (Acropora
cervicornis) in Florida. PLoS ONE, 5, e8652.
Highsmith R.C., Riggs A.C., D’Antonio C.M. (1980) Survival
of hurricane-generated coral fragments and a disturbance
model of reef calcification/growth rates. Oecologia, 46, 322–
329.
Hubisz M.J., Falush D., Stephens M., Pritchard J.K. (2009)
Inferring weak population structure with the assistance of
sample group information. Molecular Ecology Resources, 9,
1322–1332.
Jakobsson M., Rosenberg N.A. (2007) CLUMPP: a cluster
matching and permutation program for dealing with label
switching and multimodality in analysis of population
structure. Bioinformatics, 23, 1801–1806.
Jensen J., Bohonak A., Kelley S. (2005) Isolation by distance,
web service. BMC Genetics, 6, 13.
Lighty R.G., Macintyre I.G., Stuckenrath R. (1982) Acropora
palmata reef framework: a reliable indicator of sea level in
the western Atlantic for the past 10,000 years. Coral Reefs, 1,
125–130.
MacKenzie J.B., Munday P.L., Willis B.L., Miller D.J., Van
Oppen M.J.H. (2004) Unexpected patterns of genetic
structuring among locations but not colour morphs in
Acropora nasuta (Cnidaria; Scleractinia). Molecular Ecology,
13, 9–20.
Magalon H., Adjeroud M., Veuille M. (2005) Patterns of
genetic variation do not correlate with geographical distance
in the reef-building coral Pocillopora meandrina in the
South Pacific. Molecular Ecology, 14, 1861–1868.
Maier E., Tollrian R., Rinkevich B., N€urnberger B. (2005)
Isolation by distance in the scleractinian coral
Seriatopora hystrix from the Red Sea. Marine Biology, 147,
1109–1120.
Ng W., Morton B. (2003) Genetic structure of the
scleractinian coral Platygyra sinensis in Hong Kong. Marine
Biology, 143, 963–968.
Palumbi S.R. (2003) Population genetics, demographic
connectivity, and the design of marine reserves. Ecological
Applications, 13, 146–158.
Palumbi S.R., Vollmer S., Romano S., Oliver T., Ladner J.
(2012) The role of genes in understanding the evolutionary
ecology of reef building corals. Evolutionary Ecology, 26,
317–335.
Peakall R., Smouse P.E. (2006) GENALEX 6: genetic analysis
in Excel. Population genetic software for teaching and
research. Molecular Ecology Notes, 6, 288–295.
Pritchard J.K., Stephens M., Donnelly P. (2000) Inference of
population structure using multilocus genotype data.
Genetics, 155, 945–959.
R Development Core Team (2010) R: A Language and
Environment for Statistical Computing. R Foundation for
Statistical Computing, Vienna, Austria.
Reusch T.B.H., Ehlers A., H€ammerli A., Worm B. (2005)
Ecosystem recovery after climatic extremes enhanced by
genotypic diversity. Proceedings of the National
Academy of Sciences of the United States of America, 102,
2826.
Richards Z.T., van Oppen M.J.H. (2012) Rarity and genetic
diversity in Indo-Pacific Acropora corals. Ecology and
Evolution, 2, 1867–1888.
Rosenberg N.A. (2004) DISTRUCT: a program for the
graphical display of population structure. Molecular Ecology
Notes, 4, 137–138.
Rousset F. (1997) Genetic differentiation and estimation of
gene flow from F-statistics under isolation by distance.
Genetics, 145, 1219–1228.
Severance E.G., Karl S.A. (2006) Contrasting population
genetic structures of sympatric, mass-spawning Caribbean
corals. Marine Biology, 150, 57–68.
Slatkin M. (1993) Isolation by distance in equilibrium and
non-equilibrium populations. Evolution, 47, 264–279.
Tang P.C., Wei N.V., Chen C.W., Wallace C.C., Chen C.A.
(2010) Comparative study of genetic variability of AAT and
CT/GT microsatellites in staghorn coral, Acropora
(Scleractinia: Acroporidae). Zoological Studies, 49, 657–668.
Taylor M.S., Hellberg M.E. (2006) Comparative
phylogeography in a genus of coral reef fishes:
biogeographic and genetic concordance in the Caribbean.
Molecular Ecology, 15, 695–707.
Toscano M.A., Macintyre I.G. (2003) Corrected western
Atlantic sea-level curve for the last 11,000 years based on
calibrated 14C dates from Acropora palmata framework and
intertidal mangrove peat. Coral Reefs, 22, 257–270.
Vald�es-Pizzini M., Sch€arer-Umpierre M., Carrelo-Morales C.J.,
Fer�andez-Arribas M., Mu~noz-Hincapi�e M. (2009) Plan de
Manejo de la Reserva Marina de Tres Palmas Rinc�on. Equipo
de facilitaci�on del Centro Interdisciplinario de Estudios del
Litoral (CIEL), Universidad de Puerto Rico en Mayag€uez,
Puerto Rico: 100 pp.
Van Oppen M.J.H., Gates R.D. (2006) Conservation genetics
and the resilience of reef-building corals. Molecular Ecology,
15, 3863–3883.
Van Oppen M.J., Willis B.L., Van Vugt H.W.J.A., Miller
D.J. (2000) Examination of species boundaries in the
208 Marine Ecology 36 (2015) 195–209 ª 2014 Blackwell Verlag GmbH
Genetic seascape of threatened Caribbean elkhorn coral M�ege, Schizas, Garcia Reyes & Hrbek
Acropora cervicornis group (Scleractinia, Cnidaria) using
nuclear DNA sequence analyses. Molecular Ecology, 9,
1363–1373.
Veron J., Stafford-Smith M. (2000) Corals of the World Vol. 1.
Australian Institute of Marine Science, Townsville, Qld: 462
pp.
Vollmer S.V., Palumbi S.R. (2002) Hybridization and the
evolution of reef coral diversity. Science, 296, 2023–2025.
Vollmer S.V., Palumbi S.R. (2004) Testing the utility of
internally transcribed spacer sequences in coral
phylogenetics. Molecular Ecology, 13, 2763–2772.
Vollmer S.V., Palumbi S.R. (2007) Restricted gene flow in the
Caribbean staghorn coral Acropora cervicornis: implications
for the recovery of endangered reefs. Journal of Heredity, 98,
40–50.
Wallace C.C. (1999) Staghorn Corals of the World: A Revision
of the Coral Genus Acropora (Scleractinia; Astrocoeniina;
Acroporidae) Worldwide, with Emphasis on Morphology,
Phylogeny and Biogeography. CSIRO Publishing,
Collingwood, Vic.: 421 pp.
Supporting Information
Additional Supporting Information may be found in the
online version of this article:
Data S1. Methods used to estimate and choose the
number of discrete populations K in STRUCTURE,
STRUCTURE configurations for the manuscript, as well
as results from additional runs.
Data S2. Tests of hierarchical genetic structuring using
FST-based Analysis of Molecular Variance (AMOVA).
Fig. S1. Additional STRUCTURE runs under the LOC-
PRIOR model on a reduced dataset as further described
in Data S1.
Fig. S2. STRUCTURE results for K = 2 under the
LOCPRIOR model comparing global results with the
results for Puerto Rican locations only.
Table S1. Geographic distance matrices between the 14
locations reported in the manuscript.
Table S2. Configurations and results for AMOVA for
Data S2.
Marine Ecology 36 (2015) 195–209 ª 2014 Blackwell Verlag GmbH 209
M�ege, Schizas, Garcia Reyes & Hrbek Genetic seascape of threatened Caribbean elkhorn coral


