Dr. K . Venugopala RaoG roup Head
Urban Studies & GeoinformaticsNat ional Remote Sens ing Centre (NRSC)
Ind ian Space Research Organisat ion ( ISRO) ,Department of Space, G ov t . o f Ind ia
Hyderabad
nrsc
Geo-informatics for Smart Cities- Indian Perspective
UIM-2016

Smart City – Working definition
The ISO Technical Management Board (TMB) in its 63rd meeting held on 17-18June 2015 passed a resolution and approved the working definition of aSmart City in ISO as follows:
''Smart City'' should be described as a city that:
• dramatically increases the pace at which it improves itssustainability and resilience, by fundamentallyimproving how it engages society, how it appliescollaborative leadership methods, how it works acrossdisciplines and city systems, and how it uses data andintegrated technologies in order to transform servicesand quality of life to those in and involved with the city(residents, businesses, visitors)
nrsc
Smart City – Indian Initiatives
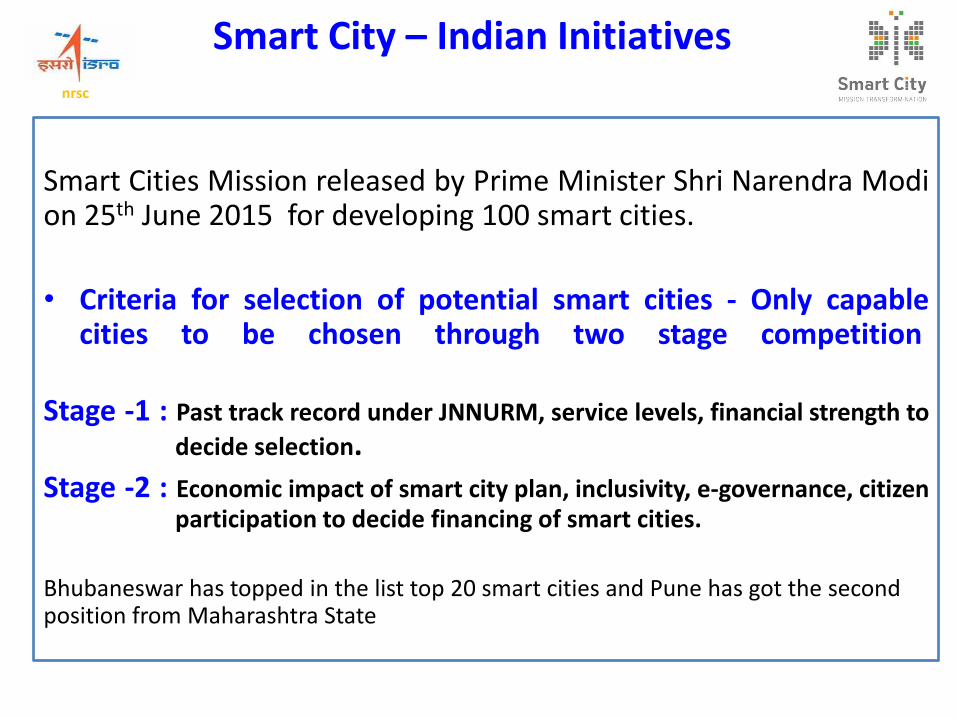
Smart Cities Mission released by Prime Minister Shri Narendra Modion 25th June 2015 for developing 100 smart cities.
• Criteria for selection of potential smart cities - Only capablecities to be chosen through two stage competition
Stage -1 : Past track record under JNNURM, service levels, financial strength to
decide selection.
Stage -2 : Economic impact of smart city plan, inclusivity, e-governance, citizenparticipation to decide financing of smart cities.
Bhubaneswar has topped in the list top 20 smart cities and Pune has got the second position from Maharashtra State
nrsc
Smart City – Indian Initiatives
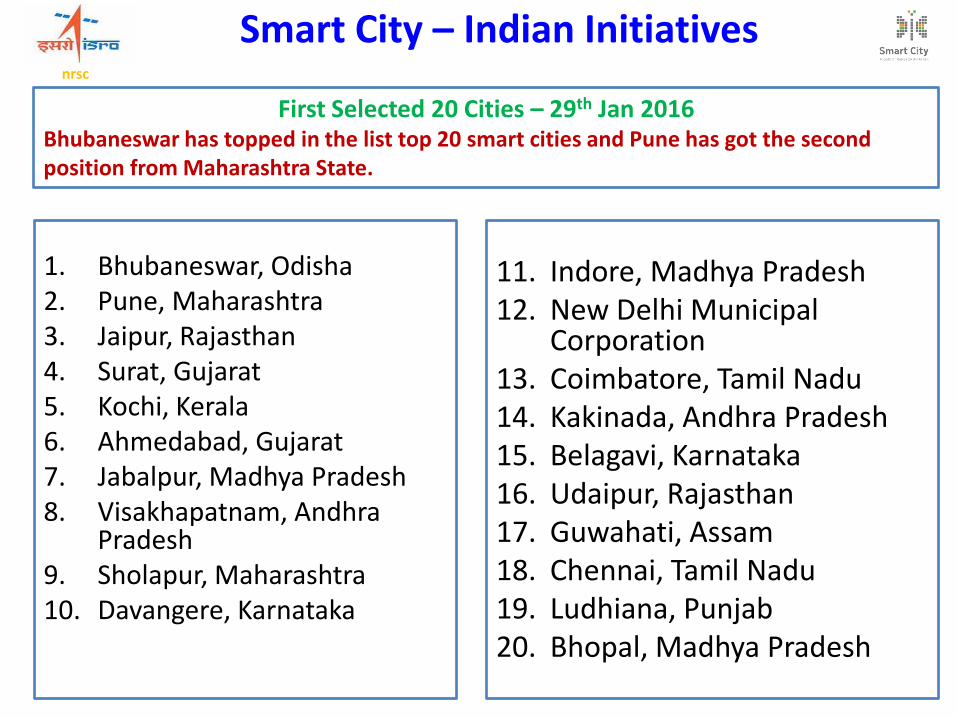
1. Bhubaneswar, Odisha2. Pune, Maharashtra3. Jaipur, Rajasthan4. Surat, Gujarat5. Kochi, Kerala6. Ahmedabad, Gujarat7. Jabalpur, Madhya Pradesh8. Visakhapatnam, Andhra
Pradesh9. Sholapur, Maharashtra10. Davangere, Karnataka
First Selected 20 Cities – 29th Jan 2016Bhubaneswar has topped in the list top 20 smart cities and Pune has got the second position from Maharashtra State.
11. Indore, Madhya Pradesh12. New Delhi Municipal
Corporation13. Coimbatore, Tamil Nadu14. Kakinada, Andhra Pradesh15. Belagavi, Karnataka16. Udaipur, Rajasthan17. Guwahati, Assam18. Chennai, Tamil Nadu19. Ludhiana, Punjab20. Bhopal, Madhya Pradesh
nrsc

nrsc

Telecommunication & Internet• No.of internet connections per 100,000 population• No.of cell phone connections per 100,000 population
Energy• Total residential electrical use per capita(kWh/yr)• %of city population with authorized electrical service.• Energy consumption of public buildings per year • % of total energy derived from renewable sources
Transportation• Km of high capacity public transport system per 100,000 population• Km of light passenger transport system per 100,000 population• Annual number of public transport trips per capita• Number of personal automobiles per capita
Health• Average life expectancy• Number of in-patient hospital beds per 100000 population.• Number of physicians per 100 000 population.• Under age five mortality per 1000 live births.
Waste Water• % of city population served by wastewater collection• % of the city’s wastewater that has received no treatment• % of the city’s wastewater receiving primary treatment• % of the city’s wastewater receiving secondary treatment• % of the city’s wastewater receiving tertiary treatment
CITY INDICATORS
(ISO 37120)
SMART CITY INDICATORS
Economy• City’s unemployment rate.• Assessed value of commercial and industrial properties
Percentage of city population living in poverty.
Education• % of female school aged population enrolled in school.• % of students completing secondary education.• % of students completing secondary education.• Primary education student/teacher ratio
Environment• Fine particulate matter (PM2.5) concentration• Particulate matter (PM10) concentration• Greenhouse gas emissions measured in tonnes
per capita
Finance• Debt service ratio (debt
service expenditure as a percent of a municipality’s own source revenue)
Fire & Emergency response• No. of firefighters per 100000 population• No. of fire related deaths per 100000 population• No. of natural disaster related deaths per 100000 population.
Governance • Voter participation in
last municipal election • % of Women elected to
city-level office.
Safety• Number of police officers per 100,000 population• Number of homicides per 100,000 population
Shelter• % of city population living in slums
Solid Waste• % of city population with regular solid waste collection
(residential)• Total collected municipal solid waste per capita• % of city’s solid waste that is recycled
Urban Planning• Green area (hectares) per
100,000 population
Water and Sanitation• % of city population with potable water supply service• % of city population with sustainable access to an improved water source • % of city population with access to improved sanitation• Total domestic water consumption per capita (litres/day)
BIS Developing
Standards
Role of Geospatial Technology for Smart City Development
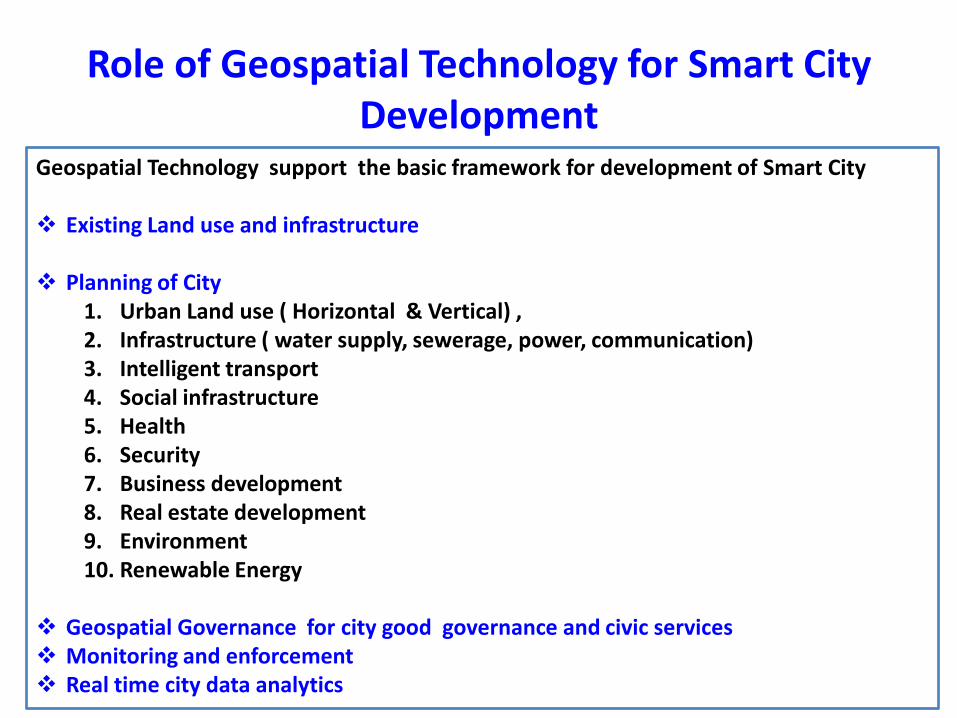
Geospatial Technology support the basic framework for development of Smart City
Existing Land use and infrastructure
Planning of City1. Urban Land use ( Horizontal & Vertical) , 2. Infrastructure ( water supply, sewerage, power, communication)3. Intelligent transport 4. Social infrastructure5. Health6. Security7. Business development8. Real estate development9. Environment 10. Renewable Energy
Geospatial Governance for city good governance and civic services Monitoring and enforcement Real time city data analytics

Bhuvan-NUIS:GIS Based Master Plan Preparation
Shri M. Venkaiah Naidu, the Union Minister for Urban Development, Housing and Urban Poverty Alleviation
and Parliamentary Affairs, released the URDPFI Guidelines-2014, at the National Workshop on Draft Model
Building Bye-Laws-2015, in New Delhi on February 18, 2015
1. Under Phase -1 NUIS, 1:10,000 Scale Urban Geospatial database from Cartosat-1 + LISS-IV data has been generation for 152 towns and hosted on Bhuvan.
2. On behalf of MoUD, Bhuvan-NUIS: Urban Geospatial Governance application has been developed for Master Plan preparation
Nationwide Training & Capacity Building on Bhuvan-NUIS
1. Trained 2, 500 Town Planning personnel on Bhuvan-NUIS through National workshop,7 Regional workshops, and 25 State level workshop from June 2014 to present.
2. 2 weeks Hands-on training has been given at NRSC to 13 states for preparation of Master Plans for the identified towns.
3. TCPO/MoUD is coordinating ULBs for progress of Master Plan preparation

Database Server
Existing Data Town Specific databases Admin Boundaries Ancillary Data
NUIS-Bhuvan Web App.o Status Updationo Data versioningo Proper loggingo Feedback
Citizen Viewo Overlay of Master Plan.o Overlay of vector layers.o Time series visualization.o Feed back
Town specific View :Authentication o Junior Level Officer Create & Upload data
o Second Level officer Approve or Reject the data Status Update alert Secure Password on mobile
o Higher Level Officer Visualization/ Validation
State : Access to all towns National : Access, state wise
Internet users
Authentication
Internet
Geo web AppGIS for mapping
Creation and Updating Bhuvan - NUIS (Local GIS Tools)
• Single point data management
• Client Bhuvan server• Bhuvan data services• Update of Existing GIS
data• Create New GIS data• Linking attributes to GIS• Mobile Apk for Field data• Final Data uplink to
Bhuvan• Serve uploaded data as
WMS• Help module for Plug-in• Video lectures for
download
ISRO Bhuvan Geo-portal
GIS based Master Plan Formulation– Bhuvan NUIS
Main Features Software Tools
URDPFI-2014

Faridabad City NUIS GIS Database – ULB Portal

AMRUT: Main Components:
1. GIS Based Master Plan
2. Water Supply Systems
3. Sewerage
4. Septage
5. Storm Water Drainage
6. Urban Transport
7. Green Space and Parks
8. Reforms management & support
9. Capacity Building
Space Input : 1:4,000 Scale base map data for
GIS BASED MASTER PLANS : 500 Cities
Atal Mission for Rejuvenation and Urban Transformation(AMRUT)
- 500 Cities (> 1.0 Lakh population)
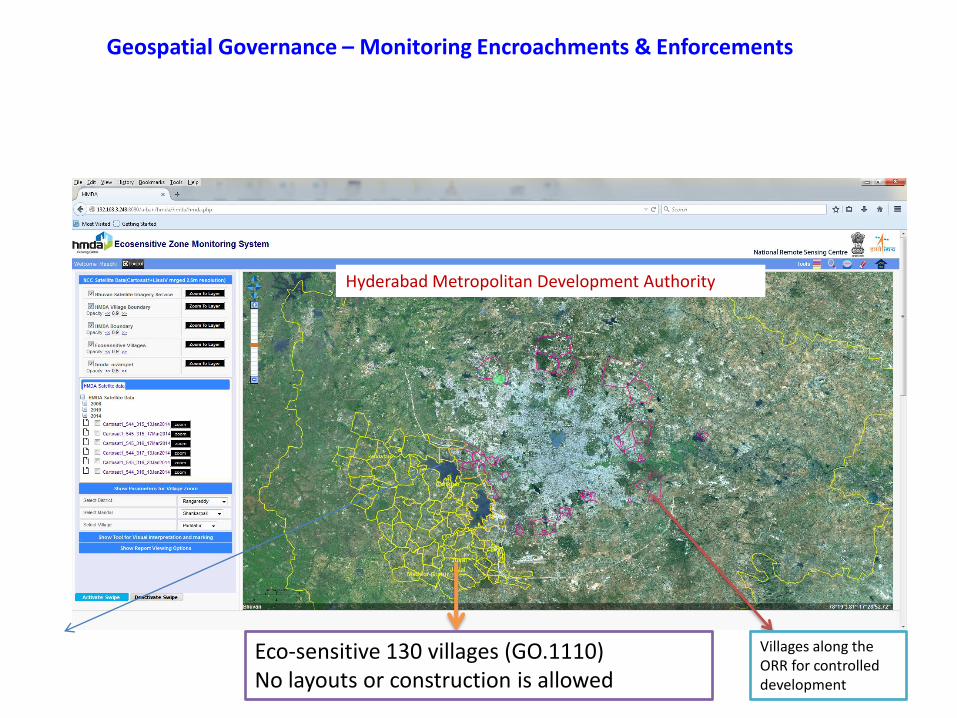
Hyderabad Metropolitan Development Authority
Eco-sensitive 130 villages (GO.1110) No layouts or construction is allowed
Villages along the ORR for controlled development
Geospatial Governance – Monitoring Encroachments & Enforcements
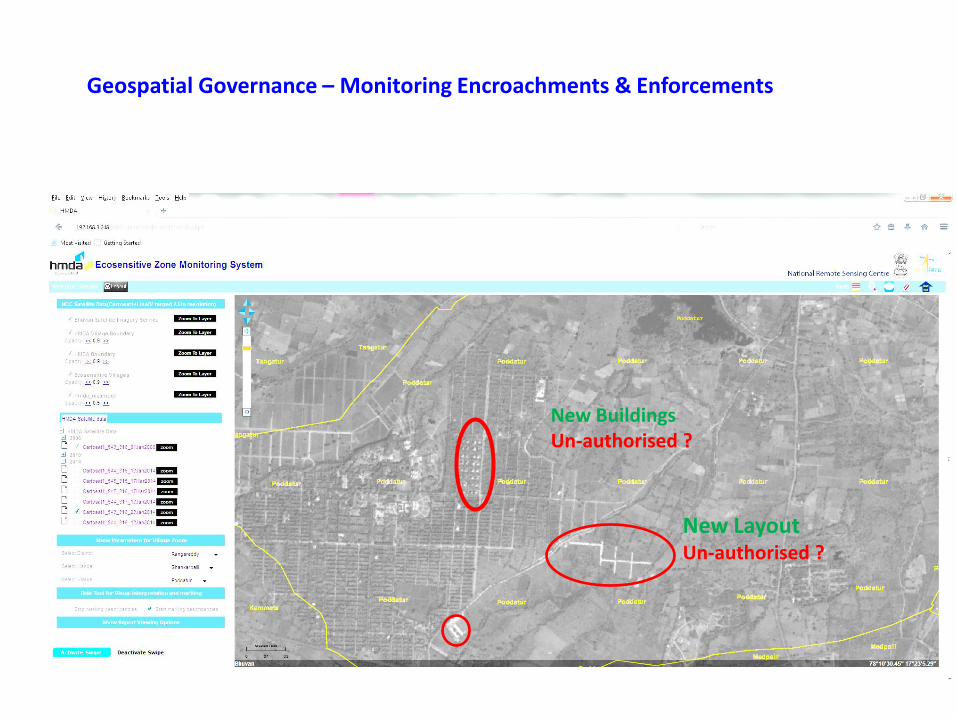
New BuildingsUn-authorised ?
New LayoutUn-authorised ?
Geospatial Governance – Monitoring Encroachments & Enforcements

Potential Building Rooftops for Solar power PVs
CASE STUDY OVER RAJKOT CITY
Heig
ht
in m 3 6 9 12 15 18 21 30
Po
wer
in w
ts
<3
00
30
0-5
00
50
0-1
00
0
10
00
-12
00
12
00
-14
00
14
00
-16
00
0
500
1000
1500
2000
2500
3000
3500
4000
4500
5000
Po
wer
in K
Wts
Potential of solar Energy from Rajkot City
2D Building rooftops are generated from VHRS data and height from Cartosat-1 Stereo data
Building rooftops > 500 sq.m are potential for Solar power - One of the AMRUTH mission reforms.
A Service to users through BHUVAN.

Development of GIS based Smart Solution
Geospatial enabled City Planning and Management 1. Urban Planning & Monitoring2. Land management3. Environmental& recreational 4. Social economic development5. Investment planning
ICT enabled Smart solutions - City Governance 1. Municipal TAX, civic services2. Transport 3. Power 4. Social Infrastructure ( school, hospitals ..)5. Water Supply6. Sewerage & Solid waste
Naya Raipur Infrastructure is SCADA (supervisory control and data acquisition) enabled. SCADA is a system for remote monitoring and control that operates with coded signals over communication channels

Thank you


