D GESS
Gesamtenergiebilanz von Erneuerbaren Energien in der SchweizStudie im Auftrag der SATW
Bjarne Steffen, Dominique Hischier, Tobias S. SchmidtPräsentation beim Strommarkttreffen Schweiz, HSR Rapperswil 13 Nov 2018
|Energy Politics Group | ETH Zürich
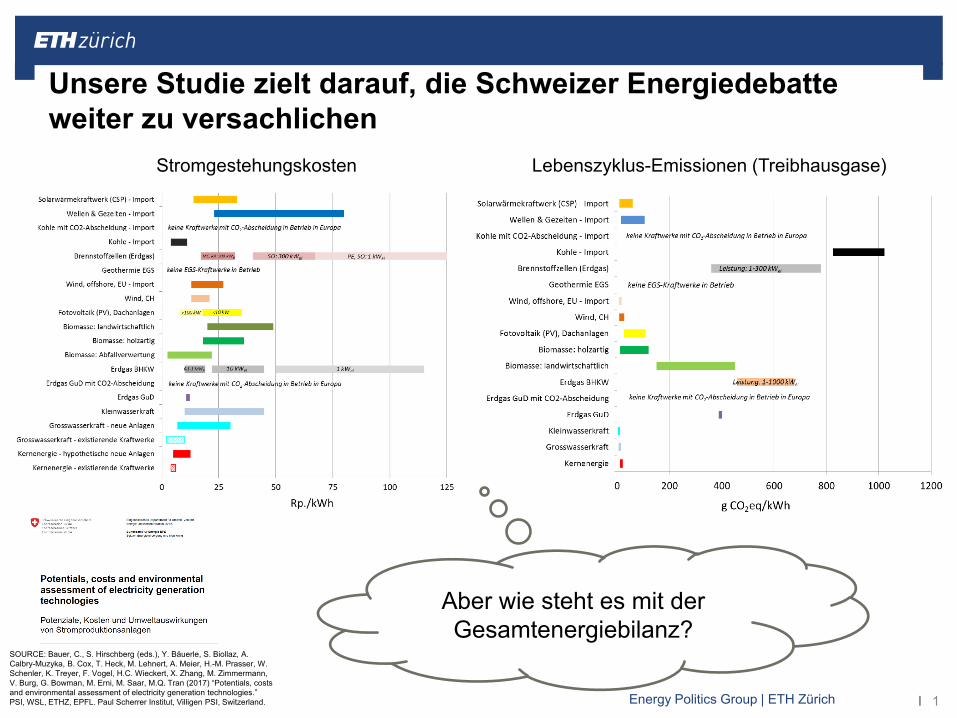
Unsere Studie zielt darauf, die Schweizer Energiedebatte weiter zu versachlichen
1
Stromgestehungskosten Lebenszyklus-Emissionen (Treibhausgase)
SOURCE: Bauer, C., S. Hirschberg (eds.), Y. Bäuerle, S. Biollaz, A. Calbry-Muzyka, B. Cox, T. Heck, M. Lehnert, A. Meier, H.-M. Prasser, W. Schenler, K. Treyer, F. Vogel, H.C. Wieckert, X. Zhang, M. Zimmermann, V. Burg, G. Bowman, M. Erni, M. Saar, M.Q. Tran (2017) “Potentials, costsand environmental assessment of electricity generation technologies.” PSI, WSL, ETHZ, EPFL. Paul Scherrer Institut, Villigen PSI, Switzerland.
Aber wie steht es mit der Gesamtenergiebilanz?
|Energy Politics Group | ETH Zürich
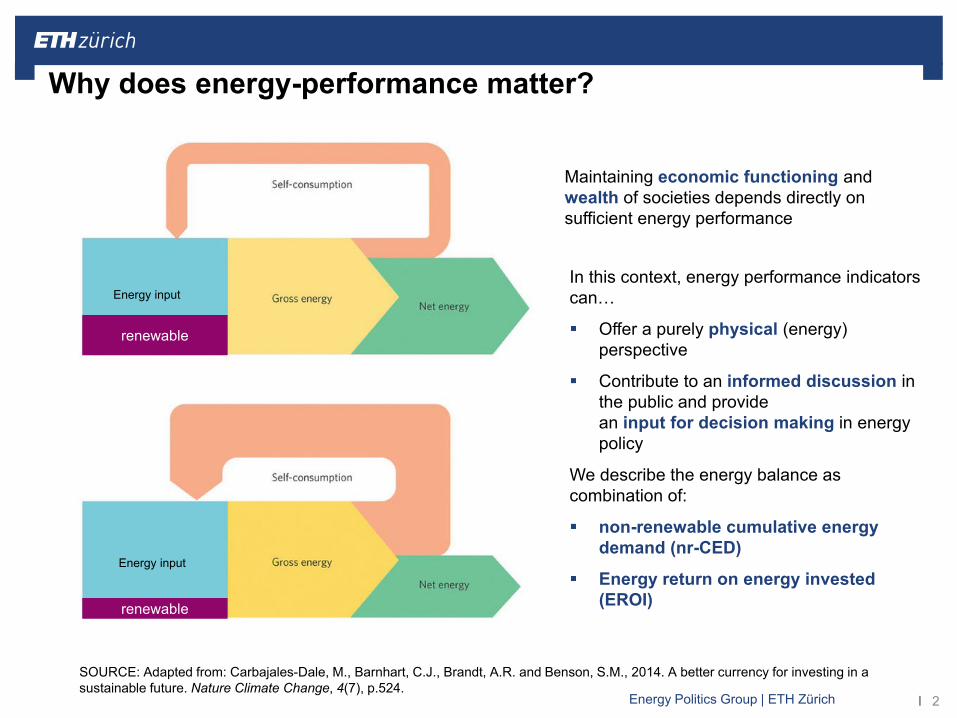
Why does energy-performance matter?
2
SOURCE: Adapted from: Carbajales-Dale, M., Barnhart, C.J., Brandt, A.R. and Benson, S.M., 2014. A better currency for investing in a sustainable future. Nature Climate Change, 4(7), p.524.
In this context, energy performance indicators can…
Offer a purely physical (energy) perspective
Contribute to an informed discussion in the public and provide an input for decision making in energy policy
We describe the energy balance as combination of:
non-renewable cumulative energy demand (nr-CED)
Energy return on energy invested (EROI)
Maintaining economic functioning and wealth of societies depends directly on sufficient energy performance
renewable
renewable
Energy input
Energy input
|Energy Politics Group | ETH Zürich
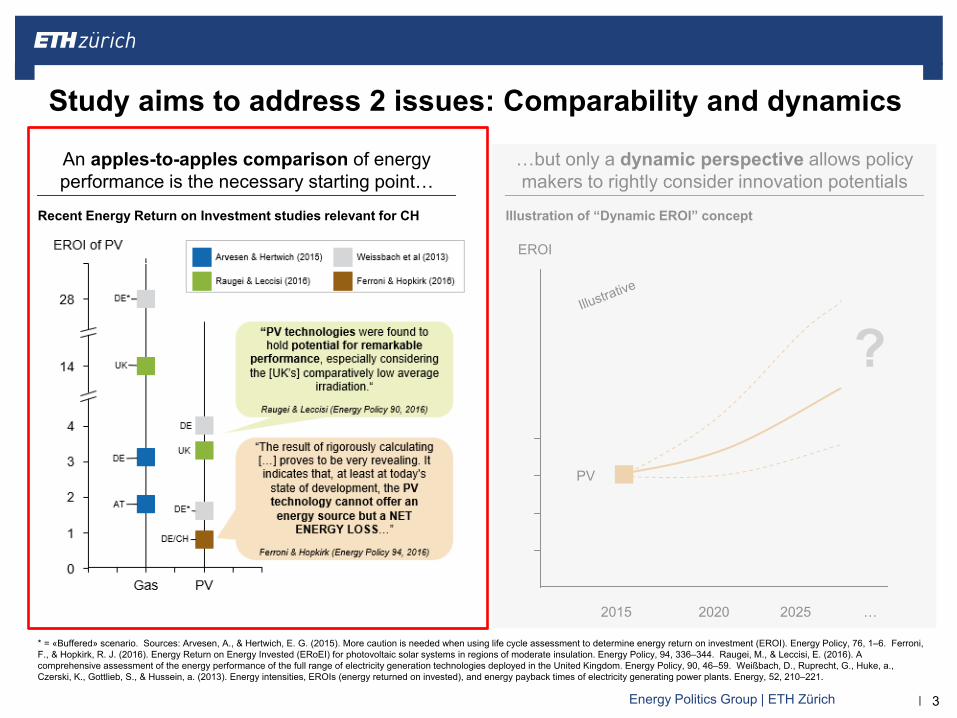
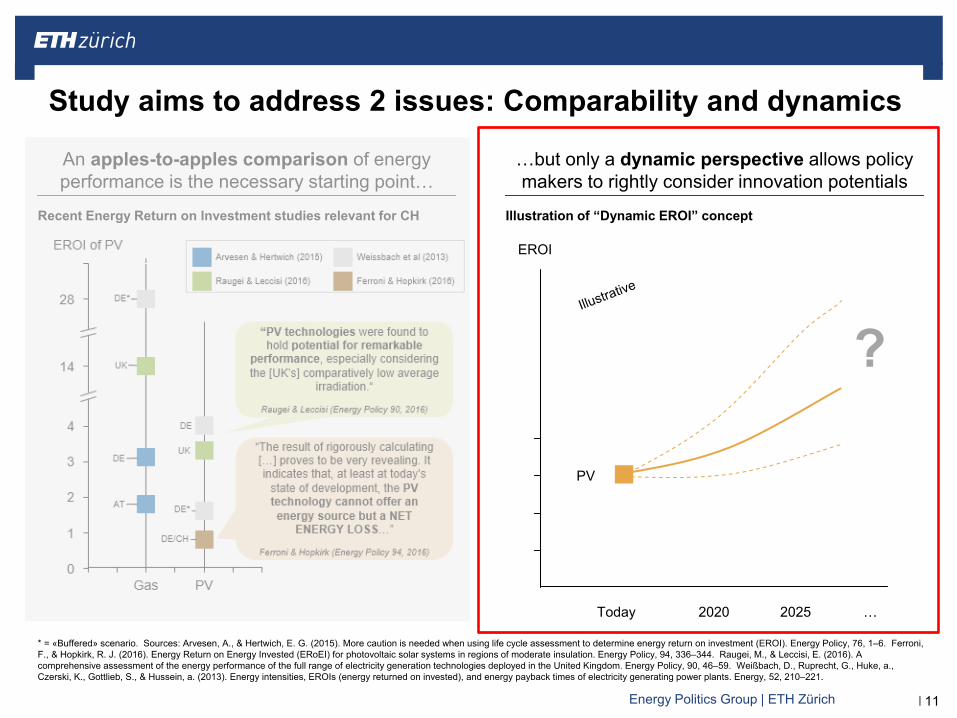
Study aims to address 2 issues: Comparability and dynamics
3
…but only a dynamic perspective allows policy makers to rightly consider innovation potentials
An apples-to-apples comparison of energy performance is the necessary starting point…
Illustration of “Dynamic EROI” conceptRecent Energy Return on Investment studies relevant for CH
* = «Buffered» scenario. Sources: Arvesen, A., & Hertwich, E. G. (2015). More caution is needed when using life cycle assessment to determine energy return on investment (EROI). Energy Policy, 76, 1–6. Ferroni, F., & Hopkirk, R. J. (2016). Energy Return on Energy Invested (ERoEI) for photovoltaic solar systems in regions of moderate insulation. Energy Policy, 94, 336–344. Raugei, M., & Leccisi, E. (2016). A comprehensive assessment of the energy performance of the full range of electricity generation technologies deployed in the United Kingdom. Energy Policy, 90, 46–59. Weißbach, D., Ruprecht, G., Huke, a., Czerski, K., Gottlieb, S., & Hussein, a. (2013). Energy intensities, EROIs (energy returned on invested), and energy payback times of electricity generating power plants. Energy, 52, 210–221.
EROI
2015 20252020 …
PV
?
|Energy Politics Group | ETH Zürich
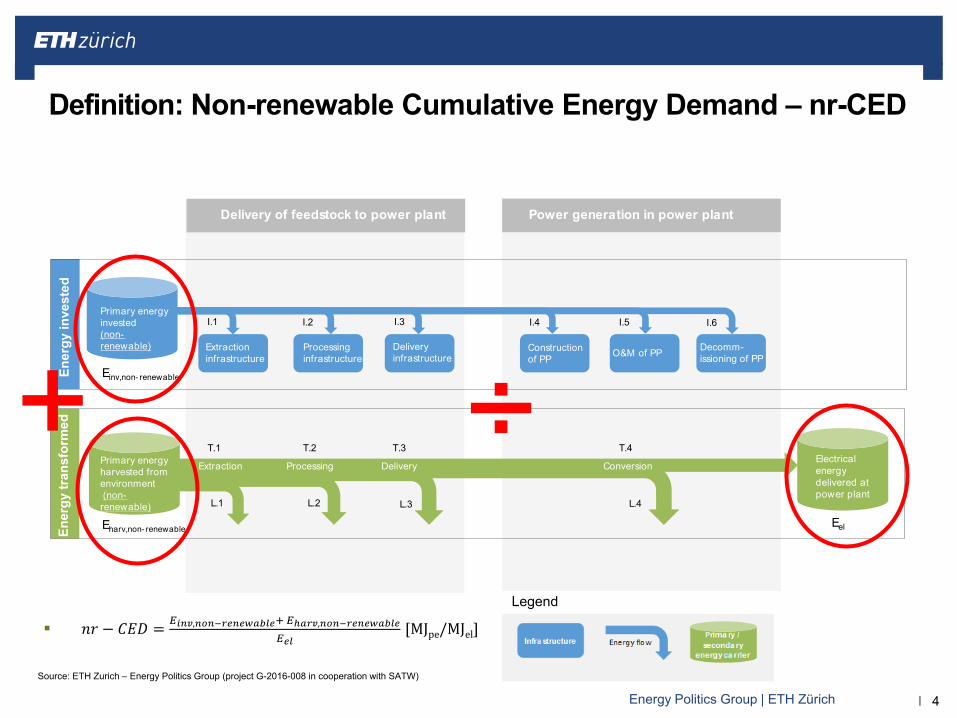
Definition: Non-renewable Cumulative Energy Demand – nr-CED
4
Electrical energydelivered
RQEn
ergy
trans
form
edRQ
Ener
gyin
vest
ed
Delivery of feedstock to power plant Power generation in power plant
Electricalenergydelivered at power plant
Extractioninfrastructure
Processing infrastructure
Deliveryinfrastructure
Constructionof PP O&M of PP Decomm-
issioning of PP
Primary energyinvested(non-renewable)
Extraction Processing Delivery ConversionElectricalenergydelivered at power plant
I.1 I.2 I.3 I.4 I.5 I.6
T.1 T.2 T.3 T.4
L.1 L.2 L.3 L.4
Einv,non- renewable
Eharv,non- renewable Eel
Primary energyharvested fromenvironment(non-renewable)
+ ÷ 𝑛𝑛𝑛𝑛 − 𝐶𝐶𝐶𝐶𝐶𝐶 = 𝐸𝐸𝑖𝑖𝑖𝑖𝑖𝑖,𝑖𝑖𝑛𝑛𝑖𝑖−𝑟𝑟𝑟𝑟𝑖𝑖𝑟𝑟𝑟𝑟𝑟𝑟𝑟𝑟𝑟𝑟𝑟𝑟+ 𝐸𝐸ℎ𝑟𝑟𝑟𝑟𝑖𝑖,𝑖𝑖𝑛𝑛𝑖𝑖−𝑟𝑟𝑟𝑟𝑖𝑖𝑟𝑟𝑟𝑟𝑟𝑟𝑟𝑟𝑟𝑟𝑟𝑟
𝐸𝐸𝑟𝑟𝑟𝑟[MJpe/MJel]
Source: ETH Zurich – Energy Politics Group (project G-2016-008 in cooperation with SATW)
Legend
|Energy Politics Group | ETH Zürich 5
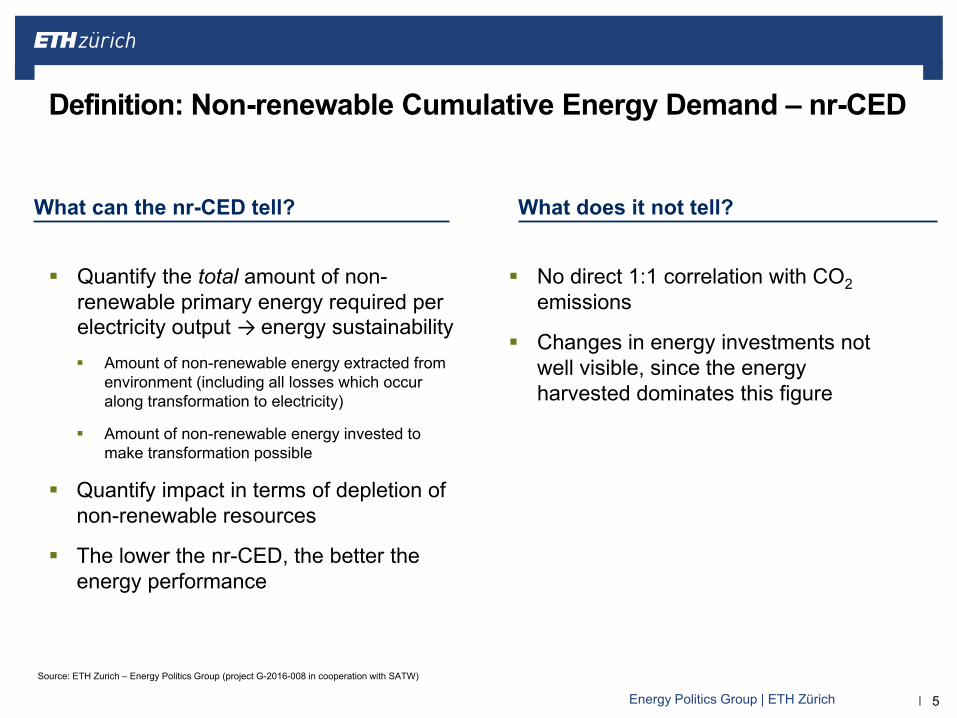
Quantify the total amount of non-renewable primary energy required per electricity output → energy sustainability Amount of non-renewable energy extracted from
environment (including all losses which occur along transformation to electricity)
Amount of non-renewable energy invested to make transformation possible
Quantify impact in terms of depletion of non-renewable resources
The lower the nr-CED, the better the energy performance
No direct 1:1 correlation with CO2emissions
Changes in energy investments not well visible, since the energy harvested dominates this figure
What can the nr-CED tell? What does it not tell?
Source: ETH Zurich – Energy Politics Group (project G-2016-008 in cooperation with SATW)
Definition: Non-renewable Cumulative Energy Demand – nr-CED
|Energy Politics Group | ETH Zürich
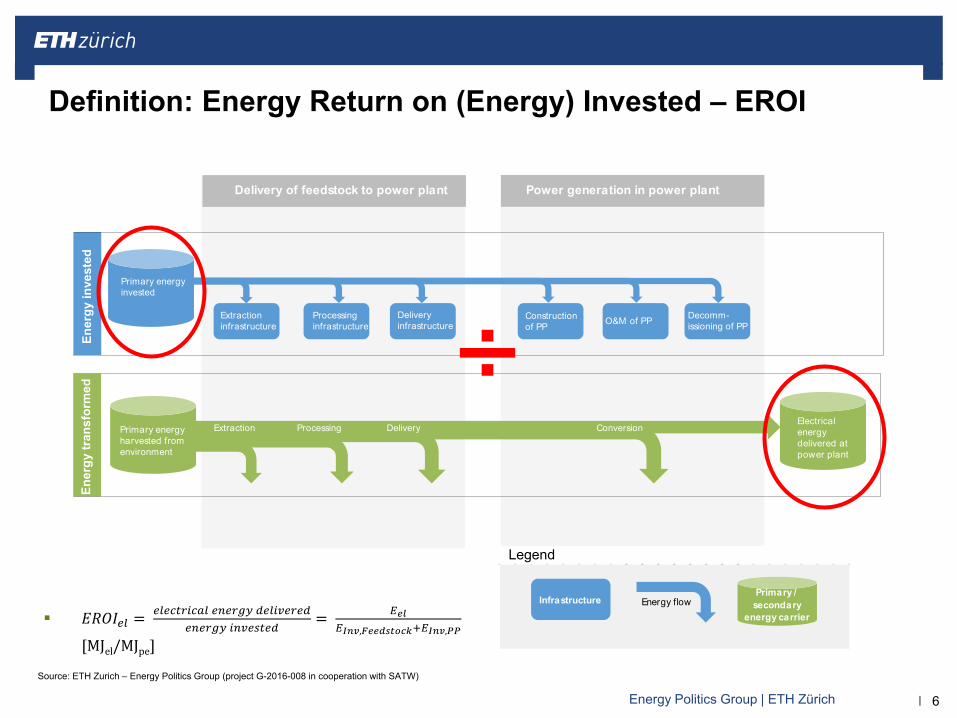
Definition: Energy Return on (Energy) Invested – EROI
6
Electrical energydelivered
RQEn
ergy
tran
sfor
med
RQEn
ergy
inve
sted
Delivery of feedstock to power plant Power generation in power plant
Electricalenergydelivered at power plant
Extractioninfrastructure
Processing infrastructure
Deliveryinfrastructure
Constructionof PP O&M of PP Decomm-
issioning of PP
Primary energyinvested
Extraction Processing Delivery ConversionPrimary energyharvested fromenvironment
Electricalenergydelivered at power plant
InfrastructurePrimary / secondary
energy carrierEnergy flow
𝐶𝐶𝐸𝐸𝐸𝐸𝐸𝐸𝑒𝑒𝑒𝑒 = 𝑒𝑒𝑒𝑒𝑒𝑒𝑒𝑒𝑒𝑒𝑒𝑒𝑒𝑒𝑒𝑒𝑒𝑒𝑒𝑒 𝑒𝑒𝑒𝑒𝑒𝑒𝑒𝑒𝑒𝑒𝑒𝑒 𝑑𝑑𝑒𝑒𝑒𝑒𝑒𝑒𝑑𝑑𝑒𝑒𝑒𝑒𝑒𝑒𝑑𝑑𝑒𝑒𝑒𝑒𝑒𝑒𝑒𝑒𝑒𝑒𝑒𝑒 𝑒𝑒𝑒𝑒𝑑𝑑𝑒𝑒𝑖𝑖𝑒𝑒𝑒𝑒𝑑𝑑
= 𝐸𝐸𝑟𝑟𝑟𝑟𝐸𝐸𝐼𝐼𝑖𝑖𝑖𝑖,𝐹𝐹𝑟𝑟𝑟𝑟𝐹𝐹𝐹𝐹𝐹𝐹𝑛𝑛𝐹𝐹𝐹𝐹+𝐸𝐸𝐼𝐼𝑖𝑖𝑖𝑖,𝑃𝑃𝑃𝑃
[MJel/MJpe]
÷Legend
Source: ETH Zurich – Energy Politics Group (project G-2016-008 in cooperation with SATW)
|Energy Politics Group | ETH Zürich 7
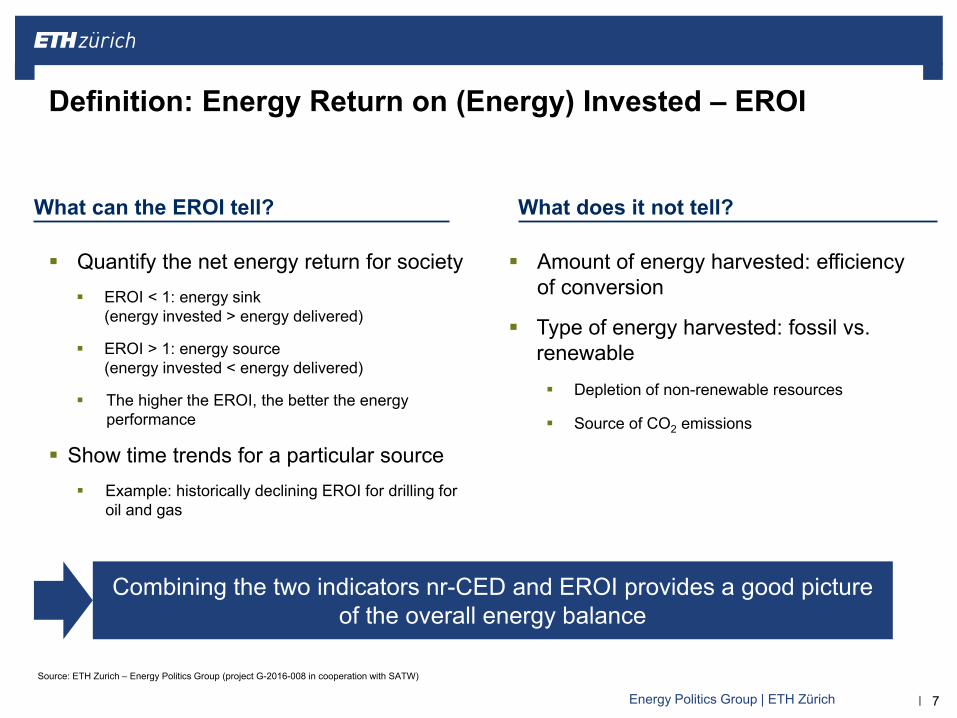
Quantify the net energy return for society EROI < 1: energy sink
(energy invested > energy delivered)
EROI > 1: energy source(energy invested < energy delivered)
The higher the EROI, the better the energy performance
Show time trends for a particular source Example: historically declining EROI for drilling for
oil and gas
Amount of energy harvested: efficiency of conversion
Type of energy harvested: fossil vs. renewable Depletion of non-renewable resources
Source of CO2 emissions
What can the EROI tell? What does it not tell?
Source: ETH Zurich – Energy Politics Group (project G-2016-008 in cooperation with SATW)
Definition: Energy Return on (Energy) Invested – EROI
Combining the two indicators nr-CED and EROI provides a good pictureof the overall energy balance
|Energy Politics Group | ETH Zürich
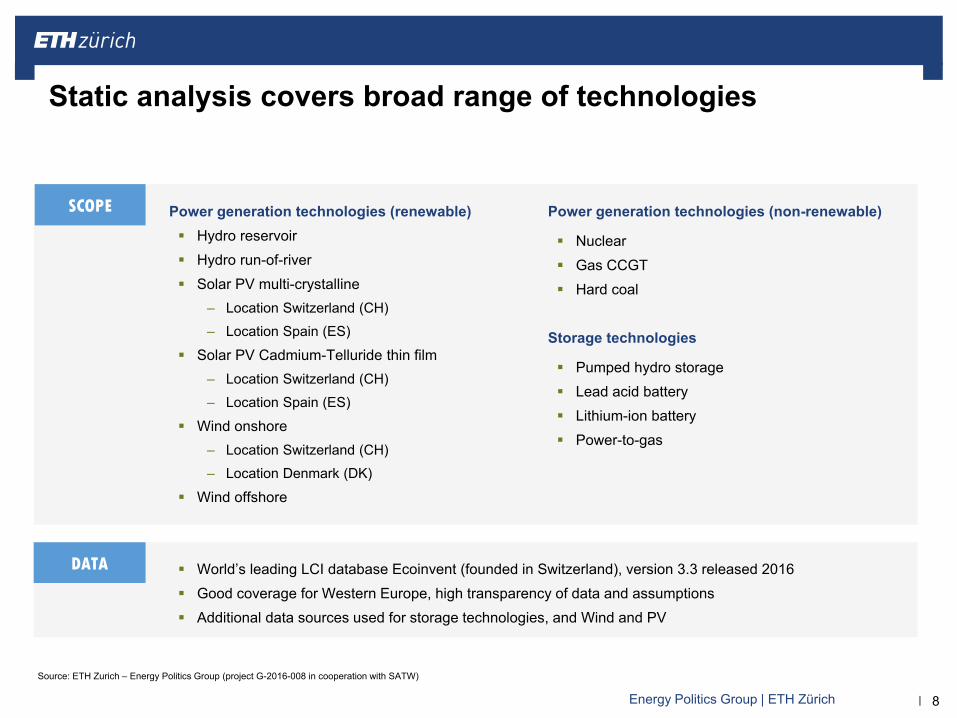
Static analysis covers broad range of technologies
8
World’s leading LCI database Ecoinvent (founded in Switzerland), version 3.3 released 2016 Good coverage for Western Europe, high transparency of data and assumptions Additional data sources used for storage technologies, and Wind and PV
DATA
SCOPE Power generation technologies (non-renewable)
Nuclear Gas CCGT Hard coal
Storage technologies
Pumped hydro storage Lead acid battery Lithium-ion battery Power-to-gas
Power generation technologies (renewable) Hydro reservoir Hydro run-of-river Solar PV multi-crystalline
‒ Location Switzerland (CH)‒ Location Spain (ES)
Solar PV Cadmium-Telluride thin film‒ Location Switzerland (CH)‒ Location Spain (ES)
Wind onshore‒ Location Switzerland (CH)‒ Location Denmark (DK)
Wind offshore
Source: ETH Zurich – Energy Politics Group (project G-2016-008 in cooperation with SATW)
|Energy Politics Group | ETH Zürich
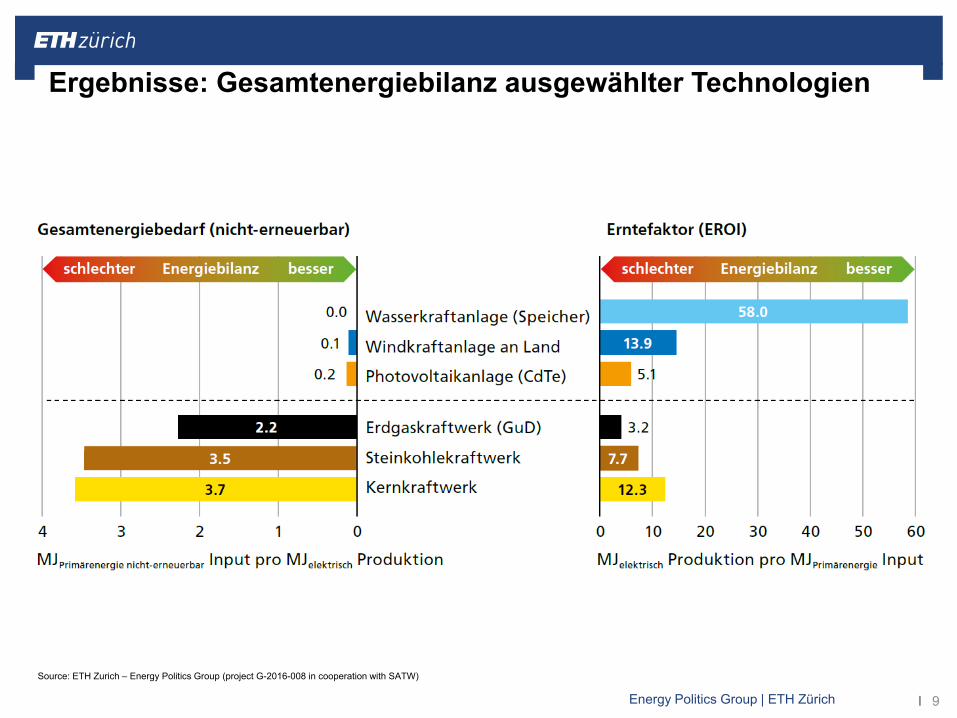
Ergebnisse: Gesamtenergiebilanz ausgewählter Technologien
9
Source: ETH Zurich – Energy Politics Group (project G-2016-008 in cooperation with SATW)
|Energy Politics Group | ETH Zürich
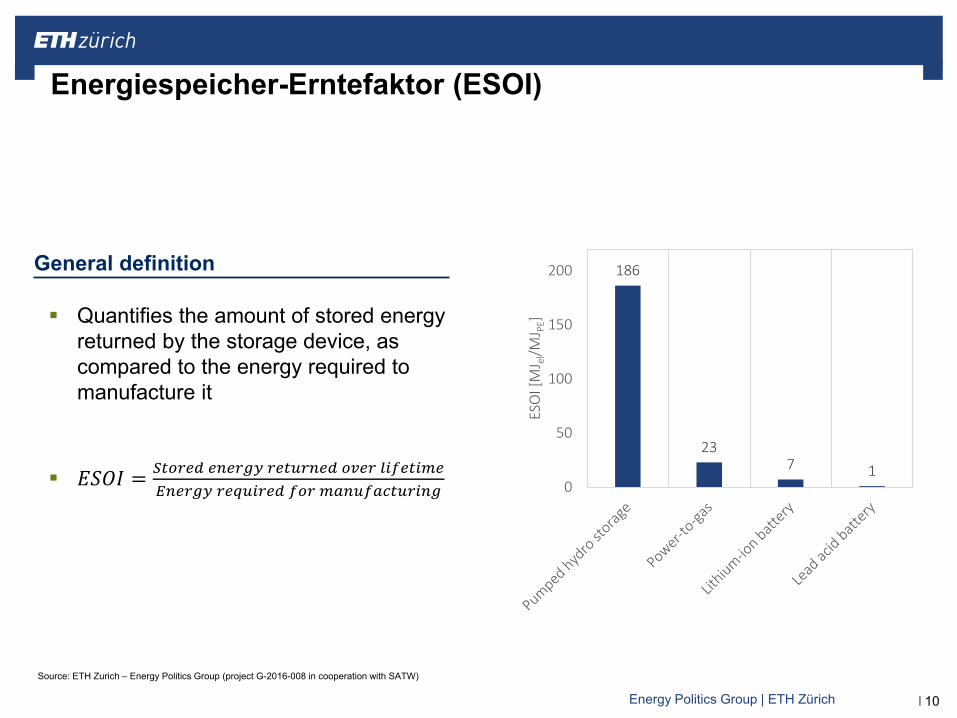
Energiespeicher-Erntefaktor (ESOI)
10
186
237 1
0
50
100
150
200
ESO
I [M
J el/M
J PE]
Source: ETH Zurich – Energy Politics Group (project G-2016-008 in cooperation with SATW)
Quantifies the amount of stored energy returned by the storage device, as compared to the energy required to manufacture it
𝐶𝐶𝐸𝐸𝐸𝐸𝐸𝐸 = 𝑆𝑆𝑒𝑒𝑆𝑆𝑒𝑒𝑒𝑒𝑑𝑑 𝑒𝑒𝑒𝑒𝑒𝑒𝑒𝑒𝑒𝑒𝑒𝑒 𝑒𝑒𝑒𝑒𝑒𝑒𝑟𝑟𝑒𝑒𝑒𝑒𝑒𝑒𝑑𝑑 𝑆𝑆𝑑𝑑𝑒𝑒𝑒𝑒 𝑒𝑒𝑒𝑒𝑙𝑙𝑒𝑒𝑒𝑒𝑒𝑒𝑙𝑙𝑒𝑒𝐸𝐸𝑒𝑒𝑒𝑒𝑒𝑒𝑒𝑒𝑒𝑒 𝑒𝑒𝑒𝑒𝑟𝑟𝑟𝑟𝑒𝑒𝑒𝑒𝑒𝑒𝑑𝑑 𝑙𝑙𝑆𝑆𝑒𝑒 𝑙𝑙𝑒𝑒𝑒𝑒𝑟𝑟𝑙𝑙𝑒𝑒𝑒𝑒𝑒𝑒𝑟𝑟𝑒𝑒𝑒𝑒𝑒𝑒𝑒𝑒
General definition
|Energy Politics Group | ETH Zürich
Study aims to address 2 issues: Comparability and dynamics
11
…but only a dynamic perspective allows policy makers to rightly consider innovation potentials
An apples-to-apples comparison of energy performance is the necessary starting point…
Illustration of “Dynamic EROI” conceptRecent Energy Return on Investment studies relevant for CH
* = «Buffered» scenario. Sources: Arvesen, A., & Hertwich, E. G. (2015). More caution is needed when using life cycle assessment to determine energy return on investment (EROI). Energy Policy, 76, 1–6. Ferroni, F., & Hopkirk, R. J. (2016). Energy Return on Energy Invested (ERoEI) for photovoltaic solar systems in regions of moderate insulation. Energy Policy, 94, 336–344. Raugei, M., & Leccisi, E. (2016). A comprehensive assessment of the energy performance of the full range of electricity generation technologies deployed in the United Kingdom. Energy Policy, 90, 46–59. Weißbach, D., Ruprecht, G., Huke, a., Czerski, K., Gottlieb, S., & Hussein, a. (2013). Energy intensities, EROIs (energy returned on invested), and energy payback times of electricity generating power plants. Energy, 52, 210–221.
EROI
Today 20252020 …
PV
?
|Energy Politics Group | ETH Zürich
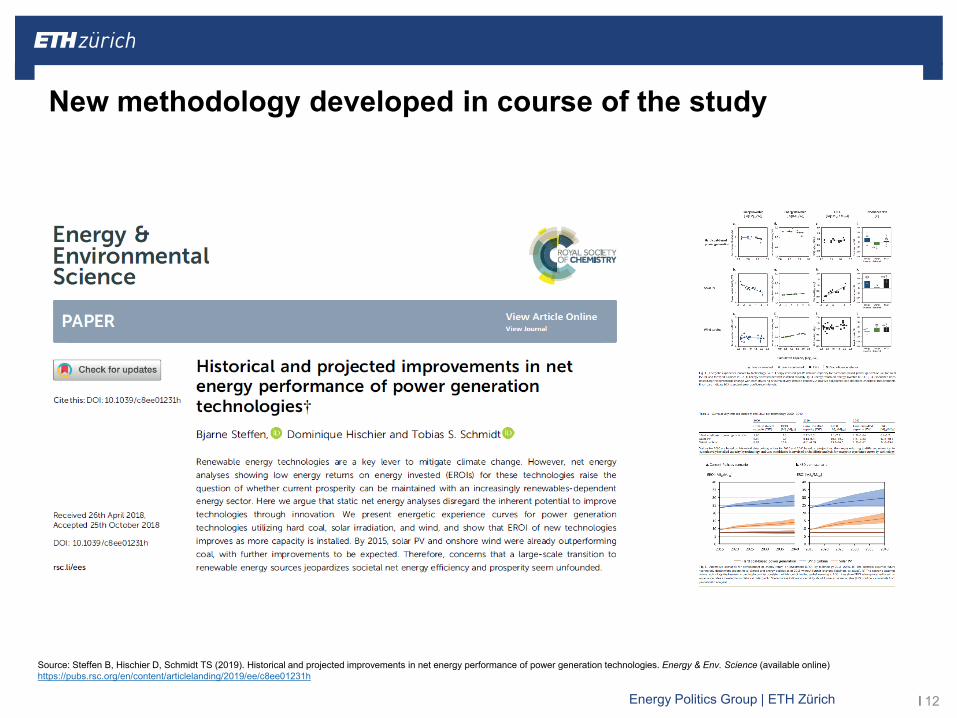
New methodology developed in course of the study
12
Source: Steffen B, Hischier D, Schmidt TS (2019). Historical and projected improvements in net energy performance of power generation technologies. Energy & Env. Science (available online) https://pubs.rsc.org/en/content/articlelanding/2019/ee/c8ee01231h
|Energy Politics Group | ETH Zürich
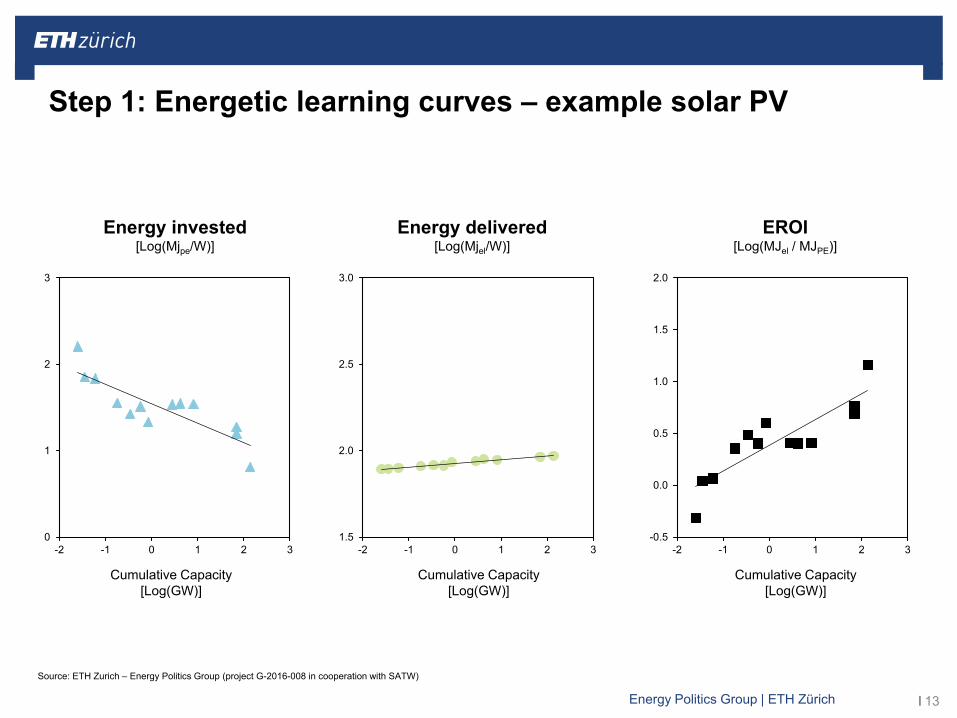
Step 1: Energetic learning curves – example solar PV
13
0
1
2
3
-2 -1 0 1 2 31.5
2.0
2.5
3.0
-2 -1 0 1 2 3-0.5
0.0
0.5
1.0
1.5
2.0
-2 -1 0 1 2 3
Energy invested [Log(Mjpe/W)]
Energy delivered[Log(Mjel/W)]
EROI[Log(MJel / MJPE)]
Cumulative Capacity [Log(GW)]
Cumulative Capacity [Log(GW)]
Cumulative Capacity [Log(GW)]
Source: ETH Zurich – Energy Politics Group (project G-2016-008 in cooperation with SATW)
|Energy Politics Group | ETH Zürich
0
500
1'000
1'500
2'000
2'500
3'000
3'500
4'000
2015 2020 2025 2030 2035 2040
0
500
1'000
1'500
2'000
2'500
3'000
3'500
4'000
2015 2020 2025 2030 2035 2040
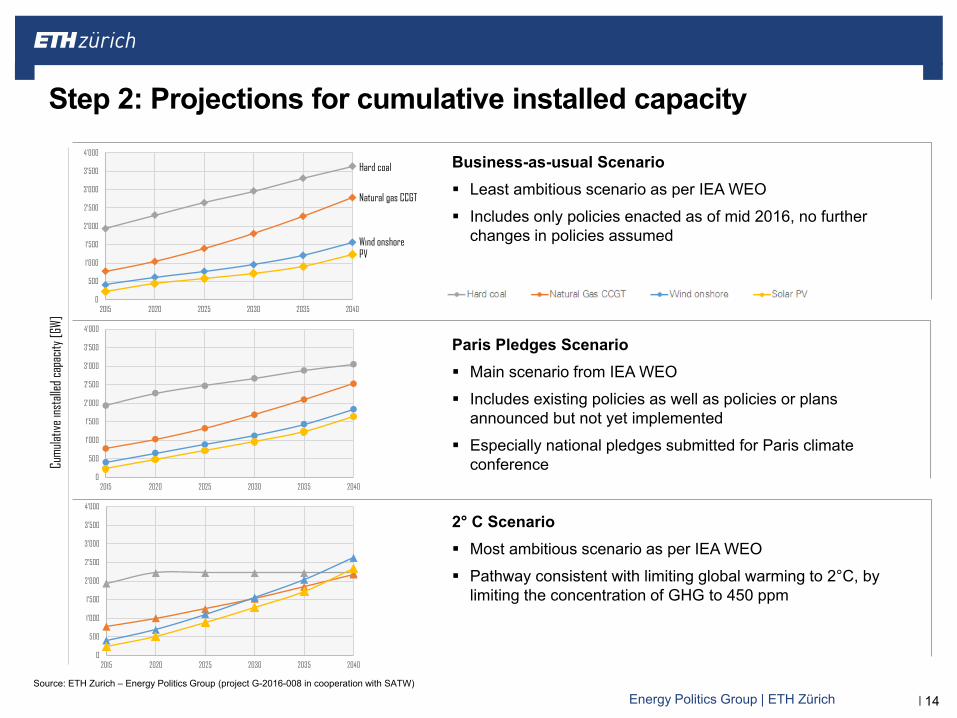
Step 2: Projections for cumulative installed capacity
14
0
500
1'000
1'500
2'000
2'500
3'000
3'500
4'000
2015 2020 2025 2030 2035 2040
Business-as-usual Scenario Least ambitious scenario as per IEA WEO Includes only policies enacted as of mid 2016, no further
changes in policies assumed
Cumu
lative
inst
alled
capa
city [
GW]
Paris Pledges Scenario Main scenario from IEA WEO Includes existing policies as well as policies or plans
announced but not yet implemented Especially national pledges submitted for Paris climate
conference
2° C Scenario Most ambitious scenario as per IEA WEO Pathway consistent with limiting global warming to 2°C, by
limiting the concentration of GHG to 450 ppm
Hard coal
Natural gas CCGT
Wind onshorePV
Source: ETH Zurich – Energy Politics Group (project G-2016-008 in cooperation with SATW)
|Energy Politics Group | ETH Zürich
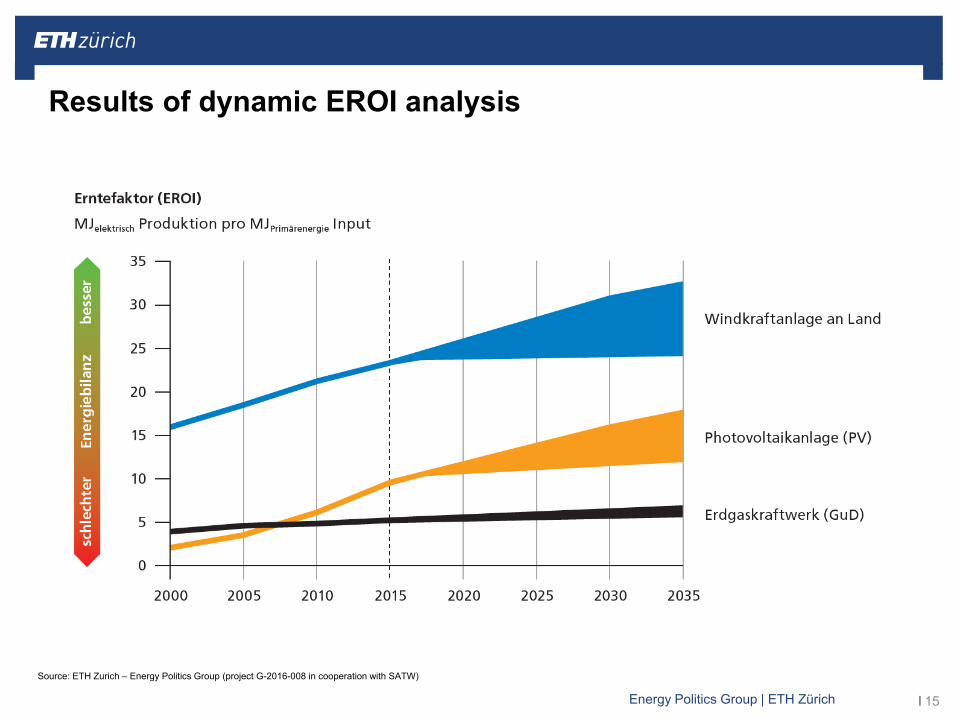
Results of dynamic EROI analysis
15
Source: ETH Zurich – Energy Politics Group (project G-2016-008 in cooperation with SATW)
|Energy Politics Group | ETH Zürich
Zusammenfassung und Implikationen
16
Unsere Studie ergänzt existierende Studien und trägt damit zur Debatte um die Energiezukunft in der Schweiz bei
Die Wasserkraft schneidet aus Sicht der Energiebilanz besonders gut ab (Erzeugung und Speicherung)
Auch neue Erneuerbare haben ihre Energiebilanz in den letzten Jahren stetig verbessern können
Aussagen, Photovoltaik sei eine Energiesenke, sind nicht haltbar
Eine statische Perspektive auf die Energiebilanz kann zu falschen Schlussfolgerungen führen (z.B. relevant bei neuen Speichertechnologien)
|Energy Politics Group | ETH Zürich 17
Die Autoren der Studie bedanken sich bei
der SATW für die finanzielle Unterstützung
der Monitoring group der SATW: Willy R. Gehrer, Dr. Rolf Hügli, and Prof. emeritus Dr. Ulrich W. Suter; dem support team der SATW: Beatrice Huber, Adrian Sulzer, Nicole Wettstein (SATW)
den Teilnehmern des Expertenworkshops am 23.10.2017: Christian Bauer, Nils Epprecht, Daniel Favrat, Markus Friedl, Rolf Frischknecht, Toni Gunzinger, Tony Kaiser, Silvan Rosser, Rolf Schmitz, Andreas Ulbig, Christian Zeyer
Für Details zur neuen Methodik siehe:
Steffen B, Hischier D, Schmidt TS (2019). Historical and projected improvements in net energy performance of power generation technologies. Energy & Environmental Science (available online) https://pubs.rsc.org/en/content/articlelanding/2019/ee/c8ee01231h


