
GIS & Spatial Modeling
Class 4: Raster Analysis I
Geography 4203 / 5203
Some Updates
• Readings discussions
Reminder: Summaries!!! Submitted
BEFORE discussion starts…
• Labs next week:
Start (delayed) of lab season as
scheduled (M / W 9-11am)

• We talked about raster data as one form of
tesselation, their properties and important
things you will find when working with them
• These facts are important to understand
storage limitations, data types, bit depths
and resolution-related problems
• In this context the assignment of pixel values
in classifications or vector-raster conversions
can become complex and is crucial
Last Lecture

• Right, and remember the last session which was areadings discussion about the field-object debate
• Take some impressions with you from this nicesession - we did not come to an end (nobody everdid)
• Keep in mind the different conceptual modelapproaches and their counterparts in differentdisciplines
• Try to remember what the advantages of fieldrepresentations are in modeling, error analysis andmapping
Last Class Meeting

Today‘s Outline
• We will talk about some important basics ofraster analysis and Map Algebra
• You will hear about the principles of MapAlgebra as the foundation of GIS modelingframework
• We will talk about the single building blocksof this modeling language: operators,functions, parameters and objects
• This will give you an impression of theconcepts behind it

Learning Objectives
• You will learn what Map Algebra stands for
and what the single components are
• You will have insights into the functioning of
Map Algebra
• You will understand what functions you are
going to use, what an operator is and how to
combine all elements for iterative models
under control
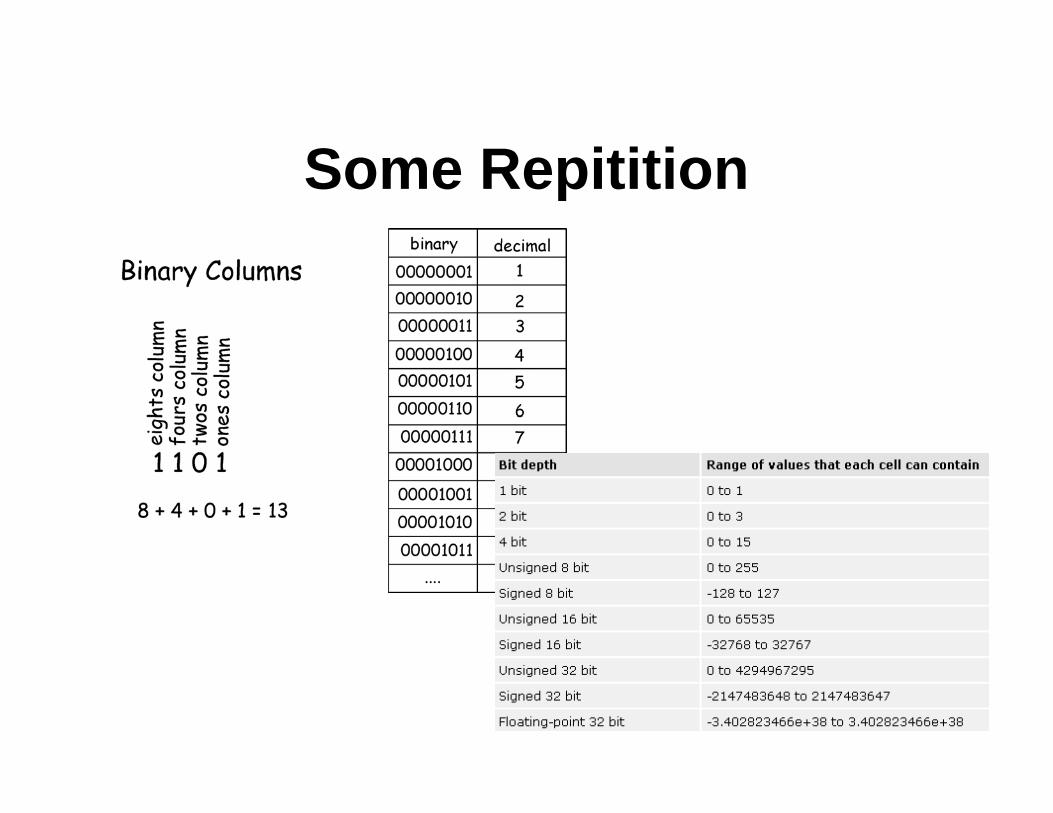
Some Repitition


World Files for
Georeferencing Information
• Some image formats store GI in a header of the
image file (grids, img, GeoTIFF)
• Others use world (ASCII) files (.tfw)
• Origin of an image is ul (row values increase
downward), of a coord system ll

Critical Points in Working
with Raster Data
• Noise, false colors, mixed colors
• Object separation / identification
• Neighborhoods for Morphology operators
• Assignment and coding
• Edges, contours and transitions betweenobjects and background (blurring)

Raster and Raster Analysis
• Two-dimensional arrays organized in columns androws as basis for efficient computation (translation intocode)
• Making use of the simple and flexible data structure
• Fields, objects, regions, connected components,networks
• Developing and extending functionalities andoperators
MyRaster[row][col]

Understanding Raster
Analysis
• To apply analysis tools is easy and
straightforward
• Behind existing tools are complex algorithms
implying mathematics, geometry and matrix
operations between datasets and within
regions of the same layer
• Thus a basic understanding of the concepts
behind these tools is fundamental

Map Algebra
• Introduced by Dana Tomlin and Joseph
Berry
• Cell-by-cell combination of raster data layers
(addition, subtraction, multipl.,…)
• Simple operations on numbers stored as
values at raster cell locations
• Output grids with results at the cell locations
corresponding to input cells

Map Algebra Operations
• Unary Operations
• Binary Operations
• Higher-order Operations

Map Algebra and Matrix
Algebra• One-to-one locational correspondence throughout all
functions applied
• *, /, **, root are defined by the same rules of
maintaining the one-to-one translation
• Matrix Algebra would apply rules for mathematical
matrices (do you remember them?)
• If A is a 2x3 and B is a 3x2 matrix:

Why we are not doing Matrix
Algebra• So that is the special sense of Map Algebra:
• Position of individual grid cells corresponds to their
position in geographic space (not in math matrices)
• Cell values are changed but not their position…
• Intuitively easy to get but it is important to know these
differences… and why they exist

Raster-Related Problems
• Different extents and NoData values (the common
or “shared” area?)
• Different raster cell sizes (how to define comb.)
• Misalignment of raster cells
• Resampling &
Transformations

Map Algebra as Modeling
Language• Something like a modified version of Matrix
Algebra, yes!
• But it can be seen as a complete modelinglanguage (taken as standard for industry)
• Allows for program control, developmentand iteration + mathematical manipulationand logical operators of comparison
• …and thus for the whole complexity ofmodeling
• Fuzzy logic as one example

Rules to be Followed
• E.g. in ESRI’s Spatial Analyst
• Building blocks for Map Algebra languageare:
Objects - datasets, layers, values (as inputsor storage location)
Actions - performed on objects; operatorsand functions (loc,foc,zon,glob) + applicationfunctions
Qualifiers on the actions - parametersdetermining the conduction of a function

Actions I: Basic Operators
• Computations within & between objects
• Remember NoData values…
• Arithmetic (+,-,*,/,**,root,mod)
• Relational / Compare / Conditional(<,>,==,>=,…)
• Boolean / Logical (&&, ||, !, XOR)
• Combinatorial (and, or; unique identifiers notBoolean)
• Assignment (=)
• Accumulative (+=, -=,…)
• Logical (IN, DIFF, OVER)

Actions II: Functions
• Spatial modeling tools for cell-based
data
• Higher-order GIS operations
• Important building blocks for model
implementation based on Map Algebra
• Parameter-dependent

Function Types in Map
Algebra• Local: cell-by-cell
• Neighborhood (Focal): neighborhood
analysis
• Block: whole blocks of cells
• Zonal: within homogeneous areas, zonal
analysis/statistics
• Global: incorporation of the full dataset
• Special types
• Uniform definition of entities in raster
data

Local Functions
• Uniform cell size presumed for cell-by-cell
analysis (ul start)
• Mathematical/arithmetic functions
• Logical operations
• Reclassification
• Nested functions
• Overlay in raster data
• sin(c\:temp\myRaster)

Neighborhood (Focal)
Functions• Everyday needs in raster GIS (slope, aspect)
• Also neighborhoods uniform
• Cell is characterized/modified based on a
predefined neighborhood of grid cells
• Focalsum([inlayer], rectangle, 3, 3)
• Neighborhoods and moving windows
• Blocks non-overlapping

Zonal Functions
• Zones identified from another layer for evaluation of
the target cell
• Zones are geographic areas with certain
characteristics (not necessarily connected such as
regionGroups)
• Internal attribute homogeneity
• meangrid = zonalmean(zonalgrid,valuegrid)
• Statistics are written into each cell of a zone
• Blocks similar but predefined “roving window”
corresponds to the zone

Global Functions
• Operate on the entire grid at once
• Each cell is a function of all input cells
• EucDistance, WeightDistance,
Hydrological, Surface, Visibility,
Viewshed, Max,…
• eucdist(…)

Further Functions
• We will see many specialized functions
implemented in GIS tools
• Complex functions which integrate
many of basic functions
• Hydrological functions
• Surface analysis

Flow Control
• Integral component of Map Algebra
• Command line framework / GUI as interfacewith the GIS user
• Composed of two elements (that work withoperations and functions):
• Statements: verbal representation ofoperations to link operators, functions andprogramming commands
• Programs: notational representation of aprocedure in Map Algebra; ordered sequenceof statements

Iteration
• Repeated execution of the same sequence of
statements under varying conditions or with
other datasets or subsets or based on
testing for conditions (“for looping”, “while
looping”)
• Combined with if then logic
• Makes a modeling framework more powerful

... Geoprocessing Framework
in ArcGIS
• Tool dialog: Single tasks
• Command line
• Model-building: This is
GIS2!
• Scripting/Programming:
This is where we‘ll go in
GIS3!

“Graphical” Modeling
FrameworkDifferent Buffer distances for different features in
different areas

How to Access Map Algebra
• Spatial Analyst: Raster Calculator
• Command line prompt in ArcGrid (going
to be gone…)
• ArcToolbox: Single Output Map
Algebra (for use in ModelBuilder)
• ArcToolbox: Multiple Output Map
Algebra (for use in scripting)

More on Local Functions
• Basically the operators we have seen beforeare executed cell-by-cell
• Remember the handling with NoData values,0-values and values unequal to zero
• Higher level operations based on localprocessing are reclassifications, nestedfunctions and overlays…
• …trigonometric, exp., log., select,statistical,…

Local Functions:
Reclassifications• Assigning output values that depend on the specific
set of input values
• Based on a table, ranges of values (for automated
reclassification) or conditional tests

Local Functions: Nested
Functions
• Functions as arguments in other
functions
absValues = ABS(Input)
LogValues = LN(absValues)
LogValues = LN(ABS(Input))
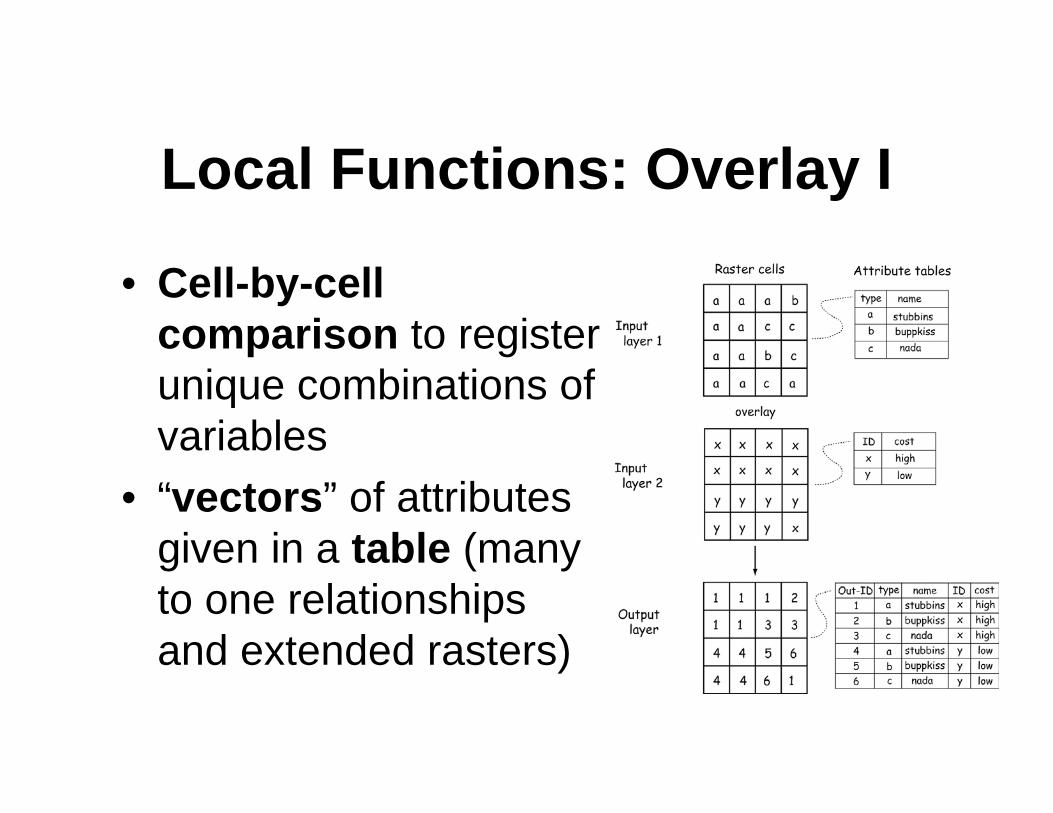
Local Functions: Overlay I
• Cell-by-cell
comparison to register
unique combinations of
variables
• “vectors” of attributes
given in a table (many
to one relationships
and extended rasters)

Local Functions: Overlay II
• Multiplication to mimicclip (extraction) usingsource and templatelayers (binary masks)
• Addition to mimicunion (same id’s fordisjunct pixels withsame characteristicsthrough many-to-oners. + ambiguous ifsame values out ofdifferent combinations) Combining zonal
with overlay…

More on Neighborhood
Functions• Often based on the concept of moving
windows:
• Configuration of raster cells that is positioned
over the input raster and defines the input for an
operation to be applied. Result associated with
center and written to the output. Window
“moves” to the next location…
• Much depends on the neighborhood…
• Any ideas of functions that use NF?

Von Neumann
Neighborhood
• Diamond-shaped
• To define a set of cells
surrounding a given cell
• Ranges r = 0,1,2,3
• N = 2*r(r+1)+1
• “centered square
number”

Moore Neighborhood
• Square-shaped
• To define a set of cells
surrounding a given cell
• Ranges r = 0,1,2,3
• N = (2r+1)2
• “odd squares”

Other Types of Neighborhood

The Principles of Moving
Windows
• Left-to-right and top-to-bottom
• Dimensions: size of the
neighborhood
• Odd-numbered in x and y to
provide a natural center cell and
square- or rectangular-shaped
(or L or wedge or circular)

Examples for Moving
Window NFs

Moving Windows and
Kernels
• Set of constants for agiven window size andshape
• Are applied with afunction to everymoving windowlocation
• What can you see atthe margins of theoutput grid?

Moving Windows and
Margin Erosion• Loss of margins in the original raster dataset: width of
cells from the center cell away
• Solutions: (a) Enlargement of study areas
(b) MW- and Kernel modification at corners (2x2; 1/4)
and edges (2x3; 1/6)

Edge Detection
Using Kernels
• Concentration
changes; elevation
changes,…
• Discovering
contrasts /
differences within
the local
neighborhood

Noise Filtering Using
Kernels
• Smoothing: Reducing differences
between neighboring cells (mean
Kernels / operators; low-pass filters)
• Noise: Errors in measurement,
recording or transforming the data or
due to data loss

High-Pass
Filter
• Accentuates
differences
between adjacent
cells in a moving
window
• Identifying “spikes”
(+ >>) and “pits”
(- >>)
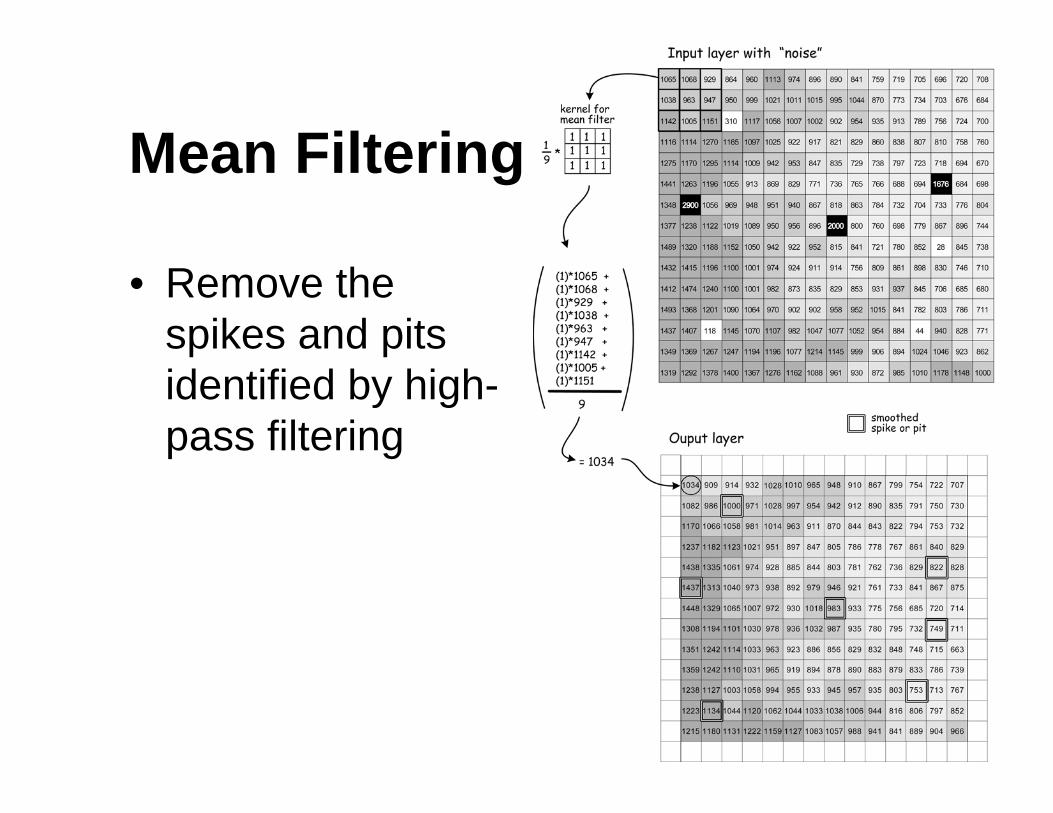
Mean Filtering
• Remove the
spikes and pits
identified by high-
pass filtering

Moving Windows and
Spatial Covariance• The more moving window operations / functions
carried out the more related (autocorrelated) the
cell values are
• Adjacent cells share six of nine cells in the local
neighborhood for the computation…

References
• Longley P.A., M. F. Goodchild, D. J. Maguire and D. W. Rhind. 2005. GeographicInformation Systems and Science. Second Edition. John Wiley, Chichester, 2005.
• Burrough, P.A. and McDonnell, R.A. 1998. Principles of Geographical InformationSystems. London: Oxford.
• Tomlin, C.D. 1991 Cartographic Modeling. In Maguire, D., Goodchild, M.F., andRhind, D. (Eds.) Geographic Information Systems: Principles and Applications.London: Longman: 361 - 374.
• Tomlin, C.D. 1983. An introduction to the Map analysis package.Proceedings. mNational Conference on Resource ManagementApplications: Energy and Environment, San Francisco. Pp. 1-14.


