Global Climate ChangeOverview
Michael D. Mastrandrea, Ph.D.
Deputy Director, Science, IPCC Working Group IIand
Assistant Consulting Professor Woods Institute for the Environment
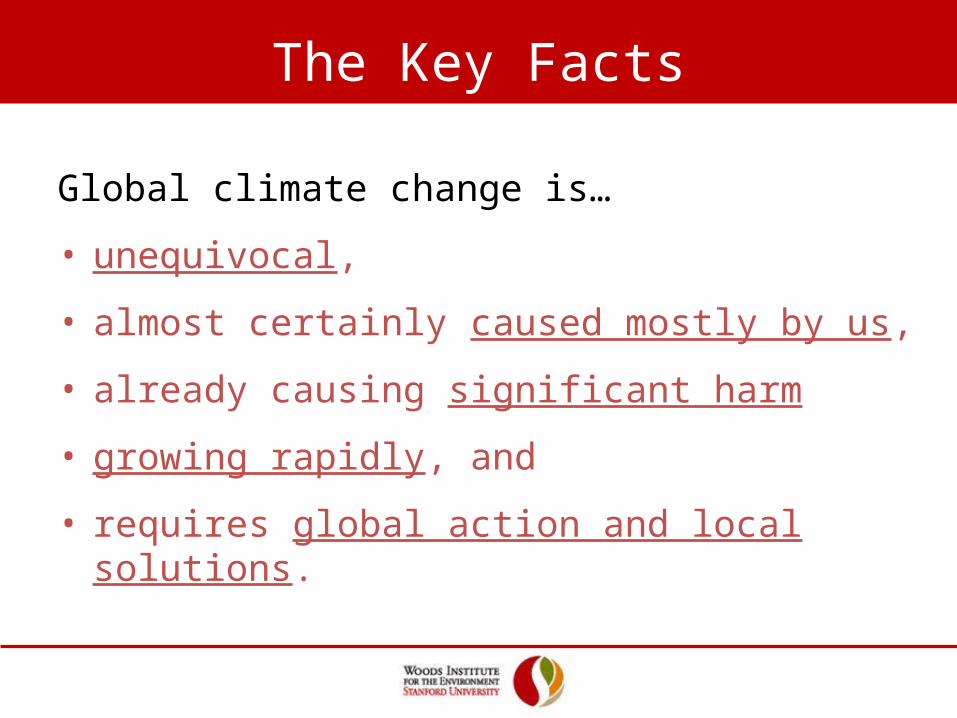
Global climate change is…
• unequivocal,
• almost certainly caused mostly by us,
• already causing significant harm
• growing rapidly, and
• requires global action and local solutions.
The Key Facts
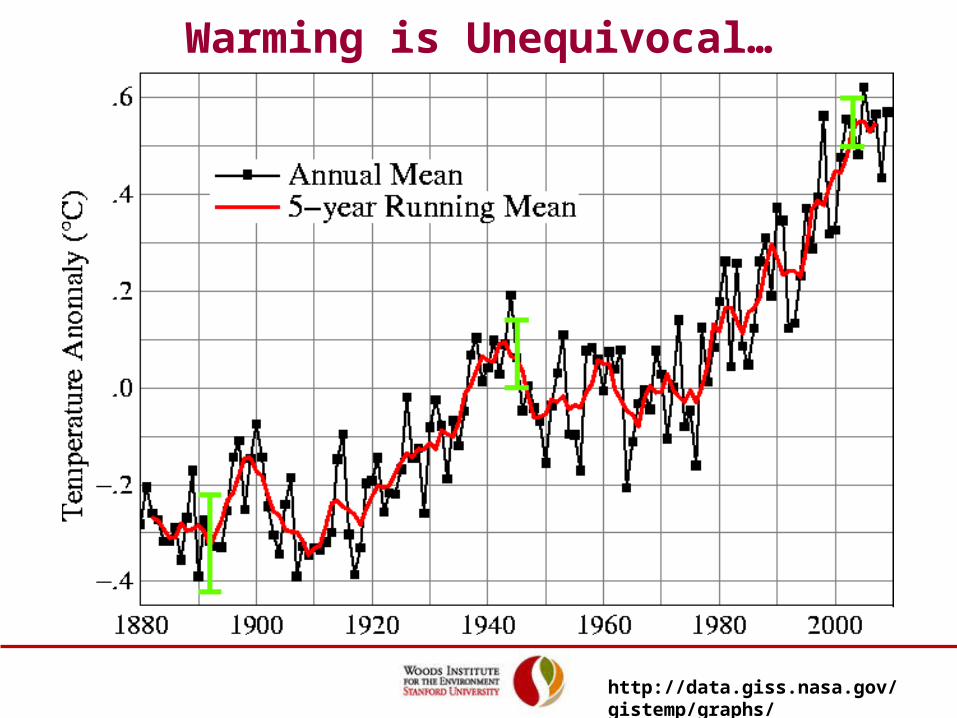
http://data.giss.nasa.gov/gistemp/graphs/
Warming is Unequivocal…
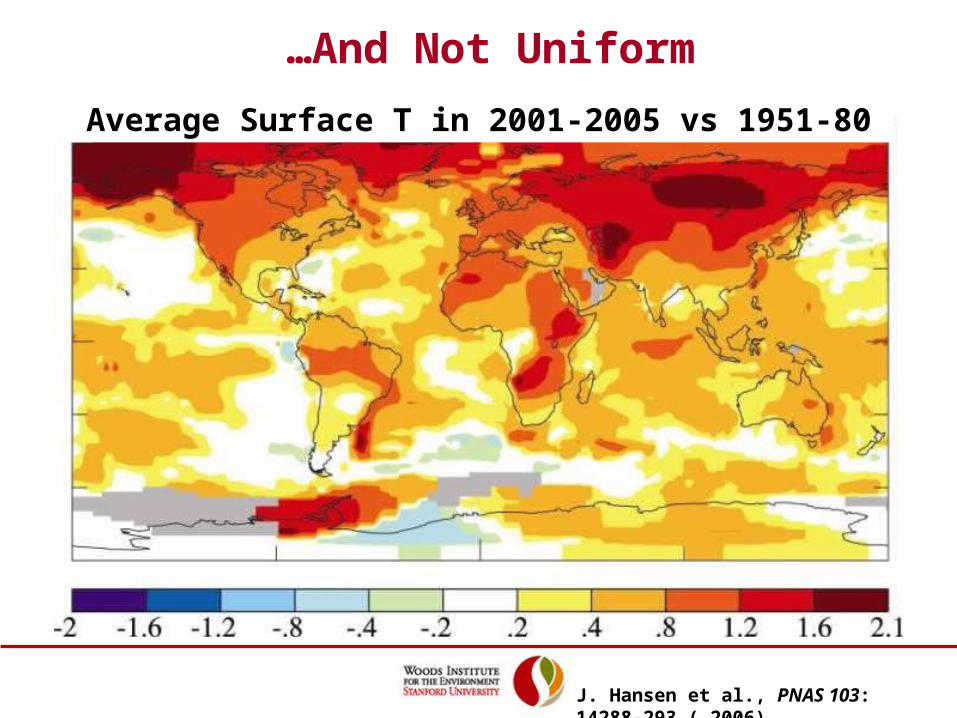
J. Hansen et al., PNAS 103: 14288-293 ( 2006)
…And Not Uniform
Average Surface T in 2001-2005 vs 1951-80
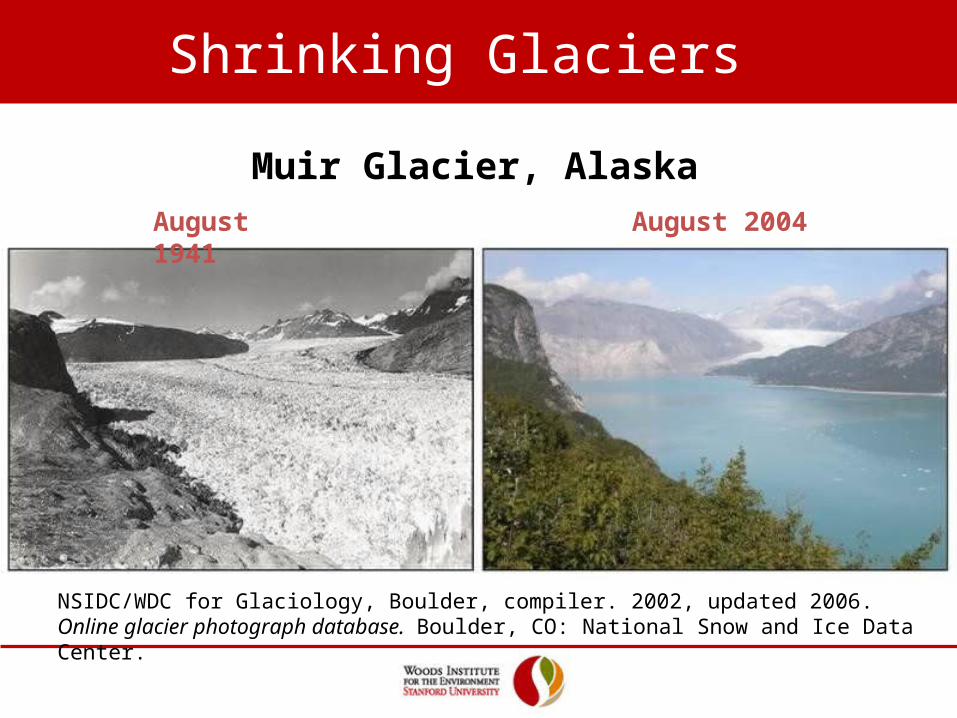
Muir Glacier, Alaska
NSIDC/WDC for Glaciology, Boulder, compiler. 2002, updated 2006. Online glacier photograph database. Boulder, CO: National Snow and Ice Data Center.
August 1941 August 2004
Shrinking Glaciers

1992 2002 2005
Source: ACIA, 2004, CIRES, 2005, Roger Braithwaite, University of Manchester (UK)
Surface melting on Greenland is expanding
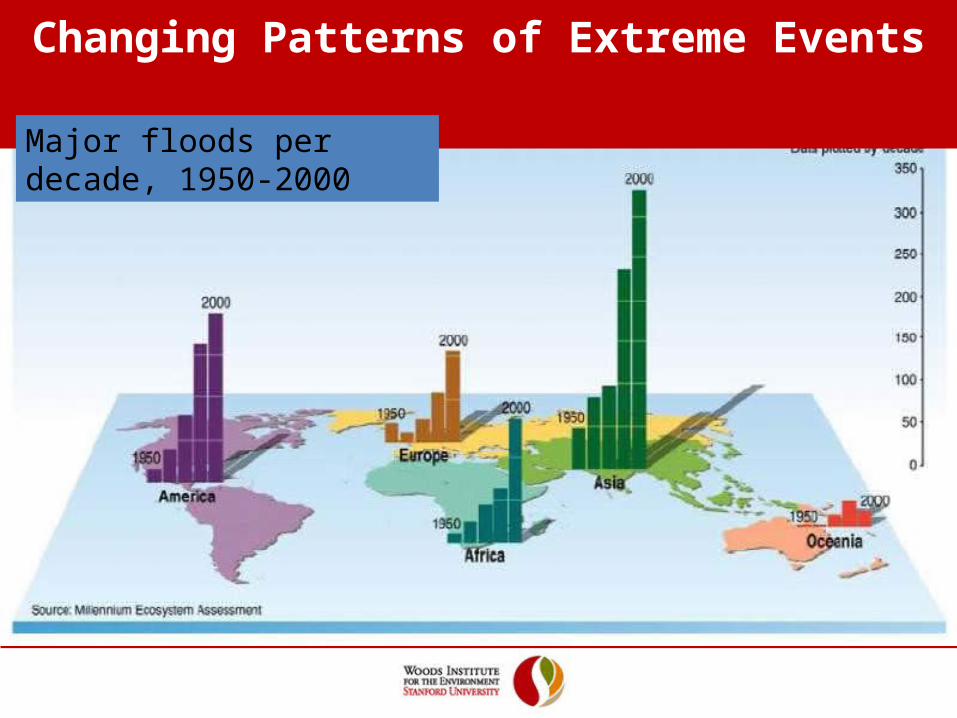
Changing Patterns of Extreme Events
Major floods per decade, 1950-2000

Source: Westerling et al. 2006
Western US area burned
Increasing Wildfire Risk
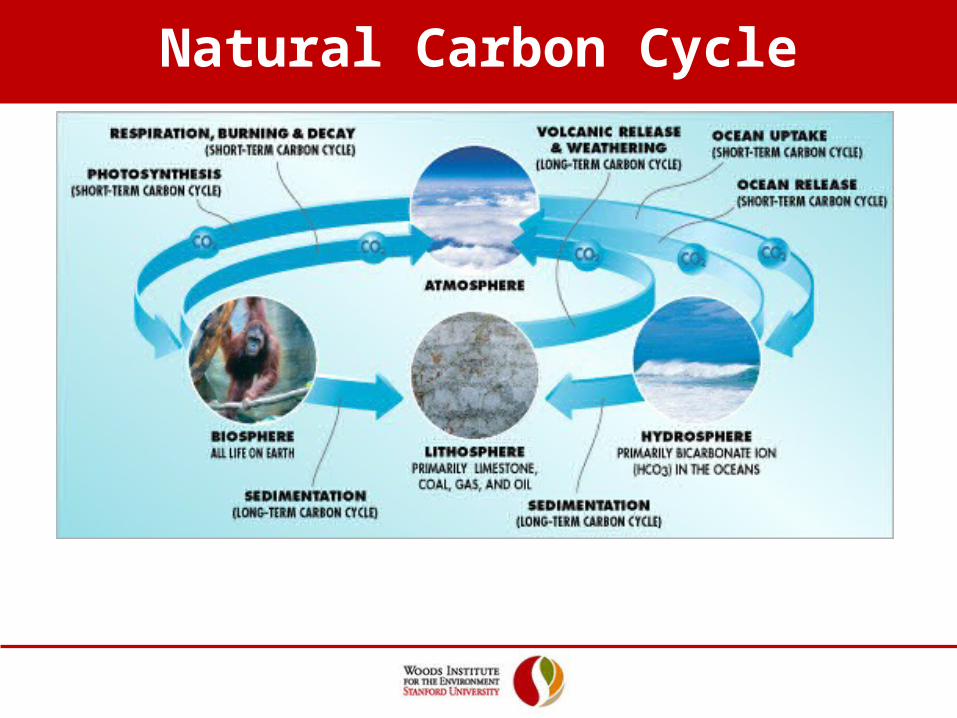
Natural Carbon Cycle
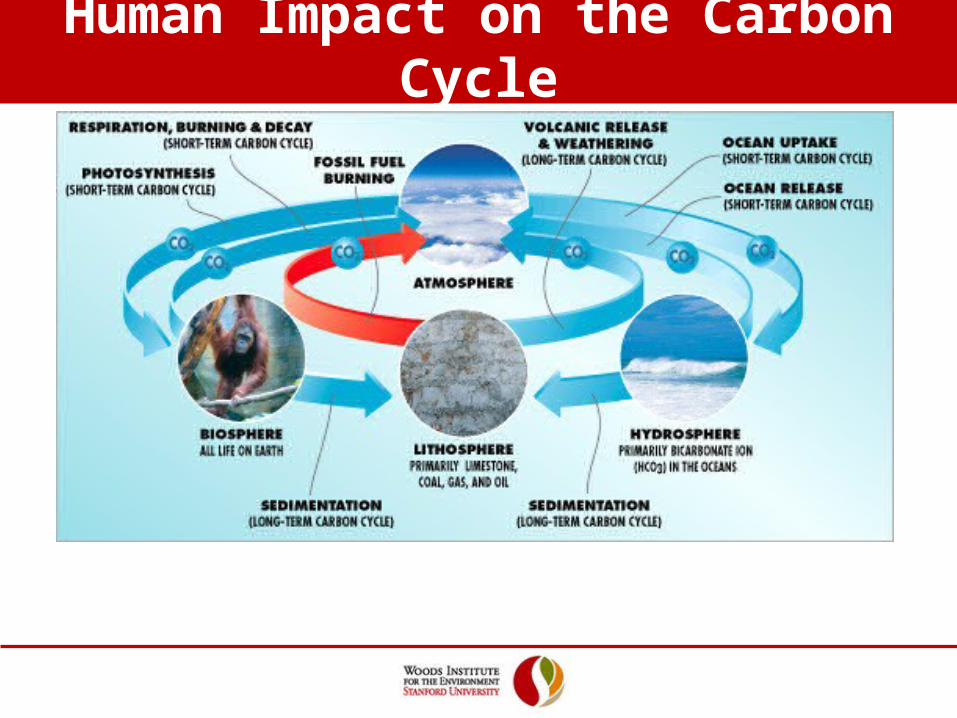
Human Impact on the Carbon Cycle
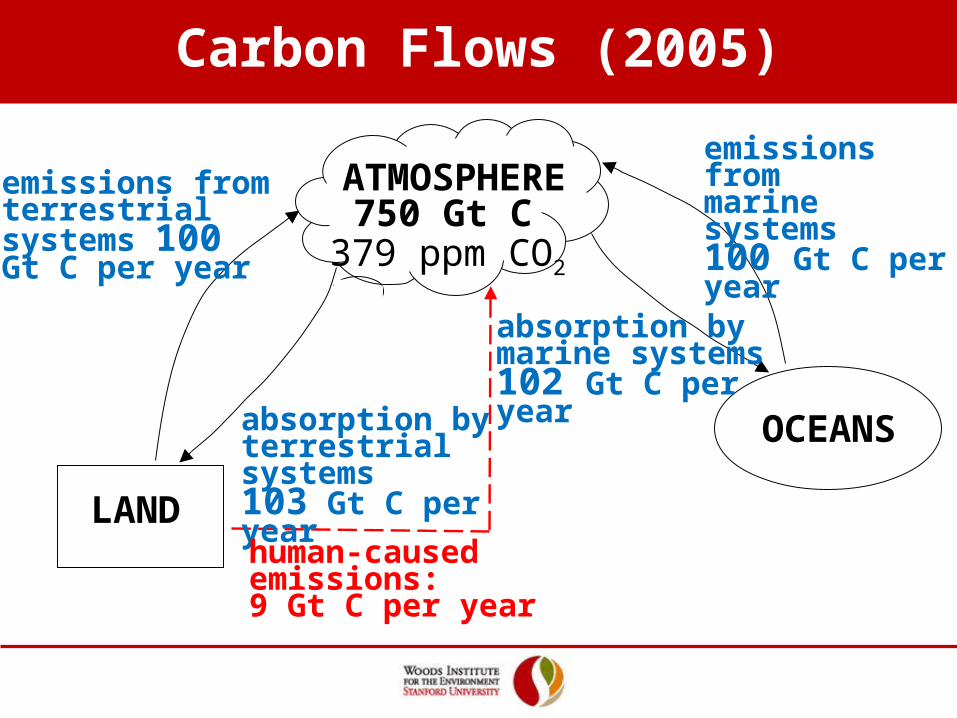
LAND
ATMOSPHERE750 Gt C
379 ppm CO2
OCEANS
emissions fromterrestrial systems 100 Gt C per year
absorption byterrestrial systems103 Gt C per year
emissions frommarine systems100 Gt C per year
absorption bymarine systems102 Gt C per year
human-caused emissions: 9 Gt C per year
Carbon Flows (2005)
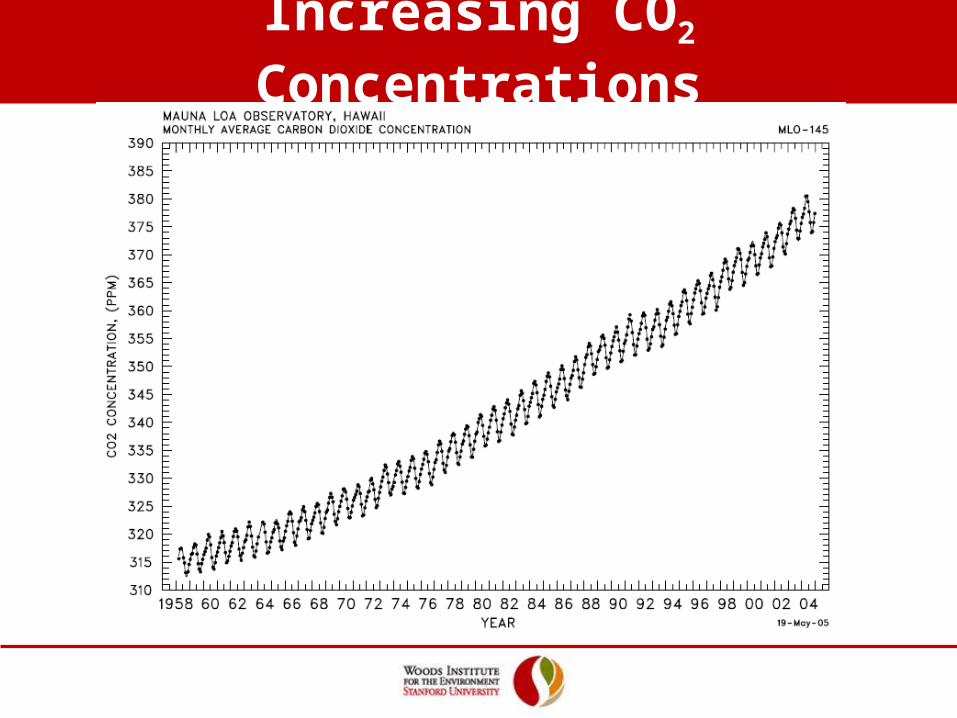
Increasing CO2 Concentrations

IPCC, 2007

IPCC, 2007
Increasing CO2 Concentrations
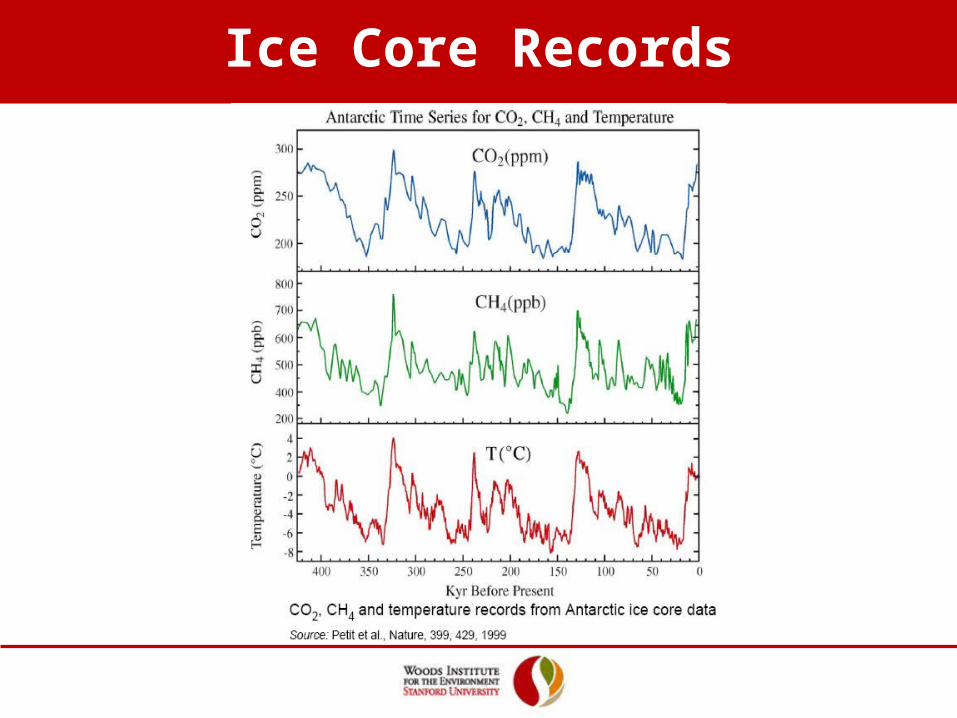
Ice Core Records
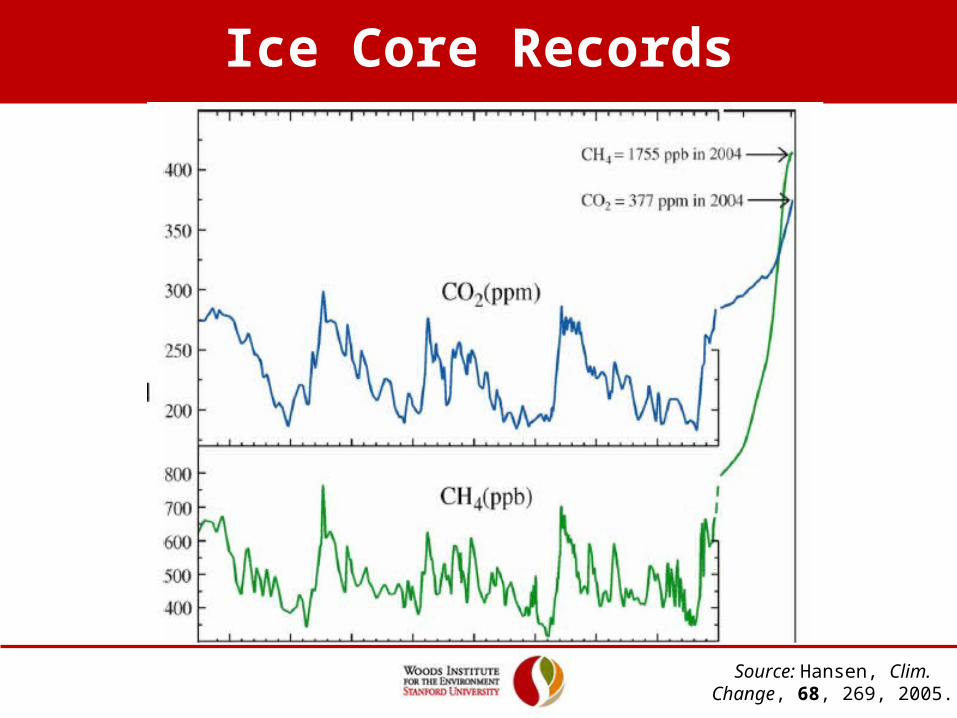
Source: Hansen, Clim.Change, 68, 269, 2005.
Ice Core Records
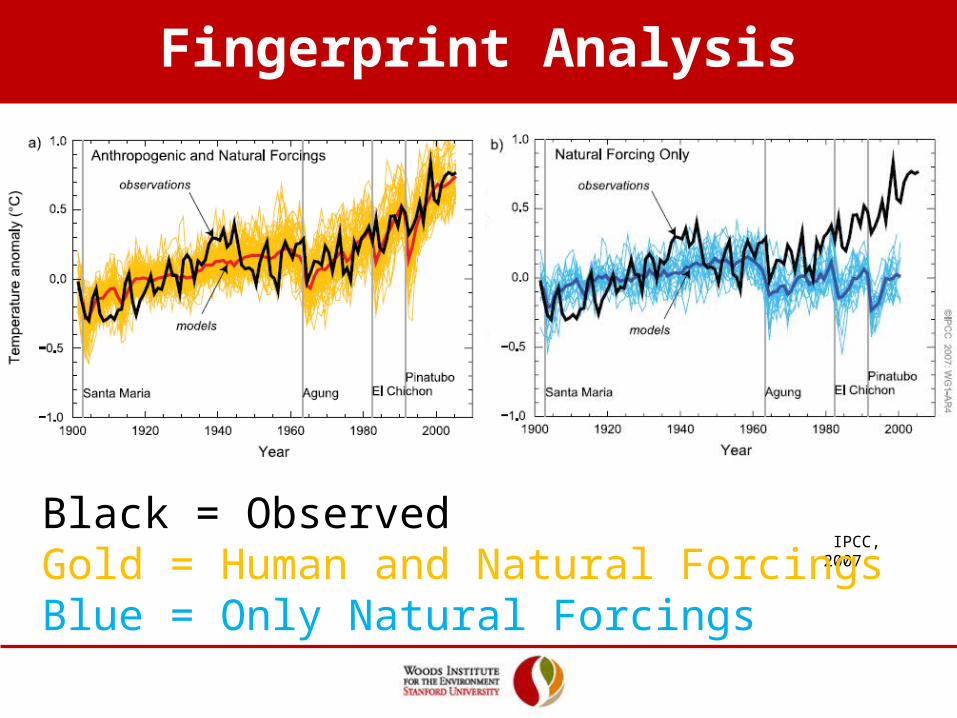
IPCC, 2007Black = ObservedGold = Human and Natural ForcingsBlue = Only Natural Forcings
Fingerprint Analysis
UCS
UCS
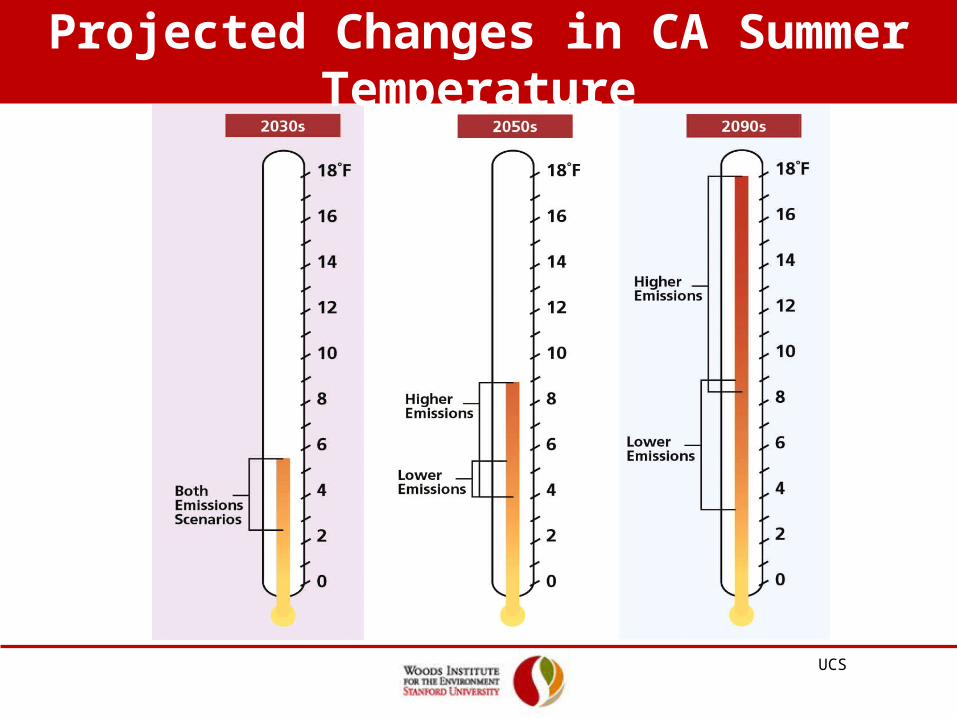
Projected Changes in CA Summer Temperature
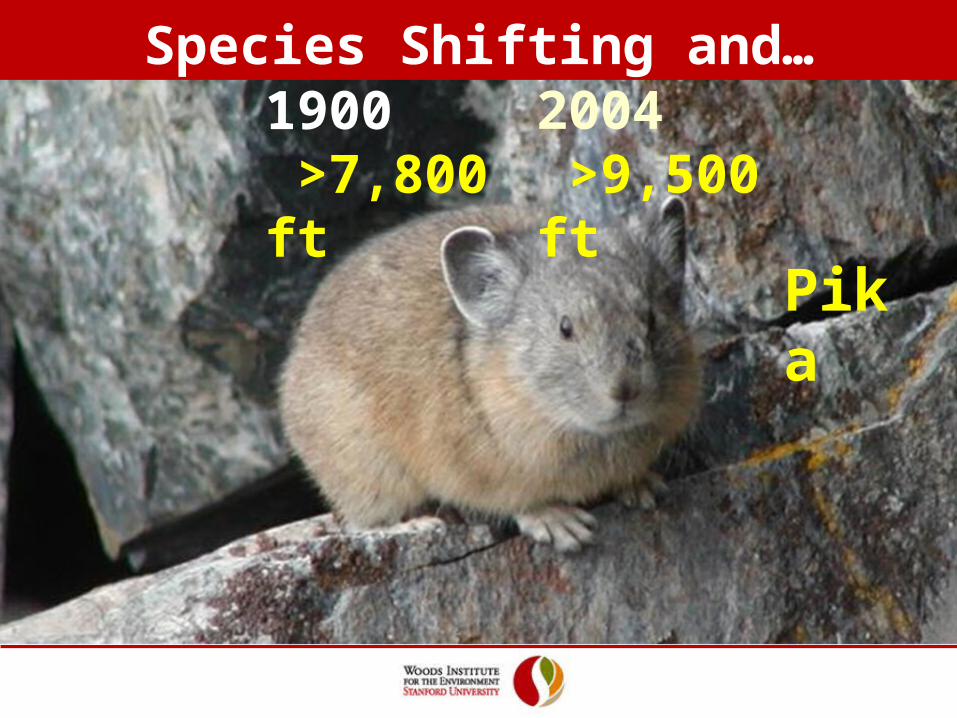
2004 >9,500 ft
1900 >7,800 ft
Pika
Species Shifting and…
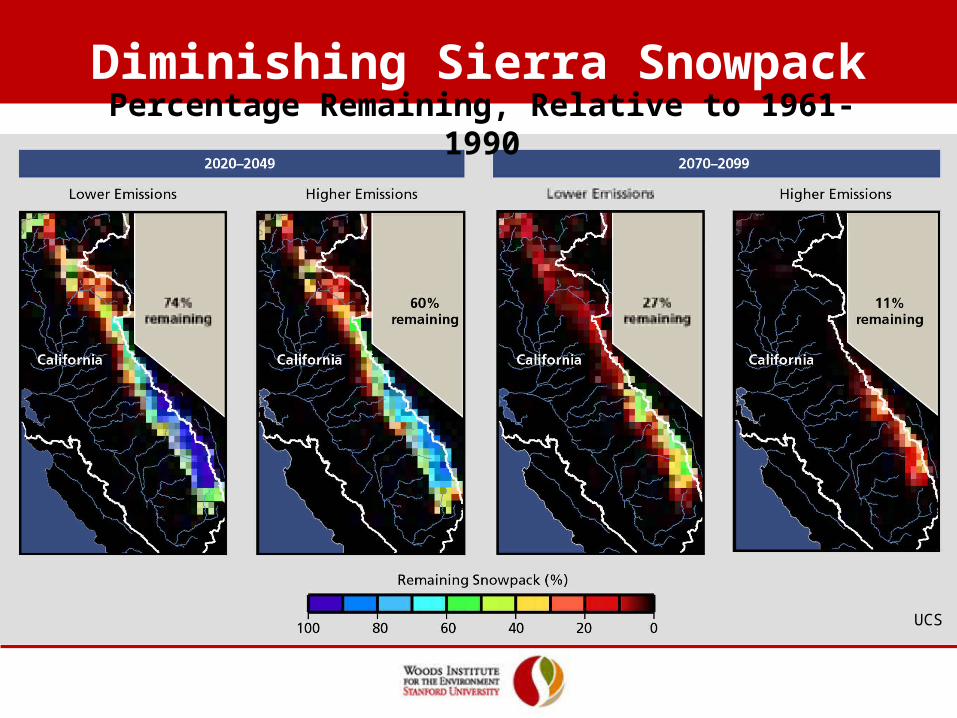
Diminishing Sierra SnowpackPercentage Remaining, Relative to 1961-1990
UCS
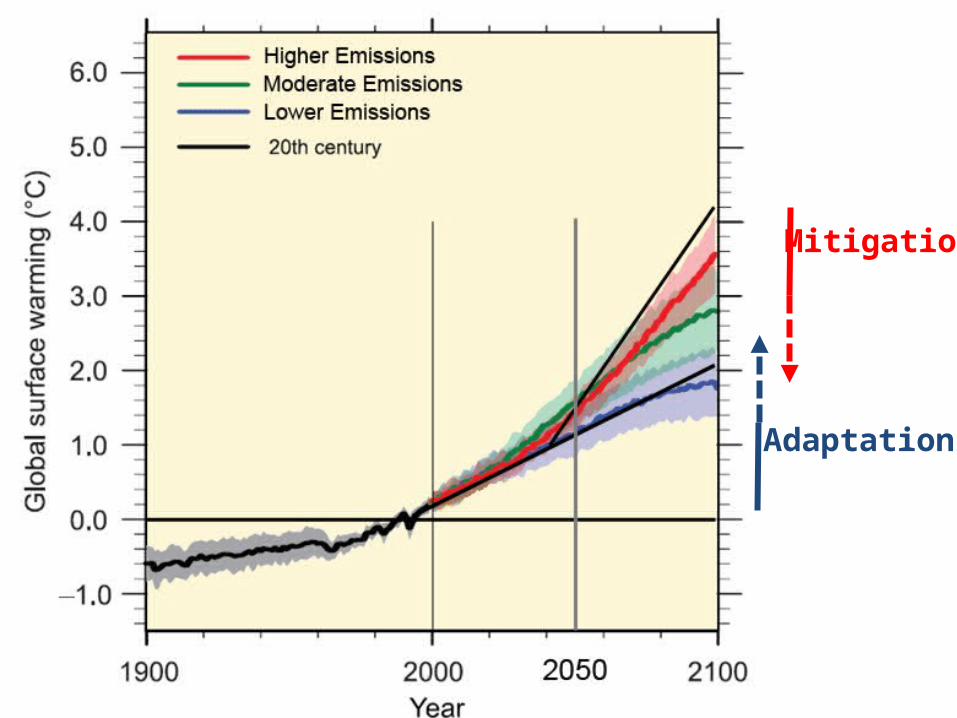
Mitigation
Adaptation
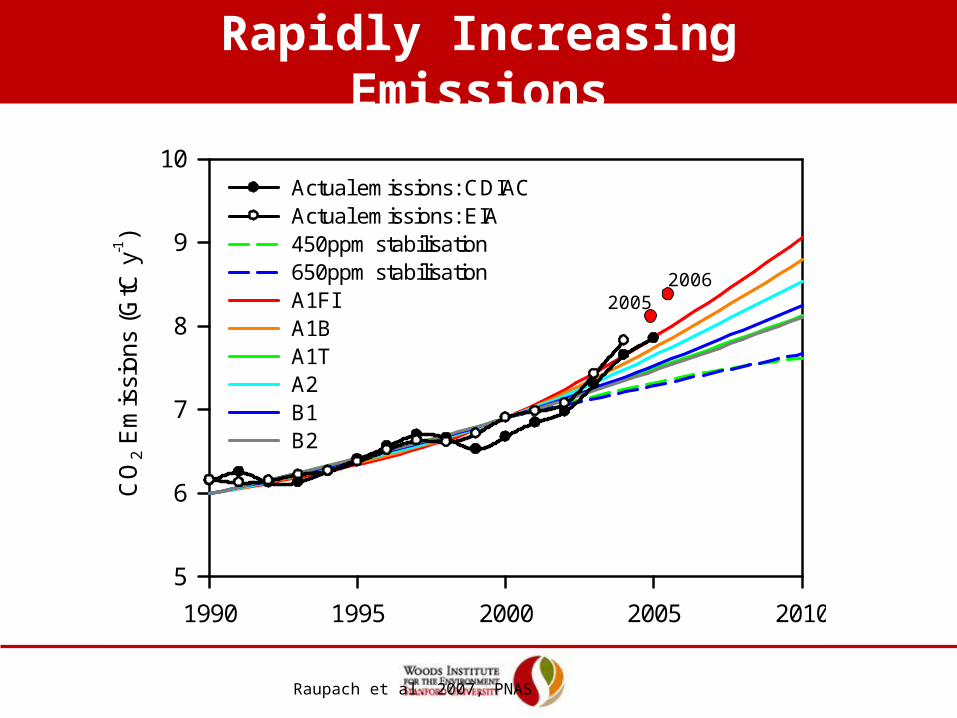
Raupach et al. 2007, PNAS
Recent emissions
1990 1995 2000 2005 2010
CO
2 E
mis
sion
s (G
tC y
-1)
5
6
7
8
9
10Actual emissions: CDIACActual emissions: EIA450ppm stabilisation650ppm stabilisationA1FI A1B A1T A2 B1 B2
1850 1900 1950 2000 2050 2100C
O2 E
mis
sion
s (G
tC y
-1)
0
5
10
15
20
25
30Actual emissions: CDIAC450ppm stabilisation650ppm stabilisationA1FI A1B A1T A2 B1 B2
20062005
Rapidly Increasing Emissions
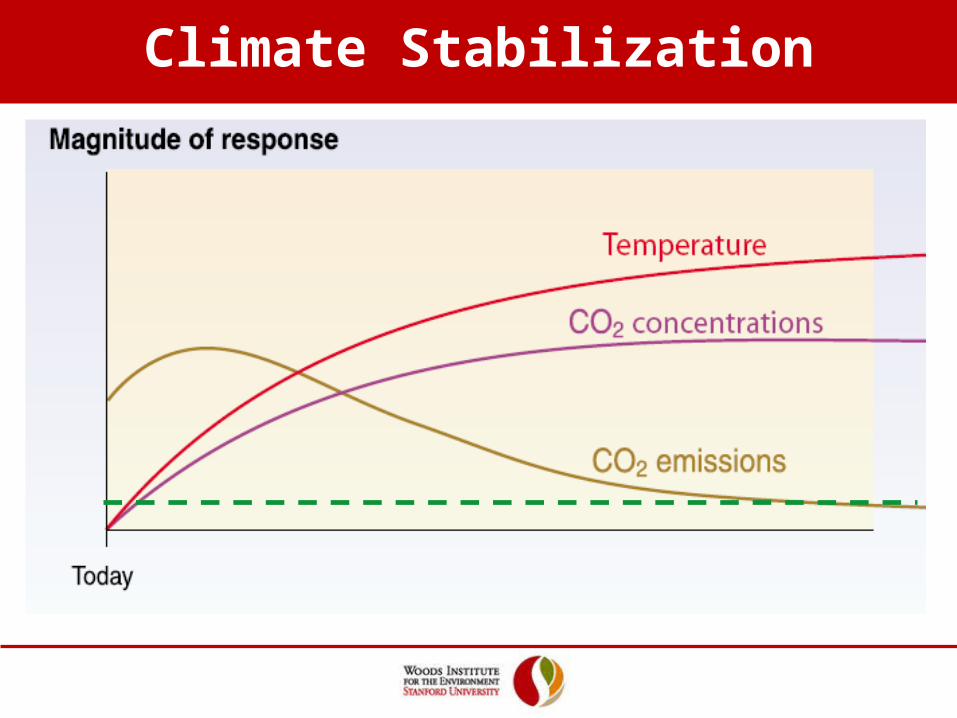
Climate Stabilization
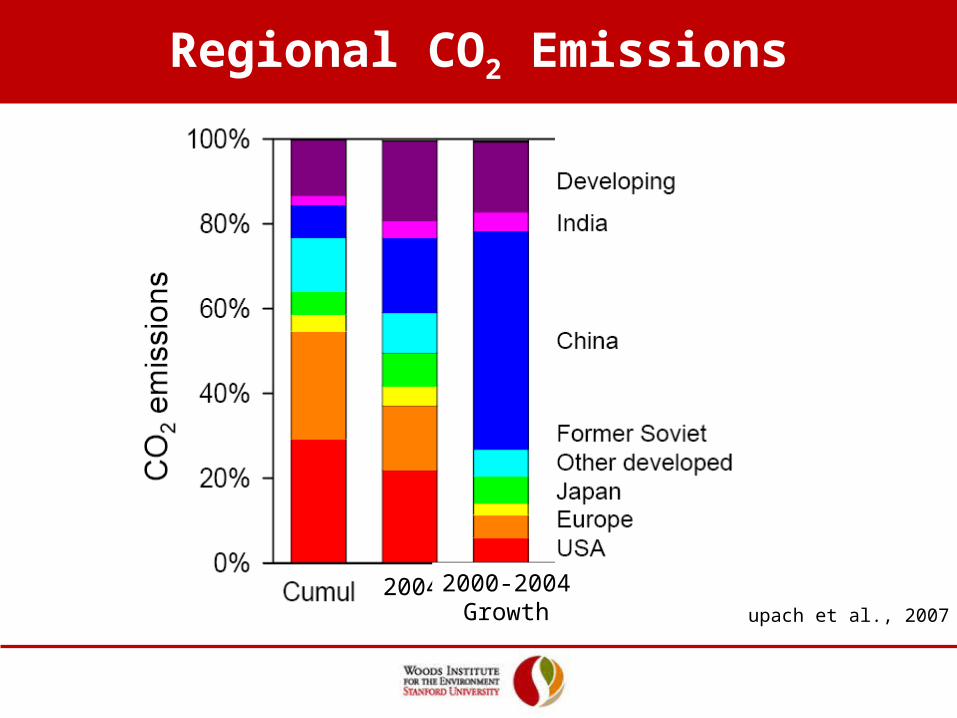
Raupach et al., 2007
Regional CO2 Emissions
2004 2000-2004Growth


