
Golden Handshakes:
Separation Pay for Retired and Dismissed CEOs
David YermackDepartment of Finance
Stern School of BusinessNew York University
44 West 4th St., Suite 9-160New York, NY 10012
(212) [email protected]
November 2005
AbstractThis paper studies separation payments made when CEOs leave their firms. In a sample of 179exiting Fortune 500 CEOs, more than half receive severance pay and the mean separationpackage is worth $5.4 million. The large majority of severance pay is awarded on adiscretionary basis by the board of directors and not according to the terms of any employmentagreement. For the subset of exiting CEOs who are dismissed, separation pay generallyconforms to theories related to bonding and damage control. Shareholders react negatively whenseparation agreements are disclosed, but only in cases of voluntary CEO turnover.
JEL classification codes: G34, J33
I appreciate helpful comments from John Core, Eliezer Fich, Kose John, Holger Mueller,Tjomme Rusticus, Douglas Skinner, Rangarajan Sundaram, Jeffrey Wurgler, an anonymousreferee, and seminar participants at the University of Arizona, Binghamton University,University of Iowa, New York University, the Federal Reserve Bank of New York, the NationalBureau of Economic Research, and the Swedish Institute for Financial Research.

1 For example, in June 2000 Procter & Gamble Co. ousted Chairman and CEO Durk I. Jager, age 57, who in abrief tenure of 18 months had presided over a sizeable drop in P&G’s stock price. P&G paid $9.5 million to Jager inexchange for future consulting services and a promise not to compete, citing Jager’s “loyal and distinguished service” aswell as “arrangements provided by other companies to retiring chief executive officers.” Jager also retained hispreviously awarded pension and stock options. The next year, a shareholder resolution at the company’s annual meetingassailed the package as “obscene” and proposed a ban on future severance pacts.
1
Golden Handshakes:
Separation Pay for Retired and Dismissed CEOs
This paper studies “golden handshakes,” the colloquial name for separation packages
awarded to CEOs at retirement or termination. These severance agreements, somewhat similar
to “golden parachutes” received by CEOs whose firms are acquired, can lead to controversy
between shareholders and boards of directors.1 Because separation pay occurs when a CEO exits
the firm, critics assert that it represents a giveaway that cannot influence future performance and
may indicate broader governance problems with a company. However, counter-arguments
suggest that separation pay may be part of an efficient multi-period incentive contract. For
successful CEOs, a separation package could represent the payoff from an “ex post settling up”
implicit contract (Fama, 1980), under which a board of directors assesses a CEO’s achievements
at the end of his career and compensates him accordingly. For CEOs who fail, severance
compensation might be predicted by one or more related bonding theories. In these models,
contingent severance pay is promised in advance to managers, providing insurance of their
human capital value. CEOs are thereby encouraged to take risk (Almazan and Suarez, 2004) and
2 The classic study of golden parachutes is Lambert and Larcker (1985), and a more recent treatment isLefanowicz, Robinson, and Smith (2000). The relation between golden parachutes and other target CEO gains fromacquisitions is investigated by Agrawal and Knoeber (1998) and Hartzell, Ofek and Yermack (2004).
2
discouraged from concealing adverse information (Inderst and Mueller, 2005), entrenching
themselves in office (Almazan and Suarez, 2004), or shirking when their dismissal appears
possible (Berkovitch, Israel, and Spiegel, 2000). Under a separate theory, separation pay may
serve as an instrument of damage control when CEOs are ousted, helping the board protect
corporate secrets and head off litigation or adverse publicity.
Although golden parachutes have been investigated at length by researchers,2 no study
has studied separation agreements for CEOs who retire or get dismissed by their boards. This
paper examines a data set of 179 CEOs of Fortune 500 companies who leave their firms between
1996 and 2002. I gather data about the terms of each CEO’s departure and classify separation
pay into five categories. More than half of the CEOs in the sample collect compensation upon
leaving their position, with a mean present value of $5.4 million including the zero-valued
observations. Nineteen of the 179 sample CEOs receive packages with present values exceeding
$10 million. However, in most cases separation pay appears modest, as the mean package equals
0.06 percent of the average market capitalization of sample firms and is less than the value of
one year’s average CEO compensation.
Though their value is not dramatic relative to certain benchmarks, separation packages
represent a puzzle because firms usually are not required to pay them. The large majority of
separation pay in my sample – 83 percent – is not delivered pursuant to a previous employment
contract, but instead is granted to CEOs on a discretionary basis by their boards of directors.
CEOs who are dismissed are far more likely to obtain separation pay compared to CEOs who
3
retire voluntarily (91 percent vs. 47 percent), and their awards are several times larger, with a
mean value of $15.1 million (median $6.5 million) compared to a mean of $2.3 (median zero) in
cases of normal retirements. Dismissed CEOs also obtain the large majority of their separation
pay – 76 percent – from discretionary awards rather than existing employment contracts.
To gain insight into the reasons that firms award severance pay, I estimate a regression
model based upon the ex post settling up, bonding, and damage control theories referred to
above, and also a fourth theory related to managerial rent extraction (Bebchuk and Fried, 2004).
I also analyze the stock market returns upon the disclosure of CEOs’ exit packages. Within the
subsample of CEOs who retire voluntarily, regression analysis fails to support for either the ex
post settling up or rent extraction theories. However, for the subsample of CEOs who are
dismissed, severance pay appears to occur in patterns that match the predictions of several
bonding theories as well as the damage control theory. Analysis of abnormal stock returns upon
the disclosure of separation packages reveals a negative and significant reaction in cases of
voluntary CEO retirements and an insignificant reaction in cases of forced CEO removal. These
results are consistent with a prediction of the damage control theory.
Payouts to CEOs when they leave their posts indicates that turnover, whether planned or
forced, serves as a type of “compensation event” in which top managers can obtain extraordinary
one-time rewards on top of their regular annual pay. The findings complement other recent
research into one-time rewards for CEOs who agree to sell their firms (Hartzell, Ofek and
Yermack, 2004), CEOs who change jobs (Fee and Hadlock, 2003), and CEOs who make
acquisitions (Grinstein and Hribar, 2004). Together these studies indicate that understanding top
management incentives requires looking beyond routine annual compensation and examining

4
one-time events, which might also include spinoffs, IPOs, equity carveouts, and even
bankruptcies or liability restructurings.
The remainder of the paper is organized as follows. Section I reviews theoretical models
of separation pay for top managers. Section II describes the data and sample selection. Section
III presents regression analysis of the value of separation packages. Section IV contains analysis
of stock market reactions to the disclosure of these pacts. Section V concludes the paper.
I. Theories of CEO separation pay
The passages below discuss four theories of severance pay: ex post settling up, bonding,
damage control, and managerial rent extraction. The first and last theories appear to apply to
voluntary CEO turnover, while the other two seem more relevant for involuntary dismissals.
A. Ex post settling up
When a CEO concludes a successful career, the ex post settling up theory would predict a
lump-sum exit payment if the CEO had been underpaid during his career. Fama’s (1980)
intertemporal model of CEO wages serves as the foundation of this theory, under which a board
of directors continually obtains new information about the CEO’s human capital value, decoding
noisy signals sent via the company’s performance. Changes to a CEO’s compensation take
account of this new information period by period, through a wage smoothing dynamic that Fama
labels “ex post settling up.” So long as the performance signal received by the board has
uncertain precision, the board will not engage in full settling up with the manager period-by-
period, but instead will revise wages gradually over time as new performance signals are

5
received. Though Fama’s model does not deal explicitly with payments to a CEO who reaches
retirement, a clear implication is that a manager who retires after a successful career may receive
a large exit package, since his human capital contributions could have exceeded those perceived
by the board during his career (this will not be true of all retiring CEOs, since boards might
realize ex post that some had been overpaid). The board could refuse to acknowledge an implicit
ex post settling up arrangement and deny a CEO the exit package, but this would send adverse
signals to other managers in the organization including the successor CEO.
Empirically, ex post settling up predicts an inverse association between separation pay
and the extent to which a CEO is overcompensated, relative to the market value of his human
capital, in the years leading to retirement. For dismissed CEOs, the expected level of separation
pay should be zero for ex post settling up purposes, since these CEOs’ ex post human capital
value likely fell below the level perceived ex ante by the board. It is important to recognize that
an inverse association between prior compensation and a CEO’s severance could exist for other
reasons than ex post settling up. Some CEOs may enter into employment contracts assuring
them of large separation packages or work for firms with histories of awarding large severance
pay. Holding all else constant, these CEOs should obtain reduced annual compensation as
consideration for the security of a large prospective exit package. The resulting coincidence of
low annual compensation and high separation pay would be the result of an ex ante endogenous
relation rather than ex post settling up.
B. Bonding
When CEOs are dismissed for poor performance, separation payments might represent

6
the payoffs of explicit or implicit contracts entered into by the firm to provide insurance for the
CEOs’ human capital value. Models of severance pay in this framework appear in Berkovitch,
Israel, and Spiegel (2000), Ju, Leland, and Senbet (2002), Almazan and Suarez (2004), and
Inderst and Mueller (2005). These papers generally analyze moral hazard or governance
problems that arise when CEOs alter their behavior because they perceive a potential for
shareholders to dismiss them. These problems are related to inadequate risk-taking, shirking,
entrenchment in office, and incomplete disclosure of information. Risk taking is analyzed in all
four papers as well as the CEO compensation literature generally. With either a concave utility
function and/or private benefits from his position, the CEO may avoid investments that have a
positive net present value but increase the probability of adverse outcomes leading to dismissal.
Shirking may arise if a CEO feels that his replacement has become likely, and that additional
effort would do little to help him keep his job; Berkovitch et. al (2000) analyze this case most
closely. CEO entrenchment, modeled by Almazan and Suarez (2004), refers to the possibility
that a CEO could be surrounded by a weak board of directors and elect to remain in his position
and collect a stream of rents, though shareholders would prefer that he be removed. Incomplete
disclosure, the focus of Inderst and Mueller (2005), represents an alternative strategy for CEOs
to remain in office and collect rents by keeping shareholders unaware of negative information.
Severance pay in each model serves as a bonding device through which shareholders
promise the CEO a minimum lifetime income and also raise the costs to themselves of changing
managers. In cases of risk aversion or effort avoidance, CEOs would be more likely to pursue
value maximizing strategies due to the security provided by severance pay. In cases of CEO
entrenchment, whether arising from weak governance or information asymmetry, severance pay

7
may make retirement more attractive to an under-performing CEO than staying in his position,
even if the board lacks the strength or accurate information that would cause it to remove him.
Individually or collectively, these models imply a number of empirical predictions, all of
which should apply more in cases of CEO dismissals instead of voluntary retirements. To
function as insurance for the CEO’s human capital value, severance pay should be positively
associated with the present value of expected future income until retirement. Leverage should be
negatively associated with severance pay, according to the Berkovitch et. al (2000) model, since
severance pay increases the costs to shareholders of removing a CEO and risky debt does the
opposite, if one assumes that CEO replacement increases the variability of expectations about
future cash flows. Almazan and Suarez’s (2004) model of CEO entrenchment predicts that
severance pay should be stronger when corporate governance quality is weaker and CEOs are
more easily entrenched. Finally, one would expect greater separation packages for CEOs hired
outside the firm, since these managers face greater ex ante uncertainty of success due to lack of
familiarity with the new firm and therefore should obtain greater insurance for their human
capital; Gillan, Hartzell, and Parrino’s (2005) study of CEO employment agreements shows a
high incidence of formal contracts for CEOs hired from outside.
C. Damage control
Most CEOs leave their posts with valuable corporate secrets as well as firm-specific
human capital that may be useful to the company in some form. For this reason, separation
packages often pay the CEO for agreeing to a variety of non-competition, non-disclosure, non-
hire, and consulting provisions. Severance pay may also prevent an ex-CEO from becoming an

3 Two well-known cases of retired CEOs assisting raiders in hostile takeover attempts are Lee Iacocca, whocooperated with Kirk Kerkorian in his unsuccessful 1995 bid for Chrysler Corp., and J. Paul Sticht, who assistedKohlberg Kravis Roberts in its 1989 leveraged buyout of RJR Nabisco Inc.
4 A number of prominent companies have in recent years become engaged in lawsuits with ex-CEOs after thecompany dismissed them and then sought to limit or cancel certain aspects of their compensation. Examples includeRichard Grasso and the New York Stock Exchange, Jean-Marie Messier and Vivendi Universal, Bernard Ebbers andMCI, Albert Dunlap and Sunbeam, Conrad Black and Hollinger, and Stephen Hilbert and Conseco.
5 W.R. Grace & Co. and Sprint Corp. are representative examples of companies that negotiated generousseparation packages with dismissed CEOs under circumstances in which litigation would have been unsurprising. In bothcases, the agreements included mutual liability releases. At W.R. Grace, CEO J.P. Bolduc left in 1995 after a boardroompower struggle with his predecessor, in which the two sides traded allegations of sexual harassment and financialirregularities involving family members. Bolduc, age 55, received a separation package valued at more than $20 million. At Sprint, CEO William T. Esrey, age 63, was ousted in 2003 after a 17 year tenure. Esrey had followed the advice ofthe company’s auditing firm and established a personal tax shelter that was challenged by the Internal Revenue Service. The CEO received a large bill for back taxes, and a public three-way conflict developed between the CEO, the auditors,and the company. Esrey received a separation package worth about $12.5 million.
8
adversary of the company, a role in which he might initiate litigation, sound off in the news
media, sabotage the transition to his successor, cooperate with regulatory investigations, or take
part in hostile takeover attempts.3 Litigation by disgruntled ex-CEOs is perhaps the most
common of these problems, and its basis is usually not the dismissal event itself, but instead the
costs incurred by the CEO if the company abridges various compensation instruments, such as
unvested stock options, executive loans, deferred compensation, or pensions.4 Separation
agreements therefore often require the ex-CEO to release the firm from any legal liability in
connection with his termination.5 If severance pay helps limit costs related to litigation, adverse
publicity, information disclosure, and related problems, then a positive relation should exist
between severance pay and expected future compensation of dismissed CEOs, because lost
future compensation represents the opportunity cost to these managers of termination.
D. Rent extraction
In line with the frequent portrayal of separation agreements in the news media, a further

9
theory of severance pay would be that it represents rent extraction by powerful managers who
are able to obtain extra compensation beyond the value of their human capital (see, e.g.,
Bebchuk and Fried, 2004). The rent extraction theory of severance pay should apply only in
cases of voluntary turnover, since CEOs who are fired would appear to lack control over their
firms’ governance. The main empirical predictions of the theory would be (i) a positive
association between prior annual over-compensation and the level of severance pay, since CEOs’
ability to obtain excess compensation should be high at both the middle and the end of their
careers, and (ii) a negative association between severance pay and the quality of corporate
governance. In addition, the theory suggests that severance pay should be delivered in a non-
transparent form, since boards might want to conceal from shareholders the true value
transferred to departing managers.
II. Sample selection and description
I analyze CEO turnover events in a panel of 237 companies that were members of the
Fortune 500 in 2002. Beginning with the entire Fortune 500, I drop non-public firms all firms
not covered by ExecuComp continuously form 1993 to 2002. Because certain computations
below require three years of lagged compensation data, the sample for turnover analysis spans
the seven-year period 1996-2002, with 1993-95 data reserved for use as lagged values. The
panel therefore includes seven observations for each of 237 firms, or 1,659 company-years.
Table I describes construction of the sample of turnover events. Within the panel,
companies change CEOs 211 times, including CEOs in the final sample year 2002 who are
replaced in 2003. The departure frequency of 12.7 percent is slightly higher than in past

10
turnover studies but in line with a rising turnover trend over the past 40 years (see studies cited
by Denis and Denis, 1995). Because this study focuses on CEO severance packages, I narrow
my sample by eliminating 32 observations for which separation pay is either irrelevant or
extraordinary, leaving 179 cases for analysis. The 32 excluded observations include four cases
of death or ill health; four CEOs who left for better positions (three became CEOs elsewhere,
and one became U.S. Secretary of the Treasury); six acting CEOs who left after short tenures;
three CEOs who left amid scandals (one each for narcotics, sexual harassment, and fraud); 13
mergers or spinoffs in which the CEO’s exit was negotiated as an antecedent; one case in which
the CEO’s compensation information was undisclosed, in violation of SEC rules; and one CEO
demoted to a lower position. I follow the standard approach of the CEO turnover literature by
partitioning the observations into “voluntary” and “forced” subsamples. For the large majority
of observations, whether turnover is voluntary can be ascertained from news reports and/or
language in company proxy statements. In borderline cases, I also consider such factors as the
exiting CEO’s age and performance, his continuing role with the firm if any, the time elapsed
between announcement of the CEO’s exit and his actual departure, and whether the successor
CEO came from outside the firm. I classify 43 events, or 24.0 percent of the turnovers, as forced
with the remainder as voluntary. This percentage is close to that found by Huson, Parrino and
Starks (2001), who classify 23.4 percent of turnover events as forced in a 1989-94 sample.
Table II presents descriptive statistics for the sample of 179 turnover events, with the full
sample’s properties shown in the left column and data for voluntary and forced subsamples in the
other two columns. Exiting CEOs have a mean age of 61 years with an average of ten years
service, and unsurprisingly, CEOs who leave voluntarily have significantly higher means for age

11
and service compared to CEOs who are forced out. Dismissed CEOs are significantly less likely
to belong to the company’s founding family. CEOs hired recently outside the firm comprise a
greater fraction of the forced compared to voluntary turnover observations, but the difference is
not significant. CEOs own a mean of $532.7 million (median of $43.1 million) of stock plus
options in their firms, with option values calculated with Black-Scholes methods based upon
option inventories disclosed in proxy statements (the very high mean value of ownership is
largely due to a single observation, Bill Gates of Microsoft). Median equity ownership is
significantly lower for CEOs whose departures are forced as opposed to voluntary, because the
accumulation of equity compensation is linked to tenure in office.
Annual compensation, equal to the sum of salary, bonus, and option and restricted stock
award values, has a mean of $8.1 million (median of $4.8 million) for CEOs in their last full year
prior to departure (CEOs who leave after less than two years in office are not counted in this
calculation). I estimate whether CEOs have been over- or under-compensated in the past relative
to their peers, as a prelude to tests of the ex post settling up and rent extraction theories. I
estimate each CEO’s past excess compensation using the ExecuComp variable for three-year
compensation, for the period ending in the last full year prior to the turnover year (this year must
be omitted from the calculation because it may include the value of the separation package). I
regress the log of each CEO’s three-year compensation against the log of sales, the firm’s three-
year net-of-market stock return compounded continuously, and dummy variables for two-digit
SIC industries and individual years. The regression sample includes the latest observation for all
ExecuComp CEOs with at least three years tenure for whom the three-year compensation and
stock return variables are not missing. The sample analyzed contains 2,087 observations, the

6 Both employment contracts and negotiated separation agreements with company officers are required to befiled with the Securities and Exchange Commission as exhibits to the company’s Form 10-Q or 10-K that covers theperiod in which the contract becomes effective, according to SEC Regulation S-K,17 CFR 229.601(a)(4) (see Instructionsto Exhibit Table, paragraph (10)(ii)(D)(iii)(A)). The filing deadline for an agreement is therefore the same as the filingdeadline for the 10-Q or 10-K. Of the 89 negotiated separation agreements in my sample, 42 were filed in a 10-K atfiscal year-end and 39 were filed mid-year in a 10-Q. The remaining eight contracts were filed ahead of disclosuredeadlines in either a Form 8-K (extraordinary events) or S-4 (registration statement). The majority of contracts are filedwithin several months after the CEO’s departure, although 20 of 89 agreements were filed in advance. In seven cases inwhich the ex-CEO remained for a period as Chairman of the Board, the separation agreements did not become effectiveimmediately and were not filed for more than a year after his departure as CEO.
12
estimated regression has an r-squared of 0.456, and estimated coefficients are 0.41 for the log of
sales and 0.14 for the three-year stock return, both statistically significant. For the 179 exiting
CEOs in my sample, 147 have enough information to appear in the regression sample. From the
excess compensation regression, I save the expected values of the log of three-year
compensation and exponentiate them. I then estimate prior excess compensation as the
difference between actual three-year compensation and the regression’s expected value.
About one-third of CEOs in my sample have employment contracts at the time of their
exits, and this frequency is somewhat higher though not significantly different for CEOs who are
dismissed compared to those who retire voluntarily. As shown in data below, the existence of an
employment contract is important for a departing CEO, because the company must continue
making payments for the duration of the contract if the CEO does not retire voluntarily.
Exiting CEOs often enter into written separation agreements with their firms. I search
SEC filings to obtain all such agreements, and I locate them for just under half of the sample
observations.6 If no written separation agreement exists, I rely on disclosures of compensation in
companies’ proxy statements to provide information about the separation pay received by exiting
CEOs (many exiting CEOs are covered by proxy disclosure rules for several years after leaving
office, since they often continue serving on the board of directors). In cases in which no formal

13
agreement is negotiated, separation payments to the CEO can occur due to unilateral action by
the board or its compensation committee. A large and unsurprising disparity exists in the
frequency of formal separation agreements for dismissed CEOs (74.4 percent) compared to
voluntary retirements (41.9 percent).
I track subsequent positions, if any, that exiting CEOs hold with their firms. An large
disparity exists in this data for CEOs who leave voluntarily compared to those who are
dismissed. Of the 136 voluntary turnover cases, 99 former CEOs (nearly three-quarters) remain
as Chairman of the Board for at least a period of transition, while another 15 remain as directors.
Only 21 of 136 resign all their positions immediately. In the subsample of 43 forced CEO
turnovers, about two-thirds, or 29 CEOs, leave all positions immediately, while 11 others
become Chairman of the Board for a nominal period.
Table II also tabulates various information about the size and governance of the sample
firms included in the analysis. No unusual patterns or significant differences exist for these
variables in the overall sample or in the forced vs. voluntary turnover subsamples.
A. Contracted and discretionary separation pay
When a CEO works under an employment contract and is dismissed, in most cases the
contract specifies minimum separation pay either directly, in a special contract term, or
indirectly, since the CEO continues receiving compensation until the contract expires. A CEO
who retires voluntarily in the middle of a contract generally is not entitled to severance, unless
the board awards it discretionarily or the CEO negotiates to retain his status as an employee,
perhaps while serving as Chairman of the Board. Employment contracts therefore affect the

14
amount of separation a CEO receives and also the form in which it is delivered. Data in Table II
indicate that CEOs who are dismissed have employment contracts more often than those who
retire voluntarily, though the difference is not significant.
An empirical study of CEO employment contracts appears in Gillan, Hartzell, and
Parrino (2005). That study’s sample of S&P 500 firms, analyzed in 2000, overlaps considerably
with the sample for this paper. The authors find that employment contracts are more common
when a CEO is young, when he has been hired outside the firm, when the board has a high
percentage of independent directors, when a predecessor CEO had been fired in the past five
years, when the firm competes in a non-homogenous industry, and when the firm’s stock has low
volatility. Several of these relations, such as CEO age, board independence, and a past history of
CEO dismissals, suggest a positive association between the incidence of employment contracts
and the ex ante probability of CEO removal.
Table III tabulates the separation pay for CEOs in my sample, with observations
partitioned according to whether or not the CEO was working under an employment contract and
whether turnover was voluntary or forced. Data for the entire sample appear in the right column.
I divide the total severance package for each subsample into two quantities, those that are
mandated by the employment contract (which equal zero by definition for the no-contract
subsample), and those that are awarded discretionarily by the board. Table III shows that CEOs
who leave voluntarily and have employment contracts rarely receive contracted severance pay (7
out of 43 observations). Boards make discretionary separation payments of almost identical size
and frequency to voluntarily retiring CEOs who do and do not have employment contracts; 42
percent of those with contracts get additional separation pay with a mean value of $2.2 million,

15
while 44 percent of those without contracts get separation pay with a mean of $2.3 million. The
overall mean separation package for voluntarily exiting CEOs is vastly lower than the mean for
dismissed CEOs, $2.3 million compared to $15.1 million. For the entire sample, CEOs with
employment contracts receive the same mean separation pay as those without contracts – $5.4
million. Only about 17 percent of separation pay is delivered pursuant to employment contracts,
and this statistic is only modestly higher, 24 percent, for the subsample of dismissed CEOs.
Data for forced CEOs turnover events presents several clear contrasts to the data for
voluntary turnover. When a CEO is fired and has an employment contract, he receives a
contracted settlement in 17 out of 19 observations. The mean contracted settlement to this
subgroup, including the two zero-valued observations, has a present value of $8.1 million
(median of $3.1 million) Most of these CEOs (11 out of 19) also receive discretionary
separation pay, with a mean value of $3.9 million (median of $1.1 million), making their total
mean package worth $12.0 million. Somewhat surprisingly, CEOs who are dismissed without an
employment contract do even better. Nearly all of these CEOs (21 out of 24) receive
discretionary separation pay, with a mean value of $17.5 million (median of $6.0 million).
B. Elements of discretionary CEO separation pay
I disaggregate data about discretionary separation pay, not required by an employment
contract, into four categories. Table IV presents descriptive statistics about each category and
the total values of packages received by the 179 exiting CEOs in the sample, with the table again
divided into sections for voluntary turnover, forced turnover, and the entire sample. Data show
that about half of all CEOs, and about three-quarters of CEOs who are dismissed, receive

7 Most CEO pensions are defined benefit life annuities. For pension changes, I calculate the value impact as thedifference of actuarial life annuity values before and after the change. Inputs to these calculations include the fixedannual pension amount payable to the CEO, the CEO’s age, a discount rate, and forecast mortality probabilities. ACEO’s annual pension entitlement can be inferred from disclosures in firms’ proxy statements, though the process canrequire significant research. I use mortality data tabulated by the U.S. Social Security Administration. The company’scost of debt, based upon its bond rating, serves as the discount rate. See Sundaram and Yermack (2005) for furtherdetails. As an example, J.P. Morgan Chase CEO Walter Shipley retired in 1999 at age 63, and according to thecompany’s 1999 proxy statement, he was entitled to a pension of $897,577 beginning at age 65 in a joint and 50%survivor life annuity. The next year, the 2000 proxy statement reported that Shipley had begun drawing a $1,600,000annual pension at age 64 in a joint and 100% survivor life annuity. These three adjustments -- increasing the annualamount, changing the survivor payout from 50% to 100%, and beginning payments one year earlier -- increased itsactuarial value by more than $7.5 million, assuming that Shipley had a wife the same age as him. The company gave noexplanation for the changes, nor did it disclose their value consequences.
8 Each firm’s default treatment of equity compensation for exiting employees appears in the documentsassociated with its executive compensation plans, which are filed as attachments to company proxy statements or Forms10-K or 10-Q. Stock options and restricted shares that have not yet vested are generally forfeited when an executiveleaves the firm, unless he has attained a minimum retirement age such as 55 or 60. If he has reached retirement age, theexecutive retains his shares or options, and some companies also allow unvested equity awards to vest. The remainingexercise period for stock options under these conditions will generally be truncated. For CEOs in my sample, I observe avariety of deviations from companies’ standard policies, including waiver of forfeiture rules, more generous vesting thanusual, and longer exercise periods. I compare the treatment of each CEO’s equity compensation to the company’sstandard policies, and I calculate the resulting value impact for each CEO. For stock options, these calculations involve
16
discretionary packages with positive value, with significantly larger payments awarded to the
forced turnover subsample. Categories of discretionary separation pay include:
• Lump-sum payments. These can include cash, forgiveness of loans from the company,and new awards of stock or options. Rather than label these as “severance pay,” firmsgenerally characterize them euphemistically as consideration for such things as “effectinga smooth transition to his successor,” “leadership in the management transition process,”or the CEO’s “personal sacrifice of electing early retirement.”
• Consulting and non-compete agreements. Many companies enter into contracts that willbe paid out over a number of years, in consideration for the exiting CEO’s agreement notto compete against the company, and/or to serve as a consultant. I take the present valueof these payments, discounted at the firm’s cost of debt as inferred from its bond rating.
• Pension augmentations. Some companies adjust the terms of CEOs’ lifetime definedbenefit pensions. Pension benefits often depend upon length of service, and some firmsadd extra service time or permit CEOs to begin drawing full pensions earlier than thenormal age (usually 65). Value consequences of these changes are usually very opaque.7
• Adjustments to equity compensation. Most exiting CEOs hold unvested stock optionsand restricted shares. All companies have policies for how to treat these awards whenexecutives leave the company, and in some cases, the company deviates from its standardpolicies in ways that add considerable value to a CEO’s holdings.8

Black-Scholes valuations before and after any adjustments of their terms. For restricted stock, calculations involvemultiplying the number of shares that the CEO obtains extraordinarily by the stock price on his date of exit. Within thesample, maximum values of these adjustments are extremely large, as two dismissed CEOs obtain more than $100million. In both cases the CEOs were younger than the company’s standard retirement age for retaining equity awardsbut were nevertheless permitted to keep millions of unvested shares and/or options. Minimum sample values are belowzero, as a few CEO separation agreements call for shortening option lives even more than under ordinary circumstances. Some CEOs’ employment contracts include pre-negotiated terms for the treatment of equity compensation if the CEOleaves the firm. In these cases I compare the contracted terms to the company’s default policies, and the value of anybenefit for the CEO counts as part of his contractual separation pay. Any further change in the treatment of the CEO’sequity awards, when compared to the contracted terms, is counted as discretionary separation pay.
9 For example, when Bank One Corp. announced CEO John B. McCoy’s departure on December 22, 1999, thecompany’s stock rose more than 10 percent. McCoy’s personally owned shares and options increased in value by morethan $3 million as a result. McCoy, age 57, left the company completely, not remaining as a director. His separationpackage was unusually large compared to others in the sample, as it included a $10.3 million lump-sum payment; a
17
I do not take account of compensation that some ex-CEOs receive for service as a
member of the board, usually as Chairman. Often exiting CEOs remain as Chairman of the
Board, even in some cases of forced turnover, and their compensation may remain at the CEO
level for at least one to two years. It is not clear whether this remuneration should be viewed as
disguised severance pay or whether the former CEO is genuinely earning additional pay for
duties performed as Chairman; the sample probably includes observations of both types. Also,
many exiting CEOs obtain fringe benefits in retirement such as country club memberships,
automobiles, office space, premium health coverage, personal security, and so forth. One CEO
in my sample negotiated for continued control over his company’s box seats at the U.S. Open
tennis championships, and no less than 16 exiting CEOs, all of them cases of voluntary turnover,
received access to company aircraft for personal travel for periods ranging from five years to
life. I do not include these perks in my calculations due to the difficulty of valuing them.
Finally, I do not include gains or losses to a CEO when the firm’s stock price reacts to
the announcement of his departure. In some cases of forced turnover, company stock prices rise
substantially, giving the exiting CEO consolation of a large appreciation in his equity holdings.9

pension increase with an actuarial value exceeding $15 million; immediate vesting of certain options, restricted shares,and deferred compensation; office space and secretarial support for life; moving expenses; and a reimbursement for anyloss on the sale of his residence. The company wrote in its 2002 proxy statement that the board’s compensationcommittee was “satisfied as to the appropriateness of the terms of [McCoy’s] agreement,” but Bank One’s stock fell by amarket-adjusted 1.61 percent upon its disclosure.
18
III. Regression analysis of separation pay
I analyze whether CEO separation packages conform to the theories of severance pay
detailed above. Since separate theories predict patterns of separation pay for voluntary and
forced CEO turnover, I estimate separate regressions for these two subsamples. Because of the
large number of zero-valued separation packages, I estimate Tobit regressions, and the
dependent variable for each regression equals the total value of each CEO’s separation package.
The key explanatory variables in the regressions are related to each ex-CEO’s
compensation and career concerns as well as the firm’s financial and governance structure. For
voluntary turnover, the ex post settling up paradigm predicts an inverse association between a
CEO’s separation package and the extent to which he was paid during his career at above-market
levels. An opposite, positive prediction between severance pay and prior compensation is
implied by the rent extraction theory. I therefore include a variable estimating the CEO’s
compensation over the prior three years, calculated according to methods discussed above. For
CEOs with less than three years tenure (32 observations out of 179), I assume that this variable
equals zero; this assumption is probably reasonable since CEOs whose compensation is out of
line with market practices typically have served long tenures in office.
For forced turnover, various bonding hypotheses suggest that separation pay should
exhibit a positive association with CEO age, since age should be related to the lifetime stream of
earnings that a CEO would expect had he worked until normal retirement. The damage control

19
theory implies a similar prediction of a positive association between severance and age. I
therefore include a variable measuring the CEO’s expected years to retirement, equal to the
difference between 65 and the CEO’s age or zero for all CEOs aged 65 and older. Certain
bonding theories also expect associations between severance and the firm’s financial leverage,
the quality of corporate governance, and whether the CEO was hired recently outside the firm. I
include measures of these three variables: for leverage I use total debt over total assets, for
corporate governance I use the anti-shareholder rights index of Gompers, Ishii and Metrick
(2003), and I set an indicator variable equal to 1 for CEOs hired outside the firm in the past five
years. The governance index is also used to test the damage control theory, which predicts a
negative association between governance quality and separation pay. Note that higher values of
the index imply weaker governance, since it is a count variable measuring the number of a firm’s
takeover defenses and related provisions. Because the data source, the Investor Responsibility
Research Center, generally reports the variable in intervals three or four years apart, I use the
value closest in time to each observation. Regressions also include the log of total assets to
control for firm size, and year and industry dummy variables. Due to the relatively small
number of observations, industry dummies are measured at the one-digit SIC level.
Results for the Tobit regression estimations appear in Table V. On the left side of the
table, estimates within the subsample of voluntary CEO turnover observations show no
significant associations with any of the key explanatory variables, and the pseudo r2 goodness-
of-fit measure is far lower than for the estimation with forced turnover observations on the right
side of the table. The absence of significant associations for the voluntary turnover observations
provides no evidence in support of the ex post settling up or rent extraction theories.
20
Regression estimates for the subsample of forced turnover observations exhibit a contrast
to those for voluntary turnover, as the leverage, governance, and years to expected retirement
coefficient estimates all have the expected sign and are statistically significant. All three of
these estimates support models of separation pay as a bonding device between the CEO and
shareholders. Only the coefficient for the dummy variable for CEOs hired recently outside the
firm, which bonding theories might predict to have a positive estimate, fails to match the
prediction of the theory. The positive and significant estimate for years until expected retirement
also supports the damage control theory, since this variable is used as a proxy for a CEO’s
expected income over the remaining years of his career.
I test the robustness of the regression results in several ways. First, I delete from the
sample of forced turnover observations two outliers whose severance packages exceed $100
million. All estimates retain their sign and significance except the coefficient for leverage,
which moves closer to zero and sees its t-statistic change to -1.07. For the years until expected
retirement and the governance index, t-statistics increase after deletion of the two outliers, to
2.44 and 2.56, respectively. As a further sensitivity test, I truncate the dependent variable from
its previous specification as the total CEO separation package value, and redefine it is the non-
contracted, discretionary value. The subsample of voluntary turnover observations continues to
exhibit no significant coefficient estimates for the key variables. Among the forced turnover
observations, two variables no longer have significant estimates – the years to expected
retirement, and the governance index – though the estimate for the leverage variable remains
significant. A final robustness test involves deleting from both samples the 32 CEOs with less
than three years service prior to the turnover year. The rationale for dropping these observations

21
is related to the estimation of excess compensation, which requires three years of lagged data and
is assumed to equal zero in the regressions shown in Table V. Dropping these observations may
reduce the measurement error in the excess compensation variable and change its coefficient
estimate. However, I find no such effect, as the variable’s estimate remains insignificant and
quite close to zero in both subsamples. Other coefficient estimates do no vary meaningfully,
except that the years to expected retirement variable loses its significant estimate in the forced
turnover subsample; this may occur because the deleted observations of inexperienced CEOs
tend to be the youngest in the sample.
D. Transparency
Some companies’ separation packages are easy for shareholders to value, since they are
delivered in straightforward ways such as lump-sum payments. In other cases, CEOs’ severance
pay is disclosed only indirectly via changes to pension plans or equity compensation. Under the
rent extraction theory, I expect that as severance packages grow larger, firms may disclose them
less transparently. I investigate this conjecture in a regression model using the subsample of
observations in which the separation package has positive value for discretionary pay. The
dependent variable is an “opacity index,” equal to the present value of a CEO’s pension
enhancements, plus the value of adjustments to equity compensation, divided by the total value
of his discretionary separation package. This index, which I compound continuously, takes a
value between zero and one, and higher values occur when the values of CEO separation
agreements are more difficult to ascertain. However, a high value of the index might also occur
when stock- or pension-based pay appears advantageous to for reasons other than reducing costs

22
of disclosure; income tax reduction, smoothing accounting earnings, or the firm’s liquidity may
also deter the company from delivering separation pay in cash. The key explanatory variable is
the size of the CEO’s incremental separation pay compared to its predicted level. This
difference is assumed to be the residual from the Tobit regression model in Table V, augmented
by a dummy variable for forced turnover observations (results are insensitive to using instead the
separate residuals from the two subsample regressions in Table V). Control variables include
return on assets, since profitable firms may be less reluctant to report high compensation, and
dummy variables for years and one-digit SIC indicators. The regression estimates, which are
untabulated in order to save space, indicate that a significantly negative association exists
between the transparency of a CEO’s separation package and the extent to which a package is
larger than expected. In addition, packages for dismissed CEOs have less transparency than
packages for voluntarily retired CEOs. Together, these findings provide mixed support for the
rent extraction theory of separation pay. Under this theory, it is not surprising that larger
packages are delivered in a non-transparent form, but it is unexpected to find the least
transparent packages being awarded to CEOs who are dismissed.
IV. Stock returns upon disclosure of separation packages
I evaluate shareholder reactions to CEO separation agreements by calculating abnormal
stock returns for dates of disclosure of these packages for the 179 CEOs in the sample. It is not
clear ex ante whether shareholders should regard severance payments positively or negatively.
Under the ex post settling up theory, for example, a large separation package might indicate that
the CEO had performed better than previously understood, which would be good news for

23
shareholders. Alternatively, a rich package for a mediocre CEO might signal that the board had
little skill at evaluating managers, which would be bad news. The various bonding theories of
severance pay yield similarly ambiguous predictions. Severance pay may indicate that the CEO
had made positive NPV investments that didn’t work out, which would perhaps convey positive
information about the firm’s governance. Alternatively, severance pay may indicate that the
CEO possessed adverse inside information about the firm’s governance quality or its future
performance and elected to resign because he forecast low future compensation for himself.
Under the damage control theory, the expected reaction of shareholders to separation pay is also
ambiguous. Severance packages could be positive news for shareholders, indicating that the
firm had limited costs that might have been high. However, they could also indicate possible
problems within the firm and therefore send an adverse signal. Only the rent extraction theory
seems to yield a clear prediction, that severance pay should result in negative stock returns, since
its disclosure would indicate that the firm’s governance was too ineffective to prevent
expropriation of resources by its managers. Even if shareholders had believed governance to be
poor, the payment of large severance might resolve uncertainty about such beliefs.
In my event study analysis, the event date is the earliest of (i) the proxy statement filing
describing the terms of the CEO’s separation, (ii) the Form 10-K, 10-Q, or other filing in which a
negotiated separation agreement is included as an exhibit, or (iii) the date on which a company
news release publicizes details of the CEO’s exit package. For CEOs receiving zero separation
pay, the event date is the first proxy statement filed after the year of their departure, the latest
point at which any separation package would have ordinarily been disclosed. I drop five events
in which the CEO’s dismissal was announced simultaneously with his separation package.

24
Abnormal stock returns are calculated over an interval beginning four trading days prior to the
event day and ending one trading day after, using standard market model methods with the
CRSP value-weighted index as the market portfolio. Results below are generally insensitive to
reasonable variations in the estimation procedure. Abnormal stock returns at the disclosure of
separation packages are nearly orthogonal to the abnormal returns at the announcement of
CEOs’ departures, with a correlation coefficient of -0.037.
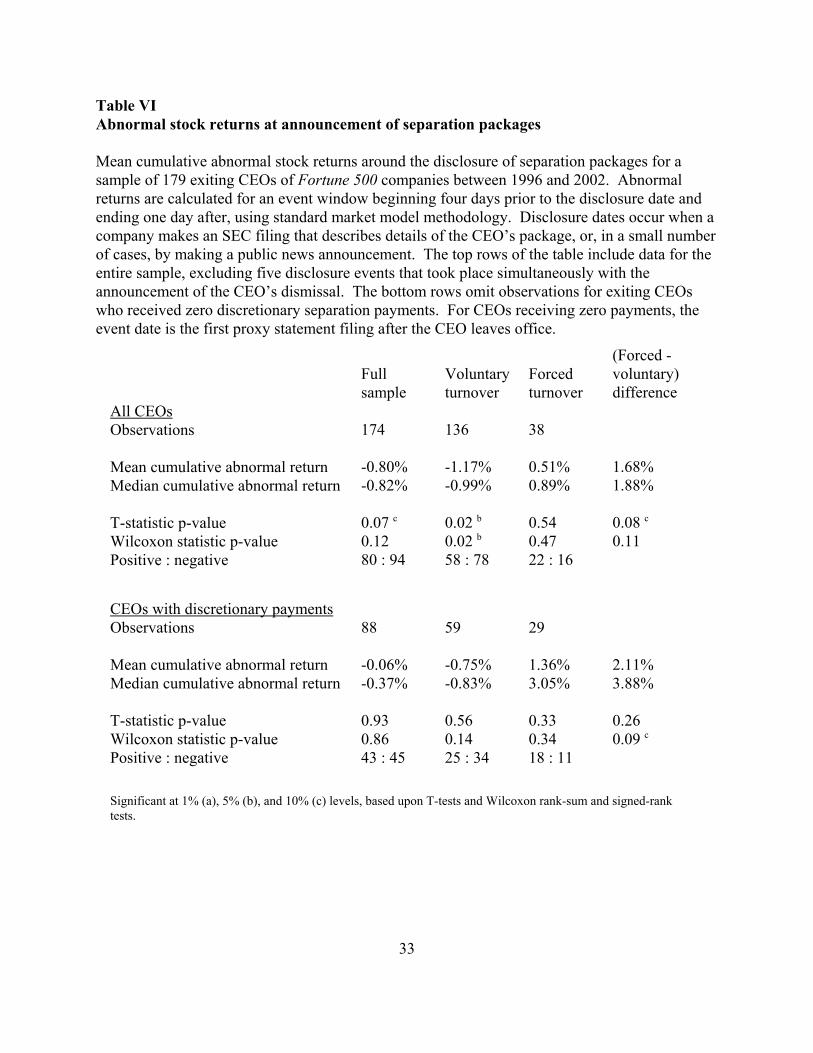
Results in Table VI indicate that shareholders have negative overall reactions to
disclosures of CEO severance packages. Abnormal returns have mean and median values
slightly less than -1.0%, with statistical significance at the 7 percent level (mean) or 12 percent
level (median). If the sample is restricted to the 88 CEOs whose discretionary separation pay
has positive value, mean and median abnormal returns remain negative but move closer to zero
and are insignificant. The middle two columns in Table VI illustrate market reactions in cases of
planned and forced turnover. Planned turnover agreements are accompanied by stock returns
more negative than those for the overall sample and are statistically significant below the 2
percent level. In contrast, agreements in cases of forced turnover are accompanied by abnormal
stock returns that are positive and insignificant. This pattern of results provides some evidence
in support of the rent extraction of severance pay, which predicts negative returns at the
disclosure of severance pacts in cases of voluntary CEO turnover.
V. Conclusions
This paper studies separation payments to CEOs when leaving their firms, compensation
commonly known as “golden handshakes.” Just over half of exiting CEOs in my sample from

25
Fortune 500 firms receive separation pay, with a mean value of $5.4 million. The majority of
separation pay is awarded by boards of directors discretionarily, rather than under employment
contracts, and CEO dismissals generally lead to larger packages than voluntary retirements..
I discuss and evaluate theories for why firms award severance pay, including ex post
settling up, bonding, damage control, and rent extraction. No results in the paper clearly support
the ex post settling up theory despite its economic appeal. Regression analysis supports the
bonding theories in cases of forced CEO turnover, with CEOs receiving pay in proportion to
expected years to future retirement and in negative association with leverage and governance
quality. The association of severance pay with expected years to retirement also supports the
damage control theory as does an apparent association between the transparency of separation
packages and their size compared to expected value. Theories related to rent extraction receive
no support from the regression analysis but are consistent with a pattern of negative stock market
reactions to the disclosure of separation packages in cases of voluntary turnover.
Several results appear to support an interpretation that boards use severance pay to assure
CEO of a minimum lifetime wage level. CEOs who retire voluntarily receive less severance
than CEOs who are forced out, perhaps because the former will continue to obtain benefits from
board service and will probably retire with higher values of accumulated equity compensation.
In cases of forced turnover, younger CEOs, for whom the costs of dismissal are higher, get more
severance than older CEOs who are forced out, and the overall value of separation pay generally
seems unrelated to whether or not a CEO had an employment contract. All of these patterns
suggest that certain norms of equity or fairness influence firms’ decisions about how to
compensate exiting CEOs, without clear attention to any theory of economic optimization.

26
References
Agrawal, Anup, and Charles R. Knoeber, 1998, Managerial compensation and the threat oftakeover, Journal of Financial Economics 47, 219-239.
Almazan, Andres, and Javier Suarez, 2004, Entrenchment and severance pay in optimalgovernance structures. Journal of Finance 58, 519-547.
Berkovitch, Elazar, Ronen Israel, and Yossef Spiegel, 2000, Managerial compensation andcapital structure, Journal of Economics and Management Strategy 9, 549-584.
Bebchuk, Lucian, and Jesse Fried, 2004, Pay without performance: The unfulfilled promise ofexecutive compensation. Harvard University Press, Cambridge.
Denis, David, and Diane Denis, 1995, Performance changes following top managementdismissals, Journal of Finance 50, 1029-1057.
Fama, Eugene F., 1980, Agency problems and the theory of the firm. Journal of PoliticalEconomy 88, 288-307.
Fee, C. Edward, and Charles J. Hadlock, 2003, Raids, rewards, and reputations in the market formanagerial talent, Review of Financial Studies 16, 1315-1357.
Gillan, Stuart L., Jay C. Hartzell, and Robert Parrino, 2005, Explicit vs. implicit contracts:Evidence from CEO employment agreements. Unpublished working paper, McCombs School ofBusiness, University of Texas.
Gompers, Paul A., Joy L. Ishii, and Andrew Metrick, 2003, “Corporate Governance and EquityPrices,” Quarterly Journal of Economics 118, 107-155.
Grinstein, Yaniv, and Paul Hribar, 2004, CEO compensation and incentives: Evidence fromM&A bonuses, Journal of Financial Economics 73, 119-143.
Hartzell, Jay C., Eli Ofek, and David Yermack, 2004, What’s in it for me? CEOs whose firmsare acquired, Review of Financial Studies 17, 37-61.
Hermalin, Benjamin E., and Michael S. Weisbach, 1988, The determinants of boardcomposition, RAND Journal of Economics 19, 589-606.
Huson, Mark R., Robert Parrino, and Laura Starks, 2001, Internal monitoring mechanisms andCEO turnover: A long-term perspective, Journal of Finance 56, 2265-2297.
Inderst, Roman, and Holger Mueller, 2005, “A mushroom theory of CEO entrenchment,”Unpublished working paper, INSEAD.

27
Ju, Nengjiu, Hayne Leland, and Lemma W. Senbet, 2002, Options, option repricing andseverance packages in managerial compensation: Their effects on corporate risk. Unpublishedworking paper, Smith School of Business, University of Maryland.
Lambert, Richard A., and David F. Larcker, 1985, Golden parachutes, executive decision-making, and shareholder wealth, Journal of Accounting and Economics 7, 179-203.
Lefanowicz, Craig E., John R. Robinson, and Reed Smith, 2000, Golden parachutes andmanagerial incentives in corporate acquisitions: Evidence from the 1980s and 1990s, Journal ofCorporate Finance 6, 215-239.
Sundaram, Rangarajan, and David Yermack, 2005, Pay me later: Inside debt and its role inmanagerial compensation, Unpublished manuscript, Stern School of Business, New YorkUniversity.
Veall, Michael R., and Klaus F. Zimmermann, 1994, Goodness of fit measures in the Tobitmodel, Oxford Bulletin of Economics and Statistics 56, 485-499.

28
Table ISample selection
Sample selection procedure for observations used in a study of CEO separation agreements. Thecandidate sample includes seven annual observations for each of 237 Fortune 500 firms thatwere public continuously between 1996 and 2002 and are covered by ExecuComp. Certain CEOturnover events are excluded from the analysis for extraordinary reasons listed in the table. Excluded events either did not require the board to decide about the terms of the CEO’sseparation, or involved significant external considerations in conjunction with the CEO turnover. Voluntary and forced turnover events are identified mainly from news reports and language incompany proxy statements.
Total sample: 237 firms x 7 years 1,659 candidate observations
CEO turnover events 211 12.7% of sample
Events excluded from analysis
Succession agreements in mergersActing CEOsResigned to take better positionDeath or poor healthResigned in connection with spinoffCause (fraud, drugs, sexual harassment)Demoted to lower positionData omitted from SEC filings
96444311
Final sample for analysis 179 observations
Forced turnoverVoluntary turnover
43136
24.0% of analyzed sample76.0%

29
Table IIDescriptive statistics
Descriptive statistics for a sample of 179 CEOs who left their positions in Fortune 500 firmsbetween 1996 and 2002. Prior year compensation includes salary, bonus, option awards, andrestricted stock awards; and this variable is missing on the ExecuComp database for nine CEOs. The value of shares and options is computed at the end of the year prior to the CEO’s departure. All stock option values are computed according to the Black-Scholes method. Three-year excesscompensation is based upon the residual from a regression of the log of compensation against thelog of firm size, three-year stock return net of market, and industry and year dummy variables;this variable is missing for 32 CEOs with less than three years tenure. Financial data is obtainedfrom ExecuComp, and the anti-shareholder rights index is obtained from the InvestorResponsibility Research Center, based on the method of Gompers, Ishii, and Metrick (2003).
Observations
Age of exiting CEOYears tenure in officeMember of company’s founding familyExternal hire, within past five yearsWorking under employment contractNegotiated separation agreement filedValue of shares and options (millions)Value of shares and optionsCompensation in prior year (millions)Compensation in prior yearThree-year excess compensation (millions)Three-year excess compensation
(mean)(mean)(mean)(mean)(mean)(mean)(mean)(median)(mean)(median)(mean)(median)
Fullsample
179
6110
12.3%7.3%
34.6%49.7%$532.7
$43.1$8.1$4.8$6.3$1.6
Voluntaryturnover
136
6311
14.0%4.4%
31.6%41.9%$674.9
$50.9$7.8$4.4$5.6$1.6
Forcedturnover
43
566
7.0%16.3%44.2%74.4%$83.1$22.5
$9.5$6.2
$10.0$2.3
a a a
a
a
a
Next position with firm ChairmanVice ChairmanDirectorNone
1101
1850
991
1521
1103
29
Debt / total assetsTotal assets (billions)Total assetsAnti-shareholder rights index
(mean)(mean)(median)(mean)
0.395$35.4$12.7
9.8
0.379$37.9$12.8
9.9
0.443$27.5$12.7
9.6
Differences in right two columns are significant at 1% (a), 5% (b), and 10% (c) levels, according to T-tests (means)and Wilcoxon rank-sum tests (identical distributions).

30
Table IIIContracted and discretionary CEO separation payments
Descriptive statistics for compensation paid to CEOs of 179 Fortune 500 companies who left theirpositions between 1996 and 2002. Data are tabulated according to whether the CEO had been workingunder an employment contract. All values are in millions, and when payments are spread over time, datareflect present values discounted at the company’s cost of debt. Information is obtained from eachcompany’s proxy statements and other SEC filings.
CEO hademployment
contract
Noemployment
contract Total
Voluntaryturnover
Observations
Contracted separation paymentsFrequencyMean
Additional discretionary paymentsFrequencyMean
43
716%$0.3
1842%$2.2
93
- -- -- -
4144%$2.3
136
75%
$0.1
5943%$2.2
Forcedturnover
Observations
Contracted separation paymentsFrequencyMeanMedian
Additional discretionary paymentsFrequencyMeanMedian
19
1789%$8.1$3.1
1158%$3.9$1.1
24
- -- -- -- -
2188%
$17.5$6.0
43
1740%$3.6
- -
3274%
$11.5$4.7
Full sample Observations
Contracted separation paymentsFrequencyMean
Additional discretionary paymentsFrequencyMeanMedian
62
2439%$2.7
2947%$2.7
- -
117
- -- -- -
6253%$5.4$0.4
179
2413%$0.9
9151%$4.5$0.2

31
Table IVElements of CEO separation payments
Descriptive statistics for compensation paid to CEOs of 179 Fortune 500 companies who lefttheir positions between 1996 and 2002. All values are in millions, and when payments arespread over time, data reflect present values discounted at the company’s cost of debt. Equitycompensation adjustments reflect increases in stock option and restricted stock values due tochanges in award maturities or vesting conditions, with all option values computed according toBlack-Scholes methods. Information is obtained from each company’s proxy statements andother SEC filings.
Voluntary turnoverLump-sum paymentsConsulting or non-competeAugmentations of pensionEquity award adjustmentsSub-total: discretionary
Contracted severance paymentsTotal of all payments
Freq.16%25%10%
8%43%
5%47%
Mean$0.7$0.4$0.5
$0.6$2.2
$0.1$2.3
Median000
0$0.0
0$0.0
75th %ile0
$0.10
0$1.3
0$1.7
Maximum$21.9
$6.5$11.1
$24.1$24.1
$4.7$24.1
Forced turnoverLump-sum paymentsConsulting or non-competeAugmentations of pensionEquity award adjustmentsSub-total: discretionary
Contracted severance paymentsTotal of all payments
37%44%44%
40%74%
40%91%
$1.3$1.5$2.2
$6.5$11.5
$3.6$15.1
a a a a a a
000
0$4.7
0$6.5
$0.6$2.3$2.4
$2.9$9.9
$2.9$14.2
$10.4$9.5
$15.5 $109.1$121.1
$36.1$121.1
a a a a a
a a
Entire sampleLump-sum paymentsConsulting or non-competeAugmentations of pensionEquity award adjustmentsSub-total: discretionary
Contracted severance paymentsTotal of all payments
21%30%18%
16%51%
13%
58%
$0.9$0.7$0.9
$2.0$4.5
$0.9$5.4
000
0$0.2
0$0.7
0$0.5
0 0
$4.3
0$5.0
$21.9$9.5
$15.5 $109.1
$121.1
$36.1$121.1
Differences in top two panels are significant at 1% (a), 5% (b), and 10% (c) levels, according to T-tests (means) andWilcoxon rank-sum tests (identical distributions).

32
Table VRegression estimates of separation pay
Tobit estimates of the total value of separation pay for 179 Fortune 500 CEOs who left theirpositions between 1996 and 2002. Excess prior compensation is estimated over the three yearsprior to CEO turnover based upon the residual from a standard compensation regression model,and is set equal to zero for all CEOs with less than three years service. Expected years toretirement equals the greater of zero and 65 minus the CEO’s age. The indicator for recentoutside hire equals 1 if the exiting CEO was hired from outside the firm within the past fiveyears. The anti-shareholder rights index is based on the method of Gompers, Ishii, and Metrick(2003). Pseudo r2 is calculated according to Veall and Zimmermann (1994). Compensationvariables are measured in millions of dollars, and firm size is measured in billions.
Voluntary turnover sample Forced turnover sample
VariableExcess prior compensationExpected years to retirementRecent outside hire indicatorLeverage (debt / total assets)Anti-shareholder rights indexFirm size (log of total assets)
Year indicatorsIndustry indicators, 1-digitSICTotal observationsPositive observationsPseudo r2
Prediction- or +
-
Yes Yes 136 64
0.356
Coef. -0.04
-0.21
2.85 3.55
-0.14
0.86
t-stat-1.01-0.810.760.91
-0.421.26
Prediction
+ + -
+
Yes Yes
43 39
0.882
Coef. 0.12 2.11
-0.10
-38.00
3.48 11.87
t-stat 0.47 1.99 b-0.01
-2.37 b
1.65 c2.23 b
Significant at 1% (a), 5% (b), and 10% (c) levels.
33
Table VIAbnormal stock returns at announcement of separation packages
Mean cumulative abnormal stock returns around the disclosure of separation packages for asample of 179 exiting CEOs of Fortune 500 companies between 1996 and 2002. Abnormalreturns are calculated for an event window beginning four days prior to the disclosure date andending one day after, using standard market model methodology. Disclosure dates occur when acompany makes an SEC filing that describes details of the CEO’s package, or, in a small numberof cases, by making a public news announcement. The top rows of the table include data for theentire sample, excluding five disclosure events that took place simultaneously with theannouncement of the CEO’s dismissal. The bottom rows omit observations for exiting CEOswho received zero discretionary separation payments. For CEOs receiving zero payments, theevent date is the first proxy statement filing after the CEO leaves office.
All CEOsObservations
Mean cumulative abnormal returnMedian cumulative abnormal return
T-statistic p-valueWilcoxon statistic p-valuePositive : negative
Fullsample
174
-0.80%-0.82%
0.07 c0.1280 : 94
Voluntaryturnover
136
-1.17%-0.99%
0.02 b0.02 b58 : 78
Forcedturnover
38
0.51%0.89%
0.540.4722 : 16
(Forced -voluntary)difference
1.68%1.88%
0.08 c0.11
CEOs with discretionary paymentsObservations
Mean cumulative abnormal returnMedian cumulative abnormal return
T-statistic p-valueWilcoxon statistic p-valuePositive : negative
88
-0.06%-0.37%
0.930.8643 : 45
59
-0.75%-0.83%
0.560.1425 : 34
29
1.36%3.05%
0.330.3418 : 11
2.11%3.88%
0.260.09 c
Significant at 1% (a), 5% (b), and 10% (c) levels, based upon T-tests and Wilcoxon rank-sum and signed-ranktests.


