
Governance, Competition and Opportunistic Accounting Choices by Banks
Robert M. Bushman
Kenan-Flagler Business School
University of North Carolina-Chapel Hill
Qi (Susie) Wang
NUS Business School
National University of Singapore
Christopher D. Williams
Ross School of Business
University of Michigan
First Draft: June 2013
Current Draft: April 2017
___________________________ We thank Neil Bhattacharya, Qiang Cheng, Jong-Hag Choi, Yiwei Dou (discussant), Bin Ke, Clive Lennox, Gerald
Lobo, Jeff Ng, Srinivasan Sankaraguruswamy, Xiangang Xin, workshop participants at Chinese University of Hong
Kong and University of North Carolina at Chapel Hill, and participants at 2014 Tri-Uni Junior Faculty Research
Conference, 2014 Financial Accounting and Reporting Section Midyear Meeting and 2013 Xiamen Winter Research
Camp, for helpful comments. We thank NUS Risk Management Institute for providing data on bank default events. We gratefully acknowledge the financial support from Kenan-Flagler Business School, University of North Carolina
at Chapel Hill, NUS Business School, National University of Singapore, and Ross School of Business, University of
Michigan.

Governance, Competition and Opportunistic Accounting Choices by Banks
Abstract
We investigate the influence of bank competition on agency costs by examining whether
earnings management in the form of loan loss provision smoothing increases as the wedge
between control rights and cash-flow rights increases. We hypothesize that disciplining pressure
from intense bank competition counteracts negative consequences of a control rights-cash flow
rights wedge, reducing incentives of controlling shareholders to engage in earnings smoothing.
While we find that earnings smoothing by banks is increasing in the magnitude of the wedge, the
impact of the wedge on earnings smoothing significantly decreases as bank competition
increases. Our results illustrate the powerful role that competition can play in counteracting
negative consequences of weak governance structures for opportunistic accounting choices by
banks.

1
1. Introduction
While diffuse ownership structures give rise to potential agency conflicts between
managers and owners of firms (e.g., Berle and Means 1932, Jensen and Meckling 1976),
concentrated ownership structures are not immune from agency conflicts as controlling
shareholders can exploit control to expropriate a firm’s resources for their own private benefit
(e.g., Shleifer and Vishny 1997). Ownership interests consist of two distinct ownership
components, cash flow and control rights. From a governance perspective, controlling
shareholders enjoying considerable control exceeding their cash flow rights have incentives and
opportunities to obtain private benefits at the expense of firm value.1 That is, conditional on
having control, incentives to consume private benefits depend on a controlling shareholder’s
skin-in-the-game as embedded in their holdings of cash-flow rights.2 Prior research provides
evidence consistent with such expropriation, showing that firm value falls as cash flow rights of
controlling shareholders decrease, and when control rights of controlling shareholders exceed
cash-flow rights. This holds both for non-financial firms (Claessens et al. 2002) and banks
(Caprio, Laeven and Levine 2007).
Expropriation activities create incentives for controlling shareholders to conceal such
activities from outsiders to avoid political costs and potential disciplinary actions against them
(see, e.g., Zingales 1994; Shleifer and Vishny 1997). Luez, Nanda and Wysocki (2003) posit that
controlling owners have incentives to opportunistically manage a firm’s earnings to mask true
firm performance and conceal their extraction of private control benefits from outsiders.
Focusing on the banking sector, we investigate how the intensity of a bank’s competitive
1 Mechanisms for separating control from cash flow rights include pyramids, cross-holdings, and dual class shares.
See Bebchuk, Kraakman and Triantis (2000) for a detailed discussion of these mechanisms. 2 Controlling shareholders could expropriate minority shareholders via self-dealing transactions in which profits can
be transferred to other firms they control. They could also pursue objectives that are not profit-maximizing in return
for personal utilities. See Fan and Wong (2002) for detail discussions.
2
environment impacts the incentives of controlling shareholders to extract private benefits and
manage earnings to conceal such expropriation activities.3
We utilize a sample of banks from 46 countries to investigate whether earnings
management in the form of loan loss provision smoothing increases as the wedge between a
controlling shareholder’s control and cash flow rights increases. A main objective of our paper is
to investigate the extent to which bank competition mitigates controlling shareholders incentives
to manage earnings. Specifically, we test the hypothesis that disciplining pressure exerted on
banks by intense bank competition counteracts negative consequences of the control rights-cash
flow rights wedge, reducing the influence of the wedge on the incentives of controlling
shareholders to engage in earnings smoothing. We provide evidence consistent with this
hypothesis.
Banks are in many respects similar to non-financial firms, and so our paper speaks
generally to relations between ownership structures, private benefits of control, and opportunistic
accounting. However, the banking sector is also in some respects special and is an important
setting in which to investigate the nexus between governance and earnings management. Banks
are the backbone of a country’s financial sector, making it important to understand the role
corporate governance plays in determining bank stability and the efficiency with which banks
provide financial services to the economy (e.g., Caprio, Laeven and Levine 2007). Governance
also has special relevance to the banking sector deriving from the tension created by the dual
demands on banks to be value maximizing entities that also serve public interests that transcend
the individual bank, where opportunistic behavior can impose substantial negative externalities
on the economy. When controlling owners manage loan loss provisions to conceal private benefit
3 Healy and Wahlen (1999) define earnings management as the alteration of firms’ reported economic performance
by insiders to either mislead some stakeholders or to influence contractual outcomes.

3
extraction by masking true performance and risk attributes of loan portfolios, the attendant loss
of transparency can undermine bank stability. For example, Bushman and Williams (2012 and
2015) find that diminished transparency deriving from opportunistic management of loan loss
provisions can dampen risk-taking discipline by inhibiting outside monitoring of banks, and by
increasing equity financing frictions that restrict banks’ ability to replenish capital during
economic downturns.
Our bank ownership sample is from Laeven and Levine (2009). Data permitting, they
collect detailed ownership data for the year 2001 on the 10 largest publicly listed banks in
countries for which La Porta et al. (1998) assembled data on shareholder rights.4 Given the
existence of complex pyramid schemes and cross-holding structures, cash flow and control rights
are established by tracing indirect ownerships chains backwards through numerous corporations
to identify the ultimate controllers of the votes. The data set contains cash flow rights and voting
rights for all banks where the ultimate owner has direct and indirect voting rights that sum to 10%
or more.5 Banks with no owner holding 10% or more of the voting rights are classified as
diffusely held. All results are robust to increasing this cutoff to 30%. Our main variable of
interest is the wedge, calculated as the total percentage of voting rights held minus the total
percentage of cash flow rights. We also run specifications that include voting rights and cash
flows rights separately in place of the wedge. While the sample size varies with the particular
specification, our maximum sample consists of 243 banks from 46 countries.
To capture the opportunistic use of accounting discretion by banks we use earnings
smoothing via loan loss provisions. The loan loss provision represents the main accounting
4 Laeven and Levine (2009) eliminate all state-owned banks (banks with majority stakes by the government),
implying that the sample focuses only on private owners. We include the La Porta et al. (1998) shareholder rights
variable, along with many others, as a control in all specifications. 5 The data includes two additional governance variables that we include as controls: total cash flow rights held by
senior management of the bank, and an indicator if the controlling shareholder has a seat on the board of directors.
4
accrual for most banks, facilitating our ability to estimate smoothing by examining the behavior
of loss provisions alone. Our focus on banks also minimizes innate differences in the wealth
generating process across firms in our sample, an issue that plagues the study of earnings
management at non-financial firms (Dechow, Ge and Schrand 2010). Earnings smoothing is
commonly posited to reflect the opportunistic exercise of accounting discretion by insiders to
manage reported earnings in order to conceal adverse economic shocks or underreport strong
current performance to create reserves for the future (e.g., Leuz, Nanda and Wysocki 2003). In a
banking context, Bushman and Williams (2012) provide evidence that discretionary smoothing
via loan loss provisions reduces the transparency of banks to outsiders. We estimate smoothing
using the coefficient from a regression of loan loss provisions on contemporaneous earnings,
after controlling for non-discretionary determinants of loan loss provisions. Higher sensitivity of
current provisions to current period earnings realizations is interpreted as greater discretionary
smoothing.6
Using this empirical smoothing specification, we first investigate whether loan loss
provision smoothing increases as the wedge between a controlling shareholder’s control and cash
flow rights increases. We find that earnings smoothing is increasing in the wedge, after
controlling for a wide range of key bank-level and country-level variables. As noted earlier,
Caprio, Laeven and Levine (2007) show that bank valuations fall as controlling owners’ cash
flow rights decrease, consistent with increasing private benefits of control. We extend Caprio,
Laeven and Levine (2007) by showing that increasing private benefits of control are
6 A significant literature uses analogous empirical specifications to examine the use of discretionary loan loss
provisioning to smooth earnings. Such papers include Greenwald and Sinkey (1988), Beatty, Chamberlain and
Mogliolo (1995), Collins, Shackelford and Whalen (1995), Ahmed, Takeda and Thomas (1999), Laeven and
Majnoni (2003), Bikker and Metzemakers (2005), Liu and Ryan (2006), Fonseca and Gonzalez (2008), Pérez, Salas-
Fumas and Saurina (2008), and Gebhardt and Novotny-Farkas (2011), among others.

5
accompanied by increased smoothing, presumably to conceal expropriation activities.7 Our
results also complement Fan and Wong (2002), who find that the informativeness of accounting
earnings is decreasing in the wedge between voting and cash flow rights using a sample of firms
from seven East Asian economies.
Building on this baseline result, we next examine the hypothesis that bank competition
offsets the negative consequences of weak governance emanating from the control rights-cash
flow rights wedge, reducing incentives of controlling shareholders to engage in earnings
smoothing. Economists have long argued that competitive forces act as a disciplining device,
exerting pressure on firms to reduce slack and improve efficiency in order to survive (e.g.,
Scherer 1980, Fama 1980). However, this hypothesis has been difficult to establish empirically
(e.g., Giroud and Mueller 2010, Jagannathan and Srinivasan 1999). We exploit our setting to
investigate the extent to which bank competition reduces opportunistic earnings management by
controlling shareholders.
Following Beck, De Jonghe and Schepens (2013), among others, we estimate competition
at the bank level using the Lerner index. The Lerner index captures competition by estimating
pricing power as the distance between marginal revenues and marginal costs. In contrast to
competition measures such as market share or market concentration, the Lerner index has several
advantages for our study. First, it does not require explicit definition of the market in which the
bank competes, potentially allowing the measure to capture the competition that a particular bank
faces from existing domestic banks, foreign banks, potential entrants, and non-bank competitors.
Second, the Lerner index conceptually measures the extent to which an individual bank can
increase marginal price beyond marginal cost. The bank’s ability to create a separation between
7 Potential channels through which the controlling shareholders of banks expropriate minority shareholders include
making loans to risky related parties at below market rates, making loans to politicians or government officials,
rolling over failing loans of cronies to keep them afloat, etc.

6
marginal price and marginal cost creates scope for the bank’s controlling shareholders to
expropriate and enjoy private benefits of control.
We split banks into high and low competition partitions based on estimated Lerner
indices. We then estimate the relation between smoothing and the control-cash flow rights wedge
separately within each partition. We find that our previous result that smoothing increases with
the wedge, only holds in the low competition partition. In contrast, there is no relation between
smoothing and the wedge in the high competition partition where banks face significant
disciplining pressure from the competitive environment.
The recent financial crisis has focused much attention on sources of structural
weaknesses in the banking sector. In this vein, bank governance has received significant
attention from both academics (Mehran, Morrison and Shapiro 2011) and policy-makers (Senior
Supervisors Group 2008, 2009; Walker Report 2009; Committee of European Banking
Supervisors 2010). Our paper contributes to the literature on bank governance and bank
competition by documenting the powerful role that bank competition plays in counteracting the
negative consequences of weak governance structures as manifested in opportunistic accounting
choices by banks. We also contribute to the debate with respect to the mechanisms through
which competition affects stability in the banking sector by documenting the negative
consequences of earnings smoothing, lending support to the competition-stability hypothesis.
The rest of the paper is organized as follows: section 2 discusses the related literature.
Section 3 explains our data and empirical approach. Section 4 presents the empirical results and
section 5 concludes.

7
2. Related Literature
A crucial agency problem is the ability of controlling owners to expropriate corporate
resources (e.g., Jensen and Meckling 1976). The incentives of controlling shareholders to
expropriate resources depend on their cash-flow rights. As their cash-flow rights rise,
expropriation involves a greater reduction in their own cash flow. Since expropriation is costly,
increases in the cash-flow rights of the controlling owner will reduce incentives to expropriate
resources from the corporation, holding other factors constant.
Grossman and Hart (1988) and Harris and Raviv (1988) demonstrate that separating
ownership and control can lower shareholders' value and may not be socially optimal. Shleifer
and Vishny (1997) argue that when ownership exceeds the point where large owners gain nearly
full control of the company they may prefer to use firms to generate private benefits of control
that are not shared by minority shareholders. Bebchuk, Kraakman, and Triantis (2000) contend
that separating control rights from cash-flow rights can create agency costs an order of
magnitude larger than the costs associated with a controlling shareholder who also has a majority
of the cash-flow rights in his or her corporation. Claessens et al. (2002) find that firm value
increases with the cash-flow ownership of the largest shareholder, consistent with a positive
incentive effect. But firm value falls when the control rights of the largest shareholder exceed its
cash-flow ownership, consistent with an entrenchment effect.
Loan loss provisioning is a key accounting choice that directly influences the volatility
and cyclicality of bank earnings, as well as information properties of banks’ financial reports
with respect to reflecting loan portfolios’ risk attributes. Banks around the world have significant
discretion over their loan provisioning decisions (Bushman and Williams 2012, Fonseca and
Gonzalez 2008, Laeven and Majnoni 2003). However, accounting discretion is a double-edged

8
sword (e.g., Dechow and Skinner 2000). While increased discretion may facilitate incorporation
of more information about future expected losses into loan provisioning decisions, it also
increases potential for opportunistic or misguided accounting behavior by managers that can
degrade bank transparency and lead to negative consequences along other dimensions (e.g.,
Koch and Wall 2000).
Dechow, Ge and Schrand (2010) classify research on earnings quality according to
whether it provides evidence on the determinants or the consequences of the earnings quality
proxy it examines. A significant literature exists examining the use of discretionary loan loss
provisioning to smooth earnings that can be characterized as determinants studies. Such papers
include Greenwald and Sinkey (1988), Beatty, Chamberlain and Mogliolo (1995), Collins,
Shackelford and Whalen (1995), Ahmed, Takeda and Thomas (1999), Laeven and Majnoni
(2003), Bikker and Metzemakers (2004), Liu and Ryan (2006), Pérez, Salas-Fumas and Saurina
(2008), and Gebhardt and Novotny-Farkas (2011), among others.
Bushman and Williams (2012) explore consequences of banks’ loan loss provision
smoothing for bank stability. Examining banks across 27 countries, Bushman and Williams
(2012) find that smoothing of loan loss provisions dampens discipline over risk-taking,
consistent with diminished transparency inhibiting outside monitoring. Indicative of smoothing
dampening disciplinary pressure over banks’ risk-taking activities, they find that the sensitivity
of bank capital to changes in asset volatility is lower in high smoothing regimes relative to low
smoothing regimes, and that banks in high smoothing regimes exhibit more risk-shifting relative
to banks in low smoothing countries.
How competition affects firm performance is a central question of economics. While the
forces of competition are fundamental to all sectors of an economy, an issue of particular interest

9
to bank regulators and policy-makers is the potential link between bank competition and the
financial stability of banks. A large body of prior research has failed to resolve this important
question (e.g., Allen and Gale 2004, Beck 2008, Claessens 2009). On the one hand, the
competition-fragility view posits that more competition among banks leads to more fragility.
This “charter value” view of banking sees banks as choosing the risk of their asset portfolio.
Banks owners, however, have incentives to shift risk to depositors, as in a world of limited
liability they only participate in the up-side part of this risk taking. In a more competitive
environment with more pressure on profits, banks have higher incentives to take more excessive
risks, resulting in higher fragility. In systems with restricted entry and therefore limited
competition, banks have better profit opportunities, capital cushions and therefore few incentives
to take aggressive risks, with positive repercussions for financial stability. In addition, in a more
competitive environment, banks earn fewer information rents from their relationship with
borrowers, reducing their incentives to properly screen borrowers, again increasing the risk of
fragility. On the other hand, the competition-stability hypothesis argues that more competitive
banking systems result in more, rather less, stability. Specifically, Boyd and De Nicolo (2005)
show that lower lending rates reduce the entrepreneurs’ cost of borrowing and increase the
success rate of entrepreneurs’ investments. As a consequence, banks will face lower credit risk
on their loan portfolio in more competitive markets, which should lead to increased banking
sector stability.
In this paper, we take a novel approach to the competition-stability question by
examining how banks’ competitive environment impacts the incentives of controlling
shareholders to extract private benefits and manage earnings to conceal such expropriation
activities. Our innovation is in examining how the interaction between bank competition and

10
governance impacts bank behavior, specifically the extent of opportunistic loan loss provisioning
behavior. Building on prior literature examining connections between weak bank governance and
expropriation by controlling owners, we first show that increasing private benefits of control are
accompanied by increased smoothing, presumably to conceal expropriation activities. We then
show that greater bank competition is associated with less smoothing, consistent with
competition counteracting the expropriation incentives created by weak governance. Finally, we
document the consequences of banks’ earnings smoothing by showing that banks engaging in
more earnings smoothing have lower valuation and higher default likelihood, lending support to
the competition-stability hypothesis.
3. Data, Bank Ownership Estimation and Empirical Design
3.1 Data, Bank Ownership Estimation
The analyses in this study are based on the sample in Laeven and Levine (2009, hereafter
LL). They collected information on the ten largest publicly listed banks,8 as defined by total
assets at the end of 2001, in the countries for which La Porta et al. (1998) assembled data on
shareholder rights. Because LL focuses on the incentives of private owners, all state-owned
banks are excluded. State-owned banks are defined as banks where the government owns the
majority stake over the sample period. This yields a sample of 279 banks from 48 countries in
2001. The sample, on average, accounts for over 80% of total assets in the banking system in
each country.
Following Caprio, Laeven and Levine (2007), LL collect data on bank ownership
structure in 2001 and classify a bank as having a large shareholder if the shareholder has direct
8 LL note that “focusing on the largest banks enhances comparability because they tend to comply with international
accounting standards and have more liquid shares, reducing concerns that accounting or liquidity differences drive
the results”.

11
or indirect voting rights of 10% or more. Otherwise, the bank is classified as being diffusely held.
Shares registered in the shareholder’s name are classified as direct ownership, while those held
by entities controlled by ultimate shareholders are defined as indirect ownership. For indirect
ownership, the control chain is traced backwards through numerous entities to identify the
ultimate controllers. When there were several control chains between an ultimate controller and a
bank, LL summarized the voting rights across all of these chains to calculate the control rights of
that ultimate controller. For multiple shareholders with over 10% voting rights, they define the
large shareholder as the owner with the highest control rights. As the large owner could hold
cash flow rights directly and indirectly, the total number of cash flow rights is the sum of direct
and indirect cash flow rights of the large shareholder. To compute indirect cash flow rights, LL
use the products of the cash flow rights along the control chain of the large shareholder.
Using the data from LL, we compute the difference between a large shareholder’s control
rights and cash flow rights and label the variable WEDGE. We then use the variable WEDGE as
a proxy for controlling shareholders’ incentives to extract private benefits. We predict that banks
with higher WEDGE engage in more earnings smoothing via loan loss provisions to conceal their
expropriation activities.
3.2 Empirical Design
Following prior literature (Bushman and Williams, 2012; Liu and Ryan, 2006; Laeven
and Majnoni, 2003) we estimate the extent to which banks’ engage in loan loss provision
smoothing using the following regression framework:
1ij ij ijLLP EBLLP Controls , (1)

12
where 𝐿𝐿𝑃𝑖𝑗 is the loan loss provisions for bank i in country j, scaled by average loans
outstanding during the year,9 and 𝐸𝐵𝐿𝐿𝑃𝑖𝑗 is defined as earnings before loan loss provisions and
taxes for bank i in country j. Under the incurred loss model of loan loss accounting, earnings
before loan loss provisions and taxes should not explain contemporaneous provisioning after
controlling for the determinants of provisions. 10
To the extent banks smooth earnings via loan
loss provision, 𝐿𝐿𝑃𝑖𝑗, we will observe β1 > 0.
To capture the effect of governance on observed income smoothing via the loan loss
provision we modify equation (1) as follows:
1 2 3 *ij ij ij ij ij ijLLP EBLLP WEDGE EBLLP WEDGE Controls . (2)
And also as:
𝐿𝐿𝑃𝑖𝑗 = 𝛾0 + 𝛾1𝐶𝐹𝑖𝑗 + 𝛾2𝐶𝐹𝑖𝑗 ∗ 𝐸𝐵𝐿𝐿𝑃𝑖𝑗 + 𝛾3𝐶𝑂𝑁𝑇𝑅𝑂𝐿𝑖𝑗 + 𝛾4𝐶𝑂𝑁𝑇𝑅𝑂𝐿𝑖𝑗 ∗ 𝐸𝐵𝐿𝐿𝑃𝑖𝑗 +
𝐶𝑜𝑛𝑡𝑟𝑜𝑙 + 𝜇𝑖𝑗, (3)
where LLP and EBLLP remain as defined previously. 𝑊𝐸𝐷𝐺𝐸𝑖𝑗 is the difference between a
controlling shareholder’s control rights and cash flow rights for bank i in country j, calculated as
total percentage of control rights (𝐶𝑂𝑁𝑇𝑅𝑂𝐿𝑖𝑗) minus total percentage of cash flow rights (𝐶𝐹𝑖𝑗).
As the incentives of controlling shareholders to expropriate increase, as proxied for by WEDGE,
we also expect the incentives of controlling shareholders to engage in earnings smoothing to
increase. We thus predict the coefficient 𝛽3 in Eq. (2) to be significantly positive. In Eq. (3), we
replace 𝑊𝐸𝐷𝐺𝐸𝑖𝑗 with the measures of control rights (𝐶𝑂𝑁𝑇𝑅𝑂𝐿𝑖𝑗) and cash flow rights (𝐶𝐹𝑖𝑗),
9 Average loans are computed as the mean value of total loans at the beginning of the year and those at the end of
the year. Similar method applies to the computation of average assets. 10 U.S. GAAP and IFRS utilize an incurred loss model where loan losses are recognized only after loss events have
occurred prior to the reporting date that are likely to result in future non-payment of loans.

13
and interact with 𝐸𝐵𝐿𝐿𝑃𝑖𝑗. We expect that 𝛾4 in Eq. (3) to be significant positive if the incentives
of controlling shareholders to expropriate increase their incentives to smooth earnings.
We include a number of bank-level control variables in all of our regression
specifications to control for the determinants of LLP. We include a measure of bank capital,
𝐶𝐴𝑅𝑖𝑗 , computed as book value of equity divided by total assets for bank i in country j, to
control for the effect of using loan loss provisions for capital management (Beatty, Chamberlain
and Mogliolo 1995; Collins, Shackelford and Whalen 1995). We also include 𝑆𝑖𝑧𝑒𝑖𝑗 defined as
natural logarithm of the average of total assets during the year for bank i in country j. We control
for the risk of the bank using 𝑍𝑆𝐶𝑂𝑅𝐸𝑖𝑗, measuring the distance from insolvency as the return on
assets plus the capital asset ratio divided by the standard deviation of asset returns (e.g., LL).
𝐿𝑜𝑎𝑛𝐺𝑟𝑜𝑤𝑡ℎ𝑖𝑗 is the percentage change in total loans for bank i in country j for the year.
Following LL, we include two governance related control variables. To control for senior
management’ share holdings, we include 𝑀𝐴𝑁𝐴𝐺𝐸𝑅_𝐶𝐹𝑖𝑗 , the total cash flow rights held by
senior management of the bank. Finally, we include 𝑂𝑊𝑁𝐸𝑅_𝐵𝑂𝐴𝑅𝐷𝑖𝑗 an indicator set equal to
“1” if a large shareholder has a seat on the management board of the bank, and “0” otherwise.
A vector of country-level capital market regulatory regimes is also included as control
variables. To control for the general contracting and property rights environment of a country,
we include a measure of the general disclosure requirements under securities law, Disclosure,
(La Porta, Lopez-de-Silanes and Shleifer 2006), the efficiency of the judicial system, Judicial,
(La Porta et al., 1998) and the country-level protection of investors against self-dealing, Rights,
(Djankov et al., 2008). Stricter disclosure requirements and stronger associated enforcement
should reduce opportunities for banks’ earnings manipulation. Similarly, stronger investor
protection rules facilitate equity financing in public equity markets by attempting to encourage

14
transparency in financial reporting. Thus, banks listed on stock markets characterized by higher
disclosure requirements ( 𝐷𝐼𝑆𝐶𝐿𝑂𝑆𝐸 ), higher judicial efficiency ( 𝐽𝑈𝐷𝐼𝐶𝐼𝐴𝐿 ) and stronger
investor protection (𝑅𝐼𝐺𝐻𝑇) should have lower incentives and scope to mask true performance
via earnings smoothing. Moreover, the level of GDP (𝐿𝐺𝐷𝑃) and the percentage change in GDP
(∆𝐺𝐷𝑃) for a particular country are included to control for the overall development of the
economy. Finally, we follow LL, and include a country-level index of official corruption
(𝐶𝑂𝑅𝑅𝑈𝑃𝑇𝐼𝑂𝑁 ) and a deposit insurance indicator at the country level (𝐷𝐸𝑃𝑂𝑆𝐼𝑇). Detail
description about these regimes is included in the Appendix.
After requiring all the variables for the regression analyses, our final sample consists of
174 banks from 37 countries. Table 1 Panel A reports country by country data on the number of
sample banks and shows that no country makes up more than 6% of the sample, helping to
eliminate concerns that any one country is driving the results. Since the values of some country-
level variables are missing for certain countries, the number of observations used for regression
analyses varies from 140 to 174.11
Table 1 Panel B reports the descriptive statistics for the each
of the regression variables for the pooled sample. Table 2 documents the results of estimating Eq.
(2) without the interaction term 𝐸𝐵𝐿𝐿𝑃𝑖𝑗 ∗ 𝑊𝐸𝐷𝐺𝐸𝑖𝑗. After controlling for WEDGE and other
bank-level and country-level characteristics, we show that the coefficient on EBLLP is
significantly positive (i.e., 0.1799, significant at 1% level), consistent with banks engaging in
earnings smoothing via loan loss provisions. Table 3 reports the distribution of wedge (WEDGE),
cash flow rights (CF) and control rights (CONTROL) by country. The total sample mean values
of WEDGE, CF and CONTROL are 0.0781, 0.2771 and 0.3552 respectively. The minimum mean
11 In robustness analysis contained in section 4.3 below, we present analyses that include a number of additional
controls for a country’s bank regulatory regime including, restrictions on banks’ activities, insurance activities, the
power of supervisory authorities, the degree to which bank regulation promotes private monitoring activities, and the
stringency of capital requirements. While all results are robust to including these variables, there is a substantial
loss of sample size and so we relegate this analysis to the robustness sectional for expositional purposes.

15
value of WEDGE across countries is 0. The country with the largest mean WEDGE value is
Brazil (0.574). The minimum mean values of CF and CONTROL across countries are 0, while
the maximum mean value of CF is in Indonesia (0.7133) and that of CONTROL is in Brazil
(0.804).
4. Empirical Results
4.1. Incentives to Smooth Earnings via the Loan Loss Provisions
Table 4 Panel A reports results estimating Eq. (2). As expected, banks’ incentives to
smooth earnings tend to be higher when the deviation between ultimate owners’ control rights
and cash flow rights is greater, as reflected by the positive coefficient of 0.3421 (p-value < 0.01)
on the interaction between 𝑊𝐸𝐷𝐺𝐸 and 𝐸𝐵𝐿𝐿𝑃. This result extends Caprio, Laeven and Levine
(2007) by showing that increasing private benefits of control are accompanied by increased
smoothing, presumably to conceal expropriation activities. That is, expropriation of private
benefits of control goes hand-in-hand with obfuscation via earnings management. Our results
also complement Fan and Wong (2002), who find that the informativeness of accounting
earnings is decreasing in the wedge between voting and cash flow rights using a sample of firms
from seven East Asian economies.
Results from the estimation of Eq. (3) are demonstrated in Table 4 Panel B. Consistent
with our predictions, the coefficient on the interaction between 𝐶𝑂𝑁𝑇𝑅𝑂𝐿 and 𝐸𝐵𝐿𝐿𝑃 is
significantly positive, i.e., 0.2878 (p-value < 0.01), implying that the above results in Panel A is
driven by controlling shareholders’ incentives to expropriate minority shareholders. Moreover,
the coefficient on the interaction between 𝐶𝐹 and 𝐸𝐵𝐿𝐿𝑃 is significantly negative (-0.3326,
significant at 1% level). This implies that controlling shareholders’ skin-in-the-game as

16
embedded in their holdings of cash-flow rights mitigate their incentives to expropriate,
subsequently reducing the engagement of earnings smoothing by controlling shareholders. We
turn next to an examination of the hypothesis that bank competition offsets the negative
consequences of weak governance emanating from the control rights-cash flow rights wedge.
4.2. The Effects of Bank Competition on Incentives to Smooth
The literature on bank competition has employed a wide range of measures to capture the
level of competition, including measures of industry concentration (e.g. Herfindahl indices),
market share measures, measures of bank entry regulation, and measures based on observed
relations between banks’ output prices and input prices. In a recent paper, Bushman, Hendricks
and Williams (2016) use bank management’s discussion of competition found in the 10-K as a
measure of banks’ perceived competition. However, there is no consensus in the banking
literature as to the best way to measure bank competition, as each measure has its own set of
estimation and interpretation challenges.12
In this paper, we follow Beck, De Jonghe and Schepens (2012) and measure competition
using the Lerner Index, a bank-level measure of market power. We employ the Lerner Index, as
opposed to a country-level metric e.g. Herfindahl index, because Lerner directly captures the
extent to which an individual bank can increase marginal price beyond the marginal cost. This
ability to extract economic profits in essence creates scope for the bank’s controlling
shareholders to expropriate and enjoy private benefits of control. To capture a bank’s market
power, the Lerner Index employs the ratio between marginal revenue and marginal cost. Under
perfect competition, marginal revenue will equal marginal cost. Reduced competition will induce
a divergence between the two variables. Based on this economic reasoning, the Lerner Index is
12 Berger et al. (2004) discuss the evolution of the literature in more details.

17
bound between 0 (perfect competition) and 1 (monopoly). Specifically, the Lerner Index is
estimated as follows:
𝐿𝑒𝑟𝑛𝑒𝑟𝑖𝑡 =𝑃𝑖𝑡−𝑀𝐶𝑖𝑡
𝑃𝑖𝑡 . (4)
𝑃𝑖𝑡 is measured as operating income (interest revenue plus non-interest revenue) to total assets.
𝑀𝐶𝑖𝑡 is the marginal cost of the bank, and is estimated using the following translog cost function:
𝑙𝑛𝐶𝑖𝑡 = 𝛽0 + 𝛽1𝑙𝑛𝑄𝑖𝑡 +𝛽2
2𝑙𝑛𝑄𝑖𝑡
2 + ∑ 𝛾𝑘𝑙𝑛𝑊𝑘,𝑖𝑡
3
𝑘=1
+ ∑ 𝜑𝑘𝑙𝑛
3
𝑘=1
𝑄𝑖𝑡𝑙𝑛𝑊𝑘,𝑖𝑡
+ ∑ ∑ 𝑙𝑛𝑊𝑘,𝑖𝑡𝑙𝑛𝑊𝑗,𝑖𝑡
3
𝑗=1
3
𝑘=1
+ 𝜀𝑖𝑡 (5)
𝐶𝑖𝑡 is total operating costs (interest expenses, personnel and other administrative or operating
costs). 𝑄𝑖𝑡 is total output defined as total assets. 𝑊1,𝑖𝑡 is the input price of labor defined as wages
divided by total assets. 𝑊2,𝑖𝑡 is the input price of funds defined as interest expense to total
deposits. 𝑊3,𝑖𝑡 is the input price of fixed capital defined as non-interest expenses divided by total
assets.
To estimate the Lerner Index, we obtain banks’ financial data from the Bankscope
database and estimate Eq. (5) by country using all banks with available data for the year 2001.
For each country, we limit our estimations by only including bank holding companies,
commercial banks and cooperative banks, consistent with Beck, De Jonghe and Schepens (2012).
Using the estimated coefficients from Eq. (5), we calculate the marginal cost for each bank as:
𝑀𝐶𝑖𝑡 =𝐶𝑖𝑡
𝑄𝑖𝑡[�̂�1 + �̂�2𝑙𝑛𝑄𝑖𝑡 + ∑ �̂�𝑘
3
𝑘=1
𝑙𝑛𝑊𝑘,𝑖𝑡] (6)
The Lerner Index for each bank is then computed by inserting the bank-level measure of
marginal cost from Eq. (6) into Eq. (4).

18
To investigate whether the disciplining pressure of bank competition counteracts the
negative consequences of the control rights-cash flow rights wedge with respect to loan
provision smoothing, we partition the sample into two groups based on the value of Lerner Index.
As discussed earlier, lower levels of Lerner are indicative of higher competition. We therefore
classify observations with a Lerner Index lower than the sample median into “High Competition”
and classify those above the median into the “Low Competition” partition. We then estimate the
relation between smoothing and the control-cash flow rights wedge separately within each
partition. The descriptive statistics of Lerner Index are documented in Table 5. In Panel A, we
show that the mean (median) value of Lerner Index for the entire sample of 140 banks is 0.2902
(0.2790). Table 5 Panel B demonstrates the mean value of Lerner Index by country for the “High
Competition” and the “Low Competition” groups respectively. In the “High Competition” group,
the average Lerner Index ranges from -0.0893 (Ecuador) to 0.2749 (Chile) across countries.
Similarly, the mean value of Lerner Index varies between 0.2825 (Portugal) and 0.7633 (Jordan)
for the “Low Competition” group.
Results from regression estimations are shown in Table 6 and Table 7. For regression
estimations across partitions, we perform a Wald Test to test the hypothesis that the coefficients
across regressions are significantly different from each other.13
In Table 6, we find that our result
in Table 2 that banks smooth earnings via loan loss provisions holds in both the “High
Competition” (coefficient of 0.3294, p-value < 0.01) and the “Low Competition” partition
(coefficient of 0.1617, p-value < 0.01). The Chi-square statistics from the Wald Test is 4.28 (p-
value < 0.05), indicating that the coefficients on EBLLP are significantly different across
partitions.
13 See Section 6.4 in Greene (2012) for details.

19
However, in Table 7 Panel A, we find that our previous result from Table 4 Panel A that
smoothing increases with the wedge, only holds in the low competition partition. In contrast,
there is no relation between smoothing and the wedge in the high competition partition where
banks face significant disciplining pressure from the competitive environment. That is, Table 7
Panel A shows that the coefficient on the interaction between 𝑊𝐸𝐷𝐺𝐸 and 𝐸𝐵𝐿𝐿𝑃 for banks in
low competitive environments is significantly positive (coefficient of 0.9662, p-value < 0.05).
Conversely, the interaction between WEDGE and smoothing is not significant in high
competitive environments. Results from Wald Tests confirm that the coefficients on EBLLP
(Chi-square: 3.45, p-value < 0.1) and the interaction between WEDGE and EBLLP (Chi-square:
6.14, p-value < 0.01) are significantly different across groups.
A further breakdown of WEDGE into CF and CONTROL shows similar results as
documented in Table 7 Panel B. In Panel B of Table 7, our result from Table 4 Panel B that
smoothing increases with the CONTROL while decreases with CF only holds in the low
competition partition. Specifically, the coefficient on the interaction between 𝐶𝑂𝑁𝑇𝑅𝑂𝐿 and
𝐸𝐵𝐿𝐿𝑃 is significantly positive (coefficient of 1.0312, p-value < 0.05) and that on the interaction
between 𝐶𝐹 and 𝐸𝐵𝐿𝐿𝑃 is significantly negative (coefficient of -0.8717, p-value < 0.1) for banks
in low competitive environments. Results from Wald Tests confirm that the coefficients on
EBLLP (Chi-square: 6.09, p-value < 0.01), the interaction terms CF* EBLLP (Chi-square: 3.34,
p-value < 0.1) and CONTROL* EBLLP (Chi-square: 8.59, p-value < 0.01) are significantly
different across groups. Taken together, these results suggest that increased competitive
pressures faced by banks counteract the negative consequences of weak governance structures as
manifested in opportunistic accounting choices by banks.

20
4.3. Robustness Analysis
In this section, we describe a range of additional analyses that we perform to demonstrate
the robustness of our main results. First, recall that LL define controlling owners using a 10%
control rights cutoff. The implication is that the WEDGE variable in our study will only have a
non-zero value when a large owner exists who holds at least 10% of the control rights. As a
robustness check, we try an additional cutoff of 20% to compute WEDGE.14
This implies that the
WEDGE will be coded as zero for any bank without an owner holding 20% or more of the
control rights. Using this cutoff, we then re-estimate Eq. (2) for high competition and low
competition groups respectively. In unreported regressions, we find results similar to those
reported in Table 7 Panel A. Specifically, using 20% control rights cutoff, we document a
significantly positive coefficient of 0.8923 (p-value < 0.1) on the interaction between 𝑊𝐸𝐷𝐺𝐸
and 𝐸𝐵𝐿𝐿𝑃 for banks in the low competitive partition, while the coefficient on the interaction is
insignificant in the high competitive environments. Overall, the results are not affected by
different control rights cutoffs.
Next, we extend our Table 7 analysis by including a number of additional country-level
variables to control for cross-country differences in bank regulations. In terms of bank
regulations, we control for various country-level bank regulation schemes. Bank regulation
measures are from large sample survey data from the World Bank’s website.15
We include three
14 Similar results are found using a cutoff of 30% control rights. 15 See the following link for the large sample survey of Barth, Caprio and Levine (2001, 2004, 2006, 2008) on the
World Bank’s website:
http://econ.worldbank.org/WBSITE/EXTERNAL/EXTDEC/EXTRESEARCH/0,,contentMDK:20345037~pagePK:
64214825~piPK:64214943~theSitePK:469382,00.html The survey questions encompass regulation and supervision
regimes with respect to the following 12 aspects: 1) entry into banking, 2) ownership, 3) capital, 4) activities, 5)
external auditing requirements, 6) internal management/organizational requirements, 7) liquidity and diversification
requirements, 8) depositor (savings) protection schemes, 9) provisioning requirements, 10) accounting information
disclosure requirements, 11) discipline/problem institutions/exit, and 12) supervision. Indices for each of the 12
aspects are formed by certain aggregating rules based on the answers to survey questions. For detail methods in
constructing the indices, please refer to Barth, Caprio and Levine (2001, 2004, and 2008).

21
measures of bank regulations. Overall restrictions on bank activities (RESTRICT), which
measures restrictions for banks’ participation in securities activities, insurance activities and real
estate activities. Official supervision (OFFICIAL), measures the degree to which countries differ
in the power of the supervisory authorities to take corrective actions when confronted with
violations of regulations or other imprudent behavior on the part of banks.16
Private monitoring
(PRIVATE), measures the degree to which bank regulation promotes market or private
monitoring of banks.17
All results are robust to including these additional controls, despite
entailing significant sample size reductions.
In untabulated regression estimation of Eq. (2), we document a significantly positive
coefficient (1.5186, significant at 5% level) on the interaction between 𝑊𝐸𝐷𝐺𝐸 and 𝐸𝐵𝐿𝐿𝑃 for
banks in lower competitive environments after controlling for these additional country-level
regimes, while coefficient on this interaction term is not significant in the high competition
partition. We find similar results for the estimation of Eq. (3) by including these additional
controls. Specifically, untabulated results demonstrate that the coefficient on the interaction
between 𝐶𝑂𝑁𝑇𝑅𝑂𝐿 and 𝐸𝐵𝐿𝐿𝑃 is significantly positive (coefficient of 1.3565, p-value < 0.01)
and that on the interaction between 𝐶𝐹 and 𝐸𝐵𝐿𝐿𝑃 is significantly negative (coefficient of -
1.1971, p-value < 0.05) for banks in low competitive environments. Therefore, our conclusions
16 Major components of this measure include i) Prompt Corrective Action, i.e. government intervention to mandate
the elimination of any supervision power to postpone or delay corrective actions to be taken against progressively
deteriorating banks; ii) Restructuring Power, i.e. whether the supervisory authorities have the power to restructure
and reorganize a troubled bank; iii) Declaring Insolvency Power, i.e. whether the supervisory authorities have the
power to declare a deeply troubled bank insolvent. 17 Five major measures are constructed to capture private monitoring forces: i) Certified Audit Required, i.e. whether
an external audit is required of the financial statement of a bank, and if so, by a licensed or certified auditor; ii)
Percentage of Ten Biggest Banks Rated by International Rating Agencies; iii) Percentage of Ten Biggest Banks
Rated by Domestic Rating Agencies; iv) No Explicit Deposit Insurance Scheme; v) Bank Accounting, i.e. whether
income statement includes accrued though unpaid interest or principal on performing loans and nonperforming
loans, whether banks are required to produce consolidated financial statements, and whether bank directors are
legally liable if information disclosed is erroneous or misleading. Besides, other four measures are also included into
private monitoring, i.e. off-balance sheet items disclosure, risk management procedure disclosure, if subordinated
debt is allowed as a part of regulatory capital and if formal enforcement actions are made public.
22
do not change after controlling for country-level banking system concentration and bank
regulations.
As a final robustness test, we extend the Eq. (2) and the Eq. (3) specifications by also
interacting EBLLP with market-level institutions (i.e., RIGHT, DISCLOSE, JUDICIAL,
DEPOSIT, CORRUPT) and governance characteristics (i.e., MANAGER, OWNER_BOARD).
These results are reported in Table 8. For parsimony, Table 8 reports only the coefficients on the
interaction terms, although all main effects are included in the regression. From Panel A, we see
that all results are robust to inclusion of these additional interaction terms in the model. We
document a significantly positive coefficient (1.2089, significant at 1% level) on the interaction
between 𝑊𝐸𝐷𝐺𝐸 and 𝐸𝐵𝐿𝐿𝑃 for banks in lower competitive environments after controlling for
these additional country-level regimes, while coefficient on this interaction term is not
significant in the high competition partition. Similarly, Panel B of Table 8 shows consistent
results with Table 7 Panel B. That is, controlling shareholders’ incentives to smooth earnings
increases with their control rights in lower competitive environments as reflected in the positive
coefficient (0.4556, significant at 10% level) on the interaction between 𝐶𝑂𝑁𝑇𝑅𝑂𝐿 and 𝐸𝐵𝐿𝐿𝑃.
5. Summary and Conclusions
The ability of controlling owners to expropriate corporate resources represents a
fundamental agency problem. Incentives to expropriate private benefits depend on a controlling
shareholder’s skin-in-the-game as embedded in their holdings of cash-flow rights. Prior research
shows that firm value falls both for banks and non-financial firms when the voting rights of
controlling shareholders exceed their cash-flow rights. Controlling shareholders also have

23
incentives to conceal expropriation activities from outsiders by opportunistically managing the
firm’s accounting numbers.
Utilizing a sample of 174 banks from 37 countries, we investigate whether earnings
management in the form of loan loss provision smoothing increases as the wedge between
control rights and cash-flow rights increases. Our main objective is to investigate the extent to
which bank competition reduces agency costs. We test the hypothesis that disciplining pressure
exerted on banks by intense bank competition counteracts negative consequences of the control
rights-cash flow rights wedge, reducing incentives of controlling shareholders to engage in
earnings smoothing.
We find that the extent of loan provision smoothing by banks is increasing in the
magnitude of the wedge, thus extending Caprio, Laeven and Levine (2007) by showing that
increasing private benefits of control are accompanied by increased smoothing, presumably to
conceal expropriation activities. We also find that the impact of the wedge on earnings
smoothing significantly decreases as bank competition, measured using the Lerner index,
increases. Finally, we document the consequences of earnings smoothing by showing that banks
engaging in more earnings smoothing have lower market value and encounter future default
events. We contribute to the literature by showing the powerful role that competition plays in
counteracting the negative consequences of weak governance structures as manifested in banks’
opportunistic earnings management choices.

24
Reference
Ahmed A., Takeda C., Thomas S., 1999. Bank Loan Loss Provisions: A Reexamination of
Capital Management, Earnings Management and Signaling Effects. Journal of Accounting and
Economics 28, 1-25.
Allen, F., Gale, D., 2004. Competition and Financial Stability. Journal of Money, Credit, and
Banking 36:3 Pt.2, 433-80.
Barth J., Caprio G., Levine R., 2008. Bank Regulations are Changing: for Better or Worse?
Comparative Economic Studies 50, 537-563.
Barth J., Caprio G., Levine R., 2006. Rethinking Bank Regulation. Cambridge University Press.
Barth J., Caprio G., Levine R., 2004. Bank Regulation and Supervision: What Works Best?
Journal of Financial Intermediation 13, 205-248.
Barth J., Caprio G., Levine R., 2001. The Regulation and Supervision of Banks around the
World: A New Database. Brookings-Wharton Papers on Financial Services 183-240.
Beatty A., Chamberlain S., Mogliolo J., 1995. Managing Financial Reports of Commercial
Banks: The Influence of Taxes, Regulatory Capital, and Earnings. Journal of Accounting
Research 33, 231-261.
Bebchuk, L., Kraakman, R., Triantis, G., 2000. Stock Pyramids, Cross-Ownership, and Dual
Class Equity: The Mechanisms and Agency Costs of Separating Control from Cash-Flow Rights,
Concentrated Corporate Ownership. Published in Concentrated corporate ownership: University
of Chicago Press, ISBN 0226536785, 295-315.
Beck T., De Jonghe O., Schepens G., 2013. Bank competition and stability: Cross-country
heterogeneity. Journal of Financial Intermediation 22, 218-244.
Beck, T., 2008. Bank Competition and Financial Stability: Friends or Foes? World Bank Policy
Research Working Paper 4656, June.
Berger A., Demirguc-Kunt A., Levine R., Haubrich J., 2004. Bank Concentration and
Competition: An Evolution in the Making. Journal of Money, Credit and Banking 36, 433-453.
Berle, A., Means, G., 1932. The Modern Corporation and Private Property: Transaction
Publishers.
Bikker, J.A., Metzemakers, P.A.J., 2005. Bank provisioning behaviour and procyclicality.
Journal of International Financial Markets, Institutions and Money 15 (2), 141-157.
Breusch, T.S., Pagan, A.R., 1979. A simple test for heteroscedasticity and random coefficient
variation. Econometrica 47, 1287-1294.

25
Boyd, J.H., De Nicolo, G., 2005. The Theory of Bank Risk-Taking and Competition Revisited.
Journal of Finance 60, 1329-1343.
Bushman R., Hendricks B., Williams C., 2016. Bank Competition: Measurement, Decision-
Making and Risk-Taking. Journal of Accounting Research. Volume 54, Issue 3, pages 777–826.
Bushman R., Williams C., 2012. Accounting discretion, loan loss provisioning, and discipline of
Banks' risk-taking. Journal of Accounting and Economics 54, 1-18.
Bushman, R., Williams, C., 2015. Delayed Expected Loss Recognition and the Risk Profile of
Banks” with Christopher Williams, Journal of Accounting Research Volume 53, Issue 3, 511–
553.
Caprio G., Laeven L., Levine R., 2007. Governance and Bank Valuation. Journal of Financial
Intermediation 16, 584-617.
Claessens, S., 2009. Competition in the Financial Sector: Overview of Competition Policies. The
World Bank Research Observer 24, 83-118.
Claessens, S., Djankov, S., Fan, J., Lang, L., 2002. Disentangling the Incentive and
Entrenchment Effects of Large Shareholdings. Journal of Finance LVII, No. 6, 2741-2771.
Collins J., Shackelford D., Whalen J., 1995. Bank Differences in the Coordination of Regulatory
Capital, Earnings and Taxes. Journal of Accounting and Economics 33, 263-291.
Committee of European Banking Supervisors. 2010. “High Level Principles for Risk
Management.” London: European Banking Authority
Dechow, P., Ge, W., Schrand, C., 2010. Understanding earnings quality: A review of the proxies,
their determinants and their consequences. Journal of Accounting and Economics 50, 344-401.
Dechow, P., Skinner, D., 2000. Earnings Management: Reconciling the Views of Accounting
Academics, Practitioners, and Regulators. Accounting Horizons 14, No. 2, 235-250.
Djankov S., La Porta R., Lopez-de-Silanes F., Shleifer A., 2008. The Law and Economics of
Self-Dealing. Journal of Financial Economics 88, 430-465.
Fama, E., 1980. Agency Problems and the Theory of the Firm The Journal of Political Economy,
Vol. 88, No. 2, 288-307.
Fan, J., Wong, T.J., 2002. Corporate ownership structure and the informativeness of accounting
earnings in East Asia. Journal of Accounting and Economics 33, 401-425.
Fonseca A., Gonzalez F., 2008. Cross-Country Determinants of Bank Income Smoothing by
Managing Loan-Loss Provisions. Journal of Banking and Finance 32, 217-228.

26
Francis J., Olsson P., Schipper K., 2006. Earnings Quality. Foundations and Trends in
Accounting 1, 259-340.
Gebhardt, G., Novotny-Farkas, Z., 2011. Mandatory IFRS Adoption and Accounting Quality of
European Banks. Journal of Business Finance & Accounting 38, 289-333.
Giroud, X., Mueller, H., 2010. Does corporate governance matter in competitive industries?
Journal of Financial Economics 95, 312-331.
Greene, W.H., 2012. Econometric analysis, 7th ed. Boston; London: Pearson.
Greenwald, M., Sinkey, J., 1988. Bank Loan-Loss Provisions and the Income-Smoothing
Hypothesis: An Empirical Analysis, 1976-1984. Journal of Financial Services Research 1, 301-
318.
Grossman, S., Hart, O., 1988. One Share-One Vote and the Market for Corporate Control.
Journal of Financial Economics 20, 175-202.
Harris, M., Raviv, A., 1988. Corporate governance: Voting rights and majority rules. Journal of
Financial Economics 20, 203-235.
Healy, P., Wahlen, J., 1999. A Review of the Earnings Management Literature and Its
Implications for Standard Setting. Accounting Horizons 13, 365-383.
Jagannathan, R., Srinivasan, S., 1999. Does product market competition reduce agency costs?
The North American Journal of Economics and Finance 10 (2), 387-399.
Jensen M., Meckling W., 1976. Theory of the Firm: Managerial Behavior, Agency Costs and
Ownership Structure. Journal of Financial Economics 3, 305-360.
Koch T., Wall L., 2000. Bank Loan-Loss Accounting: A Review of Theoretical and Empirical
Evidence. Economic Review 85, 1-19.
La Porta R., Lopez-de-Silanes F., Shleifer A., 2006. What Works in Securities Laws? Journal of
Finance LXI (1), 1-32.
La Porta R., Lopez-de-Silanes F., Shleifer A., Vishny R., 1998. Law and Finance. Journal of
Political Economy 106, 1113-1155.
Laeven L., Levine R., 2009. Bank Governance, Regulation and Risk Taking. Journal of Financial
Economics 93, 259-275.
Laeven L., Majnoni G., 2003. Loan Loss Provisioning and Economic Slowdowns: Too Much,
Too Late? Journal of Financial Intermediation 12, 178-197.

27
Leuz, C., Nanda, D., Wysocki, P., 2003. Earnings Management and Investor Protection: An
International Comparison. Journal of Accounting and Economics 69, 505-527.
Liu C., Ryan S., 2006. Income Smoothing over the Business Cycle: Changes in Banks'
Coordinated Management of Provisions for Loan Losses and Loan Charge-offs from the Pre-
1990 Bust to the 1990s Boom. The Accounting Review 81 (2), 421-441.
Mehran, H., A. Morrison, and J. Shapiro. 2011. Corporate Governance and Banks: What Have
We Learned from the Financial Crisis? Federal Reserve Bank of New York Staff Reports no. 502.
Perez, D., Salas-Fumas, V., Saurina, J., 2008. Earnings and Capital Management in Alternative
Loan Loss Provision Regulatory Regimes. European Accounting Review 17 (3), 423-445.
Scherer, F.M., 1980. Industrial market structure and economic performance: Rand McNally
College Pub. Co..
Senior Supervisors Group. 2008. “Observation on Risk Management Practices during the Recent
Market Turbulence.” March 6.
http://www.newyorkfed.org/newsevents/news/banking/2008/SSG_Risk_Mgt_doc_final.pdf .
Senior Supervisors Group. 2009. “Risk Management Lessons from the Global Banking Crisis of
2008.”October 21. http://www.newyorkfed.org/newsevents/news/banking/2009/SSG_report.pdf
Shleifer, A., Vishny, R., 1997. A Survey of Corporate Governance. Journal of Finance LII, No. 2,
737-783.
Walker, S. D. 2009. “A Review of Corporate Governance in UK Banks and other Financial
Industry Entities.” London: HM Treasury,
http://www.hm-treasury.gov.uk/d/walker_review_consultation_160709.pdf.
Zingales, L., 1994. The Value of the Voting Right: A Study of the Milan Stock Exchange
Experience. Review of Financial Studies 7 (1), 125-148.

28
Appendix: Definition of Variables
Variable Name Definition Sources/Reference
Bank-level Variables:
LLP The reported loan loss provisions on the income
statement at the end of the period scaled by average
loans during the year.
Laeven and Levine
(2009)
EBLLP Earnings before taxes and loan loss provisions scaled
by average loans during the year.
Laeven and Levine
(2009)
WEDGE The difference between control rights and cash flow
rights of banks’ ultimate controllers, calculated as
total percentage of cash flow rights deducted from
total percentage of control rights.
Laeven and Levine
(2009)
CF The cash flow rights of the large owner of the bank. Laeven and Levine
(2009)
CONTROL The control rights held by the large owner of the
bank.
Laeven and Levine
(2009)
ZSCORE The return on assets plus the capital asset ratio
divided by the standard deviation of asset returns.
ZSCORE measures the distance from insolvency.
Laeven and Levine
(2009)
SIZE Natural logarithm of the average of total assets during
the year.
Laeven and Levine
(2009)
CAR Book value of equity divided by total assets. Laeven and Levine
(2009)
LoanGrowth The percentage change in total loans for the year. Laeven and Levine
(2009)
LERNER The Lerner Index attempts to capture the extent to
which banks can increase the marginal price beyond
the marginal cost, and is calculated as follows:
𝐿𝑒𝑟𝑛𝑒𝑟𝑖𝑡 =𝑃𝑖𝑡 − 𝑀𝐶𝑖𝑡
𝑃𝑖𝑡
𝑃𝑖𝑡 is the operating income (interest revenue plus non-
interest revenue) to total assets. 𝑀𝐶𝑖𝑡 is the marginal
cost of the bank and is estimated using the following
translog cost function:
Beck, De Jonghe
and Schepens
(2012)

29
Variable Name Definition Sources/Reference
𝑙𝑛𝐶𝑖𝑡 = 𝛽0 + 𝛽1𝑙𝑛𝑄𝑖𝑡 +𝛽2
2𝑙𝑛𝑄𝑖𝑡
2 + ∑ 𝛾𝑘𝑡𝑙𝑛𝑊𝑘,𝑖𝑡
3
𝑘=1
+ ∑ 𝜑𝑘𝑙𝑛
3
𝑘=1
𝑄𝑖𝑡𝑙𝑛𝑊𝑘,𝑖𝑡
+ ∑ ∑ 𝑙𝑛𝑊𝑘,𝑖𝑡𝑙𝑛𝑊𝑗,𝑖𝑡
3
𝑗=1
3
𝑘=1
+ 𝜀𝑖𝑡
𝐶𝑖𝑡 is total costs (interest operating expense plus non-
interest operating expenses). 𝑄𝑖𝑡 is total output
defined as total assets. 𝑊1,𝑖𝑡 is the input price of labor
defined as wages divided by total assets. 𝑊2,𝑖𝑡 is the
input price of funds defined as interest expense to
total deposits. 𝑊3,𝑖𝑡 is the input price of fixed capital
defined as non-interest expenses divided by total
assets. After estimating the cost function above,
marginal cost of the bank is computed as:
𝑀𝐶𝑖𝑡 =𝐶𝑖𝑡
𝑄𝑖𝑡[�̂�1 + �̂�2𝑙𝑛𝑄𝑖𝑡 + ∑ �̂�𝑘
3
𝑘=1
𝑙𝑛𝑊𝑘,𝑖𝑡]
MANAGER_CF Total cash flow rights held by senior management of
the bank.
Laeven and Levine
(2009)
OWNER_BOARD An indicator equal to “1” if a large shareholder has a
seat on the management board of the bank, and “0”
otherwise.
Laeven and Levine
(2009)
Q Tobin’s Q, the ratio of the market value of equity plus
the book value of liabilities to the book value of
assets.
Laeven and Levine
(2009)
Bank_Smoothing A bank-level earnings smoothing measure estimated
as the coefficient 𝛽1 from the following bank-level
regression: 𝐿𝐿𝑃𝑡 = 𝛼 + 𝛽1𝐸𝐵𝐿𝐿𝑃𝑡 + 𝐶𝑜𝑛𝑡𝑟𝑜𝑙 + 𝜀𝑡 ,
where LLP is loan loss provisions on the income
statement at the end of the period scaled by average
loans during the year and EBLLP is earnings before
taxes and loan loss provisions scaled by average loans
during the year. We also control for changes in non-
performing loans, loan growth, Tier 1 capital ratio and
total assets.
Bankscope,
Laeven and Levine
(2009)
ASSET Total assets of the bank in millions of US dollars. Laeven and Levine
(2009)

30
Variable Name Definition Sources/Reference
LLP_ RATIO The ratio of bank’s loan loss provisions to net interest
income.
Laeven and Levine
(2009)
DEFAULT An indicator equal to “1” if a future default event
occurs and “0” otherwise. The default events recognized
are classified under one of the following events: (1)
bankruptcy filing, receivership, liquidation or any other
legal impasse to the timely settlement of interest and/or
principal payments; (2) a missed or delayed payment of
interest and/or principal, excluding delayed payments
made within a grace period; (3) debt restructuring or
distressed exchange, in which debt holders are offered a
new security or package of securities that result in a
diminished financial obligation (e.g., a conversion of debt
to equity, debt with lower coupon or par amount, debt with
lower seniority, debt with longer maturity).
Credit Research
Initiative System
Country-level Variables:
RIGHT The Anti-self-dealing Index measures ex ante and ex
post control of self-dealing through private
enforcement for minority shareholder protection at the
country level. The index is calculated based on
answers to a questionnaire distributed to attorneys
from Lex Mundi law firms. The lawyers received a
case study regarding the transaction between two
companies (“Buyer” and “Seller”) and were asked to
describe the minimum legal requirements in force
with respect to: (1) who approves the transaction; (2)
what needs to be disclosed to the board of directors or
supervisory board, the shareholders, the stock
exchange and the regulators; (3) the duties of officers,
directors, and controlling shareholders; (4) how the
transaction’s validity could be challenged; (5) what
causes of legal action are available if Buyer suffers
damages; (6) what needs to be proved under each
cause of legal action; (7) who has standing to sue
under each cause of legal action; (8) the availability
of director and derivative suits; (9) access to
information and discovery rights; and (10) fines and
criminal sanctions. The index has a scale of 0 to 1,
with higher scores indicating higher level of anti-self-
dealing controls.
Djankov, La Porta,
Lopez-de-Silanes
and Shleifer (2008)
DISCLOSE A measure of disclosure created from components of La Porta, Lopez-

31
Variable Name Definition Sources/Reference
the general securities law disclosure requirements.
The index of disclosure requirement is computed
based on the answers provided by one attorney from
each country to the questionnaire describing the
securities laws applicable to an offering of shares
listed in the country’s largest stock exchange.
Specifically, the index includes disclosures of: (1)
prospectus to potential investors before listing; (2)
compensation of the issuer’s directors and key
officers; (3) the issuer’s equity ownership structure;
(4) the equity ownership of the issuer’s shares by its
directors and key officers; (5) the issuer’s contracts
outside the ordinary course of business; and (6)
transactions between the issuer and its directors,
officers, and/or large shareholders. The index has a
scale of 0 to 1, with higher scores indicating higher
disclosure requirements.
de-Silanes, and
Shleifer (2006)
JUDICIAL Judicial efficiency is the assessment of the “efficiency
and integrity of the legal environment as it affects
business, particularly foreign firms” produced by the
country-risk rating agency Business International
Corporation. It “may be taken to represent investors’
assessments of conditions in the country in question.”
Average between 1980 and 1993. The index has a
scale of 0 to 10, with lower scores equal to lower
efficiency levels.
La Porta, Lopez-
de- Silanes,
Shleifer and
Vishny (1998)
LGDP The natural logarithm of GDP. Laeven and Levine
(2009)
∆GDP The percentage change in GDP. Laeven and Levine
(2009)
DEPOSIT An indicator equal to “1” if the country has explicit
deposit insurance and “0” otherwise.
Laeven and Levine
(2009)
CORRUPTION Country-level official corruption. Laeven and Levine
(2009)

32
Table 1 Sample Distribution and Descriptive Statistics
Panel A. Number of Observations by Country
ARGENTINA 1
AUSTRALIA 9
AUSTRIA 1
BRAZIL 5
CANADA 2
CHILE 4
COLOMBIA 4
DENMARK 9
ECUADOR 3
EGYPT 6
FINLAND 1
FRANCE 6
GERMANY 4
GREECE 4
HONG KONG 6
INDIA 1
INDONESIA 6
IRELAND 5
ISRAEL 7
ITALY 9
JAPAN 5
JORDAN 7
KENYA 4
MALAYSIA 5
MEXICO 1
NIGERIA 6
NORWAY 8
PAKISTAN 6
PERU 3
PORTUGAL 6
SINGAPORE 2
SPAIN 10
SWEDEN 3
THAILAND 4
USA 9
VENEZUELA 1
ZIMBABWE 1
Total 174

33
Table 1 Sample Distribution and Descriptive Statistics
Panel B. Descriptive Statistics
Variable N Mean Median Std. Dev.
LLP 174 0.0125 0.0078 0.0153
EBLLP 174 0.0394 0.0276 0.0412
SIZE 174 16.1663 16.1272 2.1635
CAR 174 0.0755 0.0678 0.0529
ZSCORE 174 23.2023 20.3760 15.5540
LoanGrowth 174 0.0519 0.0484 0.1490
MANAGER_CF 174 0.0528 0.0000 0.1265
OWNER_BOARD 174 0.3276 0.0000 0.4707
RIGHT 174 0.4885 0.4333 0.2218
DISCLOSE 174 0.6183 0.5833 0.2065
JUDICIAL 174 7.8096 8.0000 2.0865
LGDP 174 8.9407 9.5997 1.4815
∆GDP 174 0.0100 0.0113 0.0182
DEPOSIT 174 0.7931 1.0000 0.4062
CORRUPT 174 7.1207 7.0000 1.0326
LLP is loan loss provisions on the income statement at the end of the period scaled by average loans during the year.
EBLLP is earnings before taxes and loan loss provisions scaled by average loans during the year. SIZE is the natural
logarithm of the average of total assets during the year. CAR is book value of equity divided by total assets.
ZSCORE is return on assets plus the capital asset ratio divided by the standard deviation of asset returns.
LoanGrowth is the percentage change in total loans for the year. MANAGER_CF is total cash flow rights held by
senior management of the bank. OWNER_BOARD is an indicator equal to “1” if a large shareholder has a seat on
the management board of the bank, and “0” otherwise. RIGHT is the country-level anti-self-dealing index capturing
ex ante and ex post control of self-dealing through private enforcement for minority shareholder protection.
DISCLOSE is a country-level measure of disclosure created from components of the general securities law
disclosure requirements. JUDICIAL is the country-level judicial efficiency index, the assessment of the efficiency
and integrity of the legal environment as it affects business, particularly foreign firms. LGDP is the natural
logarithm of GDP. ∆GDP is the percentage change in GDP. DEPOSIT is an indicator equal to “1” if the country has
explicit deposit insurance and “0” otherwise. CORRUPT is the Country-level official corruption. Detail definitions
of variables are included in the Appendix.

34
Table 2 Ownership Structure and Earnings Smoothing
Coefficient Std. Error
Intercept 0.0003 0.0128
EBLLP 0.1799 0.0220 ***
WEDGE 0.0049 0.0055
SIZE 0.0009 0.0007
CAR 0.0623 0.0503
ZSCORE -0.0001 0.0001
LoanGrowth -0.0060 0.0067
MANAGER_CF -0.0019 0.0052
OWNER_BOARD 0.0014 0.0024
RIGHT -0.0037 0.0044
DISCLOSE -0.0074 0.0055
JUDICIAL 0.0009 0.0007
LGDP -0.0021 0.0011 **
∆GDP -0.0758 0.0383 **
DEPOSIT 0.0024 0.0022
CORRUPT 0.0005 0.0009
No. of observation 174
Adj. R-square 0.4793
Fixed Effect Bank type
The dependent variable, LLP, is loan loss provisions on the income statement at the end of the period scaled by
average loans during the year. EBLLP is earnings before taxes and loan loss provisions scaled by average loans
during the year. WEDGE is the difference between control rights and cash flow rights of banks’ ultimate controllers.
Detail definitions of variables are included in the Appendix. Significance levels of coefficient estimates are based on
standard errors adjusted for clustering at the country level. *, **, *** significant at 10%, 5%, 1% level respectively
based on a two-tailed test.

35
Table 3 Description of Ownership Structure by Country
Country Name No. of Banks Mean of WEDGE Mean of CF Mean of CONTROL
ARGENTINA 1 0.4700 0.4700 0.9400
AUSTRALIA 9 0.0000 0.0111 0.0111
AUSTRIA 1 0.0000 0.3600 0.3600
BRAZIL 5 0.5740 0.2300 0.8040
CANADA 2 0.0000 0.0000 0.0000
CHILE 4 0.2900 0.2400 0.5300
COLOMBIA 4 0.0325 0.3175 0.3500
DENMARK 9 0.0311 0.1711 0.2022
ECUADOR 3 0.0000 0.5000 0.5000
EGYPT 6 0.0650 0.2050 0.2700
FINLAND 1 0.0000 0.5700 0.5700
FRANCE 6 0.0000 0.4033 0.4033
GERMANY 4 0.0249 0.4001 0.4250
GREECE 4 0.0000 0.2225 0.2225
HONG KONG 6 0.1283 0.3950 0.5233
INDIA 1 0.3600 0.3100 0.6700
INDONESIA 6 0.0000 0.7133 0.7133
IRELAND 5 0.0000 0.0000 0.0000
ISRAEL 7 0.0000 0.4100 0.4100
ITALY 9 0.0111 0.1444 0.1556
JAPAN 5 0.0000 0.1120 0.1120
JORDAN 7 0.0229 0.2300 0.2529
KENYA 4 0.0000 0.1800 0.1800
MALAYSIA 5 0.0840 0.3060 0.3900
MEXICO 1 0.0200 0.5800 0.6000
NIGERIA 6 0.0000 0.1200 0.1200
NORWAY 8 0.0000 0.0600 0.0600
PAKISTAN 6 0.0283 0.4933 0.5217
PERU 3 0.0633 0.5500 0.6133
PORTUGAL 6 0.2583 0.1767 0.4350
SINGAPORE 2 0.0000 0.2700 0.2700
SPAIN 10 0.1370 0.1790 0.3160
SWEDEN 3 0.0900 0.0867 0.1767
THAILAND 4 0.0000 0.3950 0.3950
USA 9 0.0000 0.0000 0.0000
VENEZUELA 1 0.0000 0.3800 0.3800
ZIMBABWE 1 0.2000 0.0600 0.2600
Mean of Sample 0.0781 0.2771 0.3552

36
Table 4 Impact of Ownership Structure on Earnings Smoothing
Panel A. Effects of Wedge
Coefficient Std. Error
Intercept 0.0042 0.0144
EBLLP 0.1618 0.0227 ***
WEDGE -0.0086 0.0056
WEDGE*EBLLP 0.3421 0.1033 ***
SIZE 0.0007 0.0007
CAR 0.0599 0.0512
ZSCORE -0.0001 0.0001
LoanGrowth -0.0062 0.0066
MANAGER_CF -0.0037 0.0055
OWNER_BOARD 0.0011 0.0025
RIGHT -0.0033 0.0042
DISCLOSE -0.0054 0.0057
JUDICIAL 0.0009 0.0008
LGDP -0.0022 0.0011 **
∆GDP -0.0565 0.0350
DEPOSIT 0.0030 0.0023
CORRUPT 0.0002 0.0008
No. of observation 174
Adj. R-square 0.4897
Fixed Effect Bank type
The dependent variable, LLP, is loan loss provisions on the income statement at the end of the period scaled by
average loans during the year. EBLLP is earnings before taxes and loan loss provisions scaled by average loans
during the year. WEDGE is the difference between control rights and cash flow rights of banks’ ultimate controllers.
Detail definitions of variables are included in the Appendix. Significance levels of coefficient estimates are based on
standard errors adjusted for clustering at the country level. *, **, *** significant at 10%, 5%, 1% level respectively
based on a two-tailed test.

37
Table 4 Impact of Ownership Structure on Earnings Smoothing
Panel B. Effects of Cash Flow Rights and Control Rights
Coefficient Std. Error
Intercept 0.0086 0.0167
EBLLP 0.1828 0.0673 ***
CF 0.0031 0.0064
CF*EBLLP -0.3326 0.0971 ***
CONTROL -0.0089 0.0057
CONTROL*EBLLP 0.2878 0.1448 **
SIZE 0.0006 0.0007
CAR 0.0493 0.0492
ZSCORE -0.0001 0.0001
LoanGrowth -0.0067 0.0067
MANAGER_CF -0.0023 0.0057
OWNER_BOARD 0.0024 0.0028
RIGHT -0.0017 0.0040
DISCLOSE -0.0086 0.0061
JUDICIAL 0.0007 0.0009
LGDP -0.0019 0.0015
∆GDP -0.0902 0.0347 ***
DEPOSIT 0.0033 0.0025
CORRUPT 0.0002 0.0009
No. of observation 174
Adj. R-square 0.5000
Fixed Effect Bank type
The dependent variable, LLP, is loan loss provisions on the income statement at the end of the period scaled by
average loans during the year. EBLLP is earnings before taxes and loan loss provisions scaled by average loans
during the year. CF is the cash flow rights of the large owner of the bank. CONTROL is the control rights held by
the large owner of the bank. Detail definitions of variables are included in the Appendix. Significance levels of
coefficient estimates are based on standard errors adjusted for clustering at the country level. *, **, *** significant at
10%, 5%, 1% level respectively based on a two-tailed test.

38
Table 5 Description of Bank Competition
Panel A. Statistical Descriptive of Lerner Index
N Mean Std. Dev. 1st Quartile Median 3
rd Quartile
140 0.2902 0.2167 0.1825 0.2790 0.4123
Panel B. Lerner Index by Country
High Competition
Low Competition
Country No. of Banks Mean
Country No. of Banks Mean
AUSTRALIA 2 0.2386
ARGENTINA 1 0.3322
BRAZIL 5 0.1118
AUSTRALIA 7 0.3917
CANADA 1 0.2573
CANADA 1 0.4574
CHILE 2 0.2749
CHILE 2 0.3905
COLOMBIA 2 -0.1022
COLOMBIA 2 0.4227
ECUADOR 2 -0.0893
ECUADOR 1 0.2968
GERMANY 4 0.0761
FINLAND 1 0.4924
GREECE 3 0.2578
GREECE 1 0.3124
INDIA 1 0.2615
HONG KONG 6 0.4191
INDONESIA 3 0.0167
INDONESIA 3 0.4816
IRELAND 1 0.0259
IRELAND 4 0.4541
ITALY 8 0.1157
ISRAEL 7 0.4244
KENYA 2 0.1536
ITALY 1 0.3239
MALAYSIA 3 0.1624
JORDAN 7 0.7633
NORWAY 4 0.2371
KENYA 1 0.4357
PERU 3 -0.0906
MALAYSIA 2 0.3683
PORTUGAL 5 0.1755
NIGERIA 5 0.3948
SPAIN 6 0.2264
NORWAY 4 0.3338
SWEDEN 1 0.1918
PAKISTAN 5 0.6033
THAILAND 4 0.0141
PORTUGAL 1 0.2825
USA 7 0.1977
SPAIN 4 0.3568
VENEZUELA 1 0.0919
SWEDEN 2 0.4229
USA 2 0.3332

39
Table 6 Earnings Smoothing and Bank Competition
High Competition
Low Competition
Coefficient Std. Error
Coefficient Std. Error
Intercept -0.0357 0.0243 -0.0169 0.0176
EBLLP 0.3294 0.0782 *** 0.1617 0.0481 ***
WEDGE -0.0038 0.0058 0.0073 0.0079
SIZE 0.0006 0.0012 0.0011 0.0006 *
CAR 0.1608 0.0553 *** 0.0119 0.0127
ZSCORE 0.0000 0.0001 0.0000 0.0001
LoanGrowth 0.0040 0.0111 0.0006 0.0099
MANAGER_CF -0.0420 0.0188 ** 0.0074 0.0072
OWNER_BOARD 0.0064 0.0052 0.0017 0.0019
RIGHT 0.0286 0.0197 -0.0135 0.0063 **
DISCLOSE -0.0273 0.0146 * 0.0061 0.0069
JUDICIAL -0.0011 0.0013 0.0018 0.0007 ***
LGDP 0.0025 0.0028 -0.0002 0.0016
∆GDP -0.1974 0.0900 ** -0.0107 0.0609
DEPOSIT 0.0052 0.0058 0.0027 0.0028
CORRUPT 0.0002 0.0018 -0.0020 0.0015
No. of observation 70 70
Adj. R-square 0.7089 0.6719
Fixed Effect Bank type
Bank type
Wald Test Chi-square:
EBLLP 4.28**
The dependent variable, LLP, is loan loss provisions on the income statement at the end of the period scaled by
average loans during the year. EBLLP is earnings before taxes and loan loss provisions scaled by average loans
during the year. WEDGE is the difference between control rights and cash flow rights of banks’ ultimate controllers.
Detail definitions of variables are included in the Appendix. Competition is measured as the bank-level Lerner Index.
Significance levels of coefficient estimates are based on standard errors adjusted for clustering at the country level.
Wald Tests are performed to test the coefficients across regressions and Chi-square statistics are reported. *, **, ***
significant at 10%, 5%, 1% level respectively based on a two-tailed test.

40
Table 7 Ownership Structure, Earnings Smoothing and Bank Competition
Panel A. Effects of Wedge
High Competition
Low Competition
Coefficient Std. Error
Coefficient Std. Error
Intercept -0.0357 0.0240 -0.0156 0.0172
EBLLP 0.3401 0.1019 *** 0.1536 0.0502 ***
WEDGE -0.0012 0.0067 -0.0301 0.0183
WEDGE*EBLLP -0.0681 0.1748 0.9662 0.4284 **
SIZE 0.0006 0.0011 0.0011 0.0006 *
CAR 0.1595 0.0564 *** 0.0125 0.0129
ZSCORE 0.0000 0.0001 0.0000 0.0001
LoanGrowth 0.0037 0.0113 -0.0008 0.0100
MANAGER_CF -0.0407 0.0172 ** 0.0066 0.0076
OWNER_BOARD 0.0065 0.0054 0.0019 0.0021
RIGHT 0.0279 0.0196 -0.0118 0.0062 *
DISCLOSE -0.0269 0.0143 * 0.0079 0.0070
JUDICIAL -0.0011 0.0013 0.0020 0.0007 ***
LGDP 0.0025 0.0028 -0.0002 0.0016
∆GDP -0.2034 0.0928 ** 0.0302 0.0515
DEPOSIT 0.0049 0.0057 0.0030 0.0027
CORRUPT 0.0001 0.0018 -0.0026 0.0014 *
No. of observation 70 70
Adj. R-square 0.7092 0.6864
Fixed Effect Bank type
Bank type
Wald Test Chi-square:
EBLLP 3.45*
WEDGE*EBLLP 6.14***
The dependent variable, LLP, is loan loss provisions on the income statement at the end of the period scaled by
average loans during the year. EBLLP is earnings before taxes and loan loss provisions scaled by average loans
during the year. WEDGE is the difference between control rights and cash flow rights of banks’ ultimate controllers.
Detail definitions of variables are included in the Appendix. Competition is measured as the bank-level Lerner Index.
Significance levels of coefficient estimates are based on standard errors adjusted for clustering at the country level.
Wald Tests are performed to test the coefficients across regressions and Chi-square statistics are reported. *, **, ***
significant at 10%, 5%, 1% level respectively based on a two-tailed test.
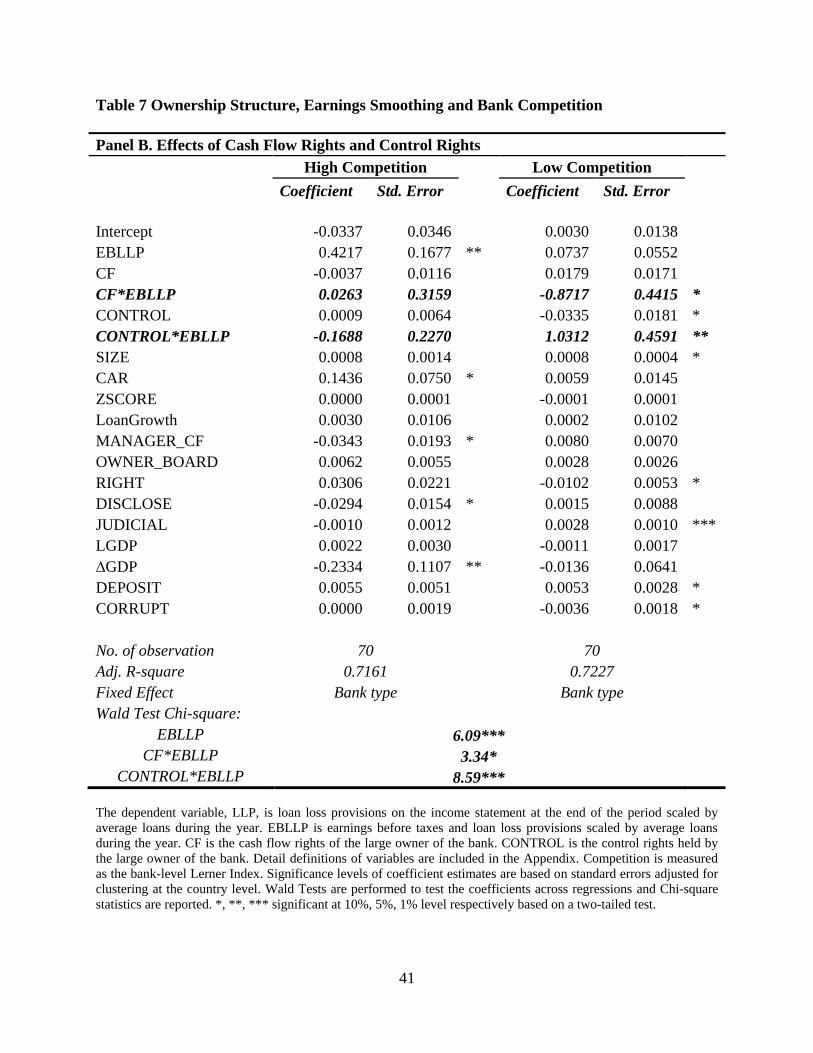
41
Table 7 Ownership Structure, Earnings Smoothing and Bank Competition
Panel B. Effects of Cash Flow Rights and Control Rights
High Competition
Low Competition
Coefficient Std. Error
Coefficient Std. Error
Intercept -0.0337 0.0346 0.0030 0.0138
EBLLP 0.4217 0.1677 ** 0.0737 0.0552
CF -0.0037 0.0116 0.0179 0.0171
CF*EBLLP 0.0263 0.3159 -0.8717 0.4415 *
CONTROL 0.0009 0.0064 -0.0335 0.0181 *
CONTROL*EBLLP -0.1688 0.2270 1.0312 0.4591 **
SIZE 0.0008 0.0014 0.0008 0.0004 *
CAR 0.1436 0.0750 * 0.0059 0.0145
ZSCORE 0.0000 0.0001 -0.0001 0.0001
LoanGrowth 0.0030 0.0106 0.0002 0.0102
MANAGER_CF -0.0343 0.0193 * 0.0080 0.0070
OWNER_BOARD 0.0062 0.0055 0.0028 0.0026
RIGHT 0.0306 0.0221 -0.0102 0.0053 *
DISCLOSE -0.0294 0.0154 * 0.0015 0.0088
JUDICIAL -0.0010 0.0012 0.0028 0.0010 ***
LGDP 0.0022 0.0030 -0.0011 0.0017
∆GDP -0.2334 0.1107 ** -0.0136 0.0641
DEPOSIT 0.0055 0.0051 0.0053 0.0028 *
CORRUPT 0.0000 0.0019 -0.0036 0.0018 *
No. of observation 70 70
Adj. R-square 0.7161 0.7227
Fixed Effect Bank type
Bank type
Wald Test Chi-square:
EBLLP 6.09***
CF*EBLLP 3.34*
CONTROL*EBLLP 8.59***
The dependent variable, LLP, is loan loss provisions on the income statement at the end of the period scaled by
average loans during the year. EBLLP is earnings before taxes and loan loss provisions scaled by average loans
during the year. CF is the cash flow rights of the large owner of the bank. CONTROL is the control rights held by
the large owner of the bank. Detail definitions of variables are included in the Appendix. Competition is measured
as the bank-level Lerner Index. Significance levels of coefficient estimates are based on standard errors adjusted for
clustering at the country level. Wald Tests are performed to test the coefficients across regressions and Chi-square
statistics are reported. *, **, *** significant at 10%, 5%, 1% level respectively based on a two-tailed test.

42
Table 8 Robustness Test
Panel A. Effects of Other Mechanisms and Wedge
High Competition
Low Competition
Coefficient Std. Error
Coefficient Std. Error
Intercept -0.0395 0.0408 -0.0042 0.0319
EBLLP 1.6781 2.4134 -0.1164 0.5959
WEDGE*EBLLP -0.2198 0.2380 1.2089 0.4683 ***
MANAGER_CF*EBLLP -0.6168 0.3214 * -1.3272 0.7951 *
OWNER_BOARD*EBLLP 0.3330 0.3474 0.0051 0.1228
RIGHT*EBLLP -0.7669 1.0213 -0.0089 0.3598
DISCLOSE*EBLLP 0.0619 0.6848 0.4158 0.3824
JUDICIAL*EBLLP 0.0016 0.0684 -0.0187 0.0176
DEPOSIT*EBLLP -0.0606 0.4374 -0.0047 0.1938
CORRUPT*EBLLP -0.1652 0.3132 0.0239 0.0288
No. of observation 70 70
Adj. R-square 0.7609 0.7390
Main Effects Yes Yes
Control Variables Yes Yes
Fixed Effect Bank type
Bank type
We include all the main effects of the interaction terms and other control variables, the coefficients on which are not
reported for brevity. The dependent variable, LLP, is loan loss provisions on the income statement at the end of the
period scaled by average loans during the year. EBLLP is earnings before taxes and loan loss provisions scaled by
average loans during the year. WEDGE is the difference between control rights and cash flow rights of banks’
ultimate controllers. MANAGER_CF is total cash flow rights held by senior management of the bank.
OWNER_BOARD is an indicator equal to “1” if a large shareholder has a seat on the management board of the
bank, and “0” otherwise. RIGHT is the country-level anti-self-dealing index capturing ex ante and ex post control of
self-dealing through private enforcement for minority shareholder protection. DISCLOSE is a country-level measure
of disclosure created from components of the general securities law disclosure requirements. JUDICIAL is the
country-level judicial efficiency index, the assessment of the efficiency and integrity of the legal environment as it
affects business, particularly foreign firms. DEPOSIT is an indicator equal to “1” if the country has explicit deposit
insurance and “0” otherwise. CORRUPT is the Country-level official corruption. Too-big-too-fail is an indicator
equals “1” if the bank’s share in the country’s total deposits exceeds 10% in 2001, and “0” otherwise. The following
control variables are included in the regressions. SIZE is the natural logarithm of the average of total assets during
the year. CAR is book value of equity divided by total assets. ZSCORE is return on assets plus the capital asset ratio
divided by the standard deviation of asset returns. LoanGrowth is the percentage change in total loans for the year.
LGDP is the natural logarithm of GDP. ∆GDP is the percentage change in GDP. Detail definitions of variables are
included in the Appendix. Competition is measured as the bank-level Lerner Index. Significance levels of coefficient
estimates are based on standard errors adjusted for clustering at the country level. *, **, *** significant at 10%, 5%,
1% level respectively based on a two-tailed test.

43
Table 8 Robustness Test
Panel B. Effects of Other Mechanisms, Cash Flow Rights and Control Rights
High Competition
Low Competition
Coefficient Std. Error
Coefficient Std. Error
Intercept -0.0762 0.0540 0.0050 0.0292
EBLLP 3.2486 3.3971 -0.2331 0.5912
CF*EBLLP -0.4927 0.5553 -0.3438 0.3163
CONTROL*EBLLP -0.1794 0.2479 0.4556 0.2393 *
MANAGER_CF*EBLLP -0.1992 0.6567 -1.6990 0.8248 **
OWNER_BOARD*EBLLP 0.1973 0.4316 0.0097 0.1104
RIGHT*EBLLP -0.3357 1.2728 -0.0617 0.3887
DISCLOSE*EBLLP -0.5255 0.9809 0.4054 0.4730
JUDICIAL*EBLLP 0.0056 0.0885 -0.0016 0.0142
DEPOSIT*EBLLP -0.0409 0.4823 -0.0513 0.1886
CORRUPT*EBLLP -0.3568 0.4732 0.0402 0.0360
No. of observation 70 70
Adj. R-square 0.7892 0.7566
Main Effects Yes Yes
Control Variables Yes Yes
Fixed Effect Bank type
Bank type
We include all the main effects of the interaction terms and other control variables, the coefficients on which are not
reported for brevity. The dependent variable, LLP, is loan loss provisions on the income statement at the end of the
period scaled by average loans during the year. EBLLP is earnings before taxes and loan loss provisions scaled by
average loans during the year. CF is the cash flow rights of the large owner of the bank. CONTROL is the control
rights held by the large owner of the bank. MANAGER_CF is total cash flow rights held by senior management of
the bank. OWNER_BOARD is an indicator equal to “1” if a large shareholder has a seat on the management board
of the bank, and “0” otherwise. RIGHT is the country-level anti-self-dealing index capturing ex ante and ex post
control of self-dealing through private enforcement for minority shareholder protection. DISCLOSE is a country-
level measure of disclosure created from components of the general securities law disclosure requirements.
JUDICIAL is the country-level judicial efficiency index, the assessment of the efficiency and integrity of the legal
environment as it affects business, particularly foreign firms. DEPOSIT is an indicator equal to “1” if the country
has explicit deposit insurance and “0” otherwise. CORRUPT is the Country-level official corruption. Too-big-too-
fail is an indicator equals “1” if the bank’s share in the country’s total deposits exceeds 10% in 2001, and “0”
otherwise. The following control variables are included in the regressions. SIZE is the natural logarithm of the
average of total assets during the year. CAR is book value of equity divided by total assets. ZSCORE is return on
assets plus the capital asset ratio divided by the standard deviation of asset returns. LoanGrowth is the percentage
change in total loans for the year. LGDP is the natural logarithm of GDP. ∆GDP is the percentage change in GDP.
Detail definitions of variables are included in the Appendix. Competition is measured as the bank-level Lerner Index.
Significance levels of coefficient estimates are based on standard errors adjusted for clustering at the country level. *,
**, *** significant at 10%, 5%, 1% level respectively based on a two-tailed test.


