Group Financial Performance
Q3 & 9M 2004(pro forma)
Canning Square Car Park, Athens
2
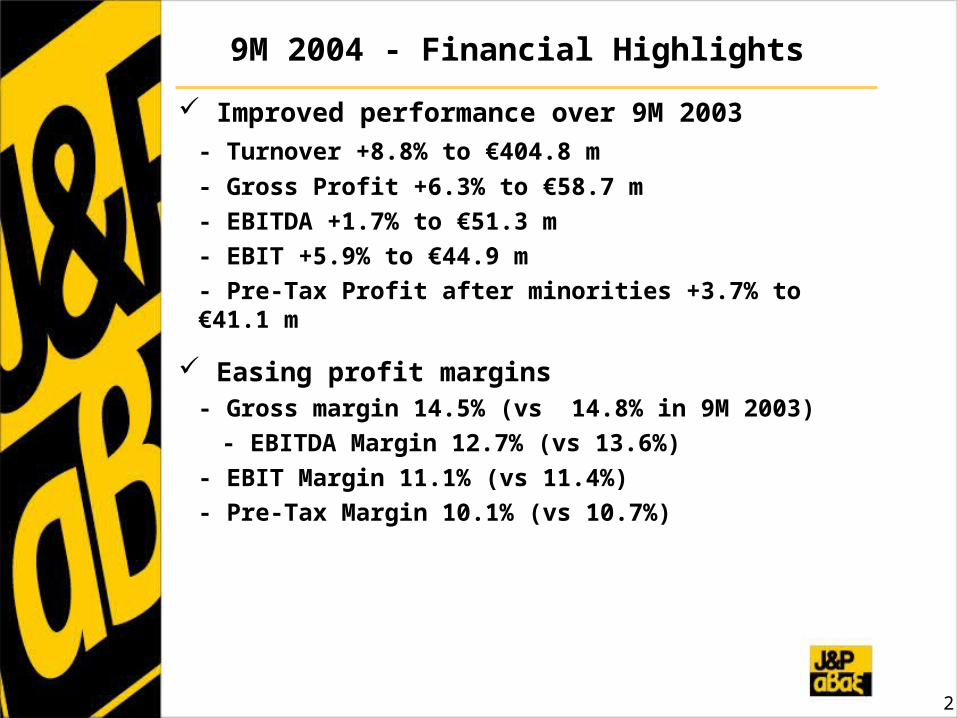
9M 2004 - Financial Highlights
Improved performance over 9M 2003 - Turnover +8.8% to €404.8 m
- Gross Profit +6.3% to €58.7 m- EBITDA +1.7% to €51.3 m- EBIT +5.9% to €44.9 m- Pre-Tax Profit after minorities +3.7% to €41.1 m
Easing profit margins- Gross margin 14.5% (vs 14.8% in 9M 2003)
- EBITDA Margin 12.7% (vs 13.6%)- EBIT Margin 11.1% (vs 11.4%)- Pre-Tax Margin 10.1% (vs 10.7%)
3
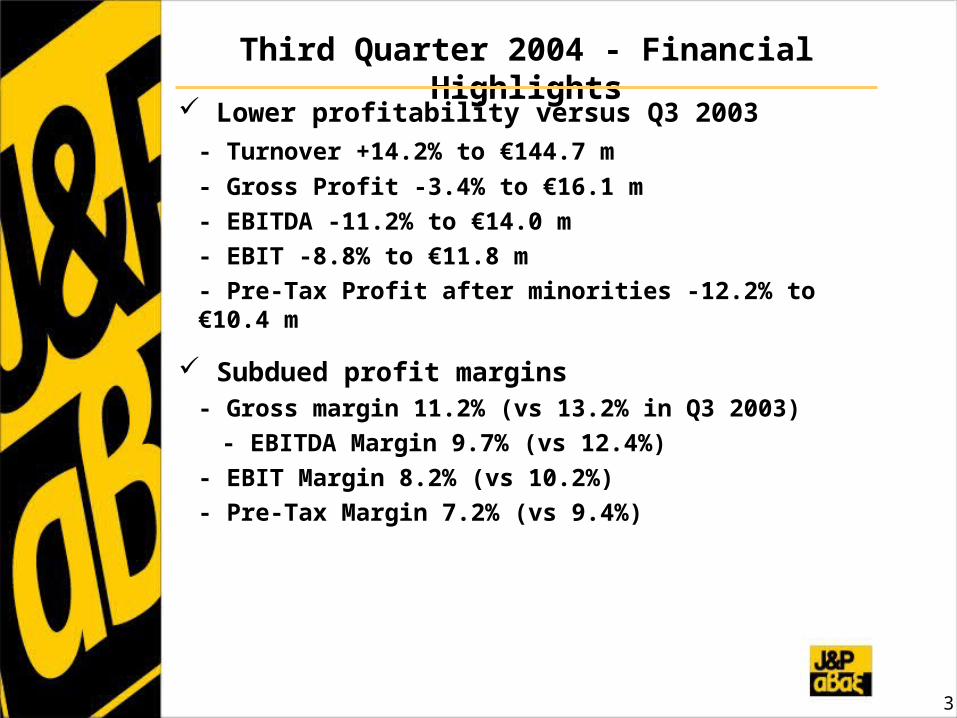
Third Quarter 2004 - Financial Highlights
Lower profitability versus Q3 2003 - Turnover +14.2% to €144.7 m
- Gross Profit -3.4% to €16.1 m- EBITDA -11.2% to €14.0 m- EBIT -8.8% to €11.8 m- Pre-Tax Profit after minorities -12.2% to €10.4 m
Subdued profit margins- Gross margin 11.2% (vs 13.2% in Q3 2003)
- EBITDA Margin 9.7% (vs 12.4%)- EBIT Margin 8.2% (vs 10.2%)- Pre-Tax Margin 7.2% (vs 9.4%)
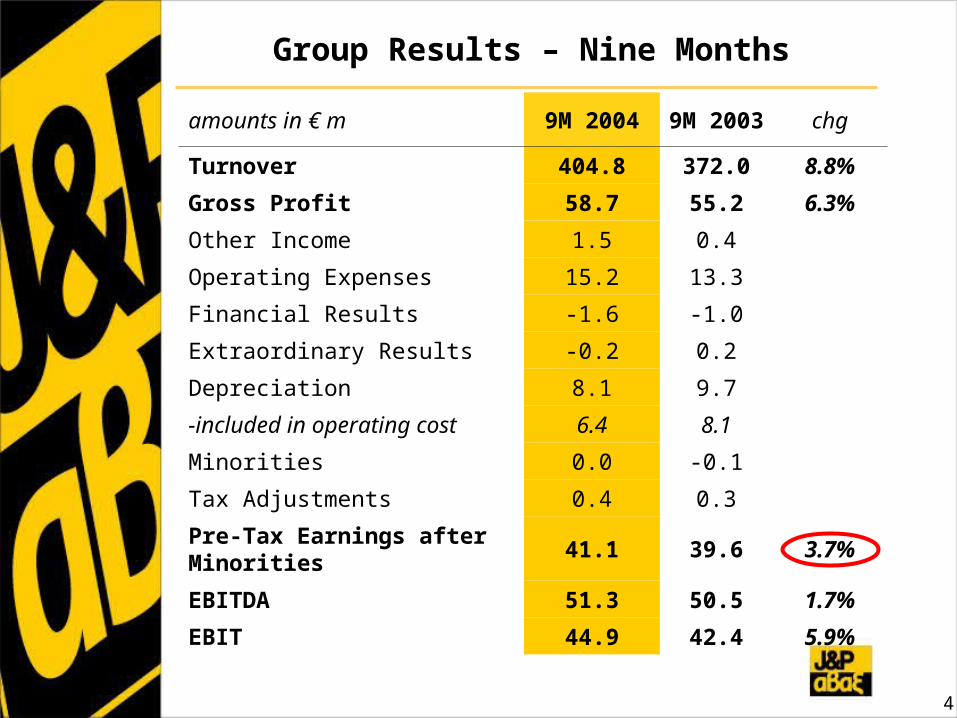
Group Results – Nine Months
4
amounts in € m 9M 2004 9M 2003 chg
Turnover 404.8 372.0 8.8%
Gross Profit 58.7 55.2 6.3%
Other Income 1.5 0.4
Operating Expenses 15.2 13.3
Financial Results -1.6 -1.0
Extraordinary Results -0.2 0.2
Depreciation 8.1 9.7
-included in operating cost 6.4 8.1
Minorities 0.0 -0.1
Tax Adjustments 0.4 0.3
Pre-Tax Earnings after Minorities
41.1 39.6 3.7%
EBITDA 51.3 50.5 1.7%
EBIT 44.9 42.4 5.9%
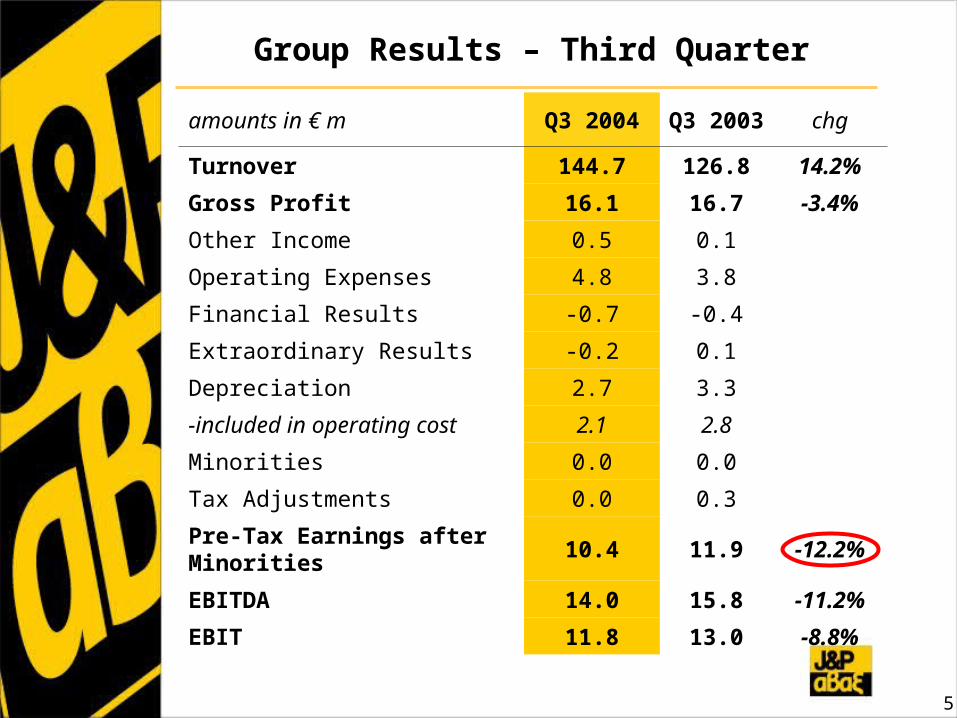
Group Results – Third Quarter
5
amounts in € m Q3 2004 Q3 2003 chg
Turnover 144.7 126.8 14.2%
Gross Profit 16.1 16.7 -3.4%
Other Income 0.5 0.1
Operating Expenses 4.8 3.8
Financial Results -0.7 -0.4
Extraordinary Results -0.2 0.1
Depreciation 2.7 3.3
-included in operating cost 2.1 2.8
Minorities 0.0 0.0
Tax Adjustments 0.0 0.3
Pre-Tax Earnings after Minorities
10.4 11.9 -12.2%
EBITDA 14.0 15.8 -11.2%
EBIT 11.8 13.0 -8.8%
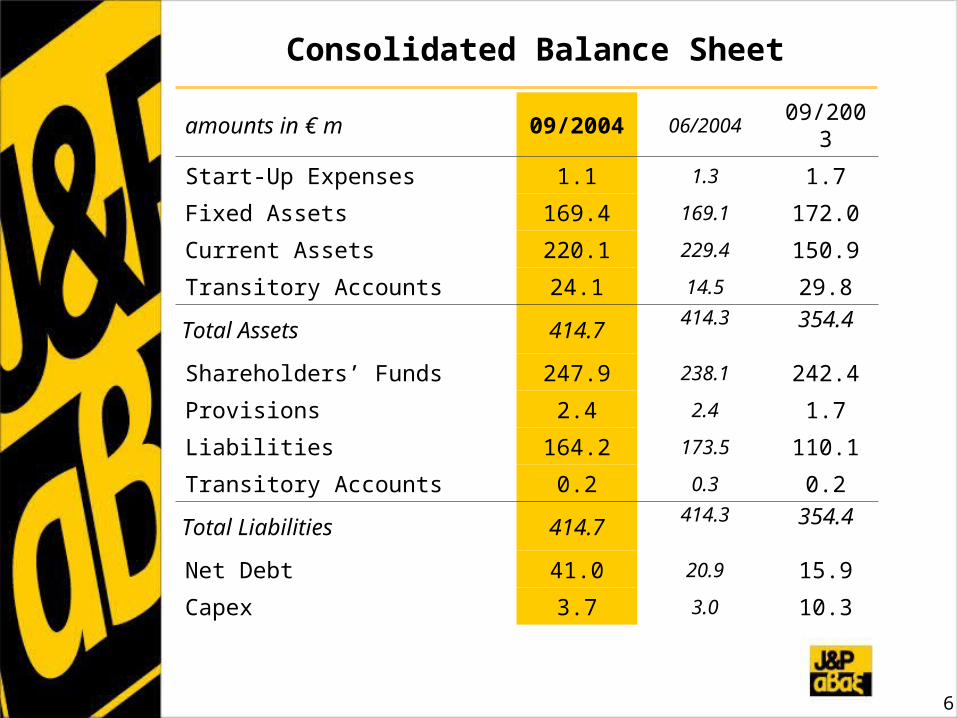
Consolidated Balance Sheet
amounts in € m09/200
406/2004
09/2003
Start-Up Expenses 1.1 1.3 1.7
Fixed Assets 169.4 169.1 172.0
Current Assets 220.1 229.4 150.9
Transitory Accounts 24.1 14.5 29.8
Total Assets 414.7 414.3 354.4
Shareholders’ Funds 247.9 238.1 242.4
Provisions 2.4 2.4 1.7
Liabilities 164.2 173.5 110.1
Transitory Accounts 0.2 0.3 0.2
Total Liabilities 414.7 414.3 354.4
Net Debt 41.0 20.9 15.9
Capex 3.7 3.0 10.3
6
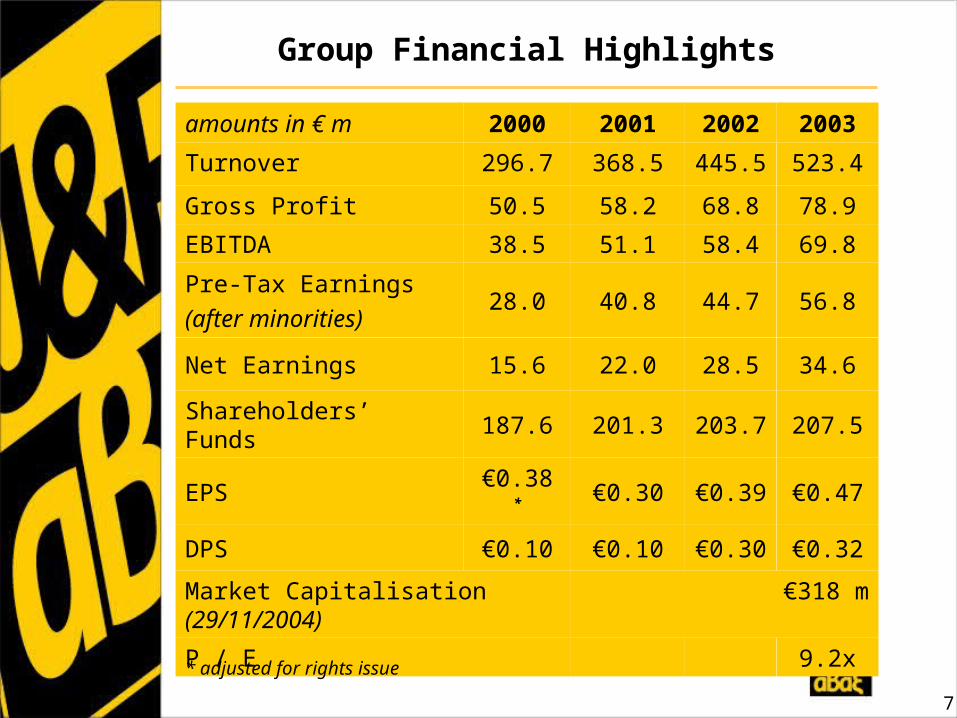
Group Financial Highlights
amounts in € m 2000 2001 2002 2003
Turnover 296.7 368.5 445.5 523.4
Gross Profit 50.5 58.2 68.8 78.9
EBITDA 38.5 51.1 58.4 69.8
Pre-Tax Earnings(after minorities)
28.0 40.8 44.7 56.8
Net Earnings 15.6 22.0 28.5 34.6
Shareholders’ Funds 187.6 201.3 203.7 207.5
EPS €0.38 * €0.30 €0.39 €0.47
DPS €0.10 €0.10 €0.30 €0.32
Market Capitalisation (29/11/2004)
€318 m
P / E 9.2x
* adjusted for rights issue
7
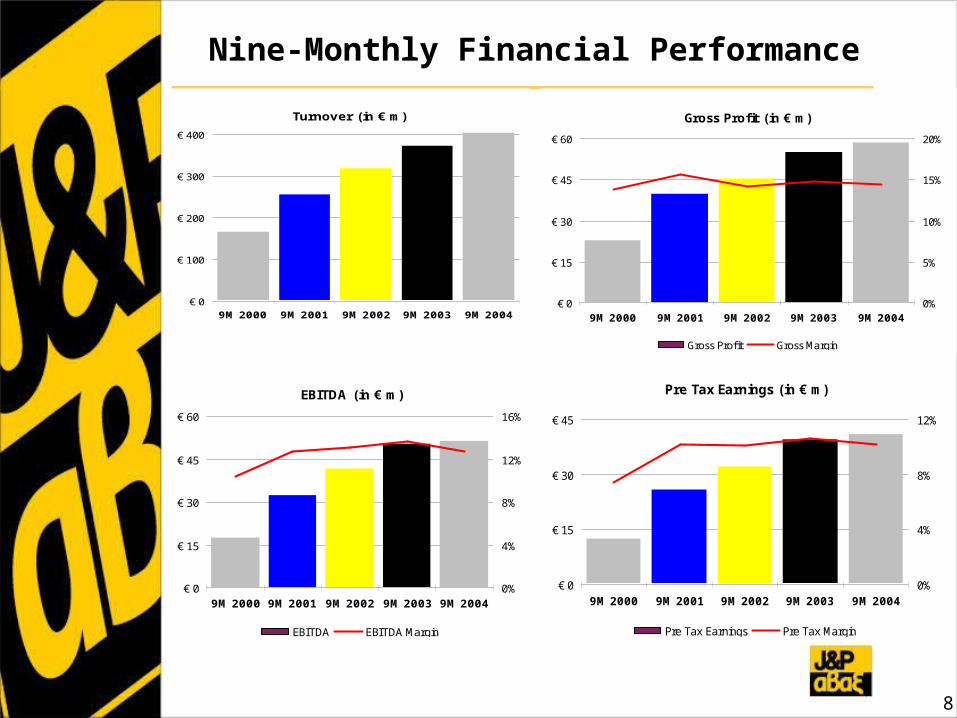
Nine-Monthly Financial Performance
8
Turnover (in € m)
€ 0
€ 100
€ 200
€ 300
€ 400
9M 2000 9M 2001 9M 2002 9M 2003 9M 2004
Gross Profit (in € m)
€ 0
€ 15
€ 30
€ 45
€ 60
9M 2000 9M 2001 9M 2002 9M 2003 9M 20040%
5%
10%
15%
20%
Gross Profit Gross Margin
EBITDA (in € m)
€ 0
€ 15
€ 30
€ 45
€ 60
9M 2000 9M 2001 9M 2002 9M 2003 9M 20040%
4%
8%
12%
16%
EBITDA EBITDA Margin
Pre Tax Earnings (in € m)
€ 0
€ 15
€ 30
€ 45
9M 2000 9M 2001 9M 2002 9M 2003 9M 20040%
4%
8%
12%
Pre Tax Earnings Pre Tax Margin
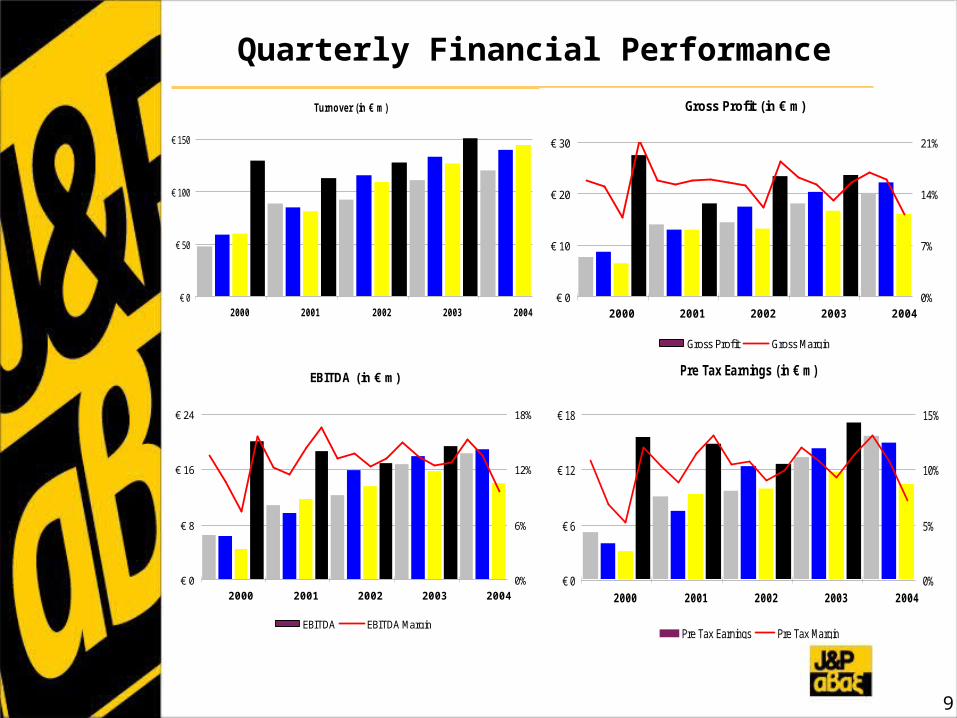
Quarterly Financial Performance
9
Turnover (in € m)
€ 0
€ 50
€ 100
€ 150
2000 2001 2002 2003 2004
Gross Profit (in € m)
€ 0
€ 10
€ 20
€ 30
2000 2001 2002 2003 20040%
7%
14%
21%
Gross Profit Gross Margin
EBITDA (in € m)
€ 0
€ 8
€ 16
€ 24
2000 2001 2002 2003 20040%
6%
12%
18%
EBITDA EBITDA Margin
Pre Tax Earnings (in € m)
€ 0
€ 6
€ 12
€ 18
2000 2001 2002 2003 20040%
5%
10%
15%
Pre Tax Earnings Pre Tax Margin

INVESTING IN THE FUTURE
Investor Relations OfficerAngelos Kiosklis9 Frangokklisias St, 151 25, Marousi, Greecetel +30-210-6185592fax +30-210-6185698email [email protected]


