
Growth in International Commodity Prices, the Terms of Trade, and GDP per capita: A
Case Study of Vietnam
By
Markus Brueckner
Kien Trung Nguyen
ANU Working Papers in Economics and Econometrics # 643
August 2016
ISBN: 0 86831 643 1

Growth in International Commodity Prices, the Terms of Trade, and GDP per capita: A CaseStudy of Vietnam
Markus BruecknerAustralian National University
and
Kien Trung NguyenDa Nang University of Economics
Abstract: The Vietnamese economy is characterized by a high degree of international trade openness and a relatively low GDP share of net-exports. This paper examines the effect of growth in the terms of trade, and more specifically, in international commodity prices, on Vietnam's GDP per capita growth. The paper finds that, during 2000-2014, growth in the terms of trade contributed positively to Vietnam’s GDP per capita growth but the effect is not large: less than one-tenth of Vietnam’s GDP per capita growth was due to growth in its terms of trade. The paper argues that the relatively small effect of growth in the terms of trade on GDP per capita growth is due to a low GDP share of net-exports. Econometric model estimates show that transitional convergence accounted for about half of Vietnam's GDP per capita growth during 2000-2014.

1. Introduction
The Vietnamese economy is a useful case study for demonstrating that the impact of growth in the
terms of trade, and specifically of international commodity prices, on GDP per capita growth
depends on the GDP share of net exports – and that trade openness, measured as exports plus
imports over GDP, can be a misleading statistic. In a nutshell, the argument can be summarized as
follows. First, note that GDP = C+I+G+NX. Totally differentiating this equation, one can see that
the income gain of a change in the international price, p, of an exported commodity, x, is
dln(GDP)=(x/GDP)*dln(p); for an imported commodity, m, the effect is dln(GDP)= -
(m/GDP)*dln(p). For a change in the international price of net exports, NX, the effect is dln(GDP)=
(NX/GDP)*dln(P), where P is the geometric sum of prices of exports and imports. Note that
NX/GDP=(NX/TRADE)*(TRADE/GDP). For a given ratio of net exports, NX, over imports plus
exports, TRADE, an increase in trade openness increases the effect that growth in the terms of trade
has on GDP per capita growth. However, ultimately it is the ratio of net exports that matters for the
overall size of the income gain (or loss).
Vietnam is more open to international trade than the majority of countries in the world. The
cross-country differences in trade openness are substantial. In 2010 Vietnam's ratio of exports plus
imports over GDP was 150 percent. In that year, Vietnam's trade openness was twice that of the
median country in the world. In 2010 the median country in the world had a ratio of exports plus
imports over GDP of 80 percent. The country at the 75th percentile had a ratio of exports plus
imports over GDP of 110 percent. In 2010 Vietnam ranked in the top 10 percent of countries in the
world with regard to international trade openness.
Figure 1 shows that since the 2000s the Vietnamese economy experienced a significant
increase in trade openness. Between 2000 and 2010 the ratio of international trade in goods and
services over GDP increased by 50 percent, from 100 percent in 2004 to 150 percent in 2010. In the
year 2014 trade openness in Vietnam was 170 percent of GDP. During this time period there was a
significant increase in exports and imports. The GDP share of Vietnam's merchandise exports

increased during the 2000s by 20 percentage points, from 40 percent in 2000 to 60 percent in 2010.
In 2014 the GDP share of merchandise exports was 80 percent. The GDP share of merchandise
imports increased by 20 percentage points during the 2000s, from 50 percent in 2000 to 70 percent
in 2010. In 2014 Vietnam's GDP share of merchandise imports was 80 percent.
Figure 2 shows that Vietnam had a current account deficit for the majority of years during
the 2000s. The average current account deficit during 2000-2010 was around 3 percent of GDP. In
2008, the peak year of the global financial crisis, Vietnam's current account deficit reached 10
percent of GDP. However, since 2011 Vietnam's current account displayed a surplus – amounting to
about 4 percent of GDP.
Figure 3 shows that Vietnam's terms of trade peaked in 2010, and since then have remained
at about the same level. Between 2000 and 2010 the net barter terms of trade increased by 30
percent.
2. Vietnam's Commodity Exports and Imports
In the early 2000s Vietnam was a net-exporter of fossil fuels but this changed throughout the course
of the decade. In 2000 the GDP share of net-exports of fossil fuels was around 5 percent. Figure 4A
shows that during the 2000s the GDP share of net-exports of fossil fuels declined significantly. By
2010 Vietnam had become a net-importer of fossil fuels. In 2014 the GDP share of net-imports of
fossil fuels was around 0.5 percent. During the 2000s the share of fossil fuel exports in merchandise
exports declined, and more so than the share of fossil fuel imports in merchandise imports.
During the 2000s the Vietnamese economy experienced an increase in the GDP share of net-
imports of metals and ores. This can be seen from Figure 4B. In 2000 the GDP share of net-imports
of metals and ores was around 1 percent. By 2010 the GDP share of net-imports of metals and ores
was around 3 percent. One can see that the increase in the GDP share of net-imports of metals and
ores is due to a significant increase in the GDP share of imports of metals and ores. The share of

imports of metals and ores in merchandise imports increased from 2 percent in 2000 to 5 percent in
2010.
Vietnam is a net importer of agricultural raw materials. Since 2000 there has been a gradual
increase in the GDP share of net-imports of agricultural raw materials, see Figure 4C. In 2000 the
GDP share of net-imports of agricultural raw materials was around 0.5 percent; by 2014 it was 1.5
percent.
Vietnam's GDP share of net-exports of food is large relative to other commodity bundles.
However, as Figure 4D shows the GDP of net-exports of food has declined since 2000. In 2000 the
GDP share of net-exports of food was 8 percent of GDP; by 2014 it was 5 percent. The GDP share
of food exports remained stable during that time period at about 11 percent. The GDP share of food
imports increased significantly, from 2 percent in 2000 to 7 percent in 2014. Figure 4D also shows
that the share of food exports in merchandise exports declined since 2000 by around 10 percentage
points: In 2000 the share of food exports in merchandise exports was around 25 percent; in 2014 it
was 15 percent.
3. Time Series of International Commodity Price Indices
Figure 5 shows time-series plots of international commodity price indices. One can see that for all
four price indices there has been a significant increase. During 2000-2014, the commodity with the
largest price increase was oil. During that time period the international oil price increased by about
350 percent. The second largest price increase was in metals, ores, and minerals. The price index for
metals, ores, and minerals increased during 2000-2014 by about 300 percent. The agricultural raw
materials price index increased by 90 percent; and the food price index increased by about 250
percent. For the oil price index and the metals, ores, and minerals price index there were two
significant peaks: one in the year 2008 and the other in the year 2012. The price indices of
agricultural raw materials and food had one significant peak in 2012.

A strict mathematical argument suggests that the impact of international commodity price
growth on GDP growth depends on two factors: (i) the GDP share of net-exports of commodities;
and (ii) the growth in the international prices. To see this note that GDP=C+I+G+NX. Taking
natural logarithms of both sides and totally differentiating yields Δln(GDPt)=δt-1*Δln(Pt), where δt-1
is the GDP share of net-exports of commodities in period t-1 and Pt is the international commodity
price in period t; Δ is the change between period t and t-1.
Figure 6 shows time-series graphs of δt-1*Δln(Pt) for various commodity bundles of interest.
One can see that for fuel and food the year-to-year growth rates of δt-1*Δln(Pt) are positive in the
majority of years since 2000. During 2000-2010 the average predicted effect on Vietnam's GDP
growth of growth in international fuel prices is around 0.6 percent per annum. For growth in
international food prices the effect on GDP growth is around 0.5 percent per annum. For fuel, the
largest positive effect is in the year 2005; in this year the international oil price increased relative to
the previous year by over 0.3 log points. The predicted effect of growth in international fuel prices
on Vietnam's GDP growth in 2005 is around 1.5 percent. For food, the largest positive value is in
the year 2008 when the international food price increased relative to the previous year by over 0.3
log points. The predicted effect on Vietnam's GDP growth in the year 2005 is around 2.3 percent.
During 2000-2010 the average predicted effect on Vietnam's GDP growth of growth in
international prices of metals, minerals and ores is around -0.2 percent per annum. This reflects that
Vietnam is a net-importer of this group of commodities and that during that time period the
international prices of metals, minerals and ores increased on average. However, in the year 2008
the metals, minerals and ores price index declined significantly, by around 0.4 log points. The
decline in prices in metals, minerals and ores positively contributed to Vietnam's GDP growth in
2008. The predicted effect is sizable, amounting to about 1 percentage point.
Growth in agricultural raw materials prices during 2000-2010 had a relative small effect on
GDP growth in Vietnam. The average predicted effect on GDP growth is around -0.05 percentage
points. The peak growth in agricultural raw materials prices was in the year 2010, amounting to

about 0.3 log points. The predicted effect on Vietnam's GDP growth is around -0.2 percentage
points in that year.
Figure 6 also shows that during 2011-2014 the contribution of growth in the international
fuel and food prices on Vietnam's GDP growth is near zero. For fuel this reflects that during 2010-
2014 Vietnam's GDP share of fuel net exports was around zero. For food the small contribution to
Vietnam's GDP growth reflects that growth in international food prices during 2010-2014 was less
than 1 percent per annum.
Figure 7 shows a time-series graph of δt-1*Δln(Pt) for the sum of the four commodity
bundles. One can see that for the majority of years, the values are in the positive range. The average
during 2000-2010 is around 0.8 percentage points per annum. This suggests that the impact on
Vietnam's GDP growth of the international commodity price boom during the 2000s was positive.
The peak effect is in the year 2008: the year-to-year changes in international commodity prices
lifted Vietnam's GDP growth by around 2 percentage points. During 2011-2014 the effect of
changes in the international commodity prices on Vietnam's GDP growth was around 0.15
percentage points per annum.
For the period 2000-2014, the average predicted effect of changes in international
commodity prices on Vietnam's GDP growth is around 0.7 percentage points. To set this figure into
perspective, it is useful to note that during 2000-2014 Vietnam's GDP per capita growth was around
5 percentage points per annum.
4. Econometric Model
The simplest econometric model of the impact of growth in the terms of trade on GDP per capita
growth is:
GDPgrowtht=a+bTermsofTradegrowtht +et
Least squares estimation of the above model, using data for Vietnam during 2000-2015, yields
b=0.14. The Huber robust standard error associated with that estimate is 0.06. Hence one can reject

the hypothesis that growth in the terms of trade had no effect on GDP per capita growth at the 5
percent significance level.
During 2000-2015, the growth rate of Vietnam's terms of trade was around 2 percent per
annum. Using a coefficient b=0.14 from the estimates of the econometric model, one can compute
that GDP per capita growth was lifted during 2000-2015 by around 0.3 percentage points per
annum. Since GDP per capita growth was around 5 percent per annum during that time period,
growth in terms of trade contributed less than one-tenth1 to Vietnam's GDP per capita growth.
A multivariate model is needed for decomposing economic growth into transitional
convergence and other variables, X. Araujo et al. (2014) use the following econometric model:
lnyct -lnyct-1 = φlnyct-1 + Γln(X)ct + ac + bt + ect
where lnyct-lnyct-1 is the change in the natural logarithm of real GDP per capita in country c between
period t and t-1; lnyct-1 is the natural logarithm of real GDP per capita of country c in period t-1; ac
and bt are country and time fixed effects; and ect is an error term. The vector of growth
determinants, Xct, includes the natural logarithms of secondary enrolment, the GDP share of
domestic credit to the private sector, trade openness, government size, telephones lines per capita,
inflation, the real exchange rate, an indicator of systemic banking crises, and the growth rate of the
terms of trade. Additional variables that are included in Xct are the Polity2 score, which is a measure
of the degree of political competition and political constraints, as well as the growth rate of an
international commodity export price index that captures windfalls from international commodity
price booms.
The system-GMM estimates of the econometric model by Araujo et al. (2014) supports the
key feature of neoclassical growth models of convergence in real GDP per capita. The estimated
coefficient on lagged (log) GDP per capita is 0.78 and has a standard error of 0.06. One can reject
the hypothesis that the coefficient is equal to zero and unity at the conventional significance levels.
The econometric model estimates of Araujo et al. (2014) show that growth in the terms of
trade has a significant positive effect on GDP per capita growth. The coefficient on the terms of
1 This is calculated as 0.3/5=0.06.

trade is around 0.12. One can reject the hypothesis that this coefficient is equal to zero at the 1
percent significance level.
Based on the Araujo et al. (2014) model estimates, Figure 9 plots the contribution of growth
in the terms of trade and transitional convergence on Vietnam's GDP per capita growth. From
Figure 9, one can see that during 2000-2014 transitional convergence accounted for more than half
of Vietnam's GDP per capita growth. Growth in terms of trade had a positive effect on Vietnam's
GDP per capita growth: about one-tenth of the observed GDP per capita growth during 2000-2014
was due to growth in the terms of trade. For comparison of the size of these effects to other natural
resource exporting countries, see Araujo et al. (2014) or Brueckner and Hansl (2016).

References
Araujo, J., M. Brueckner, M. Clavijo, E. Vostroknutova, and K. Wacker (2014). “Benchmarking theDeterminants of Economic Growth in Latin America and the Caribbean.” World BankPublications, The World Bank, number 91015, December.
Brueckner, M. and B. Hansl (2016). “Drivers of Growth in Russia.” ANU Working Papers inEconomics and Econometrics 2016-640.
WDI (2016). World Development Indicators. Online database.

Figure 1. Trade Openness
100
120
140
160
180
Tra
de %
GD
P
1996 2002 2008 2014year
30
40
50
60
70
80
Merc
han
dise
Exp
ort
s %
GD
P
1996 2002 2008 2014year
40
50
60
70
80
Merc
han
dise
Impor
ts %
GD
P
1996 2002 2008 2014year

Figure 2. Current Account
-10
-50
5C
urr
ent A
ccou
nt %
GD
P
1996 2002 2008 2014year

Figure 3. Net Barter Terms of Trade
100
110
120
130
Net Bar
ter Term
s of T
rade
1996 2002 2008 2014year

Figure 4. Exports and Imports of Specific Commodity Bundles
Panel A: Fuel
-50
510
15
1996 2002 2008 2014year
Fuel Net Exports % of GDPFuel Imports % of GDPFuel Exports % of GDP
510
1520
25
1996 2002 2008 2014year
Fuel Exports % of Merchandise ExportsFuel Imports % of Merchandise Imports

Figure 4 Exports and Imports of Specific Commodity Bundles
Panel B: Metals and Ores
01
23
45
1996 2002 2008 2014year
Metals and Ores Exports % of Merchandise ExportsMetals and Ores Imports % of Merchandise Imports
-4-2
02
4
1996 2002 2008 2014year
Metals and Ores Net Exports % of GDPMetals and Ores Imports % of GDPMetals and Ores Exports % of GDP

Figure 4 Exports and Imports of Specific Commodity Bundles
Panel C: Agricultural Raw Materials
-2-1
01
23
1996 2002 2008 2014year
Agricultural Raw Materials Net Exports % of GDPAgricultural Raw Materials Imports % of GDPAgricultural Raw Materials Exports % of GDP
1.5
22.
53
3.5
4
1996 2002 2008 2014year
Agricultural Raw Materials Exports % of Merchandise ExportsAgricultural Raw Materials Imports % of Merchandise Imports

Figure 4 Exports and Imports of Specific Commodity Bundles
Panel D: Food
05
1015
1996 2002 2008 2014year
Food Net Exports % of GDPFood Imports % of GDPFood Exports % of GDP
510
1520
2530
1996 2002 2008 2014year
Food Exports % of Merchandise ExportsFood Imports % of Merchandise Imports

Figure 5. International Commodity Price Indices
010
020
030
040
0In
tern
atio
nal P
rice
Inde
x
1996 2002 2008 2014year
Oil
100
150
200
250
300
Inte
rna
tion
al P
rice
Inde
x
1996 2002 2008 2014year
Agricultural Raw Materials
100
200
300
400
Inte
rna
tional P
rice
Inde
x
1996 2002 2008 2014year
Minerals and Ores
100
150
200
250
300
Inte
rna
tion
al P
rice
Inde
x
1996 2002 2008 2014year
Food

Figure 6. Year-to-Year Growth of Net-Export International Commodity Price Indices
-10
12
Gro
wth
Net -
Exp
ort P
rice In
dex
in %
Per
Annum
1996 2002 2008 2014year
Fuel
-1-.
50
.51
Gro
wth
Net -
Exp
ort P
rice In
dex
in %
Per
Annum
1996 2002 2008 2014year
Minerals Ores and Metals
-.2
-.1
0.1
.2G
row
th N
et -
Exp
ort P
rice In
dex
in %
Per
Annum
1996 2002 2008 2014year
Agricultural Raw Materials
-2-1
01
2G
row
th N
et -
Exp
ort P
rice In
dex
in %
Per
Annum
1996 2002 2008 2014year
Food

Figure 7. Year-to-Year Growth of Net-Export International Commodity Price Index
-2-1
01
23
Ne
t - E
xpor
t Pri
ce In
dex
Gro
wth
in %
Pe
r A
nnu
m
1996 2002 2008 2014year
All Commodities
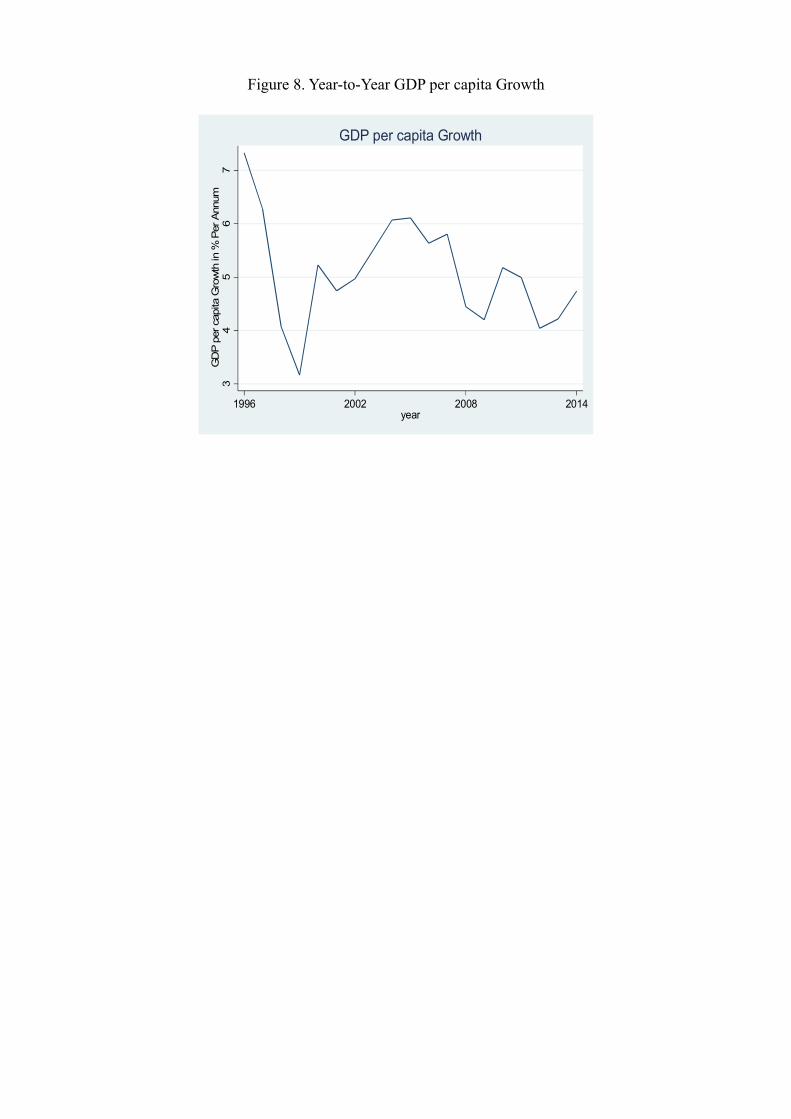
Figure 8. Year-to-Year GDP per capita Growth
34
56
7G
DP
per
cap
ita G
row
th in
% P
er A
nnum
1996 2002 2008 2014year
GDP per capita Growth

Figure 9. Growth Contribution: Transitional Convergence and Terms of Trade
0.2
.4.6
.8
Change Between 2000-2004 and 2010-2014
Change ln(GDP p.c.)Contribution of Transitional ConvergenceContribution of Terms of Trade

Appendix Table 1 Description of variablesVariable Description
Agricultural raw materials exports (% of merchandise exports)
Agricultural raw materials comprise SITC section 2 (crude materials except fuels) excluding divisions 22, 27 (crude fertilizers and minerals excluding coal, petroleum, and precious stones), and 28 (metalliferous ores and scrap). Source WDI (2016)
Agricultural raw materials imports (% of merchandise imports)
Agricultural raw materials comprise SITC section 2 (crude materials except fuels) excluding divisions 22, 27 (crude fertilizers and minerals excluding coal, petroleum, and precious stones), and 28 (metalliferous ores and scrap). Source WDI (2016)
Ores and metals exports (% of merchandise exports)
Ores and metals comprise the commodities in SITC sections 27 (crude fertilizer, minerals nes);28 (metalliferous ores, scrap); and 68 (non-ferrous metals). Source WDI (2016)
Ores and metals imports (% of merchandise imports)
Ores and metals comprise the commodities in SITC sections 27 (crude fertilizer, minerals nes);28 (metalliferous ores, scrap); and 68 (non-ferrous metals). Source WDI (2016)
Merchandise exports (current US$) Merchandise exports show the value of goods provided to the rest of the world valued in current U.S. dollars. Source WDI (2016)
Merchandise imports (current US$) Merchandise imports show the value of goods received from the rest of the world valued in current U.S. dollars. Source WDI (2016)
Fuel exports (% of merchandise exports) Fuels comprise SITC section 3 (mineral fuels). Source WDI (2016)
Fuel imports (% of merchandise imports) Fuels comprise SITC section 3 (mineral fuels). Source WDI (2016)
Food exports (% of merchandise exports) Food comprises the commodities in SITC sections 0 (food and live animals), 1 (beverages and tobacco), and 4 (animal and vegetable oils and fats) and SITC division 22 (oil seeds, oil nuts, and oil kernels). Source WDI (2016)
Food imports (% of merchandise imports) Food comprises the commodities in SITC sections 0 (food and live animals), 1 (beverages and tobacco), and 4 (animal and vegetable oils and fats) and SITC division 22 (oil seeds, oil nuts, and oil kernels). Source WDI (2016)
GDP, PPP (current international $) Gross domestic product converted to international dollars using purchasing power parity rates. Source WDI (2016)
Current account balance (%of GDP) Current account balance is the sum of net exports of goods and services, net primary

income, and net secondary income. Source WDI (2016)
Trade (% of GDP) Trade is the sum of exports and imports of goods and services measured as a share of gross domestic product. Source WDI (2016)
Merchandise Exports (% of GDP) Merchandise exports divided by current U.S. Dollars GDP times 100. Source WDI (2016)
Merchandise Imports (% of GDP) Merchandise imports divided by current U.S. Dollars GDP times 100. Source WDI (2016)
Oil Price Index Crude petroleum, average of UK Brent (light), Dubai (medium) and Texas (heavy), equally weighted ($/barrel). Source UNCTAD (2016)
Minerals, Ores and Metals Price Index Minerals, ores, and metals commodity price index. Source UNCTAD (2016).
Agricultural Raw Materials Price Index Agricultural raw materials commodity price index. Source UNCTAD (2016)
Food Price Index Food price index. Source UNCTAD (2016)
Fuel Net-Export Price Index The index is constructed as δ*ln(P), where δ is acountry's average GDP share of net-exports of fuels and P is the oil price index.
Net-Export Minerals, Ores and Metals Price Index
The index is constructed as δ*ln(P), where δ is the GDP share of net-exports of minerals, ores and metals and P is the minerals, ores and metals price index.
Net-Export Agricultural Raw Materials Price Index
The index is constructed as δ*ln(P), where δ is the GDP share of net-exports of agricultural raw materials and P is the agricultural raw materials price index.
Net-Export Food Price Index The index is constructed as δ*ln(P), where δ is the GDP share of net-exports of food and P is the food price index.
GDP per capita (constant 2005 US$) GDP per capita is gross domestic product divided by midyear population. GDP is the sum of gross value added by all resident producers inthe economy plus any product taxes and minus any subsidies not included in the value of the products. It is calculated without making deductions for depreciation of fabricated assets or for depletion and degradation of natural resources. Data are in constant 2005 U.S. dollars. Source WDI (2016)


