Download - Haemodynamic monitoring-Minati

Hemodynamic Monitoring in operating Room and Intensive
care unitDr Minati Choudhury
ProfessorCardiothoracic Sciences Centre
AIIMSNew Delhi

What I intend to discuss
• Why to monitor?• What to monitor?• How to monitor • What is the evidence that what we
are doing actually makes a difference

3
Can’t I look at my patient and tell if they are OK?
NO! Physical Assessment is often inaccurate, slow to change and difficult
to interpret

Why to monitor?
• Respiration and circulation ..Essential for sustaining life
• Oxygen ,,,,,, the real necessity for organ function
• To gather information that will indicate whether the conditions that are required to maintain tissue perfusion are adequately maintained.
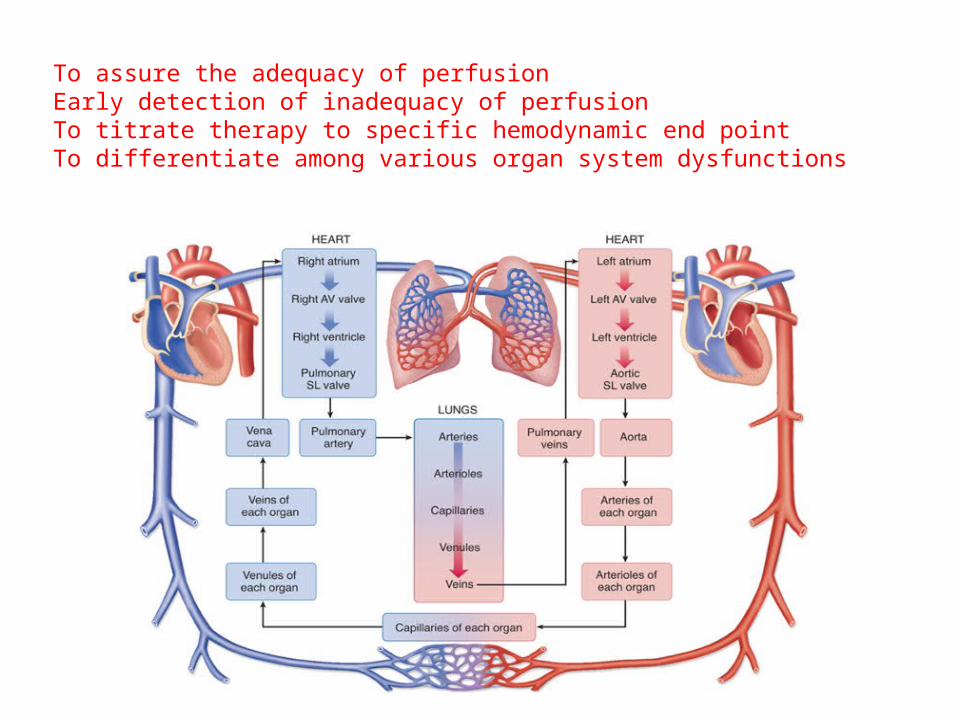
To assure the adequacy of perfusionEarly detection of inadequacy of perfusionTo titrate therapy to specific hemodynamic end pointTo differentiate among various organ system dysfunctions

Why hemodynamic monitoring?
• Preoptimization for high-risk surgery patients treated in the operating room
• EGDT (< 12 h) resuscitation in septic patients treated in the emergency department reduce morbidity, mortality, and resource use.
• The closer the resuscitation is to the insult, the greater the benefit.
• Focus of these monitoring protocols .......... to establish a mean arterial pressure > 65 mm Hg and then to increase DO2 to 600 mL/min/m2 within the first few minutes to hours of presentation.

Adequate Oxygen Delivery?
ConsumptionDemand

Oxygen Delivery
Arterial Blood Gas
Arterial Blood Gas
HemoglobinPaO2
HemoglobinPaO2
Oxygen Content
Oxygen Content
Oxygen Delivery
Oxygen Delivery
Cardiac Output
Cardiac Output
Oxygen Content
Oxygen Content== XX
Hemodynamic MonitorsHemodynamic Monitors

Oxygen Consumption
Oxygen Delivery
Oxygen Delivery
Oxygen Consumed
Oxygen Consumed
Remaining Oxygen to Heart
Remaining Oxygen to Heart== ++
Oxygen Uptake by Organs & Tissues
Oxygen Uptake by Organs & Tissues
Oxygen Content in CVP & PA
Oxygen Content in CVP & PA
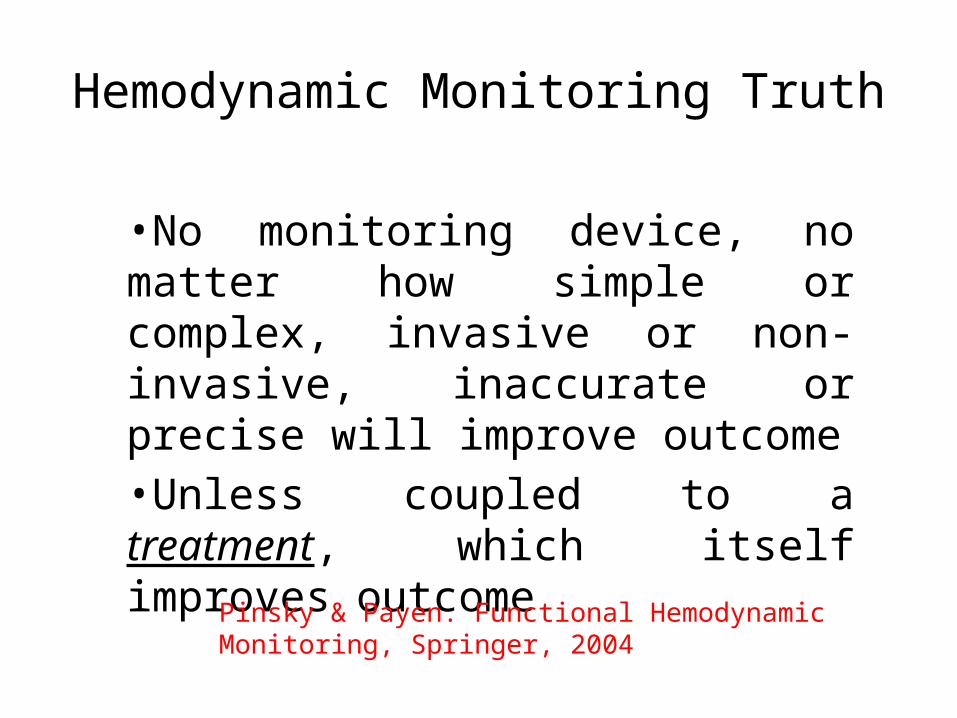
Hemodynamic Monitoring Truth
•No monitoring device, no matter how simple or complex, invasive or non-invasive, inaccurate or precise will improve outcome•Unless coupled to a treatment, which itself improves outcome
Pinsky & Payen. Functional Hemodynamic Monitoring, Springer, 2004

Different Environments Demand Different Rules
Emergency Department
Trauma ICU
Operation Room
ICU & RR
Rapid, invasive, high specificity
Somewhere in between ER and OR
Accurate, invasive, high specificityClose titration, zero tolerance for complications
Rapid, minimally invasive, high sensitivity

Traditional Monitoring
Electrocardiography• HR, dysrhythmnias, HR variability
Pulse oxymetry NIBP Arterial blood pressure Central venous pressure

Pulse Oxymetry• ABSORBTION SPECTRO PHOTOMETRY
• BEER LAMBERT LAW• LAMBERT’S LAW states that when a light falls on a homogenous
substance,intensity of transmitted light decreases as the distance through the substance increase
• BEER’S LAW states that when a light is transmitted through a clear substance with a dissolved solute ,the intensity of transmitted light decreases as the concentration of the solute increases
Uses two lights of wavelengths• 660nm –deoxy Hb absorbs ten times as oxy hb• 940 nm – absorption of oxyHb is greater• Lab oximeters use 4 wavelengths to measure 4 species of haemoglobin• It =I o e –Ecd [Ecd –absorbance]


Oxygen desaturation
• Saturation is defined as is a relative measure of the amount of oxygen that is dissolved or carried in a given medium(percentage).
• Desaturation leads to Hypoxemia – a relative deficiency of O2 in arterial blood. PaO2 < 80mmHg – hypoxemia
• Oxygen saturation will not decrease until PaO2 is below 85mmHg.
• Rough guide for PaO2 between saturation of 90%-75% is,, PaO2 = SaO2 - 30.
• SaO2< than 76% is life threatening.

• PaO2 [mmHg] SaO2 [%]
• Normal 97 to ≥80 97 to ≥95
• Hypoxia < 80 < 95• Mild 60-79 90-
94• Moderate 40 – 59 75 – 89• Severe <40 < 75
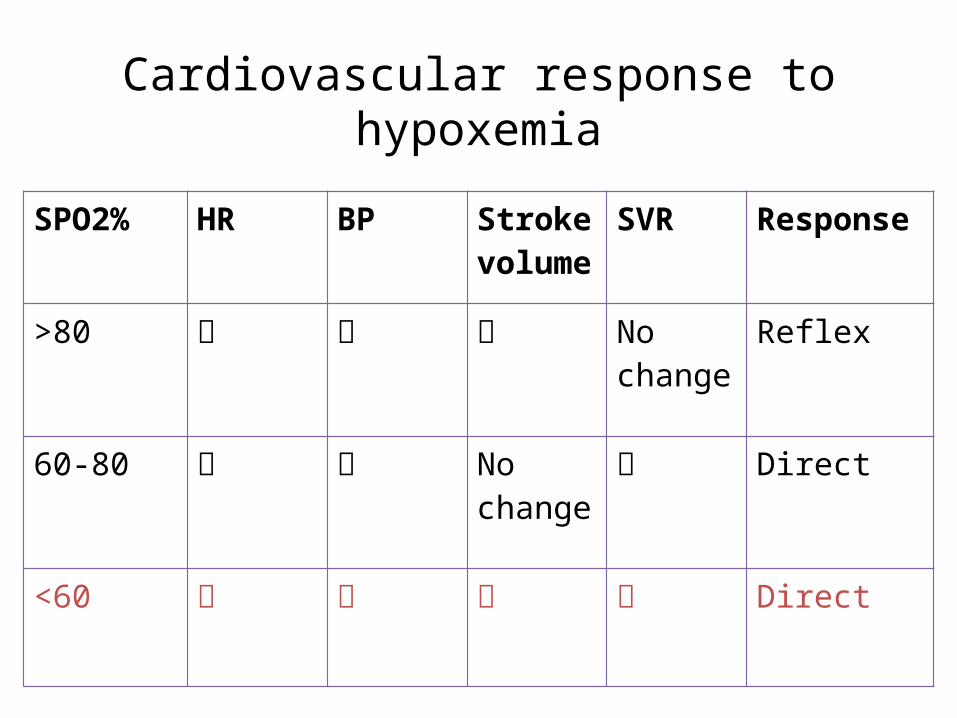
Cardiovascular response to hypoxemia
SPO2% HR BP Stroke volume
SVR Response
>80 No change
Reflex
60-80 No change
Direct
<60 Direct

Limitations
Shivering patient -motion artefacts High intensity ambient light Perfusion of the patient ear probe may be more reliable Abnormal pulses –erratic perfomance Carboxy Hb – Produces SpO2 > than true O2 saturation (10-20% in
heavy smokers) Methaemoglobinemia – absorbs equal amount of red &infra red
light (SpO2 to move towards 85%)Endo / exogenous dyes interfere Blue ,Black ,Green nail polishesDiathermy leads to disturbance in monitor
Problems
• False positives and negatives• Burn injury• Pressure injuries

Invasive Arterial pressure

Normal arterial wave form
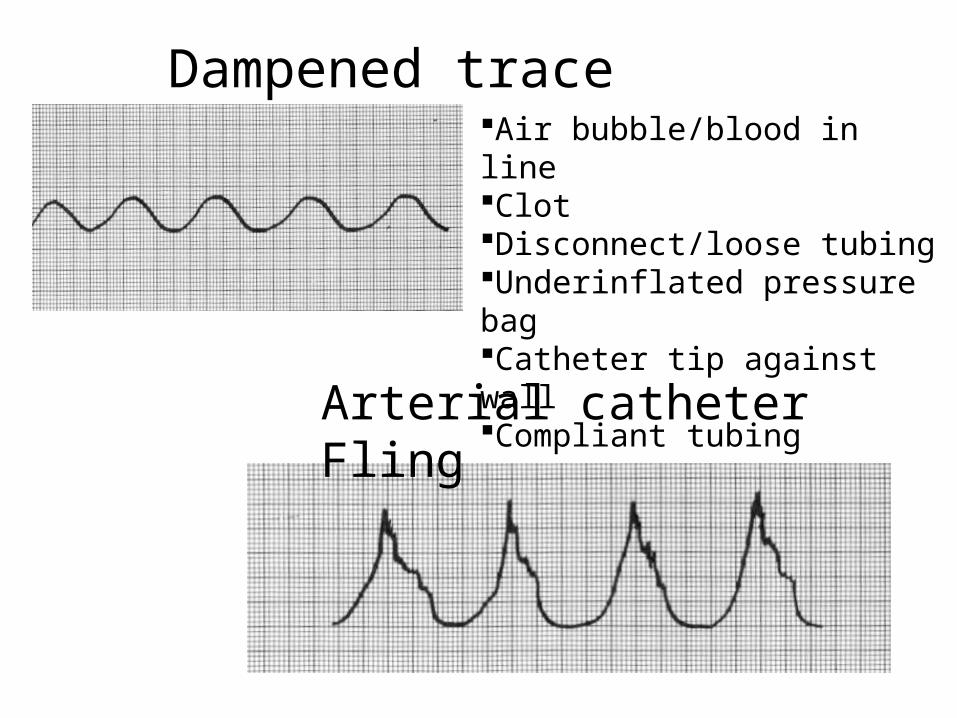
Dampened trace
Arterial catheter Fling
Air bubble/blood in lineClotDisconnect/loose tubingUnderinflated pressure bagCatheter tip against wallCompliant tubing

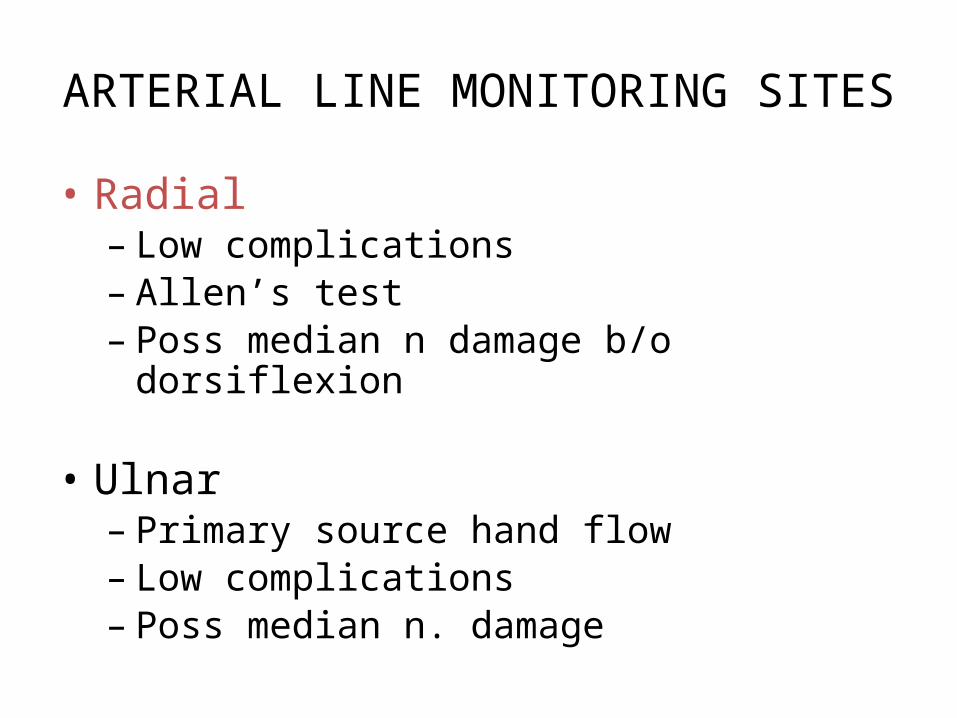
ARTERIAL LINE MONITORING SITES
• Radial– Low complications– Allen’s test– Poss median n damage b/o dorsiflexion
• Ulnar– Primary source hand flow– Low complications– Poss median n. damage
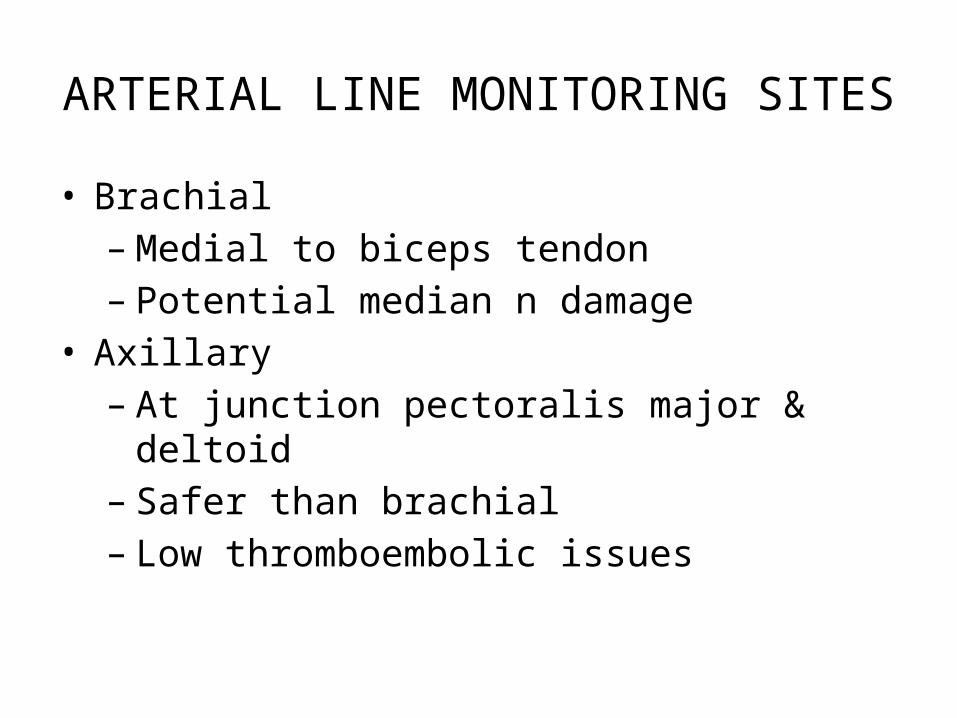
ARTERIAL LINE MONITORING SITES
• Brachial–Medial to biceps tendon– Potential median n damage
• Axillary– At junction pectoralis major & deltoid– Safer than brachial– Low thromboembolic issues
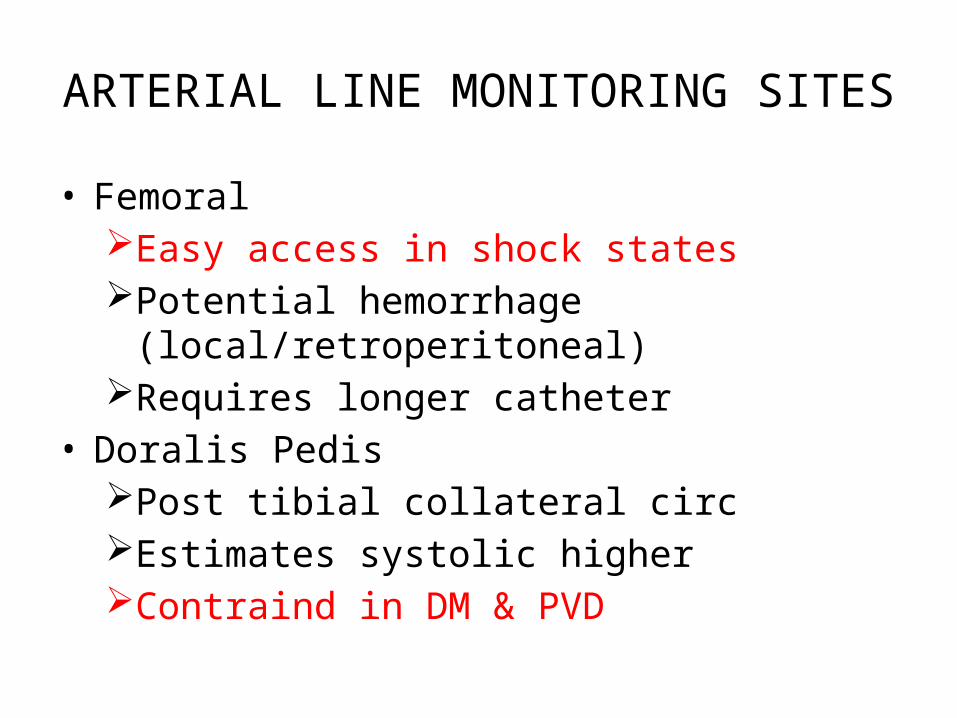
ARTERIAL LINE MONITORING SITES
• FemoralEasy access in shock statesPotential hemorrhage
(local/retroperitoneal)Requires longer catheter
• Doralis PedisPost tibial collateral circEstimates systolic higherContraind in DM & PVD
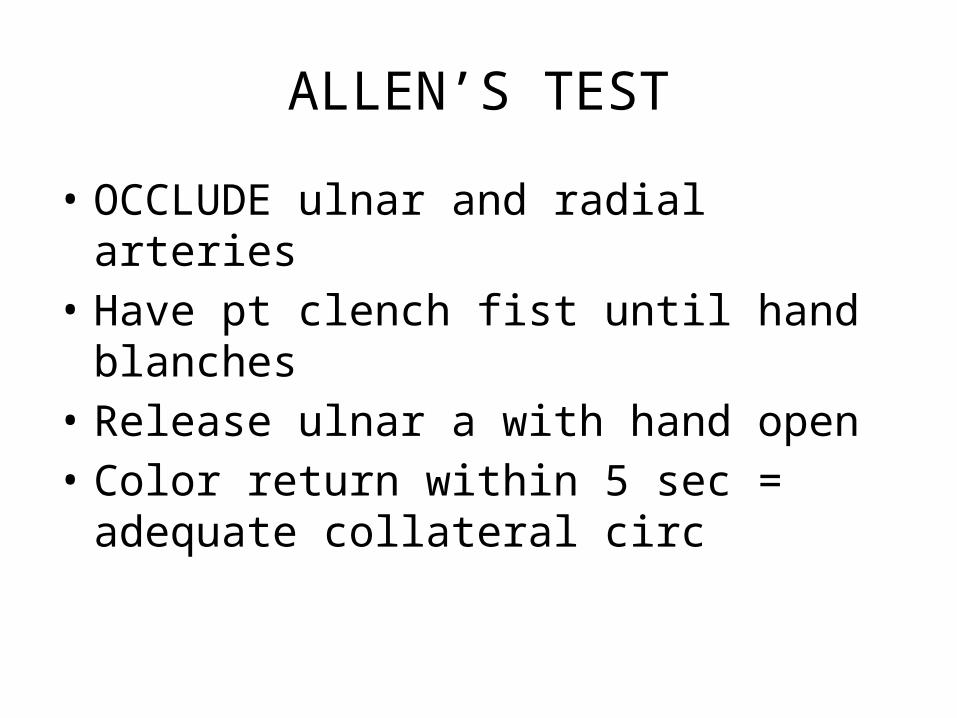
ALLEN’S TEST
• OCCLUDE ulnar and radial arteries• Have pt clench fist until hand
blanches• Release ulnar a with hand open• Color return within 5 sec = adequate
collateral circ
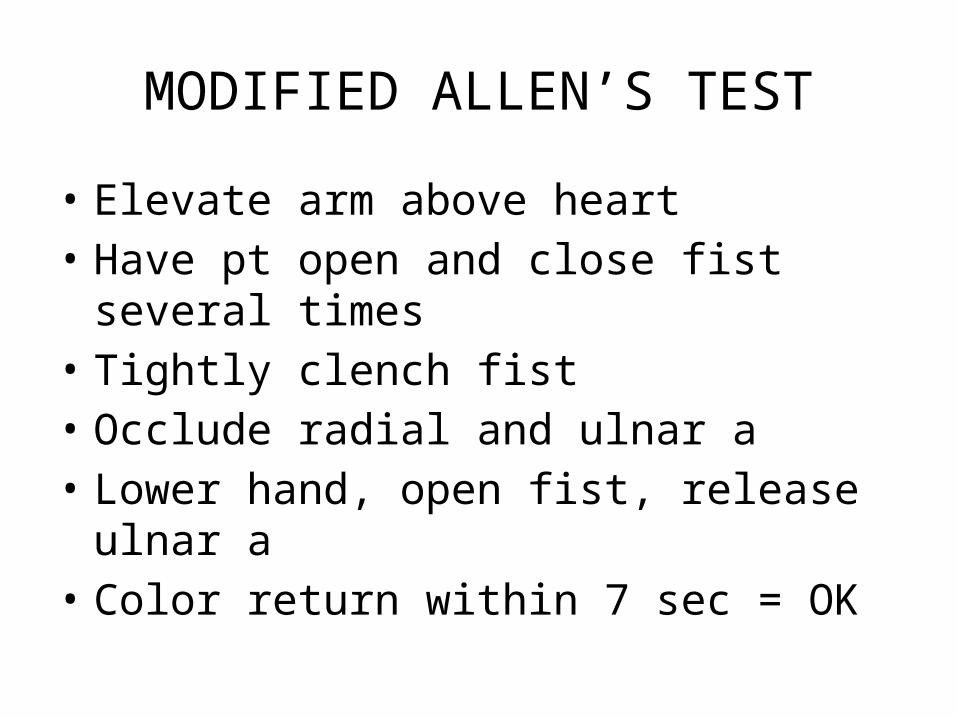
MODIFIED ALLEN’S TEST
• Elevate arm above heart• Have pt open and close fist several
times• Tightly clench fist• Occlude radial and ulnar a• Lower hand, open fist, release ulnar a• Color return within 7 sec = OK
RELATIVE CONTRAINDICATIONS
• Inadequate circulation• Infection at the site• Recent cannulation same artery• Peripheral vascular disease

COMPLICATIONS ARTERIAL LINE
• Thrombosis/embolus• Hematoma• Infection• Nerve damage/palsy• Disconnect=blood loss• Fistula• Aneurysm• Digital ischemia

mlr/2007
LOSS OF WAVEFORM
• Stopcock in wrong position• Monitor not on correct scale• Nonfunctioning monitor• Nonfunctioning transducer• Kinked/clotted catheter• Asystole

Patient effect on arterial pressure
TachycardiaHypotensionAtrial fibrillation
Wave form qualityCrisp: sharp, clear lines, flowing◦ideal
Dampened: blunted, smooth◦Low flow states, air in line
Hyperdynamic: spikes◦Pinched, compliant tubing
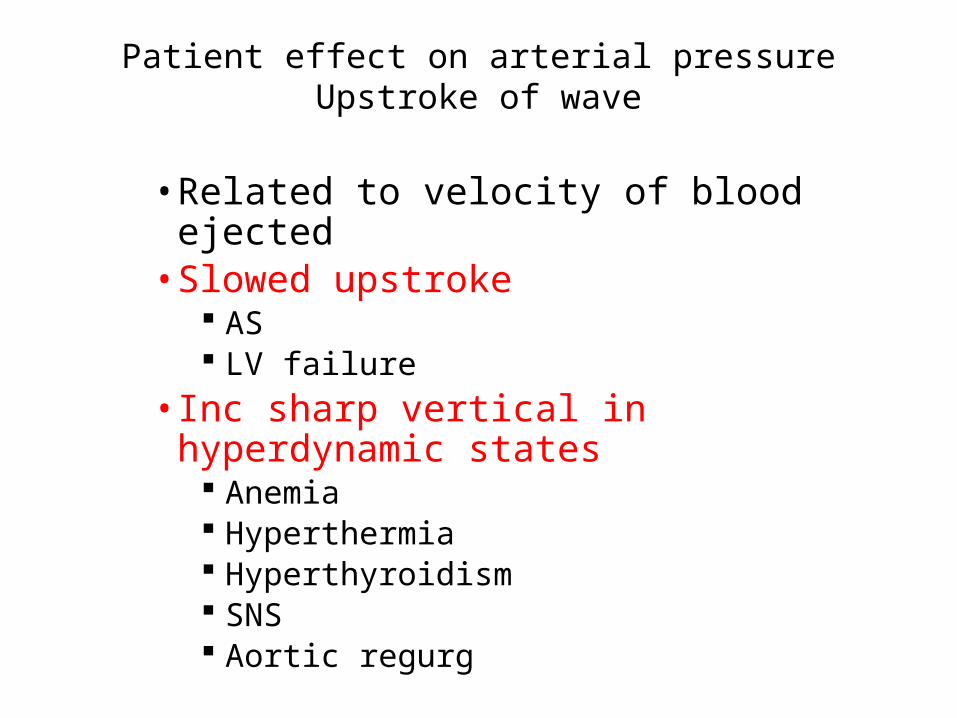
Patient effect on arterial pressureUpstroke of wave
• Related to velocity of blood ejected• Slowed upstroke
AS LV failure
• Inc sharp vertical in hyperdynamic states
Anemia Hyperthermia Hyperthyroidism SNS Aortic regurg
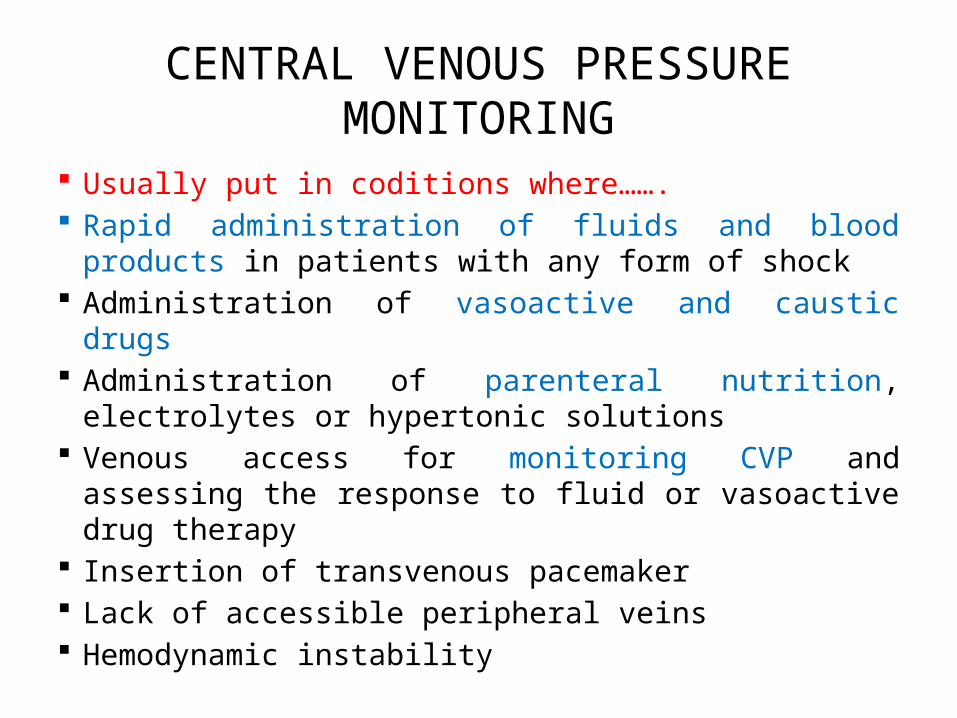
CENTRAL VENOUS PRESSURE MONITORING
Usually put in coditions where……. Rapid administration of fluids and blood
products in patients with any form of shock Administration of vasoactive and caustic drugs Administration of parenteral nutrition,
electrolytes or hypertonic solutions Venous access for monitoring CVP and
assessing the response to fluid or vasoactive drug therapy
Insertion of transvenous pacemaker Lack of accessible peripheral veins Hemodynamic instability

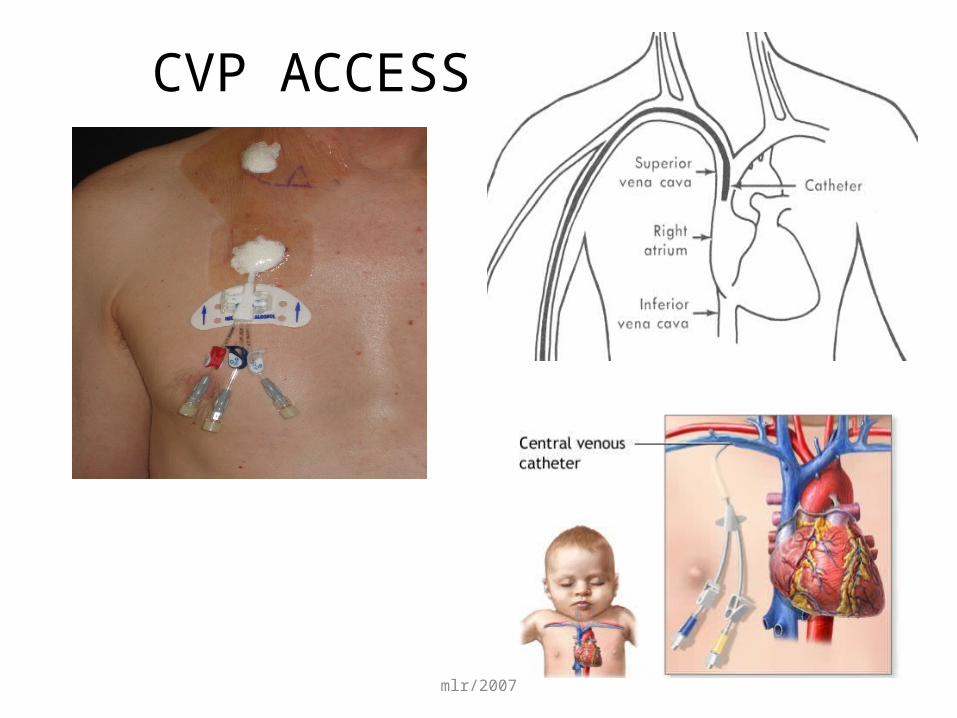
CVP ACCESS
RIJ (OR)EJSubclavian(ICU)AntecubitalFemoral
mlr/2007
CVP ACCESS

Central venous pressure monitoring kit
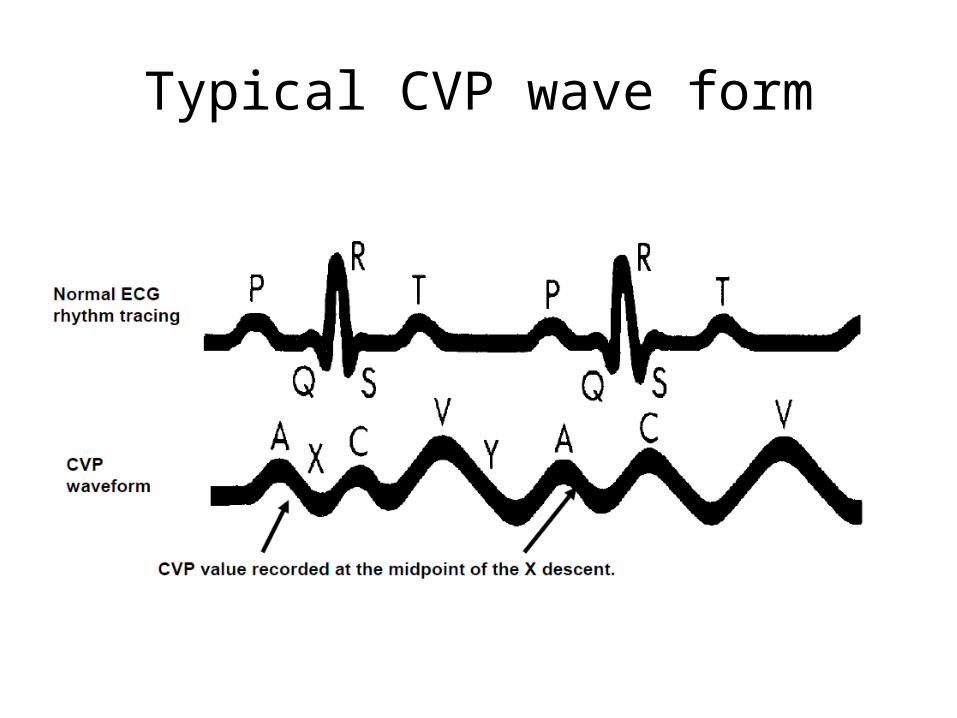
Typical CVP wave form

Elevations in Central venous pressure
• Hypervolemia• Right ventricular infarction• Impaired RV contraction• Pulmonary hypertension• Pulmonic stenosis• Left to right shunts• Tricuspid valve disease• Cardiac tamponade
Low Central venous pressure
• Hypovolemia• Dehydration• Poor vascular tone• Peripheral vasodilation• Hemorrhage• Addisonian crisis• Sepsis• Regional anesthesia• Polyuria• Sympathetic dysfunct
Contraindication
• Coagulopathies or bleeding disorders (monitor platelet count, PT, PTT)
• Current or recent use of fibrinolytics or anticoagulants
• Insertion sites that are infected or burned, or where previous vascular surgery has been performed, or involve catheter placement through vascular grafts
• Patients with suspected or confirmed vena cava injury
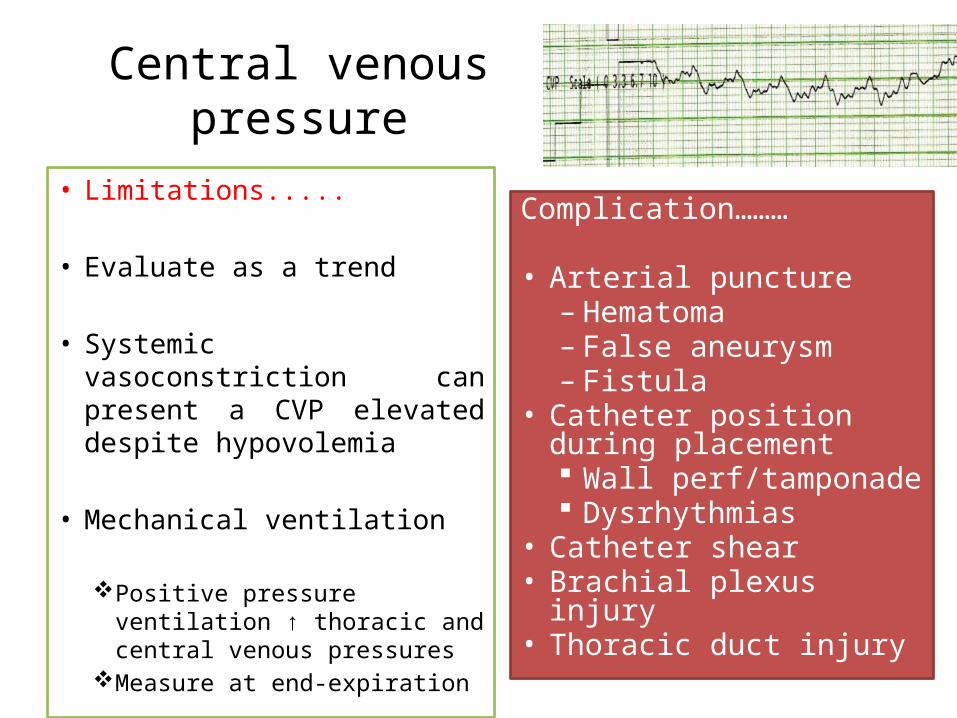
Central venous pressure
• Limitations.....
• Evaluate as a trend
• Systemic vasoconstriction can present a CVP elevated despite hypovolemia
• Mechanical ventilation
Positive pressure ventilation ↑ thoracic and central venous pressures
Measure at end-expiration
Complication………
• Arterial puncture– Hematoma– False aneurysm– Fistula
• Catheter position during placement Wall
perf/tamponade Dysrhythmias
• Catheter shear• Brachial plexus injury• Thoracic duct injury

Direct monitoring of Cardiac output
Invasive
PA catheter Fick’s
method Dye dilution Thermo
dilution
Non-invasive and semi invasive
Echocardiography Oesophageal dopplerAortovelographyTransthoracic impedanceArterial pulse contour
analysis (PiCCO)Arterial pulse power analysis
(LiDCO) Flotrac-vigileo

PA Catheter Swan-Ganz Catheter Swan
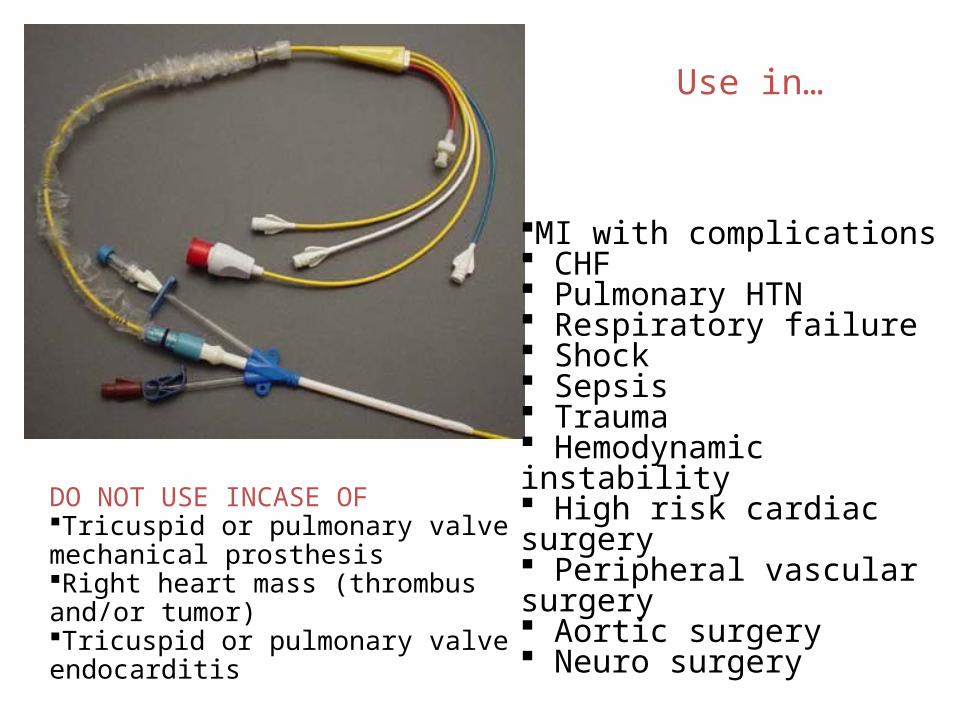
Use in…
MI with complications CHF Pulmonary HTN Respiratory failure Shock Sepsis Trauma Hemodynamic instability High risk cardiac surgery Peripheral vascular surgery Aortic surgery Neuro surgery
DO NOT USE INCASE OFTricuspid or pulmonary valve mechanical prosthesis Right heart mass (thrombus and/or tumor) Tricuspid or pulmonary valve endocarditis

PA Catheter on float

Waveforms during PAC insertion and distance from skin insertion

Proximal port in Right atrium
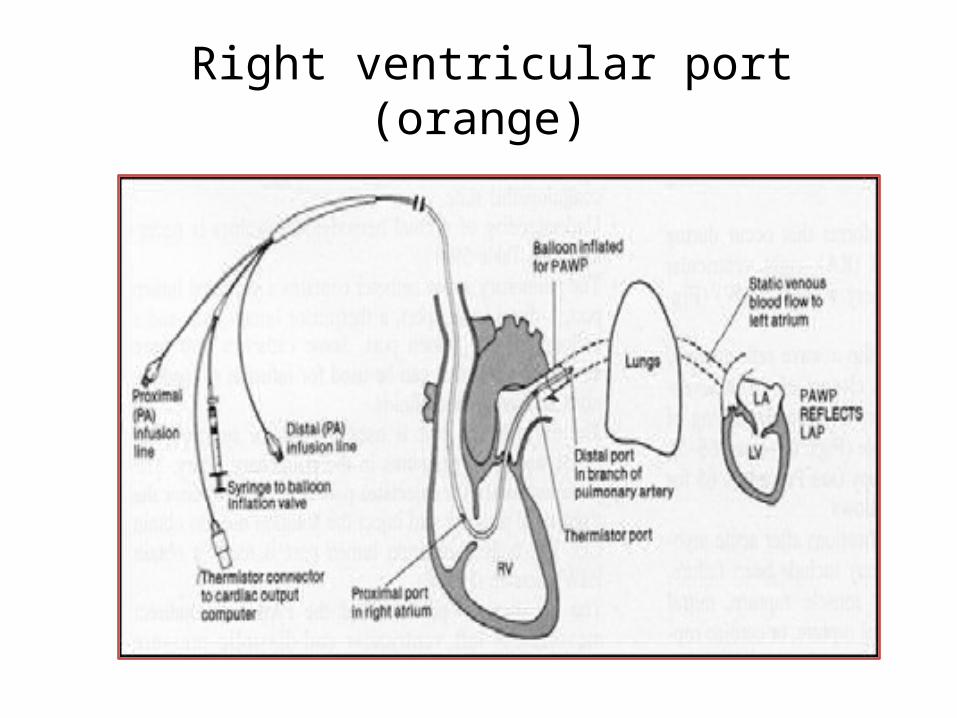
Right ventricular port (orange)

Distal port (yellow)
Normal values
PA systolic pressure = 20-30 mm Hg PA diastolic pressure = 8-12 mm Hg Mean PAP=12-15 mmHg

Measurements that can be done from PA catheter
CVPRt ventricular pressurePAPPCWPCOCI = CO/BSA, L/min/m2Stroke volume= CO/HR 1,000, mL/minStroke index = stroke volume/BSA, mL/m2LV stroke work= stroke volume (MAP-
Ppao), mL mm HgLV stroke work index= LV stroke work/BSA,
mL mm Hg/m2

Derived Hemodynamic Parameters From Hemodynamic Monitoring*
Systemic vascular resistance= (MAP- Pra)/CO× 80,dyne s/cm5
RV stroke work = stroke volume × (MPAP- Pra), mL mm Hg
RV stroke work index= RV stroke work/BSA, mL mm Hg/m2
Pulmonary vascular resistance= [(MPAP – Ppao)/CO] × 80,dyne s/cm5
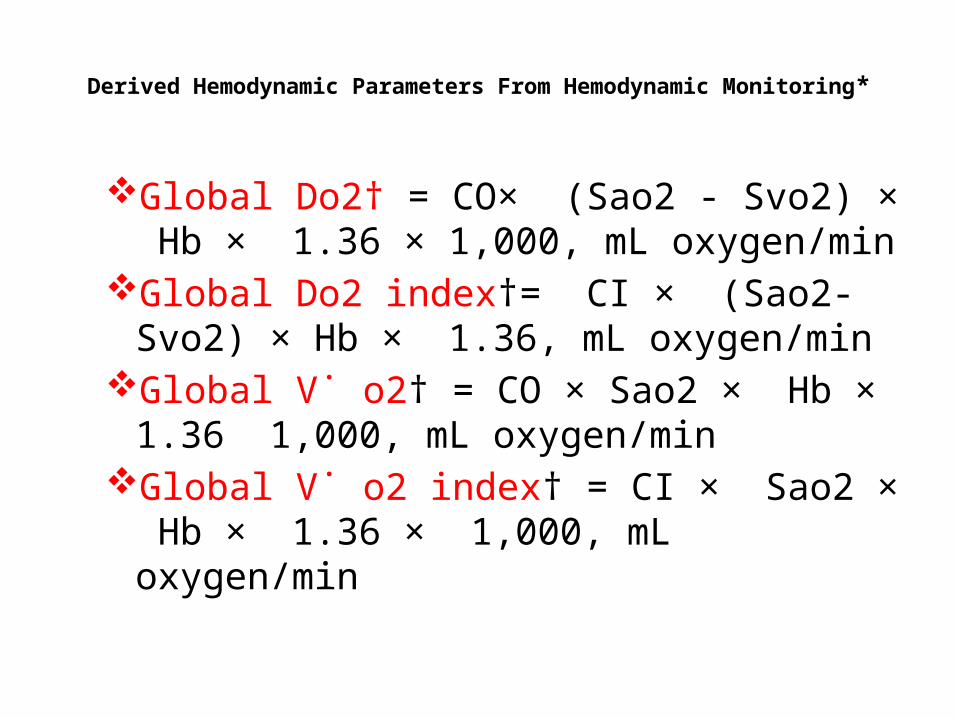
Derived Hemodynamic Parameters From Hemodynamic Monitoring*
Global Do2† = CO× (Sao2 - Svo2) × Hb × 1.36 × 1,000, mL oxygen/min
Global Do2 index†= CI × (Sao2- Svo2) × Hb × 1.36, mL oxygen/min
Global V˙ o2† = CO × Sao2 × Hb × 1.36 1,000, mL oxygen/min
Global V˙ o2 index† = CI × Sao2 × Hb × 1.36 × 1,000, mL oxygen/min
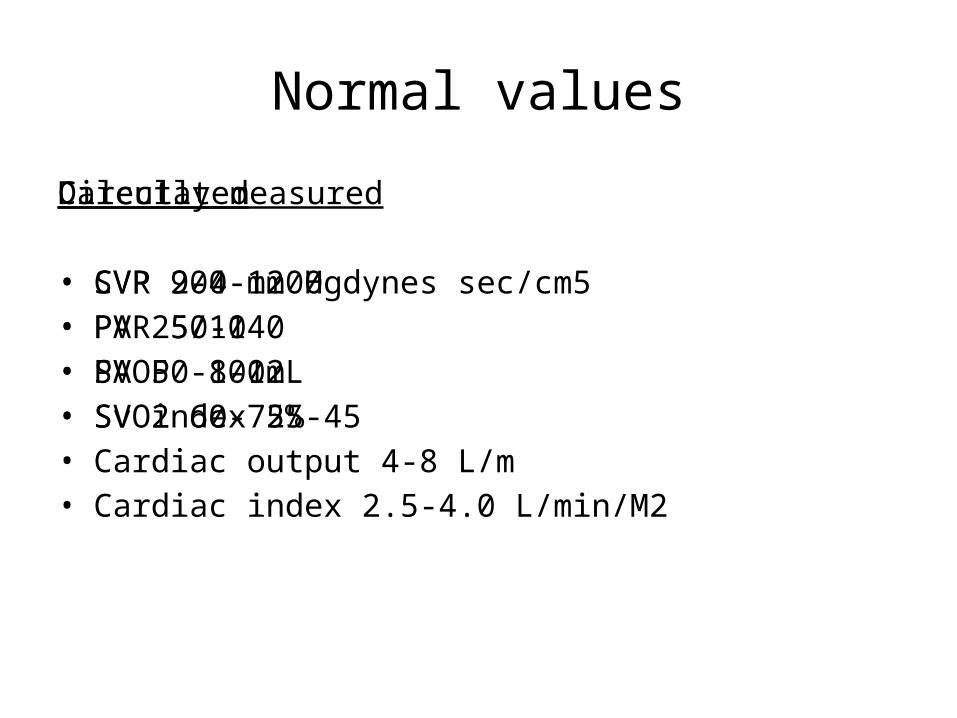
Normal values
Directly measured
• CVP 2-4 mm Hg• PA 25/10• PAOP 8-12• SvO2 60-75%• Cardiac output 4-8 L/m• Cardiac index 2.5-4.0 L/min/M2
Calculated
• SVR 900-1200 dynes sec/cm5• PVR 50-140• SV 50-100mL• SV index 25-45

Mean PAP
↑MPAP•Volume infusions•Low CO states(LV failure ,RV failure)•Peripheral vasoconstriction•Hypothermia•Vasopressors•Alpha adrenergic agents•Increased blood viscosity
↓MPAP
•Diuretics•Vasodilators•Peripheral vasodilation•Inotropic therapy(PDIII inhibitor)•Hyperdynamic phase of sepsis•Loss of vasomotor tone
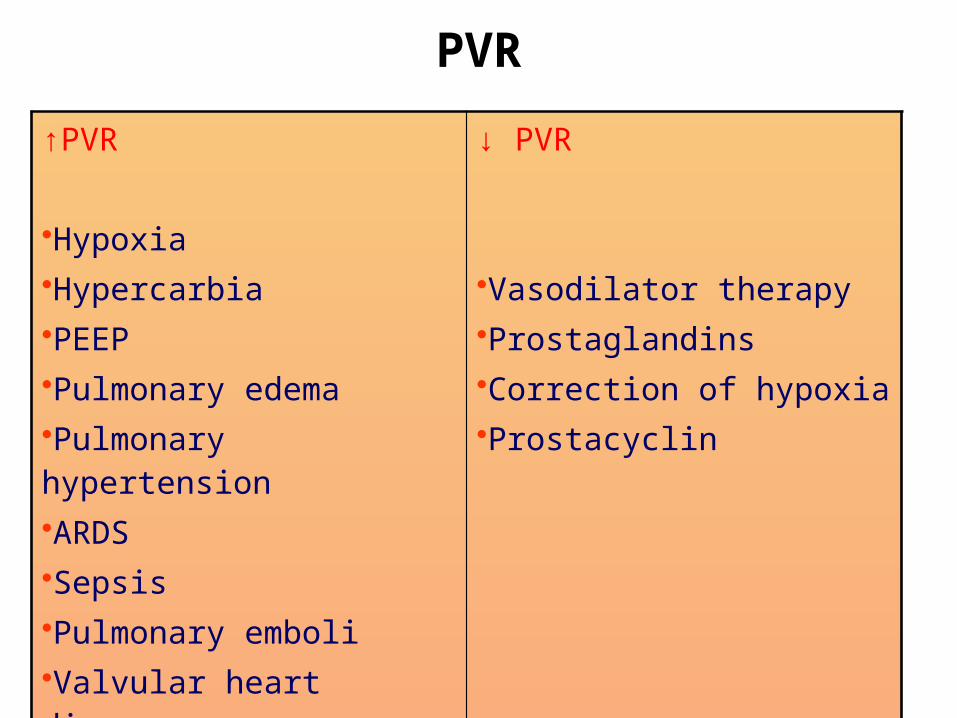
PVR
↑PVR
•Hypoxia•Hypercarbia•PEEP•Pulmonary edema•Pulmonary hypertension•ARDS•Sepsis•Pulmonary emboli•Valvular heart disease•Congenital heart defects
↓ PVR
•Vasodilator therapy•Prostaglandins•Correction of hypoxia•Prostacyclin

Systemic vascular resistance↑SVR
•Volume infusion•Decreased LV contractility•Hypervolemia•Hypoxia•Pulmonary vasoconstriction•Pulmonary hypertension•COPD
↓ SVR
•Hypovolemia•Diuretics•Inotropic therapy•Pulmonary vasodilation•Pulmonary vasodilators

Pulmonary capillary wedge pressure
Normal mean value: 8-12 mm Hg Low (< 8 mm Hg):Hypovolemia High (>12 mm
Hg):Hypervolemia
LowSepsisCirrhosisanemia
HighLV failureOverloadMitral v. issuesTamponadePericardial effusionStiff LVPPV
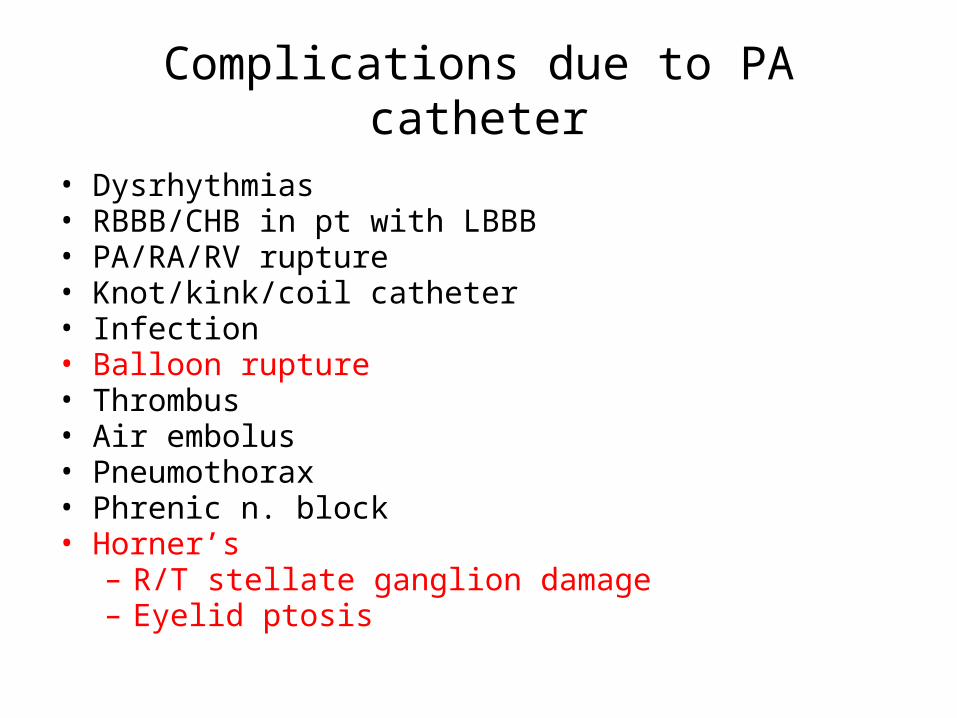
Complications due to PA catheter
• Dysrhythmias• RBBB/CHB in pt with LBBB• PA/RA/RV rupture• Knot/kink/coil catheter• Infection• Balloon rupture• Thrombus• Air embolus• Pneumothorax• Phrenic n. block• Horner’s – R/T stellate ganglion damage– Eyelid ptosis
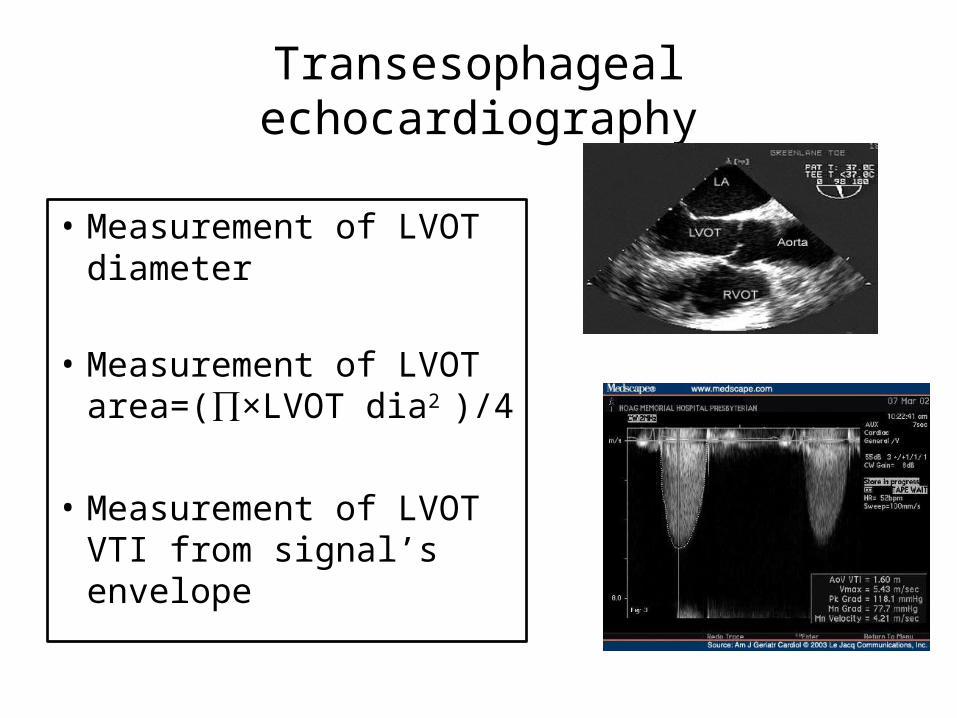
Transesophageal echocardiography
• Measurement of LVOT diameter
• Measurement of LVOT area=(∏×LVOT dia2
)/4
• Measurement of LVOT VTI from signal’s envelope
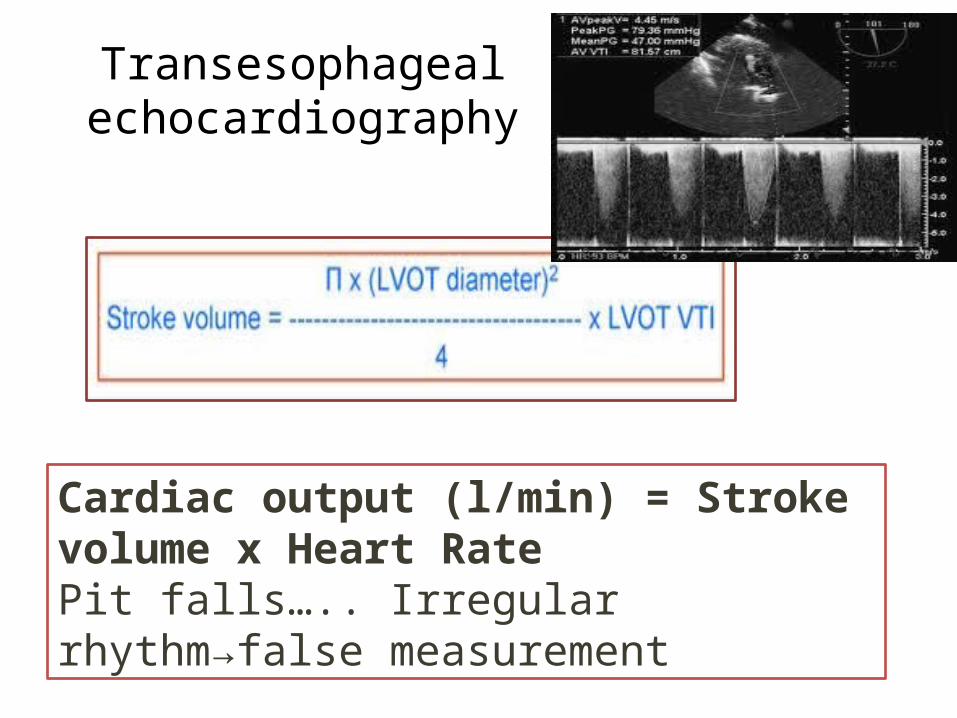
Transesophageal echocardiography
Cardiac output (l/min) = Stroke volume x Heart Rate Pit falls….. Irregular rhythm→false measurement
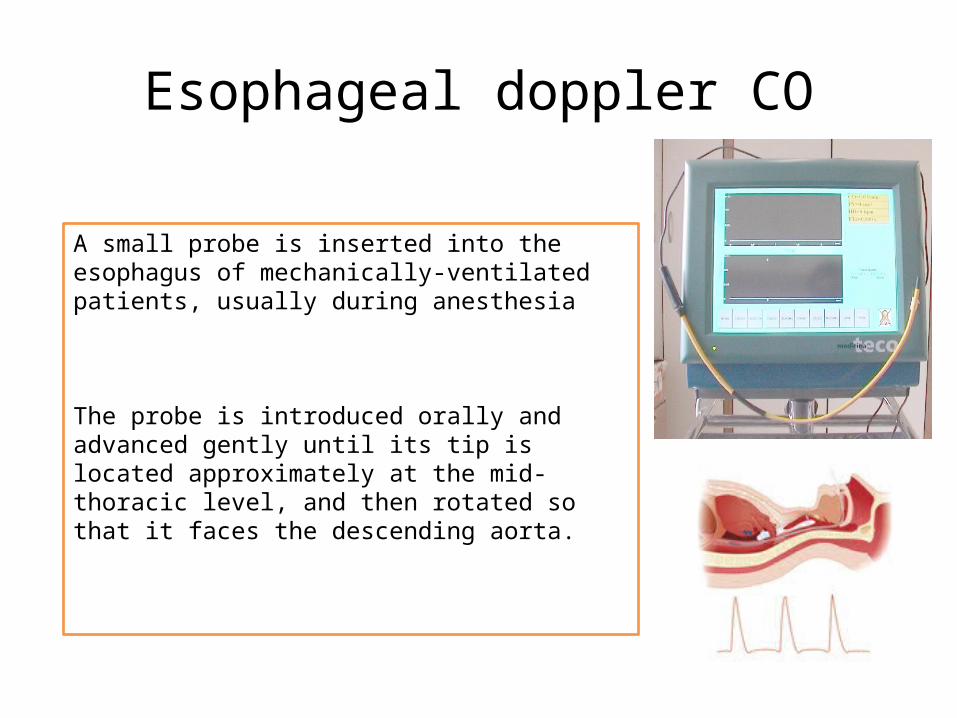
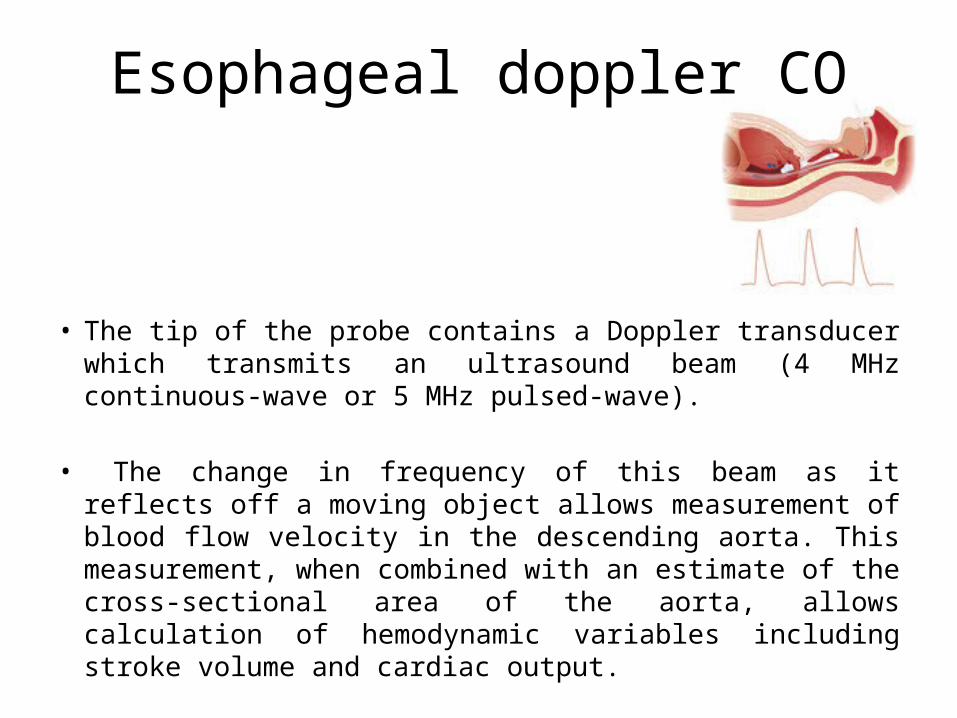
Esophageal doppler CO
A small probe is inserted into the esophagus of mechanically-ventilated patients, usually during anesthesia
The probe is introduced orally and advanced gently until its tip is located approximately at the mid-thoracic level, and then rotated so that it faces the descending aorta.
Esophageal doppler CO
• The tip of the probe contains a Doppler transducer which transmits an ultrasound beam (4 MHz continuous-wave or 5 MHz pulsed-wave).
• The change in frequency of this beam as it reflects off a moving object allows measurement of blood flow velocity in the descending aorta. This measurement, when combined with an estimate of the cross-sectional area of the aorta, allows calculation of hemodynamic variables including stroke volume and cardiac output.
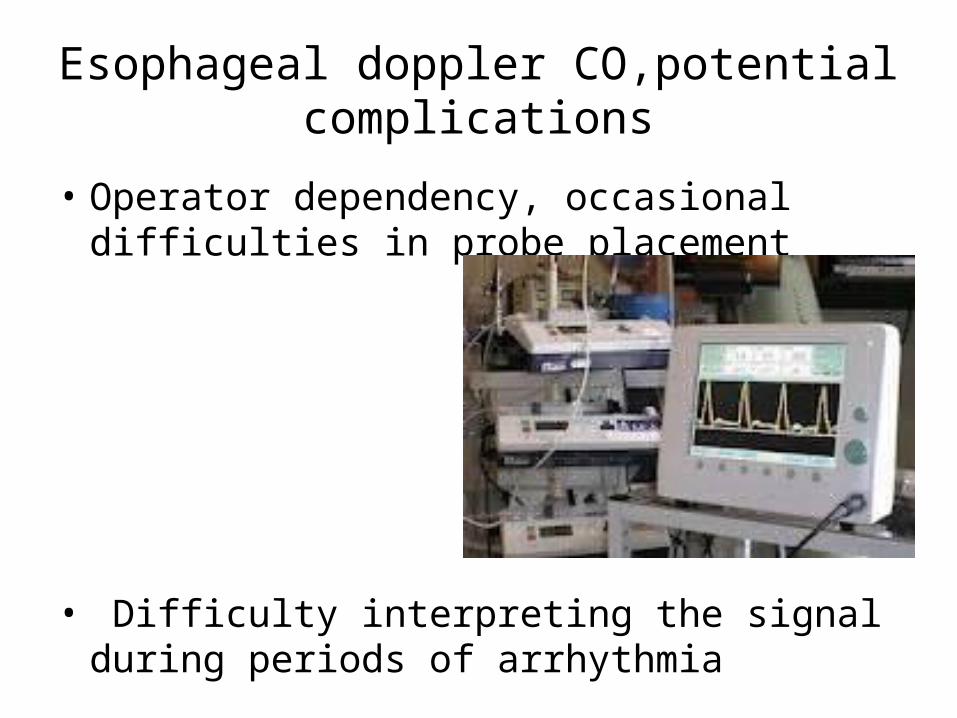
Esophageal doppler CO,potential complications
• Operator dependency, occasional difficulties in probe placement
• Difficulty interpreting the signal during periods of arrhythmia

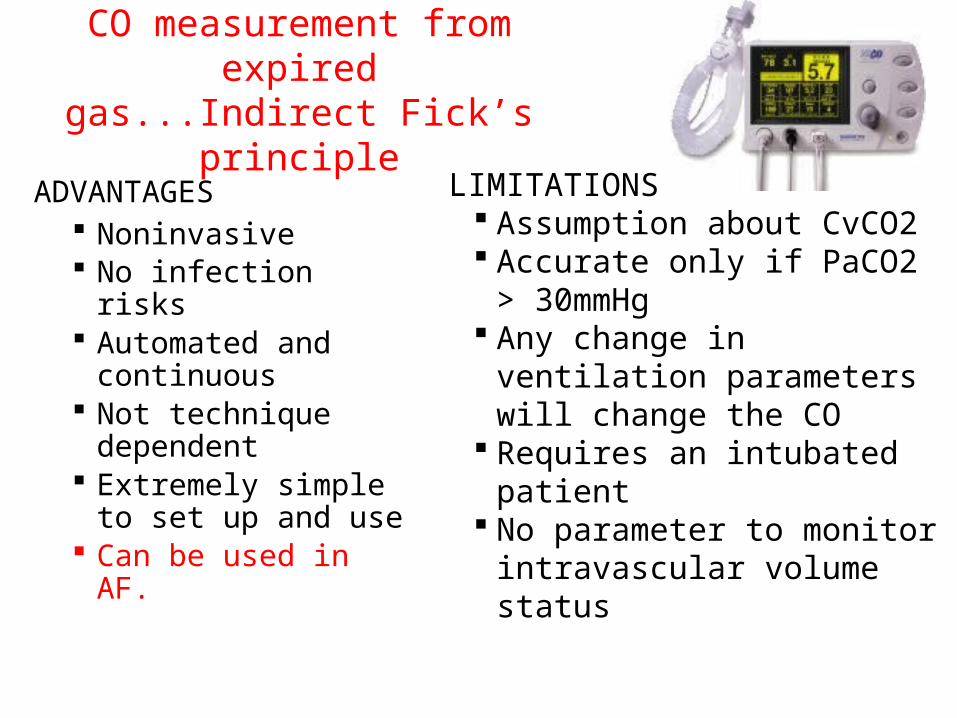
CO measurement from expired gas...Indirect Fick’s principle

CO measurement from expired gas...Indirect Fick’s principle
• Continuous cardiac output•
• Principle: Differential CO2 Fick’s partial rebreathing method
• CO= VCO2/ CvCO2-CaCO2
• To estimate CvCO2 , 150 ml of dead space is added to the ventilator circuit by opening a rebreathing valve

CO measurement from expired gas...Indirect Fick’s principle
• Cardiac output is computed on breath-by-breath measurements of CO2 elimination.
• Rebreathing measurements are made every three minutes for 35 seconds.
• Cardiac output is proportional to the change in CO2 elimination divided by the change in end tidal CO2 resulting from a brief rebreathing period.
• These measurements are accomplished and measured by the proprietary NICO Sensor, which periodically adds a rebreathing volume into the breathing circuit.
CO measurement from expired gas...Indirect
Fick’s principle
ADVANTAGES Noninvasive No infection risks Automated and
continuous Not technique
dependent Extremely simple
to set up and use Can be used in
AF.
LIMITATIONS Assumption about CvCO2 Accurate only if PaCO2 >
30mmHg Any change in ventilation
parameters will change the CO
Requires an intubated patient
No parameter to monitor intravascular volume status

THORACIC ELECTRICAL BIOIMPEDANCE
• Bioimpedance monitoring (1965) , NASA...... to estimate cardiac output non-invasively in astronauts
• Impedance ....... the resistance to alternating current• Theory of technique• The technique depends on the change in bio impedance of the
thoracic cavity during systole• The bioimpedance monitors apply a small (3 mA)
high-frequency current to the thorax and use an array of thoracic electrodes to measure the resulting potential changes to give an impedance-time or dZ/dt trace
• Cardiac output is estimated from the 0.5% variation in impedance that occurs with the cardiac cycle,
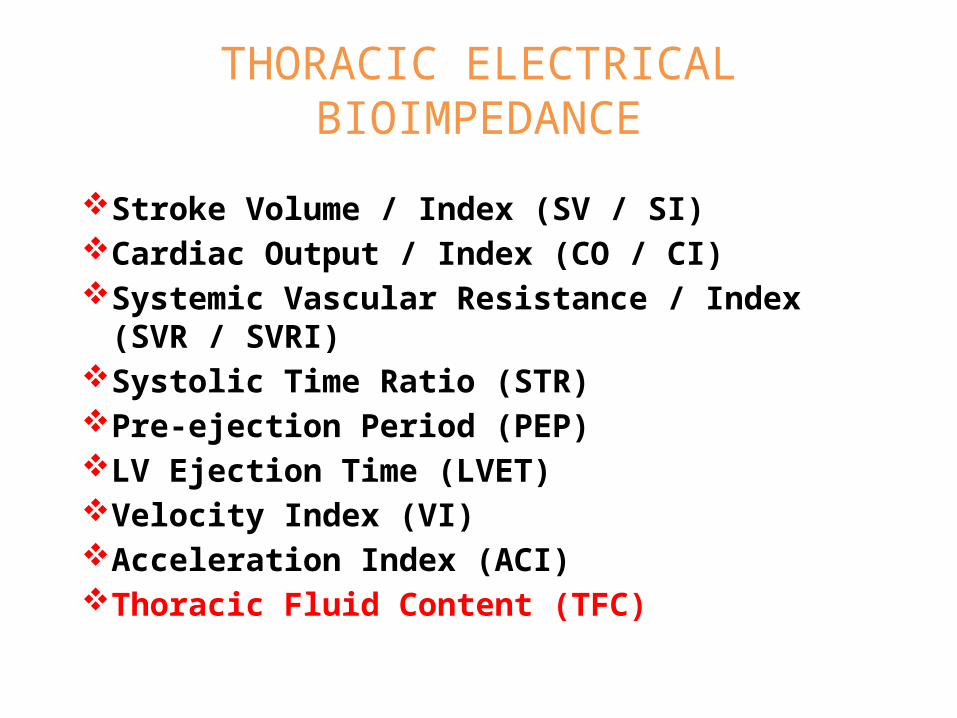
THORACIC ELECTRICAL BIOIMPEDANCE
Stroke Volume / Index (SV / SI)Cardiac Output / Index (CO / CI)Systemic Vascular Resistance / Index (SVR /
SVRI)Systolic Time Ratio (STR)Pre-ejection Period (PEP)LV Ejection Time (LVET)Velocity Index (VI)Acceleration Index (ACI)Thoracic Fluid Content (TFC)

THORACIC ELECTRICAL BIOIMPEDANCE
LIMITATIONS
Physical Height: Between 4
feet and 7 feet, 8 inches
Weight: Between 67 lbs. and 341 lbs.
Warning Pacemakers, thoracotomy, emphysema PE ARDS
Precautions
HR > 250 bpmSeptic Shock (End
stage sepsis)Severe Aortic Valve
RegurgitationExtremely High Blood
Pressure (MAP > 130) Intra-Aortic Balloon
Pump

THORACIC ELECTRICAL BIOIMPEDANCE
INTRAOPERATIVE LIMITATIONSElectrocauteryMechanical ventilation
Changes in volume in chestSurgical manipulationAssumption of hemodynamic stabilityLoose electrodes during rewarmingAcute change in tissue water, pulm edema, chest wall edemaVET from QRS: Arrythmias

LiDCO
• Principle: Indicator dilution
• A small dose of lithium chloride (0.15 -0.30 mmol) is injected via a central or peripheral venous line; the resulting arterial lithium concentration-time curve is recorded by withdrawing blood past a lithium sensor attached to the patient’s existing arterial line.

1) A bolus of Lithium isflushed through acentral or venous line
2) A Lithium sensitive sensor, attached to aperipheral arterial line, detects the concentrationof Lithium ions in the arterial blood
4) This value is then used to calibrate the LiDCOplusto give continuous cardiac output and derivedvariables from arterial waveform analysis.L i D C O ™The LiDCOplus - Lithium Indicator Dilution
16
3) The Lithium indicator dilution ‘wash-out’curve on the LiDCOplus provides anaccurate absolute cardiac output value

LiDCO
Cardiac Output = (Lithium Dose x 60)/(Area x (1-PCV))

LiDCO ADVANTAGES
Provides an absolute cardiac output value Requires no additional invasive catheters to insert
into the patient Is safe – using non-toxic bolus dosages Is simple and quick to set up Is not temperature dependent

Pulse Contour analysisFloTrac
• PRINCIPLE – PCA • Flow is determined by a pressure gradient along
a vessel and the resistance to that flow (F=P/R). • The FloTrac algorithm uses a similar principle to
measure pulsatile flow by incorporating the effects of both vascular resistance and compliance through a conversion factor known as Khi
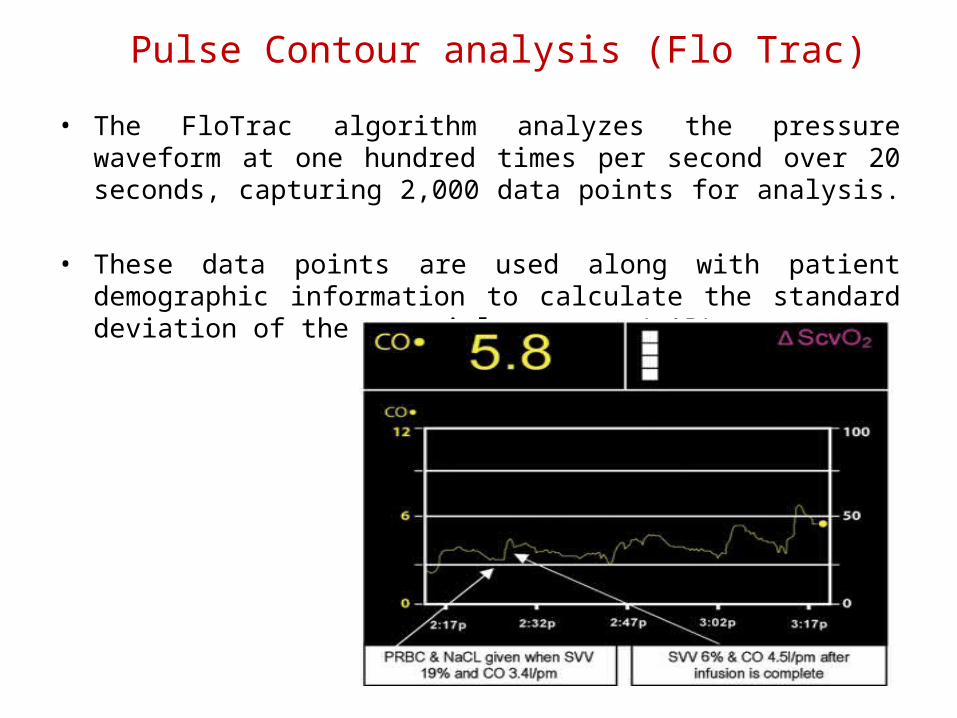
Pulse Contour analysis (Flo Trac)
• The FloTrac algorithm analyzes the pressure waveform at one hundred times per second over 20 seconds, capturing 2,000 data points for analysis.
• These data points are used along with patient demographic information to calculate the standard deviation of the arterial pressure(σAP).

Pulse Contour analysisFloTrac
The vigileo (c) and Flotrac Sensor (B) for measurement of cardiac output from area under the curve (A)

Pulse Contour analysisFloTrac
LIMITATIONSPaed. PatientsCardiac shuntsARArtherosclerosisAtrial fibrillationElderly patients with altered compliance of artery
The FloTrac sensor level is continually maintained. Intra aortic balloon pump creates artificially high
diastolic pressure Non-Invasive Blood Pressure cuff on same arm as
FloTrac™ sensor may cut arterial pressure signal off intermittently when cuff is inflated.
Long, flexible femoral catheters may be more predisposed to arterial pressure artifact
Pulse Contour analysisFloTrac
ADVANTAGES
PCA method which does not require calibrationAccounts for changes in complianceAccuracy in changing hemodynamicsParameters of fluid responsiveness (SVV)

FloTrac set upAccurate Height, Weight, Sex and Age of the Patient
If patient’s BSA changes by more than 0.1 m2----------------------check and re-enter the patient’s weight. (esp… for patients with rapid changes in weight eg.renal failure/dialysis, acute severe burns, etc.
When taking sample data, ensure. . .Patient is not agitated or coughing
Radial line or femoral line waveform artifact maybe introduced through constant movement.
Ensure stable waveforms prior to taking the data samples.Other procedures deferred during sample taking (turning
patients, bathing, suctioning, etc)Patient preferably in supine position

FloTrac: Waveform fidelity The accuracy and fidelity of the FloTrac sensor is of
importance as the cardiac output is calculated from pressures measured and waveform assessment
No “T”ing of arterial lines with other devices System is free of bubbles
Pressure bag for flush is pressurized to and maintained at 300 mmHg
Accurate zero referencing and calibration Accurate leveling of FloTrac™ sensor relevant to
patient’s Phlebostatic Axis must be maintained at all times
Case scenarios, case I
• 55 yr old, post op whipples procedure
• Post op 5th hr SpO2 100%,HR 130/min,BP 110/46mmHg,CVP 2 mmHG,Hb 8.5
• ABG N
Management????????

Case scenarios, case I
• Analgesic• Blood transfusion 1U• 6%HES 1U
• HR 82/min,BP 113/58mmHg,CVP 5 mmHg
Case scenarios, case II
• 65 yr old,FUC bronchial asthma admitted to ICU with severe respiratory distress
• Irritable,SpO2??,HR 120/min,BP 140/90,ECG sinus tachy
• ABG with mask O2 ...... PH 7.2,PO2 40,PCO2 105, BE -4.5, HCO3 20 , Na 130, K 4.2, Hb 14.5
• Intubated........ Bronchial hyegine........ Improved.... Gradual weaning.....Extubated D3 .... Calm, cooperative
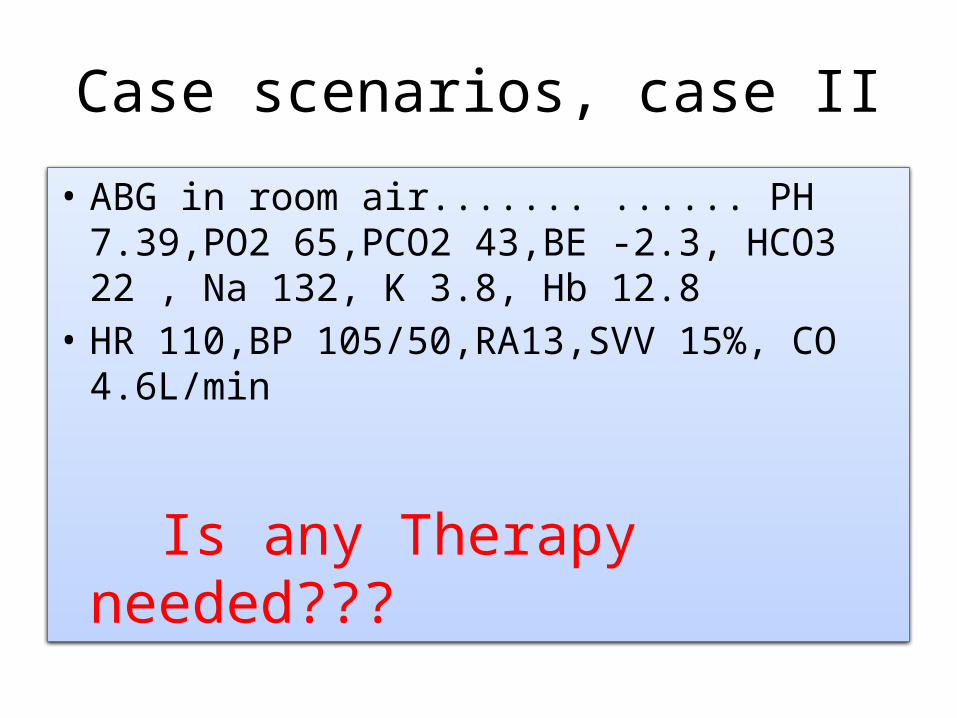
Case scenarios, case II
• ABG in room air....... ...... PH 7.39,PO2 65,PCO2 43,BE -2.3, HCO3 22 , Na 132, K 3.8, Hb 12.8
• HR 110,BP 105/50,RA13,SVV 15%, CO 4.6L/min
Is any Therapy needed???
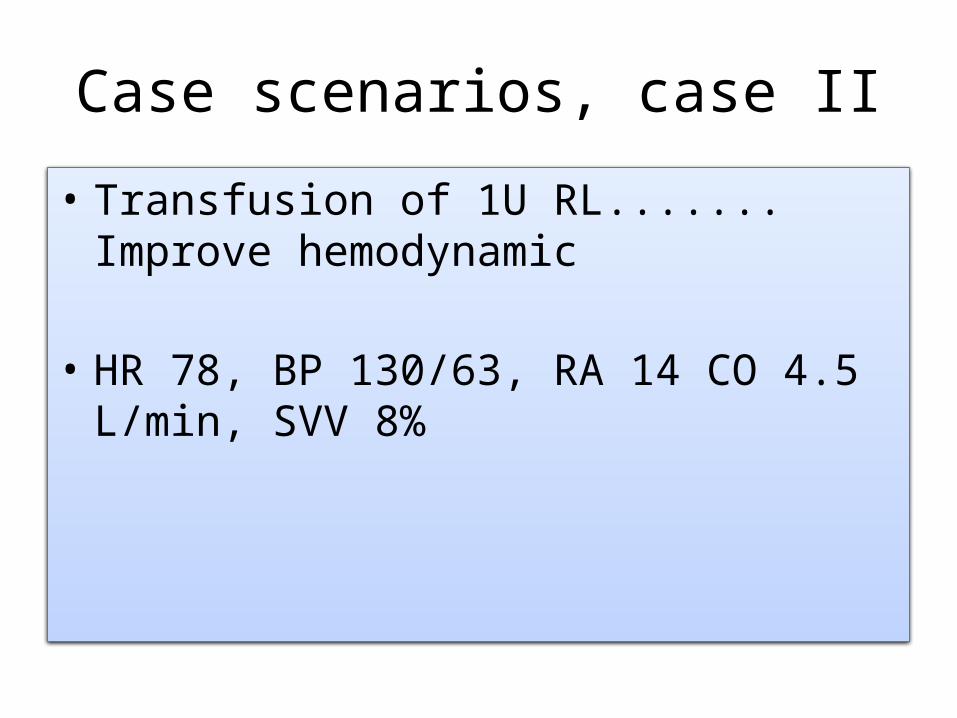
Case scenarios, case II
• Transfusion of 1U RL....... Improve hemodynamic
• HR 78, BP 130/63, RA 14 CO 4.5 L/min, SVV 8%
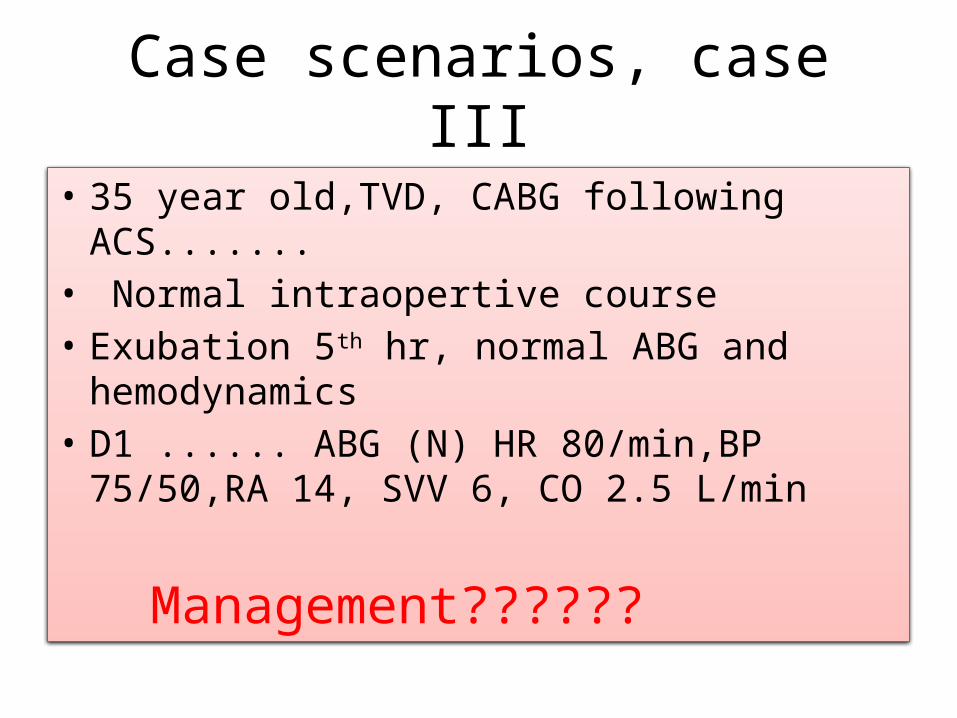
Case scenarios, case III
• 35 year old,TVD, CABG following ACS.......
• Normal intraopertive course• Exubation 5th hr, normal ABG and
hemodynamics• D1 ...... ABG (N) HR 80/min,BP 75/50,RA
14, SVV 6, CO 2.5 L/min
Management??????

Case scenarios, case III
• Fluid challenge 100 ml RL.... No response
• Adr 0.5µkg/hr,Douta 5µ kg/hr,NTG 0.5µkg/hr
• 5th hr................ ABG (N) HR 90/min,BP 105/58,RA 8, SVV 7, CO 3.9 L/min
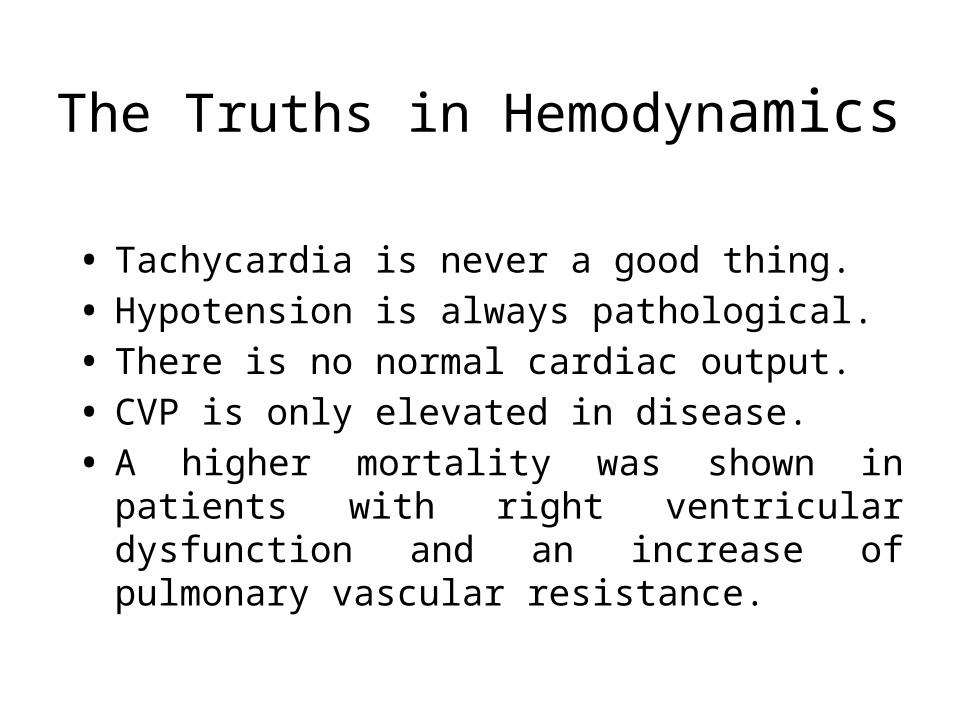
• Tachycardia is never a good thing.• Hypotension is always pathological.• There is no normal cardiac output.• CVP is only elevated in disease.• A higher mortality was shown in
patients with right ventricular dysfunction and an increase of pulmonary vascular resistance.
The Truths in Hemodynamics

The Truths in Hemodynamic Monitoring
• Monitors associate with inaccuracies, misconceptions and poorly documented benefits.
• A good understanding of the pathophysiological underpinnings for its effective application across patient groups is required.
• Functional hemodynamic monitors are superior to conventional filling pressure.
• The goal of treatments based on monitoring is to restore the physiological homeostasis.

ANY IDEAL SYSTEM?
Ideal• Non invasive• Accurate• Reliable• Continuous• Compatible in paed. Pts.• Reproducible• Fast response• Operator independent

Questions??????????????


