
National Grid Niagara Mohawk Power Corporation INVESTIGATION AS TO THE PROPRIETY OF PROPOSED ELECTRIC TARIFF CHANGES Testimony and Exhibits of: Maureen P. Heaphy Richard F. Meischeid David Lister Book 3 January 29, 2010 Submitted to: New York Public Service Commission Docket No. 10-E-____ Submitted by:

Testim
ony of
Maureen P. H
eaphy

Before the Public Service Commission
NIAGARA MOHAWK POWER CORPORATION d/b/a NATIONAL GRID
Direct Testimony
of
Maureen P. Heaphy
Vice President, U.S. Compensation and Benefits Dated: January 29, 2010
1

Testimony of Maureen P. Heaphy
Table of Contents I. Introduction and Qualifications ...................................................................1 II. Purpose of Testimony ..................................................................................2 III. Overview of National Grid’s Approach to Wages and Benefits..................5 IV. Cash Compensation .....................................................................................9 V. Non-Union Wages .....................................................................................22 VI. Union Wages..............................................................................................25 VII. Benefit Plans ..............................................................................................26 VIII. Pensions and OPEBs..................................................................................33 IX. Conclusion .................................................................................................51
2

Testimony of Maureen P. Heaphy
Page 1 of 51
I. Introduction and Qualifications 1
Q. Please state your name and business address. 2
A. My name is Maureen P. Heaphy. My business address is One MetroTech 3
Center, Brooklyn, New York 11201. 4
5
Q. By whom are you employed and in what capacity? 6
A. I am employed by National Grid USA Service Company, Inc., a 7
subsidiary of National Grid plc (“National Grid”), and currently hold the 8
position of Vice President of U.S. Compensation and Benefits. My 9
responsibilities include overseeing compensation and benefit strategy and 10
policy for all of National Grid’s US operations, including Niagara 11
Mohawk Power Corporation d/b/a National Grid (“Niagara Mohawk” or 12
“Company”). 13
14
Q. Please describe your educational background and business 15
experience. 16
A. I received Bachelor of Science degrees in Accounting and Computer 17
Applications & Information Systems from New York University in 1983. 18
In 1991, I received a Master of Business Administration in Finance from 19
St. John’s University. I joined National Grid’s predecessor, the former 20
3

Testimony of Maureen P. Heaphy
Page 2 of 51
KeySpan Corporation, in 1983 and held several professional and 1
managerial positions in Treasury and Accounting. In 1991, I joined the 2
Human Resources organization where my focus has been on design, 3
strategy, administration, and implementation of compensation and benefit 4
programs for employees and retirees. 5
6
Q. Have you previously testified before the New York Public Service 7
Commission (“PSC” or “Commission”) or any other regulatory 8
commissions? 9
A. I have previously testified before the Federal Energy Regulatory 10
Commission on behalf of National Grid Generation, LLC concerning 11
matters related to employee benefits and compensation. I have not 12
testified before the PSC previously. 13
14
II. Purpose of Testimony 15
Q. What is the purpose of your testimony? 16
A. The purpose of my testimony is to support the overall level of employee 17
compensation and benefits costs reflected in Niagara Mohawk’s electric 18
business unit base rate filing and to demonstrate that National Grid has 19
proactively managed and controlled the costs of its compensation and 20
benefits programs. Specifically, my testimony addresses and supports the 21
4

Testimony of Maureen P. Heaphy
Page 3 of 51
Company’s employee compensation and benefit costs, including those 1
associated with medical, dental, life insurance, 401-K savings, pension 2
and other post-employment benefit (“OPEB”) plans for the test year ended 3
September 30, 2009 and the forecasted rate years ending December 31, 4
2011, 2012 and 2013. The information concerning projected costs 5
changes has been provided to the Revenue Requirements Panel and was 6
used to develop the revenue requirement proposed by the Company in this 7
proceeding. 8
9
I demonstrate that the costs of the total compensation and benefit 10
programs included in Niagara Mohawk’s revenue requirement, which 11
include the costs of base salary and performance-based variable pay and 12
various benefits, are reasonable and necessary and must be incurred by the 13
Company in order to meet its obligations to provide safe and reliable 14
utility service to its customers. I also explain specifically why the costs of 15
the variable pay plan should be reflected in the revenue requirement and 16
how that plan is structured to align the interests of the Company with its 17
customers. Finally, I discuss the Company’s ongoing efforts to monitor 18
and control the costs of various elements of the Company’s employee 19
compensation and benefits package. Certain of the conclusions set forth in 20
5

Testimony of Maureen P. Heaphy
Page 4 of 51
my testimony are supported by the testimony and exhibits of Richard 1
Meischeid of Towers Watson, who is testifying separately. 2
3
Q. Do you sponsor any exhibits as part of your testimony? 4
A. Yes, I am sponsoring the following exhibits, which were prepared or 5
compiled under my direction and supervision: 6
(i) Exhibit __ (MPH-1) National Grid’s Employee Guide To The 7
Annual Performance Plan; 8
(ii) Exhibit __ (MPH-2) Sample “Performance For Growth” forms 9
for Company employees; 10
(vi) Exhibit __ (MPH-3) National Grid Union and Non-Union Wage 11
Increase History (2000-2009); 12
(v) Exhibit __ (MPH-4) National Grid USA - Union Wage 13
Comparisons; 14
(vi) Exhibit __ (MPH-5) National Grid – BENVAL Analysis for 2009 15
Non-Union Benefits; and 16
(vii) Exhibit __ (MPH-6) National Grid – BENVAL Analysis for 17
Legacy National Grid New York Union 18
Benefits. 19
20
21
6

Testimony of Maureen P. Heaphy
Page 5 of 51
III. Overview of National Grid’s Approach to Wages and Benefits 1
Q. Please briefly describe how the human resources function is 2
administered at National Grid. 3
A. National Grid employs a service company structure to enable it to provide 4
service to its U.S.-based operations in the most efficient manner possible. 5
As a consequence of this structure, the employee compensation and 6
benefits costs included in the Company’s filing in this proceeding 7
originate primarily from one of three entities, Niagara Mohawk itself, 8
National Grid USA Services Company, or KeySpan Services Company. 9
Compensation and benefit costs are administered on a centralized basis 10
and uniform compensation and benefit policies have been instituted for all 11
of National Grid’s U.S.-based operations, including Niagara Mohawk. 12
13
Q. Is a portion of the Company’s workforce unionized? 14
A. Yes. The vast majority of the Company’s employees are members of the 15
International Brotherhood of Electric Workers Local 97 (“IBEW”). The 16
total compensation for these workers is determined by collective 17
bargaining. 18
19
Q. Please describe National Grid’s philosophy relating to employee 20
wages and benefits. 21
7

Testimony of Maureen P. Heaphy
Page 6 of 51
A. In order to provide safe and reliable utility service to its customers, 1
National Grid must attract and retain high-performing, qualified personnel. 2
To accomplish this, National Grid provides a total compensation package 3
that recognizes and rewards excellence, maintains fair and competitive 4
market pay and benefits for employees, and encourages employees to 5
improve skills while providing a safe working environment. Doing so 6
under the cost containment pressures faced by all companies is a critical 7
challenge. To meet this challenge, National Grid has developed a policy 8
called the “Total Rewards Program” to provide employees with an overall 9
compensation and benefits package that is market competitive, offers 10
flexibility and choice, and supports a high performance culture by directly 11
linking performance to rewards. By maintaining a comprehensive and 12
competitive approach to total rewards that establishes appropriate levels of 13
pay and benefits, National Grid can attract and retain a high quality 14
workforce and motivate employees to improve their performance. 15
16
Q. What are the elements of the total compensation package provided to 17
employees? 18
A. The elements of the total compensation package provided to employees 19
are cash compensation, which includes both fixed and variable pay, and a 20
number of benefits, which include medical and dental plans, life 21
8

Testimony of Maureen P. Heaphy
Page 7 of 51
insurance, a 401-K savings plan, pensions and OPEBs, and vacations and 1
holidays. 2
3
Q. Please describe National Grid’s efforts to measure the reasonableness 4
of the cost of the wages and benefits it offers to employees. 5
A. As part of its effort to control the cost of compensation and benefits, 6
National Grid monitors the marketplace to ensure that its cash 7
compensation and benefit programs are both cost-effective and sufficient 8
to enable it to attract and retain the highly skilled workforce needed to 9
deliver excellent customer service and achieve the financial success 10
required by the capital markets. 11
12
Q. Have there been any recent changes in National Grid’s overall 13
approach to employee compensation? 14
A. Yes. The most recent changes to National Grid’s pay and benefits 15
structure were implemented as a result of the merger process associated 16
with the acquisition of KeySpan Corporation (“KeySpan”). As part of the 17
integration process related to that merger, National Grid commissioned a 18
market analysis of its wages and benefits to help align the two companies. 19
While the overall value of the compensation programs at the two 20
companies was roughly equivalent prior to the merger for similar sized 21
9

Testimony of Maureen P. Heaphy
Page 8 of 51
roles and service territories, the relationship between pay and benefits 1
differed, with legacy National Grid providing more value to employees 2
through fixed cost benefit plans and less value through variable pay. The 3
market analysis showed that the legacy KeySpan approach of providing 4
less costly benefit plans but a greater level of variable pay was more in 5
line with what other comparable employers were providing. 6
7
National Grid believed that changing its approach to be more in line with 8
the prior KeySpan approach would be beneficial, not only because it 9
would better position the merged company to be competitive with the 10
compensation structure offered by other similar employers, but also 11
because it would better align the compensation structure with National 12
Grid’s efforts to achieve its goals – goals that National Grid believes are 13
shared by its customers, its regulators, and its shareholders. As a result, 14
National Grid undertook to modify the benefits it offers by reducing the 15
fixed cost components (i.e. medical, dental, life insurance, and other 16
benefits) of those programs, while at the same time increasing the variable 17
component of pay, and tying the achievement of variable pay to stretch 18
objectives. I discuss the modifications to the benefits platform later in my 19
testimony. 20
21
10

Testimony of Maureen P. Heaphy
Page 9 of 51
IV. Cash Compensation 1
Q. Please explain how National Grid establishes the levels of cash 2
compensation provided to non-union employees. 3
A. National Grid’s cash compensation program includes two major 4
components: base pay and variable pay. Both components are necessary 5
elements of a total compensation package needed to attract and retain 6
qualified personnel. Taken together, the two components of cash 7
compensation permit National Grid to offer a level of compensation 8
required by the marketplace, but in a manner that structures a portion of 9
the cash compensation so that it is tied to achievement of goals that are 10
consistent with corporate objectives that benefit the Company and its 11
customers. National Grid’s overall cash compensation, fixed and variable, 12
is designed to be competitive with the median, or 50th percentile, level of 13
cash compensation provided in the marketplace. In other words, the fixed 14
component of National Grid’s cash compensation is not sufficient by itself 15
to be competitive with the marketplace. It is the combination of fixed and 16
variable pay that permits National Grid’s overall cash compensation to 17
reach competitive levels. If National Grid did not provide variable pay, it 18
likely would not be able to attract the type of employees it seeks to hire 19
because its total cash compensation package would not be competitive. 20
21
11

Testimony of Maureen P. Heaphy
Page 10 of 51
Q. How does National Grid define and determine the median 1
compensation levels for non-union employees? 2
A. National Grid’s total non-union cash compensation is approximately equal 3
to the level, on average, necessary to compensate employees at the median 4
level of salaries for equivalent functions in the geographic region in which 5
the employees work. To determine the median compensation level for 6
non-union employees, National Grid benchmarks positions within each 7
salary level and compares overall compensation (base pay plus variable 8
pay for the benchmarked jobs to the 50th percentile of overall 9
compensation for comparable jobs in similar size companies. The base 10
and variable components of overall compensation for these benchmark 11
positions and those in the same band or level are adjusted periodically to 12
capture actual practices of companies in the survey database. National 13
Grid utilizes market data surveys provided by Towers Watson to 14
determine the 50th percentile of the relevant market. The methodology 15
used to conduct such surveys and the results thereof are discussed by Mr. 16
Meischeid. A copy of the most recent study is attached to Mr. 17
Meischeid’s testimony as Exhibit __ (RFM-1). 18
19
12

Testimony of Maureen P. Heaphy
Page 11 of 51
Q. You mentioned that salaries of employees are intended, on average, to 1
approximate median compensation levels. Do individual employee 2
salaries deviate from these levels? 3
A. Yes. Individual salaries deviate above and below the median levels based 4
on individual performance and length of time in a position. 5
6
Q. Is the officer compensation program similar in philosophy and 7
operation to the non-union cash compensation program? 8
A. Yes. The approach taken with respect to officer compensation is basically 9
the same as I described for the non-union employee program. Overall 10
compensation for officers, including National Grid’s top officers, is 11
benchmarked to the 50th percentile and includes a variable pay component 12
tied to the achievement of individual and Company financial, customer 13
service, reliability, and safety goals, as with the non-union program. For 14
purposes of establishing the revenue requirement in this proceeding, the 15
Company has included payroll expense for only the fixed, base pay 16
component of the officer compensation package. The variable pay 17
component of overall officer compensation for National Grid’s officers is 18
not included in the revenue requirement. 19
20
Q. Please describe National Grid’s variable pay program. 21
13

Testimony of Maureen P. Heaphy
Page 12 of 51
A. National Grid’s variable pay program is known as Performance for 1
Growth (“P4G” or “the Plan”). The Plan was introduced in 2007 with the 2
purpose of ensuring that employees are working towards common goals 3
and that high performance is recognized. The Plan is intended to motivate 4
employees to achieve the highest possible individual performance, while 5
ensuring that at all times, all safety, health, and environmental 6
requirements are adhered to, standards of customer service are achieved, 7
and shareholder expectations are reached. In short, the Plan is designed so 8
that all stakeholders benefit. Stretch financial targets and individual 9
objectives are set, as soon as practicable, after the start of the Plan year 10
(April each year). Fifty percent (50%) of the Plan payout is based on 11
financial measures applicable to National Grid and fifty percent (50%) is 12
based on individual measures (measures that support customer 13
satisfaction, safety, and reliability objectives). 14
15
Q. Please elaborate on the goals established under the Plan. 16
A. The objectives established as part of the variable pay component of the 17
Company’s cash compensation are designed to provide direct and specific 18
incentives to employees to achieve or exceed specified customer 19
satisfaction, reliability, safety, financial, and other operating goals. The 20
financial objectives are tied to earnings per share, net operating profit, and 21
14

Testimony of Maureen P. Heaphy
Page 13 of 51
cash flow at National Grid, not Niagara Mohawk. Individual objectives 1
relate to safety, reliability, and customer satisfaction targets that are 2
aligned with Niagara Mohawk’s service quality standards and vary 3
depending on the part of the business in which an employee works. 4
National Grid believes that the attainment of these objectives provides 5
real, albeit unquantifiable benefits to customers. Exhibit __ (MPH-1) is 6
the Plan guide provided to non-union employees. This guide explains the 7
performance elements of the Plan and the potential value to participants 8
for achieving them. Exhibit __ (MPH-2) is a sample of Performance for 9
Growth Forms that set forth goals and objectives for Niagara Mohawk’s 10
electric business unit employees’ under the Plan. This exhibit provides an 11
example of how Commission-approved safety, reliability, and/or customer 12
satisfaction goals are included in the Plan. 13
14
Q. Please explain why National Grid includes a variable pay component 15
as part of total cash compensation for its employees. 16
A. Variable cash compensation provides direct and specific incentives to 17
employees to achieve or exceed certain operating performance goals of 18
importance to the Company and its customers, including the customer 19
service, safety, and reliability metrics the Commission has approved for 20
Niagara Mohawk, as well as certain financial metrics. Accordingly, the 21
15

Testimony of Maureen P. Heaphy
Page 14 of 51
variable pay component of the Company’s overall employee compensation 1
package aligns the interests of National Grid and Niagara Mohawk to the 2
interests of its customers, and assists the Company in meeting its public 3
policy objectives. Moreover, as noted above, under National Grid’s cash 4
compensation structure, base pay alone is not an adequate level of 5
compensation to allow National Grid to pay salaries at or near the median 6
level of compensation paid by other similarly situated companies, which is 7
the level of cash compensation that National Grid believes it needs to pay 8
in order to recruit and retain well qualified employees to provide safe, 9
reliable, and efficient service to customers. Today’s marketplace dictates 10
that variable pay is a fundamental component of any private sector entity’s 11
efforts to attract qualified employees. Top talent in the market demands 12
compensation that is directly linked to performance. In order for National 13
Grid to compete in this marketplace and be viewed as an employer of 14
choice, a competitive level of variable pay must be a part of the overall 15
compensation package. If National Grid did not have a competitive 16
variable pay component, it would be out of step with the market and likely 17
would not be able to attract the same type of highly motivated employees 18
necessary for the Company to deliver outstanding customer service in a 19
reliable, efficient, and safe manner. In sum, National Grid’s approach to 20
variable pay is designed to ensure that (1) employees’ total compensation 21
16
Testimony of Maureen P. Heaphy
Page 15 of 51
is approximately comparable to average pay for comparable positions and 1
is reasonable after considering base and variable pay on an aggregate 2
basis; (2) variable pay is based on both the overall performance of 3
National Grid and the performance of the individual; and (3) individual 4
and Company performance goals reflect objectives that create benefits for 5
customers. 6
7
Q. Is there objective market data that supports your claim that a cash 8
compensation program consisting of both fixed and variable pay 9
components is necessary to enable National Grid to attract and retain 10
qualified employees? 11
A. Exhibit __ (RFM-2) to Mr. Meischeid’s testimony provides an analysis of 12
National Grid’s base salary and target total compensation compared to the 13
market. This summary was performed by Towers Watson. For each of 14
the market salary bands, a comparison of National Grid’s base salary to 15
the market average base salary indicates comparable levels, but without a 16
variable pay component, National Grid’s base salaries would need to 17
increase in order to offer a competitive compensation package. The data 18
provided in Mr. Meischeid’s testimony demonstrates that (i) the 19
Company’s total cash compensation is consistent with market levels, and 20
17

Testimony of Maureen P. Heaphy
Page 16 of 51
(ii) the use of variable compensation by companies that are equivalent in 1
size to National Grid is almost universal. 2
3
Q. Does compensation for union employees also include a variable pay 4
component? 5
A. Yes. Variable pay gives union employees a stake in the Company’s 6
performance and provides direct incentives for employees to strive to meet 7
or exceed metrics tied to safe, reliable, and efficient performance, which, 8
in turn, results in better service for customers. As with the non-union 9
program, the variable compensation component is part of, not in addition 10
to, the total compensation package designed to link rewards and results. 11
Because this philosophy toward compensation is an important part of 12
National Grid’s effort to deliver value to customers as well as 13
shareholders, including a component of variable pay as a component of 14
compensation even for union employees has been one of National Grid’s 15
priorities in labor negotiations. Under the current collective bargaining 16
agreement with the IBEW, the union workers participate in a variable pay 17
plan with a target payment of 3.5% of total pay. The plan has similar 18
goals to the Plan for non-union workers. 19
20
18

Testimony of Maureen P. Heaphy
Page 17 of 51
Q Is it your testimony that the variable pay plan at National Grid is not 1
a bonus plan? 2
A. Yes, that is correct. National Grid’s variable pay plan is not a bonus plan, 3
as it is designed to be part of a total compensation program; it is a pay-at-4
risk plan, not extra or bonus pay. The variable pay component is labeled 5
“pay at risk” because if performance measures are not achieved, 6
employees will not receive the variable pay component. 7
8
Q. How has the Company determined the level of variable pay expenses 9
included in the revenue requirements proposed in this proceeding? 10
A. Before addressing that question, I want to acknowledge that the Company 11
is aware that in previous rate cases, the Commission and various parties 12
have expressed concerns that if a level of variable compensation is 13
included in rates and then ultimately not paid, the end result will be a 14
windfall for shareholders. To address this concern, the Company proposes 15
that if the variable compensation amounts reflected in rates are not paid to 16
employees for any reason, then the Company will defer any such unpaid 17
amounts plus appropriate carrying costs, so that such unpaid amounts can 18
be returned to customers. 19
20
19
Testimony of Maureen P. Heaphy
Page 18 of 51
Having said this, the Company is proposing to include approximately 1
$19.2 million of variable compensation expenses in its revenue 2
requirement in this proceeding for the rate year ending December 31, 3
2011; approximately $19.7 million in the revenue requirement for the rate 4
year ending December 31, 2012; and approximately $20.3 million in the 5
revenue requirement for the rate year ending December 31, 2013. The 6
adjustments to the amount included in the second and third rate years 7
reflect the application of an inflation factor as discussed in the testimony 8
of the Revenue Requirements panel. In determining the $19.2 million of 9
variable pay included in the first rate year, which is then adjusted for 10
inflation and carried forward to the second and third rate years, the 11
Company has assumed that: (i) with respect to the fifty percent of the 12
potential variable pay payouts associated with the attainment of financial 13
goals by non-union workers, National Grid will attain targeted levels of 14
performance and payout in each rate year; (ii) with respect to the fifty 15
percent of potential variable pay payouts associated with individual 16
objectives by non-union workers, the Company will attain the 17
performance level and payout realized in the test year; and (iii) with 18
respect to the payouts to union workers, the Company will attain the 19
targeted level of performance and payout realized in the test year. 20
21
20

Testimony of Maureen P. Heaphy
Page 19 of 51
Q. What do you mean by “target levels?” 1
A. “Target levels” represent a level of performance that is judged to be 2
approximately forty-five percent (45%) of stated maximums. Target 3
performance is best described as an above average level of performance 4
that is consistent with overall expectations. Achieving target performance 5
requires employees to perform at a high, but nonetheless expected level. 6
High performers would exceed “target levels” while average or below 7
average performers would fall below “target levels.” 8
9
Q. Are you aware that certain Commission decisions have stated that 10
variable pay plans that include financial parameters must be self 11
supporting through productivity savings or financed by shareholders? 12
A. Yes, I am. It is my understanding that in prior decisions, the Commission 13
has expressed two broad concerns. The first concern is that if variable pay 14
expenses are reflected in rates, and the variable compensation is not paid 15
to employees, shareholders will receive a windfall at the expense of 16
customers. I have already addressed this concern by proposing that any 17
unpaid variable pay expenses reflected in rates will be deferred for the 18
benefit of customers. 19
20
21

Testimony of Maureen P. Heaphy
Page 20 of 51
The second concern is reflected in the Commission’s July 19, 1991 order 1
in Case 90-G-0734, a proceeding involving National Fuel Gas Distribution 2
Corporation (“National Fuel”) in which the Commission stated: 3
Without regard to whether the Incentive Plan payments 4 constitute a salary increase to management employees, the 5 Incentive Plan will only provide compensation to 6 management employees who meet certain goals. Since, in 7 this case, the goals are related to financial parameters, it is 8 only reasonable to expect that if those goals are met, there 9 will be cost savings, which have not been reflected in the 10 revenue requirement. In that case, the savings would offset 11 the costs of the plan and the plan would be self-supporting. 12 Failure to reflect those savings would provide the Company 13 a windfall at ratepayer expense. 14
15
As I have discussed previously, the financial goals reflected in National 16
Grid’s variable pay Plan are not tied directly to the financial performance 17
of Niagara Mohawk; they are tied to the financial performance of National 18
Grid. As a consequence, it is not the case, as it apparently was in the 19
National Fuel decision, that Niagara Mohawk must achieve savings that 20
are not reflected in the revenue requirement in order for National Grid to 21
achieve its enterprise-wide financial goals. On the contrary, to the extent 22
that the performance of Niagara Mohawk ultimately contributes to the 23
attainment of National Grid’s financial goals, this result likely will be 24
achieved because the Company is able to realize the tremendous synergy, 25
productivity, and efficiency savings that are already built into Niagara 26
22

Testimony of Maureen P. Heaphy
Page 21 of 51
Mohawk’s revenue requirement in this case. National Grid has no 1
expectation that Niagara Mohawk can realistically expect to achieve 2
savings beyond the level that the Company proposes to reflect in rates. 3
Moreover, imputing additional savings in order to offset the costs of the 4
variable pay Plan would do nothing more than deprive the Company of the 5
opportunity to recover a necessary and legitimate business expense 6
associated with a market-based level of cash compensation. 7
8
The broad financial goals reflected in National Grid’s variable pay Plan 9
are intended to ensure that employees do not forsake cost effectiveness 10
and efficiency while pursuing their individual goals. This is consistent 11
with Commission policy that encourages the Company to pursue a variety 12
of customer service, safety, and reliability goals in a cost effective manner. 13
14
The financial parameters reflected in National Grid’s variable pay Plan are 15
not dominant goals that will cause Niagara Mohawk personnel to focus on 16
the attainment of financial objectives to the exclusion of other goals. 17
Instead, the National Grid Plan reflects a reasonable balancing of financial 18
objectives with individual safety, reliability, customer service, and other 19
worthwhile goals. 20
21
23

Testimony of Maureen P. Heaphy
Page 22 of 51
Q. You mentioned before that the Company is proposing to refund to 1
customers any variable pay amounts that are reflected in rates but 2
ultimately not paid to customers. Are you concerned that such a 3
“downward only” reconciliation could lead management to be less 4
than rigorous in evaluating performance and making variable pay 5
awards? 6
A. No. Assuming that there is a legitimate basis for this concern -- and there 7
is not -- as I stated before, the Company is not proposing to recover in 8
rates the portion of variable pay expense that may be paid to officers. 9
Because the same basic criteria are applied in determining whether 10
variable pay is provided to officers or other employees, the Company has 11
no incentive to authorize variable pay that has not been earned. Moreover, 12
the criteria for determining whether variable pay is earned are primarily 13
objective. 14
15
V. Non-Union Wages 16
Q. Did the Company increase non-union wages in the test year ending 17
September 30, 2009? 18
A. Yes. Consistent with the Commission’s orders that encouraged austerity, 19
the Company revised its plan to increase non-union wages downward from 20
what was originally forecast in 2009. The Company increased non-union 21
24
Testimony of Maureen P. Heaphy
Page 23 of 51
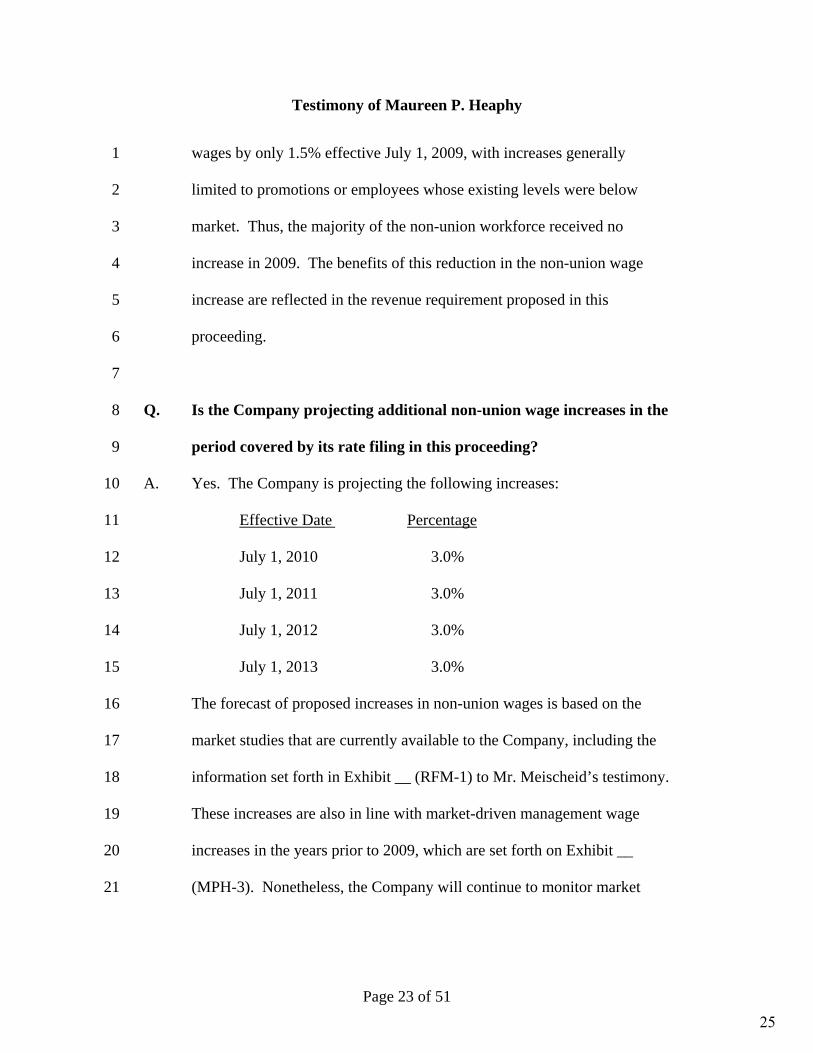
wages by only 1.5% effective July 1, 2009, with increases generally 1
limited to promotions or employees whose existing levels were below 2
market. Thus, the majority of the non-union workforce received no 3
increase in 2009. The benefits of this reduction in the non-union wage 4
increase are reflected in the revenue requirement proposed in this 5
proceeding. 6
7
Q. Is the Company projecting additional non-union wage increases in the 8
period covered by its rate filing in this proceeding? 9
A. Yes. The Company is projecting the following increases: 10
Effective Date Percentage 11
July 1, 2010 3.0% 12
July 1, 2011 3.0% 13
July 1, 2012 3.0% 14
July 1, 2013 3.0% 15
The forecast of proposed increases in non-union wages is based on the 16
market studies that are currently available to the Company, including the 17
information set forth in Exhibit __ (RFM-1) to Mr. Meischeid’s testimony. 18
These increases are also in line with market-driven management wage 19
increases in the years prior to 2009, which are set forth on Exhibit __ 20
(MPH-3). Nonetheless, the Company will continue to monitor market 21
25

Testimony of Maureen P. Heaphy
Page 24 of 51
information and may revise its projections if market conditions require 1
such adjustments. 2
3
Q. Does the Company believe that its projected non-union wage increases 4
are consistent with the Commission orders that have encouraged 5
austerity? 6
A. Yes. My understanding of the Commission’s orders directing the State’s 7
utilities to continue to identify austerity measures is that the Commission 8
is encouraging utilities to hold discretionary spending to the lowest 9
possible level. National Grid follows this policy in administering its 10
human resources function as a matter of normal business practice. At the 11
same time, however, if the Company fails to keep pace with market 12
conditions, its ability to attract and retain qualified personnel will be 13
unreasonably jeopardized. Thus, National Grid must continue to provide 14
employee compensation at levels consistent with market conditions. 15
National Grid can best comply with the Commission’s directives 16
concerning austerity by continuing to monitor market conditions closely 17
and ensuring that no expense is increased beyond the level needed to meet 18
the requirements of the marketplace. 19
20
21
26

Testimony of Maureen P. Heaphy
Page 25 of 51
VI. Union Wages 1
Q. Does National Grid follow the same compensation philosophy with 2
regard to its union employees as it does for its non-union employees? 3
A. Yes. However, the compensation provided to the IBEW workers is the 4
result of collective bargaining with the union. In August 2009, the 5
Company and IBEW entered into an agreement extending the existing 6
contract through March 31, 2014. Pursuant to the agreement, union 7
workers were provided a base wage increase of 3% on April 1, 2009, and 8
will be provided base wage increases of 3% on April 1, 2010, and 2.5% on 9
April 1, 2011, April 1, 2012, and April 1, 2013, respectively. 10
11
Q. What steps does National Grid take to ensure that the union wages it 12
pays are reasonable? 13
A. For union employees, National Grid obtains information regarding hourly 14
pay rates from surrounding utilities to measure the competitiveness of 15
union pay levels. Exhibit __ (MPH-4) shows a recent comparison of pay 16
levels for key union jobs among a number of New York utilities. As the 17
exhibit shows, National Grid’s wage rates are within the range of these 18
other utilities. In addition, the Company established a new wage schedule 19
for newly hired employees who belong to IBEW Local 97, in an effort to 20
contain costs in the customer contact center. The new wage scale creates a 21
27

Testimony of Maureen P. Heaphy
Page 26 of 51
center that can operate competitively compared to the call center 1
marketplace. As of this filing, 127 employees are working under the new 2
wage scale agreement. In addition, the benefits afforded to this population 3
do not include pensions, so each new hire creates no new pension cost. 4
5
VII. Benefit Plans 6
Q. Please describe the benefit package that is offered to employees of 7
National Grid. 8
A. National Grid provides a variety of employee health and welfare and 9
pension and OPEB plans to its union and non-union employees. Benefit 10
plans are offered for medical coverage, dental coverage, life insurance 11
coverage, and long-term disability coverage. There are also paid vacations 12
and holidays. In addition, employees are offered a defined benefit pension 13
plan, a defined contribution or 401-K plan, and post-retirement benefits. 14
15
Q. How does National Grid ensure that its benefit programs are 16
reasonable and competitive? 17
A. National Grid monitors the marketplace to ensure that its benefit programs 18
are both cost-effective and sufficient to attract and retain the highly skilled 19
workforce needed to deliver excellent customer service and achieve 20
National Grid’s financial goals. 21
28

Testimony of Maureen P. Heaphy
Page 27 of 51
Q. Please describe how National Grid monitors the marketplace. 1
A. National Grid participates in both industry groups and benefit councils to 2
learn best practices and stay abreast of market developments. National 3
Grid also seeks new ideas and suggestions from its vendors. Periodically, 4
National Grid commissions a study by outside consultants to benchmark 5
the value of the benefit programs offered by National Grid to comparable 6
companies in the marketplace. The consultant, Towers Watson, collects 7
benefit plan provisions from hundreds of employers in all sectors of the 8
economy and uses its proprietary software to measure the value of these 9
programs. National Grid utilizes these studies to determine the 10
competitiveness of the benefits being offered and assist in managing and 11
controlling the cost of these benefit programs. 12
13
Q. Did Towers Watson perform recent studies to assess the 14
competitiveness of National Grid’s benefit programs? 15
A. Yes. The recent studies conducted by Towers Watson were performed in 16
late 2009 and were based on the benefit programs and coverage levels that 17
were in effect as of January 1, 2009. These studies reflected the re-18
alignment of most, but not all of the National Grid and legacy KeySpan 19
benefits. Separate studies were conducted for the union and non-union 20
benefit plans. The results of the study for the non-union benefits are 21
29

Testimony of Maureen P. Heaphy
Page 28 of 51
submitted as Exhibit __ (MPH-5) and the results of the study for the union 1
benefits are set forth in Exhibit __ (MPH-6). The study or analysis is 2
conducted for each benefit separately as well as on an entire-program 3
basis. It is not unusual for results to vary by benefit due to unique factors 4
associated with each company’s history and priorities. The entire-program 5
analysis combines all values and allows for a comparison among 6
companies’ benefit programs. It should be noted that a condition of 7
participation in the study is that the link between the participating 8
company and the value of the benefits it provides must not be disclosed. 9
The studies included with this testimony, therefore, mask which 10
companies correlate with which data, other than for National Grid. 11
However, the names of the participants are provided in the reports, so the 12
Commission will be aware of the companies to which National Grid’s data 13
was compared. As is evident from both sets of charts, National Grid’s 14
benefit plans for both union and non-union employees are very close to the 15
median. 16
17
Q. What efforts has National Grid undertaken to control costs associated 18
with its benefit programs? 19
A. National Grid self insures its health and welfare benefit plans, which 20
affords it a greater ability to control costs than it would have under third 21
30

Testimony of Maureen P. Heaphy
Page 29 of 51
party insurance programs. Because these plans are self-insured, the costs 1
for the programs are directly linked to the utilization of benefits. National 2
Grid’s medical plans also provide extensive health and wellness programs 3
designed to reduce health risks and reduce the occurrence of costly 4
diseases. These programs combined with coverage for preventive check-5
ups and screenings, provide a benefit structure that, over time, should help 6
to mitigate costs and improve employee wellness. 7
8
National Grid has also implemented cost containment measures in its 9
disability benefit program, which protects employees from the loss of 10
income as a result of sickness or disability. To ensure that these benefits 11
are paid only to legitimately sick and/or disabled employees, National 12
Grid teams up its internal nurse practitioners with a third party – Matrix – 13
to monitor employee care, verify situations with treating physicians, find 14
alternative light duty work where it is feasible, and ensure as rapid a return 15
to regular duty as reasonably possible. 16
17
Q. What efforts have been made to control the cost of union benefit 18
plans? 19
A. National Grid also self insures the union benefit plans and has successfully 20
encouraged union employees to opt for managed care plans. National 21
31

Testimony of Maureen P. Heaphy
Page 30 of 51
Grid has made the managed care plans for the union employees the 1
preferred choice by offering them at a lower cost than other plan designs. 2
In the context of the negotiated benefit packages that are offered to union 3
employees at this time, we believe that the managed care plans achieve the 4
lowest reasonable cost. 5
6
Q. Did National Grid make changes to the benefit programs following 7
the merger of National Grid and KeySpan? 8
A. Yes. As of January 1, 2009, all non-union employees were brought under 9
a common benefit platform across National Grid. This common benefit 10
platform reduced the number of vendors, which helped to stabilize and 11
reduce administrative expenses through economies of scale. The health 12
and welfare providers were selected through a competitive bidding process 13
and the successful results of those solicitation processes, with continuing 14
modifications and improvements, has assisted the Company in managing 15
the increasing cost of the benefit plans. 16
17
Q. Please describe the specific changes that were made during 2009. 18
A. National Grid made a number of changes in its medical, dental, and life 19
insurance programs to reduce costs. Among other things, National Grid 20
made the following changes: 21
32

Testimony of Maureen P. Heaphy
Page 31 of 51
• Co-pays for office visits and prescription drugs under the health 1 care program were increased, a deductible/coinsurance 2 arrangement was implemented for in-patient hospital care, and 3 waiver credits for opting out of medical coverage were reduced to 4 $750.00 per year; 5
• The prescription drug program was carved out of each medical 6 plan and, after a competitive bid process, was replaced in its 7 entirety with a CVS Caremark plan. This approach made it 8 possible for National Grid to generate savings by leveraging a 9 volume discount with one national vendor; 10
• In the dental program, employee premium sharing was increased 11
from 20% to 35%, benefits in the major restorative category were 12 reduced to 50% from 60%, the annual benefit maximums were 13 reduced both for major restorative work and total benefits, and 14 adult orthodontia was eliminated; 15
• In the life insurance program, the coverage level was reduced from 16
two times annual base bay to one times annual base pay. 17 18
Q. Please describe any adjustments to the test year expense for employee 19
medical and dental benefit plans that the Company is including in its 20
proposed revenue requirement. 21
A. National Grid is projecting eight percent (8%) annual increases in the 22
costs associated with healthcare benefits over the three rate years. These 23
projected increases are consistent with our actual experience and also 24
consistent with national projections for health care trends and the 25
projections gathered by our own health care consultant, Towers Watson. 26
Despite the fact that health care costs have increased consistently above 27
the general rate of inflation for many years, we applied a general inflation 28
33

Testimony of Maureen P. Heaphy
Page 32 of 51
rate to the test year level of expense in order to determine the level of 1
medical and dental expenses included in the rate year revenue 2
requirement, consistent with Commission precedent. Although we are 3
following Commission precedent, the use of a general inflation factor to 4
project health insurance increases likely will deprive the Company of the 5
ability to fully recover anticipated healthcare costs in the three rate years. 6
7
Q. Please describe any adjustments to the test year expense for other 8
employee benefit plans that the Company is including in its proposed 9
revenue requirement. 10
A. The forecasted rate year revenue requirements for other employee benefit 11
plan expenses (life insurance, the thrift plan, and other active benefits) 12
were also developed by applying the general inflation rate to the test year 13
level of expense, consistent with Commission precedent. For group life 14
insurance, the general inflation rate was applied to the test year expense 15
level as adjusted by $33,931 to reflect the lower costs associated with 16
reducing the basic life insurance benefit from two times annual base pay to 17
one time annual base pay for active non-union employees. 18
34

Testimony of Maureen P. Heaphy
Page 33 of 51
VIII. Pensions and OPEBs 1
Q. Please describe National Grid’s efforts to analyze changes to OPEB 2
benefits. 3
A. The process of ensuring fair, competitive, and efficient benefit programs 4
for employees and retirees is one of the core activities of National Grid’s 5
Corporate Compensation and Benefits department. Compensation and 6
Benefits staff continually undertake efforts to ensure proper vendor 7
performance and compliance with federal and state laws and regulations. 8
Trends in benefit and compensation plan design are also continually 9
monitored. 10
11
On an annual basis, National Grid analyzes the funding, recording, and 12
administration of OPEBs. Less frequently, but on a consistent basis, we 13
consider more significant changes designed to reduce the overall cost of 14
the OPEB plan. 15
16
Q. What challenges does National Grid face in considering fundamental 17
structural changes to retirement benefits on a frequent basis? 18
A. Retiree programs are unique among the collection of employee benefits. 19
Unlike medical and disability programs for which employees derive 20
current value, retiree programs represent promises for the future. As such, 21
35

Testimony of Maureen P. Heaphy
Page 34 of 51
their value tends to accrue over a longer period of time. Due to these long 1
accrual periods, significant changes in retiree programs are difficult to 2
adjust to when they occur close to or during retirement. Preparation for 3
retirement involves assessing one’s financial preparedness provided 4
through benefit plans, Social Security, and individual savings. Given the 5
fixed benefits payable under the Company’s pension plan, and the 6
potential for significant health-care expense as participants age, promised 7
health insurance benefits are one of the key factors in reaching the 8
conclusion that one can retire. This is demonstrated by the retirement 9
behavior of Company employees. Practically no one leaves the Company 10
voluntarily after the age of 55, unless they are eligible for postretirement 11
medical benefits. Therefore, and as further outlined below, the Company 12
has reached the conclusion that changes to OPEB benefit levels are only 13
feasible in connection with major benefit alignments either following 14
corporate transactions or in connection with labor negotiations. Any 15
OPEB benefit change will usually be done in connection with other 16
benefit alignments and will generally be carefully constructed to affect 17
only those employees who have sufficient time to adapt to the changes 18
before reaching retirement age. 19
20
36

Testimony of Maureen P. Heaphy
Page 35 of 51
Another reason retiree programs are unique is the wide geographic 1
dispersion of the plans’ participants. Unlike active employees, who live 2
geographically proximate to the Company’s business operations, retirees 3
move to other parts of the United States and other countries. This makes 4
communication with them and implementation of changes to their benefits 5
administratively burdensome and costly. 6
7
Q. Are there particular challenges involved in modifying OPEB benefits 8
for union employees? 9
A. With respect to OPEBs for union employees, the Company is bound by 10
law to negotiate with IBEW Local 97 for these benefits, and having 11
reached agreement on them, to hold those benefit levels until the current 12
collective bargaining agreement expires, unless they are renegotiated 13
earlier by mutual consent. A discussion of the results of recent 14
negotiations with the union is provided below. 15
16
Q. Is there a relationship between the Company’s ability to make 17
changes to the OPEB benefits provided to non-union employees and 18
the benefits provided to union employees? 19
A. Non-union employee benefits can be changed at any time. However, the 20
existence and substantial size of the union work force and the need to 21
37

Testimony of Maureen P. Heaphy
Page 36 of 51
recruit future managers from the union ranks creates a significant 1
connection here. It would be shortsighted to design benefits and 2
implement changes to benefits without fully evaluating the impact on this 3
connection. In the case of OPEB benefits in particular, a union employee 4
would be unlikely to accept, let alone seek, a nonunion job that provides 5
either significantly fewer or less valuable benefits than he or she is eligible 6
for under the union contract. Many of the best union management recruits 7
are rank-and-file employees who have worked many years in a physical 8
field work position and seek to move into supervision. Employees like 9
these are highly valued by our management team, as they can ably and 10
immediately contribute to meeting the Company’s objective of providing 11
safe and reliable service at a reasonable cost. Forcing union employees to 12
accept benefit reductions to move to management would be a significant 13
impediment to any such moves taking place. The Company’s desire to 14
facilitate the promotion of union employees manifests itself in a three to 15
five year cycle of OPEB benefit level reviews for both union and non-16
union employees absent a major triggering event such as a merger. This 17
cycle generally corresponds to the length of the collective bargaining 18
agreement with the unions. 19
20
38

Testimony of Maureen P. Heaphy
Page 37 of 51
Q. Please explain the OPEB-related analyses performed on an annual 1
basis. 2
A. The annual process to examine OPEBs focuses on the following three 3
categories: (i) actuarial assumptions around plan expense in funding, (ii) 4
general vendor performance reviews, and (iii) Medicare prescription drug 5
program refund administration. 6
7
Actuarial assumptions for expense and funding: Each year, working with 8
its actuary, Hewitt Associates, National Grid evaluates the proper level of 9
several actuarial factors used to determine plan expense and funding, 10
including discount rate, trend rate, and mortality rate. Depending on 11
economic information and trends at the time, rates are either continued or 12
modified as appropriate. In addition, National Grid evaluates various 13
funding options to ensure optimal funding of these benefits. 14
15
Also, National Grid has commenced an asset liability modeling study to 16
determine whether any changes are appropriate for our investment strategy 17
for all of the union and non-union retiree welfare plans. The outcome of 18
the studies is expected to either affirm the current asset allocations or 19
justify a slight shift in overall investment strategy taking into 20
consideration the characteristics of the liabilities of the OPEB plan. In the 21
39

Testimony of Maureen P. Heaphy
Page 38 of 51
first part of the study, the investment strategy of the Union Voluntary 1
Employee Beneficiary Association (“VEBA”) will be reviewed, taking 2
into consideration factors such as its tax exempt status, type of assets (e.g. 3
tax exempt municipal bonds, inflation-linked bonds, equity), and inflation 4
(general vs. medical). The next stage of the study will be to review the 5
VEBA funding of OPEB liabilities for the non-union employee 6
population. Ultimately, the goal of the study is to develop an optimal 7
investment strategy for the retiree welfare plan assets after consideration 8
of factors such as tax position, category of investments available, and plan 9
liabilities. 10
11
General vendor performance reviews: Each year, National Grid’s benefits 12
staff meets with the third parties who are responsible for claims payments 13
and administration of these benefits to review each vendor’s performance. 14
These vendors are the same vendors delivering services for active 15
employee programs. National Grid’s arrangements with these vendors are 16
for administrative services only, so the focus is on transaction 17
performance and participant satisfaction. National Grid continuously 18
reviews the delivery and administration of the benefits under the retiree 19
medical plan with the ultimate objective to reduce administration costs and 20
improve the delivery of services. During 2010, the administration of the 21
40

Testimony of Maureen P. Heaphy
Page 39 of 51
legacy KeySpan retiree medical plans will be consolidated with the same 1
provider that administers the medical benefit coverage for active 2
employees. 3
4
Medicare prescription drug refund administration: Each year, National 5
Grid supplies the Federal Government with extensive documentation and 6
certification to obtain a sizable refund of retiree drug benefits. We take 7
this opportunity very seriously and vigorously pursue maximum refunds, 8
thereby lowering our OPEB benefit expenses. In addition, National Grid 9
closely monitors the current debate on healthcare reform to assess any 10
impact it could have on the design and cost of the retiree medical plans it 11
sponsors. 12
13
Q. Is the OPEB plan the same for all employees? 14
A. The Company has two OPEB plans – the OPEB plan applicable to union 15
employees and the OPEB plan applicable to non-union employees. In 16
terms of the overall cost of these plans, the cost of the union plan is greater 17
because the union workforce is much larger. Niagara Mohawk’s 18
workforce consists of approximately 3,130 full-time equivalent (“FTE”) 19
union personnel and 1,283 FTE non-union personnel, per the most recent 20
actuarial report available (April 1, 2008-March 31, 2009). In terms of the 21
41

Testimony of Maureen P. Heaphy
Page 40 of 51
Accumulated Post-Retirement Benefit Obligation values for the union and 1
non-union plans, the relationship is 67% union and 33% non-union. 2
3
In terms of the OPEB benefits offered to each workforce, the broad 4
categories of benefits are the same. Both union and non-union personnel 5
receive retiree medical benefits and may receive life insurance benefits 6
depending on their hire date. 7
8
As discussed earlier in this testimony, there is a significant relationship 9
between the union OPEB plan and the non-union OPEB plan. While the 10
non-union OPEB plan can be changed at any time, the Company must be 11
mindful of the impact that changes to the non-union OPEB plan may have 12
on its ability to recruit managers from the union workforce. The union 13
OPEB plan as it relates to current active employees can only be changed 14
through negotiations with the union. 15
16
Q. What post employment medical benefits are provided to non-union 17
employees? 18
A. The Company maintains a retiree medical plan for employees who meet 19
certain age and service conditions. The benefits provided are generally 20
42

Testimony of Maureen P. Heaphy
Page 41 of 51
equivalent to the benefits provided to active employees. However, at age 1
65, the plan’s costs are offset by the Federal Medicare program. 2
3
Q. Please describe the efforts undertaken to control the cost of retiree 4
medical benefits. 5
A. Since the mid-1990’s, Niagara Mohawk, both as a stand-alone entity and 6
later as a part of National Grid, has attempted to find ways to control the 7
costs of medical benefits in a manner that is fair to the Company, its 8
employees, and retirees. The first efforts in this area resulted in the 9
establishment of “cap type” programs in which the Company’s 10
contribution to retiree medical costs was set at certain capped levels and 11
retirees were required to pay all increases above those levels. 12
13
At the time of the National Grid-Niagara Mohawk merger, the eligibility 14
requirements for non-union retiree medical benefits were changed. The 15
Company recognized that because of the continuing escalation of medical 16
costs at three to four times the rate of general inflation, the cap type 17
programs were simply not sustainable from the standpoint of providing a 18
meaningful ongoing benefit to retirees. During a period in which the 19
Company was transitioning its previous pension plans to lower cost, cash 20
balance pension plans, the capping of the Company’s contribution to 21
43

Testimony of Maureen P. Heaphy
Page 42 of 51
retiree medical costs, coupled with forecasted continuing escalations in 1
those costs at levels well in excess of the rate of general inflation, created 2
the prospect that an unreasonable portion of both present and future 3
retirees’ income would need to be used to fund medical benefits during 4
retirement. As a consequence, the Company made certain changes to its 5
OPEB program in 2002 to both implement a meaningful and sustainable 6
program to control retiree medical costs and to effectuate an alignment of 7
benefits within the entire National Grid family of companies. Those 8
changes were as follows: 9
10
First, while employees previously had been eligible for benefits at age 55 11
with five years of service, these eligibility requirements were changed so 12
that, in order to obtain benefits, an employee was required to be: (1) age 13
55 or older with a combination of age and service of at least 85, or (ii) age 14
61 or older with at least 10 years of the service. At the non-union level, 15
this eligibility change produced modest savings because, for pension 16
reasons, the practice of most Niagara Mohawk employees was to retire 17
only upon reaching an 86 point combination of age and service. 18
19
Second, non-union employees were made subject to a service-based 20
contribution formula that results in an 80% contribution by the Company 21
44

Testimony of Maureen P. Heaphy
Page 43 of 51
for employees with 30 years of service. Fewer years of service result in a 1
lower percentage contribution by the Company. In addition, all employees 2
hired after July 1, 1992 are eligible only for a maximum 50% contribution 3
with 30 years of service. 4
5
The Company’s non-union retirees predominately enroll in self-insured 6
managed health care plans. These plans seek to maximize medical care at 7
the lowest possible costs. The Company’s medical plans encourage 8
employees to enroll in wellness and disease management control programs 9
in order to promote long term cost control efforts. While the Company 10
cannot project specific identified OPEB savings from these efforts, it is 11
believed that these efforts will produce savings in the long run. 12
13
Q. What has the Company done to manage non-union post employment 14
life insurance? 15
A. In 2002, following the Niagara Mohawk/National Grid merger, the 16
Company modified its non-union retiree life insurance benefit to provide a 17
flat $20,000 benefit to most non-union employees effective as of 18
retirement date. In addition, the pre-existing benefit to certain legacy 19
Niagara Mohawk employees was reduced from 1.25 times final base pay 20
to one-half of final base pay. This had the overall effect of reducing the 21
45

Testimony of Maureen P. Heaphy
Page 44 of 51
cost of the post-retirement life insurance benefit to Niagara Mohawk by 1
approximately $1 million annually. 2
3
In addition, in the same way as medical benefits, the eligibility rules were 4
revised to require retirees to be either (i) age 55 or older with a 5
combination of age and service of at least 85 points, or (ii) age 61 with at 6
least ten years of service. This change had a very modest cost reduction 7
impact on expenses because Niagara Mohawk non-union employees 8
typically retire with a combination of age and service of 86 points. 9
10
The changes to this benefit have resulted in a lawsuit filed on behalf of the 11
legacy Niagara Mohawk employees. This lawsuit is pending. 12
13
Q. What has the Company done to control non-union OPEB costs since 14
the merger with KeySpan. 15
A. National Grid has commenced a process of reevaluating the OPEBs that 16
will be made available to all non-union employees, including Niagara 17
Mohawk’s, in the future. All retiree benefits are being considered as part 18
of this process including pension plans, post retirement medical, life 19
insurance, and 401-K plans. Given the number of employees affected and 20
the number of benefit plans involved, this is a significant undertaking that 21
46

Testimony of Maureen P. Heaphy
Page 45 of 51
commenced in 2009. It is a complex study that attempts to reach a 1
balance between the cost of the plans to the Company, and ultimately to its 2
customers, and the competitiveness of the benefits offered to the 3
employees of National Grid. 4
5
In addition, the Company will implement a new design to provide its non-6
union population of retirees with prescription benefits. These benefits will 7
be carved out of the medical plans and provided through a national 8
vendor, which will reduce administrative expenses through economies of 9
scale, and deeper discounts negotiated with the new vendor. The change 10
will be implemented effective January 1, 2010 and it is estimated to 11
generate $4 million of ongoing savings on a Financial Accounting 12
Standards (“FAS”) 106 basis. 13
14
Q. What has the Company done to manage union post-employment 15
medical costs? 16
A. The primary effort to contain costs in the retiree medical area since 2004 17
has been directed at getting the union to agree to the full array of changes 18
that have been made to the non-union medical benefit. 19
20
47

Testimony of Maureen P. Heaphy
Page 46 of 51
At the time of the National Grid-Niagara Mohawk merger, legacy Niagara 1
Mohawk employees who retired as of May 1, 1996 were also subject to a 2
fixed cap contribution toward the cost of retiree medical benefits. The 3
Company’s cost was to be set at the cost levels as of December 31, 2002 4
and retirees were required to pay all costs over the 2002 base cost. All 5
future increases in costs were to be borne by retirees who retired on or 6
after May 1, 1996. This cap structure was modified June 1, 2001. 7
Beginning January 1, 2003, all retirees as of May 1, 1996 were required to 8
pay the first $100 above the 2002 Company contribution amount towards 9
medical premiums, and, for amounts in excess of the first $100, the retiree 10
was required to pay 10% of future premium increases until December 31, 11
2009. Effective January 1, 2010, 100% of all future premium increases 12
above the 2009 Company premium contribution amount would be borne 13
by all retirees who retired after May 1, 1996. 14
15
The first opportunity after the Niagara Mohawk/National Grid merger to 16
address these benefits was during the 2004 contract negotiations. During 17
those negotiations, the Company sought to make the same changes to the 18
union plan as had been made to non-union retiree medical benefit in 2002. 19
Had the Company been successful, the projected savings in the cost of 20
union retiree medical benefits would have approximated $7.7 million 21
48

Testimony of Maureen P. Heaphy
Page 47 of 51
annually. However, during the negotiations, the union both opposed these 1
changes and sought elimination of the fixed cost contribution cap. 2
Following very difficult and contentious negotiations, the cap was 3
replaced with an 80%/20% cost sharing formula for prospective retirees 4
from and after September 30, 2004. However, the eligibility changes and 5
the post-July 1, 1992 hired employee program implemented for the non-6
union employees were not acceptable to the union. The impact of the cap 7
removal was an increase in annual OPEB expense. However, as described 8
above, given the likelihood of regular and significant cap increases in 9
future years, the Company believes that these increases will be no larger 10
than what would ultimately have been experienced if the cap program had 11
been maintained and subjected to changes over time. Moreover, the 12
80%/20% sharing program ensures that future increases in retiree medical 13
costs will be more predictable and manageable. 14
15
The labor agreement reached in 2004 was scheduled to expire March 31, 16
2008. During early 2007, the union indicated its interest in extending the 17
agreement in order to resolve concerns related to the KeySpan merger. 18
During the negotiations concerning the extension, the Company sought to 19
achieve the retiree medical benefit changes that could not be achieved in 20
2004. Had the Company been successful, the estimated annual savings 21
49

Testimony of Maureen P. Heaphy
Page 48 of 51
would have been approximately the same $7.7 million determined in 2004. 1
However, these efforts were not successful. Instead, the Company ended 2
up extending the agreement to March 31, 2011. 3
4
As previously mentioned in this testimony, in August 2009 the Company 5
and Local 97 reached an agreement to extend the Local 97 labor contract 6
until March 31, 2014. As part of the contract extension, significant 7
changes in the post retirement medical benefits were made. First, 8
employees hired on or after July 1, 1998, or who did not meet an age and 9
service criteria at that date, will be covered by a Medicare supplement 10
plan after age 65. Second, new hires on or after the ratification date will 11
have an entirely different retiree medical plan. 12
13
The eligibility criteria for pre-Medicare (age 65) medical coverage were 14
changed to require a longer tenure. In order to receive pre-Medicare 15
medical coverage, employees will have to be either a minimum of age 60 16
with 85 points of service or a minimum of age 61 with 10 years of service. 17
These new rules apply for employees hired after August 14, 2009. 18
Employees hired prior to that date are eligible upon reaching a minimum 19
of age 55 with at least five years of service. In addition, under the new 20
rules the cost payable by a retired employee will depend on the 21
50

Testimony of Maureen P. Heaphy
Page 49 of 51
employee’s length of service. Specifically, the Company’s share of the 1
cost will be equivalent to 2.67% per year of service to a maximum of 80%. 2
This compares to rules covering pre-August 14, 2009 employees, where 3
the Company’s share of the cost of the pre-65 medical benefit coverage is 4
set at 80% irrespective of the service period of the retired employee. Once 5
an employee is eligible for Medicare medical coverage (at age 65), the 6
Company provides for a Medicare supplement type of plan. Under the 7
new agreement covering employees hired on or after August 14, 2009, the 8
Company’s share of the cost to provide this benefit is limited to $4.50 9
($9.00 if married) per month per year of service. For employees hired 10
prior to August 14, 2009, the Company is responsible for 75% of the cost 11
of this benefit. Under the new cost sharing terms, the cost to the Company 12
is fixed in dollar terms. The August 2009 agreement changes in the post 13
retiree medical plan will lower the plan obligations by $12.4 million on a 14
FAS 106 basis. 15
16
Q. What has the Company done to control the cost of life insurance 17
provided to union retirees? 18
A. In the 2004 union negotiations, the Company sought to make the same 19
changes to the union life insurance benefit that were made to the non-20
union benefit. It is estimated that these changes would have reduced costs 21
51

Testimony of Maureen P. Heaphy
Page 50 of 51
by approximately $3.0 million annually. However, the Company was not 1
successful in its negotiations. However, the retiree life insurance benefit 2
was terminated for union employees hired on or after October 1, 2004. 3
While this change only produces very modest savings initially (estimated 4
to be less than $100,000 annually), over time it will ultimately eliminate 5
the cost of this plan. 6
7
Q. What has the National Grid done to control pension costs? 8
A. National Grid reviews, on a continuous basis, the pension plan benefits it 9
offers to employees, with a dual objective of offering benefits that are in 10
line with market practices and controlling plan costs. National Grid 11
implemented a common cash balance plan design for all new hires 12
effective for non-union new hires on or after July 15, 2002 and for union 13
new hires effective on or after July 1, 1998. This cash balance pension 14
plan is significantly less costly than the previous pension plan because of 15
its smaller annual benefit accruals and flatter cost curves over the working 16
life of an employee. At the same time, the cash balance plan is market 17
competitive. National Grid has combined modifications to its pension 18
plan with an aggressive participation and investment management 19
campaign in our 401-K plan so that employees can both save more and 20
invest more wisely and end up with sufficient retirement income. 21
52

Testimony of Maureen P. Heaphy
Page 51 of 51
In addition, National Grid attempts to control the cost of the pension plans 1
by optimizing the investment returns generated by the assets held in a trust 2
for each plan. The pension plan investment strategy is reviewed regularly 3
in light of the evolving demographic of the beneficiaries and experience of 4
the plans, among other factors. 5
6
IX. Conclusion 7
Q. Does this conclude your direct testimony? 8
A. Yes it does.9
53

Exhibits of
M
aureen P. Heaphy

Testimony of Maureen P. Heaphy
Index of Exhibits
Exhibit __ (MPH-1) National Grid’s Employee Guide to the Annual
Performance Plan Exhibit __ (MPH-2) Sample “Performance for Growth” forms for
Company employees Exhibit __ (MPH-3) National Grid Union and Non-Union Wage Increase
History (2000-2009) Exhibit __ (MPH-4) National Grid USA - Union Wage Comparisons Exhibit __ (MPH-5) National Grid – BENVAL Analysis for 2009 Non-
Union Benefits Exhibit __ (MPH-6) National Grid – BENVAL Analysis for Legacy
National Grid New York Union Benefits
54

Exhibit __ (M
PH-1)

Testimony of Maureen P. Heaphy
Exhibit __ (MPH-1)
National Grid’s Employee Guide to the Annual Performance Plan
55

Exhibit __ (MPH-1) Page 1 of 9
EMPLOYEE GUIDE TO
THE
ANNUAL PERFORMANCE PLAN
US – Band C, D, E and F
2009/2010
56

Exhibit __ (MPH-1) Page 2 of 9
Dear Colleague
Performance for Growth (P4G) has been in operation now for two years and is being embedded in the Company. In the recent Employee Opinion Survey employees informed us they didn’t fully understand the Company direction and how their role contributes to the Company’s success. The line of sight framework aims to provide clarity and building on this, together with the P4G framework, will ensure we are all working towards a common goal whilst ensuring we reward high performance.
This guide provides information about how the Annual Performance Plan will operate this year and your Manager will discuss this further with you over the next few weeks.
Steve Holliday Chief Executive
1 Introduction
This guide summarises the main provisions of the National Grid Annual Performance Plan 2009/10 (the “Plan”) and highlights the general operation of the plan. The Plan has been approved by the Executive Directors and they have absolute discretion over the operation and design of the Plan (see section 7 for further detail).
The Plan is intended to motivate employees to achieve the highest possible financial and individual performance, whilst ensuring that at all times, all safety, health and environment requirements are adhered to, all standards of service are achieved and shareholder expectations reached. In short, all our stakeholders should benefit from the Plan.
Stretching financial targets and individual objectives will be set, as soon as practicable, after the start of the Plan year (April each year). These objectives should be input into the performance part of the Global Performance and Compensation System (GPCS)
2 Plan Summary
50% of the maximum Plan opportunity is based on financial targets and 50% is based on individual objectives.
2.1 Financial Targets Within the 50% for financial targets, 20% is based on Group Earnings per Share (Group EPS) and the remaining amount for the financial element of the Plan will be based on appropriate Line of Business/Executive Directorate e.g Shared Services/IS etc targets e.g. operating profit or any other appropriate targets set by the relevant Executive Director.
2.2 Individual objectives Four or five key individual objectives are set. They should be stretching, measurable and achievable.
The performance assessment will result in a rating using a scale of 1 to 5 (see Appendix 1).
57

Exhibit __ (MPH-1) Page 3 of 9
When assessing achievement of the individual objectives, equal importance is attributed to performance against the Leadership Qualities using a scale of 1 to 3 (see attached Appendix 2).
3 Performance Reviews
Your manager will discuss performance against targets and objectives with you on a regular basis throughout the year. An interim review will be undertaken part way through the year to formally assess progress and a year end review will be undertaken to assess final performance. It is both your responsibility and your Manager’s to ensure these discussions take place. They can be effective only by clearly articulating progress and expectations; and by providing an opportunity for constructive two way dialogue. Assessment of performance against individual objectives is based on the what and how ratings as shown below.
4 Worked Example – for an LOB employee
The attached example shows how the assessment process works. The example is based on an employee who has a maximum Plan opportunity of 20% of salary. 50% of the Plan is based on financial targets and 50% on individual objectives.
On this basis, 10% of salary is based on financial targets and 10% of salary is based on individual objectives. See Appendices 3 and 4 and read in conjunction with the following notes.
4.1 Notes to Example
The Company achieves stretch performance (4%) for Group EPS and target (2.70%) for LOB Operating Profit. See Appendix 3.
58

Exhibit __ (MPH-1) Page 4 of 9
4.00% - Group EPS +
2.70% - LOB Operational Profit
6.70% - Total
In this example, the manager determines the employee frequently exceeds expectations with regard to performance objectives and demonstrated the Leadership Qualities. The manager therefore determines the employee will be in a 2/2 position overall (i.e. Performance “v” Leadership Qualities) and that 80% of the maximum available for individual performance will be paid. See Appendix 4.
As such 80% x 10% = 8%. This is then added to the total for financial targets (6.70%). Consequently, 14.70% is achieved out of a Plan maximum of 20%. Therefore, the employee will receive 14.70% of their salary as a performance award.
Note: There is discretion to reduce payments to take account of significant safety, service standard incidents and environmental issues.
5 Performance Payments
Your award is payable in June and is subject to tax withholdings.
The award is calculated as a percentage of eligible earnings1 paid during the annual plan year.
6 Ceasing to be employed
If you cease to be an employee during the Plan year, a discretional cash payment may be paid to you, but this will depend on the circumstances of your leaving.
7 Limitations of the Plan
The Company may amend, suspend or terminate all or any part of the Plan at any time.
Participation in, and the operation of, the Plan will not form part of or affect your contract of employment or your employment relationship, nor will they give you the right to continued employment. Participation in one year of the Plan does not indicate that you will participate, or be considered for participation, in any future years. You are not entitled to any compensation or other benefit in respect of the Plan.
1 For the avoidance of doubt other earnings such as overtime and shift premium are not included.
59
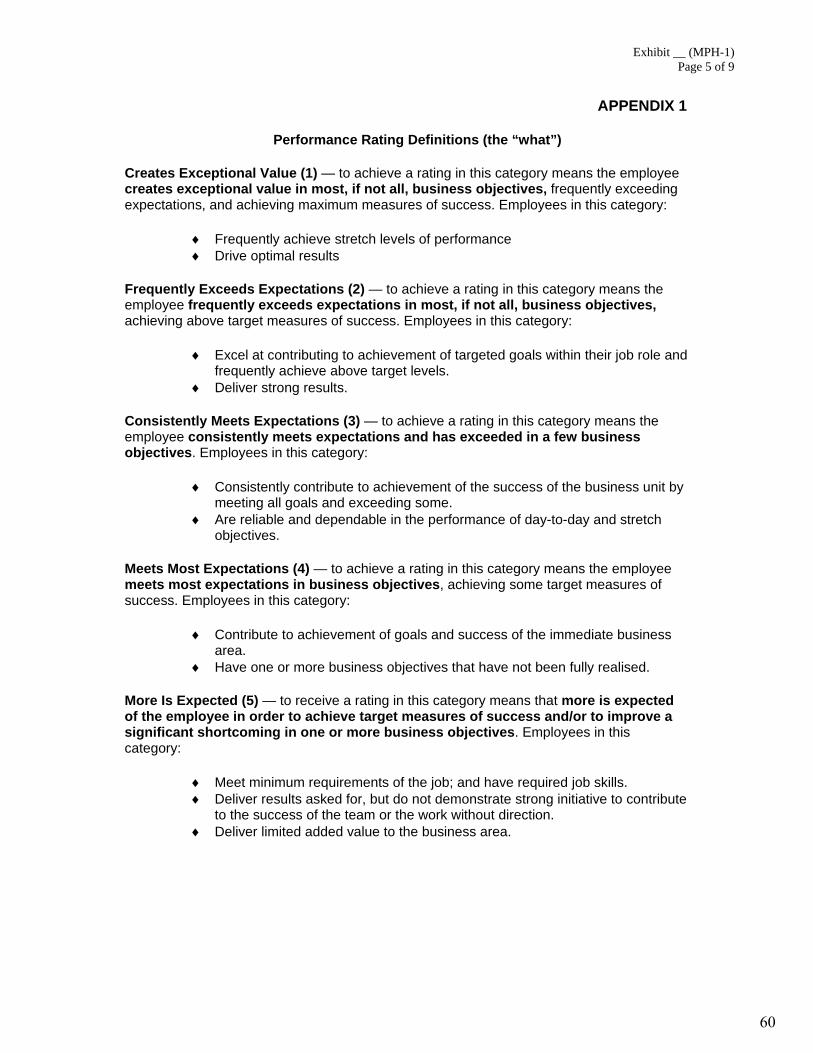
Exhibit __ (MPH-1) Page 5 of 9
APPENDIX 1
Performance Rating Definitions (the “what”)
Creates Exceptional Value (1) — to achieve a rating in this category means the employee creates exceptional value in most, if not all, business objectives, frequently exceeding expectations, and achieving maximum measures of success. Employees in this category:
♦ Frequently achieve stretch levels of performance ♦ Drive optimal results
Frequently Exceeds Expectations (2) — to achieve a rating in this category means the employee frequently exceeds expectations in most, if not all, business objectives, achieving above target measures of success. Employees in this category:
♦ Excel at contributing to achievement of targeted goals within their job role and frequently achieve above target levels.
♦ Deliver strong results.
Consistently Meets Expectations (3) — to achieve a rating in this category means the employee consistently meets expectations and has exceeded in a few business objectives. Employees in this category:
♦ Consistently contribute to achievement of the success of the business unit by meeting all goals and exceeding some.
♦ Are reliable and dependable in the performance of day-to-day and stretch objectives.
Meets Most Expectations (4) — to achieve a rating in this category means the employee meets most expectations in business objectives, achieving some target measures of success. Employees in this category:
♦ Contribute to achievement of goals and success of the immediate business area.
♦ Have one or more business objectives that have not been fully realised.
More Is Expected (5) — to receive a rating in this category means that more is expected of the employee in order to achieve target measures of success and/or to improve a significant shortcoming in one or more business objectives. Employees in this category:
♦ Meet minimum requirements of the job; and have required job skills. ♦ Deliver results asked for, but do not demonstrate strong initiative to contribute
to the success of the team or the work without direction. ♦ Deliver limited added value to the business area.
60

Exhibit __ (MPH-1) Page 6 of 9
APPENDIX 2
Leadership Qualities (the “how”)
♦ Lives the National Grid values
♦ Creates the future
♦ Consistently delivers great performance
♦ Builds relationships
♦ Develops self and others
Full details of the Leadership Qualities are included in the Performance For Growth Guidelines.
61

Exhi
bit _
_ (M
PH-1
) Pa
ge 7
of 9
Ove
rall
plan
str
uctu
re
Com
pany
LO
B/E
xecu
tive
Dire
ctor
ate
Indi
vidu
al
Max
imum
po
tent
ial
(% o
f sal
ary)
of Pla
n of
sala
ry
of Pla
n of
sala
ry
of
Pla
n of
sa
lary
To
tal
20%
20
%
4%
30%
6%
50
%10
%
Com
pany
Fin
anci
al m
easu
res
Thre
shol
d (1
0%) o
f Pla
n Ta
rget
(45%
) of P
lan
Stre
tch
(100
%) o
f Pla
n A
ctua
l
Req
uire
d re
sult
% s
alar
y R
equi
red
resu
lt %
sal
ary
Req
uire
d re
sult
% s
alar
y R
esul
t ac
hiev
ed
% o
f sa
lary
EP
S
G1
0.4
G2
1.8
G3
4 G
3 4
The
follo
win
g ta
bles
rela
te to
the
brea
kdow
n of
LO
B/E
xecu
tive
Dire
ctor
ate
targ
ets
and
diffe
r dep
endi
ng u
pon
whe
ther
the
empl
oyee
is in
an
LOB
or i
n E
xecu
tive
Dire
ctor
ate
eg IS
and
Sha
red
Ser
vice
s et
c.
LOB
Fin
anci
al m
easu
res
Thre
shol
d (1
0%) o
f Pla
n Ta
rget
(45%
) of P
lan
Stre
tch
(100
%) o
f Pla
n A
ctua
l
Req
uire
d re
sult
% s
alar
y R
equi
red
resu
lt %
sal
ary
Req
uire
d re
sult
% s
alar
y R
esul
t ac
hiev
ed
% o
f sa
lary
O
pera
ting
Pro
fit
X1
0.6
X2
2.7
X3
6 X2
2.
7
App
endi
x 1
Ann
ual P
erfo
rman
ce P
lan
Targ
ets
for 2
009/
10
App
endi
x 3
Exhibit __ (MPH-1) Page 7 of 9
62

Exhi
bit _
_ (M
PH-1
) Pa
ge 8
of 9
For L
egal
, Aud
it, S
HES
, Sha
red
Serv
ices
, US
Cus
tom
er &
Mar
kets
and
Ene
rgy
Mar
kets
& T
radi
ng th
e Fi
nanc
ial m
easu
res
are
even
ly s
plit
as fo
llow
s;-
Thre
shol
d (1
0%) o
f Pla
n Ta
rget
(45%
) of P
lan
Stre
tch
(100
%) o
f Pla
n A
n Ex
ampl
e O
uttu
rn
R
equi
red
resu
lt %
sal
ary
Req
uire
d re
sult
% s
alar
y R
equi
red
resu
lt %
sal
ary
Res
ult
achi
eved
%
of
sala
ry
US
Gas
Dis
tribu
tion
O
pera
ting
Pro
fitX
1 0.
2 X
2 0.
90
X3
2.00
X2
2.
00
US
Tra
nsm
issi
on
Ope
ratin
g P
rofit
Y
1 0.
2 Y
2 0.
90
Y3
2.00
Y
2 2.
00
US
ED
&G
Ope
ratin
g P
rofit
Z1
0.2
Z2
0.90
Z3
2.
00
Z2
2.00
For C
orpo
rate
Cen
tre,
Cor
pora
te A
ffairs
and
Gov
ernm
ent A
ffairs
the
over
all P
lan
stru
ctur
e is
as
follo
ws
to re
cogn
ise
finan
cial
ta
rget
s ar
e on
a C
ompa
ny b
asis
onl
y.
Com
pany
In
divi
dual
M
axim
um
pote
ntia
l (%
of s
alar
y)
of
Pla
n of
sala
ry
of Pla
n of
sala
ry
Tota
l20
%
50%
10
%
50%
10
%
The
brea
kdow
n of
the
plan
for t
hese
em
ploy
ees
is th
eref
ore
as fo
llow
s:-
Th
resh
old
(10%
) of P
lan
Targ
et (4
5%) o
f Pla
n St
retc
h (1
00%
) of P
lan
An
Exam
ple
Out
turn
Req
uire
d re
sult
% s
alar
y R
equi
red
resu
lt %
sal
ary
Req
uire
d re
sult
% s
alar
y R
esul
t ac
hiev
ed
% o
f sa
lary
EP
S
G1
0.5
G2
2.25
G
35.
00
G3
5.00
Con
solid
ated
Cas
hflo
w
CC
1 0.
33
CC
2 1.
50
CC
3 3.
33
Bet
wee
n C
C2
and
CC
3 2.
42
Ret
urn
on E
quity
R
10.
17
R2
0.75
R
31.
67
Bet
wee
n
R1
and
R2
0.46
Exhibit __ (MPH-1) Page 8 of 9
63

Exhi
bit _
_ (M
PH-1
) Pa
ge 9
of 9
A
ppen
dix
4
Pl
an
Rat
ing
Mat
rix
Lead
ersh
ip
Qua
litie
s (H
ow)
Pe
rfor
man
ce O
bjec
tives
(Wha
t)
Not
e:Th
e ra
nges
abo
ve re
late
to th
e pe
rcen
tage
ach
ieve
d as
a p
erce
ntag
e of
max
imum
for t
he
In
divi
dual
Obj
ectiv
es p
art o
f the
Pla
n on
ly
Stro
ngly
D
emon
stra
ted
135
% -
49%
50
% -
74%
75
% -
84%
85
% -
94%
95
% -
100%
Dem
onst
rate
d 2
21%
- 34
%
35%
- 49
%
50%
- 74
%
75%
- 84
%
85%
- 94
%
Not
D
emon
stra
ted
Con
sist
ently
3
0% -
20%
21
% -
34%
35
% -
49%
50
% -
74%
75
% -
84%
5
Mor
e is
Exp
ecte
d
4
Mee
ts M
ost
Exp
ecta
tions
3
Con
sist
ently
Mee
ts
Exp
ecta
tions
2
Freq
uent
ly
Exc
eeds
E
xpec
tatio
ns
1
Cre
ates
E
xcep
tiona
l Val
ue
Prop
osed
Dis
trib
utio
n G
uide
lines
0%
- 20
%
5%
21%
- 34
%
10%
35
% -
49%
20
%
50%
- 74
%
30%
75
% -
84%
20
%
85%
- 94
%
10%
95
% -
100%
5%
Exhibit __ (MPH-1) Page 9 of 9
64

Exhibit __ (MPH
-2)

Testimony of Maureen P. Heaphy
Exhibit __ (MPH-2)
Sample “Performance for Growth” forms for Company employees
65

Exhibit __ (MPH-2) Page 1 of 13
66

Exhibit __ (MPH-2) Page 2 of 13
67

Exhibit __ (MPH-2) Page 3 of 13
68

Exhibit __ (MPH-2) Page 4 of 13
69

Exhibit __ (MPH-2) Page 5 of 13
70

Exhibit __ (MPH-2) Page 6 of 13
71

Exhibit __ (MPH-2) Page 7 of 13
72

Exhibit __ (MPH-2) Page 8 of 13
73

Exhibit __ (MPH-2) Page 9 of 13
74
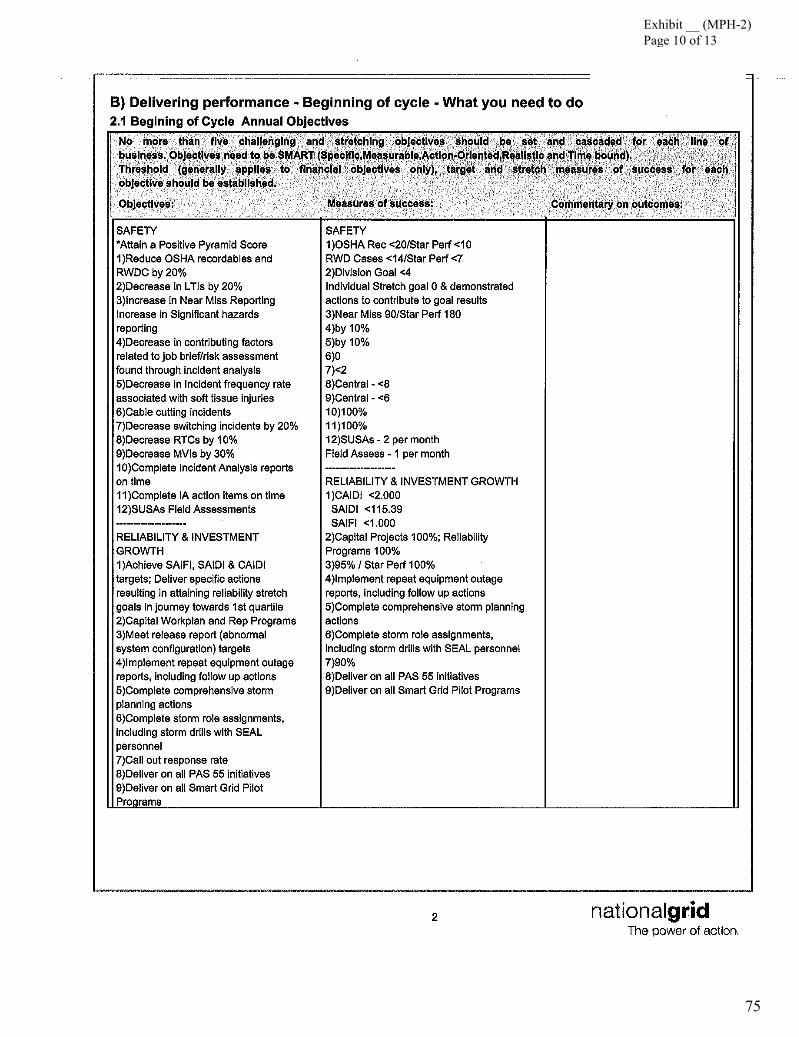
Exhibit __ (MPH-2) Page 10 of 13
75

Exhibit __ (MPH-2) Page 11 of 13
76

Exhibit __ (MPH-2) Page 12 of 13
77

Exhibit __ (MPH-2) Page 13 of 13
78

Exhibit __ (M
PH-3)

Testimony of Maureen P. Heaphy
Exhibit __ (MPH-3)
National Grid Union and Non-Union Wage Increase History (2000-2009)
79

Exhibit __ (MPH-3) Page 1 of 1
National Grid Union and Non-Union Wage Increase History (2000-2009)
Non-Union Non-Union Non-Union Union Merit Prom/Equity Total Gen Wage Increase* 2009 0.00% 1.50% 1.50% 3.00% 2008 3.40% 0.50% 3.90% 3.00% 2007 3.15% 0.50% 3.65% 3.00% 2006 3.00% 0.40% 3.40% 3.25% 2005 3.50% 0.35% 3.85% 0.00% 2004 2.60% 0.70% 3.30% 2.50% 2003 0.00% 2.00% 2.00% 3.75% 2002 3.20% 0.80% 4.00% 3.25% 2001 4.00% 1.00% 5.00% 3.25% 2000 3.00% 0.60% 3.60% 3.00% * Excludes progression step increases which are similar to non-union job family promotions
80

Exhibit (M
PH-4)

Testimony of Maureen P. Heaphy
Exhibit __ (MPH-4)
National Grid USA - Union Wage Comparisons
81
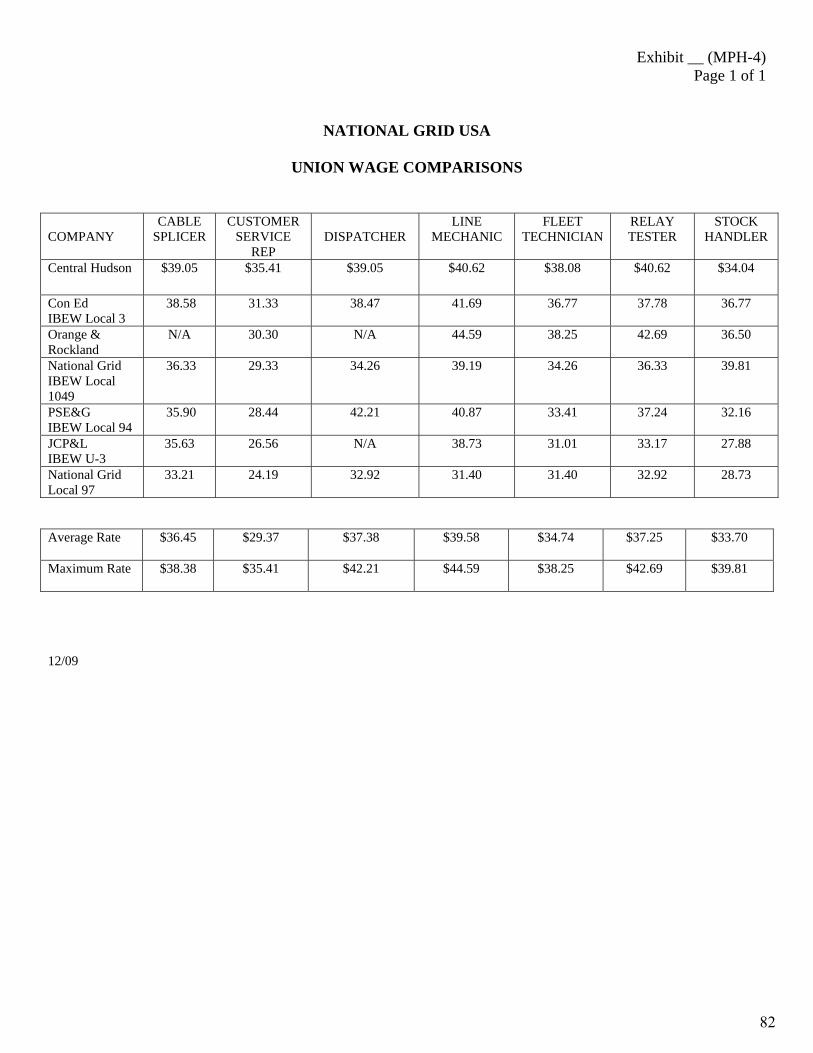
Exhibit __ (MPH-4) Page 1 of 1
NATIONAL GRID USA
UNION WAGE COMPARISONS
COMPANY
CABLE SPLICER
CUSTOMER SERVICE
REP
DISPATCHER
LINE MECHANIC
FLEET TECHNICIAN
RELAY TESTER
STOCK HANDLER
Central Hudson $39.05 $35.41 $39.05 $40.62 $38.08 $40.62 $34.04
Con Ed IBEW Local 3
38.58 31.33 38.47
41.69 36.77 37.78 36.77
Orange & Rockland
N/A 30.30 N/A 44.59 38.25 42.69 36.50
National Grid IBEW Local 1049
36.33 29.33
34.26 39.19 34.26 36.33 39.81
PSE&G IBEW Local 94
35.90 28.44
42.21 40.87 33.41 37.24 32.16
JCP&L IBEW U-3
35.63 26.56 N/A 38.73 31.01 33.17 27.88
National Grid Local 97
33.21 24.19 32.92 31.40 31.40 32.92 28.73
Average Rate
$36.45 $29.37 $37.38
$39.58 $34.74 $37.25 $33.70
Maximum Rate
$38.38 $35.41 $42.21 $44.59 $38.25 $42.69 $39.81
12/09
82

Exhibit __ (MPH
-5)

Testimony of Maureen P. Heaphy
Exhibit __ (MPH-5)
National Grid – BENVAL Analysis for 2009 Non-Union Benefits
83
Nov
embe
r 30,
200
9
©20
09 T
ower
s Pe
rrin
BEN
VAL
Ana
lysi
s fo
r 200
9 N
on-U
nion
Ben
efits
Nat
iona
l Gri
d
Pro
prie
tary
and
Con
fiden
tial
Not
for u
se o
r dis
clos
ure
outs
ide
Tow
ers
Per
rin a
nd it
s cl
ient
s
Exhi
bit _
_ (M
PH-5
) Pa
ge 1
of 4
4Exhibit __ (MPH-5) Page 1 of 44
84
©20
09 T
ower
s Pe
rrin
1P
ropr
ieta
ry a
nd C
onfid
entia
lN
ot fo
r use
or d
iscl
osur
e ou
tsid
e To
wer
s P
errin
and
its
clie
nts
Tab
le o
f C
onte
nts
Ove
rvie
w o
f Com
petit
ive
Ass
essm
ent
Ent
ire B
enef
it P
rogr
am
Ret
irem
ent B
enef
its
Act
ive
Ben
efits
Sum
mar
y
Exhi
bit _
_ (M
PH-5
) Pa
ge 2
of 4
4Exhibit __ (MPH-5) Page 2 of 44
85
©20
09 T
ower
s Pe
rrin
2P
ropr
ieta
ry a
nd C
onfid
entia
lN
ot fo
r use
or d
iscl
osur
e ou
tsid
e To
wer
s P
errin
and
its
clie
nts
Ove
rvie
w o
f C
ompe
titi
ve A
sses
smen
t
Tow
ers
Per
rin h
as c
ondu
cted
a h
ealth
car
e co
mpe
titiv
e as
sess
men
tcom
parin
g be
nefit
leve
ls fo
r bot
h N
atio
nal G
rid (N
GG
) and
Key
span
(K) r
elat
ive
to 2
0 pe
er o
rgan
izat
ions
Thro
ugho
ut th
is d
ocum
ent,
we
have
incl
uded
pla
n su
mm
ary
char
ts fo
r eac
h be
nefit
In th
e R
etire
men
t sec
tion,
we
prov
ide
plan
sum
mar
ies
for e
ach
bene
fit p
rogr
am fo
r Nat
iona
l G
rid
In th
e A
ctiv
e se
ctio
n, w
e pr
ovid
e pl
an s
umm
arie
s fo
r eac
h be
nefit
pro
gram
and
Nat
iona
l Grid
, as
wel
l as
rang
es (t
he lo
wes
t to
high
est v
alue
for t
he g
roup
of v
alue
s), a
vera
ges
(the
mea
n of
a
grou
p of
val
ues)
, and
mod
es (t
he m
ost f
requ
ent v
alue
in a
gro
up o
f val
ues)
, whe
re p
ossi
ble
for t
he c
ompe
titor
gro
up; w
here
ave
rage
s co
uld
not b
e ca
lcul
ated
, we
calc
ulat
ed a
rang
e an
d m
ode
only
For b
enef
its th
at d
iffer
for L
egac
y N
atio
nal G
rid a
nd L
egac
y K
eysp
an, w
e ha
ve in
clud
ed b
oth
bene
fit s
umm
arie
sC
ontin
ued…
3M
Am
eric
an E
lect
ric P
ower
Sys
tem
A
mer
ican
Exp
ress
C
itigr
oup
Col
gate
Pal
mol
ive
Con
solid
ated
Edi
son
Com
pany
of N
ew Y
ork,
Inc
DTE
Ene
rgy
Pro
gres
s E
nerg
y S
empr
a E
nerg
y S
outh
ern
Cal
iforn
ia
Edi
son
Uni
ted
Sta
tes
Ste
el
Cor
pora
tion
Uni
ted
Tech
nolo
gies
C
orpo
ratio
n V
eriz
on
Ent
ergy
Fe
dEx
Gro
und
FPL
Gro
up, I
nc.
MD
U R
esou
rces
, Inc
. N
orth
east
Util
ities
Ser
vice
C
ompa
ny
NS
TAR
P
acifi
c G
as a
nd E
lect
ric
Exhi
bit _
_ (M
PH-5
) Pa
ge 3
of 4
4Exhibit __ (MPH-5) Page 3 of 44
86
©20
09 T
ower
s Pe
rrin
3P
ropr
ieta
ry a
nd C
onfid
entia
lN
ot fo
r use
or d
iscl
osur
e ou
tsid
e To
wer
s P
errin
and
its
clie
nts
Ove
rvie
w o
f C
ompe
titi
ve A
sses
smen
t
The
anal
ysis
was
bas
ed o
n in
divi
dual
em
ploy
er p
lan
prov
isio
ns a
spr
ovid
ed b
y ea
ch
orga
niza
tion
appl
ied
to a
sta
ndar
d po
pula
tion,
usi
ng c
onsi
sten
t eco
nom
ic a
nd d
emog
raph
ic
assu
mpt
ions
, the
reby
mea
surin
g th
e “fi
nanc
ial v
alue
”of t
he p
lan,
not
the
actu
al c
ost o
f the
pla
n
BE
NV
AL®
dete
rmin
es a
val
ue fo
r the
se b
enef
its b
y ap
plyi
ng a
sta
ndar
d m
etho
dolo
gy to
a
stan
dard
em
ploy
ee p
opul
atio
n
Pla
n pr
ovis
ions
val
ued
are
thos
e th
at a
pply
to n
ewly
hire
d em
ploy
ees
Ben
efit
prog
ram
s ar
e:C
ompa
red
on a
rela
tive
valu
e ba
sis
betw
een
empl
oyer
s –
a sc
ore
of 1
00 re
pres
ents
the
aver
age
valu
e fo
r the
com
para
tor g
roup
Sco
res
are
dete
rmin
ed o
n a
dolla
r val
ue b
asis
rela
tive
to th
e av
erag
e va
lue
Thro
ugho
ut th
is d
ocum
ent,
“Tot
al V
alue
”ref
ers
to th
e po
sitio
ning
of t
he b
enef
it pr
ogra
ms
incl
udin
g th
e va
lue
of e
mpl
oyee
con
tribu
tions
, whe
reas
“Em
ploy
er V
alue
”ref
ers
to th
e va
lue
afte
r em
ploy
ee c
ontri
butio
ns h
ave
been
ded
ucte
d
The
tota
l ben
efit
valu
es a
re p
rimar
ily d
riven
by
the
valu
e of
the
retir
emen
t pla
ns, a
ctiv
e an
d po
st-re
tirem
ent m
edic
al p
lans
, and
vac
atio
n an
d ho
liday
pro
gram
s, w
hich
com
pris
e th
e va
st
maj
ority
of t
he p
rogr
am v
alue
s
Exhi
bit _
_ (M
PH-5
) Pa
ge 4
of 4
4Exhibit __ (MPH-5) Page 4 of 44
87

Ent
ire
Ben
efit
Pro
gram
Exhi
bit _
_ (M
PH-5
) Pa
ge 5
of 4
4Exhibit __ (MPH-5) Page 5 of 44
88

©20
09 T
ower
s Pe
rrin
5P
ropr
ieta
ry a
nd C
onfid
entia
lN
ot fo
r use
or d
iscl
osur
e ou
tsid
e To
wer
s P
errin
and
its
clie
nts
Ent
ire
Ben
efit
Pro
gram
Nat
iona
l Grid
's a
nd K
eysp
an’s
Em
ploy
er V
alue
is a
lmos
t ide
ntic
al; a
lthou
gh th
e m
ake
up o
f be
nefit
s ha
s be
en a
ligne
d fo
r mos
t ben
efits
, the
re a
re a
few
ben
efits
that
stil
l diff
er (e
.g.,
retir
ee
med
ical
, STD
, LTD
)
Key
span
’s T
otal
Val
ue o
f 105
.6 in
dica
tes
that
the
pack
age
of b
enef
its is
mor
e ge
nero
us th
an th
e av
erag
e; h
owev
er, t
he E
mpl
oyer
Val
ue d
ecre
asin
g to
93.
2 in
dica
tes
that
em
ploy
ees
are
requ
ired
to c
ontri
bute
mor
e he
avily
than
the
com
para
tor g
roup
Key
span
’s m
ore
gene
rous
Tot
al V
alue
is d
riven
by
the
Pos
t-ret
irem
ent m
edic
al b
enef
its
Entir
e Be
nefit
Pro
gram
Sco
re a
nd R
ank Sc
ore
Rank
/22
Empl
oyer
Val
ue
Lega
cy N
atio
nal G
rid93
.315
/22
Lega
cy K
eysp
an93
.216
/22
Tota
l Val
ue
Lega
cy N
atio
nal G
rid98
.613
/22
Lega
cy K
eysp
an10
5.6
6/22
Con
tinue
d…
Exhi
bit _
_ (M
PH-5
) Pa
ge 6
of 4
4Exhibit __ (MPH-5) Page 6 of 44
89

©20
09 T
ower
s Pe
rrin
6P
ropr
ieta
ry a
nd C
onfid
entia
lN
ot fo
r use
or d
iscl
osur
e ou
tsid
e To
wer
s P
errin
and
its
clie
nts
Ent
ire
Ben
efit
Pro
gram
The
bar c
hart
furth
er
illust
rate
s ho
w N
atio
nal G
rid’s
an
d K
eysp
an c
ompa
re to
th
eir p
eers
bot
h in
term
s of
gr
oss
bene
fit v
alue
of t
heir
entir
e be
nefit
pro
gram
, as
wel
l as
empl
oyer
-pro
vide
d va
lue
(i.e.
, net
of e
mpl
oyee
co
ntrib
utio
ns)
QG
NL
HM
IA
OU
EB
RF
PT
JC
DS
QN
PB
GH
TF
UE
IL
OM
AD
CR
SJ
K
K
Exhi
bit _
_ (M
PH-5
) Pa
ge 7
of 4
4Exhibit __ (MPH-5) Page 7 of 44
90

Ret
irem
ent
Ben
efit
s
Exhi
bit _
_ (M
PH-5
) Pa
ge 8
of 4
4Exhibit __ (MPH-5) Page 8 of 44
91

©20
09 T
ower
s Pe
rrin
8P
ropr
ieta
ry a
nd C
onfid
entia
lN
ot fo
r use
or d
iscl
osur
e ou
tsid
e To
wer
s P
errin
and
its
clie
nts
All
Ret
irem
ent
Pla
ns E
xcep
t S
tock
Pur
chas
e P
lan
This
cha
rt re
flect
s to
tal p
lan
desi
gn v
alue
s fo
r ret
irem
ent e
vent
s re
flect
ing
all p
lans
exc
ept t
he s
tock
pu
rcha
se p
lans
Val
ues
have
a re
lativ
ely
wid
e di
sper
sion
, with
val
ues
rang
ing
from
54.
8 to
173
.2
Con
side
ring
Em
ploy
er-V
alue
s, K
eysp
an’s
rank
ing
chan
ges
from
12t
hto
18t
h ; ke
y dr
iver
her
e is
the
cost
-sh
arin
g ar
rang
emen
t for
retir
ee m
edic
al
QG
HF
NO
PU
CE
LB
AM
IJ
DR
ST
QN
GT
HI
ML
UO
AP
SE
BF
DC
JR
K
K
Exhi
bit _
_ (M
PH-5
) Pa
ge 9
of 4
4Exhibit __ (MPH-5) Page 9 of 44
92
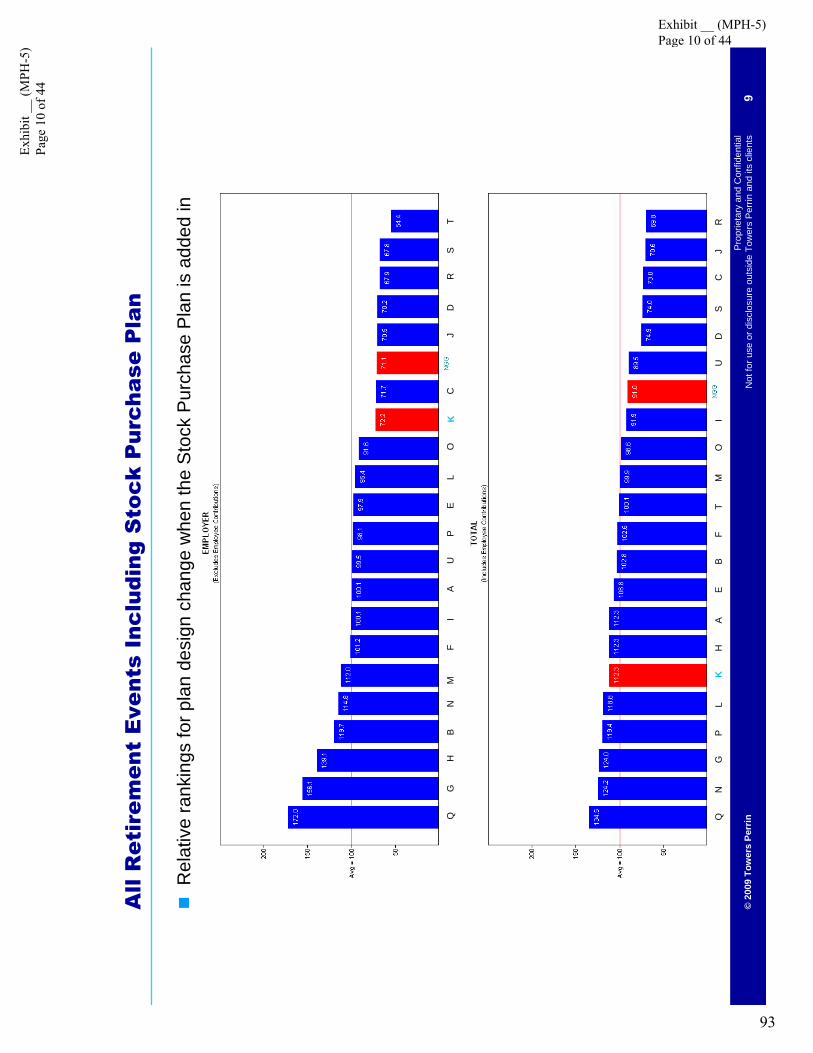
©20
09 T
ower
s Pe
rrin
9P
ropr
ieta
ry a
nd C
onfid
entia
lN
ot fo
r use
or d
iscl
osur
e ou
tsid
e To
wer
s P
errin
and
its
clie
nts
All
Ret
irem
ent
Eve
nts
Incl
udin
g S
tock
Pur
chas
e P
lan
Rel
ativ
e ra
nkin
gs fo
r pla
n de
sign
cha
nge
whe
n th
e St
ock
Pur
chas
eP
lan
is a
dded
in
QG
HA
NE
UI
OP
LB
DM
FC
JR
ST
QN
GE
LT
BA
OF
MP
SI
HU
DC
JR
K
K
Exhi
bit _
_ (M
PH-5
) Pa
ge 1
0 of
44
Exhibit __ (MPH-5) Page 10 of 44
93
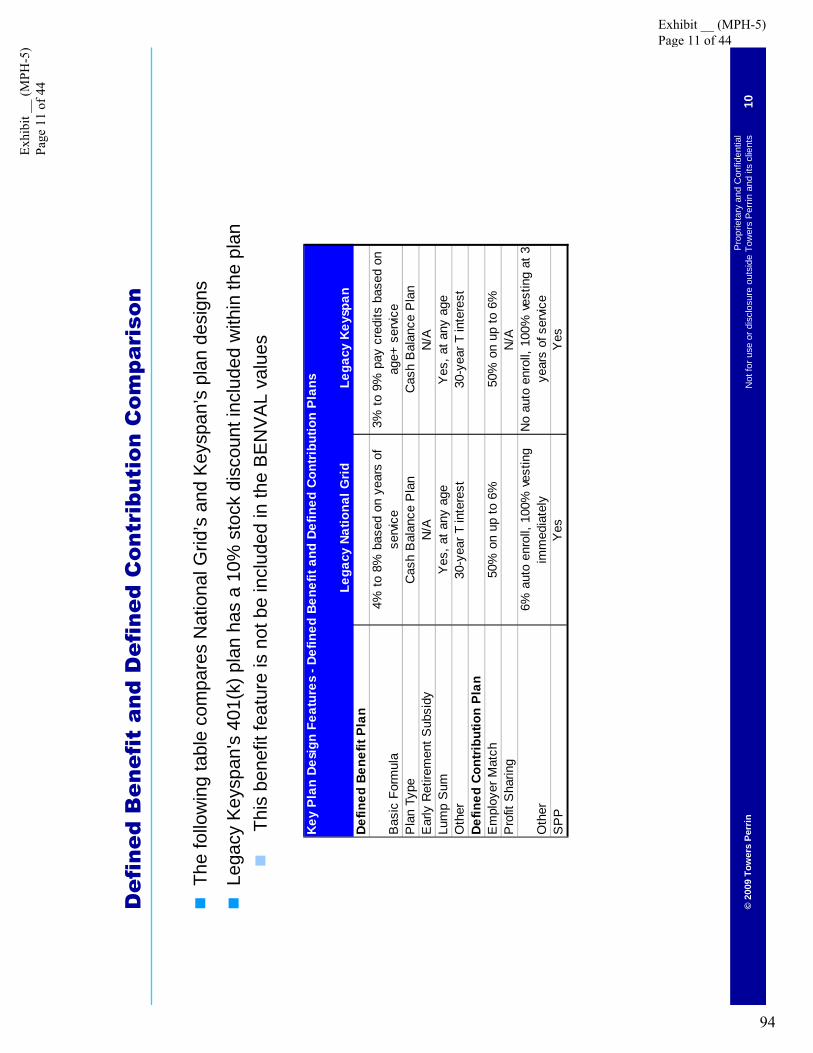
©20
09 T
ower
s Pe
rrin
10P
ropr
ieta
ry a
nd C
onfid
entia
lN
ot fo
r use
or d
iscl
osur
e ou
tsid
e To
wer
s P
errin
and
its
clie
nts
Def
ined
Ben
efit
and
Def
ined
Con
trib
utio
n C
ompa
riso
n
The
follo
win
g ta
ble
com
pare
s N
atio
nal G
rid’s
and
Key
span
’s p
lan
desi
gns
Lega
cy K
eysp
an's
401(
k) p
lan
has
a 10
% s
tock
dis
coun
t inc
lude
d w
ithin
the
plan
This
ben
efit
feat
ure
is n
ot b
e in
clud
ed in
the
BE
NV
AL
valu
es
Key
Pla
n De
sign
Fea
ture
s - D
efin
ed B
enef
it an
d De
fined
Con
tribu
tion
Plan
s
Leg
acy
Natio
nal G
rid
Leg
acy
Keys
pan
Def
ined
Ben
efit
Plan
Bas
ic F
orm
ula
4% to
8%
bas
ed o
n ye
ars
of
serv
ice
3% to
9%
pay
cre
dits
bas
ed o
n ag
e+ s
ervic
eP
lan
Type
Cas
h B
alan
ce P
lan
Cas
h B
alan
ce P
lan
Ear
ly R
etire
men
t Sub
sidy
N/A
N/A
Lum
p S
umY
es, a
t any
age
Yes
, at a
ny a
geO
ther
30-y
ear T
inte
rest
30-y
ear T
inte
rest
Def
ined
Con
tribu
tion
Plan
Em
ploy
er M
atch
50%
on
up to
6%
50%
on
up to
6%
Pro
fit S
harin
gN
/A
Oth
er6%
aut
o en
roll,
100
% v
estin
g im
med
iate
lyN
o au
to e
nrol
l, 10
0% v
estin
g at
3
year
s of
ser
vice
SP
PY
esY
es
Exhi
bit _
_ (M
PH-5
) Pa
ge 1
1 of
44
Exhibit __ (MPH-5) Page 11 of 44
94

©20
09 T
ower
s Pe
rrin
11P
ropr
ieta
ry a
nd C
onfid
entia
lN
ot fo
r use
or d
iscl
osur
e ou
tsid
e To
wer
s P
errin
and
its
clie
nts
Tot
al R
etir
emen
t B
enef
its −
Wit
hout
Sto
ck P
urch
ase
Pla
n (E
xclu
ding
Pos
t-R
etir
emen
t M
edic
al)
QN
GO
HC
LA
JB
IM
SP
ED
RU
TF
QG
NE
MC
DP
IB
LA
SO
HJ
TU
RF
K K
Exhi
bit _
_ (M
PH-5
) Pa
ge 1
2 of
44
Exhibit __ (MPH-5) Page 12 of 44
95

©20
09 T
ower
s Pe
rrin
12P
ropr
ieta
ry a
nd C
onfid
entia
lN
ot fo
r use
or d
iscl
osur
e ou
tsid
e To
wer
s P
errin
and
its
clie
nts
Tot
al R
etir
emen
t B
enef
its −
Wit
h S
tock
Pur
chas
e P
lan
(Exc
ludi
ngP
ost-
Ret
irem
ent
Med
ical
)
QN
GL
AC
OE
JB
IM
SH
PD
RU
TF
AQ
LH
NS
PO
BE
DG
FM
TC
IJ
UR
K
K
Exhi
bit _
_ (M
PH-5
) Pa
ge 1
3 of
44
Exhibit __ (MPH-5) Page 13 of 44
96

©20
09 T
ower
s Pe
rrin
13P
ropr
ieta
ry a
nd C
onfid
entia
lN
ot fo
r use
or d
iscl
osur
e ou
tsid
e To
wer
s P
errin
and
its
clie
nts
Pos
t-re
tire
men
t M
edic
al B
enef
its
Sco
re a
nd R
ank
The
follo
win
g ta
ble
illust
rate
s N
atio
nal G
rid’s
and
Key
span
’s c
ompe
titiv
e po
sitio
ning
rela
tive
to th
eir p
eer g
roup
in te
rms
of p
ost-r
etire
men
t med
ical
pro
gram
s
Six
of t
he 2
1 co
mpa
nies
do
not o
ffer e
mpl
oyer
-pro
vide
d re
tiree
med
ical
ben
efits
Whe
n co
ntrib
utio
ns a
re in
clud
ed, K
eysp
an’s
pro
gram
rank
s 8t
h, w
hile
Nat
iona
l Grid
’s is
be
low
the
med
ian
Post
-retir
emen
t Med
ical
Sco
re a
nd R
ank Sc
ore
Rank
Empl
oyer
Val
ue
Lega
cy N
atio
nal G
rid57
.210
/16
Lega
cy K
eysp
an43
.915
/16
Tota
l Val
ue
Lega
cy N
atio
nal G
rid67
.015
/19
Lega
cy K
eysp
an14
1.5
8/19
Exhi
bit _
_ (M
PH-5
) Pa
ge 1
4 of
44
Exhibit __ (MPH-5) Page 14 of 44
97
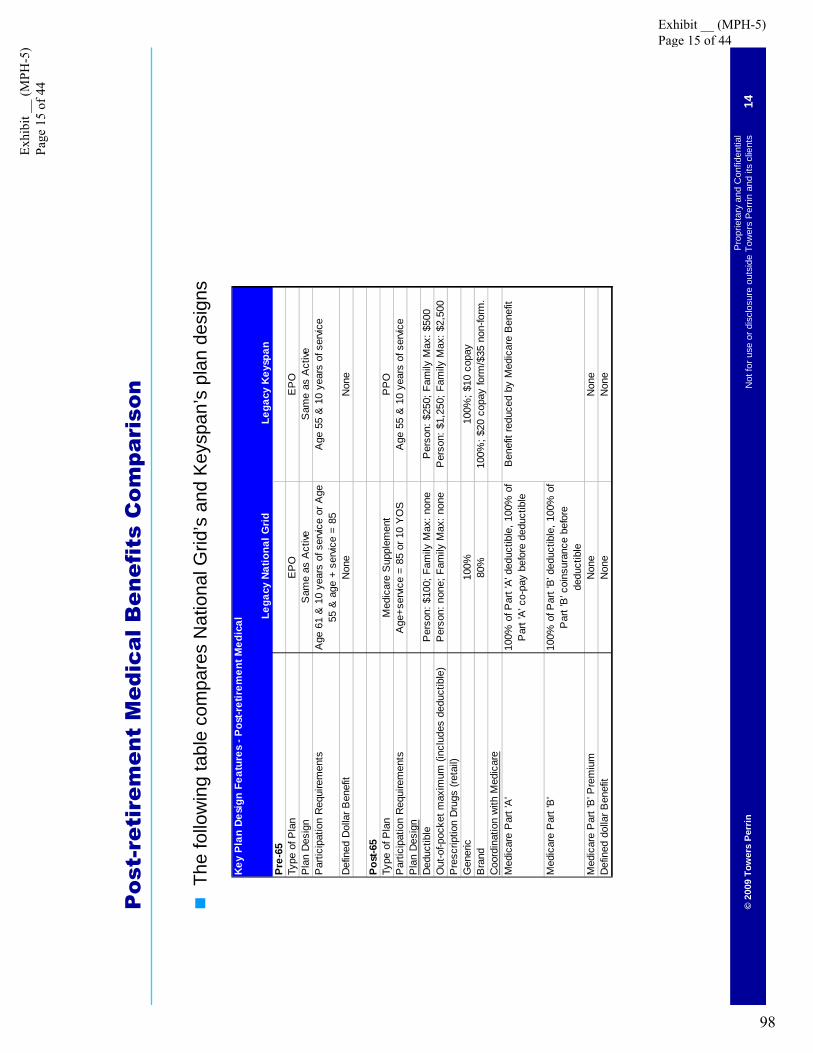
©20
09 T
ower
s Pe
rrin
14P
ropr
ieta
ry a
nd C
onfid
entia
lN
ot fo
r use
or d
iscl
osur
e ou
tsid
e To
wer
s P
errin
and
its
clie
nts
Pos
t-re
tire
men
t M
edic
al B
enef
its
Com
pari
son
Key
Plan
Des
ign
Feat
ures
- P
ost-r
etir
emen
t Med
ical L
egac
y N
atio
nal G
rid
Leg
acy
Key
span
Pr
e-65
Type
of P
lan
EP
OE
PO
Pla
n D
esig
nS
ame
as A
ctive
Sam
e as
Act
iveP
artic
ipat
ion
Req
uire
men
tsA
ge 6
1 &
10
year
s of
ser
vice
or A
ge
55 &
age
+ s
ervic
e =
85A
ge 5
5 &
10
year
s of
ser
vice
Def
ined
Dol
lar B
enef
itN
one
Non
e
Post
-65
Type
of P
lan
Med
icar
e S
uppl
emen
tP
PO
Par
ticip
atio
n R
equi
rem
ents
Age
+ser
vice
= 85
or 1
0 Y
OS
Age
55
& 1
0 ye
ars
of s
ervic
eP
lan
Des
ign
Ded
uctib
leP
erso
n: $
100;
Fam
ily M
ax: n
one
Per
son:
$25
0; F
amily
Max
: $50
0O
ut-o
f-poc
ket m
axim
um (i
nclu
des
dedu
ctib
le)
Per
son:
non
e; F
amily
Max
: non
eP
erso
n: $
1,25
0; F
amily
Max
: $2,
500
Pre
scrip
tion
Dru
gs (r
etai
l)G
ener
ic10
0%10
0%; $
10 c
opay
Bra
nd80
%10
0%; $
20 c
opay
form
/$35
non
-form
.C
oord
inat
ion
with
Med
icar
eM
edic
are
Par
t 'A
'10
0% o
f Par
t 'A
' ded
uctib
le, 1
00%
of
Par
t 'A
' co-
pay
befo
re d
educ
tible
Med
icar
e P
art '
B'
100%
of P
art '
B' d
educ
tible
, 100
% o
f P
art '
B' c
oins
uran
ce b
efor
e de
duct
ible
Med
icar
e P
art '
B' P
rem
ium
Non
eN
one
Def
ined
dol
lar B
enef
itN
one
Non
e
Ben
efit
redu
ced
by M
edic
are
Ben
efit
The
follo
win
g ta
ble
com
pare
s N
atio
nal G
rid’s
and
Key
span
’s p
lan
desi
gns
Exhi
bit _
_ (M
PH-5
) Pa
ge 1
5 of
44
Exhibit __ (MPH-5) Page 15 of 44
98

©20
09 T
ower
s Pe
rrin
15P
ropr
ieta
ry a
nd C
onfid
entia
lN
ot fo
r use
or d
iscl
osur
e ou
tsid
e To
wer
s P
errin
and
its
clie
nts
Pos
t-re
tire
men
t M
edic
al B
enef
its
A k
ey fa
ctor
in K
eysp
an’s
Tot
al
rank
ing
is th
e ge
nero
us p
ost-6
5 P
PO
des
ign
vs. N
atio
nal G
rid’s
M
edic
are
Sup
plem
ent p
lan
In th
e em
ploy
er v
iew
Key
span
rank
s af
ter N
atio
nal G
ridK
eysp
an’s
empl
oyer
co
sts
for p
re-6
5 co
vera
ge is
cap
ped
at
50%
of t
he a
ctiv
e pr
emiu
m a
t the
tim
e of
re
tirem
ent,
whi
le
Nat
iona
l Grid
’s s
ubsi
dy is
th
e sa
me
as a
ctiv
e m
edic
alK
eysp
an’s
post
-65
cove
rage
is 1
00%
em
ploy
ee p
aid
whi
le
Nat
iona
l Grid
pro
vide
s a
min
imal
sub
sidy
to
empl
oyee
s
QG
HD
BU
EL
CP
NF
AI
MJ
RS
TO
PQ
NS
GT
LB
RU
IH
MF
EA
CD
JO
K
K
Exhi
bit _
_ (M
PH-5
) Pa
ge 1
6 of
44
Exhibit __ (MPH-5) Page 16 of 44
99

©20
09 T
ower
s Pe
rrin
16P
ropr
ieta
ry a
nd C
onfid
entia
lN
ot fo
r use
or d
iscl
osur
e ou
tsid
e To
wer
s P
errin
and
its
clie
nts
Pos
t-re
tire
men
t D
eath
Sco
re a
nd R
ank
The
follo
win
g ta
ble
illust
rate
s N
atio
nal G
rid’s
and
Key
span
’s c
ompe
titiv
e po
sitio
ning
re
lativ
e to
thei
r pee
r gro
up in
term
s of
pos
t-ret
irem
ent d
eath
Sev
en c
ompa
nies
do
not h
ave
empl
oyer
pro
vide
d po
st-re
tirem
ent d
eath
ben
efits
Pos
t-ret
irem
ent D
eath
Sco
re a
nd R
ank Sc
ore
Ran
k
Empl
oyer
Val
ueLe
gacy
Nat
iona
l Grid
111.
3
Lega
cy K
eysp
an11
1.3
Tota
l Val
ueLe
gacy
Nat
iona
l Grid
87.0
Lega
cy K
eysp
an87
.0
7/15
9/16
Exhi
bit _
_ (M
PH-5
) Pa
ge 1
7 of
44
Exhibit __ (MPH-5) Page 17 of 44
100

©20
09 T
ower
s Pe
rrin
17P
ropr
ieta
ry a
nd C
onfid
entia
lN
ot fo
r use
or d
iscl
osur
e ou
tsid
e To
wer
s P
errin
and
its
clie
nts
Pos
t-re
tire
men
t D
eath
Com
pari
son
The
follo
win
g ta
ble
outli
nes
Nat
iona
l Grid
’s p
ost-r
etire
men
t dea
th b
enef
its
Pos
t-ret
irem
ent D
eath
Ben
efit
Nat
iona
l Gri
d Ty
pe o
f cov
erag
eB
asic
Life
Par
ticip
atio
n R
equi
rem
ents
Age
61
or a
ge 5
5 &
age
+ s
ervic
e =
85M
onth
ly C
ontri
butio
nsN
one
Ear
ly R
etire
men
t Cov
erag
eS
ame
as N
orm
al R
etire
men
tN
orm
al R
etire
men
t Cov
erag
eR
educ
ed im
med
iate
ly to
$20
,000
for l
ife
Exhi
bit _
_ (M
PH-5
) Pa
ge 1
8 of
44
Exhibit __ (MPH-5) Page 18 of 44
101

©20
09 T
ower
s Pe
rrin
18P
ropr
ieta
ry a
nd C
onfid
entia
lN
ot fo
r use
or d
iscl
osur
e ou
tsid
e To
wer
s P
errin
and
its
clie
nts
Pos
t-re
tire
men
t D
eath
N, H
, B a
nd F
, whi
ch a
re
rank
ed h
ighe
st, h
ave
eith
er
grad
ual r
educ
tion
sche
dule
s or
hig
her b
enef
it m
axim
ums
(e.g
., .5
x pa
y or
$50
,000
)
N
H
B
F
G
RO
A
E
M
P
Q
L
C
D
J
IU
S
T
H
N
F
B
G
U
L
R
P
O
A
E
M
Q
C
D
J
I
S
T
Exhi
bit _
_ (M
PH-5
) Pa
ge 1
9 of
44
Exhibit __ (MPH-5) Page 19 of 44
102

Act
ive
Ben
efit
s
Exhi
bit _
_ (M
PH-5
) Pa
ge 2
0 of
44
Exhibit __ (MPH-5) Page 20 of 44
103
©20
09 T
ower
s Pe
rrin
20P
ropr
ieta
ry a
nd C
onfid
entia
lN
ot fo
r use
or d
iscl
osur
e ou
tsid
e To
wer
s P
errin
and
its
clie
nts
Act
ive
Med
ical
Pla
n D
eliv
ery
Mod
els
All
com
pani
es, e
xcep
t C, R
, and
D, o
ffer t
he e
mpl
oyee
s a
choi
ce o
f pla
n ty
pe
Mos
t com
pani
es th
at o
ffer p
lans
with
in-n
etw
ork
or o
ut-o
f-net
wor
k fe
atur
es o
ffer a
PP
O ra
ther
th
an a
PO
STw
elve
com
pani
es h
ave
the
PP
O a
s th
eir h
ighe
st e
nrol
led
plan
—
Two
com
pani
es h
ave
the
PO
S a
s th
eir h
ighe
st e
nrol
led
plan
and
thre
e co
mpa
nies
hav
e an
HM
O/E
PO
as
thei
r hig
hest
enr
olle
d pl
an—
P ha
s a
Trip
le O
ptio
n as
its
high
est e
nrol
led
plan
—C
and
H h
ave
a co
nsum
er d
riven
hea
lth p
lan
as th
eir h
ighe
st e
nrol
led
plan
For p
urpo
ses
of th
e B
EN
VA
L®, w
e ev
alua
ted
only
the
optio
n w
ith h
ighe
st e
nrol
lmen
t
Exhi
bit _
_ (M
PH-5
) Pa
ge 2
1 of
44
Exhibit __ (MPH-5) Page 21 of 44
104

©20
09 T
ower
s Pe
rrin
21P
ropr
ieta
ry a
nd C
onfid
entia
lN
ot fo
r use
or d
iscl
osur
e ou
tsid
e To
wer
s P
errin
and
its
clie
nts
Act
ive
Med
ical
Ben
efit
Sco
re a
nd R
ank
The
follo
win
g ta
ble
illust
rate
s N
atio
nal G
rid’s
and
Key
span
’s c
ompe
titiv
e po
sitio
ning
rela
tive
to
thei
r pee
r gro
up in
term
s of
act
ive
med
ical
pro
gram
s
Nat
iona
l Grid
and
Key
span
con
solid
ated
med
ical
ben
efits
effe
ctiv
e 1/
1/09
The
tota
l val
ue o
f the
ben
efit
rank
s 8t
h (s
light
ly a
bove
ave
rage
), th
e ra
nk s
lips
to 1
4th
base
d on
em
ploy
er v
alue
. Thi
s di
ffere
nce
is d
ue to
hig
her t
han
aver
age
cont
ribut
ions
Act
ive
Med
ical
Sco
re a
nd R
ank
Sco
reR
ank/
22Em
ploy
er V
alue
Lega
cy N
atio
nal G
rid97
.0
Lega
cy K
eysp
an97
.0
Tota
l Val
ueLe
gacy
Nat
iona
l Grid
102.
2
Lega
cy K
eysp
an10
2.2
14/2
2
8/22
Exhi
bit _
_ (M
PH-5
) Pa
ge 2
2 of
44
Exhibit __ (MPH-5) Page 22 of 44
105

©20
09 T
ower
s Pe
rrin
22P
ropr
ieta
ry a
nd C
onfid
entia
lN
ot fo
r use
or d
iscl
osur
e ou
tsid
e To
wer
s P
errin
and
its
clie
nts
Act
ive
Med
ical
Ben
efit
s C
ompa
riso
n
The
follo
win
g ta
ble
com
pare
s N
atio
nal G
rid’s
pla
n de
sign
rela
tive
to th
eir p
eer g
roup
pla
n de
sign
s
Key
Pla
n De
sign
Fea
ture
s - M
edic
al
Nat
iona
l Grid
Ra
nge
Aver
age
Mod
eIn
-net
wor
kD
educ
tible
Non
eP
erso
n: $
100
- $1,
500
Fam
ily: $
200
- $3,
000
Per
son:
$43
4 Fa
mily
: $91
1P
erso
n: $
100
Fam
ily:
$200
Coi
nsur
ance
100%
70-1
00%
89%
90%
Out
-of-p
ocke
t max
imum
Non
eP
erso
n: $
500
- $5,
000
Fam
ily: $
1,00
0 - $
10,0
00P
erso
n: $
1,70
6 Fa
mily
: $3
,715
Per
son:
$1,
500
Fam
ily:
$3,0
00
Inpa
tient
hos
pita
l10
0%; $
150
copa
y/st
ay70
-100
%; $
75 p
er d
ay -
$300
per
sta
y87
%; $
150
copa
y/st
ay90
%
Em
erge
ncy
room
100%
; $10
0 co
pay/
visit
(wai
ved
if ad
mitt
ed)
70-1
00%
; $25
- $1
50 c
opay
93%
; $68
cop
ay (w
aive
d if
adm
itted
)10
0%; $
50 (w
aive
d if
adm
itted
)O
ffice
vis
its10
0%: $
15 c
opay
70-1
00%
; $10
- $2
5 co
pay
95%
; $19
cop
ay10
0%; $
25 c
opay
Pre
scrip
tion
drug
s (R
etai
l)G
ener
ic10
0%; $
10 c
opay
70-1
00%
; $5
- $40
cop
ay92
%; $
12 c
opay
100%
; $10
cop
ayB
rand
100%
$20
cop
ay/$
35 c
opay
Form
ular
y: 7
0% -
100%
; $10
-$6
0 co
pay
Non
-For
mul
ary:
50
- 100
%;
$21
- $27
0 co
pay
Form
ular
y: 8
6%; $
27
copa
yN
on-F
orm
ular
y: 7
6%; $
59
copa
y
Form
ular
y: 1
00%
; $20
co
pay
Non
-For
mul
ary:
100
%;
$35
copa
yO
utpa
tient
men
tal h
ealth
100%
; $15
cop
ay70
-100
%; $
10 -
$30
copa
y96
%; $
18 c
opay
100%
; $15
cop
ay
Out
-of-n
etw
ork
Ded
uctib
leN
/AP
erso
n: $
200
- $2,
500
Fam
ily: $
500
- $5,
000
Per
son:
$70
0Fa
mily
: $1,
582
Per
son:
$50
0Fa
mily
: $1,
200
Coi
nsur
ance
N/A
50- 8
0%66
%70
%O
ut-o
f-poc
ket m
axim
umN
/AP
erso
n: $
1,00
0 - $
10,5
00Fa
mily
: $2,
000
- $31
,500
Per
son:
$4,
344
Fam
ily: $
9,95
0P
erso
n: $
5,00
0Fa
mily
: $10
,000
Mon
thly
Em
ploy
ee C
ontri
butio
nsE
mpl
oyee
onl
y$1
04.0
0 $0
- $3
74$9
0.06
86
Fam
ily$2
95.0
0 $0
- $1
,000
$278
.13
N/A
Com
para
tor G
roup
Exhi
bit _
_ (M
PH-5
) Pa
ge 2
3 of
44
Exhibit __ (MPH-5) Page 23 of 44
106

©20
09 T
ower
s Pe
rrin
23P
ropr
ieta
ry a
nd C
onfid
entia
lN
ot fo
r use
or d
iscl
osur
e ou
tsid
e To
wer
s P
errin
and
its
clie
nts
Act
ive
Med
ical
Ben
efit
s
Nat
iona
l Grid
’s m
edic
al p
lan
is s
light
ly a
bove
ave
rage
, ba
sed
on th
e to
tal v
alue
Th
is is
driv
en b
y th
e la
ck
of in
-net
wor
k de
duct
ible
an
d 10
0% c
oins
uran
ce
Nat
iona
l Grid
’s e
mpl
oyer
va
lue
is s
light
ly b
elow
av
erag
e du
e to
hig
her t
han
aver
age
empl
oyee
co
ntrib
utio
ns
The
two
high
est p
lans
, ba
sed
on to
tal v
alue
, hav
e 10
0% c
over
age
and
very
ge
nero
us R
x co
vera
ge
The
low
est p
lan
(H),
base
d on
tota
l val
ue, i
s a
cons
umer
dr
iven
hea
lth p
lan
F
N
P
R
Q
L
M
I
U
A
T
B
H
J G
E
C
D
O
S
B
A
D
I
T
E
C
U
S
J
O
G
H
M
F
L
P
Q
N
R
Exhi
bit _
_ (M
PH-5
) Pa
ge 2
4 of
44
Exhibit __ (MPH-5) Page 24 of 44
107

©20
09 T
ower
s Pe
rrin
24P
ropr
ieta
ry a
nd C
onfid
entia
lN
ot fo
r use
or d
iscl
osur
e ou
tsid
e To
wer
s P
errin
and
its
clie
nts
Den
tal B
enef
it S
core
and
Ran
k
The
follo
win
g ta
ble
illust
rate
s N
atio
nal G
rid’s
and
Key
span
’s c
ompe
titiv
e po
sitio
ning
rela
tive
to
thei
r pee
r gro
up in
term
s of
act
ive
dent
al p
rogr
ams
Nat
iona
l Grid
and
Key
span
con
solid
ated
den
tal b
enef
its e
ffect
ive
1/1/
09
Dent
al S
core
and
Ran
k
Scor
eRa
nk/2
2Em
ploy
er V
alue
Lega
cy N
atio
nal G
rid80
.5
Lega
cy K
eysp
an80
.5
Tota
l Val
ue
Lega
cy N
atio
nal G
rid87
.7
Lega
cy K
eysp
an87
.7
13/2
2
15/2
2
Exhi
bit _
_ (M
PH-5
) Pa
ge 2
5 of
44
Exhibit __ (MPH-5) Page 25 of 44
108

©20
09 T
ower
s Pe
rrin
25P
ropr
ieta
ry a
nd C
onfid
entia
lN
ot fo
r use
or d
iscl
osur
e ou
tsid
e To
wer
s P
errin
and
its
clie
nts
Den
tal B
enef
its
Com
pari
son
The
follo
win
g ta
ble
com
pare
s N
atio
nal G
rid’s
pla
n de
sign
rela
tive
to th
eir p
eer g
roup
pla
n de
sign
s
Den
tal B
enef
it
Nat
iona
l Gri
d R
ange
Ave
rage
Mod
eAn
nual
Ded
uctib
le*
Per
Per
son
$50;
Fam
ily M
ax
$150
Per
per
son
$0-$
125;
Fa
mily
Max
$0-
$375
Per
Per
son:
$50
Fam
ily M
ax: $
147
Per
Per
son:
$50
Fam
ily M
ax: $
150
Annu
al M
axim
um$2
,500
/per
son
(exc
lude
s or
tho)
$1,0
00-U
nlim
ited
$1,7
53$1
,500
Clea
ning
100%
, 2 c
lean
ings
per
yea
r 3
for s
peci
fic c
ondi
tions
80%
-100
%; 2
- 4
clea
ning
s98
%; 2
.25
clea
ning
s10
0%; 2
cle
anin
gs
Non
-Gol
d Fi
lling
80%
70-1
00%
82%
80%
Cro
wns
50%
50-8
5% ;
no li
mit
- 5
year
s56
% ;
.58
year
s50
%; 5
yea
rs
Orth
odon
tia C
over
age
100%
70-1
00%
57%
50%
Ort
hodo
ntia
Max
imum
$2,0
00 p
er li
fetim
e$7
50 -
unlim
ited
$1,7
69
$1,5
00
Mon
thly
Em
ploy
ee C
ontr
ibut
ions
Em
ploy
ee$1
6.00
$4
.00-
$67.
00$1
3.95
20Fa
mily
$45.
00
$12.
00-$
160.
00$4
2.15
24
Out
of N
etw
ork
Ded
uctib
leP
er p
erso
n $2
5-$2
50;
Fam
ily M
ax $
75-$
750
Per
Per
son:
$79
Fam
ily M
ax: $
238
Per
Per
son:
$50
Fam
ily M
ax: $
150
Ann
ual M
axim
um$1
500-
Unl
imite
d$1
,717
$1
,500
*
For p
urpo
ses
of c
alcu
latin
g av
erag
es, w
e as
sum
ed 3
X fo
r fam
ily m
axim
um if
ther
e is
no
limit
Com
para
tor G
roup
Exhi
bit _
_ (M
PH-5
) Pa
ge 2
6 of
44
Exhibit __ (MPH-5) Page 26 of 44
109

©20
09 T
ower
s Pe
rrin
26P
ropr
ieta
ry a
nd C
onfid
entia
lN
ot fo
r use
or d
iscl
osur
e ou
tsid
e To
wer
s P
errin
and
its
clie
nts
Den
tal B
enef
its
Nat
iona
l Grid
’s b
elow
av
erag
e em
ploy
er ra
nk is
du
e to
hig
her t
han
aver
age
empl
oyee
con
tribu
tions
F on
ly o
ffers
an
empl
oyee
pa
y al
l pro
gram
T an
d E
hav
e pl
ans
with
no
ded
uctib
le a
nd lo
w
empl
oyee
con
tribu
tions
T ha
s an
unl
imite
d or
thod
ontia
max
imum
an
d E
has
a $
3,50
0 pe
r life
time
max
imum
T
E
G
I
Q
P
B
H
J
M
N
O
D
U
L
C
S
A
R
F
S
C
R
L
F
U
T
Q
E
I
H
G
P
A
B
O
N
M
D
J
Exhi
bit _
_ (M
PH-5
) Pa
ge 2
7 of
44
Exhibit __ (MPH-5) Page 27 of 44
110

©20
09 T
ower
s Pe
rrin
27P
ropr
ieta
ry a
nd C
onfid
entia
lN
ot fo
r use
or d
iscl
osur
e ou
tsid
e To
wer
s P
errin
and
its
clie
nts
Life
Ins
uran
ce/A
D&
D B
enef
it S
core
and
Ran
k
The
follo
win
g ta
ble
illust
rate
s N
atio
nal G
rid’s
and
Key
span
’s c
ompe
titiv
e po
sitio
ning
rela
tive
to
thei
r pee
r gro
up in
term
s of
life
insu
ranc
e an
d A
D&
D p
rogr
ams
Em
ploy
er V
alue
s ar
e dr
iven
by
the
optio
nal b
enef
its (e
.g.,
optio
nal l
ife, s
pous
e an
d de
pend
ent l
ife) a
nd th
e as
soci
ated
em
ploy
ee c
ontri
butio
n
Life
Insu
ranc
e/AD
&D
- A
ctiv
e Sc
ore
and
Ran
k
Sco
reR
ank/
22Em
ploy
er V
alue
Lega
cy N
atio
nal G
rid10
4.3
Lega
cy K
eysp
an10
4.3
Tota
l Val
ue
Lega
cy N
atio
nal G
rid10
3.0
Lega
cy K
eysp
an10
3.0
11/2
2
11/2
2
Exhi
bit _
_ (M
PH-5
) Pa
ge 2
8 of
44
Exhibit __ (MPH-5) Page 28 of 44
111

©20
09 T
ower
s Pe
rrin
28P
ropr
ieta
ry a
nd C
onfid
entia
lN
ot fo
r use
or d
iscl
osur
e ou
tsid
e To
wer
s P
errin
and
its
clie
nts
Act
ive
Life
Ins
uran
ce/A
D&
D C
ompa
riso
n
The
follo
win
g ta
ble
com
pare
s N
atio
nal G
rid’s
pla
n de
sign
rela
tive
to th
eir p
eer g
roup
pla
n de
sign
s
Life
Insu
ranc
e/AD
&D B
enef
it
Nat
iona
l Grid
R
ange
A
vera
ge
Mod
eB
asic
1x p
ay$1
0,00
0- 4
x pa
yN
/A1x
pay
M
axim
um
$1,5
00,0
00
$30,
000-
unlim
ited
$1,6
37,8
57
$1,0
00,0
00
Sup
plem
enta
lE
mpl
oyee
opt
ion
1 to
5x
pay
in m
ultip
les
of 1
x pa
y 3x
- 10
x pa
yN
/A1
to 8
x pa
y in
m
ultip
les
of 1
x pa
yM
axim
um
$1,0
00,0
00
$300
,000
-$1
0,00
0,00
0N
/A$4
,000
,000
Dep
ende
ntS
pous
eO
ptio
n I:
$10,
000
to $
100,
000
in
mul
tiple
s of
$10
,000
$5,0
00 -
4x p
ayN
/AN
/A
Chi
ldre
n:O
ptio
n I:
$2,5
00
$1,0
00 -
$20,
000
N/A
$,50
00 o
r $10
,000
Opt
ion
II:$4
,000
O
ptio
n III
: $1
0,00
0 O
ptio
n V
II:A
ccid
enta
l Dea
th-A
ctiv
eP
artic
ipat
ion
Req
uire
men
ts1
mon
th o
f svc
Dire
ctor
s, m
anag
ers,
of
ficer
s - N
one
N/A
Non
eM
onth
ly E
mpl
oyee
Con
tribu
tions
Non
eN
one
Non
eN
one
Dea
th B
enef
it A
mou
nt2x
pay
; Max
$60
0,00
0$1
0,00
0-un
limite
d1.
27x
pay;
$1,
352,
500
1x p
ay; $
1,50
0,00
0
Com
para
tor
Gro
up
Exhi
bit _
_ (M
PH-5
) Pa
ge 2
9 of
44
Exhibit __ (MPH-5) Page 29 of 44
112

©20
09 T
ower
s Pe
rrin
29P
ropr
ieta
ry a
nd C
onfid
entia
lN
ot fo
r use
or d
iscl
osur
e ou
tsid
e To
wer
s P
errin
and
its
clie
nts
Life
Ins
uran
ce/A
D&
D B
enef
its
Nat
iona
l Grid
’s B
asic
Life
am
ount
and
max
imum
is in
line
with
com
petit
ive
norm
s
Nat
iona
l Grid
’s s
uppl
emen
tal l
ife b
enef
it of
1 to
5x
pay
in m
ultip
les
of 1
x pa
y w
ith a
max
imum
of
$1,0
00,0
00 is
bel
ow th
e co
mpe
titiv
e m
ode
of 1
to 8
x pa
y in
mul
tiple
s of
1x
pay
with
a m
axim
um
of $
4,00
0,00
0
Spo
use
life
bene
fits
are
belo
w c
ompe
titiv
e no
rms
as o
ther
com
pani
es o
ffer s
pous
e be
nefit
s in
ex
cess
of $
100,
000
(Nat
iona
l Grid
’s h
ighe
st le
vel)
Chi
ld li
fe is
in li
ne w
ith n
orm
s al
thou
gh m
ost o
ffer a
two
optio
n ($
5,00
0 or
$10
,000
) ins
tead
of a
th
ree
optio
n pl
an
The
aver
age
AD
&D
ben
efit
amou
nt is
1x
pay;
Nat
iona
l Grid
’s is
2x
pay
with
a lo
wer
than
av
erag
e m
axim
um
Exhi
bit _
_ (M
PH-5
) Pa
ge 3
0 of
44
Exhibit __ (MPH-5) Page 30 of 44
113
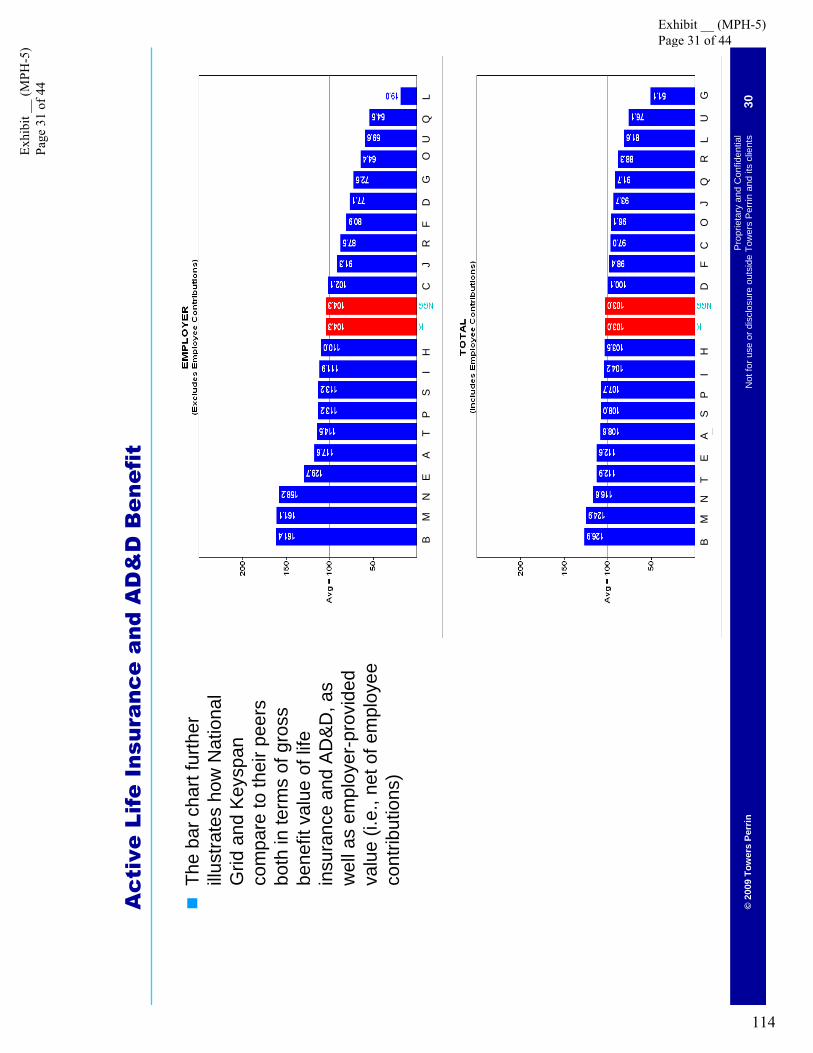
©20
09 T
ower
s Pe
rrin
30P
ropr
ieta
ry a
nd C
onfid
entia
lN
ot fo
r use
or d
iscl
osur
e ou
tsid
e To
wer
s P
errin
and
its
clie
nts
Act
ive
Life
Ins
uran
ce a
nd A
D&
D B
enef
it
The
bar c
hart
furth
er
illust
rate
s ho
w N
atio
nal
Grid
and
Key
span
co
mpa
re to
thei
r pee
rs
both
in te
rms
of g
ross
be
nefit
val
ue o
f life
in
sura
nce
and
AD
&D
, as
wel
l as
empl
oyer
-pro
vide
d va
lue
(i.e.
, net
of e
mpl
oyee
co
ntrib
utio
ns)
B
M
N
T
E
A
S
P
I
H
D
F
C
O
J
Q
R
L
U
G
B
M
N
E
A
T
P
S
I
HC
J
R
F
D
G
O
U
Q
L
Exhi
bit _
_ (M
PH-5
) Pa
ge 3
1 of
44
Exhibit __ (MPH-5) Page 31 of 44
114

©20
09 T
ower
s Pe
rrin
31P
ropr
ieta
ry a
nd C
onfid
entia
lN
ot fo
r use
or d
iscl
osur
e ou
tsid
e To
wer
s P
errin
and
its
clie
nts
Sho
rt T
erm
Dis
abili
ty S
core
and
Ran
k
The
follo
win
g ta
ble
illust
rate
s N
atio
nal G
rid’s
and
Key
span
’s c
ompe
titiv
e po
sitio
ning
rela
tive
to
thei
r pee
r gro
up in
term
s of
STD
pro
gram
sIn
term
s of
Tot
al V
alue
, bot
h N
atio
nal G
rid a
nd K
eysp
an’s
ove
rall
desi
gns
are
belo
w a
vera
ge
rela
tive
to th
eir c
ompe
titor
s (e
.g.,
both
Nat
iona
l Grid
and
Key
span
pro
vide
100
% o
f pay
for
one
wee
k at
one
yea
r of s
ervi
ce, a
nd fi
ve w
eeks
at f
ive
year
s of
serv
ice)
, com
pare
d to
the
com
petit
or a
vera
ge o
f tw
o an
d se
ven
wee
ks a
t 100
%, r
espe
ctiv
ely
Bot
h N
atio
nal G
rid’s
and
Key
span
’s E
mpl
oyer
Val
ue c
ompe
titiv
e po
sitio
ning
impr
oves
slig
htly
re
lativ
e to
the
Tota
l Val
ue d
ue to
the
fact
that
two
empl
oyer
s (P
and
Q) i
n th
e co
mpa
rato
r gr
oup
requ
ire e
mpl
oyee
con
tribu
tions
for t
he s
alar
y co
ntin
uanc
e pl
anS
TD re
sults
on
thei
r ow
n ca
n be
ske
wed
by
the
bene
fit p
erio
d (i.
e., t
he b
enef
it pe
riod
varie
s fro
m th
ree
mon
ths
to o
ne y
ear a
mon
gst t
he g
roup
), as
a re
sult,
it is
impo
rtant
to re
view
STD
an
d LT
D o
n a
com
bine
d ba
sis
(refe
r to
page
37)
Sho
rt Te
rm D
isab
ility
Sco
re a
nd R
ank
Scor
eRa
nk/2
2Em
ploy
er V
alue
Lega
cy N
atio
nal G
rid10
5.7
12/2
2
Lega
cy K
eysp
an98
.817
/22
Tota
l Val
ue
Lega
cy N
atio
nal G
rid99
.215
/22
Lega
cy K
eysp
an92
.620
/22
Exhi
bit _
_ (M
PH-5
) Pa
ge 3
2 of
44
Exhibit __ (MPH-5) Page 32 of 44
115

©20
09 T
ower
s Pe
rrin
32P
ropr
ieta
ry a
nd C
onfid
entia
lN
ot fo
r use
or d
iscl
osur
e ou
tsid
e To
wer
s P
errin
and
its
clie
nts
Sho
rt T
erm
Dis
abili
ty C
ompa
riso
n
The
follo
win
g ta
ble
com
pare
s N
atio
nal G
rid’s
and
Key
span
’s p
lan
desi
gn re
lativ
e to
thei
r pe
er g
roup
pla
n de
sign
s
Sho
rt T
erm
Dis
abili
ty
Leg
acy
Nat
iona
l Gri
d L
egac
y K
eysp
an
Rang
eAv
erag
eM
ode
Sic
k Pa
y1s
t day
of d
isab
ility
1s
t day
of d
isab
ility
1s
t day
of d
isab
ility
N/A
1st d
ay o
f dis
abili
tyS
alar
y C
ontin
uanc
eE
nd o
f Sic
k pa
yE
nd o
f Sic
k pa
yE
nd o
f sic
k tim
e - 1
st
day
of d
isab
ility
End
of s
ick
time
Ben
efit
Am
ount
Sic
k Pa
yW
eeks
at 1
00%
Wee
ks a
t 100
%W
eeks
at 1
00%
Wee
ks a
t 100
%W
eeks
at 1
00%
Yea
rs o
f Ser
vice
11
11-
102
25
55
1-26
710
1010
101-
3011
815
1515
1-45
1426
2020
201-
6016
2625
2525
1-75
1726
3030
301-
9019
2635
3535
1-10
520
26
Sal
ary
Con
tinua
nce
70%
of p
ay le
ss p
rimar
y S
ocia
l Sec
urity
, les
s de
pend
ent S
ocia
l S
ecur
ity
50%
of p
ay in
clud
es
sick
ness
& a
ccid
ent;
paya
ble
per d
isab
ility
No
sala
ry c
ontin
uanc
e -
100%
of p
ay 5
2 w
eeks
pe
r dis
abili
ty
N/A
YO
S S
ched
ule
(sal
ary
cont
inua
nce
varie
s fro
m
dolla
r val
ue to
pe
rcen
tage
of p
ay)
Yea
rs o
f Ser
vice
152
135
5213
1052
1315
5213
2052
1325
5213
3052
1335
5213
Com
para
tor
Gro
up
Exhi
bit _
_ (M
PH-5
) Pa
ge 3
3 of
44
Exhibit __ (MPH-5) Page 33 of 44
116

©20
09 T
ower
s Pe
rrin
33P
ropr
ieta
ry a
nd C
onfid
entia
lN
ot fo
r use
or d
iscl
osur
e ou
tsid
e To
wer
s P
errin
and
its
clie
nts
Sho
rt T
erm
Dis
abili
ty
The
bar c
hart
furth
er
illust
rate
s ho
w N
atio
nal G
rid
and
Key
span
com
pare
to th
eir
peer
s bo
th in
term
s of
gro
ss
bene
fit v
alue
of S
TD p
lans
, as
wel
l as
empl
oyer
-pro
vide
d va
lue
(i.e.
, net
of e
mpl
oyee
co
ntrib
utio
ns)
M
F
G
E
O
B
U
A
T
R
HS
C
I
L
D
J
P
N
Q
M
F
G
E
N
O
B
U
Q
A
P
T
R
HS
C
I
L
D
J
Exhi
bit _
_ (M
PH-5
) Pa
ge 3
4 of
44
Exhibit __ (MPH-5) Page 34 of 44
117
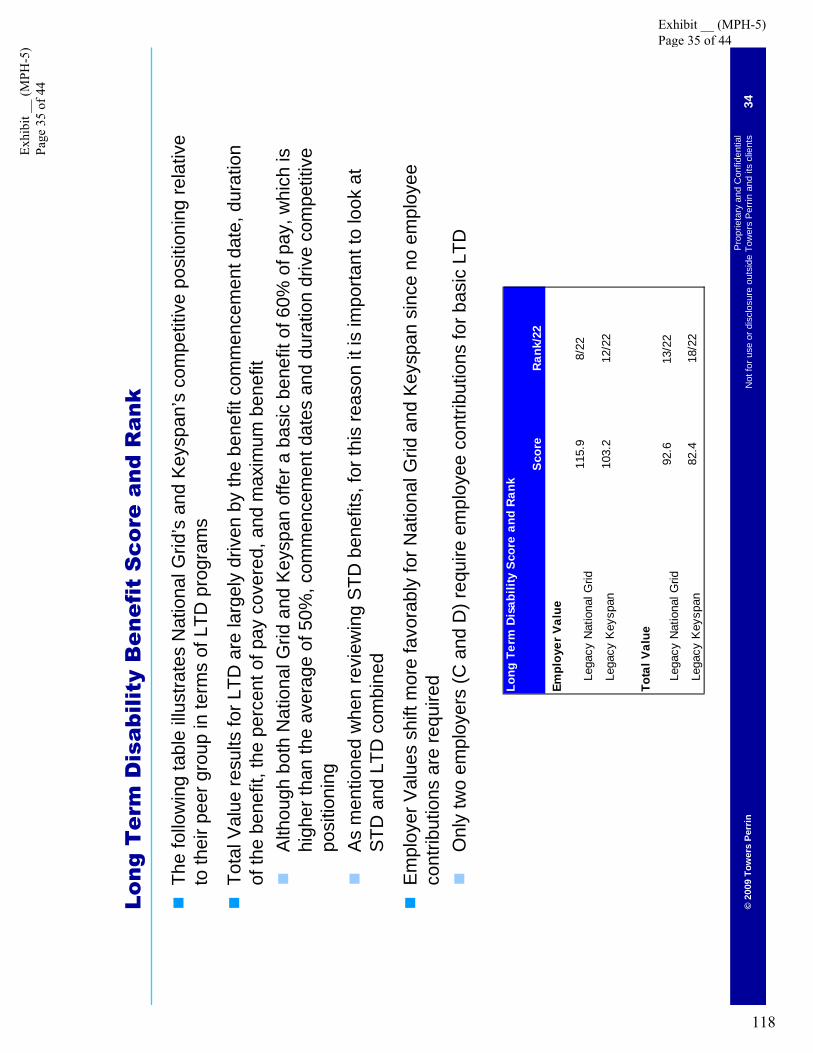
©20
09 T
ower
s Pe
rrin
34P
ropr
ieta
ry a
nd C
onfid
entia
lN
ot fo
r use
or d
iscl
osur
e ou
tsid
e To
wer
s P
errin
and
its
clie
nts
Long
Ter
m D
isab
ility
Ben
efit
Sco
re a
nd R
ank
The
follo
win
g ta
ble
illust
rate
s N
atio
nal G
rid’s
and
Key
span
’s c
ompe
titiv
e po
sitio
ning
rela
tive
to th
eir p
eer g
roup
in te
rms
of L
TD p
rogr
ams
Tota
l Val
ue re
sults
for L
TD a
re la
rgel
y dr
iven
by
the
bene
fit c
omm
ence
men
t dat
e, d
urat
ion
of th
e be
nefit
, the
per
cent
of p
ay c
over
ed, a
nd m
axim
um b
enef
itA
lthou
gh b
oth
Nat
iona
l Grid
and
Key
span
offe
r a b
asic
ben
efit
of60
% o
f pay
, whi
ch is
hi
gher
than
the
aver
age
of 5
0%, c
omm
ence
men
t dat
es a
nd d
urat
ion
driv
e co
mpe
titiv
e po
sitio
ning
As
men
tione
d w
hen
revi
ewin
g S
TD b
enef
its, f
or th
is re
ason
it is
impo
rtant
to lo
ok a
t S
TD a
nd L
TD c
ombi
ned
Em
ploy
er V
alue
s sh
ift m
ore
favo
rabl
y fo
r Nat
iona
l Grid
and
Key
span
sin
ce n
o em
ploy
ee
cont
ribut
ions
are
requ
ired
Onl
y tw
o em
ploy
ers
(C a
nd D
) req
uire
em
ploy
ee c
ontri
butio
ns fo
r bas
ic L
TD
Long
Ter
m D
isab
ility
Sco
re a
nd R
ank
Scor
eRa
nk/2
2Em
ploy
er V
alue
Lega
cy N
atio
nal G
rid11
5.9
8/22
Lega
cy K
eysp
an10
3.2
12/2
2
Tota
l Val
ue
Lega
cy N
atio
nal G
rid92
.613
/22
Lega
cy K
eysp
an82
.418
/22
Exhi
bit _
_ (M
PH-5
) Pa
ge 3
5 of
44
Exhibit __ (MPH-5) Page 35 of 44
118

©20
09 T
ower
s Pe
rrin
35P
ropr
ieta
ry a
nd C
onfid
entia
lN
ot fo
r use
or d
iscl
osur
e ou
tsid
e To
wer
s P
errin
and
its
clie
nts
Long
Ter
m D
isab
ility
Com
pari
son
The
follo
win
g ta
ble
com
pare
s N
atio
nal G
rid’s
and
Key
span
’s p
lan
desi
gn re
lativ
e to
thei
r pe
er g
roup
pla
n de
sign
s
Long
Ter
m D
isab
ility
Leg
acy
Nat
iona
l Gri
d L
egac
y K
eysp
an
Rang
eAv
erag
eM
ode
Com
men
cem
ent
Afte
r exh
aust
ion
of s
hort-
term
di
sabi
lity
bene
fits
Late
r of 9
0 ca
lend
ar d
ays
of
disa
bilit
y or
exh
aust
ion
of
shor
t-ter
m d
isab
ility
ben
efits
1 ye
ar -
13 w
eeks
of
disa
bilit
yN
/A26
wee
ks o
f di
sabi
lity
Dura
tion
Men
tal H
ealth
/Che
mic
To a
ge 6
52
year
s12
mon
ths
to a
ge 6
5N
/A24
mon
ths
Amou
nt
Max
imum
Fro
m a
ll So
urce
s70
% o
f pay
, les
s pr
imar
y S
ocia
l Sec
urity
, les
s de
pend
ent S
ocia
l Sec
urity
$15,
000
per m
onth
$3,0
00 -
$17,
500
$11,
696
/ mon
th$1
0,00
0 / m
onth
60%
of p
ay, l
ess
prim
ary
Soc
ial S
ecur
ity60
% o
f pay
, les
s pr
imar
y S
ocia
l Sec
urity
, dep
ende
nt
Soc
ial S
ecur
ity, l
ess
pens
ion
bene
fits
Com
para
tor G
roup
35%
less
prim
ary
soci
al
secu
rity
- 70%
less
pr
imar
y S
ocia
l Sec
urity
58%
; les
s pr
imar
y S
ocia
l Sec
urity
, les
s de
pend
ent S
ocia
l S
ecur
ity, l
ess
pens
ion
60%
les
s pr
imar
y S
ocia
l S
ecur
ity
Exhi
bit _
_ (M
PH-5
) Pa
ge 3
6 of
44
Exhibit __ (MPH-5) Page 36 of 44
119

©20
09 T
ower
s Pe
rrin
36P
ropr
ieta
ry a
nd C
onfid
entia
lN
ot fo
r use
or d
iscl
osur
e ou
tsid
e To
wer
s P
errin
and
its
clie
nts
Long
Ter
m D
isab
ility
Ben
efit
The
follo
win
g ba
r cha
rt fu
rther
illu
stra
tes
how
Nat
iona
l Grid
an
d K
eysp
an c
ompa
re to
thei
r pe
ers
both
in te
rms
of g
ross
be
nefit
val
ue o
f LTD
pla
ns, a
s w
ell a
s em
ploy
er-p
rovi
ded
valu
e (i.
e., n
et o
f em
ploy
ee
cont
ribut
ions
)
J
P
A
R
I
S
OQ
L
D
G
E
N
F
T
H
C
B
U
M
F
B
U
ML
G
E
N
J
D
T
I
Q
P
A
C
H
R
S
O
Exhi
bit _
_ (M
PH-5
) Pa
ge 3
7 of
44
Exhibit __ (MPH-5) Page 37 of 44
120

©20
09 T
ower
s Pe
rrin
37P
ropr
ieta
ry a
nd C
onfid
entia
lN
ot fo
r use
or d
iscl
osur
e ou
tsid
e To
wer
s P
errin
and
its
clie
nts
Sho
rt T
erm
Dis
abili
ty a
nd L
ong
Ter
m D
isab
ility
As
prev
ious
ly m
entio
ned,
be
caus
e di
fferin
g el
imin
atio
n pe
riods
can
ske
w re
sults
w
hen
look
ing
at S
TD a
nd
LTD
ben
efits
indi
vidu
ally
, it i
s al
so im
porta
nt to
look
at t
he
entir
e di
sabi
lity
cont
inuu
m
T
F
Q
M
P
A
O
I
H
R
D
B
G
C
S
U
J
E
NL
M
A
O
R
B
G
S
UI
F
E
J
L
T
H
D
C
P
Q
N
Exhi
bit _
_ (M
PH-5
) Pa
ge 3
8 of
44
Exhibit __ (MPH-5) Page 38 of 44
121
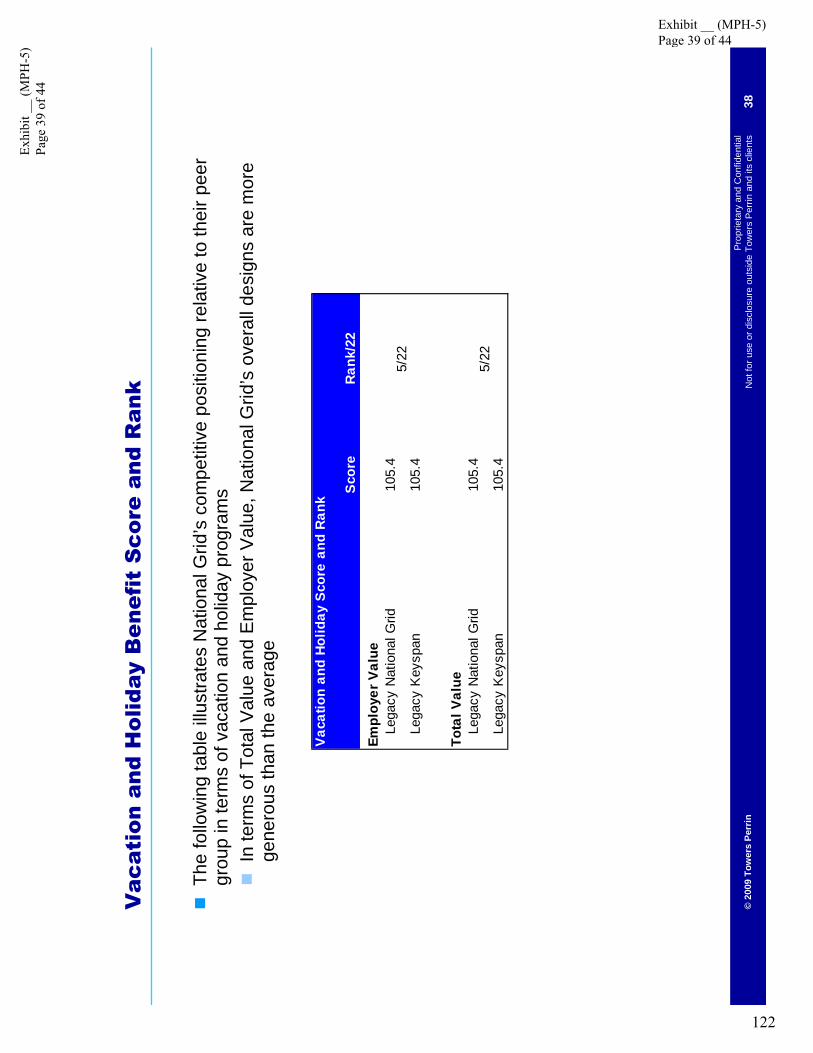
©20
09 T
ower
s Pe
rrin
38P
ropr
ieta
ry a
nd C
onfid
entia
lN
ot fo
r use
or d
iscl
osur
e ou
tsid
e To
wer
s P
errin
and
its
clie
nts
Vac
atio
n an
d H
olid
ay B
enef
it S
core
and
Ran
k
The
follo
win
g ta
ble
illus
trate
s N
atio
nal G
rid’s
com
petit
ive
posi
tioni
ng re
lativ
e to
thei
r pee
r gr
oup
in te
rms
of v
acat
ion
and
holid
ay p
rogr
ams
In te
rms
of T
otal
Val
ue a
nd E
mpl
oyer
Val
ue, N
atio
nal G
rid’s
ove
rall
desi
gns
are
mor
e ge
nero
us th
an th
e av
erag
e
Vaca
tion
and
Holid
ay S
core
and
Ran
k
Scor
eRa
nk/2
2Em
ploy
er V
alue
Lega
cy N
atio
nal G
rid10
5.4
Lega
cy K
eysp
an10
5.4
Tota
l Val
ueLe
gacy
Nat
iona
l Grid
105.
4
Lega
cy K
eysp
an10
5.4
5/22
5/22
Exhi
bit _
_ (M
PH-5
) Pa
ge 3
9 of
44
Exhibit __ (MPH-5) Page 39 of 44
122

©20
09 T
ower
s Pe
rrin
39P
ropr
ieta
ry a
nd C
onfid
entia
lN
ot fo
r use
or d
iscl
osur
e ou
tsid
e To
wer
s P
errin
and
its
clie
nts
Vac
atio
n an
d H
olid
ay B
enef
its
Com
pari
son
The
follo
win
g ta
ble
com
pare
s N
atio
nal G
rid’s
and
Key
span
’s p
lan
desi
gn re
lativ
e to
thei
r pe
er g
roup
pla
n de
sign
s
Ove
rall
vaca
tion
days
per
yea
r of s
ervi
ce a
re in
-line
/slig
htly
mor
e ge
nero
us th
an th
e co
mpe
titor
ave
rage
Nat
iona
l Grid
pol
icie
s on
vac
atio
n ca
rryov
er, b
uyin
g an
d se
lling
are
mor
e ge
nero
us th
an
com
petit
or c
ompa
nies
Vaca
tion
and
Holid
ay P
ract
ices
Nat
iona
l Gri
d R
ange
Ave
rage
Mod
e Am
ount
of V
acat
ion
(day
s)Y
ears
of S
ervic
e<1
Up
to 1
50-
179.
47U
p to
10
115
10-1
711
.410
515
10-2
214
.115
1015
15-2
217
.215
1520
15-2
420
.020
2025
20-2
521
.720
2525
20-3
025
.125
3025
20-3
226
.325
Holid
ay P
olic
yC
ompa
ny S
ched
uled
96-
129.
110
Em
ploy
ee S
ched
uled
30-
72.
23
Com
para
tor G
roup
Exhi
bit _
_ (M
PH-5
) Pa
ge 4
0 of
44
Exhibit __ (MPH-5) Page 40 of 44
123
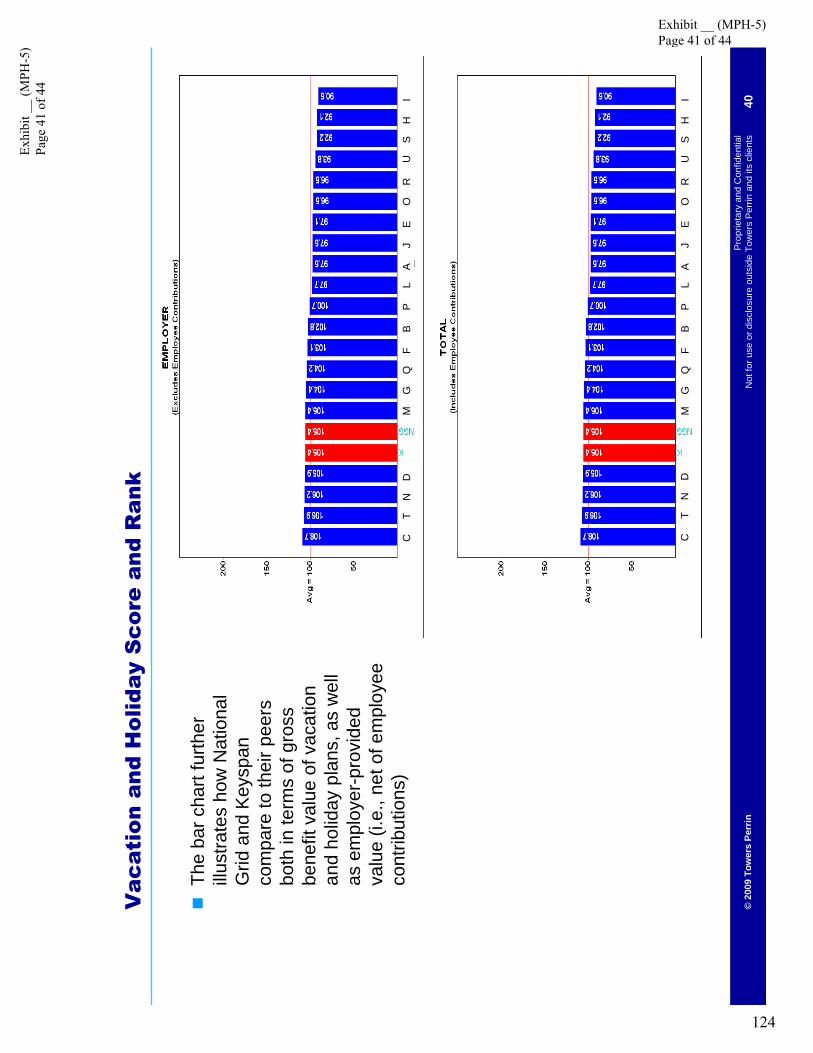
©20
09 T
ower
s Pe
rrin
40P
ropr
ieta
ry a
nd C
onfid
entia
lN
ot fo
r use
or d
iscl
osur
e ou
tsid
e To
wer
s P
errin
and
its
clie
nts
Vac
atio
n an
d H
olid
ay S
core
and
Ran
k
The
bar c
hart
furth
er
illust
rate
s ho
w N
atio
nal
Grid
and
Key
span
co
mpa
re to
thei
r pee
rs
both
in te
rms
of g
ross
be
nefit
val
ue o
f vac
atio
n an
d ho
liday
pla
ns, a
s w
ell
as e
mpl
oyer
-pro
vide
d va
lue
(i.e.
, net
of e
mpl
oyee
co
ntrib
utio
ns)
M
G
Q
F
B
P
L
A
J
E
O
R
U
S
H
I
M
G
Q
F
B
P
L
A
J
E
O
R
U
S
H
IC
T
N
D
C
T
N
D
Exhi
bit _
_ (M
PH-5
) Pa
ge 4
1 of
44
Exhibit __ (MPH-5) Page 41 of 44
124

Sum
mar
y
Exhi
bit _
_ (M
PH-5
) Pa
ge 4
2 of
44
Exhibit __ (MPH-5) Page 42 of 44
125

©20
09 T
ower
s Pe
rrin
42P
ropr
ieta
ry a
nd C
onfid
entia
lN
ot fo
r use
or d
iscl
osur
e ou
tsid
e To
wer
s P
errin
and
its
clie
nts
Sum
mar
y
Pro
visi
onEm
ploy
er V
alue
Tota
l Val
ueEm
ploy
er V
alue
Tota
l Val
ueEn
tire
Ben
efit
Pro
gram
93.3
98.6
93.2
105.
6D
efin
ed B
enef
it +
Def
ined
con
tribu
tion
75.4
98.8
81.1
105.
6
Pos
t-ret
irem
ent M
edic
al57
.267
.043
.914
1.5
Pos
t-ret
irem
ent D
eath
111.
387
.011
1.3
87.0
Ret
irem
ent E
vent
s76
.396
.072
.511
2.1
Act
ive M
edic
al97
.010
2.2
97.0
102.
2
Den
tal
80.5
87.7
80.5
87.7
Life
Insu
ranc
e/A
D&
D10
4.3
103.
010
4.3
103.
0
STD
105.
799
.298
.892
.6
LTD
115.
992
.610
3.2
82.4
Vac
atio
n +
Hol
iday
105.
410
5.4
105.
410
5.4
Lega
cy K
eysp
anLe
gacy
Nat
iona
l Grid
As
note
d th
roug
hout
this
doc
umen
t, th
ere
are
som
e be
nefit
pro
visi
ons
that
are
mor
e ge
nero
us th
an th
e co
mpe
titor
gro
up, a
nd o
ther
s th
at a
re le
ss g
ener
ous
than
the
com
petit
or
grou
p, w
hich
ulti
mat
ely
cont
ribut
e to
the
over
all E
ntire
Ben
efit
Pro
gram
sco
reIn
term
s of
Em
ploy
er V
alue
, Nat
iona
l Grid
and
Key
span
are
bel
ow a
vera
ge d
ue to
less
th
an a
vera
ge re
tirem
ent (
DC
, DB
and
retir
ee m
edic
al) b
enef
its
In te
rms
of T
otal
Val
ue, t
he b
enef
its a
re a
t ave
rage
for N
atio
nal G
rid a
nd a
bove
ave
rage
fo
r Key
span
—Th
e ab
ove
aver
age
bene
fits
for K
eysp
an a
re d
ue to
retir
ee m
edic
al
Exhi
bit _
_ (M
PH-5
) Pa
ge 4
3 of
44
Exhibit __ (MPH-5) Page 43 of 44
126
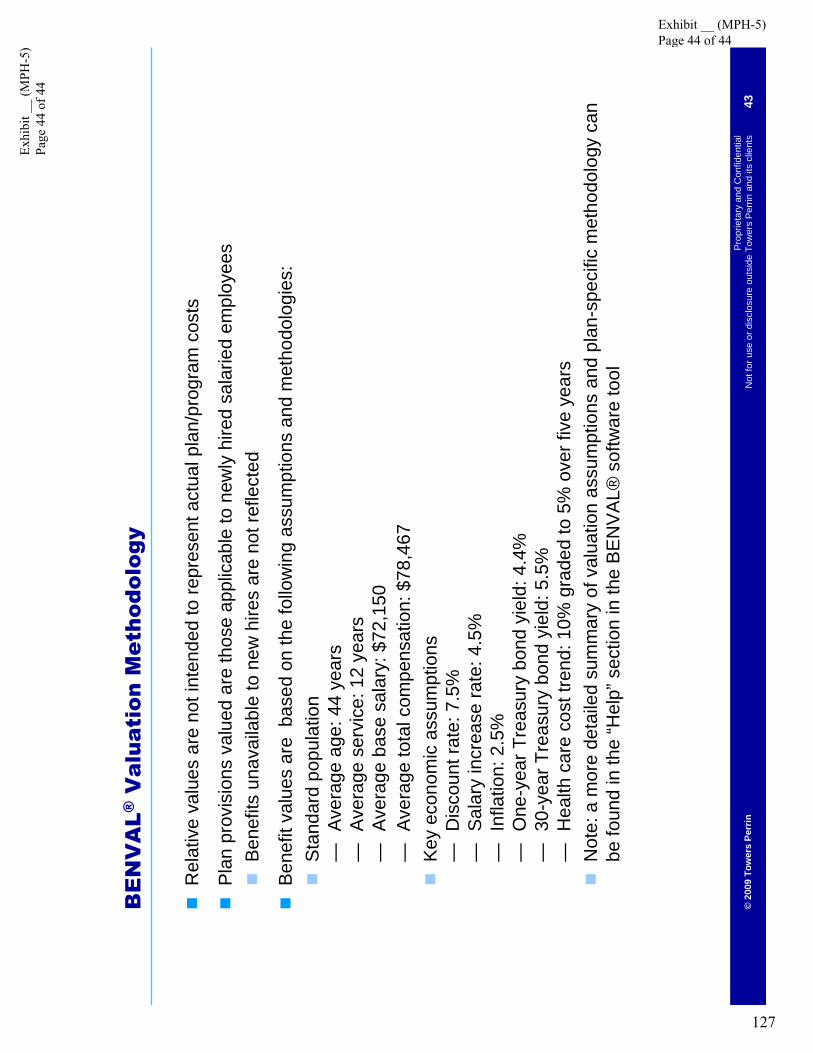
©20
09 T
ower
s Pe
rrin
43P
ropr
ieta
ry a
nd C
onfid
entia
lN
ot fo
r use
or d
iscl
osur
e ou
tsid
e To
wer
s P
errin
and
its
clie
nts
BE
NV
AL®
Val
uati
on M
etho
dolo
gy
Rel
ativ
e va
lues
are
not
inte
nded
to re
pres
ent a
ctua
l pla
n/pr
ogra
m c
osts
Pla
n pr
ovis
ions
val
ued
are
thos
e ap
plic
able
to n
ewly
hire
d sa
larie
d em
ploy
ees
Ben
efits
una
vaila
ble
to n
ew h
ires
are
not r
efle
cted
Ben
efit
valu
es a
re b
ased
on
the
follo
win
g as
sum
ptio
ns a
nd m
etho
dolo
gies
:S
tand
ard
popu
latio
n—
Aver
age
age:
44
year
s—
Aver
age
serv
ice:
12
year
s—
Aver
age
base
sal
ary:
$72
,150
—Av
erag
e to
tal c
ompe
nsat
ion:
$78
,467
Key
eco
nom
ic a
ssum
ptio
ns—
Dis
coun
t rat
e: 7
.5%
—Sa
lary
incr
ease
rate
: 4.5
%
—In
flatio
n: 2
.5%
—O
ne-y
ear T
reas
ury
bond
yie
ld: 4
.4%
—30
-yea
r Tre
asur
y bo
nd y
ield
: 5.5
%—
Hea
lth c
are
cost
tren
d: 1
0% g
rade
d to
5%
ove
r fiv
e ye
ars
Not
e: a
mor
e de
taile
d su
mm
ary
of v
alua
tion
assu
mpt
ions
and
pla
n-sp
ecifi
c m
etho
dolo
gy c
an
be fo
und
in th
e “H
elp”
sect
ion
in th
e B
EN
VA
L®so
ftwar
e to
ol
Exhi
bit _
_ (M
PH-5
) Pa
ge 4
4 of
44
Exhibit __ (MPH-5) Page 44 of 44
127

Exhibit __ (M
PH-6)
Testimony of Maureen P. Heaphy
Exhibit __ (MPH-6)
National Grid – BENVAL Analysis for Legacy National Grid New York Union Benefits
128

Dec
embe
r 14,
200
9
©20
09 T
ower
s Pe
rrin
BEN
VAL
Ana
lysi
s fo
r Leg
acy
Nat
iona
l Grid
N
ew Y
ork
Uni
on B
enef
its
Nat
iona
l Gri
d
Pro
prie
tary
and
Con
fiden
tial
Not
for u
se o
r dis
clos
ure
outs
ide
Tow
ers
Per
rin a
nd it
s cl
ient
s
Exhi
bit _
_ (M
PH-6
) Pa
ge 1
of 4
7Exhibit __ (MPH-6) Page 1 of 47
129
1©
2009
Tow
ers
Perr
inP
ropr
ieta
ry a
nd C
onfid
entia
lN
ot fo
r use
or d
iscl
osur
e ou
tsid
e To
wer
s P
errin
and
its
clie
nts
Tab
le o
f C
onte
nts
Ove
rvie
w o
f Com
petit
ive
Ass
essm
ent
Ent
ire B
enef
it P
rogr
am
Ret
irem
ent B
enef
its
Act
ive
Ben
efits
Sum
mar
y
Exhi
bit _
_ (M
PH-6
) Pa
ge 2
of 4
7Exhibit __ (MPH-6) Page 2 of 47
130
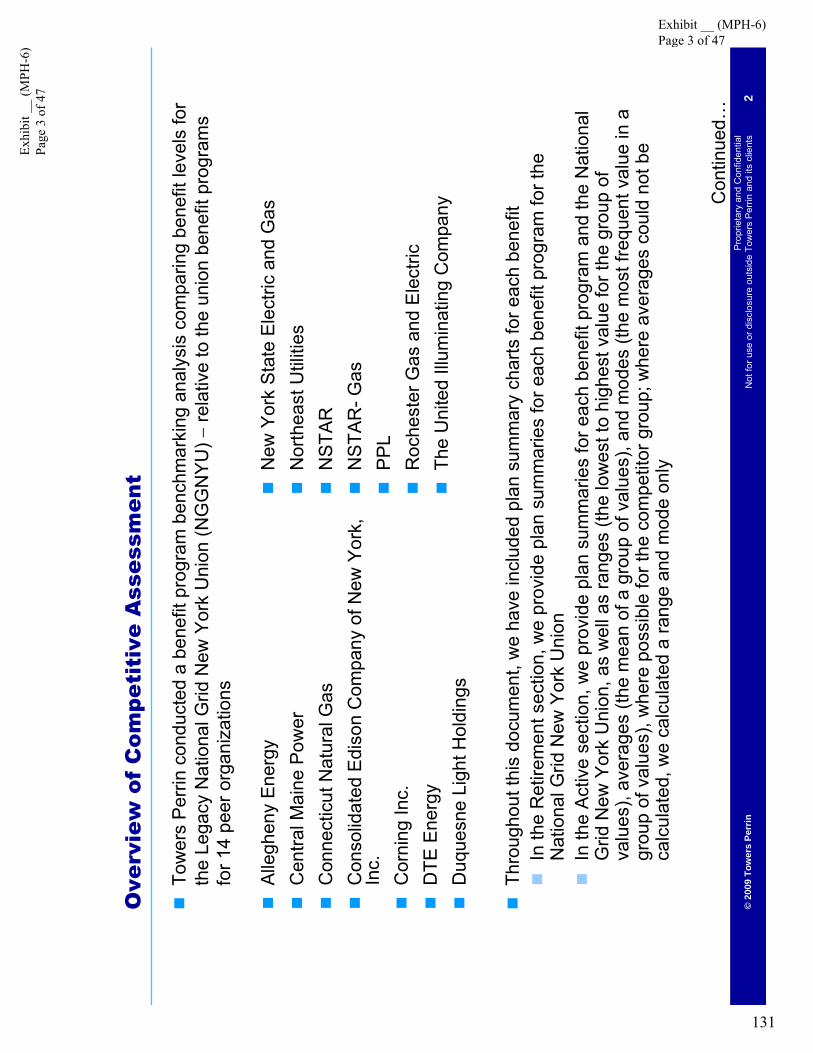
2©
2009
Tow
ers
Perr
inP
ropr
ieta
ry a
nd C
onfid
entia
lN
ot fo
r use
or d
iscl
osur
e ou
tsid
e To
wer
s P
errin
and
its
clie
nts
Ove
rvie
w o
f C
ompe
titi
ve A
sses
smen
t
Tow
ers
Per
rin c
ondu
cted
a b
enef
it pr
ogra
m b
ench
mar
king
ana
lysi
s co
mpa
ring
bene
fit le
vels
for
the
Lega
cy N
atio
nal G
rid N
ew Y
ork
Uni
on (N
GG
NY
U) −
rela
tive
to th
e un
ion
bene
fit p
rogr
ams
for 1
4 pe
er o
rgan
izat
ions
Thro
ugho
ut th
is d
ocum
ent,
we
have
incl
uded
pla
n su
mm
ary
char
ts fo
r eac
h be
nefit
In th
e R
etire
men
t sec
tion,
we
prov
ide
plan
sum
mar
ies
for e
ach
bene
fit p
rogr
am fo
r the
N
atio
nal G
rid N
ew Y
ork
Uni
onIn
the
Act
ive
sect
ion,
we
prov
ide
plan
sum
mar
ies
for e
ach
bene
fit p
rogr
am a
nd th
e N
atio
nal
Grid
New
Yor
k U
nion
, as
wel
l as
rang
es (t
he lo
wes
t to
high
est v
alue
for t
he g
roup
of
valu
es),
aver
ages
(the
mea
n of
a g
roup
of v
alue
s), a
nd m
odes
(the
mos
t fre
quen
t val
ue in
a
grou
p of
val
ues)
, whe
re p
ossi
ble
for t
he c
ompe
titor
gro
up; w
here
aver
ages
cou
ld n
ot b
e ca
lcul
ated
, we
calc
ulat
ed a
rang
e an
d m
ode
only
Con
tinue
d…
Alle
ghen
y E
nerg
y C
entra
l Mai
ne P
ower
C
onne
ctic
ut N
atur
al G
as
Con
solid
ated
Edi
son
Com
pany
of N
ew Y
ork,
In
c.
Cor
ning
Inc.
D
TE E
nerg
y D
uque
sne
Ligh
t Hol
ding
s
New
Yor
k S
tate
Ele
ctric
and
Gas
N
orth
east
Util
ities
N
STA
R
NS
TAR
-Gas
P
PL
Roc
hest
er G
as a
nd E
lect
ric
The
Uni
ted
Illum
inat
ing
Com
pany
Exhi
bit _
_ (M
PH-6
) Pa
ge 3
of 4
7Exhibit __ (MPH-6) Page 3 of 47
131

3©
2009
Tow
ers
Perr
inP
ropr
ieta
ry a
nd C
onfid
entia
lN
ot fo
r use
or d
iscl
osur
e ou
tsid
e To
wer
s P
errin
and
its
clie
nts
Ove
rvie
w o
f C
ompe
titi
ve A
sses
smen
t
The
anal
ysis
was
bas
ed o
n in
divi
dual
em
ploy
er p
lan
prov
isio
ns a
spr
ovid
ed b
y ea
ch
orga
niza
tion
appl
ied
to a
sta
ndar
d po
pula
tion,
usi
ng c
onsi
sten
t eco
nom
ic a
nd d
emog
raph
ic
assu
mpt
ions
, the
reby
mea
surin
g th
e “fi
nanc
ial v
alue
”of t
he p
lan,
not
the
actu
al c
ost o
f the
pla
n
BE
NV
AL®
dete
rmin
es a
val
ue fo
r the
se b
enef
its b
y ap
plyi
ng a
sta
ndar
d m
etho
dolo
gy to
a
stan
dard
em
ploy
ee p
opul
atio
n
Pla
n pr
ovis
ions
val
ued
are
thos
e th
at a
pply
to n
ewly
hire
d em
ploy
ees
Ben
efit
prog
ram
s ar
e:C
ompa
red
on a
rela
tive
valu
e ba
sis
betw
een
empl
oyer
s −
a sc
ore
of 1
00 re
pres
ents
the
aver
age
valu
e fo
r the
com
para
tor g
roup
Sco
res
are
dete
rmin
ed o
n a
dolla
r val
ue b
asis
rela
tive
to th
e av
erag
e va
lue
Thro
ugho
ut th
is d
ocum
ent,
“Tot
al V
alue
”ref
ers
to th
e po
sitio
ning
of t
he b
enef
it pr
ogra
ms
incl
udin
g th
e va
lue
of e
mpl
oyee
con
tribu
tions
, whe
reas
“Em
ploy
er V
alue
”ref
ers
to th
e va
lue
afte
r em
ploy
ee c
ontri
butio
ns h
ave
been
ded
ucte
d
The
tota
l ben
efit
valu
es a
re p
rimar
ily d
riven
by
the
valu
e of
the
retir
emen
t pla
ns, a
ctiv
e an
d po
st-re
tirem
ent m
edic
al p
lans
, and
vac
atio
n an
d ho
liday
pro
gram
s, w
hich
com
pris
e th
e va
st
maj
ority
of t
he p
rogr
am v
alue
s
Exhi
bit _
_ (M
PH-6
) Pa
ge 4
of 4
7Exhibit __ (MPH-6) Page 4 of 47
132

4©
2009
Tow
ers
Perr
inP
ropr
ieta
ry a
nd C
onfid
entia
lN
ot fo
r use
or d
iscl
osur
e ou
tsid
e To
wer
s P
errin
and
its
clie
nts
Ent
ire
Ben
efit
Pro
gram
Nat
iona
l Grid
’s N
ew Y
ork
Uni
on E
mpl
oyer
Val
ue o
f 98.
3 in
dica
tes
that
the
pack
age
of b
enef
its,
excl
udin
g th
e va
lue
of e
mpl
oyee
con
tribu
tions
, is
slig
htly
less
gen
erou
s th
an th
e av
erag
e pr
ogra
m
valu
e; th
e va
lue
is in
crea
sed
to 1
02.7
, or j
ust s
light
ly a
bove
ave
rage
, whe
n al
so c
onsi
derin
g th
e va
lue
of e
mpl
oyee
con
tribu
tions
to th
e va
rious
pro
gram
sTh
e lo
wer
than
ave
rage
em
ploy
er v
alue
is p
rimar
ily th
e re
sult
ofa
less
gen
erou
s re
tiree
m
edic
al p
rogr
am a
s co
mpa
red
to p
eer o
rgan
izat
ions
, offs
et b
y an
abo
ve a
vera
ge a
ctiv
e m
edic
al, d
enta
l, an
d lif
e an
d A
D&
D v
alue
Entir
e Be
nefit
Pro
gram
Sco
re a
nd R
ank
Scor
eR
ank/
15Em
ploy
er V
alue
Nat
iona
l Grid
New
Yor
k U
nion
98.3
8/15
Tota
l Val
ue
Nat
iona
l Grid
New
Yor
k U
nion
102.
78/
15
Con
tinue
d…
Exhi
bit _
_ (M
PH-6
) Pa
ge 5
of 4
7Exhibit __ (MPH-6) Page 5 of 47
133

5©
2009
Tow
ers
Perr
inP
ropr
ieta
ry a
nd C
onfid
entia
lN
ot fo
r use
or d
iscl
osur
e ou
tsid
e To
wer
s P
errin
and
its
clie
nts
Ent
ire
Ben
efit
Pro
gram
The
bar c
hart
abov
e fu
rther
illu
stra
tes
how
Nat
iona
l Grid
’s N
ew Y
ork
Uni
on p
lans
com
pare
to th
eir
peer
s bo
th in
term
s of
gro
ss b
enef
it va
lue
of th
eir e
ntire
ben
efit
prog
ram
, as
wel
l as
empl
oyer
-pr
ovid
ed v
alue
(i.e
., ne
t of e
mpl
oyee
con
tribu
tions
)
FD
LN
JC
HI
EB
AK
MG
FD
IM
KJ
EN
HB
GL
AC
Exhi
bit _
_ (M
PH-6
) Pa
ge 6
of 4
7Exhibit __ (MPH-6) Page 6 of 47
134

6©
2009
Tow
ers
Perr
inP
ropr
ieta
ry a
nd C
onfid
entia
lN
ot fo
r use
or d
iscl
osur
e ou
tsid
e To
wer
s P
errin
and
its
clie
nts
Pro
gram
Com
pone
nts
by E
mpl
oyer
Val
ue −
New
Yor
k U
nion
The
pie
char
ts a
bove
repr
esen
t the
per
cent
age
that
eac
h be
nefit
com
pone
nt c
ompr
ises
of t
he
tota
l ben
efit
prog
ram
for t
he N
ew Y
ork
Uni
on, a
s co
mpa
red
to a
n av
erag
e co
mpa
nyM
ost o
f the
New
Yor
k U
nion
’s p
rogr
ams
are
com
para
ble
to th
e av
erag
e co
mpa
ny’s
pro
gram
Th
e D
efin
ed B
enef
it is
a s
mal
ler p
erce
ntag
e, a
t 6.5
% o
f the
tota
l ben
efit
prog
ram
, tha
n th
e av
erag
e co
mpa
ny’s
retir
emen
t pro
gram
, whi
ch c
ompr
ises
8.2
% o
f the
tota
l pro
gram
Exhi
bit _
_ (M
PH-6
) Pa
ge 7
of 4
7Exhibit __ (MPH-6) Page 7 of 47
135

Ret
irem
ent
Ben
efit
s
Exhi
bit _
_ (M
PH-6
) Pa
ge 8
of 4
7Exhibit __ (MPH-6) Page 8 of 47
136

8©
2009
Tow
ers
Perr
inP
ropr
ieta
ry a
nd C
onfid
entia
lN
ot fo
r use
or d
iscl
osur
e ou
tsid
e To
wer
s P
errin
and
its
clie
nts
Def
ined
Ben
efit
and
Def
ined
Con
trib
utio
n S
core
and
Ran
k
The
follo
win
g ta
ble
illust
rate
s N
ew Y
ork
Uni
on’s
com
petit
ive
posi
tioni
ng re
lativ
e to
thei
r pe
er g
roup
in te
rms
of c
ombi
ned
defin
ed b
enef
it an
d de
fined
con
tribu
tion
prog
ram
s
Def
ined
Ben
efit
and
Cont
ribut
ion
Scor
e an
d R
ank
Scor
eR
ank/
15Em
ploy
er V
alue
Nat
iona
l Grid
New
Yor
k U
nion
91.4
9/15
Tota
l Val
ue
Nat
iona
l Grid
New
Yor
k U
nion
114.
53/
15
Exhi
bit _
_ (M
PH-6
) Pa
ge 9
of 4
7Exhibit __ (MPH-6) Page 9 of 47
137
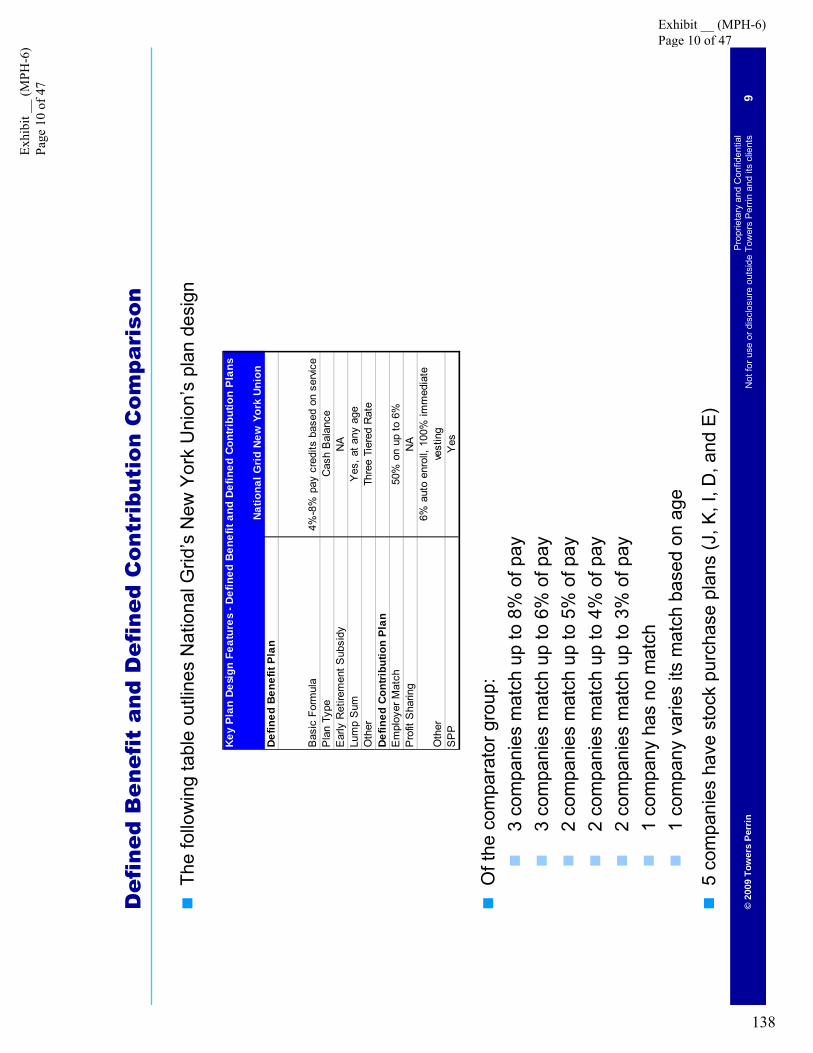
9©
2009
Tow
ers
Perr
inP
ropr
ieta
ry a
nd C
onfid
entia
lN
ot fo
r use
or d
iscl
osur
e ou
tsid
e To
wer
s P
errin
and
its
clie
nts
Def
ined
Ben
efit
and
Def
ined
Con
trib
utio
n C
ompa
riso
n
The
follo
win
g ta
ble
outli
nes
Nat
iona
l Grid
’s N
ew Y
ork
Uni
on’s
pla
n de
sign
Of t
he c
ompa
rato
r gro
up:
3 co
mpa
nies
mat
ch u
p to
8%
of p
ay
3 co
mpa
nies
mat
ch u
p to
6%
of p
ay2
com
pani
es m
atch
up
to 5
% o
f pay
2 co
mpa
nies
mat
ch u
p to
4%
of p
ay
2 co
mpa
nies
mat
ch u
p to
3%
of p
ay
1 co
mpa
ny h
as n
o m
atch
1 co
mpa
ny v
arie
s its
mat
ch b
ased
on
age
5 co
mpa
nies
hav
e st
ock
purc
hase
pla
ns (J
, K, I
, D, a
nd E
)
Nat
iona
l Grid
New
Yor
k Un
ion
Defin
ed B
enef
it Pl
an
Bas
ic F
orm
ula
4%-8
% p
ay c
redi
ts b
ased
on
serv
ice
Pla
n Ty
peC
ash
Bal
ance
Ear
ly R
etire
men
t Sub
sidy
NA
Lum
p S
umY
es, a
t any
age
Oth
erTh
ree
Tier
ed R
ate
Defin
ed C
ontri
butio
n Pl
anE
mpl
oyer
Mat
ch50
% o
n up
to 6
%P
rofit
Sha
ring
NA
Oth
er6%
aut
o en
roll,
100
% im
med
iate
ve
stin
gS
PP
Yes
Key
Plan
Des
ign
Feat
ures
- D
efin
ed B
enef
it an
d De
fined
Con
tribu
tion
Plan
s
Exhi
bit _
_ (M
PH-6
) Pa
ge 1
0 of
47
Exhibit __ (MPH-6) Page 10 of 47
138
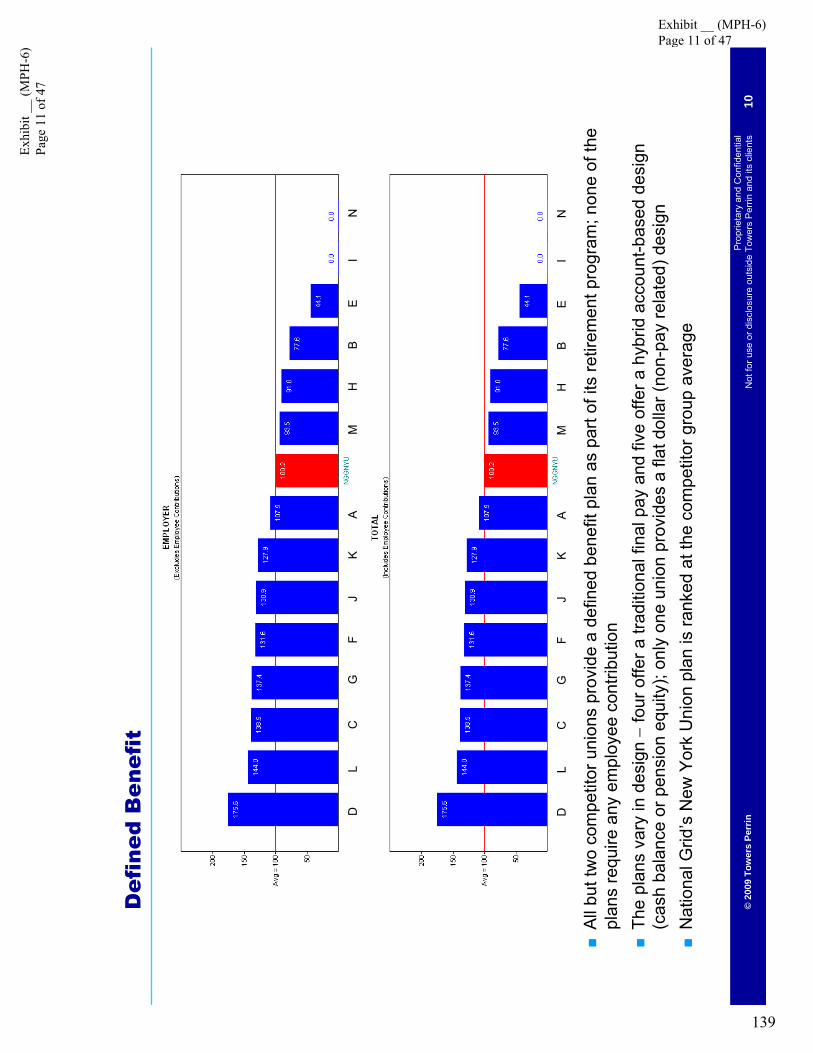
10©
2009
Tow
ers
Perr
inP
ropr
ieta
ry a
nd C
onfid
entia
lN
ot fo
r use
or d
iscl
osur
e ou
tsid
e To
wer
s P
errin
and
its
clie
nts
Def
ined
Ben
efit
■A
ll bu
t tw
o co
mpe
titor
uni
ons
prov
ide
a de
fined
ben
efit
plan
as
part
of it
s re
tirem
ent p
rogr
am; n
one
of th
e pl
ans
requ
ire a
ny e
mpl
oyee
con
tribu
tion
■Th
e pl
ans
vary
in d
esig
n −
four
offe
r a tr
aditi
onal
fina
l pay
and
five
offe
r a h
ybrid
acc
ount
-bas
ed d
esig
n (c
ash
bala
nce
or p
ensi
on e
quity
); on
ly o
ne u
nion
pro
vide
s a
flatd
olla
r (no
n-pa
y re
late
d) d
esig
n■
Nat
iona
l Grid
’s N
ew Y
ork
Uni
on p
lan
is ra
nked
at t
he c
ompe
titor
gro
up a
vera
ge
DL
CM
FJ
HA
NB
EG
IK
DL
CM
FJ
HA
NB
EG
IK
Exhi
bit _
_ (M
PH-6
) Pa
ge 1
1 of
47
Exhibit __ (MPH-6) Page 11 of 47
139

11©
2009
Tow
ers
Perr
inP
ropr
ieta
ry a
nd C
onfid
entia
lN
ot fo
r use
or d
iscl
osur
e ou
tsid
e To
wer
s P
errin
and
its
clie
nts
Def
ined
Con
trib
utio
n: I
nclu
ding
Sto
ck P
urch
ase
Pla
n
■A
ll of
the
com
petit
or re
tirem
ent p
rogr
ams
incl
ude
a de
fined
con
tribu
tion
plan
; mos
t inc
lude
onl
y an
em
ploy
er s
avin
gs p
lan
mat
chin
g co
ntrib
utio
n, b
ut a
few
als
o pr
ovid
e a
com
pany
aut
omat
ic o
r pro
fit s
harin
g el
emen
t in
the
savi
ngs
plan
■Th
e tw
o hi
ghes
t com
pani
es (N
and
I) in
clud
e a
prof
it sh
arin
g el
emen
t and
gen
erou
s em
ploy
er m
atch
ing
cont
ribut
ions
■Fi
ve o
f the
com
petit
or p
rogr
ams
also
incl
ude
a se
para
te s
tock
pur
chas
e pl
an w
ith a
sm
all p
urch
ase
disc
ount
■Th
e N
ew Y
ork
Uni
on p
lan
prov
ides
a lo
wer
em
ploy
er m
atch
ing
cont
ribut
ion
(50%
on
6% o
r max
. of 3
% e
mpl
oyer
) whi
ch
plac
es it
bel
ow th
e co
mpe
titor
gro
up a
vera
ge■
Like
Nat
iona
l Grid
’s s
avin
gs p
lans
, six
of t
he c
ompa
nies
pro
vide
for i
mm
edia
te v
estin
g of
em
ploy
er c
ontri
butio
ns; s
ix p
rovi
de
for a
uto-
enro
llmen
tNI
EJ
BL
AK
GM
DF
HC
IN
EL
FD
CJ
GA
MB
HK
Exhi
bit _
_ (M
PH-6
) Pa
ge 1
2 of
47
Exhibit __ (MPH-6) Page 12 of 47
140

12©
2009
Tow
ers
Perr
inP
ropr
ieta
ry a
nd C
onfid
entia
lN
ot fo
r use
or d
iscl
osur
e ou
tsid
e To
wer
s P
errin
and
its
clie
nts
Def
ined
Ben
efit
and
Def
ined
Con
trib
utio
n: I
nclu
ding
Sto
ck P
urch
ase
Pla
n
■A
ll bu
t tw
o of
the
com
petit
or u
nion
retir
emen
t pro
gram
s in
clud
e bo
th a
def
ined
ben
efit
and
defin
ed
cont
ribut
ion
com
pone
nt, s
imila
r to
the
desi
gn o
f Nat
iona
l Grid
’s u
nion
pro
gram
s
LD
FH
JK
AI
EG
BC
MN
DF
KH
LE
NJ
GA
BI
MC
Exhi
bit _
_ (M
PH-6
) Pa
ge 1
3 of
47
Exhibit __ (MPH-6) Page 13 of 47
141

13©
2009
Tow
ers
Perr
inP
ropr
ieta
ry a
nd C
onfid
entia
lN
ot fo
r use
or d
iscl
osur
e ou
tsid
e To
wer
s P
errin
and
its
clie
nts
Def
ined
Ben
efit
and
Def
ined
Con
trib
utio
n: E
xclu
ding
Sto
ck P
urch
ase
Pla
n
■N
atio
nal G
rid’s
NY
Uni
on’s
DB
and
DC
val
ue d
rops
to b
elow
ave
rage
whe
n th
e st
ock
purc
hase
plan
is e
xclu
ded
L
F
C
D
J
K
N
I
A
G
B
M
E
H
F
L
C
J
K
DN
A
I
B
M
G
E
H
Exhi
bit _
_ (M
PH-6
) Pa
ge 1
4 of
47
Exhibit __ (MPH-6) Page 14 of 47
142

14©
2009
Tow
ers
Perr
inP
ropr
ieta
ry a
nd C
onfid
entia
lN
ot fo
r use
or d
iscl
osur
e ou
tsid
e To
wer
s P
errin
and
its
clie
nts
Pos
t-re
tire
men
t M
edic
al S
core
and
Ran
k
The
follo
win
g ta
ble
illust
rate
s N
atio
nal G
rid’s
New
Yor
k U
nion
’s c
ompe
titiv
e po
sitio
ning
rela
tive
to th
eir p
eer g
roup
in te
rms
of p
ost-r
etire
men
t med
ical
Pos
t-Ret
irem
ent M
edic
al S
core
and
Ran
k
Sco
reR
ank/
15Em
ploy
er V
alue
Nat
iona
l Grid
New
Yor
k U
nion
40.0
12/1
5
Tota
l Val
ue
Nat
iona
l Grid
New
Yor
k U
nion
62.2
13/1
5
Exhi
bit _
_ (M
PH-6
) Pa
ge 1
5 of
47
Exhibit __ (MPH-6) Page 15 of 47
143

15©
2009
Tow
ers
Perr
inP
ropr
ieta
ry a
nd C
onfid
entia
lN
ot fo
r use
or d
iscl
osur
e ou
tsid
e To
wer
s P
errin
and
its
clie
nts
Pos
t-re
tire
men
t M
edic
al C
ompa
riso
n
Key
Pla
n De
sign
Fea
ture
s - P
ost-r
etire
men
t Med
ical
Nat
iona
l Grid
New
Yor
k Un
ion
Pre
-65
Type
of P
lan
PO
SP
lan
Des
ign
Sam
e as
act
iveP
artic
ipat
ion
Req
uire
men
tsA
ge 6
1 &
10
YO
S o
r Age
60
and
&
Age
+Ser
vice
= 85
Def
ined
Dol
lar B
enef
itN
one
Pos
t-65
Type
of P
lan
Med
icar
e S
uppl
emen
tP
artic
ipat
ion
Req
uire
men
tsA
ge+s
ervic
e =
85 o
r 10
YO
SP
lan
Des
ign
Sam
e as
act
iveD
educ
tible
Per
son:
$10
0; F
amily
Max
: non
eO
ut-o
f-poc
ket m
axim
umP
erso
n: n
one;
Fam
ily M
ax: n
one
Pre
scrip
tion
Dru
gs (r
etai
l)G
ener
ic10
0%B
rand
80%
Coo
rdin
atio
n w
ith M
edic
are
Med
icar
e P
art '
A'
100%
of P
art '
A' d
educ
tible
, 100
% o
f Par
t 'A
' co
-pay
bef
ore
dedu
ctib
leM
edic
are
Par
t 'B
'10
0% o
f Par
t 'B
' ded
uctib
le, 1
00%
of P
art '
B'
coin
sura
nce
befo
re d
educ
tible
Med
icar
e P
art '
B' P
rem
ium
Non
eD
efin
ed d
olla
r Ben
efit
Ret
iree:
$54
x s
ervic
e; R
etire
e +
Spo
use:
$1
08 x
ser
vice
The
follo
win
g ta
ble
outli
nes
Nat
iona
l Grid
’s N
ew Y
ork
Uni
on’s
pla
n de
sign
Exhi
bit _
_ (M
PH-6
) Pa
ge 1
6 of
47
Exhibit __ (MPH-6) Page 16 of 47
144
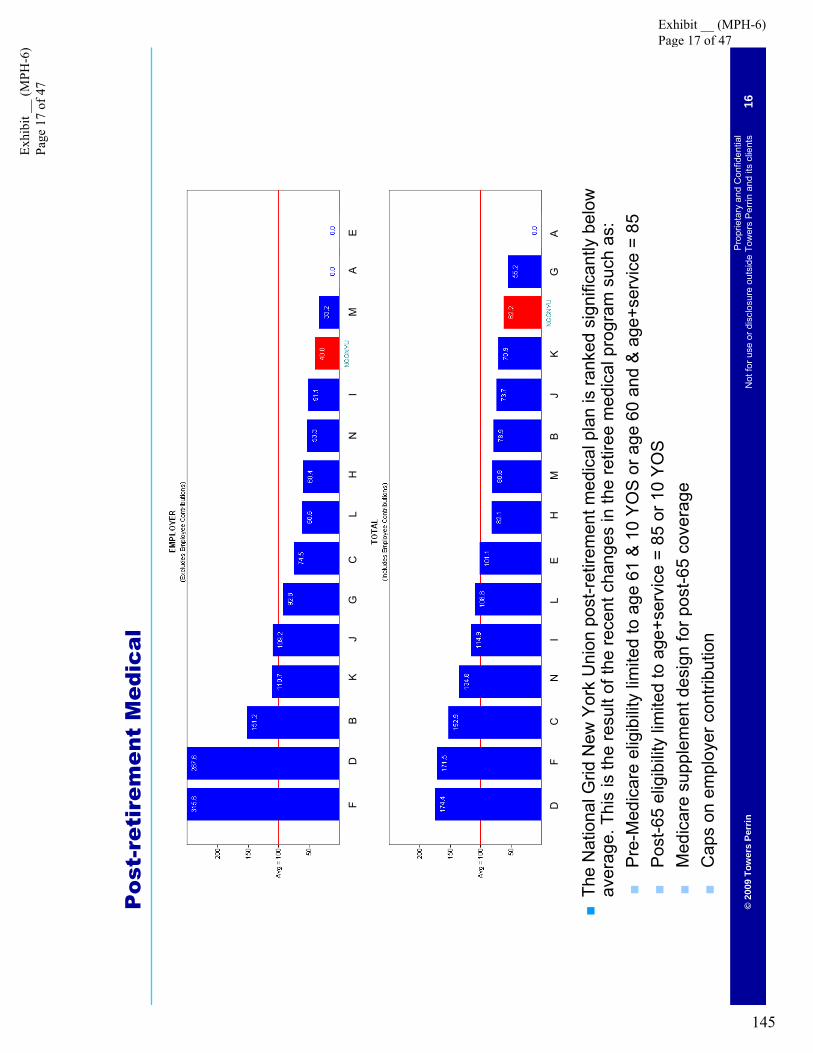
16©
2009
Tow
ers
Perr
inP
ropr
ieta
ry a
nd C
onfid
entia
lN
ot fo
r use
or d
iscl
osur
e ou
tsid
e To
wer
s P
errin
and
its
clie
nts
Pos
t-re
tire
men
t M
edic
al
■Th
e N
atio
nal G
rid N
ew Y
ork
Uni
on p
ost-r
etire
men
t med
ical
pla
n is
rank
ed s
igni
fican
tly b
elow
av
erag
e. T
his
is th
e re
sult
of th
e re
cent
cha
nges
in th
e re
tiree
med
ical
pro
gram
suc
h as
: ■
Pre
-Med
icar
e el
igib
ility
lim
ited
to a
ge 6
1 &
10
YO
S o
r age
60
and
& a
ge+s
ervi
ce =
85
■P
ost-6
5 el
igib
ility
lim
ited
to a
ge+s
ervi
ce =
85
or 1
0 Y
OS
■M
edic
are
supp
lem
ent d
esig
n fo
r pos
t-65
cove
rage
■C
aps
on e
mpl
oyer
con
tribu
tion
FD
BE
JG
HL
AN
IK
MC
DF
CA
IL
MH
GB
JN
KE
Exhi
bit _
_ (M
PH-6
) Pa
ge 1
7 of
47
Exhibit __ (MPH-6) Page 17 of 47
145

17©
2009
Tow
ers
Perr
inP
ropr
ieta
ry a
nd C
onfid
entia
lN
ot fo
r use
or d
iscl
osur
e ou
tsid
e To
wer
s P
errin
and
its
clie
nts
Pos
t-re
tire
men
t D
eath
Sco
re a
nd R
ank
The
follo
win
g ta
ble
illust
rate
s N
atio
nal G
rid’s
New
Yor
k U
nion
’s c
ompe
titiv
e po
sitio
ning
re
lativ
e to
thei
r pee
r gro
up in
term
s of
pos
t-ret
irem
ent d
eath
Sin
ce a
ll co
vera
ge e
nds
at re
tirem
ent,
ther
e is
no
valu
e at
tribu
ted
to th
is b
enef
it
Four
oth
er c
ompa
nies
in th
e co
mpa
rato
r gro
up d
o no
t offe
r thi
s be
nefit
Pos
t-Ret
irem
ent D
eath
Sco
re a
nd R
ank
Scor
eRa
nk/1
5
Empl
oyer
Val
ueN
atio
nal G
rid N
ew Y
ork
Uni
on0.
0tie
d fo
r las
t
Tota
l Val
ueN
atio
nal G
rid N
ew Y
ork
Uni
on0.
0tie
d fo
r las
t
Exhi
bit _
_ (M
PH-6
) Pa
ge 1
8 of
47
Exhibit __ (MPH-6) Page 18 of 47
146

18©
2009
Tow
ers
Perr
inP
ropr
ieta
ry a
nd C
onfid
entia
lN
ot fo
r use
or d
iscl
osur
e ou
tsid
e To
wer
s P
errin
and
its
clie
nts
Pos
t-re
tire
men
t D
eath
■L
and
F, w
hich
are
rank
ed fi
rst a
nd s
econ
d re
spec
tivel
y, o
ffer a
deat
h be
nefit
that
onl
y gr
adua
lly re
duce
s af
ter r
etire
men
t, un
til th
e be
nefit
reac
hes
a m
axim
um o
f 25%
of t
he
pre-
retir
emen
t dea
th b
enef
it
LF
AN
JK
IG
MC
DB
HE
LF
AN
GB
KJ
MD
CI
HE
Exhi
bit _
_ (M
PH-6
) Pa
ge 1
9 of
47
Exhibit __ (MPH-6) Page 19 of 47
147

19©
2009
Tow
ers
Perr
inP
ropr
ieta
ry a
nd C
onfid
entia
lN
ot fo
r use
or d
iscl
osur
e ou
tsid
e To
wer
s P
errin
and
its
clie
nts
Ret
irem
ent
Eve
nt S
core
and
Ran
k
The
follo
win
g ta
ble
illust
rate
s N
atio
nal G
rid’s
New
Yor
k U
nion
’s c
ompe
titiv
e po
sitio
ning
re
lativ
e to
thei
r pee
r gro
up in
term
s of
tota
l ret
irem
ent e
vent
s
Ret
irem
ent E
vent
Sco
re a
nd R
ank
Scor
eRa
nk/1
5Em
ploy
er V
alue
Nat
iona
l Grid
New
Yor
k U
nion
77.7
11/1
5
Tota
l Val
ue
Nat
iona
l Grid
New
Yor
k U
nion
100.
38/
15
Exhi
bit _
_ (M
PH-6
) Pa
ge 2
0 of
47
Exhibit __ (MPH-6) Page 20 of 47
148

20©
2009
Tow
ers
Perr
inP
ropr
ieta
ry a
nd C
onfid
entia
lN
ot fo
r use
or d
iscl
osur
e ou
tsid
e To
wer
s P
errin
and
its
clie
nts
Ret
irem
ent
Eve
nt
■Th
e R
etire
men
t Eve
nt c
ompa
rison
pro
vide
s an
ass
essm
ent o
f all
ofth
e be
nefit
s av
aila
ble
upon
re
tirem
ent (
defin
ed b
enef
it/de
fined
con
tribu
tion
bene
fits
and
post
-retir
emen
t med
ical
/dea
th b
enef
its)
■B
ased
on
tota
l val
ue, t
he N
atio
nal G
rid N
ew Y
ork
Uni
on p
rogr
am is
at t
he c
ompe
titor
gro
up a
vera
ge
FD
LE
JK
IN
HG
AC
MB
DF
CA
LN
JB
HK
MI
GE
Exhi
bit _
_ (M
PH-6
) Pa
ge 2
1 of
47
Exhibit __ (MPH-6) Page 21 of 47
149

Act
ive
Ben
efit
s
Exhi
bit _
_ (M
PH-6
) Pa
ge 2
2 of
47
Exhibit __ (MPH-6) Page 22 of 47
150

22©
2009
Tow
ers
Perr
inP
ropr
ieta
ry a
nd C
onfid
entia
lN
ot fo
r use
or d
iscl
osur
e ou
tsid
e To
wer
s P
errin
and
its
clie
nts
Act
ive
Med
ical
Pla
n D
eliv
ery
Mod
els
All
com
pani
es, e
xcep
t A, C
, and
E o
ffer t
heir
empl
oyee
s a
choi
ceof
pla
n ty
pe
Mos
t com
pani
es th
at o
ffer p
lans
with
an
in-n
etw
ork
and
out-o
f-net
wor
k fe
atur
e of
fer a
PP
O
rath
er th
an a
PO
S p
lan
Eig
ht c
ompa
nies
hav
e a
PP
O p
lan
as th
eir h
ighe
st e
nrol
led
plan
—
One
com
petit
or c
ompa
ny h
as a
PO
S p
lan
as th
eir h
ighe
st e
nrol
led
plan
—Fi
ve c
ompe
titor
com
pani
es h
ave
an H
MO
pla
n as
thei
r hig
hest
enr
olle
d pl
an
J an
d K
are
the
only
com
pani
es to
offe
r the
ir em
ploy
ees
a co
nsum
er d
riven
hea
lth p
lan
For p
urpo
ses
of th
e B
EN
VA
L, w
e ev
alua
ted
only
the
optio
n w
ith h
ighe
st e
nrol
lmen
t
Exhi
bit _
_ (M
PH-6
) Pa
ge 2
3 of
47
Exhibit __ (MPH-6) Page 23 of 47
151
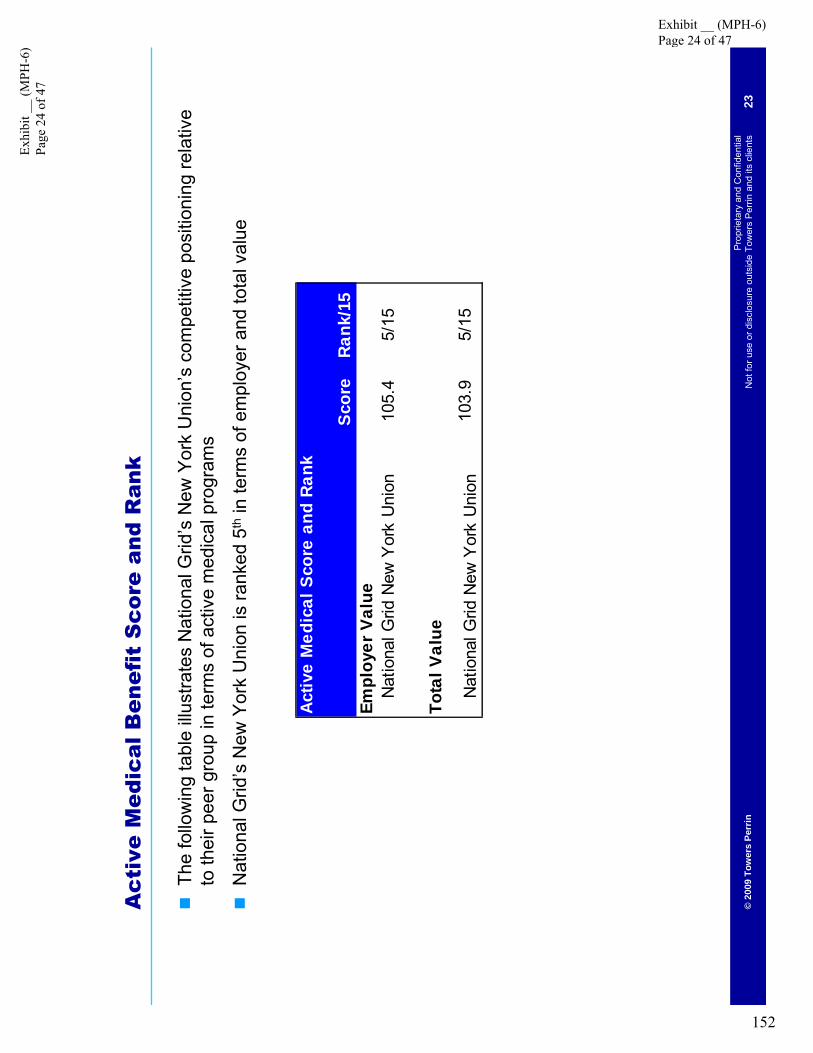
23©
2009
Tow
ers
Perr
inP
ropr
ieta
ry a
nd C
onfid
entia
lN
ot fo
r use
or d
iscl
osur
e ou
tsid
e To
wer
s P
errin
and
its
clie
nts
Act
ive
Med
ical
Ben
efit
Sco
re a
nd R
ank
The
follo
win
g ta
ble
illust
rate
s N
atio
nal G
rid’s
New
Yor
k U
nion
’s c
ompe
titiv
e po
sitio
ning
rela
tive
to th
eir p
eer g
roup
in te
rms
of a
ctiv
e m
edic
al p
rogr
ams
Nat
iona
l Grid
’s N
ew Y
ork
Uni
on is
rank
ed 5
thin
term
s of
em
ploy
er a
nd to
tal v
alue
Activ
e M
edic
al S
core
and
Ran
k
Scor
eRa
nk/1
5Em
ploy
er V
alue
Nat
iona
l Grid
New
Yor
k U
nion
105.
45/
15
Tota
l Val
ue
Nat
iona
l Grid
New
Yor
k U
nion
103.
95/
15
Exhi
bit _
_ (M
PH-6
) Pa
ge 2
4 of
47
Exhibit __ (MPH-6) Page 24 of 47
152

24©
2009
Tow
ers
Perr
inP
ropr
ieta
ry a
nd C
onfid
entia
lN
ot fo
r use
or d
iscl
osur
e ou
tsid
e To
wer
s P
errin
and
its
clie
nts
Act
ive
Med
ical
Ben
efit
s C
ompa
riso
n
The
follo
win
g ta
ble
com
pare
s N
atio
nal G
rid’s
New
Yor
k U
nion
’s p
lan
desi
gn re
lativ
e to
thei
r pe
er g
roup
pla
n de
sign
s
Key
Plan
Des
ign
Feat
ures
- M
edic
al
Nat
iona
l Grid
New
Yor
k Un
ion
Rang
eAv
erag
eM
ode
In-n
etw
ork
Ded
uctib
leN
one
Per
Em
ploy
ee: $
0-$3
00, F
amily
M
ax: $
0-$6
00P
er E
mpl
oyee
: $92
.86,
Fam
ily
Max
: $14
2.86
Non
e
Coi
nsur
ance
100%
80%
-- 1
00%
98%
100%
Out
-of-p
ocke
t max
imum
Non
eP
er E
mpl
oyee
: $0-
$150
0, F
amily
M
ax: $
0-$3
000
Per
son:
$90
8, F
amily
Max
: $1
,817
(am
ongs
t pla
ns th
at h
ave
an O
OP
max
)
Non
e
Inpa
tient
hos
pita
l10
0%80
% --
100
%N
/A10
0%E
mer
genc
y ro
om10
0%, $
35 c
o-pa
y/vis
it (w
aive
d if
adm
itted
)90
% --
100
%99
%, $
36 c
o-pa
y10
0%, $
50 c
o-pa
y/vis
it (w
aive
d if
adm
itted
)O
ffice
vis
itsP
rimar
y: 1
00%
, $10
co-
pay;
S
peci
alis
t: 10
0%, $
15 c
o-pa
y10
0% $
10 c
o-pa
y/vis
it --
100%
$2
5 co
-pay
/vis
it10
0%, $
16 c
o-pa
y10
0%, $
10 c
o-pa
y
Pre
scrip
tion
drug
s (R
etai
l)G
ener
ic80
%, $
5 m
in, $
15 m
ax80
% --
100
%, $
5 co
-pay
97%
, $7
co-p
ay10
0%, $
5 co
-pay
Bra
nd80
%, $
5 m
in, $
15 m
axFo
rm: 7
5%, $
15 m
in, $
25 m
ax
co-p
ay --
100
% $
10 c
o-pa
y; N
on
Form
: 50
-- 1
00%
, $25
co-
pay
Form
: 95%
, $18
.50
co-p
ay; N
on-
Form
: 81
%, $
32 c
o-pa
yFo
rm: 1
00%
, $20
co-
pay;
Non
-Fo
rm: 1
00%
, $50
co-
pay
Out
patie
nt m
enta
l hea
lth10
0%, $
10 c
opay
per
vis
it50
%, 5
0 vis
its/y
ear -
- 100
%, $
15
co-p
ay/v
isit
(no
limit)
89%
, $15
.50
co-p
ay/v
isit,
34
visits
/yea
r10
0%, n
o m
ode
for v
isits
Out
-of-n
etw
ork
Ded
uctib
leP
erso
n: $
250,
Fam
ily M
ax: $
500
No
OO
N c
over
age
-- P
erso
n:
$150
, Fam
ily M
ax: $
300
Per
son:
$39
2, F
amily
Max
: $92
5N
o O
ON
cov
erag
e (a
mon
gst a
ll pl
ans)
Coi
nsur
ance
80%
No
OO
N c
over
age
-- 80
%76
% (a
mon
gst p
lans
with
an
OO
N o
ptio
n)80
%
Out
-of-p
ocke
t max
imum
Per
son:
$1,
250,
Fam
ily M
ax: $
2,50
0 (in
clud
es d
educ
tible
)N
o O
ON
cov
erag
e --
Per
son:
$1
,500
, Fam
ily M
ax: $
3,00
0 (in
clud
es d
educ
tible
)
Per
son:
$2,
411,
Fam
ily M
ax:
$5,3
44N
o O
ON
cov
erag
e
Mon
thly
Em
ploy
ee C
ontri
butio
nsE
mpl
oyee
onl
y$8
1.81
$4
6.19
-- $
133.
69$9
1.35
N
/AFa
mily
$233
.17
$86.
67 --
$47
0$2
42.4
9 N
/A
Com
para
tor G
roup
Exhi
bit _
_ (M
PH-6
) Pa
ge 2
5 of
47
Exhibit __ (MPH-6) Page 25 of 47
153

25©
2009
Tow
ers
Perr
inP
ropr
ieta
ry a
nd C
onfid
entia
lN
ot fo
r use
or d
iscl
osur
e ou
tsid
e To
wer
s P
errin
and
its
clie
nts
Act
ive
Med
ical
Ben
efit
s
The
New
Yor
k U
nion
falls
in li
ne w
ith th
e co
mpe
titor
gro
up fo
r pro
visi
ons
such
as
dedu
ctib
les
(non
e), c
oins
uran
ce (1
00%
), O
OP
(non
e), a
nd in
patie
nt h
ospi
tal (
100%
), th
ere
are
diffe
renc
es
whe
n it
com
es to
the
othe
r ben
efits
The
New
Yor
k U
nion
is ra
nked
slig
htly
hig
her t
han
othe
r com
petit
or c
ompa
nies
bec
ause
thei
r of
fice
visi
t cop
ay o
f $10
($15
spe
cial
ist)
is lo
wer
than
the
aver
age
of $
16
Add
ition
ally
, the
pre
scrip
tion
drug
ben
efit
(80%
with
a m
inim
um o
f $5
and
max
imum
of $
15
rega
rdle
ss o
f dru
g tie
r) is
rich
er th
an th
e co
mpe
titor
mod
e of
a$2
0 co
pay
for b
rand
form
ular
y dr
ugs
and
a $5
0 co
pay
for b
rand
non
-form
ular
y dr
ugs
The
outp
atie
nt m
enta
l hea
lth b
enef
it is
als
o m
uch
riche
r tha
n th
e co
mpe
titor
gro
up’s
out
patie
nt
men
tal h
ealth
ben
efit −
100%
with
a $
10 c
opay
/vis
it w
ith n
o nu
mbe
r of v
isit
limita
tions
,as
com
pare
d to
the
com
petit
ors’
aver
age
bene
fit o
f 89%
cov
erag
e w
ith a
$15
.50
copa
y fo
r a
max
imum
of 3
4 vi
sits
per
yea
rA
lthou
gh th
e N
ew Y
ork
Uni
on’s
lack
of v
isit
limits
for m
enta
l hea
lth b
enef
its is
gen
erou
s, w
e ex
pect
it to
be
in li
ne w
ith th
e av
erag
e as
oth
er u
nion
pla
ns m
ove
to c
ompl
y w
ith th
e re
cent
ly
pass
ed M
enta
l Hea
lth P
arity
law
effe
ctiv
e in
201
0
Of t
he c
ompe
titor
com
pani
es th
at o
ffer a
n ou
t-of-n
etw
ork
bene
fit, t
he N
ew Y
ork
Uni
on p
lan
is
com
para
tivel
y ric
her i
n te
rms
of d
educ
tible
s an
d ou
t-of-p
ocke
t max
imum
s
Con
tinue
d…
Exhi
bit _
_ (M
PH-6
) Pa
ge 2
6 of
47
Exhibit __ (MPH-6) Page 26 of 47
154

26©
2009
Tow
ers
Perr
inP
ropr
ieta
ry a
nd C
onfid
entia
lN
ot fo
r use
or d
iscl
osur
e ou
tsid
e To
wer
s P
errin
and
its
clie
nts
Act
ive
Med
ical
Ben
efit
s
The
bar c
hart
abov
e fu
rther
illu
stra
tes
how
Nat
iona
l Grid
’s N
ew Y
ork
Uni
on’s
pla
n co
mpa
re to
thei
r pee
rs b
oth
in te
rms
of g
ross
ben
efit
valu
e of
med
ical
pla
ns, a
s w
ell a
s em
ploy
er-p
rovi
ded
valu
e (i.
e., n
et o
f em
ploy
ee c
ontri
butio
ns)
LF
IB
EK
DN
MJ
AG
CH
KL
JB
HI
GD
EN
CA
MF
Exhi
bit _
_ (M
PH-6
) Pa
ge 2
7 of
47
Exhibit __ (MPH-6) Page 27 of 47
155
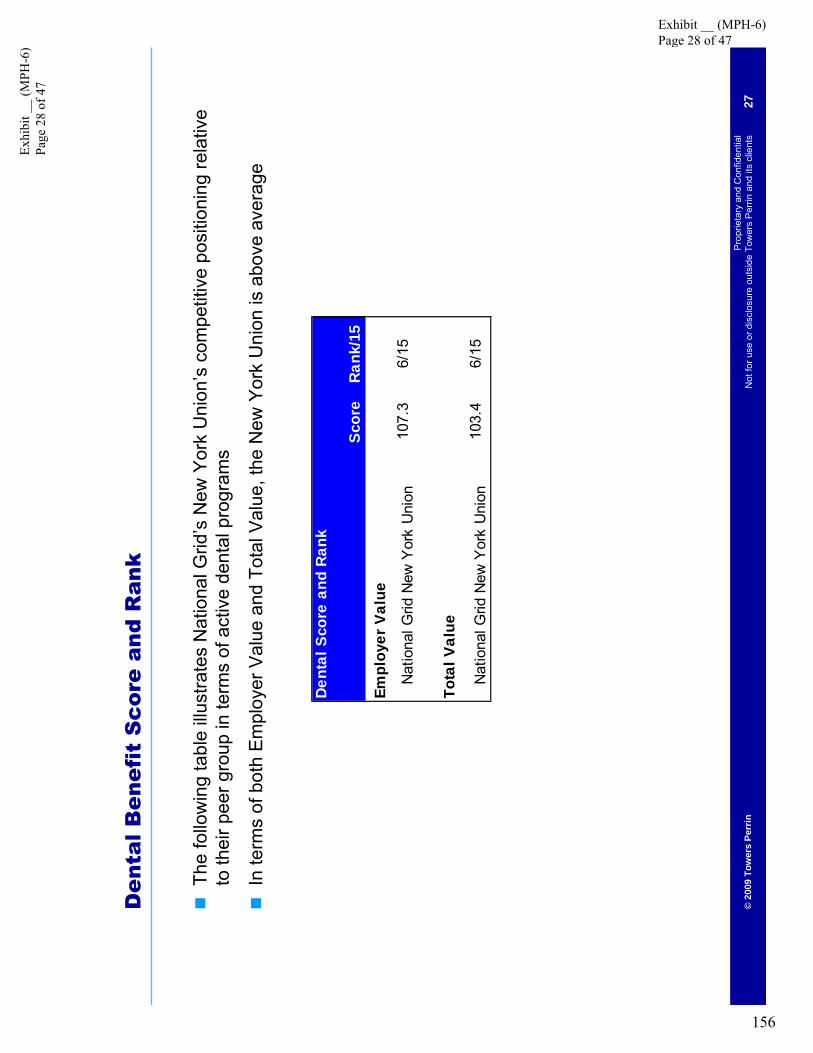
27©
2009
Tow
ers
Perr
inP
ropr
ieta
ry a
nd C
onfid
entia
lN
ot fo
r use
or d
iscl
osur
e ou
tsid
e To
wer
s P
errin
and
its
clie
nts
Den
tal B
enef
it S
core
and
Ran
k
The
follo
win
g ta
ble
illust
rate
s N
atio
nal G
rid’s
New
Yor
k U
nion
’s c
ompe
titiv
e po
sitio
ning
rela
tive
to th
eir p
eer g
roup
in te
rms
of a
ctiv
e de
ntal
pro
gram
s
In te
rms
of b
oth
Em
ploy
er V
alue
and
Tot
al V
alue
, the
New
Yor
k U
nion
is a
bove
ave
rage
Den
tal S
core
and
Ran
k
Scor
eRa
nk/1
5Em
ploy
er V
alue
Nat
iona
l Grid
New
Yor
k U
nion
107.
36/
15
Tota
l Val
ue
Nat
iona
l Grid
New
Yor
k U
nion
103.
46/
15
Exhi
bit _
_ (M
PH-6
) Pa
ge 2
8 of
47
Exhibit __ (MPH-6) Page 28 of 47
156

28©
2009
Tow
ers
Perr
inP
ropr
ieta
ry a
nd C
onfid
entia
lN
ot fo
r use
or d
iscl
osur
e ou
tsid
e To
wer
s P
errin
and
its
clie
nts
Den
tal B
enef
its
Com
pari
son
The
follo
win
g ta
ble
com
pare
s N
atio
nal G
rid’s
New
Yor
k U
nion
’s p
lan
desi
gn re
lativ
e to
thei
r pe
er g
roup
pla
n de
sign
s
Dent
al B
enef
it
Nat
iona
l Grid
New
Yo
rk U
nion
Ra
nge
Aver
age
Mod
eAn
nual
Ded
uctib
le*
Per
son:
$50
, Fam
ily
Max
: Non
eP
erso
n: $
0-$1
25;
Fam
ily M
ax: N
one-
$150
Per
son:
$45
; Fam
ily
Max
: $11
8P
erso
n: $
50; F
amily
M
ax: $
150
Annu
al M
axim
umP
reve
ntive
& B
asic
: $1
,500
/per
son,
Maj
or:
$2,0
00/p
erso
n (e
xclu
des
orth
odon
tia)
$1,0
00/p
erso
n --
$2,5
00/p
erso
n (e
xclu
des
orth
odon
tia)
$1,6
14 (e
xclu
des
orth
odon
tia)
$1,5
00 (e
xclu
des
orth
odon
tia)
Clea
ning
100%
, 2 c
lean
ings
/yea
r75
% --
100
% (4
2 cl
eani
ngs/
year
)97
%, 2
cle
anin
gs/y
ear
100%
, 2 c
lean
ings
/yea
r
Non-
Gol
d Fi
lling
80%
60%
- 80
%76
%80
%Cr
owns
60%
50%
eve
ry 8
yea
rs --
70
%55
%, e
very
3.6
yea
rs50
%, e
very
5 y
ears
Orth
odon
tia C
over
age
100%
Not
cov
ered
-- 1
00%
63%
(am
ongs
t pla
ns
that
incl
ude
orth
o.
cove
rage
)
50%
Orth
odon
tia M
axim
um$1
,800
per
life
time
$750
-- $
2,50
0$1
,779
$2
,000
M
onth
ly E
mpl
oyee
Con
tribu
tions
Em
ploy
ee$7
.48
$0 --
$17
.33
$7.2
1N
/AFa
mily
$20.
32
$0 --
$55
.40
$18.
35N
/A
Out
of N
etw
ork
Ded
uctib
leN
/AP
erso
n: $
25 --
$250
, Fa
mily
Max
: $50
--
$450
Per
son:
$95
, Fam
ily
Max
: $27
5N
o O
ON
cov
erag
e
Ann
ual M
axim
umN
/A$1
,000
-- $
2,00
0 (e
xclu
des
orth
odon
tia)
$1,6
00
$1,5
00
* Fo
r pur
pose
s of
cal
cula
ting
aver
ages
, we
assu
med
3X
for f
amily
max
imum
if th
ere
is n
o lim
it
Com
para
tor G
roup
Exhi
bit _
_ (M
PH-6
) Pa
ge 2
9 of
47
Exhibit __ (MPH-6) Page 29 of 47
157

29©
2009
Tow
ers
Perr
inP
ropr
ieta
ry a
nd C
onfid
entia
lN
ot fo
r use
or d
iscl
osur
e ou
tsid
e To
wer
s P
errin
and
its
clie
nts
Den
tal B
enef
its
The
com
petit
ive
posi
tioni
ng fo
r New
Yor
k U
nion
’s d
enta
l pla
n as
com
pare
d to
the
com
petit
or
grou
p is
larg
ely
driv
en b
y th
eir a
vera
ge to
bet
ter-t
han-
aver
age
plan
pro
visi
ons
The
New
Yor
k U
nion
den
tal p
lan
falls
in li
ne w
ith th
e co
mpe
titor
grou
p’s
aver
age
and
mea
n fo
r pro
visi
ons
such
as
the
$50
empl
oyee
ded
uctib
le, 1
00%
pre
vent
ive
cove
rage
, and
80%
ba
sic
serv
ices
cov
erag
eTh
e N
ew Y
ork
Uni
on p
lan
offe
rs a
sep
arat
e an
nual
max
imum
of $
2,00
0 fo
r maj
or s
ervi
ces,
an
d $1
,500
for p
reve
ntiv
e an
d ba
sic
serv
ices
, whi
ch n
o ot
her c
ompa
ny o
ffers
; all
othe
r uni
on
bene
fit p
rogr
ams
have
a s
ingl
e ca
lend
ar y
ear m
axim
um fo
r all
serv
ices
(exc
ludi
ng
orth
odon
tia)
Add
ition
ally
, the
New
Yor
k U
nion
pla
n co
vers
maj
or s
ervi
ces
at 6
0%, w
hile
the
maj
ority
of
com
petit
or c
ompa
nies
cov
er th
ese
serv
ices
at 5
0%Th
e pl
an c
over
s or
thod
ontia
at 1
00%
, and
onl
y th
ree
othe
r com
petit
or c
ompa
nies
(J, K
, and
H
) als
o co
ver o
rthod
ontia
at 1
00%
; the
maj
ority
of c
ompa
nies
that
cov
er o
rthod
ontia
cov
er
the
bene
fit a
t 50%
—Al
thou
gh th
e 10
0% o
rthod
ontia
ben
efit
appe
ars
mor
e ge
nero
us, t
helif
etim
e or
thod
ontia
m
axim
um d
rives
val
ue s
ince
alm
ost a
ll m
embe
rs re
ceiv
ing
orth
odon
tia s
ervi
ces
will
reac
h th
e m
axim
um; t
he N
ew Y
ork
Uni
on’s
orth
odon
tia m
axim
um is
$1,
800,
as
com
pare
d to
the
com
petit
or g
roup
’s a
vera
ge o
f $2,
000
Con
tinue
d…
Exhi
bit _
_ (M
PH-6
) Pa
ge 3
0 of
47
Exhibit __ (MPH-6) Page 30 of 47
158

30©
2009
Tow
ers
Perr
inP
ropr
ieta
ry a
nd C
onfid
entia
lN
ot fo
r use
or d
iscl
osur
e ou
tsid
e To
wer
s P
errin
and
its
clie
nts
Den
tal B
enef
its
F’s
posi
tioni
ng is
driv
en b
y its
hig
h ($
2,50
0) li
fetim
e or
thod
ontia
max
imum
G’s
pla
n ha
s no
ded
uctib
le, g
ener
ous
(85%
) bas
ic c
over
age
and
low
em
ploy
ee c
ontri
butio
ns
FG
LN
CH
AJ
IM
BK
DE
FG
KB
DE
LA
CN
IJ
MH
Exhi
bit _
_ (M
PH-6
) Pa
ge 3
1 of
47
Exhibit __ (MPH-6) Page 31 of 47
159

31©
2009
Tow
ers
Perr
inP
ropr
ieta
ry a
nd C
onfid
entia
lN
ot fo
r use
or d
iscl
osur
e ou
tsid
e To
wer
s P
errin
and
its
clie
nts
Life
Ins
uran
ce/A
D&
D B
enef
it S
core
and
Ran
k
The
follo
win
g ta
ble
illust
rate
s N
atio
nal G
rid’s
New
Yor
k U
nion
’s c
ompe
titiv
e po
sitio
ning
re
lativ
e to
thei
r pee
r gro
up in
term
s of
life
insu
ranc
e an
d A
D&
Dpr
ogra
ms
The
Nat
iona
l Grid
New
Yor
k U
nion
life
Insu
ranc
e/A
D&
D p
lan
is c
ompe
titiv
e as
com
pare
d to
pe
ers,
and
sco
res
wel
l abo
ve th
e av
erag
e pl
an
Life
Insu
ranc
e/AD
&D -
Activ
e Sc
ore
and
Rank
Scor
eRa
nk/1
5Em
ploy
er V
alue
Nat
iona
l Grid
New
Yor
k U
nion
174.
33/
15
Tota
l Val
ue
Nat
iona
l Grid
New
Yor
k U
nion
134.
54/
15
Exhi
bit _
_ (M
PH-6
) Pa
ge 3
2 of
47
Exhibit __ (MPH-6) Page 32 of 47
160

32©
2009
Tow
ers
Perr
inP
ropr
ieta
ry a
nd C
onfid
entia
lN
ot fo
r use
or d
iscl
osur
e ou
tsid
e To
wer
s P
errin
and
its
clie
nts
Life
Ins
uran
ce/A
D&
D C
ompa
riso
n
The
follo
win
g ta
ble
com
pare
s N
atio
nal G
rid’s
New
Yor
k U
nion
’s p
lan
desi
gn re
lativ
e to
thei
r pe
er g
roup
pla
n de
sign
s
Life
Insu
ranc
e/A
D&
D B
enef
it
Nat
iona
l Gri
d N
ew
York
Uni
on R
ange
A
vera
ge
Mod
eB
asic
2.5
x pa
y$5
,000
-- 2
x p
ay; i
f ag
e+se
rvic
e=85
: 4 x
pay
N/A
1 x
pay
Max
imum
$6
25,0
00
$5,0
00 --
No
Max
$495
,000
$1
,000
,000
S
uppl
emen
tal
Em
ploy
ee o
ptio
n1
to 5
x p
ay in
mul
tiple
s of
1 x
pay
Non
e --
$10,
000
to
$2,0
00,0
00 in
mul
tiple
s of
$1
0,00
0 (M
ax: 5
x p
ay)
N/A
1 to
5 x
pay
in m
ultip
les
of 1
x p
ay
Max
imum
$1
,000
,000
N
one
-- C
ombi
ned
with
Bas
ic
Life
: $1,
600,
000
N/A
Com
bine
d w
ith B
asic
Li
fe: $
1,60
0,00
0D
epen
dent
Spo
use
Non
e --
$10,
000
to $
100,
000
in m
ultip
les
of $
10,0
00N
/A$2
5,00
0 or
$50
,000
or
$100
,000
Opt
ion
I: $2
5,00
0 O
ptio
n II:
$5
0,00
0 C
hild
ren:
Non
e --
$10,
000
or $
15,0
00
or $
30,0
00N
/A$5
,000
or $
10,0
00
Opt
ion
I: $2
,500
O
ptio
n II:
$4,0
00
Opt
ion
III:
$10,
000
Acc
iden
tal D
eath
-Act
ive
Par
ticip
atio
n R
equi
rem
ents
Non
e6
mon
ths
of s
ervic
e --
Non
eN
/AN
one
Mon
thly
Em
ploy
ee C
ontri
butio
nsN
one
Non
eN
one
Non
eA
ccid
enta
l Dea
th B
enef
it A
mou
nt1
x pa
y +
$5,0
00; M
ax:
$25,
000
No
plan
-- 3
x p
ay, M
ax:
$500
,000
1.66
x p
ay,
Max
: $37
8,00
01
x pa
y
Com
para
tor
Gro
up
Exhi
bit _
_ (M
PH-6
) Pa
ge 3
3 of
47
Exhibit __ (MPH-6) Page 33 of 47
161

33©
2009
Tow
ers
Perr
inP
ropr
ieta
ry a
nd C
onfid
entia
lN
ot fo
r use
or d
iscl
osur
e ou
tsid
e To
wer
s P
errin
and
its
clie
nts
Life
Ins
uran
ce/A
D&
D B
enef
its
The
key
fact
or d
rivin
g N
atio
nal G
rid’s
New
Yor
k U
nion
life
insu
ranc
e an
d A
D&
D p
rogr
ams
to b
e ric
her t
han
som
e of
its
com
petit
ors
(rank
ed 3
rd) i
s th
e hi
gh b
asic
life
am
ount
: 2.5
x pa
y as
co
mpa
red
to th
e av
erag
e/m
ode
of 1
x pa
y fo
r the
com
petit
or g
roup
Onl
y F,
J, K
and
L o
ffer b
asic
life
at 2
x pa
y
The
New
Yor
k U
nion
’s b
enef
it m
axim
um is
$62
5,00
0, w
hich
is g
reat
er th
an th
e co
mpe
titor
gro
up
aver
age
of $
495,
000,
thou
gh lo
wer
than
the
com
petit
or g
roup
mod
eof
$1,
000,
000
Nat
iona
l Grid
’s N
ew Y
ork
Uni
on’s
sup
plem
enta
l life
ben
efit
com
pare
s w
ell w
ith th
eir c
ompe
titor
san
d of
fers
a s
epar
ate
bene
fit m
axim
um o
f $1,
000,
000
for t
hese
ben
efits
, whe
reas
the
maj
ority
of
thei
r com
petit
ors
offe
r a c
ombi
ned
basi
c an
d su
pple
men
tal b
enef
it m
axim
um o
f $1,
500,
000
The
New
Yor
k U
nion
offe
rs c
ompe
titiv
e de
pend
ent l
ife b
enef
its, a
lthou
gh th
e m
ajor
ity o
f co
mpe
titor
com
pani
es o
ffer a
n ad
ditio
nal s
pous
e be
nefit
opt
ion
of $
100,
000,
whe
reas
the
Nat
iona
l Grid
Uni
ons
only
offe
r a m
axim
um $
50,0
00 b
enef
it op
tion
The
New
Yor
k U
nion
offe
rs th
ree
child
life
opt
ions
: $2,
500,
$4,
000,
and
$10
,000
, whe
reas
the
maj
ority
of t
he c
ompe
titor
com
pani
es o
nly
offe
r a $
5,00
0 an
d $1
0,00
0 op
tion
The
AD
&D
ben
efit
is b
elow
the
com
petit
or c
ompa
nies
−th
e A
D&
D a
mou
nt is
1x
pay
plus
$5,
000
to a
max
imum
of $
25,0
00, v
ersu
s a
com
petit
or g
roup
ave
rage
of 1
xpa
y to
a m
axim
um o
f $3
78,0
00
Exhi
bit _
_ (M
PH-6
) Pa
ge 3
4 of
47
Exhibit __ (MPH-6) Page 34 of 47
162
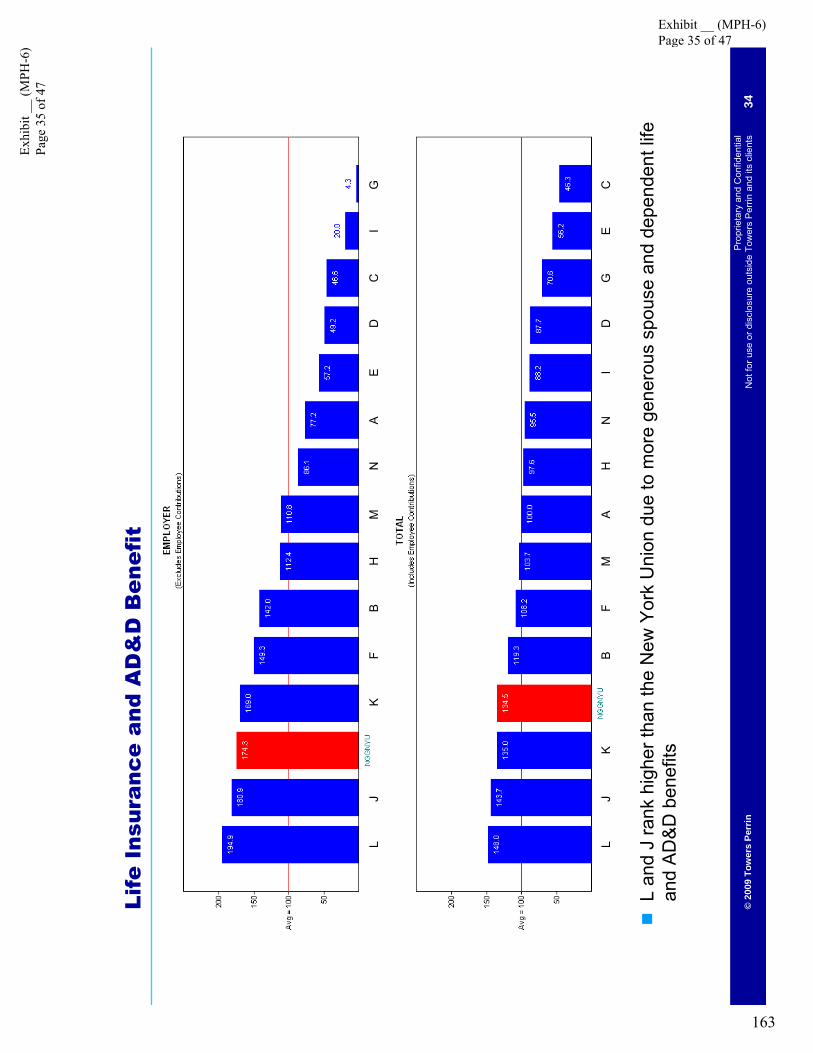
34©
2009
Tow
ers
Perr
inP
ropr
ieta
ry a
nd C
onfid
entia
lN
ot fo
r use
or d
iscl
osur
e ou
tsid
e To
wer
s P
errin
and
its
clie
nts
Life
Ins
uran
ce a
nd A
D&
D B
enef
it
L an
d J
rank
hig
her t
han
the
New
Yor
k U
nion
due
to m
ore
gene
rous
spou
se a
nd d
epen
dent
life
an
d A
D&
D b
enef
its
LJ
BG
EF
NM
IA
DK
CH
LJ
FC
IB
HA
EN
DK
GM
Exhi
bit _
_ (M
PH-6
) Pa
ge 3
5 of
47
Exhibit __ (MPH-6) Page 35 of 47
163

35©
2009
Tow
ers
Perr
inP
ropr
ieta
ry a
nd C
onfid
entia
lN
ot fo
r use
or d
iscl
osur
e ou
tsid
e To
wer
s P
errin
and
its
clie
nts
Sho
rt T
erm
Dis
abili
ty S
core
and
Ran
k
The
follo
win
g ta
ble
illust
rate
s N
atio
nal G
rid’s
New
Yor
k U
nion
’s c
ompe
titiv
e po
sitio
ning
rela
tive
to th
eir p
eer g
roup
in te
rms
of S
TD p
rogr
ams
In te
rms
of b
oth
Em
ploy
er V
alue
and
Tot
al V
alue
, the
New
Yor
k U
nion
des
ign
is s
light
ly
abov
e av
erag
e Sho
rt T
erm
Dis
abili
ty S
core
and
Ran
k
Sco
reR
ank/
15Em
ploy
er V
alue
Nat
iona
l Grid
New
Yor
k U
nion
103.
88/
15
Tota
l Val
ue
Nat
iona
l Grid
New
Yor
k U
nion
103.
88/
15
Exhi
bit _
_ (M
PH-6
) Pa
ge 3
6 of
47
Exhibit __ (MPH-6) Page 36 of 47
164

36©
2009
Tow
ers
Perr
inP
ropr
ieta
ry a
nd C
onfid
entia
lN
ot fo
r use
or d
iscl
osur
e ou
tsid
e To
wer
s P
errin
and
its
clie
nts
Sho
rt T
erm
Dis
abili
ty C
ompa
riso
n
The
follo
win
g ta
ble
com
pare
s N
atio
nal G
rid’s
New
Yor
k U
nion
pla
n de
sign
s re
lativ
e to
thei
r pee
r gr
oup
plan
des
igns
The
New
Yor
k U
nion
’s s
ick
pay
bene
fit is
less
rich
than
thos
e of
the
com
petit
or g
roup
at e
arlie
r ye
ars
of s
ervi
ce a
nd m
ore
gene
rous
at l
ater
yea
rs o
f ser
vice
The
sala
ry c
ontin
uanc
e be
nefit
is p
rovi
ded
at 6
0% o
f pay
for t
heba
lanc
e of
26
wee
ks a
s co
mbi
ned
with
the
sick
pay
ben
efit,
whi
ch is
less
gen
erou
s th
an m
ost o
f the
oth
er c
ompe
titor
co
mpa
nies
: 80%
to 1
00%
of p
ay fo
r a ra
nge
of w
eeks
at y
ears
of s
ervi
ce b
ands
Shor
t Ter
m D
isab
ility
Nat
iona
l Gri
d N
ew
York
Uni
on
Rang
eAv
erag
eM
ode
Sic
k P
ay1s
t Day
of D
isab
ility
If ill
ness
, 7th
cal
enda
r da
y of
dis
abili
ty; i
f ac
cide
nt, 1
st d
ay o
f di
sabi
lity
-- 1s
t day
of
disa
bilit
y
N/A
1st d
ay o
f dis
abili
ty
Sala
ry C
ontin
uanc
eE
nd o
f Sic
k P
ayLa
ter o
f 8th
wor
king
day
of
dis
abili
ty o
r end
of
Sic
k P
ay --
End
of S
ick
Pay
N/A
End
of S
ick
Pay
Bene
fit A
mou
ntS
ick
Pay
Yea
rs o
f Ser
vice
Wee
ks a
t 100
%
Wee
ks a
t 100
%
Wee
ks a
t 100
%
Wee
ks a
t 100
%1
12-
42
15
52-
107
510
102-
2011
1515
152-
3015
1520
202-
4020
2325
252-
5025
2630
302-
6029
3035
352-
6031
32
Sala
ry C
ontin
uanc
e60
% o
f pay
; Les
s P
rimar
y S
ocia
l Sec
urity
; Le
ss D
epen
dent
Soc
ial
Sec
urity
; Pay
able
for
bala
nce
of 2
6 w
eeks
per
ye
ar
No
sala
ry c
ontin
uanc
e --
100%
of p
ay, l
ess
Prim
ary
Soc
ial S
ecur
ity,
paya
ble
for 5
2 w
eeks
per
di
sabi
lity
N/A
YO
S S
ched
ule
Yea
rs o
f Ser
vice
Wee
ks a
t 60%
126
526
1026
1526
2026
2526
3026
3526
Com
para
tor G
roup
Exhi
bit _
_ (M
PH-6
) Pa
ge 3
7 of
47
Exhibit __ (MPH-6) Page 37 of 47
165

37©
2009
Tow
ers
Perr
inP
ropr
ieta
ry a
nd C
onfid
entia
lN
ot fo
r use
or d
iscl
osur
e ou
tsid
e To
wer
s P
errin
and
its
clie
nts
Sho
rt T
erm
Dis
abili
ty
Ove
rall,
ther
e is
littl
e di
ffere
ntia
tion
in th
e de
sign
of S
TD p
lans
and
ther
efor
e th
e va
lue
does
not
var
y w
idel
y
The
outli
er in
the
grou
p is
E, w
hich
onl
y ha
s a
defin
ed d
olla
r ben
efit
paya
ble
for 2
6 w
eeks
per
dis
abili
ty
JM
BE
DN
FG
LI
AK
CH
JM
BE
DN
FG
LI
AK
CH
Exhi
bit _
_ (M
PH-6
) Pa
ge 3
8 of
47
Exhibit __ (MPH-6) Page 38 of 47
166

38©
2009
Tow
ers
Perr
inP
ropr
ieta
ry a
nd C
onfid
entia
lN
ot fo
r use
or d
iscl
osur
e ou
tsid
e To
wer
s P
errin
and
its
clie
nts
Long
Ter
m D
isab
ility
Ben
efit
Sco
re a
nd R
ank
The
follo
win
g ta
ble
illust
rate
s N
atio
nal G
rid’s
New
Yor
k U
nion
’s c
ompe
titiv
e po
sitio
ning
re
lativ
e to
thei
r pee
r gro
up in
term
s of
LTD
pro
gram
s
The
New
Yor
k U
nion
doe
s no
t offe
r the
ir em
ploy
ees
an L
TD p
lan,
so
they
are
tied
for l
ast
plac
e un
der t
he T
otal
Val
ue w
ith th
ree
othe
r com
petit
or c
ompa
nies
(C, E
, and
G) t
hat a
lso
do n
ot o
ffer L
TD p
lans
Long
Ter
m D
isab
ility
Sco
re a
nd R
ank
Scor
eRa
nk/1
5Em
ploy
er V
alue
Nat
iona
l Grid
New
Yor
k U
nion
0.0
tied
for l
ast
Tota
l Val
ue
Nat
iona
l Grid
New
Yor
k U
nion
0.0
tied
for l
ast
Exhi
bit _
_ (M
PH-6
) Pa
ge 3
9 of
47
Exhibit __ (MPH-6) Page 39 of 47
167
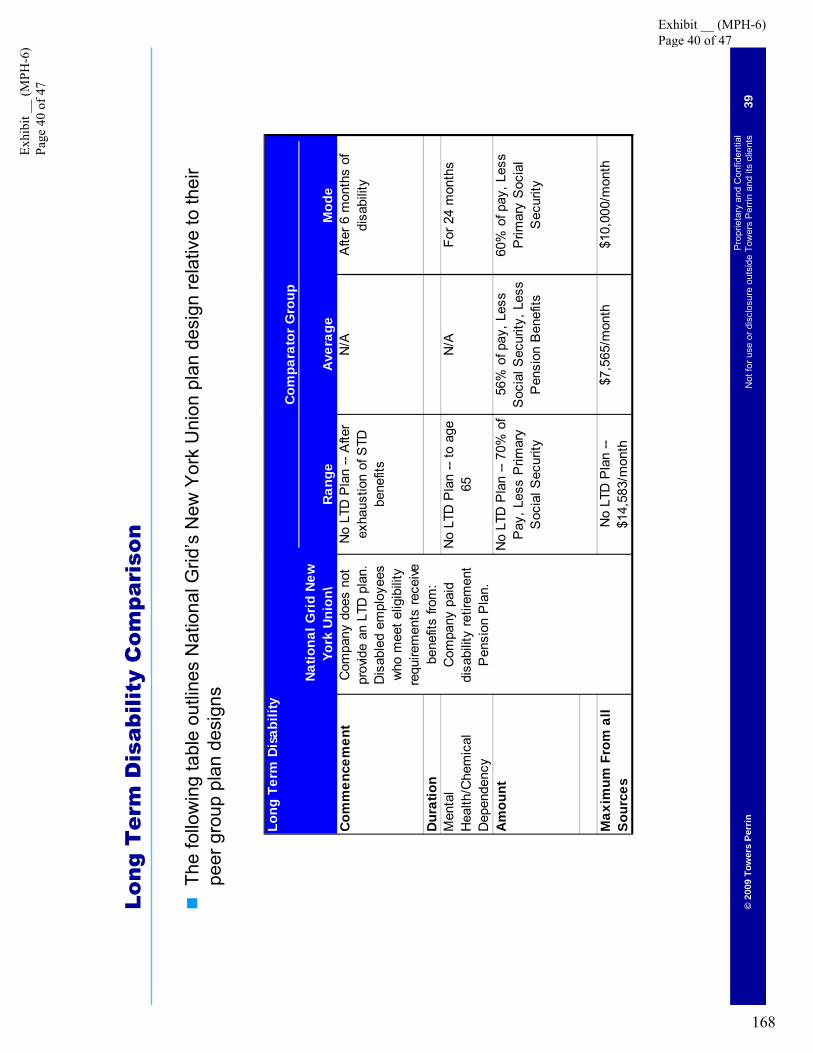
39©
2009
Tow
ers
Perr
inP
ropr
ieta
ry a
nd C
onfid
entia
lN
ot fo
r use
or d
iscl
osur
e ou
tsid
e To
wer
s P
errin
and
its
clie
nts
Long
Ter
m D
isab
ility
Com
pari
son
The
follo
win
g ta
ble
outli
nes
Nat
iona
l Grid
’s N
ew Y
ork
Uni
on p
lan
desi
gn re
lativ
e to
thei
r pe
er g
roup
pla
n de
sign
s Nat
iona
l Gri
d Ne
w
York
Uni
on\
Rang
eAv
erag
eM
ode
Com
men
cem
ent
No
LTD
Pla
n --
Afte
r ex
haus
tion
of S
TD
bene
fits
N/A
Afte
r 6 m
onth
s of
di
sabi
lity
Dur
atio
nM
enta
l H
ealth
/Che
mic
al
Dep
ende
ncy
No
LTD
Pla
n --
to a
ge
65N
/AFo
r 24
mon
ths
Am
ount
Max
imum
Fro
m a
ll S
ourc
esN
o LT
D P
lan
-- $1
4,58
3/m
onth
$7,5
65/m
onth
$10,
000/
mon
th
Long
Ter
m D
isab
ility
Com
pany
doe
s no
t pr
ovid
e an
LTD
pla
n.
Dis
able
d em
ploy
ees
who
mee
t elig
ibili
ty
requ
irem
ents
rece
ive
bene
fits
from
: C
ompa
ny p
aid
disa
bilit
y re
tirem
ent
Pen
sion
Pla
n.
Com
para
tor G
roup
No
LTD
Pla
n --
70%
of
Pay
, Les
s P
rimar
y S
ocia
l Sec
urity
56%
of p
ay, L
ess
Soc
ial S
ecur
ity, L
ess
Pen
sion
Ben
efits
60%
of p
ay, L
ess
Prim
ary
Soc
ial
Sec
urity
Exhi
bit _
_ (M
PH-6
) Pa
ge 4
0 of
47
Exhibit __ (MPH-6) Page 40 of 47
168

40©
2009
Tow
ers
Perr
inP
ropr
ieta
ry a
nd C
onfid
entia
lN
ot fo
r use
or d
iscl
osur
e ou
tsid
e To
wer
s P
errin
and
its
clie
nts
Long
Ter
m D
isab
ility
Ben
efit
A’s
pla
ns h
as th
e hi
ghes
t ben
efit
amou
nt a
nd m
axim
um o
f all
of th
eco
mpe
titor
s’pl
ans
AL
FG
NI
MK
EH
CJ
DB
AL
IG
NJ
BK
EM
HD
CF
Exhi
bit _
_ (M
PH-6
) Pa
ge 4
1 of
47
Exhibit __ (MPH-6) Page 41 of 47
169

41©
2009
Tow
ers
Perr
inP
ropr
ieta
ry a
nd C
onfid
entia
lN
ot fo
r use
or d
iscl
osur
e ou
tsid
e To
wer
s P
errin
and
its
clie
nts
Vac
atio
n an
d H
olid
ay B
enef
it S
core
and
Ran
k
The
follo
win
g ta
ble
illust
rate
s N
atio
nal G
rid’s
New
Yor
k U
nion
’s c
ompe
titiv
e po
sitio
ning
re
lativ
e to
thei
r pee
r gro
up in
term
s of
vac
atio
n an
d ho
liday
pro
gram
s
Vaca
tion
and
Holid
ay S
core
and
Ran
k
Scor
eRa
nk/1
5Em
ploy
er V
alue
Nat
iona
l Grid
New
Yor
k U
nion
103.
13/
15
Tota
l Val
ue
Nat
iona
l Grid
New
Yor
k U
nion
103.
13/
15
Exhi
bit _
_ (M
PH-6
) Pa
ge 4
2 of
47
Exhibit __ (MPH-6) Page 42 of 47
170

42©
2009
Tow
ers
Perr
inP
ropr
ieta
ry a
nd C
onfid
entia
lN
ot fo
r use
or d
iscl
osur
e ou
tsid
e To
wer
s P
errin
and
its
clie
nts
Vac
atio
n an
d H
olid
ay B
enef
its
Com
pari
son
The
follo
win
g ta
ble
com
pare
s N
atio
nal G
rid’s
New
Yor
k U
nion
’s p
lan
desi
gns
rela
tive
to th
eir
peer
gro
up p
lan
desi
gns
A m
ajor
ity o
f the
com
petit
or c
ompa
nies
offe
r ver
y si
mila
r vac
atio
n an
d ho
liday
ben
efits
; the
refo
re,
the
rang
e of
sco
res
is c
lose
for a
ll
The
New
Yor
k U
nion
ove
rall
desi
gn is
slig
htly
mor
e ge
nero
us th
anso
me
of th
e ot
her c
ompe
titor
co
mpa
nies
Whi
le th
e N
ew Y
ork
Uni
on v
acat
ion
bene
fit is
less
rich
than
thos
e of
the
com
petit
or g
roup
at
earli
er y
ears
of s
ervi
ce, t
he b
enef
it ca
tche
s up
to th
e co
mpe
titor
ave
rage
at l
ater
yea
rs, a
nd
surp
asse
s th
e co
mpe
titor
gro
up m
ode
at 3
0 ye
ars
of s
ervi
ceTh
e N
ew Y
ork
Uni
on a
lso
offe
rs 1
3 ho
liday
s, w
hich
is s
light
ly h
ighe
r tha
n av
erag
e
Vaca
tion
and
Holid
ay P
ract
ices
Natio
nal G
rid
New
Yor
k Un
ion
Rang
e*Av
erag
e M
ode
Amou
nt o
f Vac
atio
n (d
ays)
Yea
rs o
f Ser
vice
<10
0 - U
p to
10
2.5
01
Up
to 1
05-
179.
110
510
10-2
213
.915
1015
15-2
216
.315
1520
20-2
720
.620
2020
20-2
722
.420
2525
20-3
225
.125
3030
20-3
727
.325
Holid
ay P
olic
yC
ompa
ny S
ched
uled
10 d
ays
7-12
10.1
11E
mpl
oyee
Sch
edul
ed3
days
0-6
2.1
1* In
clud
es o
ne P
TO p
rogr
am
Com
para
tor G
roup
Exhi
bit _
_ (M
PH-6
) Pa
ge 4
3 of
47
Exhibit __ (MPH-6) Page 43 of 47
171
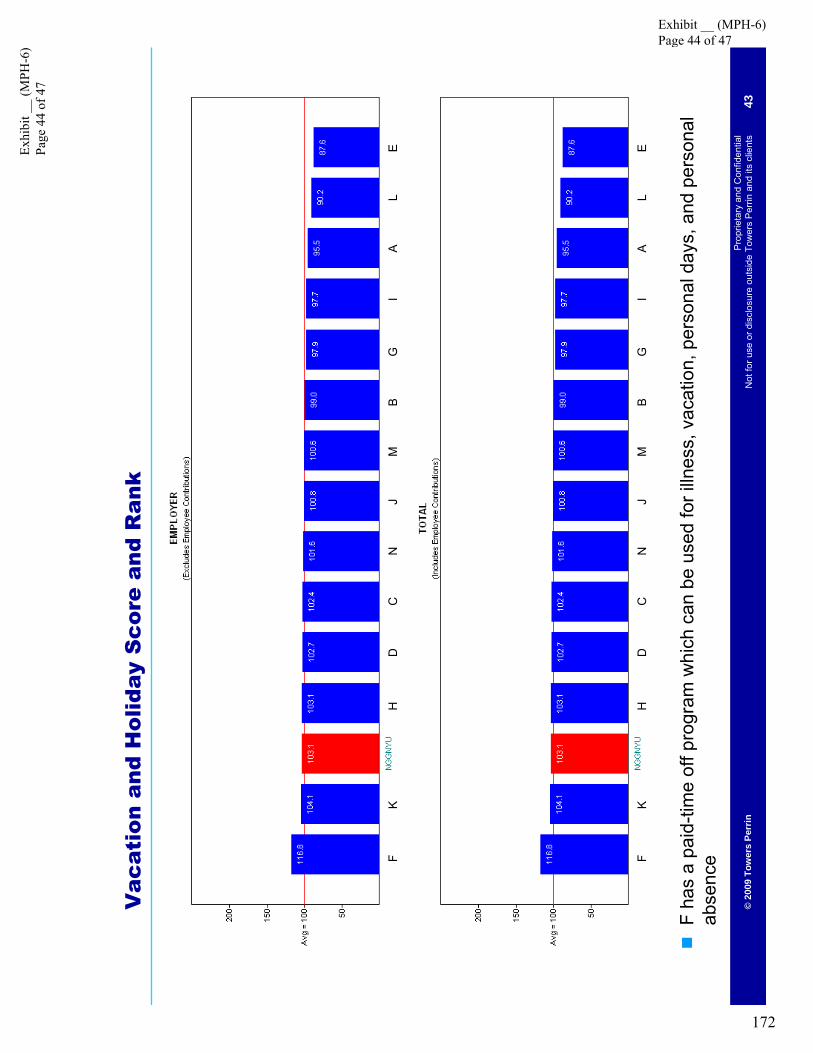
43©
2009
Tow
ers
Perr
inP
ropr
ieta
ry a
nd C
onfid
entia
lN
ot fo
r use
or d
iscl
osur
e ou
tsid
e To
wer
s P
errin
and
its
clie
nts
Vac
atio
n an
d H
olid
ay S
core
and
Ran
k
F ha
s a
paid
-tim
e of
f pro
gram
whi
ch c
an b
e us
ed fo
r illn
ess,
vac
atio
n, p
erso
nal d
ays,
and
per
sona
l ab
senc
eFK
CE
BD
JG
LM
IH
AN
FK
CE
BD
JG
LM
IH
AN
Exhi
bit _
_ (M
PH-6
) Pa
ge 4
4 of
47
Exhibit __ (MPH-6) Page 44 of 47
172

Sum
mar
y
Exhi
bit _
_ (M
PH-6
) Pa
ge 4
5 of
47
Exhibit __ (MPH-6) Page 45 of 47
173

45©
2009
Tow
ers
Perr
inP
ropr
ieta
ry a
nd C
onfid
entia
lN
ot fo
r use
or d
iscl
osur
e ou
tsid
e To
wer
s P
errin
and
its
clie
nts
Sum
mar
y
As
note
d th
roug
hout
this
doc
umen
t, th
e N
atio
nal G
rid N
ew Y
ork
Uni
on h
as s
ome
bene
fit
prov
isio
ns th
at a
re m
ore
gene
rous
than
the
com
petit
or g
roup
, and
othe
rs th
at a
re le
ss
gene
rous
than
the
com
petit
or g
roup
, whi
ch u
ltim
atel
y co
ntrib
ute
to th
e ov
eral
l Ent
ire B
enef
it P
rogr
am s
core
bei
ng s
light
ly b
elow
the
med
ian
of th
e co
mpa
rato
r gro
upIn
term
s of
Em
ploy
er V
alue
, the
New
Yor
k U
nion
offe
rs g
ener
ous
activ
e m
edic
al, d
enta
l, Li
fe a
nd A
D&
D p
rogr
ams,
less
rich
retir
emen
t (D
C,D
B, a
nd re
tiree
med
ical
) ben
efits
, and
co
mpe
titiv
e va
catio
n/ho
liday
ben
efits
. Th
e E
ntire
Ben
efit
Pro
gram
sco
re is
slig
htly
bel
ow a
vera
ge b
ecau
se g
ener
ous
activ
e m
edic
al b
enef
its a
re o
ffset
by
the
less
gen
erou
s re
tiree
med
ical
bene
fit p
rogr
am
Prov
isio
nEm
ploy
er V
alue
Tota
l Val
ueEn
tire
Ben
efit
Pro
gram
98.3
102.
7D
efin
ed B
enef
it10
0.2
100.
2
Def
ined
Con
tribu
tion
78.6
122.
2
Def
ined
Ben
efit
+ D
efin
ed c
ontri
butio
n91
.411
4.5
Pos
t-ret
irem
ent M
edic
al40
.062
.2
Pos
t-ret
irem
ent D
eath
0.0
0.0
Ret
irem
ent E
vent
s77
.710
0.3
Act
ive M
edic
al10
5.4
103.
9
Den
tal
107.
310
3.4
Life
Insu
ranc
e/A
D&
D17
4.3
134.
5
STD
103.
810
3.8
LTD
0.0
0.0
Vac
atio
n +
Hol
iday
103.
110
3.1
Natio
nal G
rid N
ew Y
ork
Unio
n
Exhi
bit _
_ (M
PH-6
) Pa
ge 4
6 of
47
Exhibit __ (MPH-6) Page 46 of 47
174

46©
2009
Tow
ers
Perr
inP
ropr
ieta
ry a
nd C
onfid
entia
lN
ot fo
r use
or d
iscl
osur
e ou
tsid
e To
wer
s P
errin
and
its
clie
nts
BE
NV
AL®
Val
uati
on M
etho
dolo
gy
Rel
ativ
e va
lues
are
not
inte
nded
to re
pres
ent a
ctua
l pla
n/pr
ogra
m c
osts
Pla
n pr
ovis
ions
val
ued
are
thos
e ap
plic
able
to n
ewly
hire
d sa
larie
d em
ploy
ees
Ben
efits
una
vaila
ble
to n
ew h
ires
are
not r
efle
cted
Ben
efit
valu
es a
re b
ased
on
the
follo
win
g as
sum
ptio
ns a
nd m
etho
dolo
gies
:S
tand
ard
popu
latio
n—
Aver
age
age:
44
year
s—
Aver
age
serv
ice:
12
year
s—
Aver
age
base
sal
ary:
$72
,150
—Av
erag
e to
tal c
ompe
nsat
ion:
$78
,467
Key
eco
nom
ic a
ssum
ptio
ns—
Dis
coun
t rat
e: 7
.5%
—Sa
lary
incr
ease
rate
: 4.5
%
—In
flatio
n: 2
.5%
—O
ne-y
ear T
reas
ury
bond
yie
ld: 4
.4%
—30
-yea
r Tre
asur
y bo
nd y
ield
: 5.5
%—
Hea
lth c
are
cost
tren
d: 1
0% g
rade
d to
5%
ove
r fiv
e ye
ars
Not
e: A
mor
e de
taile
d su
mm
ary
of v
alua
tion
assu
mpt
ions
and
pla
n-sp
ecifi
c m
etho
dolo
gy c
an
be fo
und
in th
e “H
elp”
sect
ion
in th
e B
EN
VA
L®so
ftwar
e to
ol
Exhi
bit _
_ (M
PH-6
) Pa
ge 4
7 of
47
Exhibit __ (MPH-6) Page 47 of 47
175

Testimony of
Richard F. M
eischeid

Before the Public Service Commission
NIAGARA MOHAWK POWER CORPORATION d/b/a NATIONAL GRID
Direct Testimony
of
Richard F. Meischeid
Of Towers Watson
Dated: January 29, 2010
176

Testimony of Richard F. Meischeid
Page 1 of 12
Q. Please state your name and business address. 1
A. My name is Richard Meischeid. I am employed by Towers Watson 2
(formerly Towers Perrin) at Centre Square East, 1500 Market Street, 3
Philadelphia, Pennsylvania 19102. 4
5
Q. Please describe your education and professional background. 6
A. I have been with Towers Watson for over 30 years, and during that time 7
have held a number of positions. Currently, I am responsible for 8
managing the firm’s compensation practice in the east region and leading 9
Towers Watson’s Energy Services compensation practice. I received an 10
MBA from the Wharton School of the University of Pennsylvania. A 11
more extensive statement of my qualifications is included as part of 12
Exhibit __ (RFM-1). 13
14
Q. Please provide a brief overview of Towers Watson. 15
A. Towers Watson is one of the world’s largest management and human 16
resources consulting firms, helping organizations manage their investment 17
in people to achieve measurable performance improvements. The firm’s 18
compensation practice is one of the largest in the world. Towers Watson 19
has dedicated energy and utility industry practitioners specializing in 20
compensation, human resources, and benefits. 21
177

Testimony of Richard F. Meischeid
Page 2 of 12
Q. Please summarize what Niagara Mohawk retained Towers Watson to 1
do. 2
A. Towers Watson was asked to provide competitive practice information on 3
the subject of annual incentives in the energy services industry. We were 4
also asked to compare Niagara Mohawk and National Grid’s 5
compensation levels to the competitive market with and without variable 6
pay. Finally, we were asked to provide information concerning market 7
increases in wages forecast for calendar year 2010. 8
9
Q. Do you sponsor any exhibits as part of your direct testimony? 10
A. Yes. I am sponsoring the following exhibits, which were prepared under 11
my supervision and direction: 12
(i) Exhibit __ (RFM-1) is entitled “National Grid USA, Competitive 13
Assessment of Non-Union Compensation,” and 14
(ii) Exhibit __ (RFM-2) is entitled “National Grid USA, Target 15
Compensation as a Percent of Market Assessment.” 16
17
Q. What specific tasks did you perform? 18
A. I performed the following work: (1) assessed the prevalence of variable 19
pay programs in the energy services industry; (2) analyzed National Grid’s 20
2009 target compensation opportunity relative to the energy services 21
178

Testimony of Richard F. Meischeid
Page 3 of 12
industry with and without variable pay amounts; and (3) analyzed data 1
concerning forecasts of wage increases in the energy services industry for 2
calendar year 2010. 3
4
Q. What was the purpose of your analysis of variable pay prevalence? 5
A. I attempted to discern how widespread the use of variable pay has become 6
in the energy services industry and therefore the degree to which variable 7
pay has become a standard part of the typical compensation package 8
offered to employees today. 9
10
Q. On what sources of compensation data did you rely? 11
A. Competitive compensation information was collected from Towers 12
Watson’s 2009 Energy Services Middle Management and Professional 13
Compensation Database. 14
15
Q. Is this the most current survey source available? 16
A. Yes. The Towers Watson database reflects compensation in effect as of 17
March 1, 2009. 18
19
Q. Is this the most comprehensive survey of energy services industry 20
positions? 21
179

Testimony of Richard F. Meischeid
Page 4 of 12
A. Yes. The Towers Watson database reflects the practices of approximately 1
129 energy services companies and includes both staff (e.g., human 2
resources, information technology, finance, etc.) and line (e.g., nuclear, 3
generation, transmission and distribution, etc.) positions. The database 4
includes data for over 400 non-executive, exempt positions common 5
among energy services companies. 6
7
Q. For the purpose of assessing energy services market practices, how 8
was the competitive market defined? 9
A. For this study, we analyzed market data relative to two market reference 10
points: 11
(1) We compared relative to the broader energy services industry by 12
analyzing the practices of approximately 129 energy services 13
companies in Towers Watson’s database. 14
2) Additionally, consistent with the standard practice of controlling 15
for size, we also compared relative to a sample of companies 16
similar in size to National Grid. Specifically, we used 40 energy 17
services companies having annual revenues of $6 billion or greater 18
participating in Towers Watson’s database for this portion of the 19
analysis. 20
180

Testimony of Richard F. Meischeid
Page 5 of 12
Q. What were your findings with respect to the prevalence of variable 1
pay in the energy services industry? 2
A. I found that variable pay is used by the vast majority of companies, with 3
98 percent of the similarly sized energy services companies and 90 percent 4
of the broader energy services industry sample maintaining formal 5
variable pay plans for their non-executive, exempt populations. The 6
results of our analyses are set forth on Exhibit __ (RFM-1). 7
8
Q. How broadly do energy services companies use annual incentives? 9
A. To assess how broadly variable pay is used within these organizations, we 10
analyzed eligibility on a position-by-position basis among all of the 11
benchmark positions included in Towers Watson’s database. We found 12
that the majority of positions surveyed are eligible for variable pay. 13
Specifically, we found that 99 percent of positions for the similarly sized 14
energy services companies and 92 percent of positions for the broader 15
energy services sample are eligible for variable pay. 16
17
Q. Does National Grid need to offer variable pay in order to provide a 18
competitive compensation package? 19
A. Yes. To attract and retain talented employees in today’s highly 20
competitive market, companies, including National Grid, must offer a 21
181

Testimony of Richard F. Meischeid
Page 6 of 12
competitive total rewards program, including base salary, variable pay, a 1
retirement program, health and welfare benefits, and learning and 2
development opportunities. As the prevalence data provided above shows, 3
variable pay is used widely in the energy services industry and is a 4
standard component of the compensation package provided to employees. 5
Thus, variable compensation is not “additional” or “optional” 6
compensation that National Grid provides to employees, but a required 7
element in the compensation program and a necessary cost of doing 8
business. 9
10
Q. In addition to delivering a competitive compensation package to 11
employees, what other reasons make it important to provide variable 12
pay? 13
A Multiple groups (e.g., customers, employees, community groups, 14
shareholders, etc.) have a vested interest in utilities’ operations and 15
performance. Variable pay programs play a critical role in focusing 16
employees on key organizational, business unit, and individual goals. The 17
use of both financial and non-financial goals is common practice among 18
utilities. Non-financial measures are designed to focus employees on 19
achieving superior operational, safety, and customer service results, while 20
financial measures help focus employees on achieving those results in an 21
182

Testimony of Richard F. Meischeid
Page 7 of 12
efficient and cost effective manner. National Grid’s approach of using 1
both financial and non-financial measures is consistent with sound 2
compensation practice and helps provide balance so that excellence in one 3
area is not achieved at the expense of other areas. 4
5
Q. Why did you perform a competitive analysis of National Grid’s base 6
salary, target variable pay opportunity, and target total cash 7
compensation levels? 8
A. I studied the competitiveness of National Grid’s base salary, target annual 9
variable pay opportunity, and target total cash compensation levels to 10
ascertain: (1) whether the level of variable pay being used by National 11
Grid is consistent with the competitive market practice; and (2) whether 12
National Grid’s total cash levels including variable pay opportunities are 13
competitive with market levels. 14
15
Q. What types of positions were included in your review? 16
A. I analyzed competitive market data for 428 National Grid positions 17
covering over 4,200 incumbents. 18
19
Q. At what level were competitive data analyzed? 20
183

Testimony of Richard F. Meischeid
Page 8 of 12
A. Competitive compensation data were analyzed using the market median 1
(50th percentile) as a measure of central tendency. One half of the 2
companies in the reference group provide pay in excess of the median and 3
one half provide compensation that is less than the median. 4
5
Q. Did you make any subjective adjustments to the data in your 6
analysis? 7
A. No. While companies consider a number of factors (e.g., experience, 8
internal equity) in setting compensation levels, I did not make any 9
adjustments to the market data. 10
11
Q. What types of compensation were included in your compensation 12
analysis? 13
A. My analysis of competitive data included the following elements of pay: 14
(1) base salary; (2) target annual variable pay opportunity; and (3) target 15
total cash compensation (the sum of base salary and target variable pay 16
opportunity). 17
18
Q. How do National Grid’s base salaries compare to market salary 19
levels? 20
184

Testimony of Richard F. Meischeid
Page 9 of 12
A. Base salary paid by National Grid is aligned with the 50th percentile of the 1
similarly sized energy services group and slightly above the median of the 2
broader energy services industry sample. 3
4
Q. How do National Grid’s target annual variable pay opportunities 5
compare to market levels? 6
A. National Grid’s target annual variable pay opportunities are below market 7
levels. On average, target annual variable pay opportunities provided by 8
National Grid are two percent of salary below the 50th percentile of the 9
similarly sized energy services group and one percent of salary below the 10
broader energy services industry sample. 11
12
Q. How do National Grid’s target cash compensation levels compare to 13
competitive market levels when including both the value of target 14
annual variable pay and base salaries? 15
A. When target annual variable pay opportunities are included, National 16
Grid’s target total cash compensation levels are in line with median 17
market levels. Specifically, on average, National Grid’s target total cash 18
compensation is two percent below the 50th percentile of the similarly 19
sized energy services companies and two percent above the median of the 20
broader energy services sample on a target total cash basis (base salary 21
185

Testimony of Richard F. Meischeid
Page 10 of 12
plus target annual variable pay). The comparison of National Grid’s target 1
total cash compensation to similarly sized energy services companies is set 2
forth on Exhibit __ (RFM-2). 3
4
Q. Does National Grid need to offer annual variable pay opportunities in 5
order to provide a competitive compensation package? 6
A. Yes. To answer this question, I compared National Grid’s base salary 7
levels to market levels of target total cash compensation (salary plus target 8
annual variable pay). This analysis shows how National Grid’s pay levels 9
would compare to energy services industry levels if National Grid did not 10
offer annual variable pay opportunities. My analysis found that, in the 11
aggregate, National Grid’s base salaries would average eleven percent 12
below median market levels of similarly sized energy services companies 13
and seven percent below median levels of the broader energy services 14
sample if it did not provide variable pay. 15
16
Q. What do these findings demonstrate? 17
A. My findings demonstrate that given the Company’s current salary levels, 18
National Grid would not provide its employees with competitive levels of 19
target total cash compensation if the Company did not provide a variable 20
pay opportunity. 21
186

Testimony of Richard F. Meischeid
Page 11 of 12
Q. Could National Grid raise its base pay levels to the market levels 1
instead of providing annual variable pay opportunities to stay 2
competitive? 3
A. Yes, it could, but it would result in a higher level of fixed costs. 4
Moreover, paying compensation solely in salary would remove incentives 5
for employees to provide superior service to customers and the other 6
constituencies that National Grid serves. Incentives ensure that 7
individuals have an element of “at risk” compensation that allows National 8
Grid to align pay with performance and allocate compensation to those 9
employees that are most deserving. 10
11
Q. Based on the results of your analysis, what is your recommendation 12
with respect to the Company’s request in this rate case? 13
A. Based on my analysis and information provided by Company witnesses, 14
the overall cost of National Grid’s total rewards program is reasonable. 15
This being the case, allowing the Company to determine the allocation 16
between the different components of the total rewards program is critical 17
to the Company’s ability to manage the business to the benefit of its 18
customers, shareholders, and employees. The Company’s track record 19
over the past several years in managing the total cost in a prudent, 20
thoughtful manner demonstrates both the importance and success of 21
187

Testimony of Richard F. Meischeid
Page 12 of 12
permitting the Company to allocate compensation between fixed and 1
variable components. 2
3
Q. Did you examine market data concerning the likely increases in wages 4
that will be offered in the energy services industry in calendar year 5
2010? 6
A. Yes. 7
8
Q. What did this analysis show? 9
A. Based on current forecasts, it appears that National Grid’s forecast of three 10
percent annual increases in wages in 2010 is reasonable and in line with 11
what the market is projecting. These forecasts are subject to change as 12
economic conditions change and it would be reasonable to update these 13
projections near the time that the Commission issues its decision in this 14
case. 15
16
Q. Does this conclude your testimony? 17
A. Yes.18
188

Exhibits of
R
ichard F. Meischeid

Testimony of Richard F. Meischeid
Index of Exhibits
Exhibit __ (RFM-1) National Grid USA, Competitive Assessment of
Non-Union Compensation Exhibit __ (RFM-2) National Grid USA, Target Compensation as a
Percent of Market Assessment
189

Exhibit __ (R
FM-1)
Testimony of Richard F. Meischeid
Exhibit __ (RFM-1)
National Grid USA, Competitive Assessment of Non-Union Compensation
190

Exhibit __ (RFM-1) Page 1 of 12
National Grid USA 0
1
National Grid USA
Competitive Assessment of Non-Union Compensation
Outline Prepared by Towers Perrin Richard Meischeid
December 4, 2009
191

Exhibit __ (RFM-1) Page 2 of 12
National Grid USA 0
2
Table of Contents COMPETITIVE ASSESSMENT OF NON-UNION COMPENSATION........................3 Introduction..................................................................................................................3 Approach to Assessing Pay Competitiveness and Determining the Prevalence of Incentive Compensation..............................................................................................3 Findings – Competitiveness of Pay.............................................................................4 Findings – Prevalence of Incentive Compensation…..................................................5 Observations................................................................................................................6 APPENDIX I: DESCRIPTION OF TOWERS PERRIN ...............................................8 APPENDIX II: BIOGRAPHY: RICHARD MEISCHEID ..............................................9 APPENDIX III: 2009 TOWERS PERRIN MIDDLE MANAGEMENT AND PROFESSIONAL SURVEY – PARTICIPANTS WITH REVENUES GREATER THAN $6 BILLION ...................................................................................................10 APPENDIX IV: 2008 TOWERS PERRIN MIDDLE MANAGEMENT AND PROFESSIONAL SURVEY – PARTICIPANTS WITH REVENUES GREATER THAN $6 BILLION ………………………………………………………........................11 APPENDIX V: 2007 TOWERS PERRIN MIDDLE MANAGEMENT AND PROFESSIONAL SURVEY – PARTICIPANTS WITH REVENUES GREATER THAN $6 BILLION ………………………………………………………........................12
192

Exhibit __ (RFM-1) Page 3 of 12
National Grid USA 0
3
COMPETITIVE ASSESSMENT OF NON-UNION COMPENSATION Introduction National Grid asked Towers Perrin to conduct a competitive assessment of the Company’s
compensation relative to the energy services marketplace. The analysis was focused on the
exempt non-union workforce with salary levels ranging from $40,000 to approximately
$190,000. The research addressed the competitiveness of base salary and base salary plus
target incentive compensation relative to the marketplace.
In addition to reviewing the competitiveness of National Grid pay, we were also asked to
research the prevalence of incentive compensation in energy services companies for
employees at these levels. Thus, the second section of this outline addresses the prevalence
of incentive compensation in the marketplace.
Towers Perrin’s research was conducted by Richard Meischeid, a Principal of the firm. A
description of Towers Perrin and a biography of Richard Meischeid are contained in
Appendix I and II, respectively.
Approach to Assessing Pay Competitiveness and Determining the Prevalence of Incentive Compensation Market pay information was gathered from Towers Perrin’s 2009 Energy Services Middle
Management and Professional Compensation Database. This survey is the most
comprehensive middle management and professional compensation database for the U.S.
electric and gas industry. Selected descriptive information about the database follows below:
2009
Participating companies 129
193

Exhibit __ (RFM-1) Page 4 of 12
National Grid USA 0
4
Number of incumbents reported 126,140
For this specific analysis, market pay data, including base salary and target annual incentives,
was gathered for a cross-section of over 400 National Grid positions covering over 4,200
incumbents. National Grid compensation was compared with surveyed levels among energy
services companies participating in Towers Perrin’s database with revenues over $6 billion
(40 participants).
The comparison with larger utilities provides a snapshot of Company competitiveness against
companies of similar size. Lists of participating companies included in the 2009 survey
sample are included in Appendix III.
We assessed the overall competitiveness of pay for all National Grid positions combined, but
also arrayed our findings by salary level to illustrate competitiveness at relevant
organizational levels within National Grid. We compared National Grid compensation to
median market levels.
Market data reflects survey participants’ salaries in effect as of March 1, 2009 and incentives
largely reflect 2009 target awards. National Grid data reflect salaries in effect as of July 1,
2009 and incentives reflect target 2009 awards.
Incentive compensation market prevalence information was gathered from Towers Perrin’s
2007, 2008 and 2009 Energy Services Middle Management and Professional Compensation
Databases.
Three years’ data (2007-2009) on bonus practices was gathered to not only capture practices
in 2009, but to also detail trends in bonus practices over the last three years. We have arrayed
annual incentive prevalence information for energy services companies with revenues over
$6 billion. Names of participating companies in the 2007, 2008 and 2009 surveys are
provided in Appendices III, IV and V.
194

Exhibit __ (RFM-1) Page 5 of 12
National Grid USA 0
5
Findings – Competitiveness of Pay The analysis shows that on average National Grid salaries plus 2009 target incentives are
competitive with the sample of energy companies with revenues greater than $6 billion.
Given that National Grid is among the largest energy services companies, we believe the
most appropriate comparison is with companies of similar size (in terms of revenue)
National Grid’s competitiveness, when viewed by salary level, generally follows the trend of
the findings illustrated above.
Salary Salary Plus Target Incentive
$40,000 - 60,000 112% 110%
$60,000 - 80,000 102% 100%
$80,000 - 100,000 99% 98%
$100,000 - 120,000 100% 98%
$120,000 - 140,000 92% 93%
$140,000 - 160,000 89% 84%
>$160,000 90% 86%
Average 100% 98%
Market Salary Bands
National Grid Target Compensationas a Percent of Market
Findings – Prevalence of Incentive Compensation The data in Towers Perrin’s Energy Services surveys clearly demonstrate that incentive plans
are prevalent in U.S. energy services companies and have become a standard component of
the compensation package provided to employees. The results show that the large majority of
the participants have incentive compensation programs and offer incentive pay to their
employees.
195

Exhibit __ (RFM-1) Page 6 of 12
National Grid USA 0
6
# of Incs. % Eligible
% Receiving # of Incs. %
Eligible%
Receiving # of Incs. % Eligible
% Receiving
$40,000 to $45,000 488 87% 85% 712 97% 96% 526 99% 98%$45,000 to $50,000 1,086 94% 92% 1,286 97% 95% 826 100% 99%$50,000 to $55,000 1,747 98% 96% 1,875 98% 93% 1,656 99% 97%$55,000 to $60,000 2,673 98% 95% 2,725 98% 94% 2,338 100% 98%$60,000 to $65,000 3,625 99% 95% 3,696 99% 97% 2,765 100% 99%$65,000 to $70,000 4,427 99% 97% 4,259 99% 97% 4,027 99% 98%$70,000 to $75,000 5,599 99% 97% 5,516 99% 98% 5,352 100% 99%$75,000 to $80,000 6,804 99% 97% 6,863 99% 98% 6,201 100% 99%$80,000 to $85,000 7,786 99% 97% 7,481 99% 98% 7,262 100% 99%$85,000 to $90,000 8,270 99% 98% 8,114 98% 98% 6,948 100% 99%$90,000 to $95,000 7,632 99% 98% 7,382 99% 98% 6,382 100% 99%$95,000 to $100,000 6,824 99% 98% 6,240 99% 99% 5,169 100% 100%$100,000 to $105,000 5,582 99% 98% 5,138 99% 99% 3,924 100% 99%$105,000 to $110,000 4,099 100% 98% 3,883 99% 99% 2,853 100% 100%$110,000 to $115,000 3,276 100% 98% 2,861 99% 99% 1,999 100% 99%$115,000 to $120,000 2,422 99% 98% 2,117 99% 99% 1,513 100% 100%$120,000 to $125,000 1,929 99% 98% 1,633 100% 99% 1,066 100% 100%$125,000 to $130,000 1,390 99% 98% 1,250 99% 99% 736 100% 100%$130,000 to $135,000 1,066 99% 98% 910 99% 99% 557 100% 100%$135,000 to $140,000 817 100% 99% 715 99% 99% 409 100% 100%$140,000 to $145,000 593 99% 98% 547 99% 99% 283 100% 100%$145,000 to $150,000 506 99% 98% 391 99% 99% 205 100% 100%$150,000 to $155,000 350 98% 96% 308 99% 99% 181 100% 99%$155,000 to $160,000 349 98% 98% 283 99% 99% 146 100% 100%$160,000 to $165,000 283 100% 99% 199 98% 98% 100 100% 100%$165,000 to $170,000 210 100% 100% 154 99% 99% 74 100% 100%$170,000 to $175,000 175 98% 95% 107 99% 99% 72 100% 100%$175,000 to $180,000 135 99% 97% 98 97% 96% 49 100% 100%$180,000 to $185,000 105 99% 98% 78 100% 100% 32 100% 100%$185,000 to $190,000 61 98% 98% 40 98% 98% 25 100% 100%
20082009
Base Salary Range
2007
The chart below captures the prevalence of incentive compensation eligibility at different pay
levels among energy services companies with revenues greater than $6 billion. The chart
details the number of incumbents reported by participants, the percentage of these
incumbents eligible at different salary levels as well as the percentage of incumbents actually
receiving awards.
Percentage of Incumbents Eligible For and Receiving Incentive Awards: Similar-Sized Energy Services Participants
196

Exhibit __ (RFM-1) Page 7 of 12
National Grid USA 0
7
Observations Based on the analysis of the market data we conclude that National Grid compensation (both
salaries and target incentive awards) are competitively aligned with market levels at energy
services companies of similar size. The data also shows that incentives are prevalent at the
pay levels we examined and are almost universal. Today, nearly all utilities use annual
incentives as a component of their total cash compensation program.
To attract and retain talented employees in today’s highly competitive market, companies
must offer a competitive total rewards program, including compensation, retirement program,
health and welfare benefits, and learning and development opportunities. Annual incentives
are used widely in the utility industry and have become a standard component of the
compensation package provided to employees. The increased use of incentives reflects a shift
in the overall mix in compensation in the industry to emphasize pay for performance. Thus,
incentive compensation is not “additional” or “optional” compensation that employers
provide to employees, but a required element in the compensation program and a necessary
cost of doing business. Moreover, incentive compensation offers businesses a vehicle to
maintain a portion of compensation in variable form, that is paid only if results are delivered,
rather than increasing fixed costs by delivering all elements of cash compensation in the form
of salary.
197

Exhibit __ (RFM-1) Page 8 of 12
National Grid USA 0
8
APPENDIX I: Description of Towers Perrin
Towers Perrin is a global professional services firm that helps organizations around the world optimize performance through effective people, risk and financial management.
Our Human Capital Group helps organizations forge the critical link between business performance and people performance. Drawing on comprehensive data and informed insights about what drives organization value and what engages people to perform, we help business leaders make appropriate decisions in these key areas: Who: Which people, with what skills, do we need to run the organization effectively and deliver sustained growth? How Much: How much should we invest in our people, and how should we allocate that investment to achieve desired results — a highly engaged workforce focused on the right behaviors and performance — at an appropriate cost? How can we manage our total costs most effectively — including the costs associated with compensation and benefits?
How: How should we manage our people programs to optimize business performance while limiting risk?
DEVELOPING WORKFORCE INSIGHTSEmployee engagement Culture alignmentLeadership alignmentSafety process and cultureOrganization well-beingHuman capital metrics
MANAGING PEOPLEHuman capital strategyTalent managementEmployee engagementCareer managementChange management Leadership developmentOrganization and reward communicationBusiness performance management and linkage analysisTotal Rewards Optimization
MANAGING PAYExecutive compensation strategy and program designDirector compensation and plan designBroad-based reward strategyand program design Performance managementSales compensation Compensation administration
MANAGING BENEFITSRETIREMENT
Benefit strategy and program designRetirement risk and financial managementActuarial servicesGovernance and complianceAsset consulting and forecasting
HEALTH AND WELFAREHealth care strategyActuarial and financial modeling Program governance and measurement Design and pricingCare/disease managementPharmacy consulting and group purchasingAbsence and disability managementDental and life insurance consultingFull insurance brokerage services
BUILDING AN EFFECTIVEHR ORGANIZATION
Global HR function strategyand design Broad-scale HR transformationHR sourcing strategyHR service delivery strategyHR technology strategy and design
Web portal design and developmentEmployee/manager self-service
MANAGING MERGERS,ACQUISITIONS AND OTHERCORPORATE TRANSACTIONS
Target evaluationDue diligenceIntegration planning and implementation
LeadershipCultureWorkforce planStaffing and selectionRewardsTalent managementHR service delivery
Change management and communication
USING DATA FORDECISION SUPPORT
Comp Online™Comp AgilityExecutive Compensation Resources (ECR)™Benefits Online™Benefit plan design and actuarial valuation data (through Employee Benefit Information Center)Discount Data Warehouse of National Health PlansWorkforce analytics
How do we develop a high-performing management team, an aligned organizational structure and engaged employeesto ensure a win/win approach in running a successful organization?Where: Where do we need to deploy people geographically — within a single country or across the globe — to create better results?
We approach all our work from a single perspective: Does it help deliver measurable business results to your organization?
Understanding how workplace programs affect employee behavior, and how to size and allocate workforce invest-ments to achieve desired business results, guides everything we do. Our services are focused on helping organizations manage people costs and risk, enhance employee and organizational performance, deliver HR services more efficiently, and manage small- and large-scale change, particularly in a merger, acquisition or divestiture.
www.towersperrin.com
HUMAN CAPITAL GROUP
198

Exhibit __ (RFM-1) Page 9 of 12
National Grid USA 0
9
APPENDIX II: BIOGRAPHY RICHARD F. MEISCHEID
Richard Meischeid is a Managing Principal with responsibility for directing Towers Perrin’s
compensation consulting practice in the east region. He joined Towers Perrin in 1978 and
was elected a Principal of the firm in 1983.
Richard has over thirty years experience in working with public and private sector Boards
and management on executive compensation issues. He has long-term relationships with
several clients where he serves as the executive compensation consultant to the board and
management including: American Electric Power, AmeriSource Bergen, Equitable
Resources, Exelon, NICOR, NRG, NV Energy, PPL Corporation, Princeton University,
PSEG Enterprises, The Southern Company, Tyco Electronics and UGI Corporation.
Richard has extensive experience preparing and presenting testimony in support of utility rate
case proceedings. He has worked with utility clients on rate cases in the following
jurisdictions: Illinois, Florida, Georgia, Kentucky, Nevada, New Jersey, Minnesota,
Pennsylvania, Wisconsin and Utah.
Before joining Towers Perrin, Richard was associated with The Wharton School of the
University of Pennsylvania, where he served as a graduate teaching assistant. He was a
founding member of The Wharton Entrepreneurial Center.
Richard graduated from St. Francis College in 1970 and earned an M.B.A. from The Wharton
School in 1978.
199

Exhibit __ (RFM-1) Page 10 of 12
National Grid USA 0
10
APPENDIX III: 2009 U.S. CDB Energy Services Middle Management and Professional Database Participant Listing – Companies with Revenues Greater than $6 Billion Company AEI Services Ameren American Electric Power Atmos Energy BG US Services CenterPoint Energy CMS Energy Consolidated Edison Constellation Energy DCP Midstream Dominion Resources DTE Energy Duke Energy Edison International Enbridge Energy Energy Future Holdings Entergy EPCO Exelon FirstEnergy
Company FPL Group Integrys Energy Group Knight McDermott Mitsubishi Nuclear Energy Systems NiSource NOVA Chemicals NRG Energy ONEOK Pacific Gas & Electric Pepco Holdings PPL Progress Energy Public Service Enterprise Group Reliant Energy Sempra Energy Southern Company Services Tennessee Valley Authority Williams Companies Xcel Energy
200

Exhibit __ (RFM-1) Page 11 of 12
National Grid USA 0
11
APPENDIX IV:
2008 U.S. CDB Energy Services Middle Management and Professional Database
Participant Listing – Companies with Revenues Greater than $6 Billion Company Ameren American Electric Power Calpine CenterPoint Energy CMS Energy Consolidated Edison Constellation Energy DCP Midstream Dominion Resources DTE Energy Duke Energy Edison International Enbridge Energy Energy Future Holdings Entergy EPCO Exelon
Company FirstEnergy Fluor FPL Group Integrys Energy Group NiSource NOVA Chemicals ONEOK Pacific Gas & Electric Pepco Holdings PPL Progress Energy Public Service Enterprise Group Reliant Energy Sempra Energy Southern Company Services Williams Companies Xcel Energy
201

Exhibit __ (RFM-1) Page 12 of 12
National Grid USA 0
12
APPENDIX V: 2007 U.S. CDB Energy Services Middle Management and Professional Database Participant Listing – Companies with Revenues Greater than $6 Billion Company Ameren American Electric Power Atmos Energy Calpine CenterPoint Energy CMS Energy Consolidated Edison Constellation Energy Dominion Resources DTE Energy Duke Energy Edison International Enbridge Energy Energy Future Holdings Entergy EPCO Exelon
Company FirstEnergy FPL Group KeySpan Northeast Utilities ONEOK Pacific Gas & Electric Pepco Holdings PPL Progress Energy Public Service Enterprise Group Reliant Energy Sempra Energy Southern Company Services Tennessee Valley Authority Williams Companies Xcel Energ
202

Exhibit __ (RFM
-2)
Testimony of Richard F. Meischeid
Exhibit __ (RFM-2)
National Grid USA, Target Compensation as a Percent of Market Assessment
203

Nat
iona
l Grid
USA
Targ
et C
ompe
nsat
ion
as a
Per
cent
of M
arke
t Ass
essm
ent
2009
Ene
rgy
Serv
ices
Mid
dle
Man
agem
ent D
atab
ase
- Cus
tom
Pee
r Gro
up
Com
pani
es w
ith R
even
ues
Gre
ater
than
$6
Bill
ion
Plus
Sel
ecte
d R
egio
nal E
nerg
y Se
rvic
es C
ompa
nies
Sala
ryTa
rget
Tot
al C
ash
Com
pens
atio
n*Sa
lary
Targ
et T
otal
Cas
h C
ompe
nsat
ion*
Sala
ryTa
rget
Tot
al C
ash
Com
pens
atio
n*
$40,
000
- 60,
000
$60.
0$6
3.3
$53.
5$5
7.7
112%
110%
$60,
000
- 80,
000
$72.
1$7
7.2
$70.
8$7
7.1
102%
100%
$80,
000
- 100
,000
$88.
5$9
6.9
$89.
0$9
8.7
99%
98%
$100
,000
- 12
0,00
0$1
08.9
$122
.6$1
09.0
$125
.110
0%98
%
$120
,000
- 14
0,00
0$1
16.0
$133
.3$1
25.7
$143
.892
%93
%
$140
,000
- 16
0,00
0$1
35.5
$159
.4$1
52.8
$189
.489
%84
%
>$16
0,00
0$1
49.3
$179
.8$1
66.6
$208
.090
%86
%
Ave
rage
$94.
7$1
05.7
$96.
4$1
10.2
100%
98%
Not
e:
Mar
ket S
alar
y B
ands
* Ta
rget
tota
l cas
h co
mpe
nsat
ion
refle
cts
2009
bas
e sa
larie
s pl
us 2
009
targ
et b
onus
es.
Nat
iona
l Grid
Ave
rage
Tar
get
Com
pens
atio
n by
Mar
ket S
alar
y B
and
Mar
ket A
vera
ge T
arge
t Com
pens
atio
nby
Mar
ket S
alar
y B
and
Nat
iona
l Grid
Tar
get C
ompe
nsat
ion
as a
Per
cent
of M
arke
t
Exhi
bit _
_ (R
FM-2
) Pa
ge 1
of 1
Exhibit __ (RFM-2) Page 1 of 1
204

Testim
ony of
David Lister

Before the Public Service Commission
NIAGARA MOHAWK POWER CORPORATION d/b/a NATIONAL GRID
Direct Testimony
of
David Lister
Chief Information Officer
Dated: January 29, 2010
205

Testimony of David Lister
Table of Contents
I. Introduction and Qualifications ...................................................................1
II. Purpose of Testimony ..................................................................................1
III. IS Services ...................................................................................................2
IV. Rate Year IS Projects and Initiatives ...........................................................8
V. Back Office Project....................................................................................12
VI. Conclusion .................................................................................................22
206

Testimony of David Lister
Page 1 of 22
I. Introduction and Qualifications 1
Q. Please state your name and business addresses. 2
A. My name is David Lister. My business address is St Catherine’s Lodge, 3
National Grid Control Centre, Sindlesham, United Kingdom. 4
5
Q. By whom are you employed and in what capacity? 6
A. I am employed by National Grid plc as Chief Information Officer. 7
8
Q. Please briefly describe your educational background. 9
A. I attended Daniel Stewarts College and the University of Edinburgh. 10
11
Q. What is your professional background? 12
A. During the past twenty years I have held Chief Information Officer / 13
Information Technology Director roles with companies operating across a 14
wide range of industries, including Reuters, Glaxo Welcome, Diageo and 15
Royal Bank of Scotland. 16
17
II. Purpose of Testimony 18
Q. What is the purpose of your testimony? 19
A. The purpose of my testimony is to describe the information services (“IS”) 20
strategy of National Grid plc (“National Grid”) and specifically as it 21
207

Testimony of David Lister
Page 2 of 22
relates to Niagara Mohawk Power Corporation d/b/a National Grid (the 1
“Company” or “Niagara Mohawk”). I will also identify major IS projects 2
and discuss the Enterprise Resource Planning project (“ERP” or the “Back 3
Office Project”). 4
5
Q. How is the testimony organized? 6
A. First, I will discuss IS and the services provided. Next, I will discuss how 7
restructuring IS enables National Grid to deliver superior services to 8
Niagara Mohawk and its customers. Finally, I will identify the new 9
systems that IS will deliver, including the Back Office Project. 10
11
III. IS Services 12
Q. Please provide a brief description of IS. 13
A. The IS organization provides services to all National Grid operating 14
companies, including Niagara Mohawk. The IS organization consists of 15
six core functions: (i) service delivery; (ii) solution delivery; (iii) strategy 16
and architecture; (iv) relationship management; (v) finance and human 17
resources and (vi) security and risk. These core functions are intended to 18
capture the breadth of services provided by National Grid IS, including 19
promotion of business innovation; regulatory planning and control 20
reviews; business/IS planning and investment; financial management and 21
208

Testimony of David Lister
Page 3 of 22
reporting; IS project portfolio management; service design and strategy; 1
service management; infrastructure planning and cyber and digital risk 2
management. 3
4
Q. What types of services are provided to Niagara Mohawk by IS? 5
A. National Grid IS provides a full range of IS services to Niagara Mohawk 6
ranging from critical electric transmission, distribution and gas support 7
systems to standard office desktop applications. 8
9
The IS systems underpin the safe, reliable and secure physical and 10
commercial operation of the Niagara Mohawk electric and gas businesses. 11
They are an integral part of the Niagara Mohawk business and require the 12
same levels of resilience as primary network assets. In addition, Asset and 13
Work Management systems enable efficient capital planning, construction, 14
maintenance and repair of network assets. 15
16
Q. Please explain the benefits these services provide to Niagara Mohawk 17
customers. 18
A. The role of National Grid IS is to deliver cost effective solutions and 19
services with transparency, flexibility and scalability. These services are 20
209

Testimony of David Lister
Page 4 of 22
aligned to business objectives, including providing safe, reliable and cost 1
effective service to customers, and are achieved through: 2
• A drive to a low-cost operating model based on best practices and 3
process efficiency; 4
• Common infrastructure and tools that leverage technology to deliver 5
business requirements most effectively and with economy of scale; 6
• Right level of standardization and rationalization; 7
• Development and execution of green IT strategies; 8
• Flexibility in response to demands for change; 9
• Enhanced ability to meet regulatory standards through targeted 10
investment in IS and 11
• Delivering reliable Critical Infrastructure System performance. 12
13
IS also supports Niagara Mohawk’s commitment to enhancing the 14
customer experience. The IS customer strategy is to provide high quality 15
customer service through standardized processes and consolidation of 16
customer systems (including the Customer Service System (“CSS”), 17
Customer Accounting System (“CAS”), Customer Relations Information 18
System (“CRIS”), and Advantage) onto a common platform. 19
20
Q. What effort is IS currently making to improve delivery of services? 21
210

Testimony of David Lister
Page 5 of 22
A. As part of an on-going effort to drive efficiency within the business, 1
National Grid is currently seeking to transform its IS services. This 2
transformation vision includes the restructuring and rationalization of IS to 3
provide more responsive and adaptable services that better meet business 4
needs. The purpose of the transformation effort is to establish a market 5
leading IS delivery model in order to deliver increased value. One 6
element of this transformation is the recently completed strategic 7
application architecture and road map. When implemented, it will provide 8
a common systems platform that exploits economies of scale, and provides 9
standardization that eliminates rework and duplication. This strategy will 10
leverage industry leading integrated software packages that will provide 11
single solutions across National Grid and enable a more efficient and 12
streamlined service delivery organization to support these applications. 13
Transformation will drive the optimization of National Grid’s IS, 14
delivering operating cost and service level benefits. Transformation is 15
intended to improve efficiency and ultimately reduce costs for customers 16
through improved business capabilities. Niagara Mohawk and its 17
customers will ultimately benefit from the consistency, rationalized 18
applications and scale leverage of suppliers and infrastructure. National 19
Grid acknowledges that selected investment will be required in order to 20
unlock these benefits and costs to achieve these additional efficiency 21
211

Testimony of David Lister
Page 6 of 22
initiatives in the Historical Test Year provide the means to achieve 1
productivity savings. In addition, certain transformation initiatives were 2
identified as synergy or efficiency initiatives in the KeySpan merger 3
proceeding and included in the revenue requirement. For example 4
consolidation of the back office systems will result in synergy savings 5
credits to customers, as discussed later in my testimony. The 6
transformation initiatives do not include the projects identified in Schedule 7
4 of Exhibit __ (RRP-2), which are also discussed later in my testimony. 8
9
Q. Does National Grid have a long-term strategy for improving the 10
application services it delivers to Niagara Mohawk? 11
A. Yes. National Grid has a step by step plan to address various business and 12
system limitations and maximize opportunities in priority order over the 13
next several years. This comprehensive strategic roadmap for National 14
Grid’s US operations addresses limitations in business operations that the 15
SAP business suite can address now and in the future. The purpose is to 16
improve business capability at lower costs. The key stages of the strategy 17
roadmap include implementation of the National Grid Back Office Project 18
in late 2011, implementation of the Gas Operations Front Office Project in 19
2011 to 2013 and implementation of the Electric Front Office Project in 20
2013 to 2014. Niagara Mohawk’s Front Office systems such as STORMS 21
212

Testimony of David Lister
Page 7 of 22
and MWORK will be maintained until the Electric Front Office Project is 1
completed. The existing systems will interface with the Back Office 2
Project described later in my testimony to achieve optimal value. 3
4
Q. How does National Grid identify the projects necessary to serve 5
Niagara Mohawk? 6
A. Under National Grid’s IS Governance framework, all IS investment 7
proposals are subject to a formal review, prioritization and sanctioning 8
process. As part of this process a number of economic, asset health and 9
risk factors are considered in the appraisal of investment viability. 10
The asset health appraisal is a process to evaluate the current status of the 11
applications from available health check information with regard to 12
“toleration” of risks arising from factors such as security, age, 13
obsolescence and withdrawal of supplier support. All IS investment 14
proposals are also subject to financial evaluation. The economic case for 15
IS investment depends on the benefits to be delivered in the business. 16
IS Investments are categorized into one of three types: 17
• Asset Health – Investments critical to ensuring reliability at acceptable 18
levels of risk. Such investments can also contain security components. 19
• Mandatory – Either specific to the industry (for example, code 20
compliance) or legal or regulatory compliance requirements. 21
213

Testimony of David Lister
Page 8 of 22
• Investments that deliver sufficient business value to justify the spending. 1
2
The Niagara Mohawk IS investment portfolio contains projects from all 3
the above categories. Investment plans are made for the lifetime 4
management of all application and infrastructure assets. The plans reflect 5
our professional judgment by balancing investment and maintaining risks 6
at an acceptable level for the business and are informed by external best 7
practice. 8
9
IV. Rate Year IS Projects and Initiatives 10
Q. What major projects or new initiatives has the Company included in 11
the Rate Years? 12
A. Information Services is supporting the business with a number of 13
initiatives in the Customer Service and Electric Operations areas that will 14
improve the Niagara Mohawk customer experience, enhance electricity 15
network reliability, and reduce operating costs. Some of these projects 16
address the replacement of aging assets and are essential to maintaining 17
current levels of customer service and electricity network reliability. All 18
IS projects are presented in Exhibit __ (RRP-2), Schedule 4. I will discuss 19
four significant projects including the implementation of a new Back 20
214

Testimony of David Lister
Page 9 of 22
Office Project and identify other major projects and the witnesses that will 1
discuss those projects. 2
3
Q. Please explain the most significant projects in the Customer Service 4
area. 5
A. The most significant projects in the Customer Service area are the 6
Customer Systems Agent Desktop project and the Phase 2 – Interactive 7
Voice Response project. These projects are discussed in detail in the 8
testimony of Company witness Rudolph Wynter. 9
10
Q. Please explain the most significant projects in the Electric Operations 11
area. 12
A. The most significant projects are the Distribution/Outage Management 13
System, the Electric Distribution Legacy Grid Mobile Expansion project, 14
the Radio Console Standardization project and Transformation KPI 15
project. These projects are discussed in detail in the testimony of the 16
Company’s Infrastructure and Operations Panel. 17
18
Q. Is the Company planning any additional major projects? 19
A. Yes. We are planning the Data Center Rationalization Project, the 20
Employee Remote Access Project, the Enterprise Content Management 21
215

Testimony of David Lister
Page 10 of 22
and Data Archive Project and the Back Office Project. The costs 1
associated with these projects are shown in Exhibit__(RRP-2), Schedule 4. 2
3
Q. Please explain the Data Center Rationalization Project. 4
A. National Grid currently has four primary production data centers. These 5
centers are currently located in Syracuse, Albany, Hicksville and Melville. 6
National Grid has additional smaller data centers located throughout its 7
service territories. The objective of the Data Center Rationalization 8
Project (“Data Center Project”) is to consolidate the current data centers 9
into two regional centers to be located at the current Syracuse and 10
Hicksville facilities. The final configuration will consist of one production 11
data center and one disaster recovery/development data center. This 12
multi-year, multi-stage integration project was initiated to standardize 13
operations including hardware and software and to achieve expected 14
synergy savings through the consolidation of facilities. 15
16
Q. Please explain the Employee Remote Access Program. 17
A. The Employee Remote Access Program (“Program”) calls for the 18
provision of a flexible work environment to improve employee 19
productivity, reduce our carbon footprint and reduce operational costs. 20
216
Testimony of David Lister
Page 11 of 22
The objectives of the Program are: 1
• To develop a system and implementation roadmap to enable users 2
to seamlessly access resources like E-Mail, SharePoint, Instant 3
Messaging and Shared Files in order to realize the benefits of 4
improved collaboration; 5
• to upgrade and consolidate the MicroSoft Exchange E-Mail 6
environment; 7
• to design, build and /or enhance collaboration and productivity 8
tools including Instant Messaging and Desktop Video 9
Conferencing; and 10
• to decommission obsolete collaboration applications and 11
infrastructure (for example, Lotus Notes Database). 12
13
Q. Please explain the Enterprise Content Management and Data Archive 14
Project. 15
A. The objective of the Enterprise Management and Data Archiving 16
Project is to implement standardized and comprehensive content 17
management and data archive capability. 18
19
Historically, National Grid has implemented a number of content 20
management solutions to address specific business systems. There is, 21
217

Testimony of David Lister
Page 12 of 22
however, no standardized content management and data archive solution. 1
This project will enable business driven management of data through more 2
efficient mechanisms and procedures for managing, storing, archiving and 3
retrieving data. It will also support legal and regulatory compliance 4
activities. This project will allow optimal use of infrastructure and 5
software licenses as well as reduced operational costs. 6
7
V. Back Office Project 8
Q. What is the Back Office Project? 9
A. We are planning to implement a new Enterprise Resource Planning 10
solution that will make improvements in Supply Chain, Finance and 11
Human Resources functions at National Grid. This Back Office Project 12
represents the first major phase for implementing the strategic application 13
roadmap referenced earlier. 14
15
Q. Is the Company proposing to recover the costs associated with the 16
Back Office Project in the Rate Years? 17
A. The Back Office Project was identified during the KeySpan Merger 18
proceeding as a synergy/efficiency integration initiative. As shown in 19
Exhibit __ (RRP-2), the costs associated with the Back Office Project are 20
offset by the associated synergy savings in the Rate Years ended 21
218

Testimony of David Lister
Page 13 of 22
December 31, 2011, December 31, 2012 and December 31, 2013 1
(collectively, the “Rate Years”). 2
3
Q. When is the Back Office Project expected to be placed in service? 4
A. IS anticipates that the Back Office Project will be placed in service in 5
October 2011. For ratemaking purposes however, the Company has 6
reflected the in service date as January 1, 2012 as shown in Exhibit __ 7
(RRP-2), Schedule 8. The Company is therefore not proposing recovery 8
of any costs associated with the Back Office Project in 2011. The 9
Company is however providing customers with the synergy savings credit 10
associated with the Back Office Project beginning in the Rate Year ending 11
December 31, 2011. 12
13
Q. Following the Commission’s Order on austerity, why is National Grid 14
undertaking this program now? 15
A. This is part of our continual efforts to improve efficiency and service to 16
customers. National Grid reviewed the activities of employees to 17
determine what tools would enable them to better perform their duties. At 18
the same time, National Grid evaluated the ability of some of today’s most 19
widely implemented and thoroughly proven information technologies to 20
determine what would most enhance the service levels and cost 21
219

Testimony of David Lister
Page 14 of 22
effectiveness of our business processes. National Grid believes it would 1
be unwise to postpone this investment that will enable Niagara Mohawk to 2
serve its customers more effectively. 3
4
Q. Please explain the Back Office Project. 5
A. This project is a replacement of the current Finance, Human Resources 6
and Supply Chain systems in the US. It is a critical step in the strategic 7
applications roadmap that is designed to improve US business operations. 8
This investment in back office systems establishes the required foundation 9
for future investments in the US application portfolio to replace and 10
consolidate work management, asset management and potentially 11
customer applications. 12
13
Q. Please describe National Grid’s overall objectives for the Back Office 14
functions. 15
A. National Grid’s objectives for Back Office functions are to: 16
• Improve employee productivity by eliminating the need for most 17
paper-based processes and requests; 18
• Move to a system where data is entered once into the system at the 19
point of data origination and is immediately available to all authorized 20
users throughout the system; 21
220

Testimony of David Lister
Page 15 of 22
• Standardize data to support effective and efficient reporting and 1
eliminate costly manual reconciliation work; 2
• Improve financial processing and management capabilities; 3
• Improve supply chain controls and capabilities, including seamless 4
integration among purchasing, inventory management, warehousing 5
and accounts payable; 6
• Reduce IT infrastructure costs by creating common processes and 7
systems; 8
• Establish the common platform/foundation for additional consolidation 9
of legacy applications that will generate economies of scale; 10
• Enhance human resource and benefits applications to provide more 11
efficient employee self-service; and 12
• Improve the periodic planning and budgeting systems to reduce total 13
cycle times. 14
15
Q. What are the limitations of the current National Grid Back Office 16
systems with respect to Niagara Mohawk? 17
A. Niagara Mohawk’s Back Office processes are supported by the PeopleSoft 18
system. PeopleSoft was acquired by Oracle in January 2005, seven 19
months after Niagara Mohawk’s implementation of PeopleSoft. Oracle’s 20
221
Testimony of David Lister
Page 16 of 22
current strategy is to develop a new set of Enterprise Applications named 1
Fusion that, notwithstanding Oracle’s commitment to support older 2
versions of PeopleSoft, we believe will become the focus for future 3
investment in new functionality. As a consequence, we don’t consider the 4
current PeopleSoft system to be a sound long term systems platform for 5
Niagara Mohawk or a viable base upon which to build a common systems 6
platform. The STORMS Work Management system, which is heavily 7
integrated into PeopleSoft, and which supports our field workforce in 8
managing work orders that address customer requests, has no forward 9
upgrade path and cannot therefore be considered to be a long term 10
strategic solution for Niagara Mohawk. 11
National Grid will maintain STORMS during the initial phases of the 12
Back Office Project; however, it is critical for National Grid to migrate to 13
long-term strategic solutions that will remain viable for supporting service 14
to our customers and business operations in the future. 15
16
There are many Back Office operational issues that exist with PeopleSoft 17
and STORMS that will be improved by migration to a strategic solution. 18
Many of today’s ERP Back Office functions have manual reconciliation 19
processes that add time and cost. National Grid current systems also lack 20
222

Testimony of David Lister
Page 17 of 22
an integrated and consistent view of inventory, which adds time to 1
complete work orders, drives higher inventory levels, and presents 2
complex planning challenges to accurately forecast inventory 3
requirements for purchasing. From a workforce management perspective, 4
our current HR systems are unable to provide capabilities required for us 5
to operate more effectively as discussed later in my testimony. In 6
addition, National Grid’s current financial information system 7
infrastructure does not support the most efficient use of National Grid’s 8
financial analysis tools and results in more time spent in the business 9
planning and monthly reporting process. 10
11
Q. Did IS consider continued utilization of or implementation of 12
upgrades to National Grid’s existing systems? 13
A. Yes, however we believe that the current ERP system does not provide the 14
foundation or functionality necessary to meet the long-term needs of 15
Niagara Mohawk or our other operating companies. Further, the 16
complexity and business risk associated with continued utilization or 17
implementation of upgrades to the existing platform could compromise 18
our ability to achieve the required Back Office benefits. National Grid 19
cannot deliver the expected savings or operate effectively without 20
replacing the Back Office systems as a matter of priority. 21
223

Testimony of David Lister
Page 18 of 22
Q. Please describe the benefits of the Back Office Project. 1
A. This is National Grid’s first major step in establishing strategic, common 2
platforms that will improve operations and customer service. The package 3
solution we plan to implement will drive a greater level of standardization 4
that will significantly improve quality and efficiency across the business 5
functions supported. This solution will also be less complex to maintain. 6
Another primary benefit will be to migrate to systems that are not 7
becoming technically obsolete. Providing an integrated solution will 8
enable elimination of many manual activities that are performed today. 9
An integrated solution will also enable better management of National 10
Grid inventory levels thereby lowering carrying costs and make us more 11
responsive to customer requests by ensuring the right inventory is 12
available at the right time to complete customer work orders in a timely 13
and efficient manner. 14
15
An integrated Back Office system will also enable future improvements in 16
Front Office, customer, and other business functions. These other 17
functions will be integrated with Back Office after the rate plan period 18
proposed in this proceeding; however, they cannot be effectively 19
implemented without the Back Office foundation being in place first. 20
21
224
Testimony of David Lister
Page 19 of 22
Q. How did IS approach the development of the business case for the 1
Back Office Project? 2
A. The business case for the Back Office Project investment centered around 3
understanding the opportunities to improve customer experience and 4
operate more efficiently based on more integrated business processes and 5
corresponding information technology. It was important to consider how 6
well the software solution alternatives supported the desired improvements 7
in business processes. Most of today’s widely implemented packaged 8
applications support process workflows that are considered by many to be 9
“best practice” processes. For National Grid, the processes supported by 10
our choice of technology solutions represent the processes necessary to 11
achieve our goals of improved customer service and reduced capital and 12
operating costs. 13
14
Q. Did National Grid consider any alternatives to the Back Office 15
solution described above? 16
A. Yes. Throughout the analysis and planning phases of the project, various 17
implementation alternatives were considered, including different 18
technology solutions for Back Office. An extensive “fit” analysis was 19
performed to determine how well the alternatives would address National 20
Grid’s requirements. National Grid also compared the Back Office 21
225

Testimony of David Lister
Page 20 of 22
Project to the option of continuing to utilize all, or major portions, of our 1
current systems and process platforms. The primary considerations 2
involved in these analyses were whether the desired cost-of-service and 3
customer service benefits could be achieved at a lower cost and at a lower 4
risk. 5
6
Q. What distinguished SAP from the other options considered? 7
A. SAP was selected as the Back Office Project solution because SAP is 8
known for its ability to provide functionality to an organization the size of 9
National Grid and has a long history of providing reliable service to large 10
enterprises. It has been implemented by many of the world’s leading 11
utilities. SAP is under constant research and development to maintain its 12
position as a leader in the industry. The SAP for Utilities solution 13
portfolio is comprised of an integrated set of solution components that lie 14
within SAP ERP. The ERP solution is comprised of software that will 15
enable National Grid to manage the entire value chain of its operation. A 16
variety of scenarios and processes that are critical to utilities are delivered 17
within SAP. National Grid will implement business applications for the 18
Back Office functions first. This will provide the foundational building 19
blocks for the Front Office and customer solutions that will be 20
implemented later as part of the strategic roadmap. 21
226

Testimony of David Lister
Page 21 of 22
Q. Please explain how the Back Office Project will improve Niagara 1
Mohawk’s Human Resources, Finance and Supply Chain functions. 2
A. The Back Office Project will provide a fully integrated system that will 3
automate transactional processes and make employees accountable for 4
their own time and attendance record-keeping and personal data. This will 5
result in: 6
• Improved HR ability to research, process and report HR-related 7
information; 8
• Increased accuracy and consistency of HR information; 9
• Increased visibility of HR information to employees and management; 10
• Ability of employees to revise their own HR data; 11
• Ability of HR to track employees from application to termination and 12
to fully implement succession planning; and 13
• Reduction in paper forms and creation of standardized processes. 14
15
With respect to Finance functions, the Back Office Project will create 16
synergies with existing and proposed software to reduce the time required 17
to prepare budgets. It will increase business modeling capabilities and the 18
timeliness and consistency of financial reports resulting in streamlined 19
financial processes and improved management reporting. In addition, an 20
integrated Back Office system will also facilitate the eventual 21
227

Testimony of David Lister
Page 22 of 22
consolidation of the National Grid and KeySpan Service Companies as 1
identified in the Niagara Mohawk Management Audit and explained in the 2
testimony of Company witness Andrew F. Sloey. 3
4
With respect to Supply Chain, the Back Office Project will provide real-5
time inventory transactions across the National Grid supply chain, will 6
enable operational inventories to be maintained at optimal levels at all 7
locations, both mobile and permanent, and will establish minimum and 8
maximum reorder points by type of inventory and related carrying costs. 9
Increased material availability will shorten the total repair time for 10
customer repairs required in the field. 11
12
By achieving Back Office objectives, National Grid will be able to better 13
support the overall program goals of enhanced customer service and 14
reduced cost of service. 15
16
VI. Conclusion 17
Q. Does that conclude your testimony? 18
A. Yes it does. 19
228


