
ii
ABSTRACT
Hericium erinaceus (Bull. Fr.) Pers. is a well-known culinary-medicinal mushroom that
is used in traditional Chinese and Japanese cooking and herbal medicine to treat various
human diseases. The objectives of the present investigation was to evaluate the
gastroprotection and healing effects by aqueous extracts of the basidiocarps H.
erinaceus against ethanol-induced gastric ulcers in rats. In acute toxicity study, all
animals did not show any abnormal behavioural expressions and toxicological signs.
Seven groups of rats were pre-treated orally with distilled water as the normal group;
distilled water as ulcer group; 20 mg/kg of omeprazole as positive group; 50, 100, 200,
and 400 mg/kg of extract as the experimental groups. One hour later, distilled water was
given orally to the rats in normal group while ethanol was given orally to the ulcer
control, positive control, and the experimental groups. The rats were sacrificed after an
hour. Ulcer area, gastric wall mucus, gastric mucus barrier test, and histology and
immunohistochemistry of the gastric wall were assessed. Gastric homogenates were
analysed for Lipid peroxidation (LPO), superoxide dismutase (SOD), and catalase
(CAT) content. The ulcer group exhibited significantly (p < 0.05) severe mucosal injury
when compared to rats treated with omeprazole or extracts which showed significant (p
< 0.05) protection against gastric mucosal injury. The mushroom extracts promoted
protection as there was significant (p < 0.05) reduction of gross ulcer area. Further, the
histological analysis showed marked reduction of edema and leucocytes infiltration in
the submucosal layer when compared to the ulcer group. Immunohistochemistry studies
showed up-regulation of HSP70 protein and down-regulation of Bax protein in rats pre-
treated with extract. Significant (p < 0.05) increase in the mucus of gastric content and
high levels SOD and CAT, reduced amount of LPO was observed in rats treated with
mushroom extracts indicating the protective and / or healing effects of the mushroom
iii
extracts. During the three days ulcer treatment test, H. erinaceus extract at a dose of
400mg/kg could significantly (p < 0.05) heal the ulcer that was induced by ethanol in
the rats.
iv
ABSTRAK
Hericium erinaceus (Bull. Fr.) Pers. merupakan cendawan yang boleh di makan dan
amnya digunakan dalam perubatan tradisional cina dan jepun untuk mengubati
pelbagai penyakit. Objektif kajian ini adalah untuk mengkaji kesan gastroproteksi dan
pemulihan ekstrak akues terhadap ulser gastrik berpunca dari etanol. Dalam kajian acute
ketoksikan, semua haiwan tidak menunjukkan tingkah laku yang luar biasa dan tanda-
tanda keracunan.Tujuh kumpulan tikus diberi minum air suling sebagai kumpulan
normal; air suling sebagai kumpulan ulser; 20mg/kg omeprazole sebagai kumpulan
positif; dan 50, 100, 200 dan 400 mg/kg ekstrak sebagai kumpulan eksperimen. Satu
jam kemudian, air suling diberi minum kepada tikus dalam kumpulan normal sementara
etanol diberi minum kepada kumpulan kawalan ulser, kumpulan kawalan positif, dan
kumpulan-kumpulan eksperimen. Tikus-tikus tersebut dikorbankan sejam kemudian.
Kawasan ulser, mukus dinding gastrik, ujian pemisah mukus gastrik, dan histologi dan
immunokimia dinding gastrik diperiksa. Homogenat gastrik dikesan untuk kandungan
lipid peroxidasi (LPO), superoxide dismutase (SOD), dan catalase (CAT). Tikus- tikus
dibawah kumpulan yang dijangkiti ulser menunjukan perubahan ketara (p < 0.05) dalam
kecederaan mukosa yang parah berbanding dengan tikus-tikus yang dirawati dengan
omeprazole atau kumpulan ekstrak yang menunjukkan sifat perlindungan terhadap
kecederaan mukosa gastrik yang ketara (p < 0.05). Cendawan ini menunjukan kesan
protektif terhadap ulser kerana ia menunjukkan pengurangan ketara kawasan ulser dan
histologi menunjukkan pengurangan edema dan penyusupan leukosit lapisan
submucosal berbanding dengan kumpulan ulcer. Immunohistokimia menunjukkan up-
regulation protein HSP70 and down-regulation protein Bax dalam tikus-tikus yang telah
dirawati dengan ekstrak. Peningkatan ketara (p < 0.05) dalam mukus kandungan gastrik
dan paras tinggi SOD dan CAT, serta pengurangan jumlah LPO diperhatikan pada tikus

v
yang dirawat dengan ekstrak cendawan ini. Kajian terhadap ulser telah dijalankan
selama tiga hari dan ekstrak H. erinaceus (400mg/kg) menunjukkan kebolehan untuk
menyembuhkan ulser dalam kumpulan tikus yang telah diberikan etanol.
vi
ACKNOWLEDGEMENTS
I would like to express my sincere appreciation to my both supervisors,
Professor Dr. Vikineswary Sabaratnam, and Professor Dr. Mahmood Ameen Abdulla
for their invaluable guidance, assistance, and encouragement to help me finish this
project.
My special thanks go to Mr. Pouya Davish Hussain for his invaluable advices,
supports and endless help throughout this study. Without his help, it is impossible to
finish my project.
Further thanks to all staff, research assistants and postgraduate students at the
Laboratory of Mycology and Plant Pathology, Laboratory of Immunology, Laboratory
of Animal Science Centre and Fungal Biotechnology Laboratory. I also would like to
take this chance to thank Tan Wee Cheat, Wong Wei Lun, Wong Kah Hui, Ms.
Marjiana Ismail and Madam Chang May Hing for giving me good advice and the the
technical aspects of this study.
In addition, I would like to thank and dedicate this project to my family
members who have supported and shared the happiness or sadness along the way.
Finally, without mentioning their name, I would like to express my gratitude for
all those who generously provide support until I completed my thesis.

vii
LIST OF CONTENTS
Page
ABSTRACT ii
ABSTRAK iv
ACKNOWLEDGEMENTS vi
LIST OF CONTENTS vii
LIST OF FIGURES xi
LIST OF TABLES xiii
LIST OF PLATES xiv
LIST OF SYMBOLS AND ABBREVATIONS xv
CHAPTER ONE INTRODUCTION 1
CHAPTER TWO LITERATURE REVIEW 5
2.1 Gastric ulcers 5
2.1.1 Anatomy of human stomach 5
2.1.2 Rat stomachs 6
2.2 Peptic ulcer and gastric ulcer diseases 6
2.3 Factors that cause peptic ulcers 7
2.3.1 Aggresive factors 7
2.3.1.1 Helicobacter pylori (H. pylori) 7
2.3.1.2 Nonsteroidal anti-inflammatory 8
drugs (NSAID)
2.3.1.3 Stress 9
2.3.1.4 Smoking 10
2.3.2 Defensive factors 10
2.3.2.1 Mucosal defense 10
2.3.2.2 The Epithelium 11
2.3.2.3 Mucosal blood flow 12
2.3.2.4 Ulcer healing 13

viii
2.4 Medical treatment of gastric ulcer 16
disease
2.4.1 Omeprazole 16
2.4.2 Characteristics of Omeprazole 17
2.4.3 Limitations of Omeprazole 17
2.5 Mushrooms 18
2.5.1 Introduction to mushrooms 18
2.5.2 Hericium erinaceus 19
2.5.3 Medicinal properties of 21
H. erinaceus
2.5.4 Nutritional composition of 22
H. erinaceus
2.6 Free radicals 22
2.6.1 Introduction to free radicals 22
2.6.2 Reactive oxygen species 22
2.6.3 Antioxidants 23
2.6.4 Antioxidant compounds 24
2.6.5 Antioxidant Enzymes 24
2.6.6 Lipid peroxidation activity 25
2.7 Heat shock proteins 26
2.7.1 Heat shock proteins and the stomach 27
2.7.2 Heat shock proteins and protection 28
against oxidative stress
2.8 Bax protein 29
CHAPTER THREE MATERIALS AND METHODS 31
3.1 Mushroom and preparation of 31
mushroom extracts
3.2 The toxic effects, if any, of extracts 31
freeze-dried fruit bodies of H. erinaceus
to rats
3.2.1 Animals 31
3.2.2 Acute toxicity studies 32
3.3 The gastroprotective effects of H. erinaceus 33

ix
extract in rats
3.4 The ulcer healing effects of H. erinaceus 35
extract in rats
3.5 Gross gastric lesions evaluation 36
3.6 Measurement of mucus production 37
3.7 Gastric wall mucus determination 37
3.8 Histological evaluation of gastric lesions 38
3.9 Immunohistochemistry 38
3.10 Estimation of free radical generation 39
3.10.1 Lipid peroxidase (LPO) 39
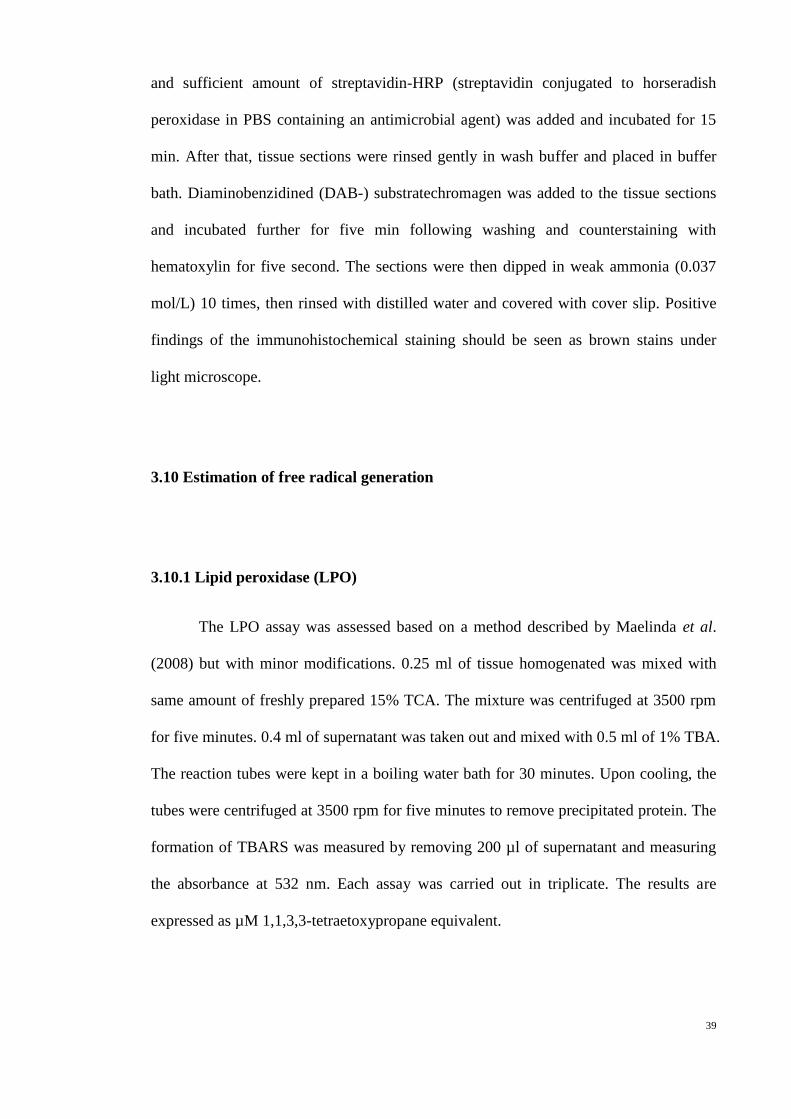
3.10.2 Superoxide dismutase (SOD) activity 40
3.10.3 Catalase (CAT) activity 40
3.11 Statistical analysis 41
CHAPTER FOUR RESULTS AND DISCUSSION 42
4.1 Acute oral toxicity studies on aqueous 42
extracts of H. erinaceus
4.1.1 Body weight of experimental rats 42
4.1.2 Histopathological examination of livers 44
and kidneys of rats
4.1.3 Hematological and clinical biochemistry 45
4.2 Gastroprotective effects of H. erinaceus 56
extract in vivo
4.2.1 Effect of H. erinaceus on gross ethanol- 56
induced gastric lesions in rats
4.2.2 Effect of H. erinaceus on ulcer area and 58
ulcer inhibition in gastric glandular tissue
of rats
4.2.3 Effect of H. erinaceus on mucus production 61
in gastric glandular tissue of rats
4.2.4 Effect of H. erinaceus in gastric barrier 63
mucus production in gastric glandular
tissue of rats with ethanol-induced ulcer
4.2.5 Histological evaluation of gastric lesions 65

x
in stomachs of control and treated rats
4.2.6 Immunohistochemistry analysis in the 67
stomach of rats in ethanol-induced ulcer
4.2.7 Effect of H. erinaceus in LPO, SOD and 70
CAT enzymes in gastric glandular tissue
of rats with ethanol-induced ulcer
4.3 Ulcer healing activity of H. erinaceus 75
extracts in rats with ethanol - induced ulcers
4.3.1 Healing effect of H. erinaceus in 75
gross gastric lesions evaluation
4.3.2 Healing effect of H. erinaceus in the 77
ulcer area in gastric glandular tissue
4.3.3 Effect of H. erinaceus on mucus production 78
in glandular tissue
4.3.4 Effect of H. erinaceus on gastric barrier 80
mucus production in gastric
glandular tissue of rats with
ethanol-induced ulcer
4.3.5 Histological evaluation of gastric lesions 81
in stomachs of control and treated rats
CHAPTER FIVE RECOMMENDATIONS FOR 86
FURTHER STUDIES AND
CONCLUSIONS
REFERENCES 88
APPENDIX A 112
APPENDIX B 126
APPENDIX C 153

xi
LIST OF FIGURES
Figure Description Page
2.1 The pathogenesis of NSAID-induced gastric injury 9
and bleeding.
2.2 The basic processes of intestinal epithelial wound 14
healing.
2.3 Chemical structure of omeprazole. 17
2.4 Basidiocarp of Hericium erinaceus 20
3.1 Flow diagram of the acute toxicity studies. 33
3.2 Flow diagram of the gastricprotective studies. 34
3.3 Flow chart for ulcer treatment tests. 36
3.4 Superoxide dismutase (SOD) assay (SOD assay kit, 40
Cayman Chemical Company).
3.5 Catalase Assay (Catalase assay kit, Cayman 41
Chemical Company).
4.1 The effects of the aqueous extract of H. erinaceus on 43
weight in the control and treated male rats during 14
days in the acute toxicity study.
4.2 The effects of the aqueous extract of H. erinaceus on 43
weight in the control and treated female rats
during 14 days in the acute toxicity study.
4.3 Effect of H. erinaceus extract on ulcer area in 59
ethanol induced ulcers in rats.
4.4 Inhibitory (%) effect of H. erinaceus extract on ethanol- 60
induced ulcer in rats.
xii
4.5 Effect of H. erinaceus extract on mucus production 62
in rats with ethanol induced ulcers.
4.6 Effect of H. erinaceus extract on gastric barrier mucus 64
in rats with ethanol induced ulcers.
4.7 Effect of H. erinaceus extract on LPO production 71
(µM TEP equivalent) in ethanol induced ulcer of rats.
4.8 Effect of H. erinaceus extract on SOD production 72
(U/mg of protein) in ethanol induced ulcer of rats.
4.9 Effect of H. erinaceus extract on CAT production 73
(U/mg protein) in ethanol induced ulcer of rats.
4.10 Effect of H. erinaceus extract on ulcer area in ethanol 78
induced rats after three days treatment.
4.11 Effect of H. erinaceus extract on mucus production 79
in ethanol induced rats after three days treatment.
4.12 Effect of H. erinaceus extract on gastric barrier mucus 81
in ethanol induced rats after three days treatment.
xiii
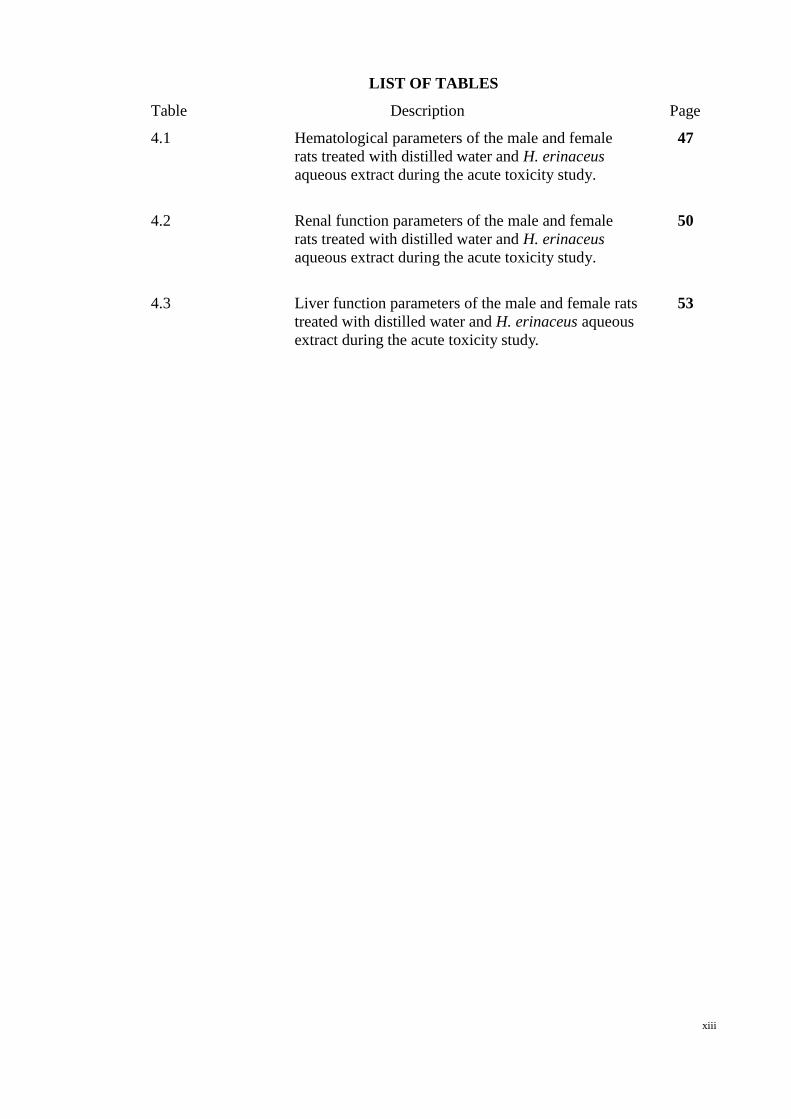
LIST OF TABLES
Table Description Page
4.1 Hematological parameters of the male and female 47
rats treated with distilled water and H. erinaceus
aqueous extract during the acute toxicity study.
4.2 Renal function parameters of the male and female 50
rats treated with distilled water and H. erinaceus
aqueous extract during the acute toxicity study.
4.3 Liver function parameters of the male and female rats 53
treated with distilled water and H. erinaceus aqueous
extract during the acute toxicity study.

xiv
LIST OF PLATES
Plate Description Page
4.1 Histological sections of liver in acute toxicity test. 44
4.2 Histological sections of kidney in acute toxicity test. 45
4.3 Gross appearance of the gastric mucosa in rats with 57
ethanol-induced ulcers.
4.4 Histological study of ethanol-induced gastric mucosal 66
damage in rats.
4.5 Immunohistochemical analysis of expression of HSP 68
and Bax proteins in the stomach of rats in ethanol-induced
gastric ulcer.
4.6 Gross appearance of the gastric mucosa in rats. 76
4.7 Histological study of ethanol-induced gastric mucosal 83
damage in rats.
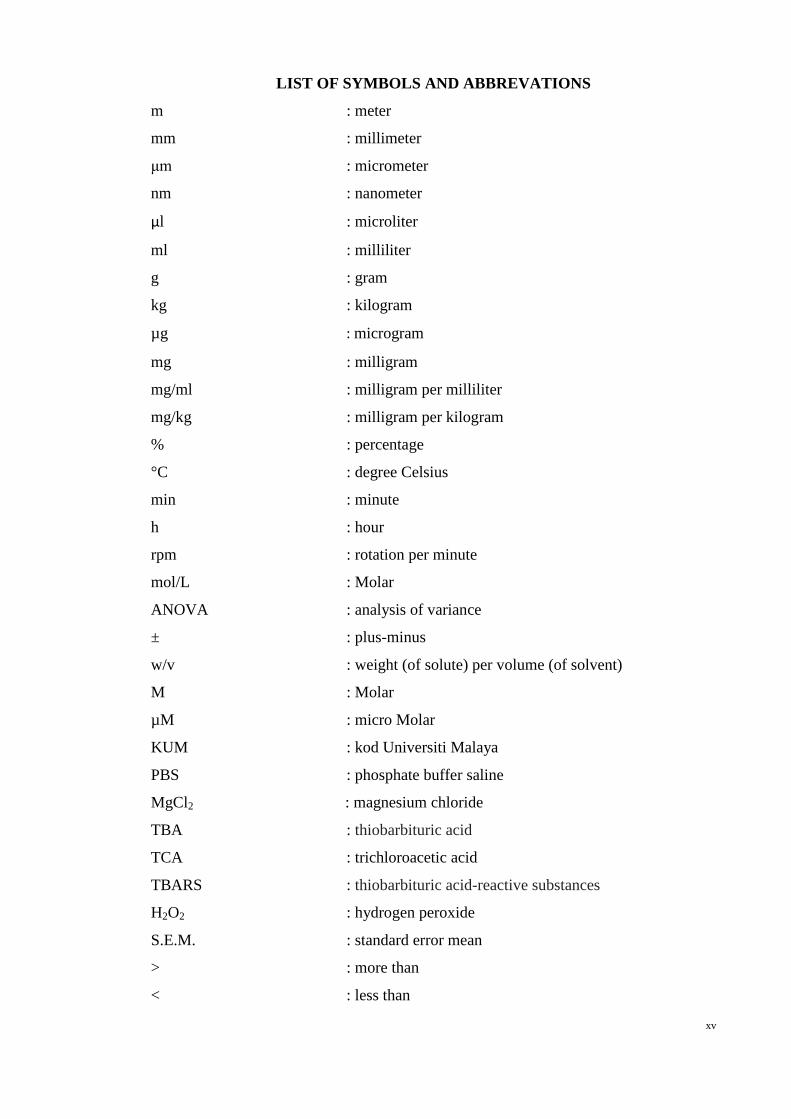
xv
LIST OF SYMBOLS AND ABBREVATIONS
m : meter
mm : millimeter
μm : micrometer
nm : nanometer
µl : microliter
ml : milliliter
g : gram
kg : kilogram
µg : microgram
mg : milligram
mg/ml : milligram per milliliter
mg/kg : milligram per kilogram
% : percentage
°C : degree Celsius
min : minute
h : hour
rpm : rotation per minute
mol/L : Molar
ANOVA : analysis of variance
± : plus-minus
w/v : weight (of solute) per volume (of solvent)
M : Molar
µM : micro Molar
KUM : kod Universiti Malaya
PBS : phosphate buffer saline
MgCl2 : magnesium chloride
TBA : thiobarbituric acid
TCA : trichloroacetic acid
TBARS : thiobarbituric acid-reactive substances
H2O2 : hydrogen peroxide
S.E.M. : standard error mean
> : more than
< : less than

1
1.0 Introduction
Peptic ulcers, including both gastric and duodenal ulcers, have been a major
threat to the world’s population over the past two centuries. In 2007, roughly 14.5
million people in the United States suffered from peptic ulcers, and this number had
increased further to 14.99 million by year 2010. (Pleis et al., 2009; and Schiller et al.,
2012). The two most common types of peptic ulcers are named after the location where
the ulcer is found. Gastric ulcers are located in the stomach, whereas duodenal ulcers
are found at the beginning of the small intestine or duodenum.
The predominant symptom of uncomplicated peptic ulcer is epigastric pain,
which presents itself with other symptoms such as fullness, bloating, early satiety, and
nausea. Generally, patients with duodenal ulcers suffer epigastric pain during the fasting
state or even during the night, and this is usually relieved by food intake or acid-
neutralising agents (Malfertheiner et al., 2009). Gastric ulcers are a serious
gastrointestinal (GI) disorder, and occur when the gastric mucosa is impaired, leading to
perforations of the stomach lining and then bleeding.
Generally, peptic ulcers result from an imbalance between increased aggressive
factors in the body, such as acid and pepsin secretions (Wolfe & Sachs, 2002), and
decreased defensive factors, such as mucus and bicarbonate secretions (Allen &
Flemstrom, 2005), mucosal barriers (Peskar, 2001), mucosal blood flow (Abdel-Salam
et al., 2001) and endogenous prostaglandin production (Peleg & Wicox, 2002). Some
other factors which induce peptic ulcers include Helicobacter pylori infections (Peura,
1997), the ingestion of non-steroidal anti-inflammatory drugs (NSAID) (Pawlik et al.,
2000), and psychological stress (Brogie, 1962). The production of free radicals,
inhibition of cell proliferation, and infiltration of inflammatory cells are also factors
involved in the pathogenesis of ulcers (Maity & Chattopadhyay, 2008). Many

2
ulcerogens produce excessive reactive oxygen species (ROS), which cause imbalances
between aggressive and protective factors such as levels of cytokines, prostaglandins
(PGs) and enzymes (COXs, NOS etc.), pro- and anti-angiogenic as well as tissue
growth parameters.
The objectives of treatment for peptic ulcers are relief from pain, enhancement
of healing and prevention of recurrence. Treatment for stomach and duodenal ulcers is
decided by the doctor on the basis of a patient’s age; overall health; medical history;
extent of the pathogenesis; tolerance for medications, procedures or therapies; and
expectations or preferences. Therapeutic strategies generally aim to restore balance
between aggressive and defensive factors. In the past, the major therapies mainly aimed
to reduce the secretion of gastric acids, which were considered as the main cause of
ulcer formation. Nowadays, treatment strategy has changed to focusing on potentiating
the mucosal defences along with reducting acid secretions (Wallace, 2005).
Anti-secretory agents as H2-receptor antagonists and proton pump inhibitors and
mucosal protective agents as sucralfate and prostaglandin analogs are very important
drugs for the treatment of peptic ulcers. At the same time, each of these drugs can cause
simpler to serious side effects like gynaecomastia that occurs with cimetidine (H2-
receptor antagonist) (Brogden et al., 1978) and enterochromaffin-like cell (ECL)
hyperplasia that occurs in omeprazole (proton pump inhibitor) treatments (Ekman et al.,
1985). Hence the interest of researchers in finding better and safer alternatives for the
treatment of peptic ulcers and specifically in the gastroprotective effects of medicinal
plants which may have fewer side effects.
Nowadays, natural products have not only gained a strong foothold in the
pharmaceutical industry but have also inspired the search for new potential sources of
bioactive molecules (Schmeda-Hirschmann & Yesilada, 2005). Herbs, medicinal plants,

3
spices, vegetables, and crude drug substances are considered potential resources in the
fight against various diseases, including gastric ulcers. Some medicinal plants such as
ginger (Yamahara et al., 1988), turmeric (Rafatullach et al., 1990) and aloe (Suvitayavat
et al., 1997) are reported to have gastroprotective effects. Abdulla et al. (2008) reported
that Hericium erinaceus, one of the well-known medicinal mushrooms, produced
gastroprotective activity in rats.
Medicinal mushrooms have a history of applications in traditional oriental
therapies. Mushroom-derived preparations continue to be used in modern clinical
practice in countries such as Japan, China and Korea. Medicinal effects have been
proved for many traditionally used mushrooms (Ooi & Liu, 2000), including extracts
from species belonging to the genera Auricularia, Flammulina, Ganoderma, Grifola,
Hericium, Lentinula, Pleurotus, Trametes (Coriolus), Schizophyllum, and Tremella
(Wasser, 2002). Over the past twenty to thirty years, scientific and medical studies in
Japan, China, Korea, and more recently in the United States, India and Malaysia, have
increasingly demonstrated the potent and unique properties of mushroom-extracted
compounds for the prevention and treatment of cancer.
Hericium erinaceus, a spine fungus which grows on the trunks, branches and
stumps of trees, can be found throughout the northern hemisphere, and range from rare
in central Europe to fairly common in southern England (Pegler, 2003). This mushroom
not only tastes extremely good, but also several medicinal properties have been
attributed to it. Previous studies have reported anti-tumor activities (Mizuno et al.,
1995), antioxidant properties (Wong et al., 2007), antimicrobial effects (Wong et al.,
2009a), the stimulation of neurite outgrowth in the cell line NG 108-15 (Wong et al.,
2009b) and nerve regeneration (Wong et al., 2011).
4
Hericium erinaceus is a temperate mushroom that has been domesticated and is
commercially grown in Malaysia. The extracts of this mushroom have both neurite-
outgrowth stimulating effects (Wong et al., 2009b) and preliminary study had shown
that gastric ulcer prevention effects of this mushroom (Abdulla et al., 2008). In the
current study, extracts of tropical grown H. erinaceus were investigated to establish
whether and how these have gastric ulcer prevention and healing effects.
The objectives of this study were to:
a) investigate the gastroprotective and ulcer healing properties of H. erinaceus.
b) measure the lipid peroxidation and antioxidant enzymes in gastric ulcers in a
rat’s stomach, induced by ethanol.
c) evaluate the effects of ethanol and H. erinaceus extract on HSP70 and Bax
proteins in immunohistochemical staining.

5
2.0 Literature review
2.1 Gastric Ulcers
2.1.1 Anatomy of human stomach
The stomach is the most dilated part of the digestive tube, having a capacity of
1000–1500 ml in adults. It is located between the end of the oesophagus and the
duodenum – the beginning of the small intestine. It lies in the epigastric, umbilical, and
left hypochondrial regions of the abdomen, and occupies a recess bounded by the upper
abdominal viscera, the anterior abdominal wall and the diaphragm. It has two openings
and is described as having two borders, although in reality the external surface is
continuous. The relationship of the stomach to the surrounding viscera is altered by the
amount of the stomach contents, the stage that the digestive process has reached, the
degree of development of the gastric musculature, and the condition of the adjacent
intestines. However, borders are assigned by the attachment of the peritoneum via the
greater and lesser omentum, thus dividing the stomach into an anterior and posterior
surface (Daniels & Allum, 2005).
The main function of the stomach is to mix food with acid, mucus and pepsin
and then release the resulting chyme, at a controlled rate, into the duodenum for the
process of absorption. Gastric motility is controlled by both neural and hormonal signals.
Nervous control originates from the enteric nervous system as well as the
parasympathetic (predominantly vagus nerve) and sympathetic systems. A number of
hormones have been shown to influence gastric motility: gastrin and cholecystokinin,
for example, act to relax the proximal stomach and enhance contractions in the distal
stomach. Other functions of the stomach include the secretion of intrinsic factors
necessary for the absorption of vitamin B12 (Daniels & Allum, 2005).

6
The stomach wall is made of four layers: mucosa, submucosa, muscularis
externa and serosa. The mucosa is the innermost layer, and is divided into a surface
epithelium, a loose connective tissue called lamina propria, and a thin smooth muscle
called muscularis interna or muscularis mucosae. The submucosa is the loose
connective tissue, containing blood vessels and nerve endings. The muscularis externa
is the muscular layer, consisting of an inner oblique muscle, a middle circular muscle
and an outer longitudinal muscle. Finally, the serosa is the outermost layer (Marieb,
1998).
2.1.2 Rat stomachs
The rat’s stomach comprises two regions: the non-glandular (forestomach) and
glandular parts. The non-glandular stomach is lined by cornified squamous epithelium.
The glandular stomach consists of the corpus, antrum and pyrolus, and is lined by a
simple columnar epithelium. The non-glandular part is distinguished from the glandular
part of the stomach by the limiting ridge, which prevents a reflux of gastric juice from
the glandular part into the non-glandular part when the stomach is empty. The anatomy
and physiology of a rat’s stomach is not much different from the human stomach. There
has been a considerable volume of research using the rat’s stomach as tools to
investigate the gastric function, so the results from rat models provide the basic
information on humans as well (Sbarbati et al., 1995).
2.2 Peptic ulcer and gastric ulcer diseases
There are various kinds of ulcers, named after their respective locations in the
digestive tract. Duodenal or peptic ulcers can be found in the intestines, while gastric
ulcers are located inside the stomach. A gastric ulcer is considered as a necrotic lesion

7
penetrating through the entire mucosal thickness of the stomach. Peptic and duodenal
ulcers are usually benign; however, gastric ulcers are more prone to becoming
malignant. In this study, we focus on gastric ulcers induced by ethanol.
2.3 Factors that cause peptic ulcers
Peptic ulcers form because of an imbalance between increased aggresive factors,
which breakdown the ability of the gastrointestinal mucosa to protect itself, and a
decrease in the defensive factors which maintain mucosal integrity through endogenous
defense mechanisms. These aggressive and defensive factors and their roles in peptic
ulcers are described below:
2.3.1 Aggresive factors
2.3.1.1 Helicobacter pylori (H. pylori)
Helicobacter pylori is a spiral-shaped, pH-sensitive, gram-negative,
microaerophilic bacterium that arises between the mucous layer and surface epithelial
cells in the stomach. The ability of H. pylori to produce urease may be related to its
pathogenic potential and survival in the stomach. Urease is an enzyme which can break
down urea into carbon dioxide and ammonia. The ammonia is converted into
ammonium by taking away a proton (H+), leaving only hydroxyl ions. The hydroxyl
ions then react with carbon dioxide, producing carbonate, which neutralizes gastric acid.
Urease activity is low at neutral pH but can increase 10- to 20-fold as the external pH
falls to between 6.5 and 5.5, and remains high at pH 2.5 (Scott et al., 1998).
Helicobacter pylori also carry another protein – urel, which is a urea transporter that
brings urea into the cytoplasm of the bacteria for urease to digest. Helicobacter pylori

8
cause gastric mucosal injury by direct effects, by changes in immune/inflammatory
responses and by hypergastrinemia leading to increased acid secretions. Helicobacter
pylori infections change inflammatory responses and damage epithelial cells directly by
cell-mediated immune mechanisms or indirectly by activated neutrophils or
macrophages attempting to phagocytose bacteria or bacterial products (Peura, 1997).
2.3.1.2 Nonsteroidal anti-inflammatory drugs (NSAID)
NSAIDs cause clinically significant ulceration, bleeding, or obstruction in 1–4%
of patients chronically taking these drugs (Silverstein et al., 2000). NSAIDs inhibit
cyclooxygenase (COX), the enzyme responsible for the conversion of arachidonic acid
to prostaglandins (Vane, 1971). There are two isoforms of COX: COX-1 and COX-2
(Crofford et al., 2000). COX-1 is a ubiquitous constitutive isozyme producing
prostaglandins responsible for maintaining gastrointestinal mucosal integrity, vascular
homeostasis and renal functions (Crofford et al., 2000). COX-2 is a largely cytokine-
induced iso-zyme producing prostaglandins that are associated with pain and
inflammation (Crofford et al., 2000). NSAIDs inhibit both COX-1 and COX-2 to
varying degrees (Gierse et al., 1995; and Gierse et al., 1999). Gastric injuries induced
by NSAIDs are shown in Figure 2.1.

9
Figure 2.1: The pathogenesis of NSAID-induced gastric injury and bleeding. NSAIDs induce
injury/bleeding via three key pathways: inhibition of cyclooxygenase (COX)-1 activity, inhibition of
COX-2 activity, and direct cytotoxic effects on the epithelium. Effects produced via only one of these
pathways (e.g. the selective inhibition of COX-1 and COX-2) are unlikely to produce significant damage
(retrieved from Wallace, 2008).
Gana et al. (1987) reported that NSAIDs have the ability to reduce blood flow
on the gastric mucosa. A reduction of gastric blood flow is usually not sufficient to
result in significant mucosal injury. However, reduced mucosal blood flow can lead to
the mucosa becoming more vulnerable to damage induced by luminal irritants, and
damage the epithelial restitution process (Wallace & McKnight, 1990).
2.3.1.3 Stress
Psychological and physical stresses have both been shown to precipitate
mucosal injury in animal models of peptic ulcer disease (Weiner, 1991). Stress ulcers
are frequently seen in intensive care settings after surgery for various acute and severe
diseases. The resulting pathophysiology interferes with blood flow and sporadic acid

10
secretions, and disrupts mucosal defences. Incubation, which is a common procedure
during major surgery (especially cardiac, neural, or renal transplants), and major trauma,
such as bum or spinal cord injury, increase the chances of patients getting peptic ulcer
disease (Soll, 1989).
2.3.1.4 Smoking
Previous studies (Hull & Beale, 1985) have proved that cigarette smoking is an
important risk factor which can cause peptic ulceration and delayed ulcer healing.
However, the mechanism through which ulceration develops due to cigarette smoking
still remains unclear.
2.3.2 Defensive factors
2.3.2.1 Mucosal defense
The term “mucosal defense” describes the various factors and components that
permit the mucosa to remain intact despite frequent exposure to substances with a wide
range of temperatures, pHs, and osmolarity, as well as to substances with detergent or
cytotoxic actions, and bacterial products capable of causing local and systemic
inflammatory reactions (Wallace & Granger, 1996). The gastric mucosa is not
impermeable to damage by these agents, and mucosal injuries do occur reasonably
regularly. However, the ability of the mucosa to repair itself rapidly can limit these to
the most superficial layer of cells and prevent entry into the systemic circulation of
substances detrimental to the organism. In a healthy organism, the resistance of the
gastric mucosa to injury is increased when the stomach is irritated by certain factors, for

11
instance through an increment of mucosal blood flow and an efflux of mucus from
surface epithelial cells.
2.3.2.2 The Epithelium
The epithelium is often described as the physical barrier of stomach. There are
various components of mucosal defense on the luminal side of the epithelium, including
gastric juice and mucus. Gastric juice has a number of constituents capable of
decreasing bacterial colonization of the stomach, including acid, immunoglobulins, and
lactoferrin. Giannella et al. (1973) demonstrated that acid is an important defensive
factor, and that hypochlorhydria and achlorhydria can therefore increase the risks and
exacerbate the severity of bacterial and certain parasitic infections.
The mucus that is secreted onto the surface of the stomach plays a number of
roles: as a lubricant, to reduce physical damage to the epithelium by ingested materials,
and as a trap for bacteria (Forstner, 1978; and Belley et al., 1999). Thus mucus can
decrease the ability of bacteria to enter into the epithelium. Mucus creates an unstirred
layer on the mucosal surface, which helps to maintain a near-neutral pH at that surface
as well as acting as a physical barrier against luminal pepsin (Allen & Flemström, 2005).
Schreiber and Scheid (1997) suggested that mucus retard the diffusion of protons, which
can further help in maintaining a favourable pH at the apical surface of the epithelium.
Hills et al. (1983) reported that the surface of the stomach is hydrophobic, and
therefore a barrier to acid back-diffusion, because of the presence of a surfactant-like
layer of surface-active phospholipids. This layer is located either on the surface of the
epithelium itself, or on the most luminal surface of mucus overlying the epithelium
(Goddard et al., 1990). Aspirin or bile salts cause disruption in this layer, resulting in an
12
elevated diffusion of acid into the mucosa, and to mucosal necrosis (Goddard et al.,
1990).
Although there are several “layers” of mucosal defense, experimentally reducing
the effectiveness of the mucus-bicarbonate layer on the epithelial surface does not
usually result in epithelial damage (Wallace, 1989). It is possible that may have an
underlying ability to remain intact and functional when continuously exposed to high
concentrations of acid. Sanders and colleagues (1985) reported that the apical
membrane of cultured chief cells is highly resistant to damage by acid and that these
cells can tolerate a solution of pH 2 for more than four hours without any damage to the
cells. Takezono et al. (2004) revealed that gastric-surface mucus cells have a
mechanism to resist the back-diffusion of acid into the mucosa that involves
enhancement of the functional barrier.
2.3.2.3 Mucosal blood flow
Mucosal blood flow is triggered by sensory afferent neurons when irritants such
as acid enter the subepithelial compartment, allowing the buffering of acid and the rapid
removal of toxic substances, thus limiting the latter’s penetration into deeper layers of
the mucosa (Wallace & Granger, 1996). When the sensory afferents are stimulated, this
causes a rapid increase in mucosal blood flow. Holzer and Sametz (1986) reported that
excision of the sensory afferent neurons eliminates the “reactive hyperemic” response to
topical irritants and thereby increases the chances of injury to the gastric mucosa. A
constant delivery of plasma from the subepithelial blood vessels plays an important role
in maintaining a repair-conducive microenvironment. An interruption in blood flow can
result in a rapid decrease in pH at the site of the injury, leading to disruption of the
repair process and damage progressing to deeper layers of the mucosa (Wallace &
McKnight, 1990).

13
2.3.2.4 Ulcer healing
Healing a gastric ulcer requires restoring the epithelium, endothelium,
connective tissue, and smooth muscle damaged during ulceration. Ulcer healing is a
complex repair process that involves inflammation, cell proliferation (particularly at the
ulcer margin), the formation of granulation tissue at the base of the ulcer, and
angiogenesis (new blood vessel growth).
Normally, intestinal epithelial repair after injury involves different processes
which can be considered partially independent (Figure 2.2). The initial, rapid response
to damage involves the migration of surrounding epithelial cells to cover the denuded
area (Argenzio et al., 1988; Lacy, 1988; and Feil et al., 1989) - a process called re-
epithelialization. This process is crucial because a continuous epithelial “barrier” can
protect granulation tissue from mechanical and chemical injury or infection. For small
wounds, short restitution and proliferation phases may be sufficient to restore the
monolayer. If the wound is large, immunologic responses and the deposition of
protective granulation tissue may be necessary to restore epithelial continuity.
The re-epithelialization process involves epithelial cell migration and
proliferation, and is activated and regulated by certain growth and transcription factors
(Tarnawski, 2000; Vanwijck, 2001; and Chai et al., 2004).

14
Figure 2.2: The basic processes of intestinal epithelial wound healing. When an undamaged mucosal
surface (A) is subjected to an attack that strips away epithelial cells (B), the first response is loss of
polarization of cells near the wound margin and conversion to a migratory phenotype (C). Over a process
of minutes to hours, depending on the extent of the wound, cells flatten and move to cover the denuded
area, re-establishing the protective barrier (D). Leader and follower cells often move as a unified sheet,
maintaining rudimentary attachments during the restitution process. Cell proliferation restores the
epithelial population (E), allowing cells to reform normal junctional complexes and retrieve a polarized
columnar phenotype (F). (Frey & Polk, 2006)
Granulation tissue develops at the ulcer base two or three days after ulceration
[(Tarnawski et al., 1990; Tarnawski et al., 1991; Tarnawski, (1993, 2000); and Cotran
et al., 1999)]. Proliferating connective tissue cells such as macrophages, fibroblasts and
proliferating endothelial cells found in granulation tissue form microvessels through the
process of angiogenesis [(Tarnawski et al., 1990; Tarnawski et al., 1991; Tarnawski,
(1993, 2000); and Cotran et al., 1999)]. Granulation tissue plays a crucial role in the
ulcer healing process because it supplies connective tissue cells (a synthesizing
extracellular matrix for restoring the lamina propria) and microvessels for the
restoration of the microvasculature within an ulcer scar [(Tarnawski et al., 1991;
Tarnawski, (1993, 2000); and Cotran et al., 1999)].

15
Angiogenesis is the process for forming a new microvascular network, which is
considered essential for the healing of chronic gastroduodenal ulcers. Angiogenesis
happens through a series of steps, which include: (a) degradation of the capillary
basement membranes by matrix metalloproteinases; (b) endothelial cell migration into
the perivascular space and proliferation; (c) the formation of microvascular tubes
followed by anastomoses; (d) the establishment of lumina and basement membranes;
and finally, (e) the formation of the capillary network (Tarnawski et al., 1991; Folkman
& D’Amore, 1996; Risau, 1997; and Cotran et al., 1999). The formation of granulation
tissue and generation of new microvessels through angiogenesis is induced by bFGF,
VEGF, PDGF, angiopoietins, and other growth factors and cytokines, including IL-1
and tumor necrosis factor-alpha (TNF-α) (Folkman & D’Amore, 1996; Risau, 1997; and
Tarnawski, 2000).
Extracellular matrix (ECM) is secreted by a wide range of cell types including
fibroblasts, epithelial, smooth muscle and endothelial cells. It assembles into a network
in the spaces surrounding cells which withdraws water and minerals and binds growth
factors (Basson et al., 1993; Cotran et al., 1999; and Basson, 2001). ECM consists of
fibrous structural proteins such as the collagens and elastins, adhesive glycoproteins
including fibronectin and laminin and an amorphous gel composed of proteoglycans and
hyaluronan. All the components above can form an interstitial matrix as well as the
basement membrane (Basson et al., 1993; Cotran et al., 1999; and Basson, 2001).
The replacement of granulation tissue with a connective tissue scar changes the
composition of the ECM. These growth factors not only stimulate the production of
collagen and other connective tissue components but also modulate the synthesis and
activity of metalloproteinases- enzymes which degrade these ECM components (Cotran
et al., 1999). The end result of this process is a remodelling of the connective tissue,
which is an important feature of ulcer healing (Cotran et al., 1999). Degradation of the

16
collagen and other ECM proteins is accomplished by the matrix metalloproteinases,
enzymes dependent on zinc ions for their activity (Pai et al., 1998; Cotran et al., 1999;
and Calabro et al., 2004). Some collagenases and their inhibitors are essential in the
remodelling of connective tissue required for tissue defect repair and scar formation (Pai
et al., 1998; and Calabro et al., 2004).
2.4 Medical treatment of gastric ulcer disease
Treatment of gastric ulcer disease usually involves a combination of antacids
(aluminium hydroxide, magnesium hydroxide) (Preclik et al., 1989), H2-receptor
antagonists (e.g. cimetidine, famotidine, nizatidine, ranitidine) (Rainford, 1987), proton
pump inhibitors (e.g. omeprazole, lansoprazole) (Sander, 1996), and complex bismuth
salt (e.g. colloidal bismuth subcitrate (CBS)) (Tytgat, 1986). Unfortunately, patients
have to take as many as 20 pills a day, and often end up with different side effects,
which can range from nausea to vomiting, diarrhea, dizziness and headaches.
2.4.1 Omeprazole
Omeprazole is a proton pump inhibitor that suppresses gastric acid secretion by
specific inhibition of the H+/K+- ATPase in the gastric parietal cell. By acting
specifically on the proton pump, omeprazole blocks the final step in acid production,
therefore decreasing gastric acidity. The structure of omeprazole is shown in Figure 2.3.
17
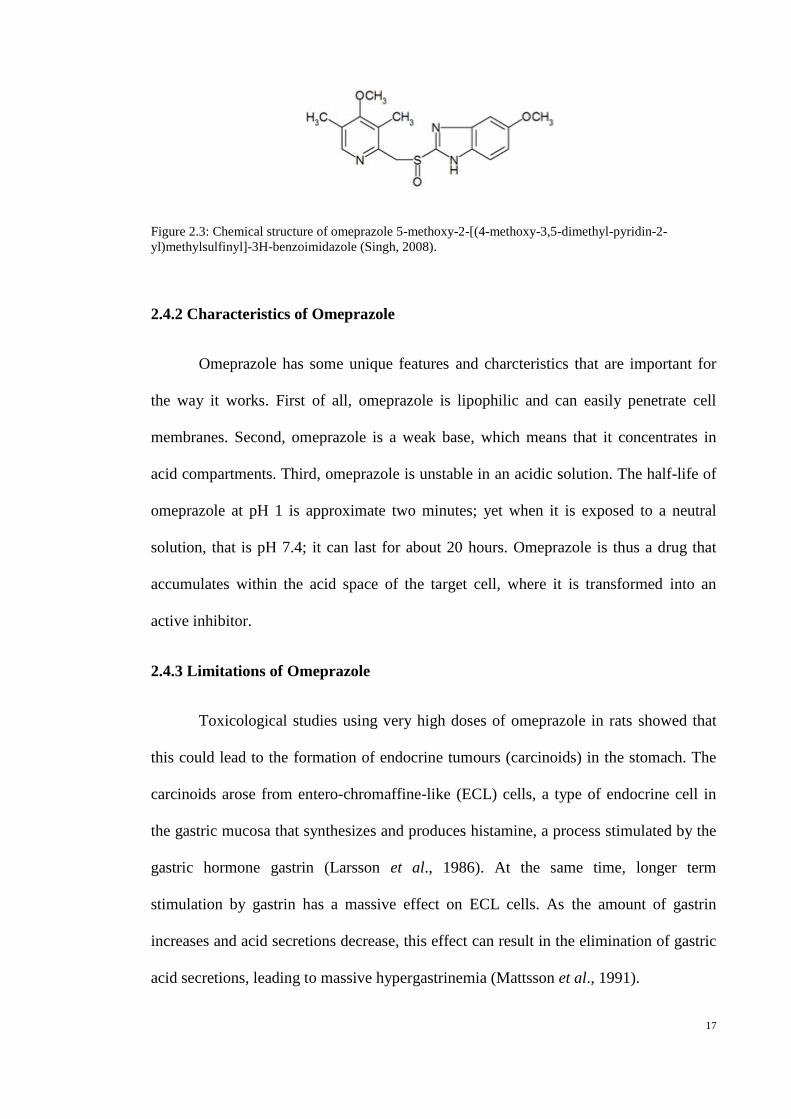
Figure 2.3: Chemical structure of omeprazole 5-methoxy-2-[(4-methoxy-3,5-dimethyl-pyridin-2-
yl)methylsulfinyl]-3H-benzoimidazole (Singh, 2008).
2.4.2 Characteristics of Omeprazole
Omeprazole has some unique features and charcteristics that are important for
the way it works. First of all, omeprazole is lipophilic and can easily penetrate cell
membranes. Second, omeprazole is a weak base, which means that it concentrates in
acid compartments. Third, omeprazole is unstable in an acidic solution. The half-life of
omeprazole at pH 1 is approximate two minutes; yet when it is exposed to a neutral
solution, that is pH 7.4; it can last for about 20 hours. Omeprazole is thus a drug that
accumulates within the acid space of the target cell, where it is transformed into an
active inhibitor.
2.4.3 Limitations of Omeprazole
Toxicological studies using very high doses of omeprazole in rats showed that
this could lead to the formation of endocrine tumours (carcinoids) in the stomach. The
carcinoids arose from entero-chromaffine-like (ECL) cells, a type of endocrine cell in
the gastric mucosa that synthesizes and produces histamine, a process stimulated by the
gastric hormone gastrin (Larsson et al., 1986). At the same time, longer term
stimulation by gastrin has a massive effect on ECL cells. As the amount of gastrin
increases and acid secretions decrease, this effect can result in the elimination of gastric
acid secretions, leading to massive hypergastrinemia (Mattsson et al., 1991).

18
2.5 Mushrooms
2.5.1 Introduction to mushrooms
Nowadays, there are at least 80,060 species of described fungi of all kinds on the
Earth. This figure is based on the total derived from adding together the species in each
genus given in the latest edition of the Dictionary of Fungi (Kirk et al., 2001), which
includes all organisms traditionally studied by mycologists: slime molds, chromistan
fungi, chytridiaceous fungi, lichen-forming fungi, filamentous fungi, moulds and yeasts.
From the definition of Chang and Miles (1992), ‘a mushroom is a macrofungus
with a typical fruiting body which can be hypogeous or epigeous, large enough to be
seen with the naked eye and to be picked by hand’. The number of filamentous fungi
that are mushrooms, in the sense of this definition deduced from the Dictionary of the
Fungi, is at least 14,000 and perhaps as many as 22,000 (Hawksworth, 2001). That, the
actual number of such species on Earth is probably much higher is due to two main
reasons: (1) the large number of as yet undescribed species; and (2) the fact that many
morphologically defined mushroom ‘species’ prove to be assemblages of several
biological species (Hawksworth, 2001). Potentially new mushrooms are regularly found
in the tropics, especially species forming ectomycorrhizas with native trees. In various
tropical areas, 22–55% (in some cases up to 73%) of mushroom species have turned out
to be undescribed (Hawksworth, 2001). An analysis of the localities from which fungi
new to science have been described and catalogued in the Index of Fungi in the 10 years
from 1990 to 1999 revealed that about 60% of all newly identified fungi were from the
tropics (Hawksworth 1993, 2001); and this is also the case for mushrooms, although
new species also continue to be discovered in Europe and North America.
Researches of compatibility and molecular sequences between mushrooms
previously considered to be the same species on morphological grounds have revealed

19
‘cryptic species’, i.e., populations functioning as separate biological species but covered
by a single scientific name. Hawksworth (2001) stated that a single morphologically
identified species may consist of 20 or more biological species. Given this, the number
of fungi species on Earth could range from 500,000 to as many as 9.9 million, of which
only 80,060 have been named. A working figure of 1.5 million species is generally
accepted, and new data suggests that this is not unreasonable. Within this, the number of
mushrooms on Earth is estimated at 140,000, of which maybe only 10% are known.
Meanwhile, of those nearly 14,000 species that we know today, around 50% are
considered to have varying degrees of edibility; just over 2,000 are safe; and about 700
are known to possess significant pharmacological properties (Chang, 1999; Wasser &
Weis 1999; and Reshetnikov et al., 2001). Hence, it is clear that mushrooms represent a
major potential source of powerful new pharmaceutical products.
2.5.2 Hericium erinaceus
Hericium erinaceus (Bull. Fr.) Pers. is known as monkeyhead mushroom in
China, and ‘cendawan bunga kobis’ in Malaysia. Other common names for Hericium
spp. included lion’s mane, old man’s beard, hedgehog mushroom, satyr’s beard, pom
pom and yamabushitake (Japanese for “mountain-priest mushroom”)(Stamets, 2005).
The basidiocarp of H. erinaceus appears as a slightly rounded structure, up to 25
cm in diameter; pure white when fresh, but easily becoming bruised and staining
yellowish brown (Figure 2.4). There is no recognizable cap, but only a short stalk from
which grows a cascade of long, downwardly projecting spines, up to 4 cm long. In
nature, the fruit body always grows out of the knotholes or wounds of a tree, which may
be walnut, oak, elm, or beech. In the wild, only the fresh, young fruit body is edible and
is regarded as a delicacy- an especially desirable one, as the fruit body can be large.

20
When this mushroom becomes old and yellowish brown, the taste can turn bitter and
unpleasant (Pegler, 2003).
Figure 2.4: Basidiocarp of Hericium erinaceus. (Source: retrieved from
Prof. Dr. Vikineswary Sabaratnam, University of Malaya)
Because of the rapid increase of interest in Hericium species, more information
about this mushroom is necessary to screen efficient species and strains, and to improve
its yield and quality. Unfortunately, limited data and reference texts are available on the
physiological, genetic, and cultural characteristics of the Hericium species. To date,
only a few Hericium species have been identified throughout the world. Park et al.
(2004) analyzed the phylogenetic relationships of seven Hericium species including H.
abietis, H. alpestre, H. americanum, H. coralloides, H. erinaceum, H. erinaceus and H.
laciniatum. Among the seven Hericium species, attempts at cultivation on logs, stumps
and sawdust have been made so far only with H. erinaceum (Suzuki & Mizuno, 1997),
H. erinaceus (Chang & Roh, 1999) and H. abietis (Xiao & Chapman, 1997). Ko et al.
(2005) studied the potential for using agricultural by-products as a supplementary
resource of sawdust substrate for the growth of seven Hericium species, as well as
basidiomata formation and production on oak sawdust substrate.

21
2.5.3 Medicinal properties of H. erinaceus
Mizuno (1999) found that polysaccharides (HEPS) in the fruiting bodies of
Hericium erinaceus may have beneficial effects against stomach, esophageal and skin
cancers. Hericium erinaceus (including its fruiting body, mycelium, and products in the
medium) also contains some lower-level MW pharmaceutical constituents, such as the
novel phenols (hericenones A and B) and Y-A-2, which may have chemotherapeutic
effects on cancer. Yang et al. (2003) studied the hypolipidaemic effect of an exo-
biopolymer produced from a submerged mycelial culture of H. erinaceus in dietary-
induced hyperlipidaemic rats. After oral administration of exo-biopolymer at a dose of
200 mg/kg of body weight, the plasma total cholesterol (32.9%), low density lipoprotein
cholesterol (45.4%), triglyceride (34.3%), phospholipids (18.9%), atherogenic index
(58.7%) and hepatic HMG-CoA reductase activity (20.2%) were extensively reduced. It
also increased the plasma high density lipoprotein cholesterol level (31.1%) over that of
the control group (Yang et al., 2003).
Recent studies have determined that H. erinaceus may have important
physiological functions in humans, including antioxidant activities, the regulation of
blood lipid levels and reducing blood glucose levels (Chyi et al., 2005). Gue et al. (2006)
stated that H. erinaceum is a medicinal and edible mushroom with anti-microbial and
anti-cancer activities.
Recently, Hericium spp. has attracted considerable attention from researchers
owing to its antimicrobial effects (Kim et al., 2000), anti-tumor activities (Mizuno et al.,
1995), immunomodulatory effects (Liu et al., 2002), antioxidant properties (Mau et al.,
2002), cytotoxic effects (Kuwahara et al., 1992), and promotion of synthesis of
neurogrowth factors (Kawagishi et al., 1994).

22
2.5.4 Nutritional composition of H. erinaceus
Wang et al. (1992) studied the nutritional composition of five strains of H.
erinaceus fruit bodies that have the highest crude protein content (28.4%) and low crude
fat. Kim et al. (2011) found that, for four H. erinaceus extracts, protein, carbohydrate,
and mineral (ash) content were all high, ranging (in % of dry weight) from 35.5 to 38.5;
33.8 to 39.5 and 14.6 to 19.0 respectively; moisture content was about 8%; while fiber
and fat content were <1%.
2.6 Free radicals
2.6.1 Introduction to free radicals
A free radical is any chemical species capable of independent existence that has
one or more unpaired electrons. Free radicals are often described by the insertion of a
radical dot (·) to indicate that one or more unpaired electrons is present. Usually,
radicals are less stable than nonradicals, in that they can interreact either with another
radical or with another molecule in various ways to achieve a stable state.
2.6.2 Reactive oxygen species
Aerobes require oxygen (O2) to perform cell functions, as oxygen plays an
important role in a series of biochemical reactions such as electron transport chains and
other enzyme systems. A series of electron transfer reactions produces several
molecules of adenosine triphosphate (ATP), which in turn provides the energy required
for a multitude of cellular reactions and functions for each electron that passes through
the respiratory chain. Molecular oxygen can pair with four electrons, one at a time, and

23
the corresponding number of protons to yield two molecules of water. Different oxygen
radicals are formed as intermediate products during this process, namely superoxide (O2-
); peroxide (O2=), which normally exists in cells as hydrogen peroxide (H2O2); and the
hydroxyl radical (•OH). Superoxide, peroxide, and the hydroxyl radical are considered
the primary reactive oxygen species (ROS). Reactive oxygen species (ROS) is often
used to refer not only to the radicals OH·, RO2·, NO· and O2·−, but also the nonradicals
HOCl, 1O2, ONOO
−, O3, and H2O2.
An imbalance between the production of ROS and the activity of the antioxidant
defences is called oxidative stress. Oxidative stress, superoxide production and an
imbalance in antioxidant enzymes may contribute to the initiation of cancer (Wiseman
& Halliwell, 1996), cause structural alterations in DNA (Halliwell & Aruoma, 1991),
affect cytoplasmic and nuclear signal transduction pathways (Burdon, 1995).
2.6.3 Antioxidants
An antioxidant is defined as any substance that, when present at low
concentrations compared with those of the oxidizable substrate, considerably delays or
inhibits oxidation of the substrate (Gutteridge, 1995). Antioxidants can act by: (a)
removing oxygen or decreasing local oxygen concentration; (b) removing catalytic
metal ions; (c) removing key reactive oxygen species such as superoxide and hydrogen
peroxide; (d) scavenging initiating free radicals such as hydroxyl, alkoxyl, and peroxyl
species; (e) breaking the chain of an initiated sequence; or (f) quenching or scavenging
singlet oxygen (Gutteridge, 1995).

24
2.6.4 Antioxidant compounds
Vitamin C (ascorbic acid) is a major aqueous-phase antioxidant, and Vitamin E
(α-tocopherol) is a major membrane bound antioxidant. These compounds are both
human vitamins that play vital roles in maintaining health.
There are two types of antioxidant: water-soluble and lipid-soluble antioxidant
compounds. Water-solubles include uric acid, glutathione and ceruloplasmin. Uric acid
is the end product of purine metabolism in humans, and may function both as a classic
suicidal antioxidant and as a chelator of transition metals. Uric acid may inhibit metal-
catalyzed oxidation reactions without itself becoming oxidized, by binding iron and/or
copper. Beta-carotene and ubiquinone are lipid-soluble agents that may also play
important antioxidant roles in vivo.
2.6.5 Antioxidant Enzymes
In order to minimize oxidative damage, aerobic organisms also produce
numerous antioxidant enzymes (Fridovich, 1995; and Özben, 1998). One of the best
known of these enzymes is superoxide dismutase (SOD).
Superoxide dismutase (SOD) catalyzes the dismutation reaction of O2- + O2
-
H2O2+O2 and increases the rate constant of this important dismutation reaction
several-fold. SOD is found in almost all eukaryotic cells, including yeasts, plants and
animals. Different members of the SOD family use different transition metals such as
Ferum, Manganese, Copper/ Zinc at their active sites. Bacteria use a Fe-SOD and a Mn-
SOD, whereas mammals apply distinct cytoplasmic and extracellular forms of Cu/Zn-
SOD and a mitochondrial Mn-SOD which is closely related to bacterial Mn-SOD. Mn-
SOD has four subunits, with Mn in each subunit (Smith & Heath, 1976). Cu/Zn-SOD
consists of two subunits, with each unit having an active site containing one Cu ion and

25
one Zn ion (McCord, 1979). Cu ion serves as an active redox site while Zn maintains
the protein structure (Fridovich, 1975). Cu/Zn-SOD is found mainly in cytosol and is
shown to be present in the nucleus also (Slot et al., 1986). SOD present in our body can
dismutate O2- rapidly at the site where it is formed.
The product of SOD is H2O2, which is clearly toxic and must be quickly
removed. In mammalian cells this is accomplished by two enzyme families: the
glutathione peroxidases and the catalases. Both glutathione peroxidases and catalases
detoxify H2O2 by reducing it to water and oxygen. Glutathione peroxidase is not further
discussed here.
Catalase removes H2O2 and generates O2, 2H2O2 2H2O + O2 (Krall et al.,
1988). In most mammalian cell types, catalase is only found within peroxisomes where
it has a clear function of removing the H2O2 generated by β-oxidation of long-chain
fatty acids. Normally, catalase is not found in the cytoplasm of most mammalian cells,
and for that reason diffusion of H2O2 from the cytoplasm into peroxisomes seems rather
unconvincing all of which suggests that glutathione peroxidases largely deal with
cytoplasmic H2O2 and catalases largely deal with peroxisomal H2O2.
2.6.6 Lipid peroxidation activity
The free-radical oxidation of polyunsaturated fatty acids in biological systems is
known as lipid peroxidation. Lipid peroxidation is an inevitable process in vivo.
Cardiovascular diseases such as preeclampsia and atherosclerosis are induced by this
process, and the end-products of this process such as malondialdehyde (MDA) and 4-
hydroxynonenal (HNE) can cause damage to proteins and to DNA. Lipid peroxidation
causes damage to biological membrane functions, e.g. it decreases fluidity, inactivates

26
membrane-bound enzymes and receptors, and may alter nonspecific calcium ion
permeability (Orrenius, 1989; and Bast, 1993).
Lipid peroxidation induced by oxygen free radicals is believed to play an
important part in the destruction and impairment of cell membranes, because this
process degrades polyunsaturated fatty acids (PUFA) in the latter, with consequent
disruption of membrane integrity (Tappel, 1973).
Previous studies have reported that lipid peroxidation plays a significant role in
the pathogenesis of gastric mucosal lesions induced by water immersion restraint stress,
burn shock, and ischemia-reperfusion (Yoshikawa et al., 1986, 1987, 1989).
2.7 Heat shock proteins
Heat shock response was first reported by Ritossa (1962), who observed it in
Drosophila melanogaster chromosomes after subjecting these flies to heat treatment. A
heat shock response then increases the expression of genes encoding a special class of
proteins, called heat shock proteins (HSPs) or stress proteins.
Heat shock proteins play important roles in both normal conditions and
pathological situations involving either systemic or cellular stress. Previous studies have
shown that most HSPs have strong cytoprotective effects, are involved in many
regulatory pathways, and act as molecular chaperones to preserve important cellular
proteins (Hightower, 1991, and Arya, 2007). HSPs are essential for the maintenance of
gastric mucosal cell integrity both during normal cell growth and in several
pathophysiological conditions (Robert et al., 1983; Lichtenberger, 1999; and Laine et
al., 2008).
Heat shock proteins are also implicated in gastric cytoprotection. HSPs are a
group of highly conserved proteins that are induced in response to heat and other

27
stresses (Kinouchi et al., 1994; and Schiaffonati & Tiberio, 1997). They are classified
into subfamilies according to their molecular weight, such as small HSPs (16–30 kDa),
HSP40, the predominantly mitochondrial HSP, HSP60, HSP70, HSP90 and the large
HSP110. 70 kDa heat shock proteins assist in both the assembly and transport of newly
synthesized proteins within cells and also the removal of denatured proteins. Therefore,
HSP70 plays a role in preventing damage and in cellular repair processes after injury.
Previous studies have also found the induction of HSP70 in response to heat, ethanol,
oxidative stress, or water immersion–restraint stress in the gastric mucosal cell (Zeniya
et al., 1995; and Hirakawa et al., 1996). However, only a few studies have reported
locating HSP70 in the injured stomach.
2.7.1 Heat shock proteins and the stomach
The stomach is one of the organs in our body that is often exposed to outside
irritants such as hot food, alcohol, and oxidants generated from ingested food and H.
pylori-associated infection. Alcohol is one of major factors that cause gastric mucosal
injuries including gastritis or ulcers.
Some studies showed that HSPs contribute to adaptive cytoprotection in the
gastrointestinal mucosa. Among the HSPs, HSP70 is believed to be the one that plays
an important role in the defense mechanism of gastrointestinal mucosa. HSPs are
reported to have been induced both in in vitro and in vivo. According to Nakamura et al.
(1991), HSPs were induced by heat shock treatment resistant 7.5% ethanol in cultured
guinea pig gastric mucosal cells. In an in vivo study, it was reported that an
overexpression of HSPs was induced by water-immersion restraint (WIR) stress in
animals pretreated with hyperthermia, as compared with stress alone (Itoh & Noguchi,
2000). Hirakawa et al. (1996) revealed that the oral administration of the anti-ulcer drug
28
geranylgeranylacetone (GGA) produced HSP60, HSP70, HSC70, and HSP90 in the
gastric mucosa of normal rats. Park et al. (2008) also demonstrated that HSP70
inductions protected rats against ethanol-induced gastric mucosal damages.
These results suggest that HSPs, especially HSP70, induce resistance in the
gastric mucosa against stress-induced mucosal damage. HSPs thus play a protective role
in gastric mucosa under stressful conditions.
2.7.2 Heat shock proteins and protection against oxidative stress
Heat shock proteins also play an important role in other cellular processes that
occur during and after exposure to oxidative stress. Oxidative stress occurs as a result of
an imbalance between the productions of reactive oxygen species (ROS) and the
detoxifying process of reactive intermediates. As a consequence, this imbalance
generates excessive ROS, which leads to the oxidation and aggregation of vital proteins
and of DNA, causing a failure of normal cell functions.
Under such stress conditions, some HSPs, especially the HSP70 family and its
co-chaperones, are synthesized at high levels. Members of the HSP70 protein family
include: HSC70 (a constitutive HSP70), present within the cytoplasm and nucleus;
grp75, a mitochondrial HSP70; and grp78 (Bip), a resident of the endoplasmic
reticulum.
The HSP70 protein family functions as molecular chaperones in refolding
denatured polypeptide (Gething & Sambrook, 1992; Hendrick & Hartl, 1993; Becker &
Craig, 1994; and Hartl, 1996). A molecular chaperone is defined as a protein that binds
to newly synthesized proteins and refolds denatured proteins (Bukau & Horwich, 1998;
and Young et al., 2004).

29
Members of the HSP70 family and its co-chaperones select and direct abnormal
proteins to the proteasome or lysosomes for degradation (Mayer & Bukau, 2005).
Previous studies have revealed that an overproduction of HSP70 can reduce stress-
induced denaturation as well as the aggregation of certain proteins (Kampinga et al.,
1995; and Kabakov & Gabai, 1995) - further evidence that HSP70 plays an important
role in protection against stresses (Georgopoulos & Welch, 1993; and Kampinga, 1993).
Heat shock proteins may also exhibit its protective effects against oxygen radical-
induced cellular damage such as membranes (lipid peroxidation), proteins, DNA, and
mitochondria. Jacquier-Sarlin et al. (1994) reported the protective effects of HSP70
against lipid peroxidation and DNA damage. The over-expression of HSPs may
therefore protect multiple cellular compartments and prevent protein damage from
oxidative stress.
2.8 Bax protein
The balance between apoptosis and cellular proliferation is a main factor in
gastric injury and repair. These processes are regulated by several genes, including p53
and members of the Bcl-2 family such as Bax and Bcl-2 (Haunstetter & Izumo, 1998;
Boucher et al., 2000; and Rezvani et al., 2000).
The Bax gene is a proliferative suppressor gene that encodes the Bax protein
which promotes apoptosis. Bax is a protein that forms an isomeric dimmer with Bcl-2.
It counteracts the action of Bcl-2 in the presence of various cell death signals, and
induces apoptosis (Wu et al., 1998). Bax protein expression has been identified in
various human tissues such as the prostate, colon, breast, testis and ovary. However,
little is known about Bax protein expression in gastric injury. Qiao et al. (2011)
reported high levels of expression of Bax protein in the early stages of the gastric

30
ischemia reperfusion of rats, which decreased gradually after that. This suggests that a
down-regulation of Bax protein is related to healing effects in gastric ulcers.
31
3.0 Materials and methods
3.1 Mushroom and preparation of mushroom extracts
One batch of 20kg fresh basidiocarp of H. erinaceus KUM 61131 was collected
from Highland & Lowland Mushroom Industry, Selangor, Malaysia. Fresh H. erinaceus
fruit bodies were sliced and frozen at -20 ± 2 °C prior to freeze-drying at -50 ± 2 °C.
The extraction was based on the method by Wong et al. (2007). Freeze-dried
fruit bodies of H. erinaceus were blended into powder. The yield was 13.57%. The
powdered fruit bodies were soaked with distilled water at a ratio 1:10 (w/v) and left for
24 h at 27 ± 2°C. The soaked fruit bodies were then boiled for 30 min with agitation,
left covered for 30 minutes, and filtered cold using Whatman no.1 filter paper. The
extract was then freeze-dried. The yield was 27.47%.
3.2 The toxic effects, if any, of extracts freeze-dried fruit bodies of H. erinaceus to
rats
3.2.1 Animals
Healthy male and female Sprague Dawley rats weighing between 150 g and 300
g were used in this study. The female animals used were nulliparous and non-pregnant.
The animals were fed with pellet feed. Food and water were provided ad libitum during
acclimation and throughout the study. The animals were maintained under control
condition of temperature at 26⁰C (±2⁰C) and relative humidity around 44–56%.
Animals were housed in polypropylene cages over husk beddings and 12 h light and 12
h dark cycle was maintained throughout the experimental period. All the animal
experiments were performed after getting necessary approval from the Institutional
32
Animal Ethical Committee (which follows the guidelines of Animal Care and Use
Committee), Laboratory Animal Science Centre, Faculty of Medicine, University of
Malaya (Ethics no. ISB/11/08/2010/WJY (R). All efforts were made to minimize both
the number of animals used and unwanted stress or discomfort to the animals
throughout the experimental procedures.
3.2.2 Acute toxicity studies
The acute toxic study was used to determine a safe dose of the mushroom
extract. Animals were divided into three groups, each group containing six animals.
Group 1 animals served as control which received distilled water. Group 2 and Group 3
animals received freeze-dried H. erinaceus powder in single doses of 2 and 5g/kg b/w.,
respectively. The H. erinaceus powder was suspended in sterile distilled water and
administered by gavage (P.O.). Food was withheld for a further three to four hours after
treatment (OECD, 2001). The animals were observed for 30 min and 2, 4, 24 and 48 h
for the onset of clinical or toxicological symptoms. Mortality, if any was observed over
a period of two weeks. During this period, body weight was recorded weekly to
evaluate possible toxic effect. After an overnight fast, the animals were sacrificed on the
15th
day. Hematological, serum biochemical and histological (liver and kidney)
parameters were determined using standard methods. The experimental flow is given in
Figure 3.1.

33
Acute toxicity test
2 weeks observation if no mortality
Sacrificed on 15th
day
Figure 3.1: Flow diagram of the acute toxicity studies.
3.3 The gastroprotective effects of H. erinaceus extract in rats
The rats were starved for 24 hours (Garg et al., 1993) but had free access to
drinking water until two hours before the experiment. On the day of experiment, the rats
were randomly divided into seven groups with six animals. Each group received oral
dose of distilled water (ulcer-free control group), distilled water (ulcer control group),
four different concentrations of mushroom extracts (50, 100, 200, and 400mg/kg b/w.,
respectively) in distilled water and Omeprazole in distilled water (positive control group)
were the treatments to investigate gastroprotective activities, if any, of aqueous extracts
of H. erinaceus (Figure 3.2). All groups were orally fed with 95% alcohol (De Pasquale
et al., 1995) one hour after their pre-treatment, except ulcer-free control group which
Low dose (2g/kg)
High dose (5g/kg)
Blood test (biochemical parameters test) Histological lesions evaluation in
liver and kidney
Control group
(Distilled water)
Fast rats overnight
34
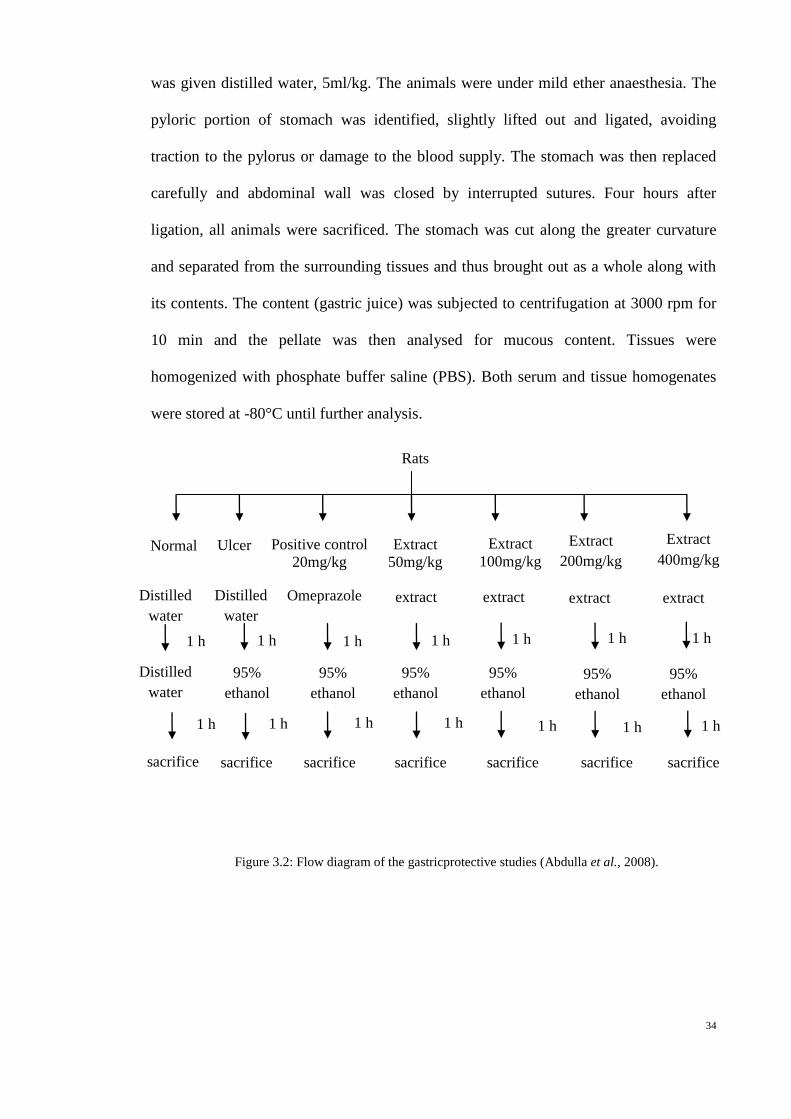
was given distilled water, 5ml/kg. The animals were under mild ether anaesthesia. The
pyloric portion of stomach was identified, slightly lifted out and ligated, avoiding
traction to the pylorus or damage to the blood supply. The stomach was then replaced
carefully and abdominal wall was closed by interrupted sutures. Four hours after
ligation, all animals were sacrificed. The stomach was cut along the greater curvature
and separated from the surrounding tissues and thus brought out as a whole along with
its contents. The content (gastric juice) was subjected to centrifugation at 3000 rpm for
10 min and the pellate was then analysed for mucous content. Tissues were
homogenized with phosphate buffer saline (PBS). Both serum and tissue homogenates
were stored at -80°C until further analysis.
Figure 3.2: Flow diagram of the gastricprotective studies (Abdulla et al., 2008).
Normal
control
Ulcer
control
Extract
50mg/kg
Extract
100mg/kg
Extract
200mg/kg
Extract
400mg/kg
1 h 1 h 1 h
95%
ethanol
95%
ethanol
95%
ethanol
95%
ethanol
95%
ethanol
sacrifice sacrifice
sacrifice
sacrifice
sacrifice
sacrifice
Positive control
20mg/kg
Omeprazole
1 h
95%
ethanol
sacrifice
Distilled
water
Distilled
water
Distilled
water
extract extract extract extract
1 h 1 h 1 h
1 h 1 h 1 h 1 h 1 h 1 h 1 h
Rats
35
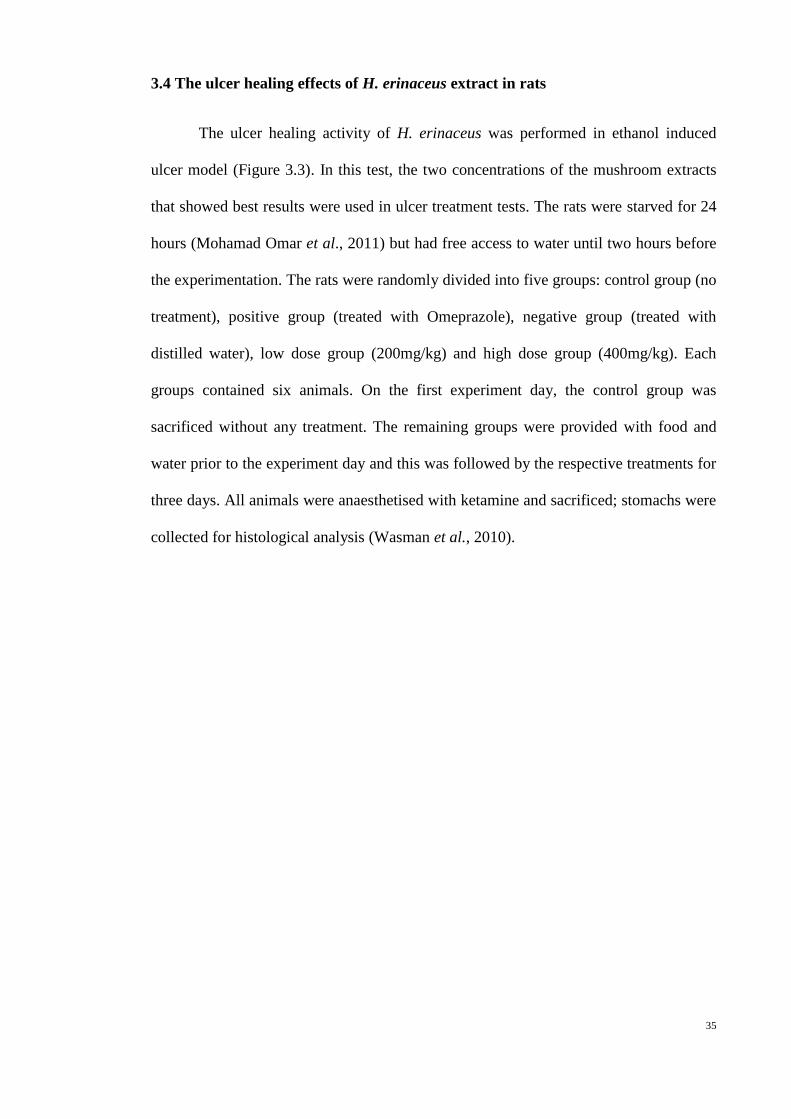
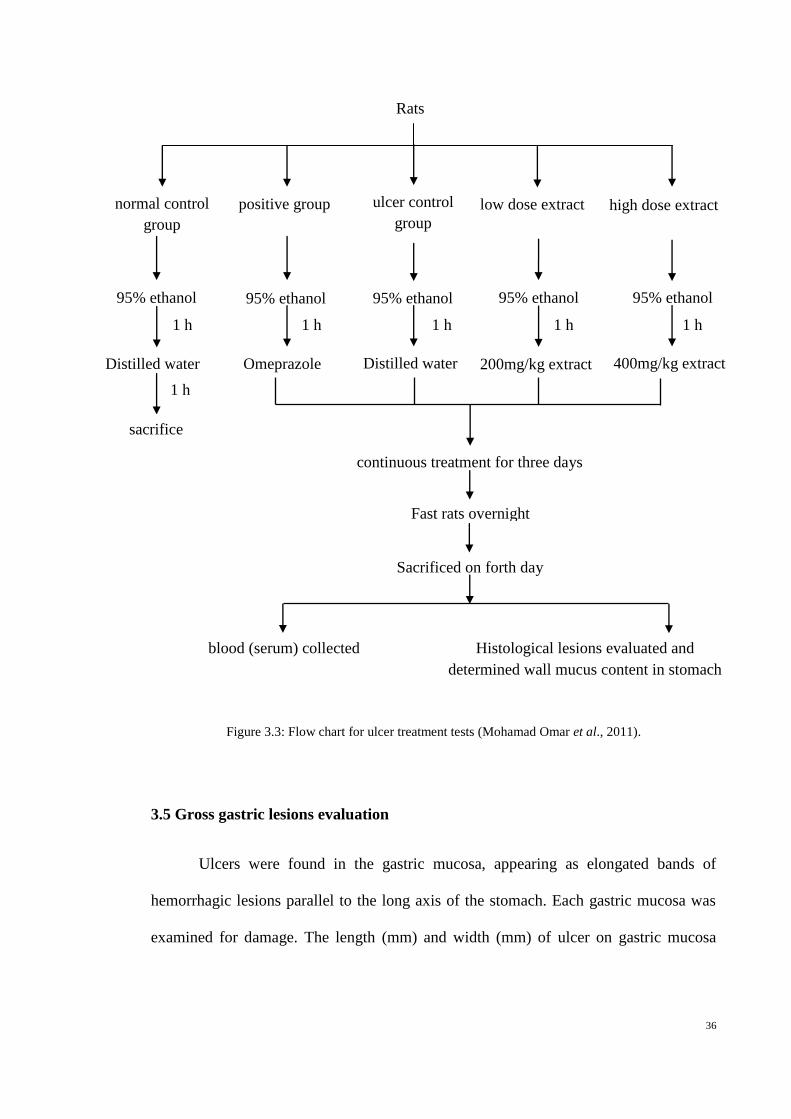
3.4 The ulcer healing effects of H. erinaceus extract in rats
The ulcer healing activity of H. erinaceus was performed in ethanol induced
ulcer model (Figure 3.3). In this test, the two concentrations of the mushroom extracts
that showed best results were used in ulcer treatment tests. The rats were starved for 24
hours (Mohamad Omar et al., 2011) but had free access to water until two hours before
the experimentation. The rats were randomly divided into five groups: control group (no
treatment), positive group (treated with Omeprazole), negative group (treated with
distilled water), low dose group (200mg/kg) and high dose group (400mg/kg). Each
groups contained six animals. On the first experiment day, the control group was
sacrificed without any treatment. The remaining groups were provided with food and
water prior to the experiment day and this was followed by the respective treatments for
three days. All animals were anaesthetised with ketamine and sacrificed; stomachs were
collected for histological analysis (Wasman et al., 2010).
36
Figure 3.3: Flow chart for ulcer treatment tests (Mohamad Omar et al., 2011).
3.5 Gross gastric lesions evaluation
Ulcers were found in the gastric mucosa, appearing as elongated bands of
hemorrhagic lesions parallel to the long axis of the stomach. Each gastric mucosa was
examined for damage. The length (mm) and width (mm) of ulcer on gastric mucosa
normal control
group
positive group ulcer control
group
low dose extract high dose extract
Distilled water Distilled water
200mg/kg extract
95% ethanol
400mg/kg extract
95% ethanol 95% ethanol
95% ethanol
95% ethanol
Omeprazole
1 h 1 h
1 h
1 h
1 h
1 h
sacrifice
continuous treatment for three days
Fast rats overnight
Sacrificed on forth day
blood (serum) collected Histological lesions evaluated and
determined wall mucus content in stomach
Rats
37
were measured by a planimeter (10 × 10 mm2 = ulcer area) under dissecting microscope
(x1.8).
The area of each ulcer lesion was measured by counting the number of small
squares, 2 × 2 mm, covering the length and width of each ulcer band. The sum of the
areas of all lesions for each stomach was applied in the calculation of the ulcer area (UA)
wherein the sum of small squares × 4 × 1.8 = UA mm2 as described by Kauffman and
Grossman (1978) with slight modification. The inhibition percentage (I %) was
calculated by the following formula as described by Njar et al. (1995) with slight
modification.
(I %) = [(UAcontrol − UAtreated) ÷ UAcontrol] × 100%.
3.6 Measurement of mucus production
Gastric mucus production in the rats that were subjected to ethanol-induced
gastric mucosal injury was measured. The gastric mucosa of each rat was gently scraped
using a glass slide and the mucus obtained was weighed using a precision electronic
balance (Tan et al., 2002).
3.7 Gastric wall mucus determination
The modified method of Corne et al. (1974) was used to determine gastric wall
mucus. The glandular segments from stomach, which had been opened along their
greater curvature, were weighed. All weighed segments were transferred immediately to
10 ml of 0.1%, w/v alcian blue solution (in 0.16 M sucrose solution, buffered with 0.05
M sodium acetate adjusted to pH 5.8 with HCl). Segments were stained for two hours,
excess dye was removed by two successive rinses with 10 ml of 0.25 M sucrose, first
for 15 min and then for 45 min. Alcian blue complexed with the gastric wall mucus was
extracted with 10 ml of 0.5 M magnesium chloride, by shaking for one min at 30 min
38
intervals for two hours. The resulting blue solution was shaken vigorously with an equal
volume of diethyl ether and then the emulsion was centrifuged at 3000 rpm for 10 min
and the absorbance of the aqueous layer against blank standard MgCl2 solution was
recorded at 580 nm. The quantity of alcian blue recovered from per gram of net
glandular tissue was then calculated.
3.8 Histological evaluation of gastric lesions
Specimens of the gastric walls from each rat were fixed in 10% buffered
formalin and processed in a paraffin tissue processing machine. Sections of the stomach
were made at a thickness of 5μm and stained with hematoxylin and eosin for
histological evaluation.
Histological analyses were made using a Nikon microscope with NIS-Elements
D Imaging Software 2.30 version. The images were manipulated in ACDSee Version
10.0 Photo Manager to enhance the image resolution and to frame the plates.
3.9 Immunohistochemistry
Tissue section slides were heated at 60°C for approximately 25 min in hot air
oven (Venticell, MMM, Einrichtungen, Germany). The tissue sections were
deparaffinized in xylene and rehydrated using graded alcohol. Antigen retrieval process
was done in 10mM sodium citrate buffer boiled in microwave. Immunohistochemical
staining was performed according to manufacturer’s protocol (Dakocytomation, USA).
At first, endogenous peroxidase was blocked by peroxidase block (0.03% hydrogen
peroxide containing sodium azide) for five min. Tissue sections were washed gently
with wash buffer, and then incubated with HSP70 (1 : 500) and Bax (1 : 200)
biotinylated primary antibodies for 15 min. The sections were rinsed gently with wash
buffer and placed in buffer bath. The slides were then placed in a humidified chamber
39
and sufficient amount of streptavidin-HRP (streptavidin conjugated to horseradish
peroxidase in PBS containing an antimicrobial agent) was added and incubated for 15
min. After that, tissue sections were rinsed gently in wash buffer and placed in buffer
bath. Diaminobenzidined (DAB-) substratechromagen was added to the tissue sections
and incubated further for five min following washing and counterstaining with
hematoxylin for five second. The sections were then dipped in weak ammonia (0.037
mol/L) 10 times, then rinsed with distilled water and covered with cover slip. Positive
findings of the immunohistochemical staining should be seen as brown stains under
light microscope.
3.10 Estimation of free radical generation
3.10.1 Lipid peroxidase (LPO)
The LPO assay was assessed based on a method described by Maelinda et al.
(2008) but with minor modifications. 0.25 ml of tissue homogenated was mixed with
same amount of freshly prepared 15% TCA. The mixture was centrifuged at 3500 rpm
for five minutes. 0.4 ml of supernatant was taken out and mixed with 0.5 ml of 1% TBA.
The reaction tubes were kept in a boiling water bath for 30 minutes. Upon cooling, the
tubes were centrifuged at 3500 rpm for five minutes to remove precipitated protein. The
formation of TBARS was measured by removing 200 µl of supernatant and measuring
the absorbance at 532 nm. Each assay was carried out in triplicate. The results are
expressed as µM 1,1,3,3-tetraetoxypropane equivalent.
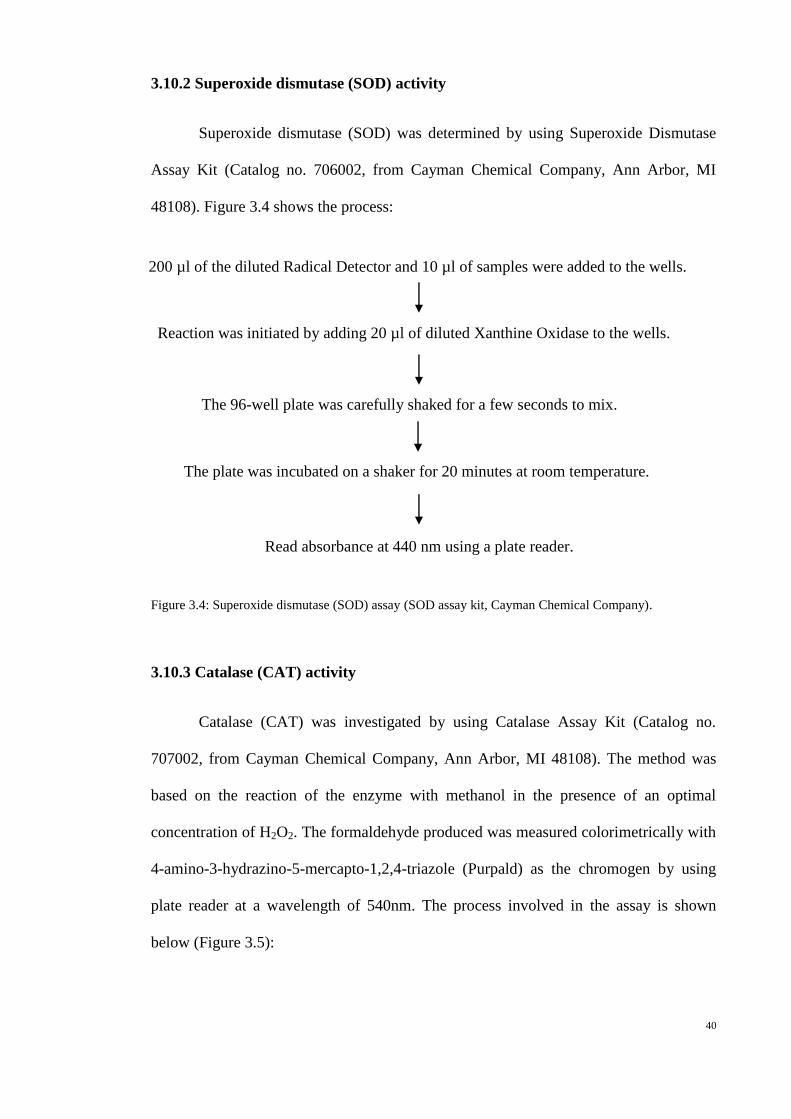
40
3.10.2 Superoxide dismutase (SOD) activity
Superoxide dismutase (SOD) was determined by using Superoxide Dismutase
Assay Kit (Catalog no. 706002, from Cayman Chemical Company, Ann Arbor, MI
48108). Figure 3.4 shows the process:
Figure 3.4: Superoxide dismutase (SOD) assay (SOD assay kit, Cayman Chemical Company).
3.10.3 Catalase (CAT) activity
Catalase (CAT) was investigated by using Catalase Assay Kit (Catalog no.
707002, from Cayman Chemical Company, Ann Arbor, MI 48108). The method was
based on the reaction of the enzyme with methanol in the presence of an optimal
concentration of H2O2. The formaldehyde produced was measured colorimetrically with
4-amino-3-hydrazino-5-mercapto-1,2,4-triazole (Purpald) as the chromogen by using
plate reader at a wavelength of 540nm. The process involved in the assay is shown
below (Figure 3.5):
200 µl of the diluted Radical Detector and 10 µl of samples were added to the wells.
Reaction was initiated by adding 20 µl of diluted Xanthine Oxidase to the wells.
The 96-well plate was carefully shaked for a few seconds to mix.
The plate was incubated on a shaker for 20 minutes at room temperature.
Read absorbance at 440 nm using a plate reader.

41
Figure 3.5: Catalase Assay (Catalase assay kit, Cayman Chemical Company).
3.11 Statistical analysis
All values were reported as mean ± S.E.M. Statistical analysis done using SPSS
version 17.0. The significance of differences amongst groups was assessed using one-
way ANOVA and Tukey multiple range test. A value of p < 0.05 was considered as
statistically significant.
100 µl of diluted Assay Buffer, 30 µl of methanol, and 20 µl of sample were
added to wells.
20 µl of diluted Hydrogen Peroxide was added to all the wells to initiate the
reactions.
The plate was covered with plate cover and incubated on a shaker for
20 minutes at room temperature.
30 µl of diluted Potassium Hydroxide was added to each well to terminate the
reaction and then 30 µl of Catalase Purpald (Chromagen) was added to each
well.
The plate was covered with plate cover and incubated for 10 minutes at
room temperature on a shaker.
10 µl of Catalase Potassium Periodate was added to each well. The plate
was covered with plate cover and incubated for five minutes at room
temperature on a shaker.
Read absorbance at 540 nm using a plate reader.

42
4.0 Results and Discussion
4.1 Acute oral toxicity studies on aqueous extracts of H. erinaceus
Animals treated with H. erinaceus extract at a doses of 2 and 5 g/kg were kept
under observation for 14 days. Both sexes of rats showed no signs of toxicological
effects during the experimental period after a single oral dose administration of the
extract at 2 or 5 g/kg when compared to control group. Further, there was no mortality
for rats administered with the extracts. In current study, all animals did not show any
abnormal behavioural expressions and toxicological signs during experimental period.
4.1.1 Body weight of experimental rats
Evaluation of toxicity was carried out by observing body weight changes of the
animals as shown in Figure 4.1 and Figure 4.2. During the two weeks period, body
weight of male and female rats increased gradually from 0 day to 14 days in the three
groups. Further, body weight of rats that received low or high dosage of H. erinaceus
extract did not reveal significant differences when compared to animals in control group.
The increases in body weight in male and female rats indicated that nutritional state of
the animal was not compromised by the extracts. The results showed similarity to that
obtained by Watthanachaiyingcharoen et al. (2009). However, it was not similar to the
findings by Adebajo et al. (2006). Watthanachaiyingcharoen et al. (2009) showed that
the body weight of both sexes’ rats that received medicinal plant powder showed
increase during the 14 days of observation period. However, Adebajo et al. (2006)
found that rats that fed with Murraya koenigii leaf methanol extract at doses (250-
450mg/kg) showed reduction in body weight and hepatic injury was observed after two
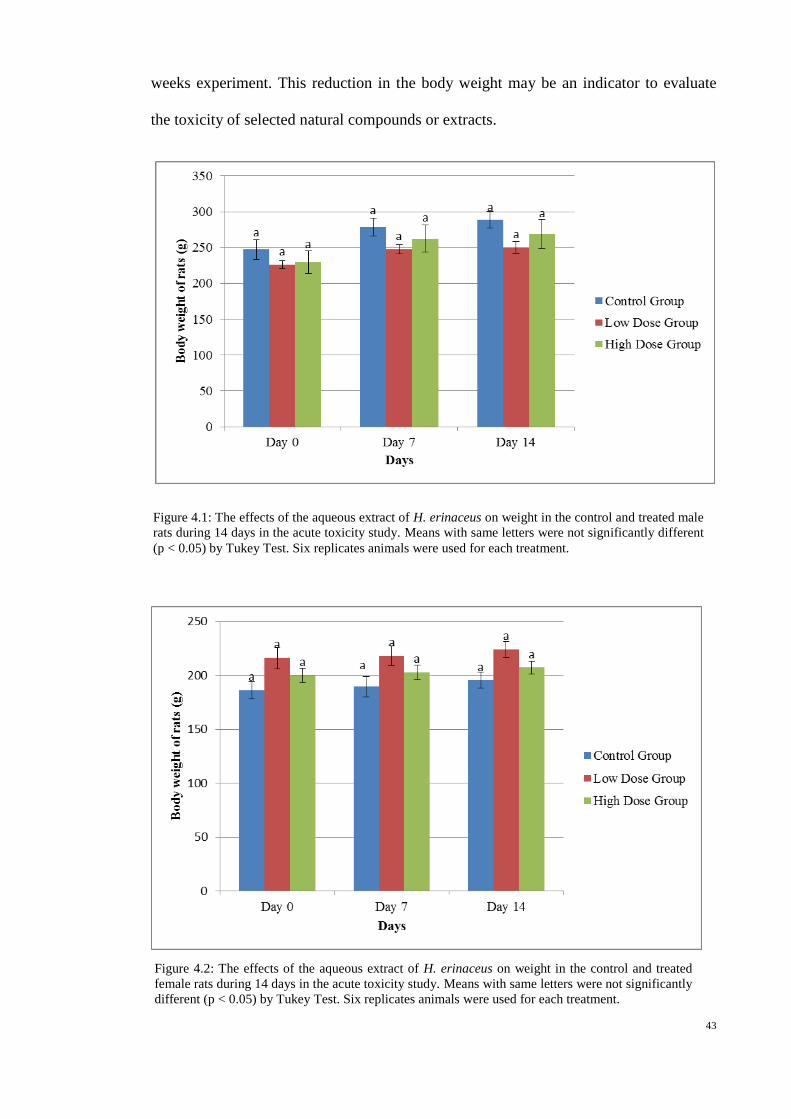
43
weeks experiment. This reduction in the body weight may be an indicator to evaluate
the toxicity of selected natural compounds or extracts.
Figure 4.1: The effects of the aqueous extract of H. erinaceus on weight in the control and treated male
rats during 14 days in the acute toxicity study. Means with same letters were not significantly different
(p < 0.05) by Tukey Test. Six replicates animals were used for each treatment.
Figure 4.2: The effects of the aqueous extract of H. erinaceus on weight in the control and treated
female rats during 14 days in the acute toxicity study. Means with same letters were not significantly
different (p < 0.05) by Tukey Test. Six replicates animals were used for each treatment.

44
4.1.2 Histopathological examination of livers and kidneys of rats
No signs of morphological injury or lesion were found in the liver of rats treated
with low and high doses of extracts. Normal cellular architecture with binucleated
formation around the central veins was observed and the hepatocytes were arranged in
cords (Plate 4.1a-c). These results showed that the H. erinaceus extract did not alter the
physiological activities of the liver.
Plate. 4.1: Histological sections of liver in acute toxicity test. (a) Rats treated with 5 ml/kg
vehicle (distilled water), (b) Rats treated with 2 g/kg (5 ml/kg) H. erinaceus extract,
(c) Rats treated with 5 g/kg (5 ml/kg) H. erinaceus extract. (Haematoxylin and Eosin
staining, 20x). Note the hepatocytes were arranged in cords (arrows).
The kidney of rats that were oral-administered with low and high doses of
extracts showed normal glomeruli with normal vascularity. The collecting tubules were
similar to that of control groups (Plate 4.2 a-c). The epithelial linings of both proximal
and distal tubules were of normal architecture. No signs of morphological injury or
b a
c

45
lesion were found in the kidney. These results indicated that the H. erinaceus extract did
not have toxic effects on the physiological activities of the kidney.
Plate 4.2: Histological sections of kidney in acute toxicity test. (a) Rats treated with 5 ml/kg
vehicle (distilled water), (b) Rats treated with 2 g/kg (5 ml/kg) H. erinaceus extract,
(c) Rats treated with 5 g/kg (5 ml/kg) H. erinaceus extract. (Haematoxylin and Eosin
staining, 20x). Note the normal glomeruli (arrows).
4.1.3 Hematological and clinical biochemistry
The effects of aqueous extracts of H. erinaceus on haematological parameters of
treated and control rats are presented in Table 4.1. The hematological status of rats after
14 days of oral-administration of H. erinaceus extract was not significantly (p < 0.05)
different when compared to the control group rats. Both animals and humans have
similar toxicity patterns in haematological, gastrointestinal and cardiovascular adverse
a b
c

46
effects (Oslon et al., 2000). Hematological parameters in animals are important markers
to reveal the risk of toxic as the changes in the blood system have a higher predictive
value for human toxicity. In this study, Table 4.1 shows that both sexes of rats had
increased level of Erythrocyte (RBC) in extracts group when compared to control group,
though there were no significant (p < 0.05) difference between the three groups. The
leukocyte (WBC) level in female high dose rats, 5.45 ± 0.56 (10^9/L) was higher than
in control group 4.47 ± 0.55 (10^9/L), though no significant difference were found
between groups. Further, in female rats, there was an increase trend for platelet
parameter in extracts group when compared to control group. Platelet level was 691.00
± 56.42 (10^9/L) in low dose group and 745.50 ± 33.35 (10^9/L) in high dose group.
Both groups showed higher level than rats in control group (640.33 ± 43.64 (10^9/L)).
However, there were no significant (p < 0.05) difference between the three groups.
Erythrocyte (RBC), leukocyte (WBC), or thrombocytes (platelet) are blood cells formed
during hematopoiesis process. Increased production in RBC, WBC and platelet
indicated that there was a stimulation of the hematopoiesis system (Guyton & Hall,
2006). Erythrocyte plays role in boosting the immune system, WBC defend our body
from being attack by foreign organisms and the platelets protect blood vessels from
endothelial damage as well as initiate repair of these vessels. Thus, this suggests that H.
erinaceus extract may have strong immuno-modulatory, antioxidant and endothelial
protection and repair activity. As shown in Table 4.1, there were no significant changes
(p < 0.05) in MCV, MCH, MCHC and RDW. Moreno Chulilla et al. (2009) stated that
these parameters are major indices for the basis of morphological anaemia classification.
In the present study, the extract did not significantly change the calculated RBC indices
and had minimal effect on the size of RBC and in Hb content per RBC. This shows that
H. erinaceus extracts may not have the potential to induce anaemia.
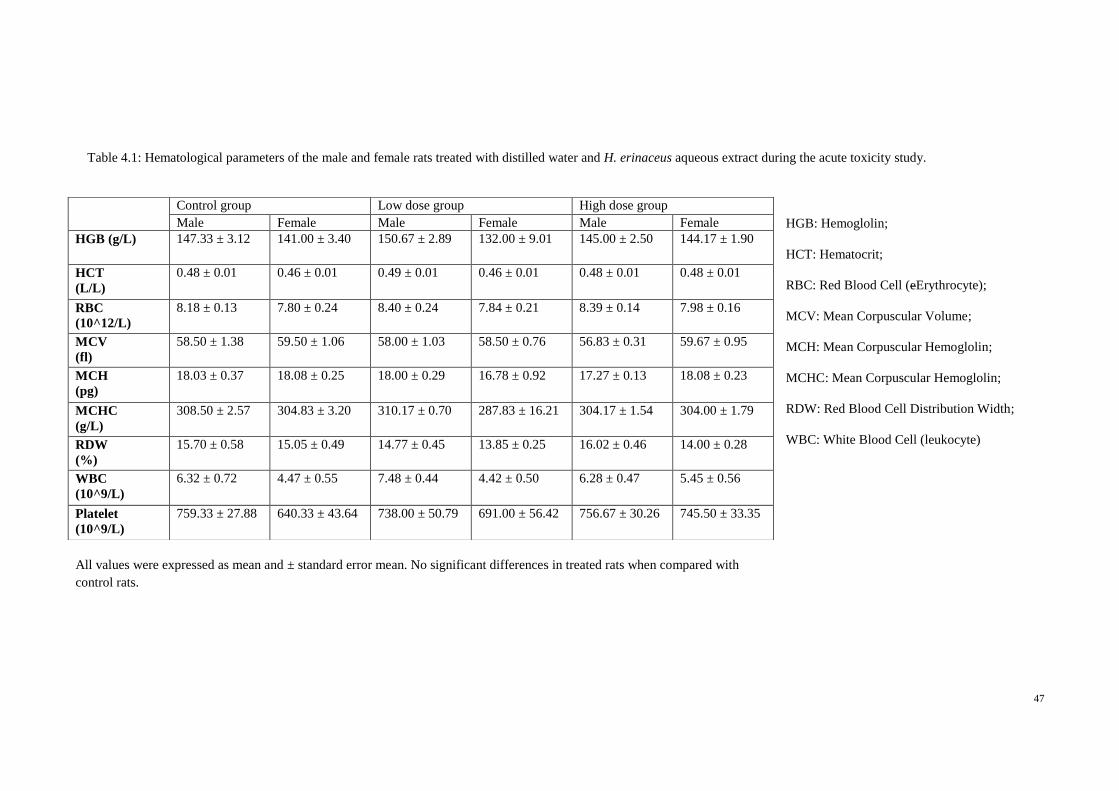
47
HGB: Hemoglolin;
HCT: Hematocrit;
RBC: Red Blood Cell (eErythrocyte);
MCV: Mean Corpuscular Volume;
MCH: Mean Corpuscular Hemoglolin;
MCHC: Mean Corpuscular Hemoglolin;
RDW: Red Blood Cell Distribution Width;
WBC: White Blood Cell (leukocyte)
Control group Low dose group High dose group
Male Female Male Female Male Female
HGB (g/L) 147.33 ± 3.12 141.00 ± 3.40 150.67 ± 2.89 132.00 ± 9.01 145.00 ± 2.50 144.17 ± 1.90
HCT
(L/L)
0.48 ± 0.01 0.46 ± 0.01 0.49 ± 0.01 0.46 ± 0.01 0.48 ± 0.01 0.48 ± 0.01
RBC
(10^12/L)
8.18 ± 0.13 7.80 ± 0.24 8.40 ± 0.24 7.84 ± 0.21 8.39 ± 0.14 7.98 ± 0.16
MCV
(fl)
58.50 ± 1.38 59.50 ± 1.06 58.00 ± 1.03 58.50 ± 0.76 56.83 ± 0.31 59.67 ± 0.95
MCH
(pg)
18.03 ± 0.37 18.08 ± 0.25 18.00 ± 0.29 16.78 ± 0.92 17.27 ± 0.13 18.08 ± 0.23
MCHC
(g/L)
308.50 ± 2.57 304.83 ± 3.20 310.17 ± 0.70 287.83 ± 16.21 304.17 ± 1.54 304.00 ± 1.79
RDW
(%)
15.70 ± 0.58 15.05 ± 0.49 14.77 ± 0.45 13.85 ± 0.25 16.02 ± 0.46 14.00 ± 0.28
WBC
(10^9/L)
6.32 ± 0.72 4.47 ± 0.55 7.48 ± 0.44 4.42 ± 0.50 6.28 ± 0.47 5.45 ± 0.56
Platelet
(10^9/L)
759.33 ± 27.88 640.33 ± 43.64 738.00 ± 50.79 691.00 ± 56.42 756.67 ± 30.26 745.50 ± 33.35
Table 4.1: Hematological parameters of the male and female rats treated with distilled water and H. erinaceus aqueous extract during the acute toxicity study.
All values were expressed as mean and ± standard error mean. No significant differences in treated rats when compared with
control rats.

48
The biochemical analyses were assessed in both female and male rats and
summarised in the Table 4.2 and 4.3. In renal function tests, there were no significant
differences between treated female rats and control rats. Further, renal profiles of male
rats were not significantly different when compared to the control except for potassium
level. Potassium level was significantly (p < 0.05) elevated when compared to the rats
in control group (4.77 ± 0.06 mmol/L). In the low dose group, the level was 5.08 ± 0.08
mmol/L whereas in the high dose group the level was 5.08 ± 0.09 mmol/L, and there was
no significant difference (p < 0.05) between the two groups (Table 4.2).
Normal renal function is related to normal concentration of potassium in serum
because more than 80% of the ingested potassium is excreted in the urine (Van Y
Persele De Strihou, 1977). Serum potassium level which showed slightly above normal
limits is a progressive sign of renal failure. However, normal architecture that was
observed in kidney (Plate 4.2 b and c) showed that H. erinaceus extracts did not affect
the kidney function when compared to normal group rats.
The observation of differences in renal function could be linked with the chronic
progressive nephropathy that may affect the Sprague-Dawley rats. Kohn and Clifford
(2002) reported that this age-related disease is more frequent in male rats. Stock animal
variations, however, may be the main factor that caused the differences in elevated
potassium levels in both groups of rats treated with low and high doses of extract.
From the renal function profile result, creatinine and urea levels in extracts
group was not significantly different (p < 0.05) when compared to the control rats.
Creatinine and urea are two important markers of kidney function (Arneson & Brickell,
2007). The insignificant changes in creatinine and urea levels implied that the activity of

49
protein metabolism was maintained within the normal range due to the non-toxic effect
of the extract.
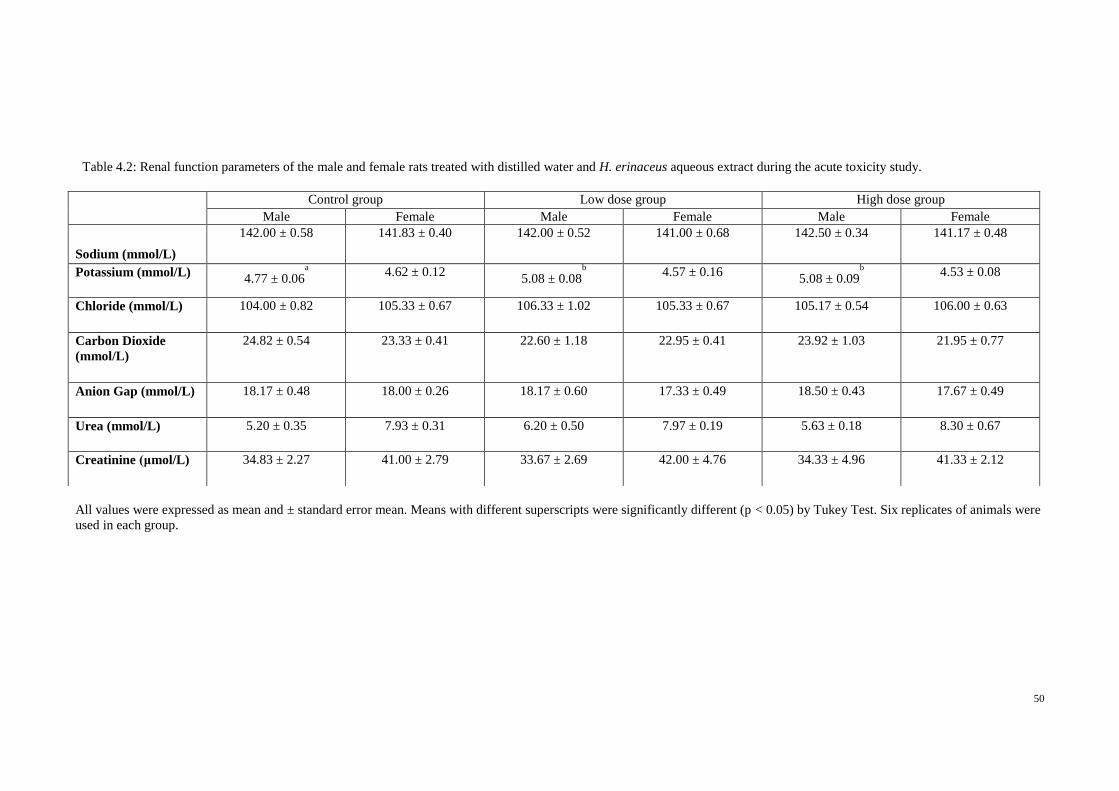
50
All values were expressed as mean and ± standard error mean. Means with different superscripts were significantly different (p < 0.05) by Tukey Test. Six replicates of animals were
used in each group.
Control group Low dose group High dose group
Male Female Male Female Male Female
Sodium (mmol/L)
142.00 ± 0.58 141.83 ± 0.40 142.00 ± 0.52 141.00 ± 0.68 142.50 ± 0.34 141.17 ± 0.48
Potassium (mmol/L) 4.77 ± 0.06
a
4.62 ± 0.12
5.08 ± 0.08b
4.57 ± 0.16
5.08 ± 0.09b
4.53 ± 0.08
Chloride (mmol/L) 104.00 ± 0.82 105.33 ± 0.67 106.33 ± 1.02 105.33 ± 0.67 105.17 ± 0.54 106.00 ± 0.63
Carbon Dioxide
(mmol/L)
24.82 ± 0.54 23.33 ± 0.41 22.60 ± 1.18 22.95 ± 0.41 23.92 ± 1.03 21.95 ± 0.77
Anion Gap (mmol/L) 18.17 ± 0.48 18.00 ± 0.26 18.17 ± 0.60 17.33 ± 0.49 18.50 ± 0.43 17.67 ± 0.49
Urea (mmol/L) 5.20 ± 0.35 7.93 ± 0.31 6.20 ± 0.50 7.97 ± 0.19 5.63 ± 0.18 8.30 ± 0.67
Creatinine (μmol/L) 34.83 ± 2.27 41.00 ± 2.79 33.67 ± 2.69 42.00 ± 4.76 34.33 ± 4.96 41.33 ± 2.12
Table 4.2: Renal function parameters of the male and female rats treated with distilled water and H. erinaceus aqueous extract during the acute toxicity study.
51
For the evaluation of liver function, as shown in Table 4.3, male rats showed
significant difference (p < 0.05) in alanine aminotransferase (ALT). Control group had
the highest ALT value (51.83 ± 1.92 IU/L) when compared to low dose group (48.00 ±
0.58 IU/L) and high dose group (46.50 ± 1.45 IU/L) whereas in female rats, there was
significant difference (p < 0.05) in alkaline phosphatase (ALP) compared control group
(114.83±10.10 IU/L) and low dose group (72.83 ± 5.16 IU/L) (Table 4.3). From the
result, male rats treated with low dose extract had higher ALP level (163.17 ± 15.40
IU/L) than control group (153.00 ± 15.14 IU/L), followed by high dose group (135.00 ±
9.04 IU/L). However, there was no significant difference (p < 0.05) between the three
groups. The variation of liver linked enzymatic activity could be associated of age, sex
and other factors (i.e. diets) (Braun et al., 1993). However, the ALP variation is well
related to the (6-8 weeks) age of animals and especially with the higher bone
metabolism in younger ones.
Table 4.3 shows that both sexes of rats showed increased trend in AST level in
H. erinaceus extract groups when compared to control group. However, there was no
significant difference (p < 0.05) between the groups. Both sexes of rats had the lowest
AST level in control group. In male rats, low dose group had the highest AST level
(181.83 ± 5.48 IU/L), followed by high dose group (175.83 ± 8.51 IU/L). Female rats in
low dose group had 172.17 ± 10.35 IU/L, whereby the level of AST in high dose group
increased by 10 IU/L, which is 182.83 ± 5.61 IU/L.
As shown in Table 4.3, male control rats had same G-Glutamyl Transferase
level with male rats treated with high dose of extract (3.17 ± 0.17 IU/L), and both
groups showed lower level than low dose groups (3.67 ± 0.42 IU/L). However, all three
groups showed no significant difference (p < 0.05). In contrast to male group, female
control group had the highest G-Glutamyl Transferase level (3.67 ± 0.33 IU/L),
followed by low dose group (3.50 ± 0.50 IU/L) and high dose group (3.00 ± 0.00 IU/L).

52
Both groups did not show significant difference though there were changes in the
groups.

53
All values were expressed as mean and ± standard error mean. Means with different superscripts were significantly different (p < 0.05) by Tukey Test. Six replicates of animals were
used in each group.
Control group Low dose group High dose group
Male Female Male Female Male Female
Total Protein (g/L) 61.33 ± 1.15 64.33 ± 1.26 57.83 ± 0.65 63.33 ± 1.17 60.17 ± 1.01 65.00 ± 0.68
Albumin (g/L) 9.83 ± 0.48 11.17 ± 0.17 8.67 ± 0.33 11.00 ± 0.45 9.83 ± 0.48 11.50 ± 0.43
Globulin (g/L) 51.50 ± 1.09 53.17 ± 1.28 49.17 ± 0.60 52.33 ± 1.26 50.33 ± 1.09 53.50 ± 0.72
Total Bilirubin (μmol/L) 2.17 ± 0.17 2.00 ± 0.00 2.00 ± 0.00 2.00 ± 0.00 2.00 ± 0.00 2.00 ± 0.00
Conjugated Bilirubin (μmol/L) 1.00 ± 0.00 1.00 ± 0.00 1.00 ± 0.00 1.00 ± 0.00 1.00 ± 0.00 1.00 ± 0.00
Alkaline Phosphatase (IU/L) 153.00 ± 15.14 114.83 ± 10.10b 163.17 ± 15.40 72.83 ± 5.16
a 135.00 ± 9.04 94.00 ± 7.15
ab
Alanine Aminotransferase (IU/L) 51.83 ± 1.92b 43.17 ± 1.94 48.00 ± 0.58
ab 39.67 ± 2.70 46.50 ± 1.45
a 44.50 ± 1.88
AST (IU/L) 171.50 ± 7.13 171.33 ± 6.84 181.83 ± 5.48 172.17 ± 10.35 175.83 ± 8.51 182.83 ± 5.61
G-Glutamyl Transferase (IU/L) 3.17 ± 0.17 3.67 ± 0.33 3.67 ± 0.42 3.50 ± 0.50 3.17 ± 0.17 3.00 ± 0.00
Table 4.3: Liver function parameters of the male and female rats treated with distilled water and H. erinaceus aqueous extract during the acute toxicity study.
54
Among the biochemical parameters tested, AST, ALT and ALP are considered
as important markers of liver function (Arneson & Brickell, 2007; and Obici et al.,
2008). Rise of AST and ALT level in serum level are indicators for hepatocellular
damage. Aniagu et al. (2004) stated that ALT enzyme is considered a more sensitive
marker of hepatocellular damage than AST because ALT is localized in the cytosol of
hepatocytes and provides a quantitative evaluation of the degree of damage sustained by
the liver.
Increase in ALP level is often linked with various disorders such as extra-
hepatic bile obstruction, intra-hepatic cholestasis, infiltrative liver disease, hepatitis and
bone diseases (Adinortey et al., 2012). However, increase of ALP in less than three
times the normal level is considered non-specific and will not affect the normal activity
of liver (Rosalki & Mcintyre, 1999; and Pagana & Pagana, 2003). Mukherjee (2005)
demonstrated that extremely high ALP level in serum is seen in cases of obstructive
jaundice and biliary cirrhosis. Both ALP and GGT levels are expected to be high if
there is bile duct obstruction in liver. Since there were no significant changes (p < 0.05)
in both ALP and GGT levels, this indicated that normal liver function was observed
after administration of H. erinaceus extract. This result correlated with findings from
histopathological examination of the liver, as it showed normal cellular architecture.
Bilirubin is a major breakdown product of haemoglobin. Therefore, bilirubin
level in serum is considered an indicator of liver function because it shows that the liver
possesses ability to take up, process and secrete bilirubin into the bile (Abotsi et al.,
2011). Table 4.3 reveals that both sexes of rats showed no significant difference (p <
0.05) and change in total bilirubin and conjugated bilirubin between control and extract
groups. From the results, H. erinaceus extract did not show any adverse effects on
hepatic metabolism or bililary secretion.

55
Plasma proteins such as total protein, albumin and globulin are produced by
liver. After 14 days of H. erinaceus extract administration, the level of total protein,
albumin and globulin in extract treated groups were not significantly different (p < 0.05)
when compared to the control group. Therefore, administration of H. erinaceus extracts
did not affect the production of plasma protein in liver.
In the present study, the H. erinaceus extract did not affect the clinical
biochemistry parameters and body weight. Further, histological evaluation showed no
signs of toxicity. Therefore, the extract was considered safe at concentrations tested.
There were no signs of acute toxicity and the oral lethal dose (LD50) for the male and
female rats was greater than 5 g/kg body weight.
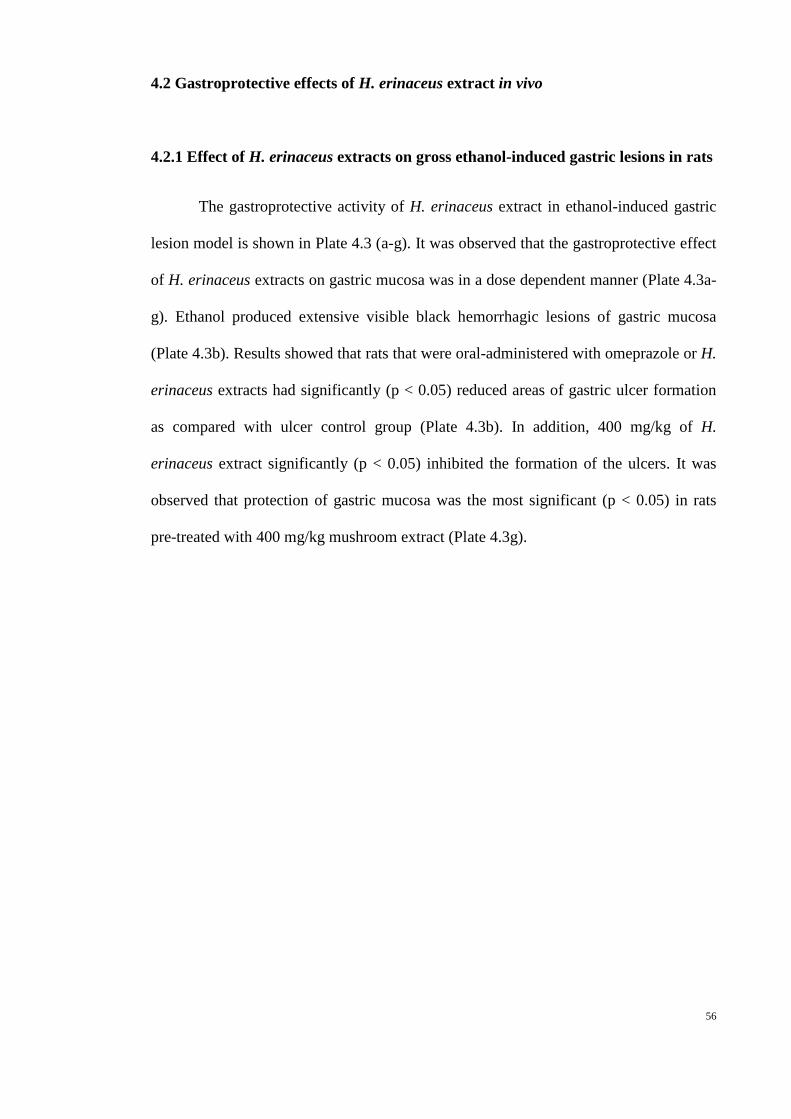
56
4.2 Gastroprotective effects of H. erinaceus extract in vivo
4.2.1 Effect of H. erinaceus extracts on gross ethanol-induced gastric lesions in rats
The gastroprotective activity of H. erinaceus extract in ethanol-induced gastric
lesion model is shown in Plate 4.3 (a-g). It was observed that the gastroprotective effect
of H. erinaceus extracts on gastric mucosa was in a dose dependent manner (Plate 4.3a-
g). Ethanol produced extensive visible black hemorrhagic lesions of gastric mucosa
(Plate 4.3b). Results showed that rats that were oral-administered with omeprazole or H.
erinaceus extracts had significantly (p < 0.05) reduced areas of gastric ulcer formation
as compared with ulcer control group (Plate 4.3b). In addition, 400 mg/kg of H.
erinaceus extract significantly (p < 0.05) inhibited the formation of the ulcers. It was
observed that protection of gastric mucosa was the most significant (p < 0.05) in rats
pre-treated with 400 mg/kg mushroom extract (Plate 4.3g).

57
a b c
d e f g
Plate 4.3: Gross appearance of the gastric mucosa in rats with ethanol-induced ulcers. (a) Rats pre-treated with 5ml/kg distilled water (normal control).
No injuries to the gastric mucosa are observed. (b) Rats pre-treated with 5ml/kg distilled water (ulcer control). Severe injuries are observed in the gastric
mucosa. Ethanol produced extensive visible hemorrhagic necrosis (arrow) of gastric mucosa. (c) Rats pre-treated with omeprazole (20mg/kg). Injuries to the
gastric mucosa are milder compared to the injuries seen in the ulcer control rats. (d). Rats pre-treated with H. erinaceus extract (50 mg/kg). Moderate injuries
are seen in the gastric mucosa. The extract inhibits the formation of gastric lesions induced by ethanol. (e). Rats pre-treated with H. erinaceus extract
(100 mg/kg).Moderate injuries are seen in the gastric mucosa. The extract inhibits the formation of gastric lesions induced by ethanol (f). Rats pre-treated
with H. erinaceus extract (200 mg/kg). Mild injuries are seen in the gastric mucosa. The extract reduces the formation of gastric lesions induced by ethanol.
(g) Rats pre-treated with 400 mg/kg of H. erinaceus extract. Very mild injuries (arrow) to the gastric mucosa are seen.

58
4.2.2 Effect of H. erinaceus on ulcer area and ulcer inhibition in gastric glandular
tissue of rats
Ulcer in gastric glandular tissue of pre-treatment ulcer control group (distilled
water) showed severe mucosal injury (Figure 4.3), whereas the rats pre-treated with
omeprazole (20mg/kg) or H. erinaceus extract (50, 100, 200, and 400mg/kg) showed
significantly (p < 0.05) decreased area of gastric lesion formation compared to pre-
treatment with ulcer control group. Hericium erinaceus extract significantly prevented
the formation of ulcer, in a dose-dependant manner. Ulcer control group had the largest
ulcer area (894.00 ± 36.69 mm2), rats that were treated with H. erinaceus extract at a
dose of 50mg/kg had 727.20 ± 26.88 mm2 of ulcer area, followed by 602.40 ± 29.43
mm2 with 100mg/kg of H. erinaceus extract. The inhibition of ulcer was significant (p <
0.05) when compared to the standard drug group. There was, however, no significant
difference (p < 0.05) between the highest dosage of extract (240.00 ± 17.31 mm2),
400mg/kg and the standard drug omeprazole group (285.6 mm2). Ulcer areas in rats
treated with 50mg/kg of H. erinaceus extract (727.20 ± 26.88 mm2) were three times
larger than rats treated with 400mg/kg H. erinaceus extract (240.00 ± 17.31 mm2).
Higher doses of extract gave better protection against the formation of the ulcers
induced by ethanol.

59
Figure 4.3: Effect of H. erinaceus extract on ulcer area in ethanol induced ulcers in rats. All values were
expressed as mean of six replicate values. Means with different letters were significantly different
(p < 0.05) by Tukey Test. Six replicates animals were in each treatment group.
Figure 4.4 showed the ulcer inhibition percentage for seven different groups of
treatment. As shown in Figure 4.4, inhibition percentage of ulcer of H. erinaceus
extracts was increased in a dose dependent manner. Pre-treatment with H. erinaceus
extract (400mg/kg) exhibited the highest inhibition percentage of ulcer area formation,
at 72.97%, followed by omeprazole (67.45%), 200mg/kg (48.6%), 100mg/kg (32.17%)
and 50mg/kg (18.14%). Inhibition percentage of ulcer in omeprazole group (67.45%)
was comparable to 400mg/kg extract group (72.97%).
e
a a
d
c
b
60
Figure 4.4: Inhibitory (%) effect of H. erinaceus extract on ethanol-induced ulcer in rats. All values were
expressed as mean of six replicate values. Means with different letters were significantly different (p <
0.05) by Tukey Test. Six animals were used in each treatment group.
Ethanol-induced gastric ulcer has been widely used for the experimental
evaluation of anti-ulcer activity. Gastric lesions produced by ethanol administration
appeared as multiple haemorrhagic red bands of different sizes along the glandular
stomach. Szabo et al. (1995) suggest that the ethanol damage to the gastrointestinal
mucosa starts with microvascular injury, namely disruption of the vascular endothelium
resulting in increased vascular permeability, edema formation and epithelial lifting.
Ethanol produces necrotic lesions in the gastric mucosa by its direct toxic effect,
reducing the secretion of bicarbonates and production of mucus (Marhuenda et al.,
1993). Exposure to ethanol increases the extension of cellular damage in a dose-
dependent way (Mutoh et al., 1990). The H. erinaceus extract at a dose of 400 mg/kg
gave a 72.93% of ulcer inhibition of the gastric mucosa. This indicated that this
mushroom possessed protective action on the gastric mucosa (Figure 4.4). This result
also suggested a possible cytoprotective activity, since ethanol acts directly on gastric
61
mucosal cells. It is well known that ethanol induced gastric ulcers are not inhibited by
anti-secretory agents such as cimetidine. Thus, omeprazole, one of the proton pump
inhibitors, was being used in current study as a control.
4.2.3 Effect of H. erinaceus on mucus production in gastric glandular tissue of rats
The mucus weight of the stomach was measured in all test groups of rats, the
mucus content (g) in the positive control group, administered with omeprazole had a
higher mucus weight of 1.56 ± 0.07 g as compared to all treated rats (Figure 4.5). Rats
that were orally administered with ethanol had significantly (p < 0.05) lower mucus
weight (0.79 ± 0.03 g) when compared to rats in positive group. However, there was no
significant (p < 0.05) difference between groups treated with H. erinaceus extract at
concentration of 50, 100, and 200 mg/kg (Figure 4.5).
Rats in non-treated group that were only administered with distilled water had
significantly (p < 0.05) lower mucus weight (0.43 ± 0.06 g) as compared to animals
with ulcer induced by ethanol. This suggested that tissue damage in the stomach would
increase the production of mucus weight. To regain the balance, drugs of plant origin
were investigated to inhibit the gastric acid secretion or to activate the mucosal defence
mechanism by increasing mucus production (Borrelli & Izzo, 2000). The results of this
study have revealed that the H. erinaceus extracts were able to stimulate the increase
amount of mucus that can protect stomach against the formation of ulcer induced by
ethanol.

62
Figure 4.5: Effect of H. erinaceus extract on mucus production in rats with ethanol induced ulcers.
All values were expressed as mean of six replicate values. Means with different letters were
significantly different (p < 0.05) by Tukey Test. Six animals were in each treatment group.
It was demonstrated that ulceration induced by ethanol is associated with
diminished protective factors of the mucosa such as prostaglandin and mucus (Konturek
et al., 2005). In light of this, the gastroprotective activity of H. erinaceus may be
attributed to the mucosal protective factor as mucus production increased with
increasing concentration of extracts. Davenport (1968) reported that the mucus of the
gastric wall is thought to play an important role as a defensive factor against
gastrointestinal damage. From our results, pre-treatment with H. erinaceus aqueous
extract significantly (p < 0.05) increased the gastric mucus production (Figure 4.5). This
showed that H. erinaceus aqueous extract may play role in the preservation of gastric
mucus secretion. Mucus is a viscous, elastic, adherent and transparent gel comprised of
95% water and 5% glycoprotein. Glycoprotein present in mucus is an important
a
b
d
b b b
c

63
protective factor for the gastric mucosa because glycoprotein functions as antioxidant,
reducing damage in the mucosa induced by free radicals (Repetto & Llesuy, 2002).
4.2.4 Effect of H. erinaceus in gastric barrier mucus production in gastric
glandular tissue of rats with ethanol-induced ulcer
The effect of distilled water (5 ml/kg), omeprazole (20 mg/kg), and different
dosage of H. erinaceus extracts (50, 100,200, 400 mg/kg) on gastric barrier mucus in
gastric ulcer rats induced by ethanol are shown in Figure 4.6. The alcian blue binding
capacity in ulcer control group (3.42 ± 0.13 µg/g) was siginificantly (p < 0.05) lower
than in the non-treated rats (5.01 ± 0.46 µg/g) and rats pre-treated with omeprazole and
H. erinaceus extracts. Omeprazole treated group (6.73 ± 0.67 µg/g) had a significant
lower amount of gastric mucus as compared to H. erinaceus extract groups. It was
observed that the amount of gastric mucus in rats treated by H. erinaceus extracts
groups was increased in a dose dependent manner. The binding capacity, however,
decreased at dosage 400 mg/kg (10.64 ± 0.90 µg/g).
These results revealed that ethanol inhibited gastric mucus secretion. Similar
result was reported in García-Barrantes and Badilla (2011). They had demonstrated that
the binding capacity of alcian blue increased in a dose dependent manner in pylorus-
ligated rats.

64
Figure 4.6: Effect of H. erinaceus extract on gastric barrier mucus in rats with ethanol induced ulcers. All
values were expressed as mean of six replicate valus. Means with different letters were significantly
different (p < 0.05) by Tukey Test. Six replicates animals were in each treatment group.
Gastric barrier mucus plays important role in gastroprotection (Kaunitz, 1999).
Pre-treatment with H. erinaceus aqueous extract significantly (p < 0.05) increased the
mucoprotective effect. The free mucus was significantly increased as compared to the
mucus barrier of ulcer control animals (p < 0.05). This mucus comprises of mucin-type
glycoprotein, which can be detected by a colour dye called alcian blue (Bolton et al.,
1978). Alcian blue dye is able to bind to negatively charged materials. The mucus gel
adhering to the gastric mucosal surface protects the underlying epithelium against acid,
pepsin and necrotizing agents such as ethanol and indomethacin (Alqasoumi et al.,
2008). In addition, Allen and Flemström (2005) demonstrated that gastric wall mucus
plays crucial role in the defence of the gastric mucosa against aggression of chemical or
mechanical factors compared to the soluble mucus in the lumen of the stomach. Gastric
wall mucus coating may enhance the repair of the damaged gastric epithelium (Shih et
ab
a
bc
cd
e
e
de

65
al., 2005). Hence, the increase of alcian blue binding capacity to gastric wall mucus
suggested the involvement of H. erinaceus aqueous extract in process of mucosal
adaptation by increasing the secretion of mucus in stomach of rats.
4.2.5 Histological evaluation of gastric lesions in stomachs of control and treated
rats
Histological observation of ethanol induced gastric lesions in ulcer control group
pre-treated with sterile distilled water (ulcer control group), showed comparatively
extensive damage to the gastric mucosa and necrotic lesions penetrate deeply into
mucosa, and extensive oedema and leucocytes infiltration of the submucosal layer were
observed (Plate 4.4). Rats that were pre-treated with H. erinaceus extract had
comparatively better protection of the gastric mucosa as seen by reduction or absence of
ulcer area, reduced or absence of submucosal edema and leucocytes infiltration (Plate
4.4). Hericium erinaceus extract has been shown to have the cytoprotective effects in a
dose-dependent manner. Previous studies that using mushroom extracts in
gastroprotective did not evaluate on histological test.

66
a b c
d e f g
Plate 4.4: Histological study of ethanol-induced gastric mucosal damage in rats. (a) Rats pre-treated with 5ml/kg distilled water (normal control group). No injuries
to the gastric mucosa are seen. (b) Rats pre-treated with 5ml/kg ethanol (ulcer control group). There is severe disruption to the surface epithelium and necrotic
lesions penetrating deeply into mucosa and extensive edema of submucosa layer and leucocytes infiltration is present. (c) Rats pre-treated with omeprazole (20mg/kg).
Mild disruption of the surface epithelium mucosa is seen. There is edema and leucocytes infiltration of the submucosal layer. (d) Rat pre-treated with H. erinaceus
extract (50 mg/kg). Moderate disruption of surface epithelium is present. There is leucocytes infiltration in submucosal layer. (e) Rats pre-treated with H. erinaceus
extract (100 mg/kg). There is mild disruption to the surface epithelium. There is edema with leucocytes infiltration of the submucosal layer. (f). Rats pre-treated
with H. erinaceus extract (200 mg/kg). There is mild disruption to the surface epithelium. There is edema and leucocytes infiltration of the submucosal layer.
(g) Rats pre-treated with H. erinaceus extract (400 mg/kg). There is no disruption to the surface epithelium and no edema or leucocytes infiltration of the submucosal
layer (H&E stain 10× magnification). Notice leucocytes infiltration in submucosal layer (arrows).

67
Results of the present study showed protection of gastric mucosa and inhibition
of leucocytes infiltration of gastric wall in rats pre-treated with H. erinaceus extract.
Cheng and Koo (2000) demonstrated that pre-treatment with plant extract before
ethanol administration significantly decreased neutrophil infiltration of gastric mucosa.
While, Shimizu et al. (2000) had shown that the decrease in neutrophil infiltration into
ulcerated gastric tissue promotes the healing of gastric ulcers in rats. Ethanol damaged
the gastric mucosa and increased neutrophil infiltration into the gastric mucosa.
Neutrophils play role in prevention of infection, destroy and remove bacteria as well as
damage tissue by phagocytosis. Tsukimi et al. (1996) found that suppression of
neutrophil infiltration during inflammation could enhance gastric ulcer healing. From
the current study, H. erinaceus extract may possess anti-inflammatory activity too that
protects against gastromucosa damage.
4.2.6 Immunohistochemistry analysis in the stomach of rats in ethanol-induced
ulcer
Immunohistochemical results showed that rats pre-treated with H. erinaceus
extract prior to ethanol administration expressed HSP70 protein in high level (Plate 4.5).
In contrast, expression of HSP70 protein in ethanol-induced gastric tissues (ulcer
control group) was found to be down regulated compared to HSP70 (70 kilodalton heat
shock proteins) expression in H. erinaceus extract treated group (Plate 4.5).
Immunohistochemical staining of Bax protein showed that pre-treatment of ethanol-
induced ulcer with H. erinaceus extract caused down-regulation of Bax protein (Plate
4.5). Furthermore, up-regulation of Bax in ulcer control group was observed as
compared to H. erinaceus extract-treated group (Plate 4.5).

68
Normal control group Ulcer control group Omeprazole group Extract 50mg/kg Extract 100mg/kg Extract 200mg/kg Extract 400mg/kg
Plate 4.5: Immunohistochemical analysis of expression of HSP and Bax proteins in the stomach of rats in ethanol-induced gastric ulcer. Immunohistochemistry
staining of HSP70 and Bax proteins showed up-regulation of HSP70 protein and down-regulation of Bax protein in rats pretreated with H. erinaceus extract
(magnification 20×).
HSP
Bax
69
In the present study, there was up-regulation of heat shock protein 70 (HSP70)
in the ulcerated mucosa of the group treated with H. erinaceus extract (Plate 4.5). This
finding affirms previous studies which showed an increase in HSP70 expression after
the damage of the gastric mucosa (Hirakawa et al., 1996; and Schichijo et al., 2003).
Qiao et al. (2011) also demonstrated that Bax protein was expressed in gastric ischemia-
reperfusion of rats. The level of Bax protein increased in early stage of reperfusion,
reached its peak at one hour of reperfusion, and decreased gradually after that.
Apoptosis and proliferation are basic mechanisms for cell death and survival and
differentiation in the gastric mucosa. Up-regulation of Bax protein induced apoptosis
and inhibited proliferation. Based on the results, extracts of H. erinaceus may have the
ability to suppress and inhibit synthesis of Bax protein which may lead to the protection
of the mushroom extract against irritants in stomach.
Heat shock proteins, (HSPs) play important roles in normal conditions and
pathological situations involving both systemic and cellular stress. It have strong
cytoprotective effects, are involved in many regulatory pathways, and act as molecular
chaperones for preserving important cellular proteins (Hightower, 1991; and Arya et al.,
2007). In the gastric mucosa, it has been shown that HSP70 had important
cytoprotective function in in vitro and in vivo (Nakamura et al., 1991; and Itoh &
Noguchi, 2000). Our results show significant expression of HSP70 in pre-treated
mushroom extract. The HSP70 family functions as a molecular chaperone and reduces
stress-induced denaturation and aggregation of intracellular proteins. Reactive oxygen
species (ROS) generated by ethanol suppresses the expression of HSP and increase the
expression of Bax protein. HSP70 proteins protect cells from oxidative stress or heat
shock. The over expression of HSP70 that was observed in this study could indicate that
H. erinaceus extract protected the gastric tissues through the upregulation of HSP70.
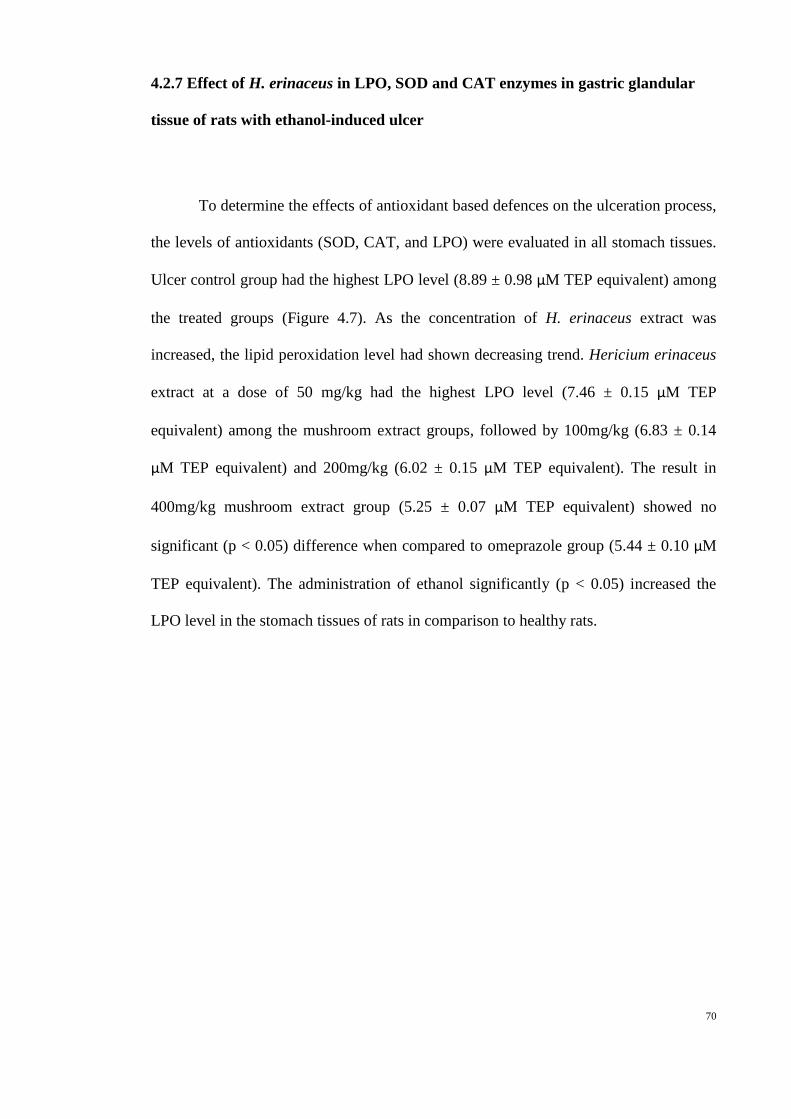
70
4.2.7 Effect of H. erinaceus in LPO, SOD and CAT enzymes in gastric glandular
tissue of rats with ethanol-induced ulcer
To determine the effects of antioxidant based defences on the ulceration process,
the levels of antioxidants (SOD, CAT, and LPO) were evaluated in all stomach tissues.
Ulcer control group had the highest LPO level (8.89 ± 0.98 µM TEP equivalent) among
the treated groups (Figure 4.7). As the concentration of H. erinaceus extract was
increased, the lipid peroxidation level had shown decreasing trend. Hericium erinaceus
extract at a dose of 50 mg/kg had the highest LPO level (7.46 ± 0.15 µM TEP
equivalent) among the mushroom extract groups, followed by 100mg/kg (6.83 ± 0.14
µM TEP equivalent) and 200mg/kg (6.02 ± 0.15 µM TEP equivalent). The result in
400mg/kg mushroom extract group (5.25 ± 0.07 µM TEP equivalent) showed no
significant (p < 0.05) difference when compared to omeprazole group (5.44 ± 0.10 µM
TEP equivalent). The administration of ethanol significantly (p < 0.05) increased the
LPO level in the stomach tissues of rats in comparison to healthy rats.
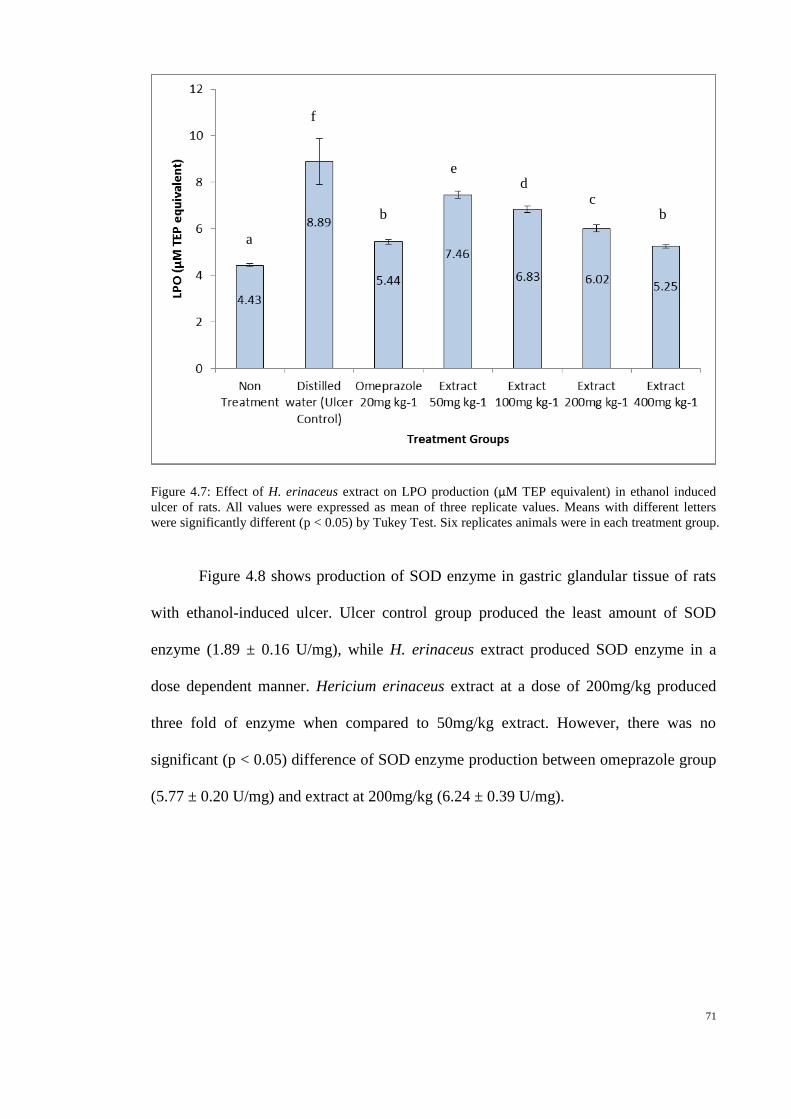
71
Figure 4.7: Effect of H. erinaceus extract on LPO production (µM TEP equivalent) in ethanol induced
ulcer of rats. All values were expressed as mean of three replicate values. Means with different letters
were significantly different (p < 0.05) by Tukey Test. Six replicates animals were in each treatment group.
Figure 4.8 shows production of SOD enzyme in gastric glandular tissue of rats
with ethanol-induced ulcer. Ulcer control group produced the least amount of SOD
enzyme (1.89 ± 0.16 U/mg), while H. erinaceus extract produced SOD enzyme in a
dose dependent manner. Hericium erinaceus extract at a dose of 200mg/kg produced
three fold of enzyme when compared to 50mg/kg extract. However, there was no
significant (p < 0.05) difference of SOD enzyme production between omeprazole group
(5.77 ± 0.20 U/mg) and extract at 200mg/kg (6.24 ± 0.39 U/mg).
a
f
b
e d
c b

72
Figure 4.8: Effect of H. erinaceus extract on SOD production (U/mg of protein) in ethanol induced ulcer
of rats. All values were expressed as mean of three replicate values. Means with different letters were
significantly different (P < 0.05) by ANOVA Test. Six replicates animals were in each treatment group.
Catalase enzyme production in stomach of rats with ethanol-induced ulcer is
shown in Figure 4.9. Hericium erinaceus extract at a dose of 50mg/kg showed the least
production of catalase enzyme (40.45 ± 2.71 U/mg), whereas non-treatment group had
the highest production of catalase enzyme (179.24 ± 11.89 U/mg). Mushroom extract
produced catalase enzyme in a dose dependent manner, whereas extract at a dose of
200mg/kg produced the highest amount (135.94 ± 6.54 U/mg) of catalase enzyme
among the mushroom extract groups. This was significantly higher (p < 0.05) when
compared to rats treated with omeprazole and other doses of mushroom extracts.
a a
b
d
c
c
bc
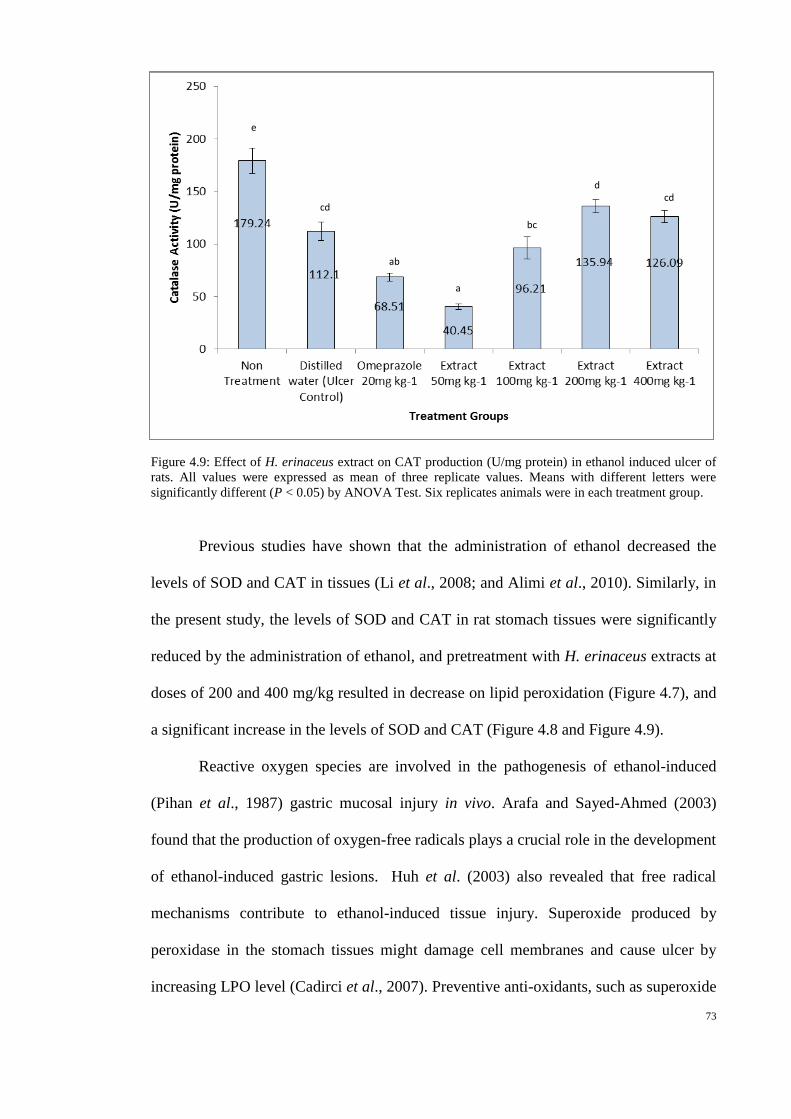
73
Figure 4.9: Effect of H. erinaceus extract on CAT production (U/mg protein) in ethanol induced ulcer of
rats. All values were expressed as mean of three replicate values. Means with different letters were
significantly different (P < 0.05) by ANOVA Test. Six replicates animals were in each treatment group.
Previous studies have shown that the administration of ethanol decreased the
levels of SOD and CAT in tissues (Li et al., 2008; and Alimi et al., 2010). Similarly, in
the present study, the levels of SOD and CAT in rat stomach tissues were significantly
reduced by the administration of ethanol, and pretreatment with H. erinaceus extracts at
doses of 200 and 400 mg/kg resulted in decrease on lipid peroxidation (Figure 4.7), and
a significant increase in the levels of SOD and CAT (Figure 4.8 and Figure 4.9).
Reactive oxygen species are involved in the pathogenesis of ethanol-induced
(Pihan et al., 1987) gastric mucosal injury in vivo. Arafa and Sayed-Ahmed (2003)
found that the production of oxygen-free radicals plays a crucial role in the development
of ethanol-induced gastric lesions. Huh et al. (2003) also revealed that free radical
mechanisms contribute to ethanol-induced tissue injury. Superoxide produced by
peroxidase in the stomach tissues might damage cell membranes and cause ulcer by
increasing LPO level (Cadirci et al., 2007). Preventive anti-oxidants, such as superoxide
e
cd
ab
a
bc
d cd
74
dismutase (SOD) and catalase (CAT) enzymes are the first line of defence against
reactive oxygen species.
SOD scavenges the super oxide radical O2−, one of the reactive oxygen species
(ROS) responsible for lipid peroxidation (Fridovich, 1978). This reaction leads to an
increase in the generation of peroxyl radical H2O2−, which is also capable of producing
more oxidative damage (Das et al., 1997). Catalase and other peroxidases further reduce
H2O2−. In the present study, pre-treatment with H. erinaceus aqueous extract
significantly decreased LPO and increased SOD and CAT, which indicates its efficacy
in preventing free radical-induced damage.
A previous study had demonstrated that basidiocarp of H. erinaceus possess
antioxidant properties (Wong et al., 2009a). It is probably due to the antioxidant
property of H. erinaceus that could be linked to its gastroprotective effect. These
findings reveal that H. erinaceus aqueous extract could have components that prevented
the formation of ulcer or reduced the severity of ulcer induced by ethanol. Because of
their antioxidant properties as shown in the present study, their capacity to protect the
mucosal tissue and their ability to prevent the depletion of antioxidant enzymes it is
clear that H. erinaceus aqueous extract have gastroprotective activity.
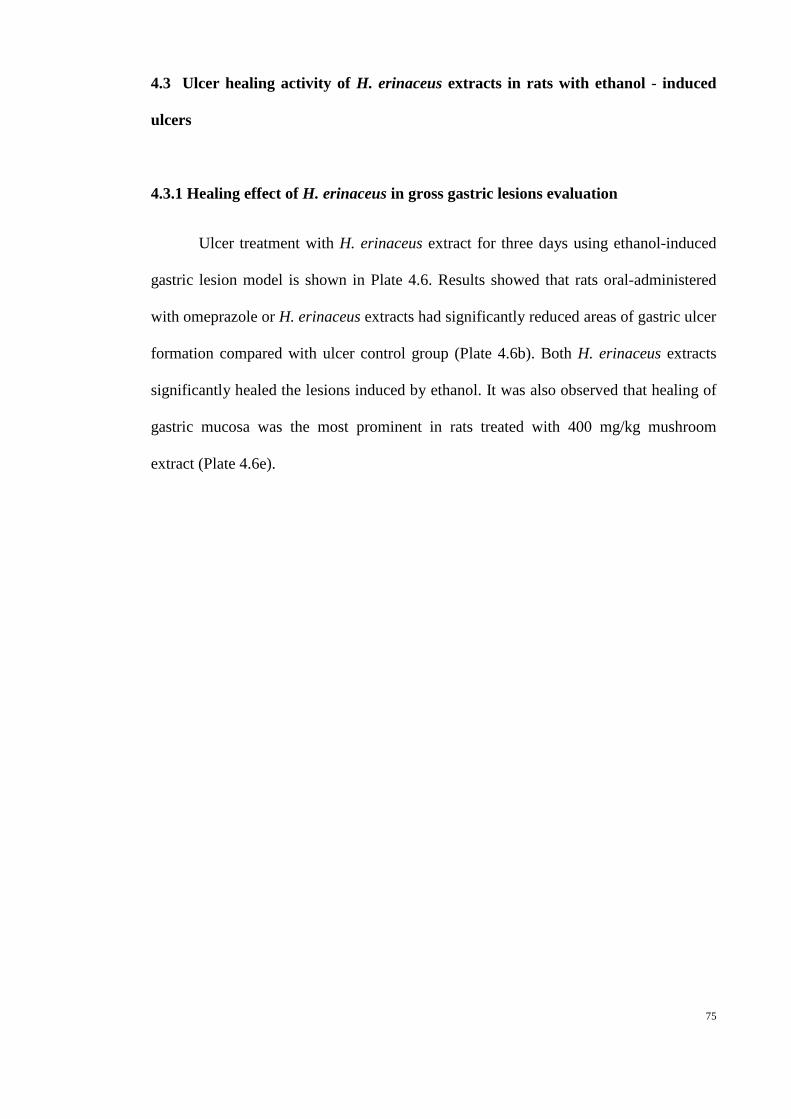
75
4.3 Ulcer healing activity of H. erinaceus extracts in rats with ethanol - induced
ulcers
4.3.1 Healing effect of H. erinaceus in gross gastric lesions evaluation
Ulcer treatment with H. erinaceus extract for three days using ethanol-induced
gastric lesion model is shown in Plate 4.6. Results showed that rats oral-administered
with omeprazole or H. erinaceus extracts had significantly reduced areas of gastric ulcer
formation compared with ulcer control group (Plate 4.6b). Both H. erinaceus extracts
significantly healed the lesions induced by ethanol. It was also observed that healing of
gastric mucosa was the most prominent in rats treated with 400 mg/kg mushroom
extract (Plate 4.6e).
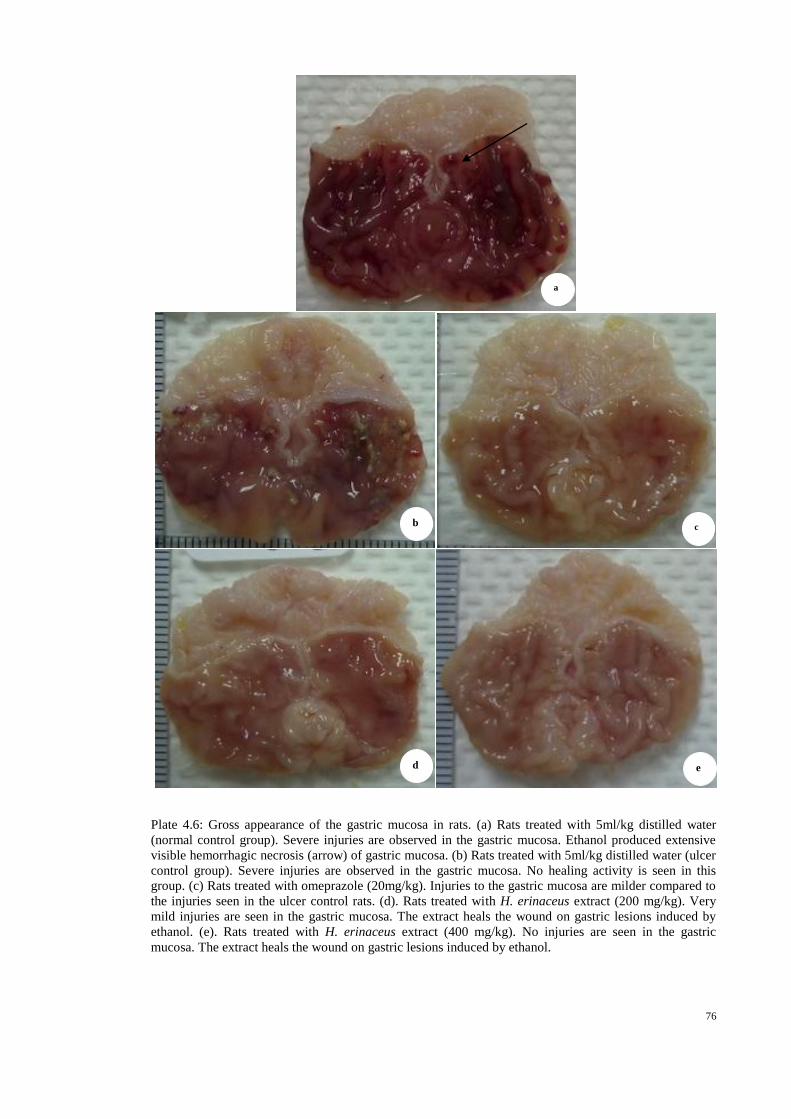
76
Plate 4.6: Gross appearance of the gastric mucosa in rats. (a) Rats treated with 5ml/kg distilled water
(normal control group). Severe injuries are observed in the gastric mucosa. Ethanol produced extensive
visible hemorrhagic necrosis (arrow) of gastric mucosa. (b) Rats treated with 5ml/kg distilled water (ulcer
control group). Severe injuries are observed in the gastric mucosa. No healing activity is seen in this
group. (c) Rats treated with omeprazole (20mg/kg). Injuries to the gastric mucosa are milder compared to
the injuries seen in the ulcer control rats. (d). Rats treated with H. erinaceus extract (200 mg/kg). Very
mild injuries are seen in the gastric mucosa. The extract heals the wound on gastric lesions induced by
ethanol. (e). Rats treated with H. erinaceus extract (400 mg/kg). No injuries are seen in the gastric
mucosa. The extract heals the wound on gastric lesions induced by ethanol.
a
b c
d e
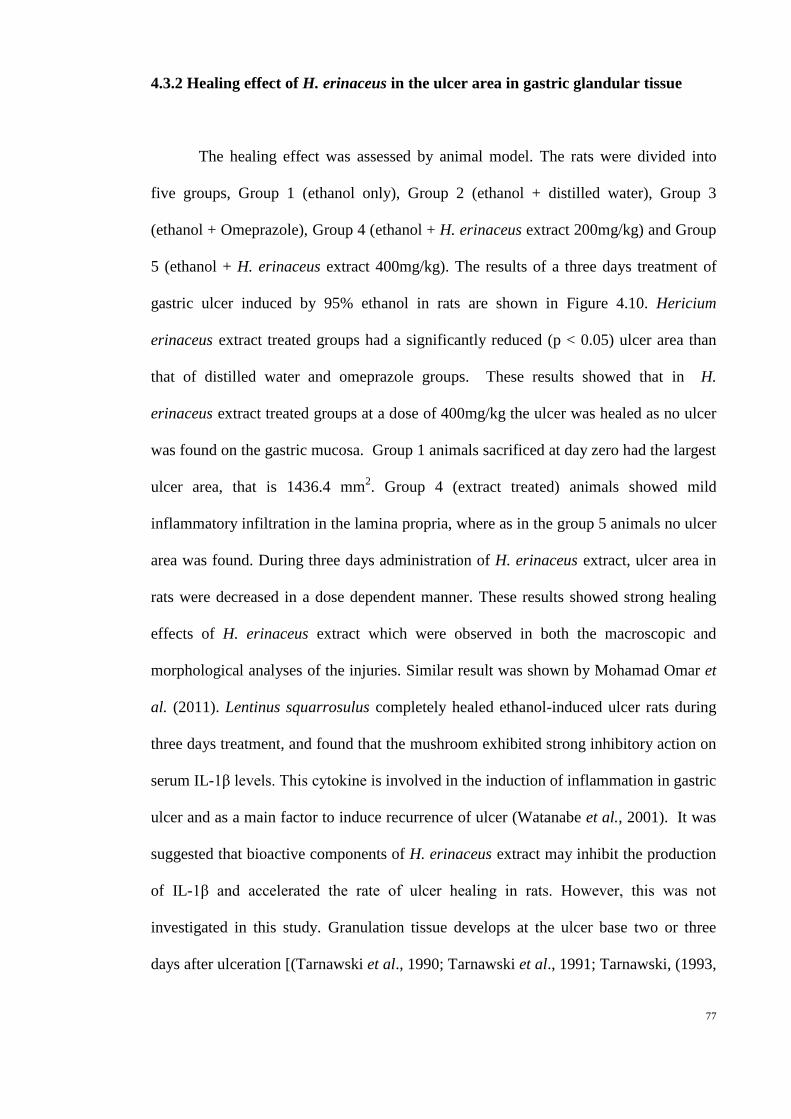
77
4.3.2 Healing effect of H. erinaceus in the ulcer area in gastric glandular tissue
The healing effect was assessed by animal model. The rats were divided into
five groups, Group 1 (ethanol only), Group 2 (ethanol + distilled water), Group 3
(ethanol + Omeprazole), Group 4 (ethanol + H. erinaceus extract 200mg/kg) and Group
5 (ethanol + H. erinaceus extract 400mg/kg). The results of a three days treatment of
gastric ulcer induced by 95% ethanol in rats are shown in Figure 4.10. Hericium
erinaceus extract treated groups had a significantly reduced (p < 0.05) ulcer area than
that of distilled water and omeprazole groups. These results showed that in H.
erinaceus extract treated groups at a dose of 400mg/kg the ulcer was healed as no ulcer
was found on the gastric mucosa. Group 1 animals sacrificed at day zero had the largest
ulcer area, that is 1436.4 mm2. Group 4 (extract treated) animals showed mild
inflammatory infiltration in the lamina propria, where as in the group 5 animals no ulcer
area was found. During three days administration of H. erinaceus extract, ulcer area in
rats were decreased in a dose dependent manner. These results showed strong healing
effects of H. erinaceus extract which were observed in both the macroscopic and
morphological analyses of the injuries. Similar result was shown by Mohamad Omar et
al. (2011). Lentinus squarrosulus completely healed ethanol-induced ulcer rats during
three days treatment, and found that the mushroom exhibited strong inhibitory action on
serum IL-1β levels. This cytokine is involved in the induction of inflammation in gastric
ulcer and as a main factor to induce recurrence of ulcer (Watanabe et al., 2001). It was
suggested that bioactive components of H. erinaceus extract may inhibit the production
of IL-1β and accelerated the rate of ulcer healing in rats. However, this was not
investigated in this study. Granulation tissue develops at the ulcer base two or three
days after ulceration [(Tarnawski et al., 1990; Tarnawski et al., 1991; Tarnawski, (1993,
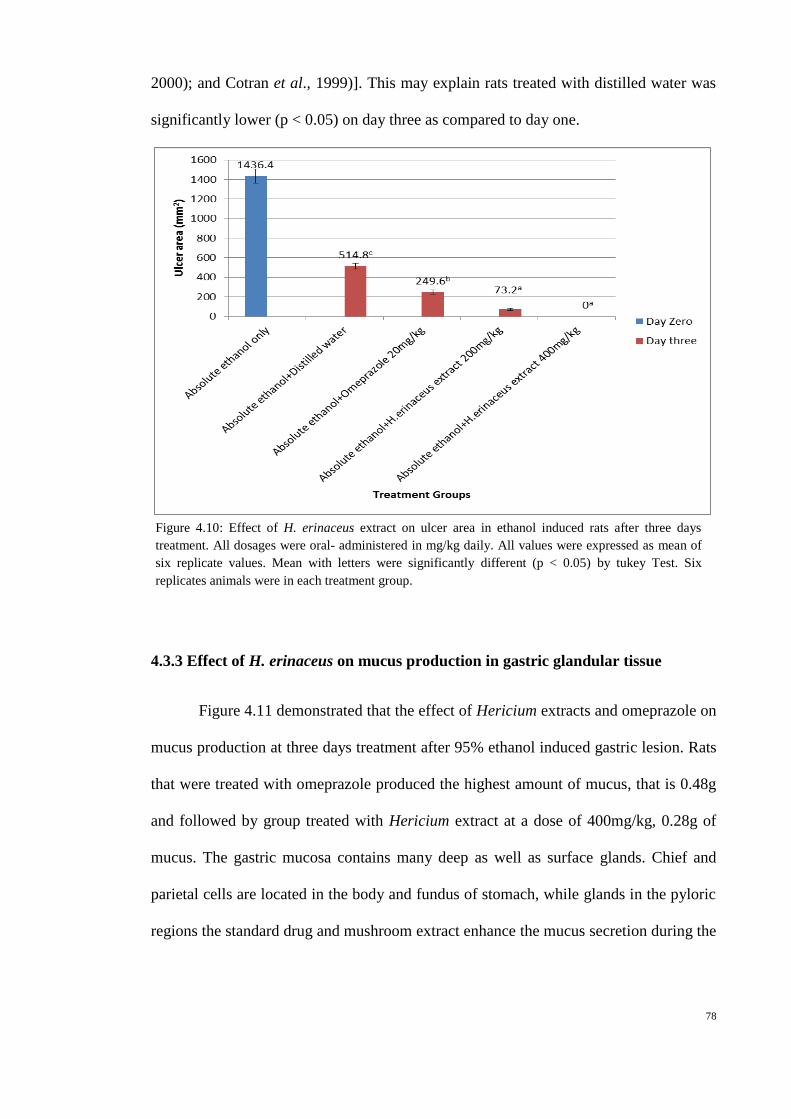
78
2000); and Cotran et al., 1999)]. This may explain rats treated with distilled water was
significantly lower (p < 0.05) on day three as compared to day one.
4.3.3 Effect of H. erinaceus on mucus production in gastric glandular tissue
4.3.3 Effect of H. erinaceus on mucus production in gastric glandular tissue
Figure 4.11 demonstrated that the effect of Hericium extracts and omeprazole on
mucus production at three days treatment after 95% ethanol induced gastric lesion. Rats
that were treated with omeprazole produced the highest amount of mucus, that is 0.48g
and followed by group treated with Hericium extract at a dose of 400mg/kg, 0.28g of
mucus. The gastric mucosa contains many deep as well as surface glands. Chief and
parietal cells are located in the body and fundus of stomach, while glands in the pyloric
regions the standard drug and mushroom extract enhance the mucus secretion during the
Figure 4.10: Effect of H. erinaceus extract on ulcer area in ethanol induced rats after three days
treatment. All dosages were oral- administered in mg/kg daily. All values were expressed as mean of
six replicate values. Mean with letters were significantly different (p < 0.05) by tukey Test. Six
replicates animals were in each treatment group.

79
imbalance. However, both treatment (group 4 and 5) groups did not show significant
difference (p < 0.05) in mucus production after three days treatment.
Koh and Chen (2000) have suggested that the proton pump inhibitor such as
omeprazole could inhibit acid secretion and continuously induce production in plasma
gastrin level thus involved in the regulation of mucosal cell proliferation during ulcer
healing. Schmassmann and Reubi (2000) demonstrated that during ulcer healing process,
omeprazole induced hypergastrinaemia, and exogenous gastrin-17 enhanced cell
Figure 4.11: Effect of H. erinaceus extract on mucus production in ethanol induced rats after three
days treatment. All dosages were oral- administered in mg/kg daily. All values were expressed as
mean of six replicate values. Mean with letters were significantly different (p < 0.05) by Tukey Test.
Six replicates animals were in each treatment group.
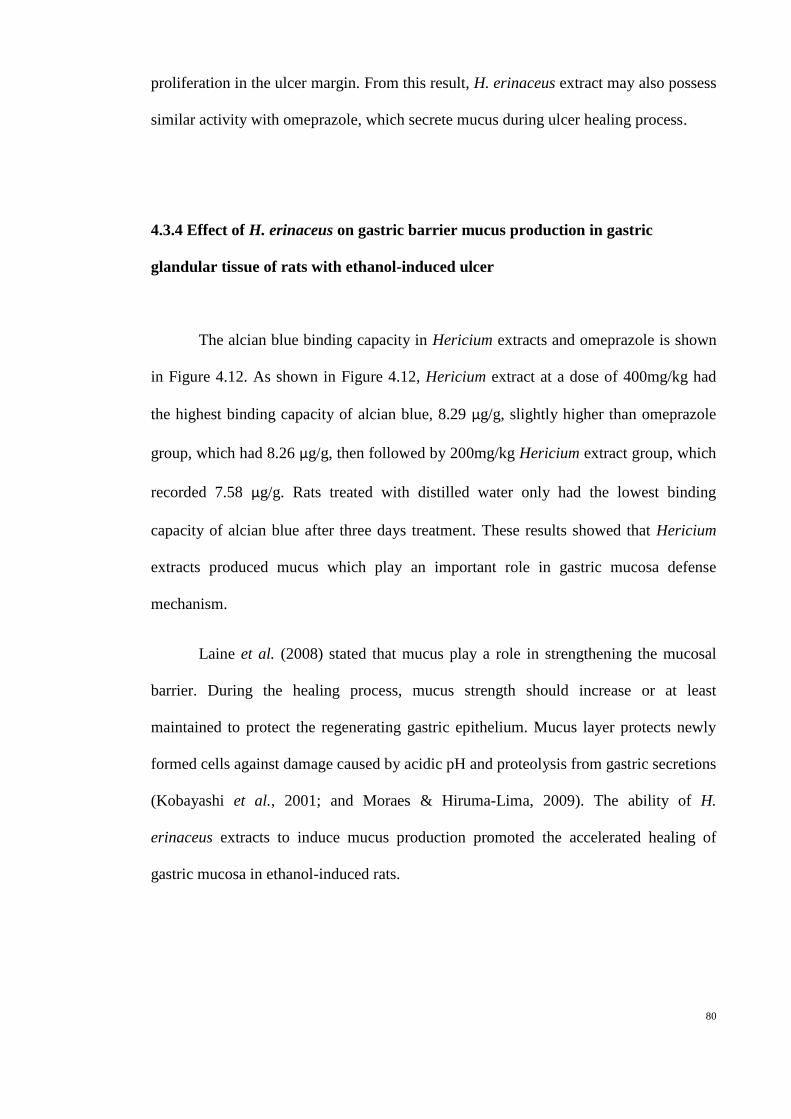
80
proliferation in the ulcer margin. From this result, H. erinaceus extract may also possess
similar activity with omeprazole, which secrete mucus during ulcer healing process.
4.3.4 Effect of H. erinaceus on gastric barrier mucus production in gastric
glandular tissue of rats with ethanol-induced ulcer
The alcian blue binding capacity in Hericium extracts and omeprazole is shown
in Figure 4.12. As shown in Figure 4.12, Hericium extract at a dose of 400mg/kg had
the highest binding capacity of alcian blue, 8.29 µg/g, slightly higher than omeprazole
group, which had 8.26 µg/g, then followed by 200mg/kg Hericium extract group, which
recorded 7.58 µg/g. Rats treated with distilled water only had the lowest binding
capacity of alcian blue after three days treatment. These results showed that Hericium
extracts produced mucus which play an important role in gastric mucosa defense
mechanism.
Laine et al. (2008) stated that mucus play a role in strengthening the mucosal
barrier. During the healing process, mucus strength should increase or at least
maintained to protect the regenerating gastric epithelium. Mucus layer protects newly
formed cells against damage caused by acidic pH and proteolysis from gastric secretions
(Kobayashi et al., 2001; and Moraes & Hiruma-Lima, 2009). The ability of H.
erinaceus extracts to induce mucus production promoted the accelerated healing of
gastric mucosa in ethanol-induced rats.

81
4.3.5 Histological evaluation of gastric lesions
4.3.5 Histological evaluation of gastric lesions in stomachs of control and treated
rats
Histological observation of ethanol induced gastric lesions in ulcer control group
treated with distilled water (normal control group) only showed severe damage to the
epithelium and necrotic lesions penetrate deeply into mucosa, and extensive oedema and
leucocytes infiltration of the submucosal layer were present (Plate 4.7). Rats that were
treated with H. erinaceus extract had comparatively better healing effects of the gastric
Figure 4.12: Effect of H. erinaceus extract on gastric barrier mucus in ethanol induced rats after three
days treatment. All dosages were oral- administered in mg/kg daily. All values were expressed as
mean of six replicate values. Mean with letters were significantly different (p < 0.05) by Tukey Test.
Six replicates animals were in each treatment group.

82
mucosa as seen by reduction or absence of ulcer area, reduced or absence of submucosal
edema and leucocytes infiltration (Plate 4.7).
Laine et al. (2008) stated that the reduction of neutrophils infiltration into
ulcerated gastric tissues has been related in the promotion of healing of acetic-acid-
induced chronic ulcer in rats. From the histological evaluation (Plate 4.7), it suggested
that treatment with H. erinaceus extract promoted gastric ulcer healing when compared
to the normal control group.

83
Plate 4.7: Histological study of ethanol-induced gastric mucosal damage in rats. (a) Rats treated with
5ml/kg distilled water (normal control group). There is severe disruption to the surface epithelium and
necrotic lesions penetrating deeply into mucosa and extensive edema of submucosa layer and leucocytes
infiltration is present. (b) Rats treated with 5ml/kg distilled water (ulcer control group). Moderate damage
to the surface epithelium is seen. (c) Rats treated with omeprazole (20mg/kg). Mild disruption of the
surface epithelium mucosa is seen. There is edema and leucocytes infiltration of the submucosal layer. (d)
Rat treated with H. erinaceus extract (100 mg/kg). Mild disruption of surface epithelium is present. There
is leucocytes infiltration. (e) Rats treated with H. erinaceus extract (400 mg/kg). There is no disruption to
the surface epithelium and no edema or leucocytes infiltration of the submucosal layer (H&E stain 10×
magnification). Notice the leucocytes infiltration in submucosa layer (arrows).
a
b c
d e

84
Mushrooms such as Lentinula edodes, Pleurotus ostreatus (Bilay et al., 2011),
Ganoderma lucidum (Gao et al., 2002 and Rony et al., 2011), Lentinus squarrosulus
(Mohamad Omar et al., 2011), H. erinaceus (Abdulla et al., 2008) are reported to have
gastroprotective property. However, only G. lucidum (Gao et al., 2002) and L.
squarrosulus (Mohamad Omar et al., 2011) were shown to heal ethanol-induced gastric
ulcer in rats.
In ulcer treatment, the two highest dosages of H. erinaceus extracts, that is
200mg/kg and 400mg/kg which were used in prevention test were selected. During the
three days treatment, H. erinaceus extracts significantly (p < 0.05) reduced the ulcer
area and healed the ulcers on gastric mucosa.
After ulceration is initiated, ulcer healing starts with a process of coagulation
and hemostasis. The process is to prevent exsaguination and to provide a matrix for the
cells coming into the ulcer in the later phase of healing (Chai, 2011). After two or three
days, the process of granulation tissue formation takes place. Granulation tissue
comprises of proliferation of connective tissue cells such as macrophage, fibroblast and
proliferative endothelial cells which form microvessels through angiogenesis process
(Tarnawski, 2005). Angiogenesis process is an important process in peptic ulcer healing
and vascular endothelial growth factor (VEGF) is an important regulator that is
involved in this process (Syam et al., 2009).
Relationship between endothelial cells, platelets, coagulation, and fibrinolysis
determines hemostasis and regulates the amount of fibrin deposited at the injury site,
thus, the progress of healing were influenced by these factors. Growth factors, such as
platelet derived growth factor (PDGF), transforming growth factor-β (TGF-β),
epidermal growth factor (EGF), insulin-like growth factor (IGF), basic fibroblast
growth factor (bFGF), vascular endothelial growth factor (VEGF), Tumor necrosis
85
factor-α (TNF-α), interleukin-1 (IL-1), and interleukin-6 (IL-6) are major stimulators for
cells to go through proliferation, mitosis, migration, and re-epithelization (Chai, 2011).
They act as promoters in the ulcer healing by activating and attracting neutrophils,
macrophages, endothelial cells, fibroblasts and myofibroblasts to the ulcer area, and
then bring the healing process to the inflammation phase. The inflammatory phase ends
when lymphocytes are attracted to the ulcer by IL-1, an important regulator of
collagenase activity that is later needed for extracellular matrix (ECM) remodelling.
ECM made of fibrous structural proteins such as the collagens and elastins,
adhesive glycoproteins including fibronectin and laminin and an amorphous gel
composed of proteoglycans and hyaluronan will form an interstitial matrix and the
basement membrane (Basson et al., 1993; Cotran et al., 1999; and Basson, 2001). Later
phase, ECM proteins will be degraded and replaced by matrix metalloproteinases
(MMPs). Activated MMPs are inhibited by their antagonists, tissue inhibitors of
metalloproteinase (TIMP), which can be found in most mesenchymal cells, thus
preventing uncontrolled action of these proteinases (Cotran et al., 1999; and Calabro et
al., 2004). Both proteins are important in the remodelling of connective tissue necessary
for the tissue defect repair and scar formation (Shanin et al., 2001; and Calabro et al.,
2004).
86
5.0 Recommendations for further studies and conclusions
In the present study, the potential efficacy of the mushroom
H. erinaceus to protect and / or heal the gastric ulcer in rats experimentally induced by
ethanol was investigated and compared with. Other models of gastric ulcer induction
such as Hydrochloric acid (HCl), acetic acid or pylorus ligation methods can be
conducted in the future. Other than that, biomarkers such as NF-kB, Interleukin-1β,
TNF-α, PGE2, NO and COX-2 can also be investigated to aid in understanding of the
healing mechanism/s. Another staining method, Periodic acid-Schiff (PAS) staining can
be alternative choice to evaluate the mucus secretion, which form a mucus layer to
protect gastric mucosa against physical damage.
Furthermore, double-boiled aqueous extract was used in this study. Aqueous
extract can be further purified to obtain pure compounds so that specific compounds
which have effect on gastric ulcer treatment can be identified. Since aqueous extraction
mainly release primary active compounds such as polysaccharides or beta glucans,
solvents such as methanol and ethanol can be used to extract H. erinaceus basidiocarp
to obtain secondary metabolites. Through alcohol extraction, secondary metabolite such
as triterpenoids, which are believed to have anti-inflammatory property, may be
obtained.
In conclusion, Hericium erinaceus did not show any sign of toxicological effects
on rats during 14 days at a dose of 2 and 5 g/kg. Hericium erinaceus extract had
gastroprotective activity in a dose dependent manner and produced mucus which is
important in gastric defense mechanism. At 400mg/kg, there was a significant (p < 0.05)
reduction of ulcer areas in the gastric wall as well as by the reduction or inhibition of
edema and leukocytes infiltration of the submucosal layers which were shown
histologically. Immunohistochemistry staining of HSP70 and Bax proteins showed up-

87
regulation of HSP70 protein and down-regulation of Bax protein in rats pre-treated with
mushroom extract, in a dose dependent manner.
Beside that, H. erinaceus extract also significantly increased the SOD and CAT
and decreased the level of lipid peroxidation (LPO) in gastric tissue homogenates.
Among the extract concentrations, highest SOD and CAT enzyme activity were shown
at 200mg/kg dose. In addition, H. erinaceus extract at 400mg/kg had the lowest LPO
activity, and this result was comparable to omeprazole group.
During the three days ulcer treatment experiment, H. erinaceus extract at a dose
of 400mg/kg could significantly (p < 0.05) heal the ulcer that was induced by ethanol in
rats. No ulcer was observed after three days treatment and significantly higher (p < 0.05)
mucus content was present when compared to extract at 200mg/kg dosage.
Hericium erinaceus, a well-documented temperate mushroom that is beneficial
for gastrointestinal health in Chinese medicine is now grown in Malaysia. The
gastroprotection and ulcer healing effects are retained though mushroom is grown at
much higher temperatures in tropical Malaysia. All these results suggest the safety and
efficacy of H. erinaceus either in preventing or healing gastric ulcer.

88
References
Abdel-Salam, O. M. E., Czimmer, J., Debreceni, A., Szolcsanyi, J., & Mozsilk, G.
(2001). Gastric mucosal integrity: gastric mucosal blood flow and
microcirculation. Journal of Physiology Paris, 95, 105-127.
Abdulla, M. A., Suzita, M. N., Vikineswary, S., Noorlidah, A., Wong, K. H., &
Hapipah M. A. (2008). Effect of culinary-medicinal lion’s mane mushroom,
Hericium erinaceus (Bull.: Fr.) Pers. (Aphyllophoromycetideae), on ethanol-
induced gastric ulcers in rats. International Journal of Medicinal Mushrooms, 10,
325-330.
Abotsi, W. K. M., Ainooson, G. K., & Gyasi, E. B. (2011). Acute and sub-acute toxicity
studies of the ethanolic extract of the aerial parts of Hilleria Latifolia (Lam.) H.
Walt. (Phytolaccaceae) in rodents. West African Journal of Pharmacy, 22(1), 27
– 35.
Adebajo, A., Ayoola, O., Iwalewa, E., Akindahunsi, A., Omisore, N., Adewunmi, C., et
al. (2006). Anti-trichomonal, biochemical and toxicological activities of
methanolic extract and some carbazol alkaloids isolated from the leaves of
Murraya koenigii growing in Nigeria. Phytomedicine, 13, 246-254.
Adinortey, M. B., Sarfo, J. K., Adukpo, G. E., Dzotsi, E., Kusi, S., Ahmed, M. A., et al.
(2012). Acute and sub-acute oral toxicity assessment of hydro-alcoholic root
extract of Paullinia pinnata on haematological and biochemical parameters.
Biology and Medicine, 4 (3), 121–125.
Alimi, H., Hfaiedh, N., Bouoni, Z., Hfaiedh, M., Sakly, M., Zourgui, L., et al. (2010).
Antioxidant and antiulcerogenic activities of Opuntia ficus indica f. inermis root
extract in rats. Phytomedicine, 17, 1120–1126.

89
Allen, A., & Flemström, G. (2005). Gastroduodenal mucus bicarbonate barrier:
protection against acid and pepsin. American Journal of Physiology, 288, C1–
C19.
Alqasoumi, S., Al-Howiriny, T. A., Al-Yahya, M., & Rafatullah, S. (2008).
Gastroprotective effects of radish "raphanus sativus" L. on experimental gastric
ulcer models in rats. Farmacia, 46, 204-214.
Aniagu, S. O., Nwinyi, F. C., Olanubi, B., Akumka, D. D., Ajoku, G. A., Izebe, K. S., et
al. (2004). Is Berlina grandiflora (Leguminosae) toxic in rats? Phytomedicine,
11(4), 352-360.
Arafa, H. M. M., & Sayed-Ahmed, M. M. (2003). Protective role of carnitine esters
against alcohol-induced gastric lesions in rats. Pharmacological Research, 48,
285–290.
Argenzio, R. A., Henrikson, C. K., & Liacos, J. A. (1988). Restitution of barrier and
transport function of porcine colon after acute mucosal injury. American Journal
of Physiology, 255, G62-G71.
Arneson, W., & Brickell, J. (2007). Assessment of Renal Function. In: Arneson, W., &
Brickell J., (Ed.). Clinical Chemistry: A laboratory Perspective. (1st ed., pp.
201-266). Philadelphia: F.A. Davis Company.
Arya, R., Mallik, M., & Lakhotia, S. C. (2007). Heat shock genes-integrating cell
survival and death. Journal of Bioscience, 32, 595-610.
Basson, M. D. (2001). In vitro evidence for matrix regulation of intestinal epithelial
biology during mucosal healing. Life Sciences, 69, 3005–3018.
Basson, M. D., Modlin, I. M., Turowski, G., & Madri, J. A. (1993). Enterocyte-matrix
interactions in the healing of mucosal injury. European Journal of
Gastroenterology & Hepatology, 5, S21–S28.
90
Bast, A. (1993). Oxidative Stress and Calcium Homeostasis. In B. Halliwell, Aruoma,
O.I (Ed.), DNA and Free Radicals (pp. 95–108). London: Ellis Horwood.
Becker, J., & Craig, E. A. (1994). Heat-shock proteins as molecular chaperones.
European Journal of Biochemistry, 219, 11-23.
Belley, A., Keller, K., Gottke, M., & Chadee, K. (1999). Intestinal mucins in
colonization and host defense against pathogens. American Journal of Tropical
Medicine and Hygiene, 60, 10–15.
Bilay, V., Beregova, T., & Kukharskyy, V. (Eds.). (2011). The influence of culinary-
medicinal mushrooms: Agaricus bisporus, Lentinula edodes and Pleurotus
ostreatus on injuries of gastric mucosa in rats evoked by stress. Proceedings of
the 7th International Conference on Mushroom Biology and Mushroom
Products (ICMBMP7). Ukraine.
Bolton, J. P., Palmer, D., & Cohen, M. M. (1978). Stimulation of mucus and nonparietal
cell secretion by the E2 prostaglandins. Digestive Diseases Science, 23, 359-364.
Borrelli, F., & Izzo, A. A. (2000). The plant kingdom as a source of anti-ulcer remedies.
Phytotherapy Research, 14, 581-591.
Boucher, M. J., Morisset, J., Vachon, P. H., Reed, J. C., Lainé, J., & Rivard, N. (2000).
MEK/ERK signaling pathway regulates the expression of Bcl-2, Bcl-X(L), and
Mcl-1 and promotes survival of human pancreatic cancer cells. Journal of
Cellular Biochemistry, 79, 355-369.
Braun, J. P., Aktas, M., Lefebvre, H., Rico, A. G., & Toutain, P. L. (1993). Clinical
enzymology for the assessment of organ damage: interspecific differences.
Comparative Haematology International, 3, 27–32.
Brogden, R. N., Heel, R. C., Speight, T. M., & Avery, G. S. (1978). Cimetidine: a
review of its pharmacological properties and therapeutic efficacy in peptic ulcer
disease. Drugs, 15, 93-131.
91
Brogie, D. A. (1962). Ulceration of the stomach produced by restraint in rats.
Gastroenterology, 43, 107-109.
Bukau, B., & Horwich, A. L. (1998). The HSP70 and HSP60 chaperone machines. Cell,
92, 351-366.
Burdon, R. H. (1995). Superoxide and hydrogen peroxide in relation to mammalian cell
proliferation. Free Radical Biology & Medicine, 18(4), 775-794.
Cadirci, E., Suleyman, H., Aksoy, H., Halici, Z., Ozgen, U., Koc, A., et al. (2007).
Effects of Onosma armeniacum root extract on ethanol-induced oxidative stress
in stomach tissue of rats. Chemico-Biological Interactions, 170, 40-48.
Calabro, A., Grappone, C., Pellegrini, G., Evangelista, S., Tramontana, M., Schuppan,
D., et al. (2004). Spatial and temporal pattern of expression of interstitial
collagenase, stromelysin/transin, gelatinase A, and TIMP-1 during experimental
gastric ulcer healing. Digestion, 70, 127–138.
Chai, J. Y. (2011). Gastric Ulcer Healing –Role of Serum Response Factor. Peptic
Ulcer Disease, 143-164. doi: 10.5772/17410.
Chai, J., Baatar, D., & Tarnawski, A. S. (2004). Serum response factor promotes re-
epithelialization and muscular structure restoration during gastric ulcer healing.
Gastroenterology, 126, 1809–1818.
Chang, H. Y., & Roh, M. G. (1999). Physiological characteristics of Hericium
erinaceus in sawdust media. Korean Journal Mycology, 27, 252–255.
Chang, S. T. (1999). Global impact of edible and medicinal mushrooms on human
welfare in the 21st century: nongreen revolution. International Journal of
Medicinal Mushrooms, 1, 1–8.
Chang, S. T., & Miles, P. G. (1992). Mushroom biology – a new discipline. Mycologist,
6, 64–65.

92
Cheng, C. L., & Koo, M. W. L. (2000). Effect of Centella asiatica on ethanol induced
gastric mucosal lesions in rats. Life Sciences, 67, 2647-2653.
Chyi, W. J., Hui, H. S., Teng, W. J., Shao, C. K., & Chen, C. Y. (2005). Hypoglycemic
effect of extract of Hericium erinaceus. Journal of the Science of Food and
Agriculture, 85(4), 641-646.
Corne, S. J., Morrissery, S. M., & Woods, R. J. (1974). A method for the quantitative
estimation of gastric barrier mucus. Journal of Physiology, 242, 116–117.
Cotran, R. S., Kumar, V., & Robbins, S. L. (1999). Gastric ulceration. In R. S. Cotran,
Kumar, V., & Robbins, S.L (Ed.), Robbins Pathologic Basis of Disease (5th ed.,
pp. 298–299, 773–777). Philadelphia: Saunders.
Crofford, L. J., Lipsky, P. E., Brooks, P., Abramson, S. B., Simon, L. S., & Van de
Putte, L. B. A. (2000). Basic biology and clinical application of specific
cyclooxygenase-2 inhibitors. Arthritis & Rheumatism, 43, 4–13.
Daniels, I., & Allum, W. (2005). The Anatomy and Physiology of the Stomach. Upper
Gastrointestinal surgery, 10, 17-37.
Das, D., Bandyopadhyay, D., Bhattacharjee, M., & Banerjee, R. K. (1997). Hydroxyl
radical is the major causative factor in stress-induced gastric ulceration. Free
Radical Biology and Medicine, 23, 8–18.
Davenport, H. (1968). Destruction of the gastric mucosal barrier by detergents and urea.
Gastroenterology, 54, 175.
De Pasquale, R., Germano, M. P., Keita, A., Sanogo, R., & Lauk, L. (1995). Antiulcer
activity of Pteleopsis suberosa. Journal of Ethnopharmacology, 47, 55-58.
Ekman, L., Hansson, E., Havu, N., Carlsson, E., & Lundberg, C. (1985). Toxicological
studies on omeprazole. Scandinavian Journal of Gastroenterology, 20, 53-69.

93
Feil, W., Lacy, E. R., Wong, Y. M., Burger, D., Wenzi, E., Starlinger, M., et al. (1989).
Rapid epithelial restitution of human and rabbit colonic mucosa.
Gastroenterology, 97, 685-701.
Folkman, J., & D’Amore, P. A. (1996). Blood vessel formation: what is its molecular
basis? Cell, 87, 1153–1155.
Forstner, J. F. (1978). Intestinal mucins in health and disease. Digestion, 17, 234–263.
Frey, M. R., & Polk, D. B. (2006). Mucosal Repair and Restitution. In L. R. Johnson
(Ed.), Physiology of the Gastrointestinal Tract (4th
ed., pp. 459-475). California:
Elsevier Academic Press.
Fridovich, I. (1975). Superoxide dismutases. Annual Review of Biochemistry, 44, 147-
159.
Fridovich, I. (1978). The biology of oxygen radicals. Science, 201, 875–880.
Fridovich, I. (1995). Superoxide radical and superoxide dismutases. Annual Review of
Biochemistry, 64, 97–112.
Gana, T. J., Huhlewych, R., & Koo, J. (1987). Focal gastric mucosal blood flow in
aspirin-induced ulceration. Annals of Surgery, 205, 399–403.
Gao, Y. H., Zhou, S. F., Wen, J. B., Huang, M., & Xu, A. L. (2002).Mechanism of the
antiulcerogenic effect of Ganoderma lucidum polysaccharides on indomethacin-
induced lesions in the rat. Life Sciences, 72, 731–745.
García-Barrantes, P. M., & Badilla, B. (2011). Anti-ulcerogenic properties of Quassia
amara L. (Simaroubaceae) standardized extracts in rodent models. Journal of
Ethnopharmacology, 134, 904–910.
Garg, G. P., Nigam, S. K., & Ogle, C. W. (1993). The gastric antiulcer effects of the
leaves of the neem tree. Planta Medica, 59, 215-217.

94
Georgopoulos, C., & Welch, W. J. (1993). Role of the major heat shock proteins as
molecular chaperones. Annual Review of Cell Biology, 9, 601-634.
Gething, M. J., & Sambrook, J. (1992). Protein folding in the cell. Nature, 355, 33-45.
Giannella, R. A., Broitman, S. A., & Zamcheck, N. (1973). Influence of gastric acidity
on bacterial and parasitic enteric infections: A perspective. Annals of Internal
Medicine, 78, 271–276.
Gierse, J. K., Hauser, S. D., Creely, D. P., Koboldt, C., Rangwala, S. H., Isakson, P.
C., et al. (1995). Expression and selective inhibition of the constitutive and
inducible forms of human cyclo-oxygenase. Biochemical Journal, 305, 479-484.
Gierse, J. K., Koboldt, C. M., Walker, M. C., Seibert, K., & Isakson, P. C. (1999).
Kinetic basis for selective inhibition of cyclo-oxygenases. Biochemical Journal,
339, 607- 614.
Goddard, P. J., Kao, Y. C., & Lichtenberger, L. M. (1990). Luminal surface
hydrophobicity of canine gastric mucosa is dependent on a surface mucous gel.
Gastroenterology, 98, 361–370.
Gue, S. C., Woo, S. J., Hyo, C. J., Kwan, C. C., Heui, Y. C., Tae, C. W., et al. (2006).
Macrophage activation and nitric oxide production by water soluble component
of Hericium erinaceum. International Immunopharmacology, 6(8), 1363-1369.
Gutteridge, J. M. C. (1995). Lipid peroxidation and antioxidants as biomarkers of tissue
damage. Clinical Chemistry, 41, 1819-1828.
Guyton, A. C. & Hall, J. E. (2006).Textbook of Medical Physiology. (11th ed., pp. 1152)
USA: Elsevier Saunders.
Halliwell, B., & Aruoma, O. I. (1991). DNA damage by oxygen-derived species-Its
mechanism and measurement in mammalian systems. Federation of European
Biochemical Societies, 281, 9-19.

95
Hartl, F. U. (1996). Molecular chaperones in cellular protein folding. Nature, 381, 571-
579.
Haunstetter, A., & Izumo, S. (1998). Apoptosis: basic mechanisms and implications for
cardiovascular disease. Circulation Research, 82, 1111-1129.
Hawksworth, D. L. (1993). The tropical fungal biota: census, pertinence, prophylaxis,
and prognosis. In S. Isaac, Frankland, J. C., Watling, R. & Whalley, A. J. S.
(Ed.), Aspects of Tropical Mycology (pp. 265–293). Cambridge, UK: Cambridge
University Press.
Hawksworth, D. L. (2001). Mushrooms: the extent of the unexplored potential.
International Journal of Medicinal Mushrooms, 3, 333–340.
Hendrick, J. P., & Hartl, F. U. (1993). Molecular chaperone functions of the heat-shock
proteins. Annual Review of Biochemistry, 62, 349-384.
Hightower, L. E. (1991). Heat shock, stress proteins, chaperones, and proteotoxicity.
Cell, 66, 191-197.
Hills, B. A., Butler, B. D., & Lichtenberger, L. M. (1983). Gastric mucosal barrier,
hydrophobic lining to the lumen of the stomach. American Journal of
Physiology - Gastrointestinal and Liver Physiology, 244, G561–G568.
Hirakawa, T., Rokutan, K., Nikawa, T. & Kishi, K. (1996). Geranylgeranylacetone
induces heat shock proteins in cultured guinea pig gastric mucosal cells and rat
gastric mucosa. Gastroenterology, 111, 345–357.
Holzer, P., & Sametz, W. (1986). Gastric mucosal protection against ulcerogenic factors
in the rat mediated by capsaicin-sensitive afferent neurons. Gastroenterology, 91,
975–981.
Huh, K., Kwon, T. H., Shin, U. S., Kim, W. B., Ahn, B. O., Oh, T. Y., et al. (2003).
Inhibitory effects of DA-9601 on ethanol-induced gastrohemorrhagic lesions
96
and gastric xanthine oxidase activity in rats. Journal of Ethnopharmacology, 88,
269–273.
Hull, D. H., & Beale, P .J. (1985). Cigarette smoking and duodenal ulcer. Gut, 26,
1333-1337.
Itoh, Y. H., & Noguchi, R. (2000). Pre-treatment with mild whole-body heating
prevents gastric ulcer induced by restraint and water-immersion stress in rats.
International Journal of Hyperthermia, 16, 183—191.
Jacquier-Sarlin, M. R., Fuller, K., Dinh-Xauan, A. T., Richard, M. J., & Polla, B. S.
(1994). Protective effects of hsp70 in inflammation. Experientia, 50, 1031-1038.
Kabakov, A. E., & Gabai, V. L. (1995). Heat shock-induced accumulation of 70-kDa
stress protein (HSP70) can protect ATP-depleted tumor cells from necrosis.
Experimental Cell Research, 217, 15-21.
Kampinga, H. H. (1993). Thermotolerance in mammalian cells. Protein denaturation
and aggregation, and stress proteins. Journal of Cell Science, 104, 11-17.
Kampinga, H. H., Brunsting, J. F., Stage, G. J. J., Burgman, P. W. J. J., & Konings, A.
W. T. (1995). Thermal protein denaturation and protein aggregation in cells
made thermotolerant by various chemicals: role of heat shock proteins.
Experimental Cell Research, 219, 536-546.
Kauffman, J. G., & Grossman, M. (1978). Prostaglandin and cimetidine inhibit the
formation of ulcers produced by parenteral salicylates. Gastroenterology, 75,
1099.
Kaunitz, J. D. (1999). Barrier function of gastric mucus. Keio Journal of Medicine, 48,
63–68.
Kawagishi, H., Shimada, A., Shirai, R., Okamoto, K., Ojima, F., Sakamoto, H., et al.
(1994). Erimacines A, B, and C, strong stimulators of nerve growth factor (NGF)

97
synthesis, from the mycelia of Hericium erinaceum. Tetrahedron Letters, 35,
1569–1572.
Kim, D. M., Pyun, C. W., Ko, H. G., & Park, W. M. (2000). Isolation of antimicrobial
substances from Hericium erinaceum. Mycobiology, 28, 33–38.
Kim, S. P., Kang, M. Y., Choi, Y. H., Kim, J. H., Nam, S. H., & Friedman, M. (2011).
Mechanism of Hericium erinaceus (Yamabushitake) mushroom-induced
apoptosis of U937 human monocytic leukemia cells. Food and Function, 2, 348-
356.
Kinouchi, H., Sharp, F. R., Chan, P. H., Koistinaho, J., Sagar, S. M., & Yoshimoto, T.
(1994). Induction of c-fos, junB, c-jun, and hsp70 mRNA in cortex, thalamus,
basal ganglia, and hippocampus following middle cerebral artery occlusion.
Journal of Cerebral Blood Flow & Metabolism, 14, 808–817.
Kirk, P. M., Cannon, P. F., David, J. C., & Stalpers, J. A. (2001). Ainsworth and Bisby’s
dictionary of the fungi (9th ed.). Wallingford: CAB International.
Ko, H. G., Park, H. G., Park, S. H., Choi, C. W., Kim, S. H., & Park, W. M. (2005).
Comparative study of mycelial growth and basidiomata formation in seven
different species of the edible mushroom genus Hericium. Bioresource
Technology, 96, 1439–1444.
Kobayashi, T., Ohta, Y., Yoshino, J. & Nakazawa, S. (2001). Teprenone promotes the
healing of acetic acid-induced chronic gastric ulcers in rats by inhibiting
neutrophil infiltration and lipid peroxidation in ulcerated gastric tissues.
Pharmacological Research, 43(1), 23–30.
Koh, T. J., & Chen, D. (2000). Gastrin as a growth factor in the gastrointestinal tract.
Regulatory Peptides, 93, 37-44.
98
Kohn, D. F., & Clifford, C. B. (2002). Biology and diseases of rats. In J. G. Fox,
Anderson, L. C., Loew, F. M., & Quimby, F. W. (Ed.) Laboratory Animal
Medicine (2nd
ed., pp. 121–165 ). Massachusetts: Elsevier Academic Press.
Konturek, S. J., Konturek, P. C., & Brzozowski, T. (2005). Prostaglandins and ulcer
healing. Journal Physiology and Pharmacology, 56, 5–31.
Krall, J., Bagley, A. C., Mullenbach, G. T., Hallewell, R. A., & Lynch, R. E. (1988).
Superoxide mediates the toxicity of paraquat for cultured mammalian cells.
Journal of Biological Chemistry, 263, 1910-1914.
Kuwahara, S., Morihiro, E., Nemoto, A., & Hiramatsu, A. (1992). Synthesis and
absolute configuration of a cytotoxic fatty acid isolated from the mushroom
Hericium erinaceum. Bioscience Biotechnology and Biochemistry, 56, 1417–
1419.
Lacy, E. R. (1988). Epithelial restitution in the gastrointestinal tract. Journal of Clinical
Gastroenterology, 10, S72-S77.
Laine, L., Takeuchi, K., & Tarnawski, A. (2008). Gastric mucosal defense and
cytoprotection: bench to bedside. Gastroenterology, 135, 41-60.
Larsson, H., Carlsson, E., Mattsson, H., Lundell, L., Sundler, F., Sundell ,G., et al.
(1986). Plasma gastrin and gastric enterochromaffine-like cell activation and
proliferation. Studies with omeprazole and ranitidine in intact and antrectomized
rats. Gastroenterology, 90(2), 391-399.
Li, C. Y., Xu, H. D., Zhao, B. T., Chang, H. I., & Rhee, H. I. (2008). Gastroprotective
effect of cyanidin 3-glucoside on ethanol-induced gastric lesions in rats. Alcohol,
42, 683-687.
Lichtenberger, L. M. (1999). Gastroduodenal mucosal defense. Current Opinion in
Gastroenterology, 15, 463-472.

99
Liu, C. P., Fang, J. N., & Xiao, X. Q. (2002). Structural characterization and biological
activities of SC4, an acidic polysaccharide from Salvia chinensis. Acta
Pharmacologica Sinica, 23, 162–166.
Maelinda, D., Noorlidah, A., Vikineswary, S., Goh, P. C., & Kuppusamy, U. R. (2008).
Antioxidant from maize and maize fermented by Marasmiellus sp. as stabilizer
of lipid-rich foods. Food Chemistry, 107, 1092–1098.
Maity, B., & Chattopadhyay, S. (2008). Natural Antiulcerogenic Agents: An Overview.
Current Bioactive Compounds, 4, 225-244.
Malfertheiner, P., Chan, F. K. L., & McColl, K. E. L. (2009). Peptic ulcer disease.
Lancet, 374, 1449–1461.
Marhuenda, E., Martin, M. J., & Alarcon de la Lastra, C. (1993). Antiulcerogenic
activity of aescine in different experimental models. Phytotherapy Research, 7,
13-16.
Marieb, E. N. (1998). Human anatomy and physiology (4th ed.). California: Benjamin
Commings Publishing Company.
Mattsson, H., Havu, N., Bräutigam, J., Carlsson, K., Lundell, L., & Carlsson, E. (1991).
Partial gastric corporectomy results in hypergastrinemia and development of
gastric ECL-cell carcinoids in the rats. Gastroenterology, 100(2), 311-319.
Mau, J. L., Lin, H. C., & Song, S. F. (2002). Antioxidant properties of several specialty
mushrooms. Food Research International, 35, 519–526.
Mayer, M. P., & Bukau, B. (2005). Hsp70 chaperones: cellular functions and molecular
mechanism. Cellular and Molecular Life Sciences, 62, 670–684.
McCord, J. M. (1979). Superoxide dismutase. In M. C. Tattazzi, Scandalios, J. G., &
Whitt, G. S. (Ed.), Isozyme: Current Topics in Biological and Medical Research.
New York: Alan R Liss Inc.

100
Mizuno, T. (1999). Bioactive substances in Hericium erinaceus (Bull., Fr.) Pers.
(Yambushitake) and its medicinal utilization. International Journal of Medicinal
Mushroom, 2, 105-119.
Mizuno, T., Sation, H., Nishitoba, T., & Kawagishi, H. (1995). Antitumor active
substances from mushroom. Food Review International, 11, 23–61.
Mohamad Omar, N. A., Noorlidah, A., Kuppusamy, U. R, Abdulla, M. A., &
Vikineswary, S. (2011). Nutritional composition, antioxidant activities, and anti-
ulcer potential of Lentinus squarrosulus (Mont.) Mycelia extract. Evidence-
Based Complementary and Alternative Medicine, 1-8. doi: 10.1155/2011539356.
Moraes, T. M., & Hiruma-Lima, C. A. (2009). Effect of essential oil from Citrus
aurantium and its main compounds limonene on quantity of PGE2 and mucus
production in gastric mucosa. Planta Medica, 75, S1124.
Moreno Chulilla, J. A., Romero Colás, M. S., & Gutiérrez Martín, M. (2009).
Classification of anaemia for gastroenterologists. World Journal of
Gastroenterology, 15(37), 4627–4637.
Mukherjee, K. L. (2005). Medical Laboratory Technology. A Procedure Manual for
Routine Diagnosis Test (7th
ed., pp. 909, 998, 1039–1040). New Delhi: Tata
McGraw-Hill Publishing Company Limited.
Mutoh, H., Hiraishi, H., Ota, S., Ivey, K. J., Terano, A., & Sugimoto, T. (1990). Role of
oxygen radicals in ethanol-induced damage to cultured gastric mucosal cells.
American Journal of Physiology, 258, G603-G609.
Nakamura, K., Rokutan, K., Marui, N., Aoike, A., & Kawai, K. (1991). Induction of
heat shock proteins and their implication in protection against ethanol-induced
101
damage in cultured guinea pig gastric mucosal cells. Gastroenterology, 101,
161—166.
Njar, V., Adesanwo, J., & Raji, Y. (1995). Methyl Angolenate: Antiulcer Agent from
the Stem Bark of Entandrophragma angolense. Planta Medica, 61, 91-92.
Obici, S., Otobone, F. J., da Silva Sela, V. R., Ishida, K., da Silva, J. C., Nakamura, C.
V., et al. (2008). Preliminary toxicity study of dichloromethane extract of
Kielmeyera coriacea stems in mice and rats. Journal of Ethnopharmacology,
115(1), 131-139.
Ooi, V. E., & Liu, F. (2000). Immunomodulation and anticancer activity of
polysaccharide–protein complexes. Current Medicinal Chemistry, 7, 715–729.
Organization for Economic Cooperation and Development (OECD). (2001). Guideline
for the testing of chemicals (425). Acute oral toxicity-up-and-down procedure.
Orrenius, S., McConkey, D. J., Bellomo, G., & Nicotera, P. (1989). Role of Ca2+
in
Toxic Cell Killing. Trends in Pharmacological Sciences, 10, 281–285.
Oslon, H., Betton, G., Robinson, D., Thomas, K., Monro, A., Kolaja, G., et al. (2000).
Concordance of toxicity of pharmaceuticals in humans and in animals.
Regulatory Toxicology and Pharmacology, 32, 56–67.
Özben, T. (1998). Free Radicals, Oxidative Stress, and Antioxidants. Paper presented at
the Pathological and Physiological Significance Proceedings, New York.
Pagana, K. D., & Pagana, T. J. (2003). Mosby’s diagnostic and laboratory test reference
(6th
ed., pp. 36–37). USA: Mosby, Inc.
Pai, R., Wyle, F. A., Cover, T. L., Itani, R. M., & Tarnawski, A. (1998). H. pylori
culture supernatant interferes with EGF-activated signal transduction in human
gastric Kato III cells. American Journal of Pathology, 152, 1617–1624.

102
Park, H. K., Ko, H. G., Kim, S. H., & Park, W. M. (2004). Molecular identification of
Asian isolates of medicinal mushroom Hericium erinaceum by phylogenetic
analysis of nuclear ITS rDNA. Journal Microbiology Biotechnology, 14, 816–
821.
Park, S. W., Oh, T. Y., Kim, Y. S., Sim, H., Park, S. J., Jang, E. J., et al. (2008).
Artemisia asiatica extracts protect against ethanol-induced injury in gastric
mucosa of rats. Journal of Gastroenterology and Hepatology, 23, 976-984.
Pawlik, T., Konturek, P. C., Konturek, J. W., Konturek, S. J., Brzozowski, T.,
Czesniliewicz, M., et al. (2000). Impact of Helicobacter pylori and nonsteroidal
anti-inflammatory drugs on gastric ulcergenesis in experimental animals and in
humans. European Journal of Pharmacology, 449, 1-15.
Pegler, D. N. (2003). Useful fungi of the world: the monkey head fungus. Mycologist,
17, 120-121.
Peleg, L. I., & Wicox, C. M. (2002). Role of eicosanoids, cyclooxygenases, and
nonsteroidal anti-inflammatory drugs in colorectal tumorigenesis and
chemoprevention. Journal of Clinical Gastroenterology, 34(2), 117-125.
Peskar, B. M. (2001). Role of cyclooxygenase isoforms in gastric mucosal defence.
Journal of Physiology Paris, 95, 3-9.
Peura, D. A. (1997). Ulcerogenesis: Intergrating the roles of Helicobacter pylori and
acid secretion of in duodenal ulcer. American Journal of Gastroenterology, 92,
8-16.
Pihan, G., Regillo, C., & Szabo, S. (1987). Free radicals and lipid peroxidation in
ethanol- or aspirin-induced gastric mucosal injury. Digestive Diseases and
Sciences, 32, 1395–1401.
Pleis, J. R., & Lucas, J. W. (2009). Summary Health Statistics for U.S. Adults: National
Health Interview Survey, 2007, Hyattsville, MD.
103
Preclik, G., Stange, E. F. , Gerber, K., Fetzer, G., Horn, H ., & Ditschuneit, H. (1989).
Stimulation of mucosal prostaglandin synthesis in human stomach and
duodenum by antacid treatment. Gut, 30, 148-151.
Qiao, W. L., Wang, G. M., Shi, Y., Wu, J. X., Qi, Y.J., Zhang, J. F., et al. (2011).
Differential expression of Bcl-2 and Bax during gastric ischemia-reperfusion of
rats. World Journal of Gastroenterology, 17(13), 1718-1724.
Rafatullach, S., Tariq, M., Al-Yahya, M. A., Mossa, J. S., & Ageel, A. M. (1990).
Evaluation of turmeric (Curcuma longa) for gastric and duodenal antiulcer
activity in rats. Journal of Ethnopharmacology, 29(1), 25-34.
Rainford, A. (1987). Acid suppression in duodenal ulcer: a meta-analysis to defined
optimal dosing at anti-secretory drugs. Gut, 28(9), 1120-1127.
Repetto, M. G., & Llesuy, S. F. (2002). Antioxidant properties of natural compounds
used in popular medicine for gastric ulcers. Brazilian Journal of Medical and
Biological Research, 35, 523–534.
Reshetnikov, S. V., Wasser, S. P., & Tan, K. K. (2001). Higher Basidiomycota as a
source of antitumor and immunostimulating polysaccharides. International
Journal of Medicinal Mushrooms, 3, 361–394.
Rezvani, M., Barrans, J. D., Dai, K. S., & Liew, C. C. (2000). Apoptosis-related genes
expressed in cardiovascular development and disease: an EST approach.
Cardiovascular Research, 45, 621-629.
Risau, W. (1997). Mechanisms of angiogenesis. Nature, 386, 671–673.
Ritossa, F. (1962). A new puffing pattern induced by temperature shock and DNP in
Drosophila. Experientia, 18, 571-573.
Robert, A., Nezamis, J. E., Lancaster, C., Davis, J. P., Field, S. O., & Hanchar, A. J.
(1983). Mild irritants prevent gastric necrosis through "adaptive cytoprotection"
mediated by prostaglandins. American Journal of Physiology, 245, G113-G121.
104
Rony, K. A., Mathew, J., Neenu, P. P. & Janardhanan, K. K. (2011). Ganoderma
lucidum (Fr.) P. Karst ocurring in South India attenuates gastric ulceration in
rats. Indian Journal of Natural Products and Resources, 2(1), 19-27.
Rosalki, S. B., & Mcintyre, N. (1999). Biochemical investigations in the management of
liver disease. Oxford Textbook of Clinical Hepatology (2nd
ed., pp. 503–521).
New York: Oxford University Press.
Sanders, M. J., Ayalon, A., Roll, M., & Soll, A. H. (1985). The apical surface of canine
chief cell monolayers resists H+ back-diffusion. Nature, 313, 51–54.
Sander, S. W. (1996). Pathogenesis and treatment of peptic ulcer comparison of proton
pump inhibitor with other antiulcer agents. Clinical Therapeutics, 18(1), 2-23.
Sbarbati, A., Baldassari, A. M., Zancanaro, X., & Boicelli, A. (1995). In vivo morpho-
functional study of rat gastric mucus secretion. Anatomical Record, 241, 377-
382.
Schiaffonati, L., & Tiberio, L. (1997). Gene expression in liver after toxic injury:
analysis of heat shock response and oxidative stress inducible genes. Liver, 17,
183–191.
Schichijo, K., Ihara, M., Matsuo, M., Okumura, Y., & Sekine, I. (2003). Overpression
of heat shock protein 70 in stomach of stress-induced gastric ulcer-resistant rats.
Digestive Disease and Science 48, 340–348.
Schiller, J. S., Lucas, J. W., Ward, B. W., & Peregoy, J. A. (2012). Summary Health
Statistics for U.S. Adults: National Health Interview Survey, 2010, Hyattsville,
MD.
Schmassmann, A., & Reubi, J. C. (2000). Cholecystokinin-B/gastrin receptors enhance
wound healing in the rat gastric mucosa. Journal of Clinical Investigation,
106(8), 1021-1029.
105
Schmeda-Hirschmann, G., & Yesilada, E. (2005). Traditional medicine and
gastroprotective crude drugs. Journal of Ethnopharmacology, 100(1-2), 61–66.
Schreiber, S., & Scheid, P. (1997). Gastric mucus of the guinea pig: proton carrier and
diffusion barrier. American Journal of Physiology - Gastrointestinal and Liver
Physiology, 272, G63–G70.
Scott, D. R., Weeks, D., Hong, C., Postius, S., Melchers, K., & Sachs, G. (1998). The
role of internal urease in acid resistance of Helicobacter pylori.
Gastroenterology, 114(1), 58- 70.
Shanin, M., Konturek, J. W., Pohle, T., Schuppan, D., Herbst, H., & Domschke, W.
(2001). Remodeling of extracellular matrix in gastric ulceration. Microscopy
Research and Technique, 53(6), 396-408.
Shih, S. C., Tseng, K. W., Lin, S. C., Kao, C. R., Chou, S. Y., Wang, H. Y., et al.
(2005). Expression patterns of transforming growth factor-beta and its receptors
in gastric mucosa of patients with refractory gastric ulcer. World
Journal of Gastroenterology, 11(1), 136-141.
Shimizu, N., Watanabe, T., Arakawa, T., Fujiwara, Y., Higuchi, K., & Kuroki, T.
(2000). Pentoxifylline accelerates gastric ulcer healing in rats: roles of tumor
necrosis factor alpha and neutrophils during the early phase of ulcer healing.
Digestion, 6, 157-164.
Silverstein, F. E., Faich, G., Goldstein, J. L., Simon, L. S., Pincus, T., Whelton, A., et al.
(2000). Gastrointestinal toxicity with celecoxib vs nonsteroidal anti-
inflammatory drugs for osteoarthritis and rheumatoid arthritis: the CLASS study:
a randomized controlled trial. Celecoxib Longterm Arthritis Safety Study.
Journal of the American Medical Association, 284, 1247–1255.

106
Singh, R. (2008). Omeprazole: An Overview. The Pharmaceutical Magazine, 1-2.
Institute of Pharmacy, Pt. Ravishankar Shukla University.
Slot, J. W., Geuze, H. J., Freeman, B. A., & Crapo, J. D. (1986). Intracellular
localization of the copper-zinc and manganese superoxide dismutase in rat liver
parenchymal cells. Laboratory Investigation, 55, 363-371.
Smith, P., & Heath, D. (1976). Paraquat. CRC Critical Reviews in Toxicology, 4, 411-
445.
Soll, A. H. (1989). Gastric, duodenal, and stress ulcer. In M. H. Sleisenger, & Fordtran,
J. S (Ed.), Gastrointestinal Disease: Pathophysiology/ Diagnosis/Management
(5th ed., pp. 814-879). Philadelphia: WB Saunders.
Stamets, P. (2005). Mycelium Running: How Mushrooms Can Help Save The World.
California: Ten Speed Press.
Suvitayavat, W., Bunyapraphatsara, N., Thirawarapan, S., & Watanbe, K. (1997).
Gastric acid secretion inhibitory and gastric lesion protective effects of aloe
preparation. Journal of Thai Phytopathology, 4(1), 1-11.
Suzuki, C., & Mizuno, T. (1997). Cultivation of Yamabushitake (Hericium erinaceum).
Food Review International, 13, 419–421.
Syam, A. F., Sadikin, M., Wanandi, S. I., & Rani, A. A. (2009). Molecular mechanism
on healing process of peptic ulcer. Acta medica Indonesiana, 41(2), 95-98.
Szabo, S., Kusstatscher, S., Sakoulas, G., Sandor, Z., Vincze, A., & Jadus, M. (1995).
Growth factors: New “endogenous drug” for ulcer healing. Scandinavian
Journal of Gastroenterology, 210, 15-18.
Takezono, Y., Joh, T., Oshima, T., Suzuki, H., Seno, K., Yokoyama, Y., et al. (2004).
Role of prostaglandins in maintaining gastric mucus-cell permeability against
acid exposure. Journal of Laboratory and Clinical Medicine, 143, 52–58.

107
Tan, P., Nyasse, B., Dimo, T., & Mezui, C. (2002). Gastric cytoprotective antiulcer
effects of the leaf methanol extract of Ocimum suave (Lamiaceae) in rats.
Journal of Ethnopharmacology, 82, 69-74.
Tappel, A. L. (1973). Lipid peroxidation damage to cell components. Federation
Proceedings, 32, 1870-1874.
Tarnawski, A. (1993). Cellular mechanisms of gastric ulcer healing. In W. Domschke,
& Konturek, S. J. (Ed.). The Stomach. Berlin New York: Springer.
Tarnawski, A. (2000). Molecular mechanism of ulcer healing. Drug News Perspect, 13,
158–168.
Tarnawski, A. S. (2005). Cellular and Molecular Mechanisms of Gastrointestinal Ulcer
Healing. Digestive Diseases and Sciences, 50, S24–S33.
Tarnawski, A., Hollander, D., Krause, W. J., Dabros, W., Stachura, J., & Gergely, H.
(1990). “Healed” experimental gastric ulcers remain histologically and
ultrastructurally abnormal. Journal of Clinical Gastroenterology, 12, 139–147.
Tarnawski, A., Hollander, D., Stachura, J., Gergely, H., Krause, W. J., & Sarfeh, I. J.
(1991). Role of angiogenesis in healing of experimental gastric ulcer. In F.
Halter, Garner, A., & Tytgat, G. N. J. (Ed.). Mechanisms of Peptic Ulcer
Healing (pp. 165–171). United States, Kluwer Academic Publisher.
Tsukimi, Y., Nozue, C., & Okabe, S. (1996). Effects of leminoprazole, omeprazole and
sucralfate on indomethacin-induced delayed healing of kissing gastric ulcers in
rats. Journal of Gastroenterology and Hepatology, 11, 335-340.
Tytgat, G. N. J. (1986). Colloidal bismuth subcitrate in peptic ulcer disease. South
African Medical Journal, 70, 31-33.
Van Y Persele De Strihou, C. (1977). Potassium homeostasis in renal failure. Kidney
Iniernational, 11, 491—504.
108
Vane, J. R. (1971). Inhibition of Prostaglandin synthesis as a mechanism of action for
aspirin-like drugs. Nature New Biology, 231, 232-235.
Vanwijck, R. (2001). Surgical biology of wound healing. Bulletin et memoires de
l'Academie royale de medecine de Belgique, 56(3-4), 175–184.
Wallace, J. L. (1989). Gastric resistance to acid: is the “mucus-bicarbonate barrier”
functionally redundant? . American Journal of Physiology - Gastrointestinal and
Liver Physiology, 256, G31–G38.
Wallace, J. L. (2005). Recent advances in gastric ulcer therapeutics. Current Opinion in
Pharmacology, 5, 573-577.
Wallace, J. L. (2008). Prostaglandins, NSAIDs, and Gastric Mucosal Protection: Why
Doesn’t the Stomach Digest Itself? Physiological Reviews, 88, 1547–1565.
Wallace, J. L., & McKnight, G.W. (1990). The mucoid cap over superficial gastric
damage in the rat. A high-pH microenvironment dissipated by nonsteroidal anti-
inflammatory drugs and endothelin. Gastroenterology, 99, 295–304.
Wallace, J. L., & Granger, D. N. (1996). The cellular and molecular basis of gastric
mucosal defense. FASEB Journal, 10, 731–740.
Wang, M. X., Guan, D. & Jing, M. D. (1992). Nutritional composition analysis of five
strains of Hericium erinaceus and their utilization. Microbiology Beijing, 19(2),
68-72.
Wasman, S. Q., Mahmood, A. A., Salehhuddin, H., Zahra, A. A., & Salmah, I. (2010).
Cytoprotective activities of Polygonum minus aqueous leaf extract on ethanol-
induced gastric ulcer in rats. Journal of Medicinal Plant Research, 4(24), 2658–
2665.
Wasser, S. P. (2002). Medicinal mushrooms as a source of antitumor and
immunomodulating polysaccharides. Gastroenterology, 60, 258–274.
109
Wasser, S. P., & Weis, A. L. (1999). Medicinal properties of substances occurring in
Higher Basidiomycetes mushrooms: current perspectives. International Journal
of Medicinal Mushrooms, 1, 31–62.
Watanabe, T., Higuchi, K., Tominaga, K., Fujiwara, Y., & Arakawa, T. (2001). Acid
regulates inflammatory response in a rat model of induction of gastric ulcer
recurrence by interleukin 1β. Gut, 48(6), 774-781.
Watthanachaiyingcharoen, R., Phanwichien, K., Pradermwong, A., & Kamkaen, N.
(2009). Acute toxicity test of medicinal plants and herbal remedies of aphthous
alcer. Journal of Health Research, 23(4), 169-174.
Weiner, H. (1991). From simplicity to complexity (1950-1990): The case of peptic
ulceration- II. Animal studies. Psychosomatic Medicine, 53, 491-516.
Wiseman, H., & Halliwell, B. (1996). Damage to DNA by reactive oxygen and nitrogen
species: role in inflammatory disease and progression to cancer. Biochemical
Journal, 313, 17-29.
Wolfe, M. M., & Sachs, G. (2002). Acid suppression: optimizing therapy for
gastroduodenal ulcer healing, gastroesophageal reflex disease and stress-related
erosive syndrome. Gastroenterology, 118, 9-31.
Wong, K. H., Vikineswary, S., Noorlidah, A., Murali, N., & Keynes, R. (2007). Activity
of aqueous extracts of Lion’s Mane mushroom Hericium erinaceus (Bull.:Fr.)
Pers. (Aphyllophoromycetideae) on the neural cell line NG108-15. International
Journal of Medicinal Mushroom, 9, 57-65.
Wong, K. H., Vikineswary, S., Noorlidah, A., Kuppusamy, U. R., & Naidu, M. (2009a).
Effects of cultivation techniques and processing on antimicrobial and
antioxidant activities of Hericium erinaceus (Bull.: Fr.) Pers. extracts. Food
Technology and Biotechnology, 47, 47-55.

110
Wong, K. H., Naidu, M., David, R. P., Abdulla, M. A., Abdullah, N., Kuppusamy, U. R.,
& Vikineswary, S. (2009b). Functional recovery enhancement following Injury
to rodent peroneal nerve by lion’s mane mushroom, Hericium erinaceus (Bull.:
Fr.) Pers. (Aphyllophoromycetideae). International Journal of Medicinal
Mushrooms, 11, 225–236.
Wong, K. H., Naidu, M., David, R. P., Abdulla, M. A., Abdullah, N., Kuppusamy, U. R.,
et al. (2011). Peripheral nerve regeneration following crush injury to rat
peroneal nerve by aqueous extract of medicinal mushroom Hericium erinaceus
(Bull.: Fr.) Pers. (Aphyllophoromycetideae). Evidence-Based Complementary
and Alternative Medicine, 1-10. doi:10.1093/ecam/neq062.
Wu, M. S., Shun, G. T., Lee, W. C., Chen, C. J., Wang, H. P., Lee, W. J., et al. (1998).
Overexpression of p53 in different subtypes of intestinal metaplasia and gastric
cancer. Brtish Journal of Cancer, 78, 971-973.
Xiao, G., & Chapman, B. (1997). Cultivation of Hericium abietis on conifer sawdust.
Canadian Journal of Botany, 75, 1155–1157.
Yamahara, J., Mochizuki, M., Rong, H. Q., Matsuda, H., & Fujimara, H. (1988). The
anti-ulcer effect in rats of ginger constituents. Journal of Ethnopharmacology,
23, 299-304.
Yang, B.K., Park, J. B., & Song, C. H. (2003). Hypolipidemic effect of an exo-
biopolymer produced from a submerged mycelial culture of Hericium erinaceus.
Bioscience, Biotechnology and Biochemistry, 67(6), 1292-1298.
Yoshikawa, T., Miyagawa, H., Yoshida, N., Sugino, S., & Kondo, M. (1986). Increase
in lipid peroxidation in rat gastric mucosal lesions induced by water-immersion
restraint stress. Journal of Clinical Biochemistry and Nutrition, 1, 271-277.
111
Yoshikawa, T., Yoshida, N., Miyagawa, H., Takemura, T., Tanigawa, T., Sugino, S., et
al. (1987). Role of lipid peroxidation in gastric mucosal lesions induced by burn
shock in rats. Journal of Clinical Biochemistry and Nutrition, 2, 163-170.
Yoshikawa, T., Ueda, S., Naito, Y., Takahashi, S., Oyamada, H., Morita, Y., et al.
(1989). Role of oxygen-derived free radicals in gastric mucosal injury induced
by ischema or ischemiareperfusion in rats. Free radical research
communications, 7, 285-291.
Young, J. C., Agashe, V. R., Siegers, K., & Hartl, F. U. (2004). Pathways of chaperone
mediated protein folding in the cytosol. Nature Reviews Molecular Cell Biology,
5, 781-791.
Zeniya, A., Otaka, M., Itoh, H., Kuwabara, T., Fujimori, S., Otani, S., et al. (1995).
Induction and intracellular localization of a 72-kDa heat shock protein in rat
gastric mucosa after water-immersion stress. Journal of Gastroenterology, 30,
572–577.

112
Appendix A: Analytical Methods
a) Gastric mucus barrier
Dissolve 1g of alcian blue in 100ml dH2O, do a series of two times dilution. Rats
stomach tissue homogenated in PBS buffer at a 1:8 ratio, that is 1g of tissue
homogenated in 8 ml of PBS buffer.
Concentration (g/ml, x10-6
) Absorbance at 580nm
1.9 0.0825
3.9 0.1305
7.8 0.167
15.6 0.271
31.2 0.487
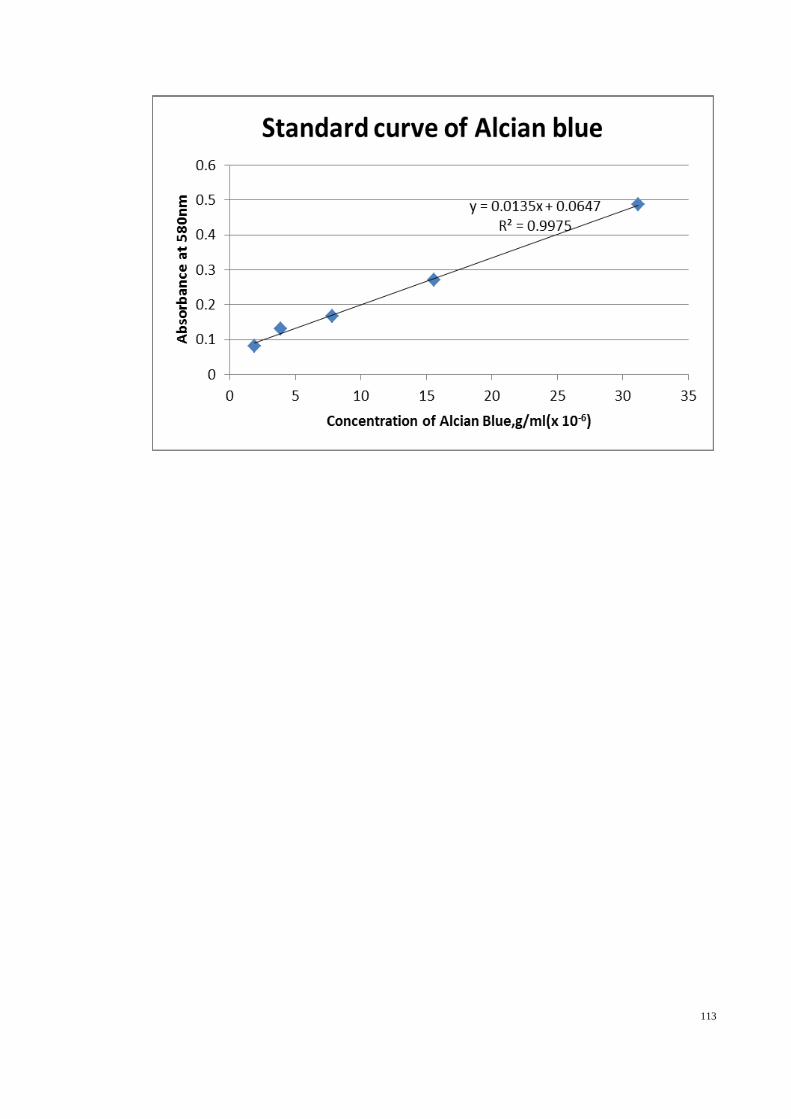
113

114
b) Bradford Test
Prepare stock standard 1mg/ml (5mg/5ml) of BSA
Prepare three to five times dilution
1mg/ml
0.5mg/ml
0.1mg/ml
0.05mg/ml
Concentration of protein (mg/ml) Absorbance at 595nm
0 0
0.05 0.06633
0.1 0.197667
0.25 0.407667
0.5 0.663

115
Standard curve of Bradford was plotted after five times dilution of tissue homogenated
solution.
c) Lipid peroxidation assay: Standard preparation
12.5 µl TEP/ 50ml dH2O
20 µM
10µM 15 µM
5 µM
2.5 µM
2x dilution
2x dilution
2x dilution

116
Reagent preparation
15% TCA : Dissolve 6g of TCA in 40ml dH2O
1% TBA : Dissolve 0.4g of TBA in 40ml dH2O
Concentration of TEP (µm) Absorbance at 532 nm
0 0
2.5 0.06
5 0.123
10 0.25
15 0.332
20 0.409

117
d) SOD
SOD activity (U/ml) Linearized rate
0 1
0.025 1.243644
0.05 1.262366
0.1 1.56117
0.15 1.869427
0.2 1.989831
0.25 2.530172

118
Standard curve of SOD
SOD (U/ml) =
e) CAT
Formaldehyde (µM) Absorbance at 540 nm
0 0
5 0.096
15 0.1875
30 0.262
45 0.4185
60 0.48
75 0.7405
[( ) ]
Sample LR – y-intercept
slope x
0.23 ml
0.01 ml x Sample
dilution
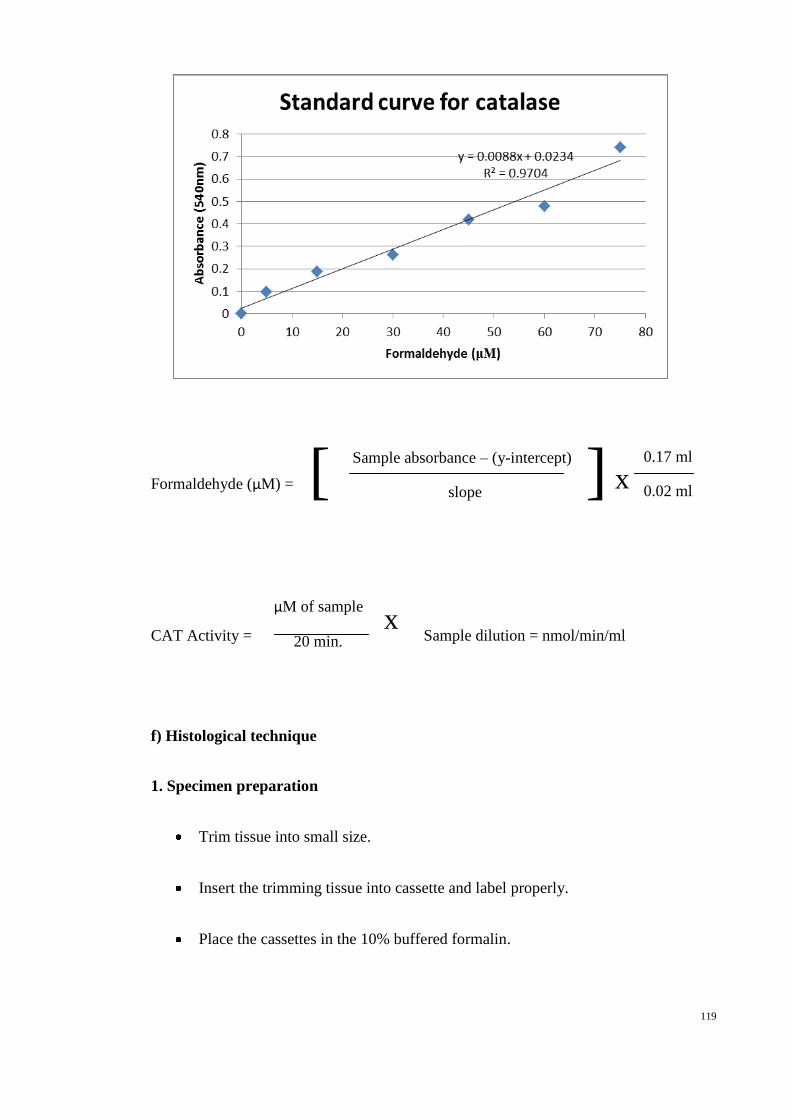
119
Formaldehyde (µM) =
CAT Activity = Sample dilution = nmol/min/ml
f) Histological technique
1. Specimen preparation
Trim tissue into small size.
Insert the trimming tissue into cassette and label properly.
Place the cassettes in the 10% buffered formalin.
[ ] Sample absorbance – (y-intercept)
slope x
0.17 ml
0.02 ml
µM of sample
20 min. x
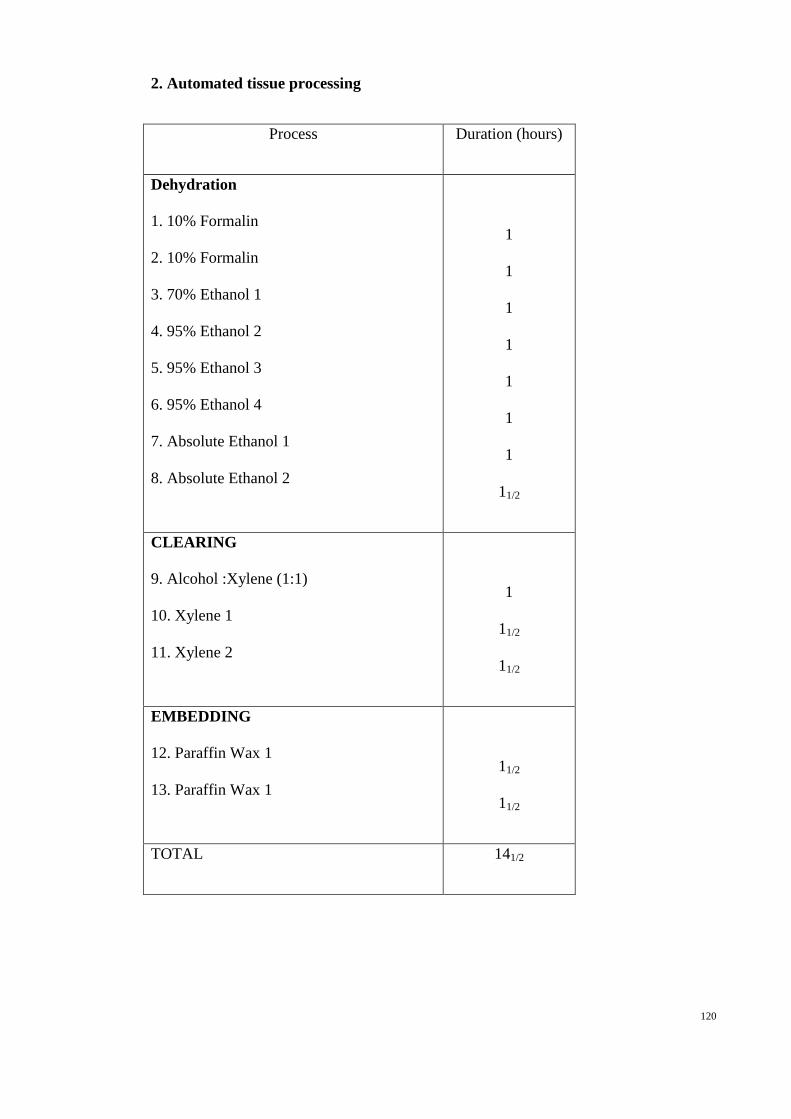
120
2. Automated tissue processing
Process Duration (hours)
Dehydration
1. 10% Formalin
2. 10% Formalin
3. 70% Ethanol 1
4. 95% Ethanol 2
5. 95% Ethanol 3
6. 95% Ethanol 4
7. Absolute Ethanol 1
8. Absolute Ethanol 2
1
1
1
1
1
1
1
11/2
CLEARING
9. Alcohol :Xylene (1:1)
10. Xylene 1
11. Xylene 2
1
11/2
11/2
EMBEDDING
12. Paraffin Wax 1
13. Paraffin Wax 1
11/2
11/2
TOTAL 141/2

121
3. Tissue blocking
Place the tissue in mold properly
Load the paraffin wax into the mold.
Place the mold on cold plate area and wait until it solidifies.
4. Sectioning
Section the tissue blocking by using a rotary microtome to a thickness of 5 µm.
Put the ribbon section onto 42 °C water bath.
Pick the best tissue section on water bath by using clean glass slide.
Dehydrate the slides in an oven at 55°C for at least 24 hours.
5. Staining
a) Haematoxylin and Eosin staining
Process (solution) Time duration (minutes)
DEWAXING
1. Xylene 1
2. Xylene 1
3
3
REHYDRATION
3. Absolute Alcohol
4. 95%Alcohol 1
5. 95%Alcohol 2
6. 70%Alcohol
2
2
2
2
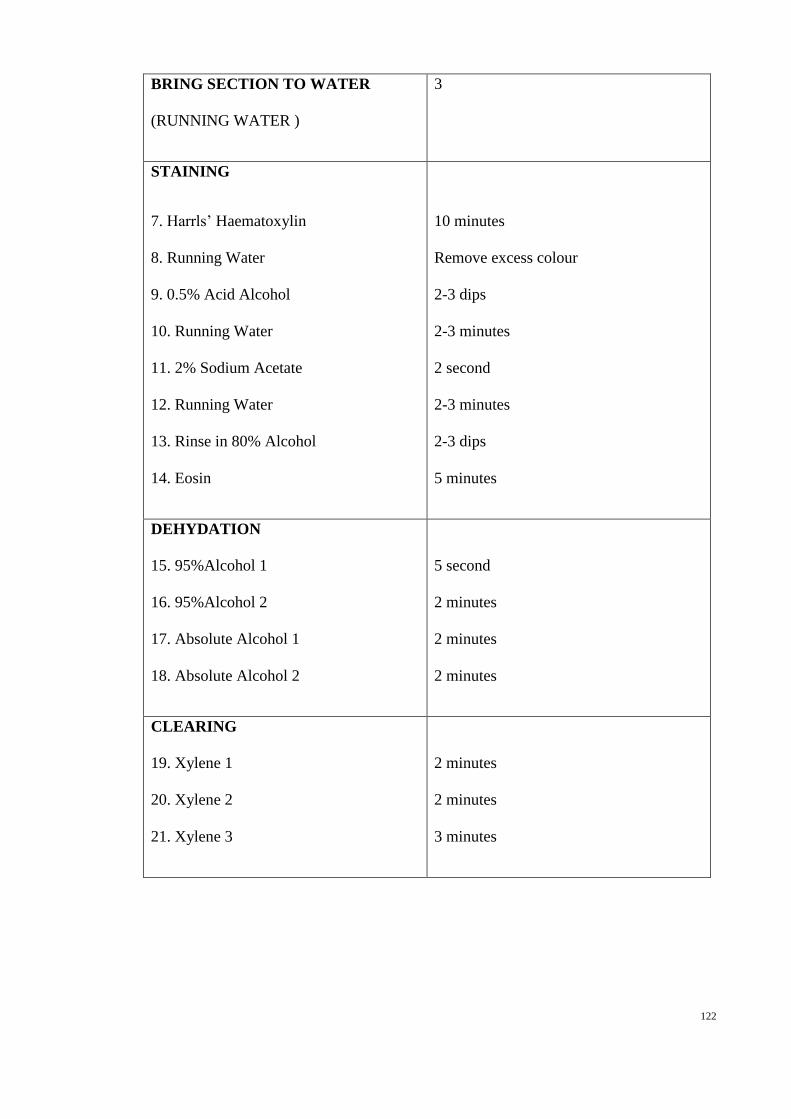
122
BRING SECTION TO WATER
(RUNNING WATER )
3
STAINING
7. Harrls’ Haematoxylin
8. Running Water
9. 0.5% Acid Alcohol
10. Running Water
11. 2% Sodium Acetate
12. Running Water
13. Rinse in 80% Alcohol
14. Eosin
10 minutes
Remove excess colour
2-3 dips
2-3 minutes
2 second
2-3 minutes
2-3 dips
5 minutes
DEHYDATION
15. 95%Alcohol 1
16. 95%Alcohol 2
17. Absolute Alcohol 1
18. Absolute Alcohol 2
5 second
2 minutes
2 minutes
2 minutes
CLEARING
19. Xylene 1
20. Xylene 2
21. Xylene 3
2 minutes
2 minutes
3 minutes

123
b) Immunohistochemistry staining
Process (solution) Time duration
(minutes)
DEWAXING
1. Xylene 1
2. Xylene 2
3. Xylene 3
5
5
5
REHYDRATION
4. 95%Alcohol
5. 85%Alcohol
6. 70%Alcohol
7. Distilled water
20 dips
20 dips
20 dips
5 minutes
WASHING
8. Soak in 10X TBS wash buffer and heat in oven at low
temperature.
9. Cool down in room temperature
10. Tap off excess TBS buffer.
11. Use lintless tissue to wipe around the specimen.
20
STAINING
i) Peroxidase block
Tap off excess wash buffer. Using a lintless tissue to
wipe around the specimen.
5
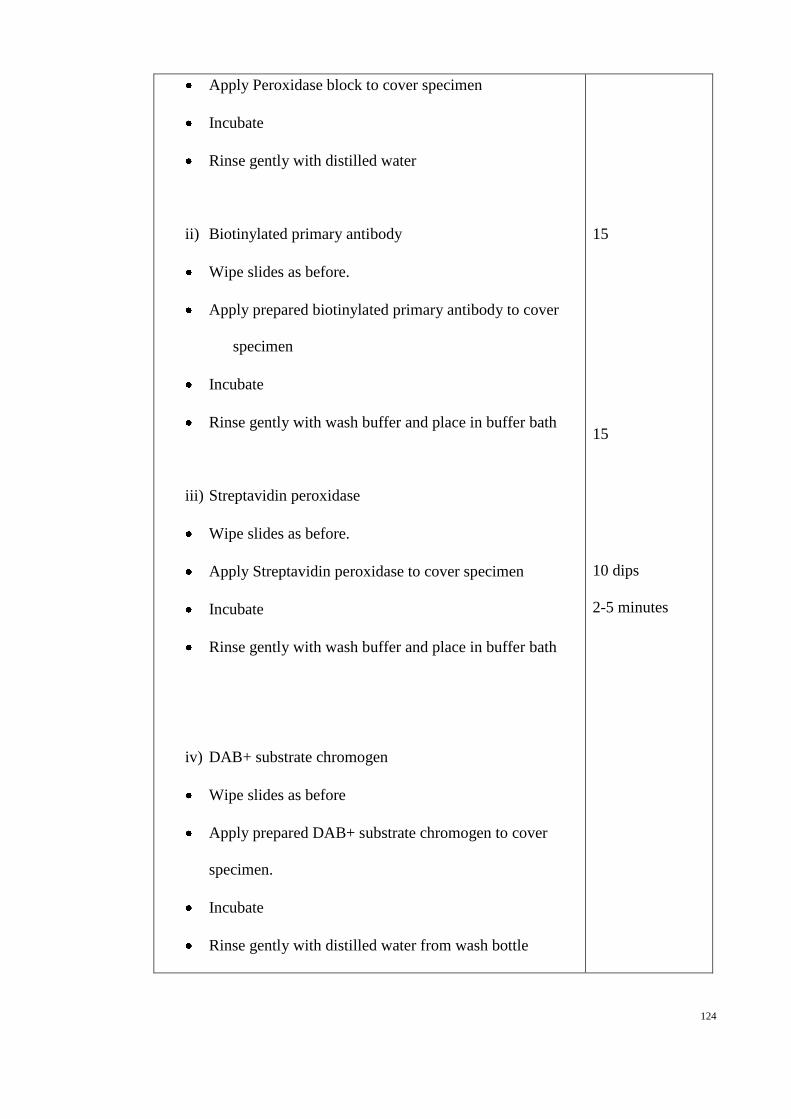
124
Apply Peroxidase block to cover specimen
Incubate
Rinse gently with distilled water
ii) Biotinylated primary antibody
Wipe slides as before.
Apply prepared biotinylated primary antibody to cover
specimen
Incubate
Rinse gently with wash buffer and place in buffer bath
iii) Streptavidin peroxidase
Wipe slides as before.
Apply Streptavidin peroxidase to cover specimen
Incubate
Rinse gently with wash buffer and place in buffer bath
iv) DAB+ substrate chromogen
Wipe slides as before
Apply prepared DAB+ substrate chromogen to cover
specimen.
Incubate
Rinse gently with distilled water from wash bottle
15
15
10 dips
2-5 minutes

125
v) Haematoxylin counterstain
Immerse slides in a bath of haematoxylin.
0.037mol/L ammonia
Rinse slides in a bath of distilled water
6. Mounting
Mount stained tissue with DPX mounting media and cover the tissue with cover slip and
wipe the slide to remove excess xylene and then observed under light microscope.
Flow chart of histological technique
Preparation of specimen
Automated tissue processing
Tissue blocking
Sectioning
Staining
Mounting

126
Appendix B: Results of Experiments
a) Acute toxicity test
i) Body weight of rat
Table 1. Descriptive: body weight of male rats in control group (Treatment)
Table 2. ANOVA: body weight of male rats in control group (Treatment)
N Mean
Std.
Deviation
Std.
Error 95% Confidence
Interval for Mean Minimum Maximum
Lower
Bound
Upper
Bound
Day
0
6 247.5000 33.88067 13.83173 211.9444 283.0556 190.00 280.00
Day
7
6 278.6667 29.83063 12.17830 247.3613 309.9720 230.00 305.00
Day
14
6 288.6667 28.40892 11.59789 258.8533 318.4800 241.00 313.00
Total 18 271.6111 34.09009 8.03511 254.6585 288.5637 190.00 313.00
Sum of
Squares
df Mean Square F Sig.
Between
Groups
5532.111 2 2766.056 2.917 .085
Within
Groups
14224.167 15 948.278
Total 19756.278 17
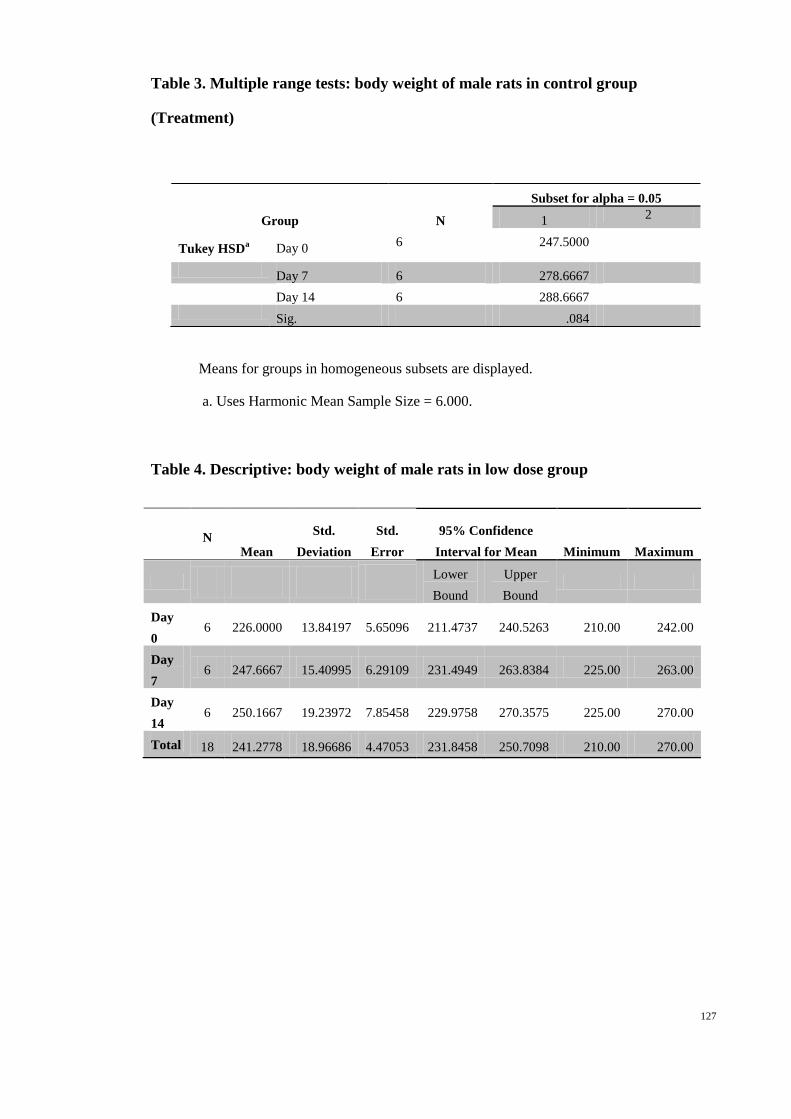
127
Table 3. Multiple range tests: body weight of male rats in control group
(Treatment)
Means for groups in homogeneous subsets are displayed.
a. Uses Harmonic Mean Sample Size = 6.000.
Table 4. Descriptive: body weight of male rats in low dose group
N Mean
Std.
Deviation
Std.
Error
95% Confidence
Interval for Mean Minimum Maximum
Lower
Bound
Upper
Bound
Day
0 6 226.0000 13.84197 5.65096 211.4737 240.5263 210.00 242.00
Day
7 6 247.6667 15.40995 6.29109 231.4949 263.8384 225.00 263.00
Day
14 6 250.1667 19.23972 7.85458 229.9758 270.3575 225.00 270.00
Total 18 241.2778 18.96686 4.47053 231.8458 250.7098 210.00 270.00
Group N
Subset for alpha = 0.05
1 2
Tukey HSDa Day 0
6 247.5000
Day 7 6 278.6667
Day 14 6 288.6667
Sig. .084

128
Table 5. ANOVA: body weight of male rats in low dose group
Table 6. Multiple range tests: body weight of male rats in low dose group
Tukey HSDa Group N Subset for alpha = 0.05
1 2
Day 0 6 226.0000
Day 7 6 247.6667
Day 14 6 250.1667
Sig.
.053
Table 7. Descriptive: body weight of male rats in high dose group
N Mean Std.
Deviation
Std.
Error
95% Confidence
Interval for Mean Minimum Maximum
Lower
Bound
Upper
Bound
Day
0
6 229.3333 38.89302 15.87801 188.5176 270.1491 176.00 280.00
Day
7
6 262.5000 46.51344 18.98903 213.6871 311.3129 203.00 319.00
Day
14
6 268.8333 49.32917 20.13855 217.0655 320.6011 204.00 325.00
Total 18 253.5556 45.98494 10.83875 230.6878 276.4233 176.00 325.00
Sum of
Squares df
Mean
Square F Sig.
Between
Groups 2119.444 2 1059.722 3.978 .041
Within
Groups 3996.167 15 266.411
Total 6115.611 17
Means for groups in homogeneous subsets are displayed.
a. Uses Harmonic Mean Sample Size = 6.000.

129
Table 8. ANOVA: body weight of male rats in high dose group
Table 9. Multiple range tests: body weight of male rats in high dose group
Group N Subset for alpha = 0.05
1
Tukey HSDa Day 0 6 229.3333
Day 7 6 262.5000
Day 14 6 268.8333
Sig.
.312
Means for groups in homogeneous subsets are displayed.
a. Uses Harmonic Mean Sample Size = 6.000.
Table 10. Descriptive: body weight of female rats in control group
Sum of
Squares df Mean Square F Sig.
Between
Groups
5400.778 2 2700.389 1.326 .295
Within
Groups
30547.667 15 2036.511
Total 35948.444 17
N Mean Std.
Deviation
Std.
Error
95% Confidence
Interval for Mean Minimum Maximum
Lower
Bound
Upper
Bound
Day 0 6 186.3333 19.68417 8.03603 165.6761 206.9906 164.00 213.00
Day 7 6 189.6667 23.12286 9.43987 165.4007 213.9326 167.00 219.00
Day
14
6 195.5000 17.87456 7.29726 176.7418 214.2582 175.00 220.00
Total 18 190.5000 19.50339 4.59699 180.8012 200.1988 164.00 220.00
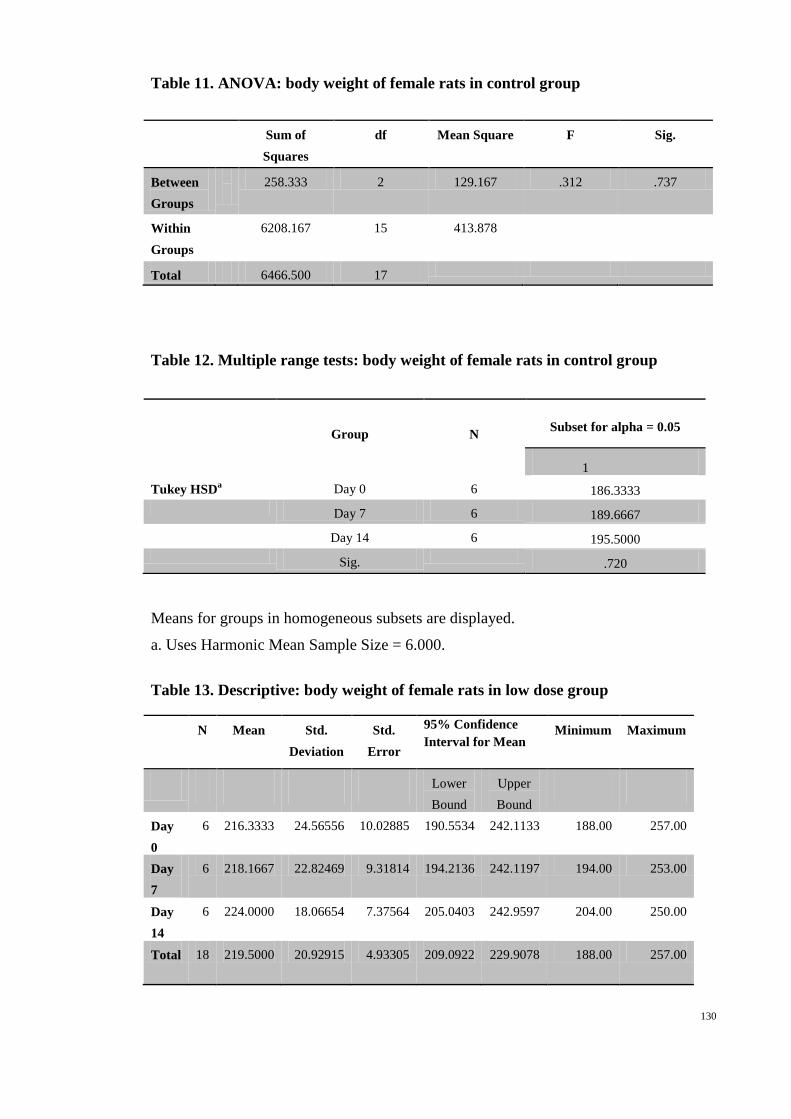
130
Table 11. ANOVA: body weight of female rats in control group
Sum of
Squares
df Mean Square F Sig.
Between
Groups
258.333 2 129.167 .312 .737
Within
Groups
6208.167 15 413.878
Total 6466.500 17
Table 12. Multiple range tests: body weight of female rats in control group
Means for groups in homogeneous subsets are displayed.
a. Uses Harmonic Mean Sample Size = 6.000.
Table 13. Descriptive: body weight of female rats in low dose group
N Mean Std.
Deviation
Std.
Error
95% Confidence
Interval for Mean Minimum Maximum
Lower
Bound
Upper
Bound
Day
0
6 216.3333 24.56556 10.02885 190.5534 242.1133 188.00 257.00
Day
7
6 218.1667 22.82469 9.31814 194.2136 242.1197 194.00 253.00
Day
14
6 224.0000 18.06654 7.37564 205.0403 242.9597 204.00 250.00
Total 18 219.5000 20.92915 4.93305 209.0922 229.9078 188.00 257.00
Group N Subset for alpha = 0.05
1
Tukey HSDa Day 0 6 186.3333
Day 7 6 189.6667
Day 14 6 195.5000
Sig.
.720

131
Table 14. ANOVA: body weight of female rats in low dose group
Sum of
Squares
df Mean Square F Sig.
Between
Groups 192.333 2 96.167 .199 .822
Within
Groups 7254.167 15 483.611
Total 7446.500 17
Table 15. Multiple range tests: body weight of female rats in low dose group
Group N Subset for alpha = 0.05
1
Tukey HSDa Day 0 6 216.3333
Day 7 6 218.1667
Day 14 6 224.0000
Sig.
.820
Means for groups in homogeneous subsets are displayed.
a. Uses Harmonic Mean Sample Size = 6.000.
Table 16. Descriptive: body weight of female rats in high dose group
N Mean Std.
Deviation
Std.
Error
95% Confidence
Interval for Mean Minimum Maximum
Lower
Bound
Upper
Bound
Day 0 6 199.8333 16.00521 6.53410 183.0369 216.6298 168.00 212.00
Day 7 6 202.6667 16.39105 6.69162 185.4653 219.8680 174.00 222.00
Day
14
6 207.3333 14.69240 5.99815 191.9146 222.7521 180.00 221.00
Total 18 203.2778 15.09891 3.55885 195.7693 210.7863 168.00 222.00
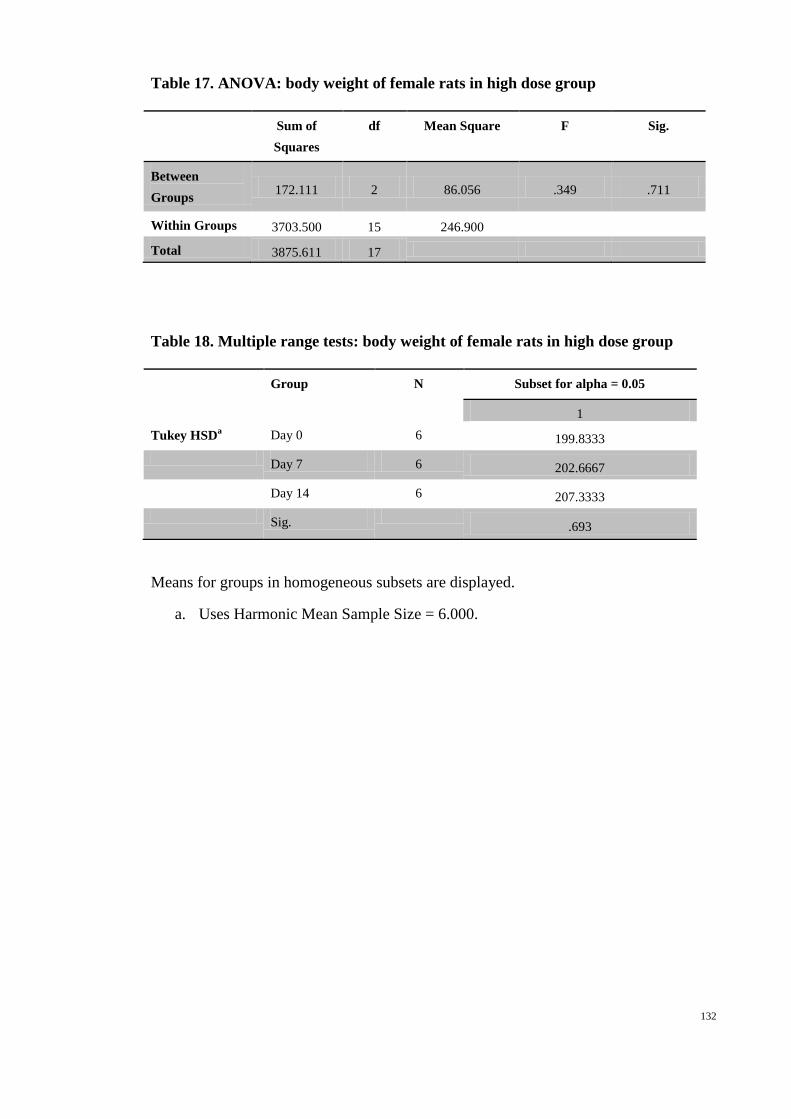
132
Table 17. ANOVA: body weight of female rats in high dose group
Sum of
Squares
df Mean Square F Sig.
Between
Groups 172.111 2 86.056 .349 .711
Within Groups 3703.500 15 246.900
Total 3875.611 17
Table 18. Multiple range tests: body weight of female rats in high dose group
Group N Subset for alpha = 0.05
1
Tukey HSDa Day 0 6 199.8333
Day 7 6 202.6667
Day 14 6 207.3333
Sig.
.693
Means for groups in homogeneous subsets are displayed.
a. Uses Harmonic Mean Sample Size = 6.000.
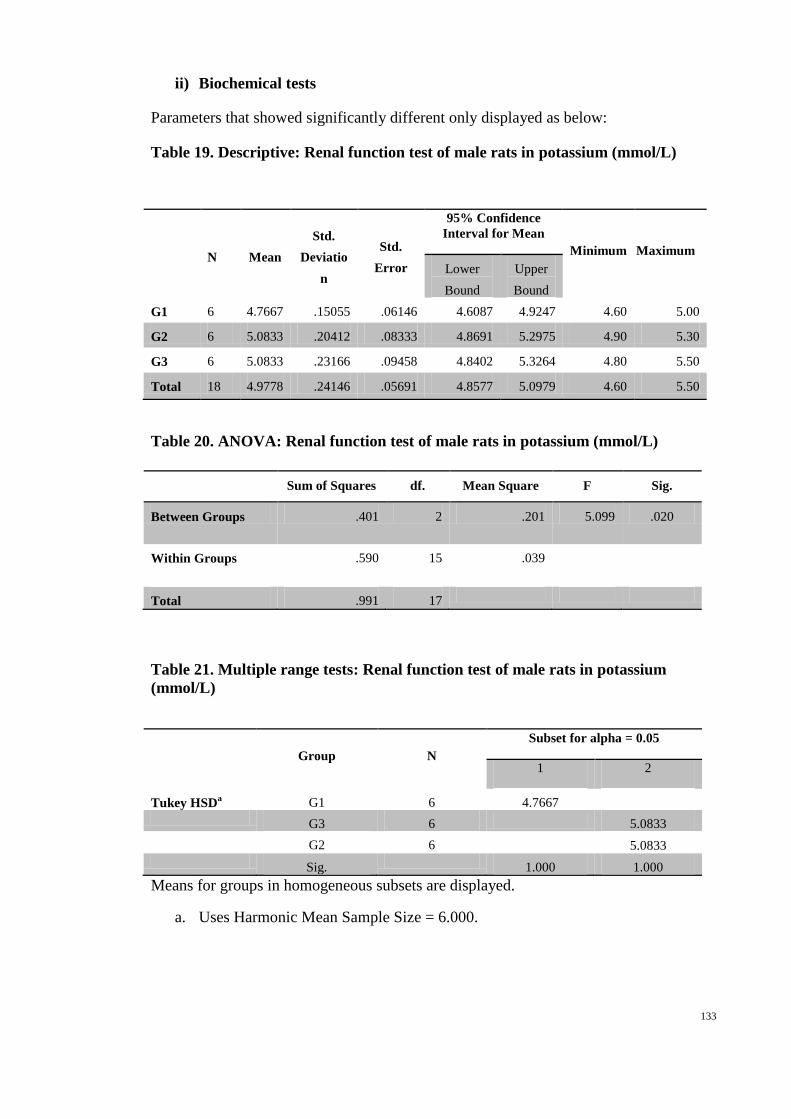
133
ii) Biochemical tests
Parameters that showed significantly different only displayed as below:
Table 19. Descriptive: Renal function test of male rats in potassium (mmol/L)
N Mean
Std.
Deviatio
n
Std.
Error
95% Confidence
Interval for Mean
Minimum Maximum
Lower
Bound
Upper
Bound
G1 6 4.7667 .15055 .06146 4.6087 4.9247 4.60 5.00
G2 6 5.0833 .20412 .08333 4.8691 5.2975 4.90 5.30
G3 6 5.0833 .23166 .09458 4.8402 5.3264 4.80 5.50
Total 18 4.9778 .24146 .05691 4.8577 5.0979 4.60 5.50
Table 20. ANOVA: Renal function test of male rats in potassium (mmol/L)
Table 21. Multiple range tests: Renal function test of male rats in potassium
(mmol/L)
Group N
Subset for alpha = 0.05
1 2
Tukey HSDa G1 6 4.7667
G3 6 5.0833
G2 6 5.0833
Sig.
1.000 1.000
Means for groups in homogeneous subsets are displayed.
a. Uses Harmonic Mean Sample Size = 6.000.
Sum of Squares df. Mean Square F Sig.
Between Groups .401 2 .201 5.099 .020
Within Groups .590 15 .039
Total .991 17

134
Table 22. Descriptives: Liver function test of male rats in Alanine
Aminotransferase (IU/L)
N Mean
Std.
Deviatio
n
Std.
Error
95% Confidence
Interval for Mean
Minimum Maximum
Lower
Bound
Upper
Bound
G1 6 51.8333 4.70815 1.92209 46.8924 56.7742 45.00 58.00
G2 6 48.0000 1.41421 .57735 46.5159 49.4841 46.00 50.00
G3 6 46.5000 3.56371 1.45488 42.7601 50.2399 42.00 50.00
Total 18 48.7778 4.02281 .94819 46.7773 50.7783 42.00 58.00
Table 23. ANOVA: Liver function test of male rats in Alanine Aminotransferase
(IU/L)
Table 24. Multiple range tests: Liver function test of male rats in Alanine
Aminotransferase (IU/L)
Group N
Subset for alpha = 0.05
1 2
Tukey HSDa G3 6 46.5000
G2 6 48.0000 48.0000
G1 6 51.8333
Sig. .743 .175
Means for groups in homogeneous subsets are displayed.
a. Uses Harmonic Mean Sample Size = 6.000.
Sum of Squares df. Mean Square F Sig.
Between Groups 90.778 2 45.389 3.693 .050
Within Groups 184.333 15 12.289
Total 275.111 17

135
Table 25. Descriptives: Liver function test of female rats in Alkaline Phosphatase
(IU/L)
N Mean Std.
Deviation
Std.
Error
95% Confidence
Interval for Mean
Minimum Maximum
Lower
Bound
Upper
Bound
G1 6 114.8333 24.73392 10.09758 88.8767 140.7900 84.00 159.00
G2 6 72.8333 12.63988 5.16021 59.5686 86.0981 53.00 89.00
G3 6 94.0000 17.50429 7.14609 75.6304 112.3696 75.00 125.00
Total 18 93.8889 25.06671 5.90828 81.4235 106.3543 53.00 159.00
Table 26. ANOVA: Liver function test of female rats in Alkaline Phosphatase
(IU/L)
Table 27. Multiple range tests: Liver function test of female rats in Alkaline
Phosphatase (IU/L)
Group N
Subset for alpha = 0.05
1 2
Tukey HSDa G2 6 72.8333
G3 6 94.0000 94.0000
G1 6 114.8333
Sig. .163 .172
Means for groups in homogeneous subsets are displayed.
a. Uses Harmonic Mean Sample Size = 6.000.
Sum of Squares df. Mean Square F Sig.
Between Groups 5292.111 2 2646.056 7.364 .006
Within Groups 5389.667 15 359.311
Total 10681.778 17

136
b) Ulcer prevention:
i) Ulcer area
Table 28. Descriptives: ulcer area of rats in ulcer prevention test
N Mean Std.
Deviation
Std.
Error
95% Confidence
Interval for Mean Minimum Maximum
Lower
Bound
Upper
Bound
Positive
Group
6 285.6000 48.11985 19.64485 235.1013 336.0987 223.20 360.00
Negative
Group
6 894.0000 89.86069 36.68547 799.6970 988.3030 756.00 993.60
50mg/kg
Group
6 727.2000 65.83179 26.87571 658.1138 796.2862 640.80 806.40
100mg/kg
Group
6 602.4000 72.09594 29.43304 526.7400 678.0600 504.00 720.00
200mg/kg
Group
6 453.6000 68.30520 27.88548 381.9181 525.2819 367.20 525.60
400mg/kg
Group
6 240.0000 42.39245 17.30665 195.5118 284.4882 172.80 280.80
Total 36 533.8000 244.31641 40.71940 451.1352 616.4648 172.80 993.60
Table 29. ANOVA: ulcer area of rats in ulcer prevention test
Sum of Squares df Mean Square F Sig.
Between Groups 1957243.680 5 391448.736 89.017 .000
Within Groups 131924.160 30 4397.472
Total 2089167.840 35

137
Table 30. Multiple range tests: ulcer area of rats in ulcer prevention test
Group N Subset for alpha = 0.05
1 2 3 4 5
Tukey
HSDa
400mg/kg Group 6 240.0000
Positive Group 6 285.6000
200mg/kg Group 6
453.6000
100mg/kg Group 6
602.4000
50mg/kg Group 6
727.2000
Negative Group 6
894.0000
Sig.
.838 1.000 1.000 1.000 1.000
Means for groups in homogeneous subsets are displayed.
a. Uses Harmonic Mean Sample Size = 6.000.
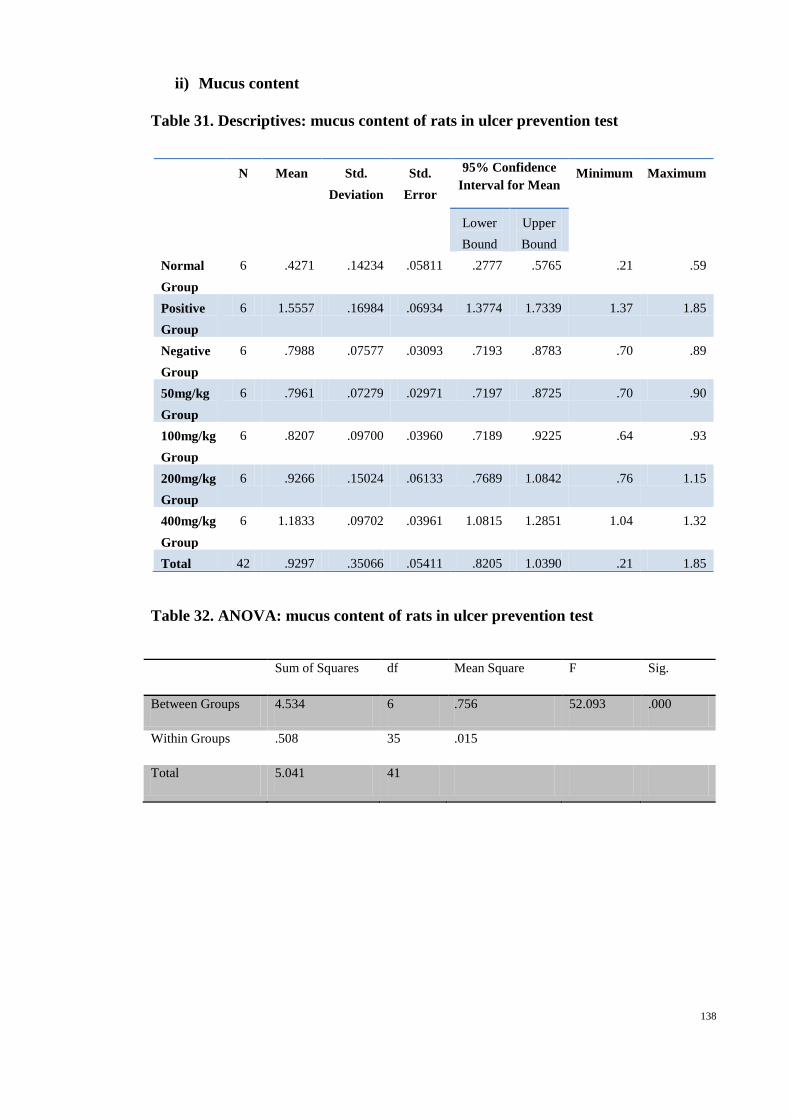
138
ii) Mucus content
Table 31. Descriptives: mucus content of rats in ulcer prevention test
Table 32. ANOVA: mucus content of rats in ulcer prevention test
Sum of Squares df Mean Square F Sig.
Between Groups 4.534 6 .756 52.093 .000
Within Groups .508 35 .015
Total 5.041 41
N Mean Std.
Deviation
Std.
Error
95% Confidence
Interval for Mean Minimum Maximum
Lower
Bound
Upper
Bound
Normal
Group
6 .4271 .14234 .05811 .2777 .5765 .21 .59
Positive
Group
6 1.5557 .16984 .06934 1.3774 1.7339 1.37 1.85
Negative
Group
6 .7988 .07577 .03093 .7193 .8783 .70 .89
50mg/kg
Group
6 .7961 .07279 .02971 .7197 .8725 .70 .90
100mg/kg
Group
6 .8207 .09700 .03960 .7189 .9225 .64 .93
200mg/kg
Group
6 .9266 .15024 .06133 .7689 1.0842 .76 1.15
400mg/kg
Group
6 1.1833 .09702 .03961 1.0815 1.2851 1.04 1.32
Total 42 .9297 .35066 .05411 .8205 1.0390 .21 1.85
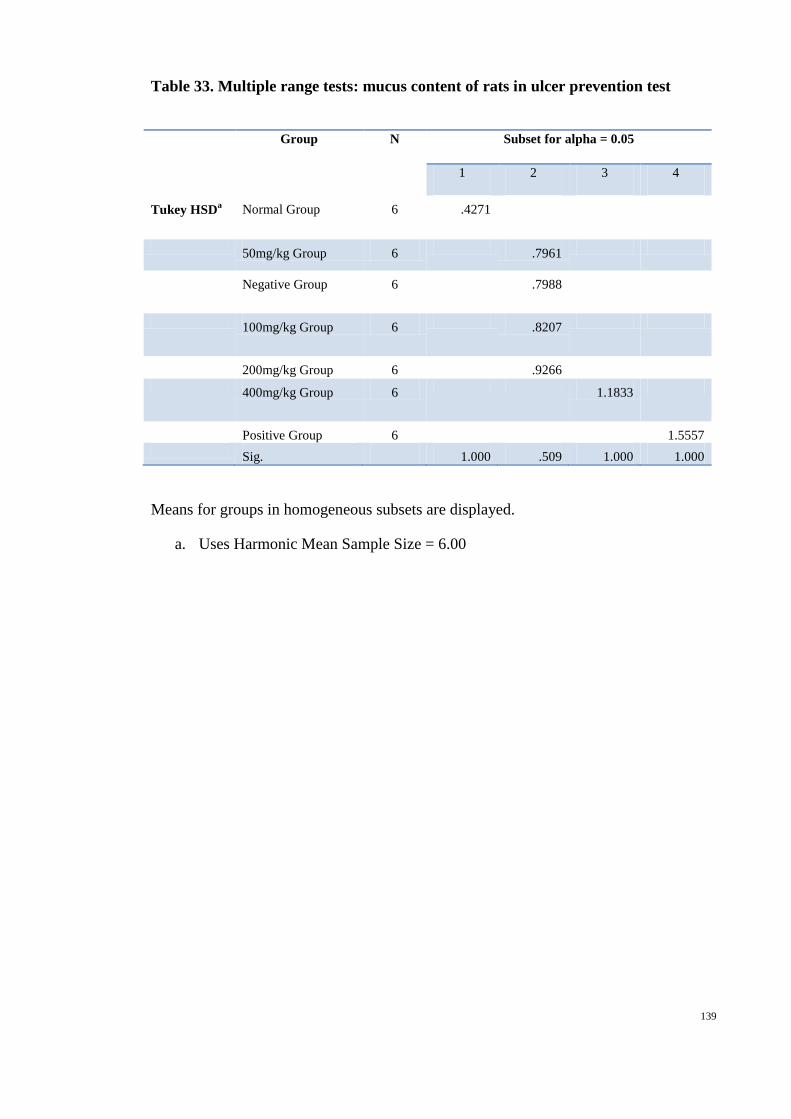
139
Table 33. Multiple range tests: mucus content of rats in ulcer prevention test
Group N Subset for alpha = 0.05
1 2 3 4
Tukey HSDa Normal Group 6 .4271
50mg/kg Group 6 .7961
Negative Group 6 .7988
100mg/kg Group 6 .8207
200mg/kg Group 6 .9266
400mg/kg Group 6 1.1833
Positive Group 6 1.5557
Sig. 1.000 .509 1.000 1.000
Means for groups in homogeneous subsets are displayed.
a. Uses Harmonic Mean Sample Size = 6.00

140
iii) Alcian blue
Table 34. Descriptives: alcian blue of rats in ulcer prevention test
Table 35. ANOVA: alcian blue of rats in ulcer prevention test
Sum of Squares df Mean Square F Sig.
Between Groups 401.495 6 66.916 30.543 .000
Within Groups 76.681 35 2.191
Total 478.176 41
N
Mean Std.
Deviation
Std.
Error
95% Confidence
Interval for Mean
Minimum Maximum
Lower
Bound
Upper
Bound
Non
Treatment
Group
6 5.0099 1.12988 .46127 3.8241 6.1956 3.21 6.10
Positive
Group
6 6.7259 1.64754 .67261 4.9969 8.4549 4.91 9.13
Negative
Group
6 3.4173 .31572 .12889 3.0860 3.7486 2.84 3.80
Extract
50mg/kg
Group
6 8.0963 1.70917 .69777 6.3026 9.8900 6.17 10.24
Extract
100mg/kg
Group
6 11.1951 1.09611 .44749 10.0448 12.3454 9.87 12.76
Extract
200mg/kg
Group
6 12.2938 1.49231 .60923 10.7277 13.8599 10.02 14.02
Extract
400mg/kg
Group
6 10.6395 2.21265 .90331 8.3175 12.9615 8.39 13.58
Total 42 8.1968 3.41509 .52696 7.1326 9.2610 2.84 14.02

141
Table 36. Multiple range tests: alcian blue of rats in ulcer prevention test
Means for groups in homogeneous subsets are displayed.
a. Uses Harmonic Mean Sample Size = 6.000.
Group N Subset for alpha = 0.05
1 2 3 4 5
Tukey
HSDa
Negative Group 6 3.4173
Non Treatment
Group
6 5.0099 5.0099
Positive Group 6
6.7259 6.7259
Extract 50mg/kg
Group
6
8.0963 8.0963
Extract 400mg/kg
Group
6
10.6395 10.6395
Extract 100mg/kg
Group
6
11.1951
Extract 200mg/kg
Group
6
12.2938
Sig.
.517 .428 .681 .071 .472
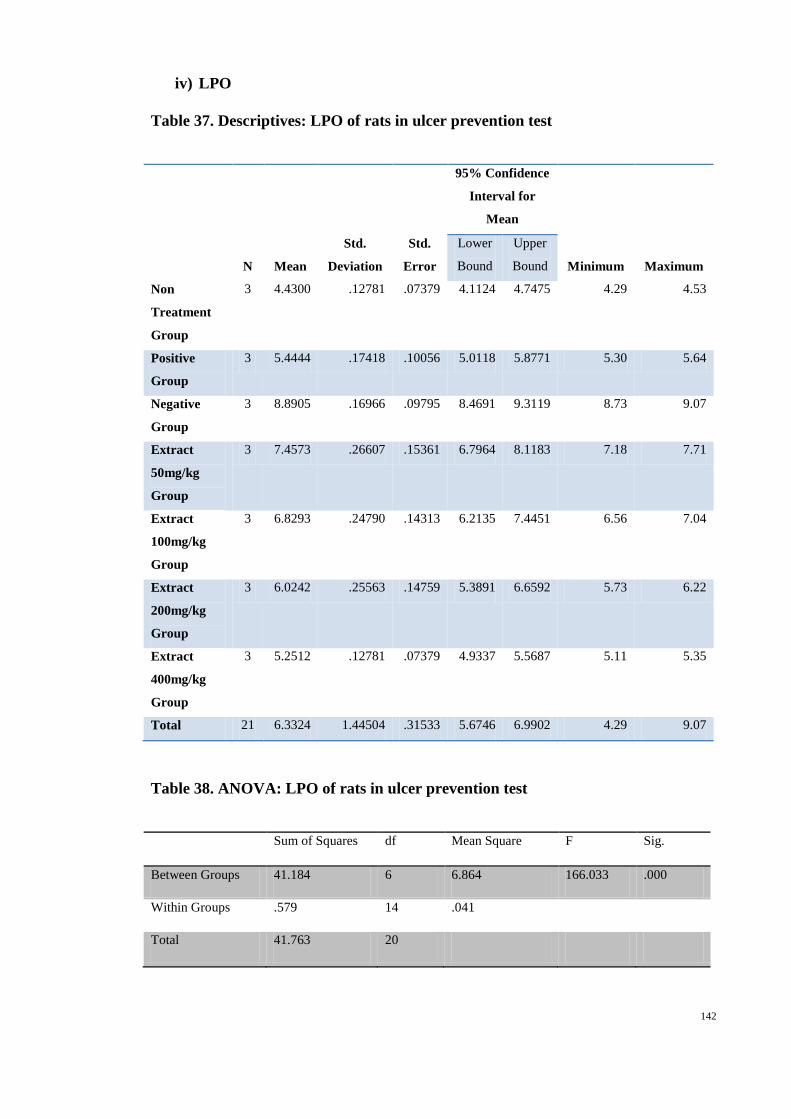
142
iv) LPO
Table 37. Descriptives: LPO of rats in ulcer prevention test
N Mean
Std.
Deviation
Std.
Error
95% Confidence
Interval for
Mean
Minimum Maximum
Lower
Bound
Upper
Bound
Non
Treatment
Group
3 4.4300 .12781 .07379 4.1124 4.7475 4.29 4.53
Positive
Group
3 5.4444 .17418 .10056 5.0118 5.8771 5.30 5.64
Negative
Group
3 8.8905 .16966 .09795 8.4691 9.3119 8.73 9.07
Extract
50mg/kg
Group
3 7.4573 .26607 .15361 6.7964 8.1183 7.18 7.71
Extract
100mg/kg
Group
3 6.8293 .24790 .14313 6.2135 7.4451 6.56 7.04
Extract
200mg/kg
Group
3 6.0242 .25563 .14759 5.3891 6.6592 5.73 6.22
Extract
400mg/kg
Group
3 5.2512 .12781 .07379 4.9337 5.5687 5.11 5.35
Total 21 6.3324 1.44504 .31533 5.6746 6.9902 4.29 9.07
Table 38. ANOVA: LPO of rats in ulcer prevention test
Sum of Squares df Mean Square F Sig.
Between Groups 41.184 6 6.864 166.033 .000
Within Groups .579 14 .041
Total 41.763 20

143
Table 39. Multiple range tests: LPO of rats in ulcer prevention test
Means for groups in homogeneous subsets are displayed.
a. Uses Harmonic Mean Sample Size = 3.000.
Group N
Subset for alpha = 0.05
1 2 3 4 5 6
Tukey
HSDa
Non Treatment
Group
3 4.4300
Extract 400mg/kg
Group
3
5.2512
Positive Group 3
5.4444
Extract 200mg/kg
Group
3
6.0242
Extract 100mg/kg
Group
3
6.8293
Extract 50mg/kg
Group
3
7.4573
Negative Group 3
8.8905
Sig.
1.000 .896 1.000 1.000 1.000 1.000

144
v) SOD
Table 40. Descriptives: SOD of rats in ulcer prevention test
Table 41. ANOVA: SOD of rats in ulcer prevention test
Sum of Squares df Mean Square F Sig.
Between Groups 105.725 6 17.621 78.550 .000
Within Groups 3.141 14 .224
Total 108.866 20
N
Mean
Std.
Deviation
Std.
Error
95% Confidence
Interval for
Mean
Minimum
Maximum
Lower
Bound
Upper
Bound
Non
Treatment
Group
3
8.8161 .53526 .30903 7.4865 10.1458 8.26 9.33
Positive Group 3 5.7701 .34725 .20049 4.9074 6.6327 5.37 5.98
Negative
Group
3 1.8890 .28329 .16356 1.1852 2.5927 1.64 2.20
Extract
50mg/kg
Group
3
2.1032 .25757 .14871 1.4633 2.7430 1.90 2.39
Extract
100mg/kg
Group
3
4.3537 .58925 .34021 2.8899 5.8175 3.95 5.03
Extract
200mg/kg
Group
3
6.2390 .66930 .38642 4.5764 7.9016 5.54 6.87
Extract
400mg/kg
Group
3
5.3168 .47054 .27167 4.1480 6.4857 4.79 5.69
Total 21 4.9268 2.33308 .50912 3.8648 5.9888 1.64 9.33

145
Table 42. Multiple range tests: SOD of rats in ulcer prevention test
Means for groups in homogeneous subsets are displayed.
a. Uses Harmonic Mean Sample Size = 3.000.
Group N
Subset for alpha = 0.05
1 2 3 4 5
Tukey
HSDa
Negative Group 3 1.8890
Extract 50mg/kg
Group
3 2.1032
Extract 100mg/kg
Group
3 4.3537
Extract 400mg/kg
Group
3 5.3168 5.3168
Positive Group 3 5.7701
Extract 200mg/kg
Group
3 6.2390
Non Treatment
Group
3 8.8161
Sig. .997 .234 .273 1.000

146
vi) CAT
Table 43. Descriptives: CAT of rats in ulcer prevention test
N
Mean
Std.
Deviation
Std.
Error
95% Confidence
Interval for Mean
Minimum
Maximum
Lower
Bound
Upper
Bound
Non
treatment
Group
3 179.2439 20.59684 11.89159 128.0785 230.4093 166.61 203.01
Positive
Group
3 68.5147 6.52168 3.76529 52.3139 84.7154 62.32 75.32
Negative
Group
3 112.1032 15.27800 8.82076 74.1505 150.0558 100.08 129.30
Extract
50mg/kg
Group
3 40.4522 4.68744 2.70629 28.8080 52.0965 37.60 45.86
Extract
100mg/kg
Group
3 96.2136 18.41117 10.62970 50.4778 141.9495 83.11 117.26
Extract
200mg/kg
Group
3 135.9413 11.31900 6.53503 107.8233 164.0592 123.84 146.27
Extract
400mg/kg
Group
3 126.0888 10.11856 5.84195 100.9529 151.2246 114.56 133.49
Total 21 108.3654 44.70120 9.75460 88.0176 128.7131 37.60 203.01
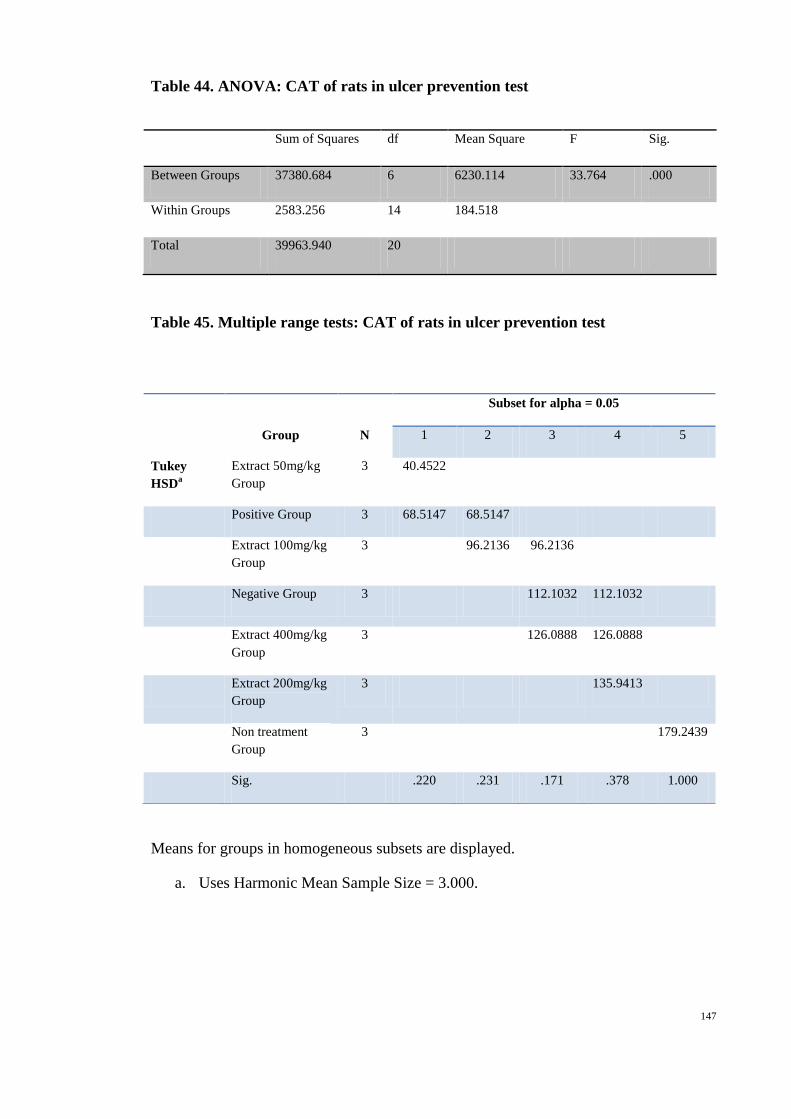
147
Table 44. ANOVA: CAT of rats in ulcer prevention test
Sum of Squares df Mean Square F Sig.
Between Groups 37380.684 6 6230.114 33.764 .000
Within Groups 2583.256 14 184.518
Total 39963.940 20
Table 45. Multiple range tests: CAT of rats in ulcer prevention test
Means for groups in homogeneous subsets are displayed.
a. Uses Harmonic Mean Sample Size = 3.000.
Group N
Subset for alpha = 0.05
1 2 3 4 5
Tukey
HSDa
Extract 50mg/kg
Group
3 40.4522
Positive Group 3 68.5147 68.5147
Extract 100mg/kg
Group
3 96.2136 96.2136
Negative Group 3 112.1032 112.1032
Extract 400mg/kg
Group
3 126.0888 126.0888
Extract 200mg/kg
Group
3 135.9413
Non treatment
Group
3 179.2439
Sig. .220 .231 .171 .378 1.000

148
c) Ulcer healing
i) Ulcer area
Table 46. Descriptives: ulcer area of rats in ulcer treatment test
Table 47. ANOVA: ulcer area of rats in ulcer treatment test
Sum of Squares df Mean Square F Sig.
Between Groups 943704.000 3 314568.000 145.925 .000
Within Groups 43113.600 20 2155.680
Total 986817.600 23
N Mean
Std.
Deviation
Std.
Error
95% Confidence
Interval for
Mean
Minimum Maximum
Lower
Bound
Upper
Bound
Ulcer Control
Group
6 514.8000 70.36135 28.72490 440.9603 588.6397 403.20 590.40
Omeprazole
Group
6 249.6000 56.07994 22.89454 190.7477 308.4523 158.40 324.00
Hericium extract
200mg/kg
6 73.2000 22.95735 9.37230 49.1077 97.2923 43.20 108.00
Hericium extract
400mg/kg
6 .0000 .00000 .00000 .0000 .0000 .00 .00
Total 24 209.4000 207.13549 42.28136 121.9344 296.8656 .00 590.40

149
Table 48. Multiple range test: ulcer area of rats in ulcer treatment test
Group N Subset for alpha = 0.05
1 2 3 4
Tukey HSDa Hericium extract
400mg/kg 6 .0000
Hericium extract
200mg/kg 6 73.2000
Omeprazole Group 6 249.6000
Ulcer Control Group
6 514.8000
Sig. .057 1.000 1.000
Means for groups in homogeneous subsets are displayed.
a. Uses Harmonic Mean Sample Size = 6.000.
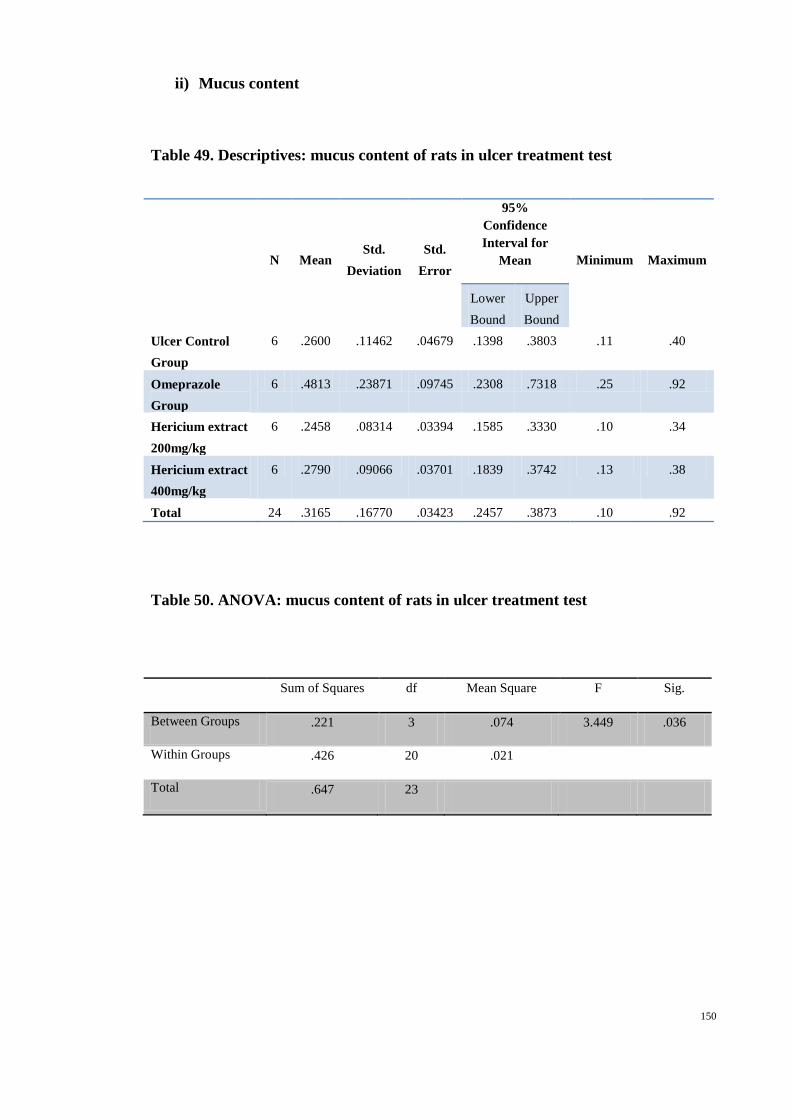
150
ii) Mucus content
Table 49. Descriptives: mucus content of rats in ulcer treatment test
N Mean Std.
Deviation
Std.
Error
95%
Confidence
Interval for
Mean Minimum Maximum
Lower
Bound
Upper
Bound
Ulcer Control
Group
6 .2600 .11462 .04679 .1398 .3803 .11 .40
Omeprazole
Group
6 .4813 .23871 .09745 .2308 .7318 .25 .92
Hericium extract
200mg/kg
6 .2458 .08314 .03394 .1585 .3330 .10 .34
Hericium extract
400mg/kg
6 .2790 .09066 .03701 .1839 .3742 .13 .38
Total 24 .3165 .16770 .03423 .2457 .3873 .10 .92
Table 50. ANOVA: mucus content of rats in ulcer treatment test
Sum of Squares df Mean Square F Sig.
Between Groups .221 3 .074 3.449 .036
Within Groups .426 20 .021
Total .647 23
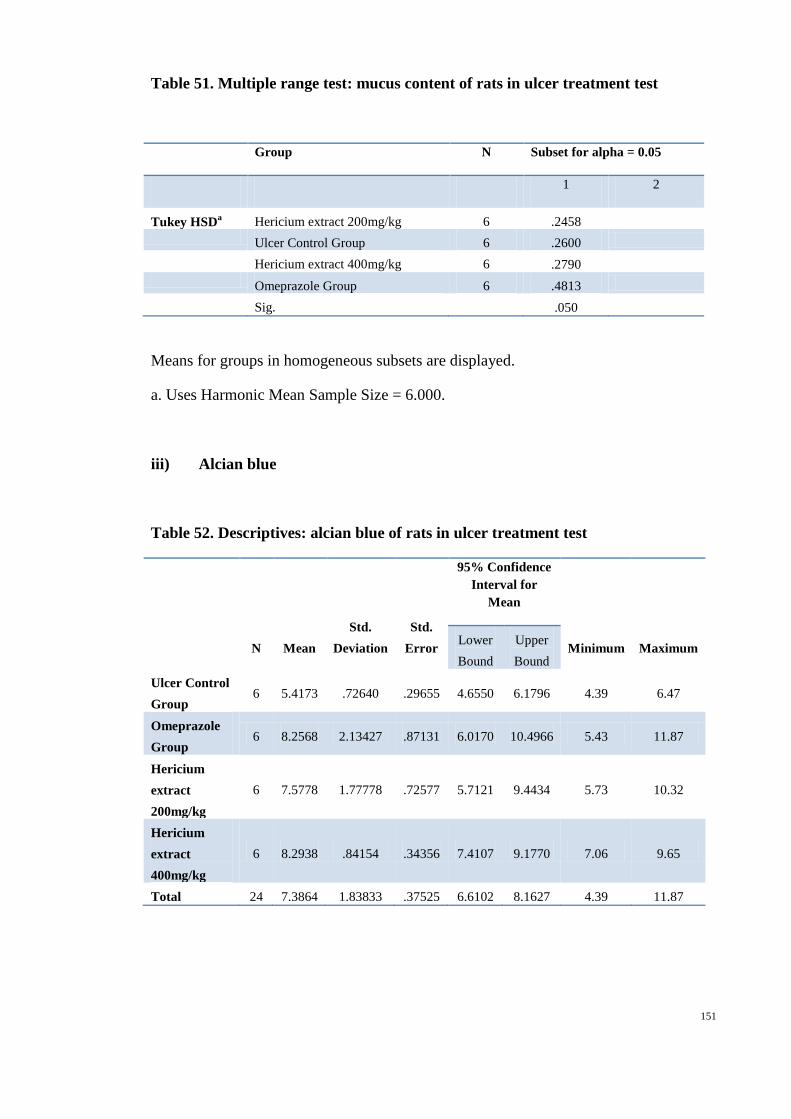
151
Table 51. Multiple range test: mucus content of rats in ulcer treatment test
Group N Subset for alpha = 0.05
1 2
Tukey HSDa Hericium extract 200mg/kg 6 .2458
Ulcer Control Group 6 .2600
Hericium extract 400mg/kg 6 .2790
Omeprazole Group 6 .4813
Sig.
.050
Means for groups in homogeneous subsets are displayed.
a. Uses Harmonic Mean Sample Size = 6.000.
iii) Alcian blue
Table 52. Descriptives: alcian blue of rats in ulcer treatment test
N Mean
Std.
Deviation
Std.
Error
95% Confidence
Interval for
Mean
Minimum Maximum Lower
Bound
Upper
Bound
Ulcer Control
Group 6 5.4173 .72640 .29655 4.6550 6.1796 4.39 6.47
Omeprazole
Group 6 8.2568 2.13427 .87131 6.0170 10.4966 5.43 11.87
Hericium
extract
200mg/kg
6 7.5778 1.77778 .72577 5.7121 9.4434 5.73 10.32
Hericium
extract
400mg/kg
6 8.2938 .84154 .34356 7.4107 9.1770 7.06 9.65
Total 24 7.3864 1.83833 .37525 6.6102 8.1627 4.39 11.87

152
Table 53. ANOVA: alcian blue of rats in ulcer treatment test
Sum of Squares df Mean Square F Sig.
Between Groups 32.970 3 10.990 4.911 .010
Within Groups 44.757 20 2.238
Total 77.727 23
Table 54. Multiple range tests: alcian blue of rats in ulcer treatment test
Group N
Subset for alpha = 0.05
1 2
Tukey HSDa Ulcer Control Group 6 5.4173
Hericium extract 200mg/kg 6 7.5778 7.5778
Omeprazole Group 6 8.2568
Hericium extract 400mg/kg 6 8.2938
Sig.
.090 .840
Means for groups in homogeneous subsets are displayed.
a. Uses Harmonic Mean Sample Size = 6.000.
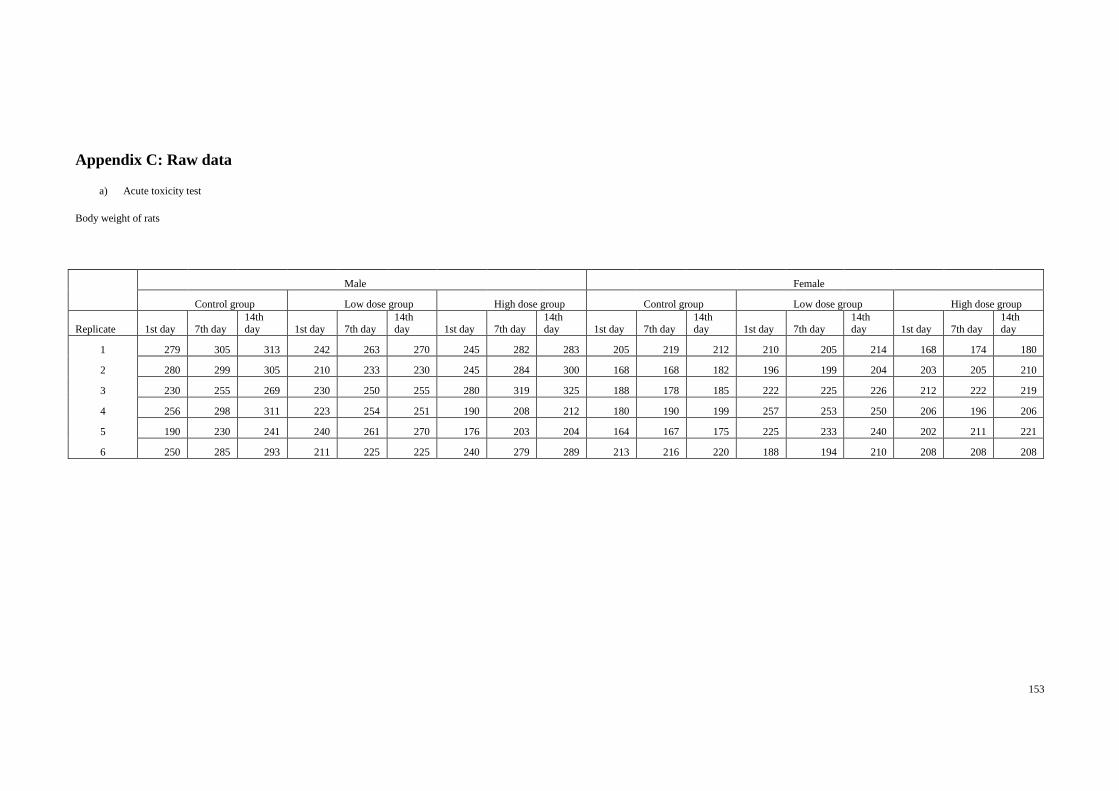
153
Appendix C: Raw data
a) Acute toxicity test
Body weight of rats
Male Female
Control group Low dose group High dose group Control group Low dose group High dose group
Replicate 1st day 7th day 14th day 1st day 7th day
14th day 1st day 7th day
14th day 1st day 7th day
14th day 1st day 7th day
14th day 1st day 7th day
14th day
1 279 305 313 242 263 270 245 282 283 205 219 212 210 205 214 168 174 180
2 280 299 305 210 233 230 245 284 300 168 168 182 196 199 204 203 205 210
3 230 255 269 230 250 255 280 319 325 188 178 185 222 225 226 212 222 219
4 256 298 311 223 254 251 190 208 212 180 190 199 257 253 250 206 196 206
5 190 230 241 240 261 270 176 203 204 164 167 175 225 233 240 202 211 221
6 250 285 293 211 225 225 240 279 289 213 216 220 188 194 210 208 208 208

154
Hematological parameters
HGB
Male Female
Replicate Control Low dose
High dose Control
Low dose
High dose
1 150 140 143 127 149 145
2 135 151 150 141 138 147
3 150 156 142 150 146 144
4 147 160 150 148 130 135
5 158 146 150 143 140 147
6 144 151 135 137 89 147
HCT
Male Female
Replicate Control
Low
dose
High
dose Control
Low
dose
High
dose
1 0.47 0.45 0.47 0.42 0.5 0.48
2 0.44 0.49 0.5 0.46 0.45 0.48
3 0.49 0.5 0.47 0.5 0.48 0.48
4 0.48 0.51 0.49 0.48 0.43 0.44
5 0.52 0.47 0.49 0.49 0.46 0.49
6 0.48 0.49 0.45 0.43 0.43 0.48
RBC
Male Female
Replicate Control
Low
dose
High
dose Control
Low
dose
High
dose
1 8.21 8.01 8.08 7 8.68 7.65
2 7.9 8.36 8.8 8.16 8.04 8.11
3 7.7 8.86 8.39 8.46 7.8 7.81
4 8.51 9.27 8.56 8.31 7.4 7.51
5 8.52 7.62 8.61 7.62 7.92 8.4
6 8.24 8.26 7.9 7.27 7.22 8.4
MCV
Male Female
Replicate Control
Low
dose
High
dose Control
Low
dose
High
dose
1 57 56 58 60 57 63
2 55 59 56 57 56 59
3 64 57 56 59 61 62
4 56 55 57 57 59 59
5 61 62 57 64 58 58
6 58 59 57 60 60 57

155
MCH
Male Female
Replicate Control
Low
dose
High
dose Control
Low
dose
High
dose
1 18.3 17.5 17.7 18.1 17.2 19
2 17.1 18.1 17 17.3 17.2 18.1
3 19.5 17.6 16.9 17.7 18.7 18.4
4 17.3 17.3 17.5 17.8 17.6 18
5 18.5 19.2 17.4 18.8 17.7 17.5
6 17.5 18.3 17.1 18.8 12.3 17.5
MCHC
Male Female
Replicate Control
Low
dose
High
dose Control
Low
dose
High
dose
1 320 311 306 304 301 302
2 310 308 302 305 308 309
3 305 311 302 301 305 299
4 309 312 309 310 300 305
5 304 311 307 293 306 300
6 303 308 299 316 207 309
RDW
Male Female
Replicate Control
Low
dose
High
dose Control
Low
dose
High
dose
1 14.1 15.6 15.6 15.9 14.9 14.9
2 14 14.2 16.3 14.7 13.9 14.1
3 16.4 14.1 17.2 13.3 13.8 13.4
4 15.5 16.4 15.7 16.8 13.7 13.5
5 16.8 13.4 14.2 15 13.8 14.7
6 17.4 14.9 17.1 14.6 13 13.4
WBC
Male Female
Replicate Control
Low
dose
High
dose Control
Low
dose
High
dose
1 5.1 7.3 7.1 2.8 5.8 5.4
2 8.1 6 4.3 6.8 5.1 5.8
3 8.7 7.1 6.9 4.8 4.2 7.8
4 4.6 7.5 6.8 4.4 3 3.9
5 6.6 9.3 7.1 4.3 5.4 5.5
6 4.8 7.7 5.5 3.7 3 4.3
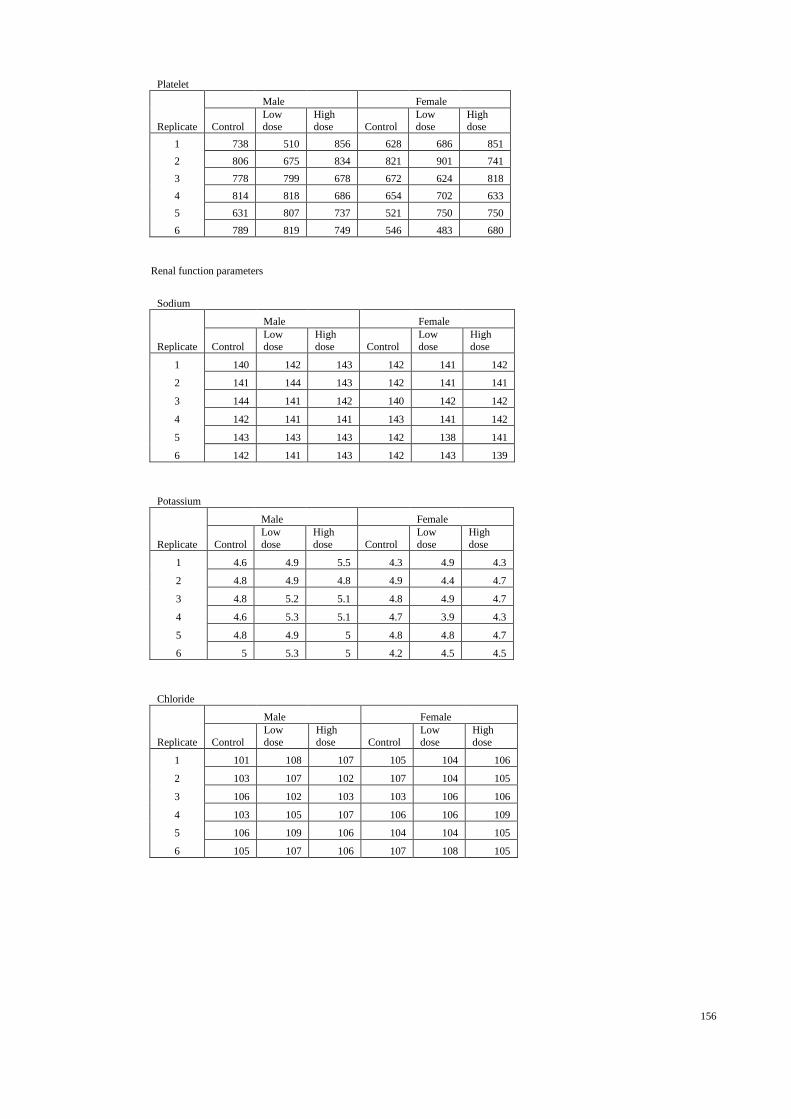
156
Platelet
Male Female
Replicate Control
Low
dose
High
dose Control
Low
dose
High
dose
1 738 510 856 628 686 851
2 806 675 834 821 901 741
3 778 799 678 672 624 818
4 814 818 686 654 702 633
5 631 807 737 521 750 750
6 789 819 749 546 483 680
Renal function parameters
Sodium
Male Female
Replicate Control
Low
dose
High
dose Control
Low
dose
High
dose
1 140 142 143 142 141 142
2 141 144 143 142 141 141
3 144 141 142 140 142 142
4 142 141 141 143 141 142
5 143 143 143 142 138 141
6 142 141 143 142 143 139
Potassium
Male Female
Replicate Control
Low
dose
High
dose Control
Low
dose
High
dose
1 4.6 4.9 5.5 4.3 4.9 4.3
2 4.8 4.9 4.8 4.9 4.4 4.7
3 4.8 5.2 5.1 4.8 4.9 4.7
4 4.6 5.3 5.1 4.7 3.9 4.3
5 4.8 4.9 5 4.8 4.8 4.7
6 5 5.3 5 4.2 4.5 4.5
Chloride
Male Female
Replicate Control
Low
dose
High
dose Control
Low
dose
High
dose
1 101 108 107 105 104 106
2 103 107 102 107 104 105
3 106 102 103 103 106 106
4 103 105 107 106 106 109
5 106 109 106 104 104 105
6 105 107 106 107 108 105
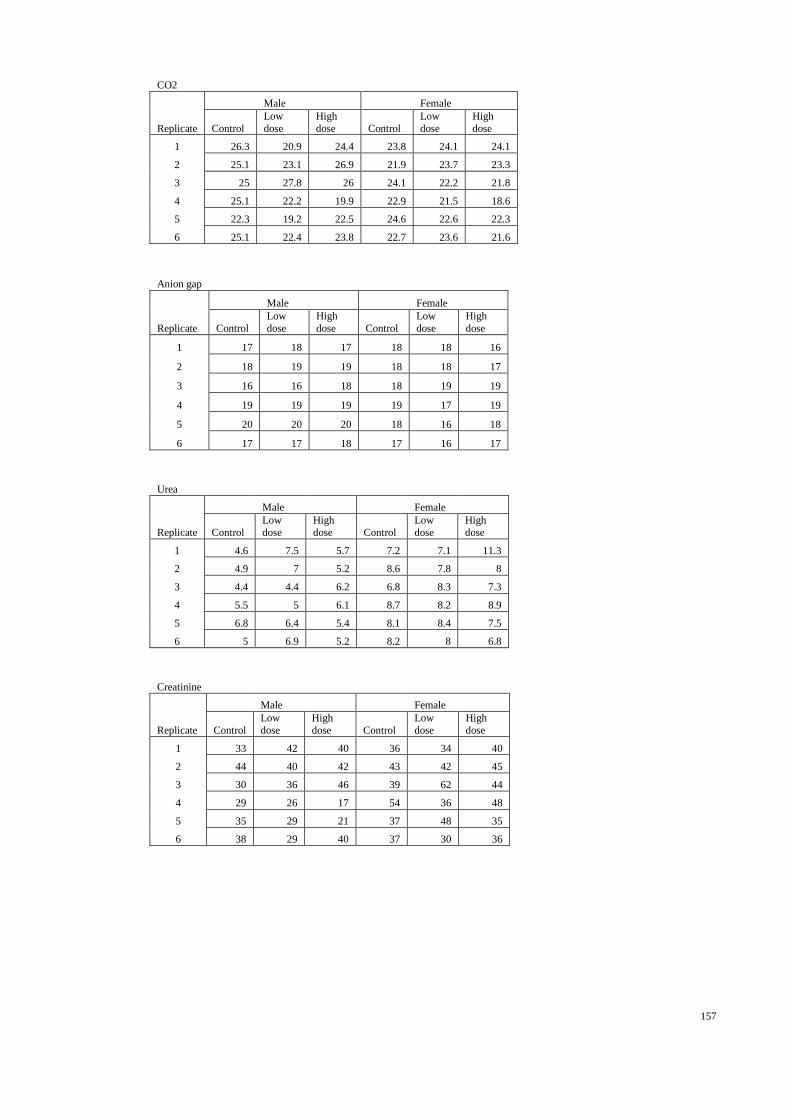
157
CO2
Male Female
Replicate Control
Low
dose
High
dose Control
Low
dose
High
dose
1 26.3 20.9 24.4 23.8 24.1 24.1
2 25.1 23.1 26.9 21.9 23.7 23.3
3 25 27.8 26 24.1 22.2 21.8
4 25.1 22.2 19.9 22.9 21.5 18.6
5 22.3 19.2 22.5 24.6 22.6 22.3
6 25.1 22.4 23.8 22.7 23.6 21.6
Anion gap
Male Female
Replicate Control
Low
dose
High
dose Control
Low
dose
High
dose
1 17 18 17 18 18 16
2 18 19 19 18 18 17
3 16 16 18 18 19 19
4 19 19 19 19 17 19
5 20 20 20 18 16 18
6 17 17 18 17 16 17
Urea
Male Female
Replicate Control
Low
dose
High
dose Control
Low
dose
High
dose
1 4.6 7.5 5.7 7.2 7.1 11.3
2 4.9 7 5.2 8.6 7.8 8
3 4.4 4.4 6.2 6.8 8.3 7.3
4 5.5 5 6.1 8.7 8.2 8.9
5 6.8 6.4 5.4 8.1 8.4 7.5
6 5 6.9 5.2 8.2 8 6.8
Creatinine
Male Female
Replicate Control
Low
dose
High
dose Control
Low
dose
High
dose
1 33 42 40 36 34 40
2 44 40 42 43 42 45
3 30 36 46 39 62 44
4 29 26 17 54 36 48
5 35 29 21 37 48 35
6 38 29 40 37 30 36
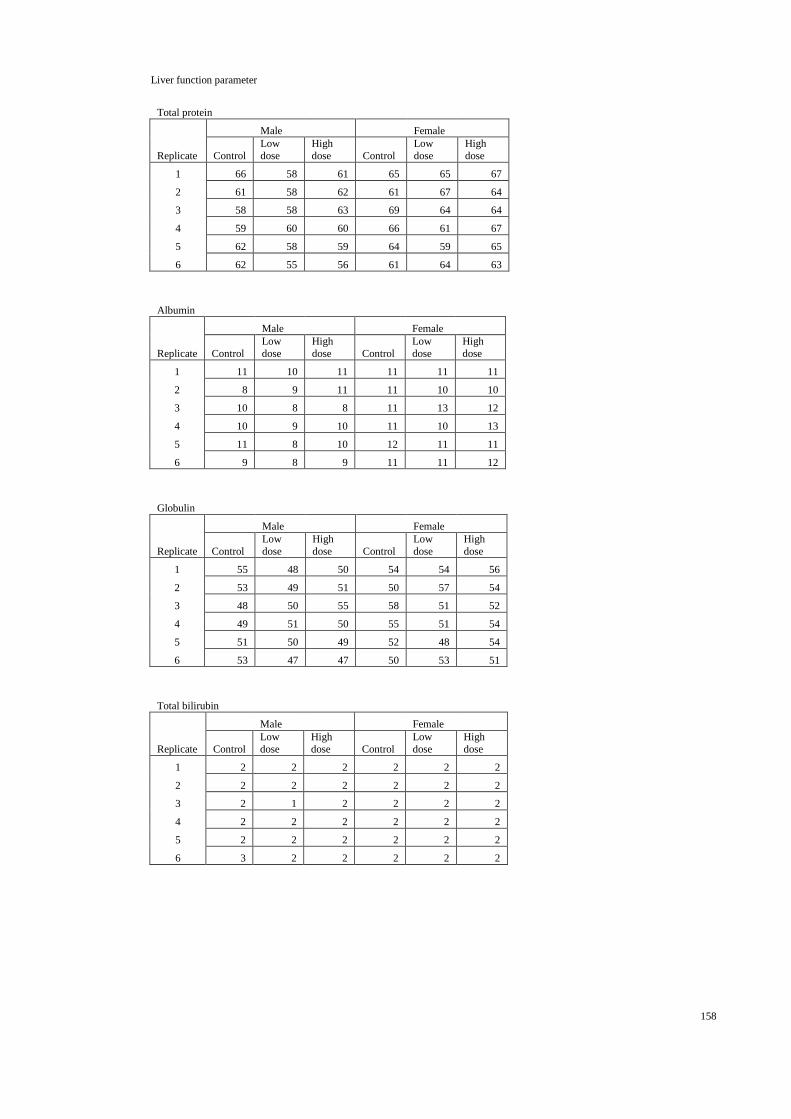
158
Liver function parameter
Total protein
Male Female
Replicate Control
Low
dose
High
dose Control
Low
dose
High
dose
1 66 58 61 65 65 67
2 61 58 62 61 67 64
3 58 58 63 69 64 64
4 59 60 60 66 61 67
5 62 58 59 64 59 65
6 62 55 56 61 64 63
Albumin
Male Female
Replicate Control
Low
dose
High
dose Control
Low
dose
High
dose
1 11 10 11 11 11 11
2 8 9 11 11 10 10
3 10 8 8 11 13 12
4 10 9 10 11 10 13
5 11 8 10 12 11 11
6 9 8 9 11 11 12
Globulin
Male Female
Replicate Control
Low
dose
High
dose Control
Low
dose
High
dose
1 55 48 50 54 54 56
2 53 49 51 50 57 54
3 48 50 55 58 51 52
4 49 51 50 55 51 54
5 51 50 49 52 48 54
6 53 47 47 50 53 51
Total bilirubin
Male Female
Replicate Control
Low
dose
High
dose Control
Low
dose
High
dose
1 2 2 2 2 2 2
2 2 2 2 2 2 2
3 2 1 2 2 2 2
4 2 2 2 2 2 2
5 2 2 2 2 2 2
6 3 2 2 2 2 2
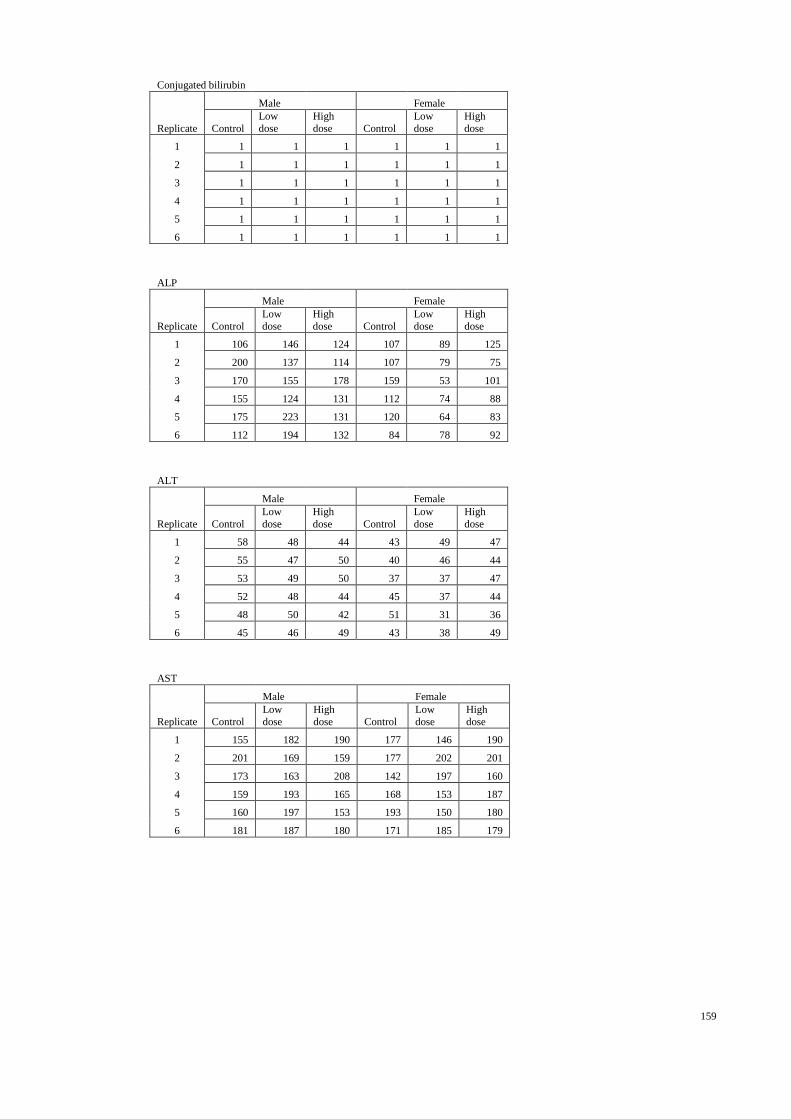
159
Conjugated bilirubin
Male Female
Replicate Control
Low
dose
High
dose Control
Low
dose
High
dose
1 1 1 1 1 1 1
2 1 1 1 1 1 1
3 1 1 1 1 1 1
4 1 1 1 1 1 1
5 1 1 1 1 1 1
6 1 1 1 1 1 1
ALP
Male Female
Replicate Control
Low
dose
High
dose Control
Low
dose
High
dose
1 106 146 124 107 89 125
2 200 137 114 107 79 75
3 170 155 178 159 53 101
4 155 124 131 112 74 88
5 175 223 131 120 64 83
6 112 194 132 84 78 92
ALT
Male Female
Replicate Control
Low
dose
High
dose Control
Low
dose
High
dose
1 58 48 44 43 49 47
2 55 47 50 40 46 44
3 53 49 50 37 37 47
4 52 48 44 45 37 44
5 48 50 42 51 31 36
6 45 46 49 43 38 49
AST
Male Female
Replicate Control
Low
dose
High
dose Control
Low
dose
High
dose
1 155 182 190 177 146 190
2 201 169 159 177 202 201
3 173 163 208 142 197 160
4 159 193 165 168 153 187
5 160 197 153 193 150 180
6 181 187 180 171 185 179
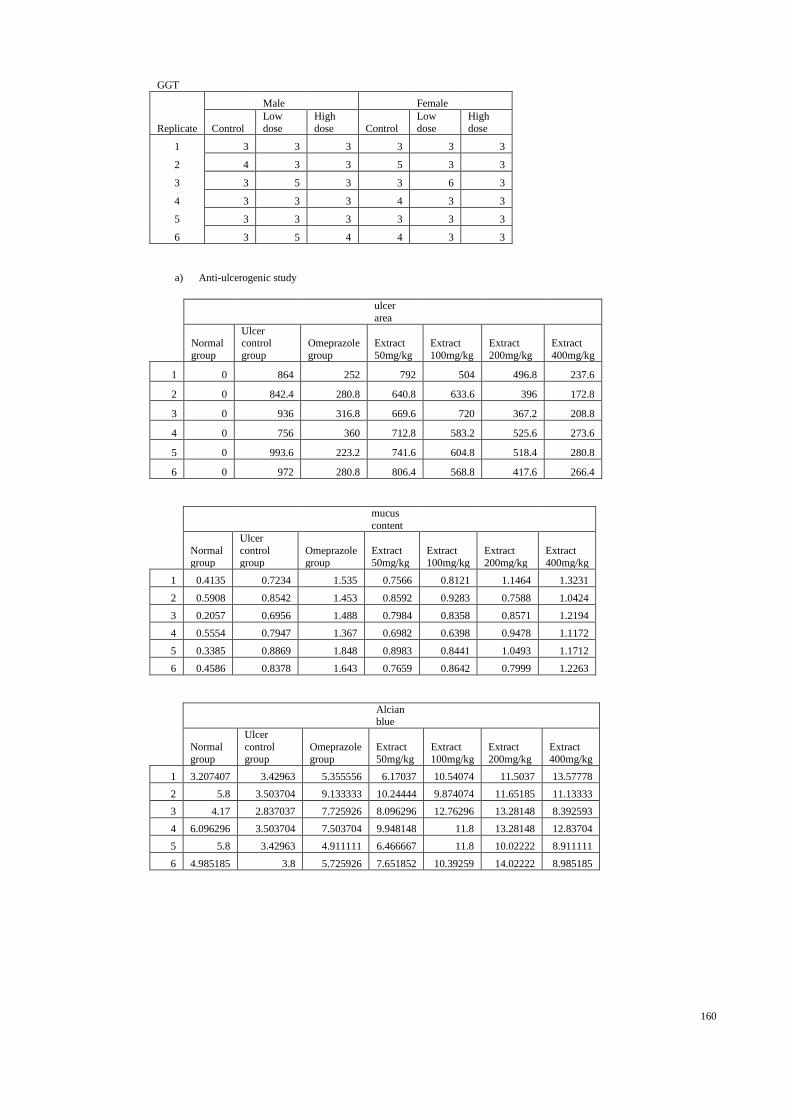
160
GGT
Male Female
Replicate Control
Low
dose
High
dose Control
Low
dose
High
dose
1 3 3 3 3 3 3
2 4 3 3 5 3 3
3 3 5 3 3 6 3
4 3 3 3 4 3 3
5 3 3 3 3 3 3
6 3 5 4 4 3 3
a) Anti-ulcerogenic study
ulcer
area
Normal
group
Ulcer control
group
Omeprazole
group
Extract
50mg/kg
Extract
100mg/kg
Extract
200mg/kg
Extract
400mg/kg
1 0 864 252 792 504 496.8 237.6
2 0 842.4 280.8 640.8 633.6 396 172.8
3 0 936 316.8 669.6 720 367.2 208.8
4 0 756 360 712.8 583.2 525.6 273.6
5 0 993.6 223.2 741.6 604.8 518.4 280.8
6 0 972 280.8 806.4 568.8 417.6 266.4
mucus
content
Normal
group
Ulcer
control
group
Omeprazole
group
Extract
50mg/kg
Extract
100mg/kg
Extract
200mg/kg
Extract
400mg/kg
1 0.4135 0.7234 1.535 0.7566 0.8121 1.1464 1.3231
2 0.5908 0.8542 1.453 0.8592 0.9283 0.7588 1.0424
3 0.2057 0.6956 1.488 0.7984 0.8358 0.8571 1.2194
4 0.5554 0.7947 1.367 0.6982 0.6398 0.9478 1.1172
5 0.3385 0.8869 1.848 0.8983 0.8441 1.0493 1.1712
6 0.4586 0.8378 1.643 0.7659 0.8642 0.7999 1.2263
Alcian blue
Normal
group
Ulcer
control
group
Omeprazole
group
Extract
50mg/kg
Extract
100mg/kg
Extract
200mg/kg
Extract
400mg/kg
1 3.207407 3.42963 5.355556 6.17037 10.54074 11.5037 13.57778
2 5.8 3.503704 9.133333 10.24444 9.874074 11.65185 11.13333
3 4.17 2.837037 7.725926 8.096296 12.76296 13.28148 8.392593
4 6.096296 3.503704 7.503704 9.948148 11.8 13.28148 12.83704
5 5.8 3.42963 4.911111 6.466667 11.8 10.02222 8.911111
6 4.985185 3.8 5.725926 7.651852 10.39259 14.02222 8.985185

161
MDA
Normal group
Ulcer
control group
Omeprazole group
Extract 50mg/kg
Extract 100mg/kg
Extract 200mg/kg
Extract 400mg/kg
1 4.52657 9.067633 5.299517 7.183575 6.555556 5.7343 5.10628
2 4.478261 8.729469 5.637681 7.47343 7.038647 6.217391 5.299517
3 4.285024 8.874396 5.396135 7.714976 6.89372 6.120773 5.347826
SOD
Normal
group
Ulcer
control
group
Omeprazole
group
Extract
50mg/kg
Extract
100mg/kg
Extract
200mg/kg
Extract
400mg/kg
1 8.260235 1.642295 5.369144 2.011252 5.029921 6.310204 5.691669
2 9.328042 2.198369 5.976743 1.904177 4.080923 5.536923 5.470084
3 8.860137 1.826241 5.964269 2.394101 3.950272 6.869823 4.78879
CAT
Normal
group
Ulcer control
group
Omeprazole
group
Extract
50mg/kg
Extract
100mg/kg
Extract
200mg/kg
Extract
400mg/kg
1 166.6071982 106.9345816 62.31956884 37.89692563 83.11101505 146.2662149 130.218007
2 203.011208 129.295061 75.3200287 45.8620604 117.263649 123.838596 133.489721
3 168.113376 100.079893 67.9043941 37.5977055 88.2662547 137.71901 114.558563
b) Ulcer healing
ulcer area
Normal control
group
Ulcer control
group
Omeprazole
group
Extract
200mg/kg
Extract
400mg/kg
1 1411.2 468 230.4 108 0
2 1310.4 511.2 324 64.8 0
3 1238.4 403.2 244.8 57.6 0
4 1706.4 590.4 158.4 86.4 0
5 1591.2 576 252 43.2 0
6 1360.8 540 288 79.2 0
mucus
content
Normal control group
Ulcer control group
Omeprazole group
Extract 200mg/kg
Extract 400mg/kg
1 0.5688 0.2532 0.9156 0.2438 0.3245
2 0.5796 0.1475 0.5166 0.2251 0.2113
3 0.5416 0.1053 0.4795 0.2543 0.3378
4 0.7504 0.3066 0.248 0.3364 0.134
5 0.3833 0.3517 0.283 0.1005 0.2881
6 0.5266 0.3959 0.4452 0.3146 0.3784
Gastric mucus barrier
Normal control
group
Ulcer control
group
Omeprazole
group
Extract
200mg/kg
Extract
400mg/kg
1 16.39259 6.466667 9.059259 10.31852 8.17037
2 14.83704 5.948148 11.87407 6.17037 9.651852
3 11.13333 4.392593 7.355556 9.059259 8.096296
4 10.0963 5.42963 5.42963 5.725926 7.059259
5 10.17037 4.985185 7.948148 6.762963 8.17037
6 12.24444 5.281481 7.874074 7.42963 8.614815

162


