HIGHWAY 407 (SEATON LANDS)ECONOMIC DEVELOPMENT STUDY
April 2007
Ontario Realty Corporation
APPENDICES
In Conjunction With:
Joseph Bogdan Associates Inc.
ENTRA Consultants
Giffels Design-Build Inc.
ECD Energy and Environment Canada Ltd.
RJ Burnside & Associates Limited
Macaulay Shiomi Howson Ltd.

APPENDICES
This document contains five Appendices that were prepared as partof the Highway 407 (Seaton Lands) Economic Development Study.Key points from the appendices are cited within the Final Reportwhich is produced under separate cover. The five appendices are asfollows:
Appendix A: Employment Land Market Study
Appendix B: Transportation Strategy
Appendix C: Urban Design and Built Form Guidelines
Appendix D: Sustainability Guidelines
Appendix E: Development Pro Formas
HEMSON

HIGHWAY 407 (SEATON LANDS)ECONOMIC DEVELOPMENT STUDY
APPENDIX A
Employment Land Market Study
Hemson Consulting Ltd.

TABLE OF CONTENTS
I INTRODUCTION . . . . . . . . . . . . . . . . . . . . . . . . . . . . . . . . . . . . . . . . . . . . . . . . . . . . . . . . . . . . . . . . . . . . . . . . . . . . . . . . . . . . . 1
A. CENTRAL PICKERING DEVELOPMENT PLAN DEFINES THE OVERALL VISION FOR SEATON . . . . . . . . . . . . . . . . . . . . . 1B. EXISTING CONDITIONS IN SEATON . . . . . . . . . . . . . . . . . . . . . . . . . . . . . . . . . . . . . . . . . . . . . . . . . . . . . . . . . . . . . . . . 1C. REPORT STRUCTURE . . . . . . . . . . . . . . . . . . . . . . . . . . . . . . . . . . . . . . . . . . . . . . . . . . . . . . . . . . . . . . . . . . . . . . . . . . . . . 4
II DEMAND FOR EMPLOYMENT LAND . . . . . . . . . . . . . . . . . . . . . . . . . . . . . . . . . . . . . . . . . . . . . . . . . . . . . . . . . . . . . . . . . . . . . 5
A. GTA REMAINS AN INDUSTRIAL ECONOMY . . . . . . . . . . . . . . . . . . . . . . . . . . . . . . . . . . . . . . . . . . . . . . . . . . . . . . . . . . 5B. DURHAM’S EMPLOYMENT LAND EMPLOYMENT IS FORECAST TO GROW BY ABOUT 67,000 . . . . . . . . . . . . . . . . . . 7C. EMPLOYMENT LAND AREAS HAVE EVOLVED TO ACCOMMODATE A WIDE RANGE OF FUNCTIONS . . . . . . . . . . . . 8D. ECONOMIC SECTORS DEMANDING EMPLOYMENT LAND . . . . . . . . . . . . . . . . . . . . . . . . . . . . . . . . . . . . . . . . . . . . . 12E. LOCATIONAL REQUIREMENTS OF EMPLOYMENT LAND USERS . . . . . . . . . . . . . . . . . . . . . . . . . . . . . . . . . . . . . . . . . 15F. SEATON LIKELY TO DIFFER FROM MAJORITY OF MARKET . . . . . . . . . . . . . . . . . . . . . . . . . . . . . . . . . . . . . . . . . . . . . . 16
III GTA EMPLOYMENT LAND MARKET ASSESSMENT. . . . . . . . . . . . . . . . . . . . . . . . . . . . . . . . . . . . . . . . . . . . . . . . . . . . . . . . . . 23
A. LARGE SHARE OF EMPLOYMENT LAND MARKET ACTIVITY IS IN THE GTA WEST . . . . . . . . . . . . . . . . . . . . . . . . . . . 23B. SEATON WILL CONTRIBUTE TO ACHIEVING DURHAM’S EMPLOYMENT GOALS . . . . . . . . . . . . . . . . . . . . . . . . . . . . 24C. SEATON WILL BECOME THE MAJOR NEW EMPLOYMENT AREA IN DURHAM . . . . . . . . . . . . . . . . . . . . . . . . . . . . . . 24D. SEATON’S MAIN COMPETITORS WILL BE THE 404 CORRIDOR AND WESTERN DURHAM . . . . . . . . . . . . . . . . . . . . . 25E. DURHAM’S EMPLOYMENT LAND IS RELATIVELY LESS EXPENSIVE . . . . . . . . . . . . . . . . . . . . . . . . . . . . . . . . . . . . . . . . 30F. SEATON’S CAMPUS OFFICE POTENTIAL WILL ASSIST IN A VERY COMPETITIVE MARKET . . . . . . . . . . . . . . . . . . . . . . 31
IV SEATON MARKET ASSESSMENT . . . . . . . . . . . . . . . . . . . . . . . . . . . . . . . . . . . . . . . . . . . . . . . . . . . . . . . . . . . . . . . . . . . . . . . . 33
A. SEATON SWOT ANALYSIS . . . . . . . . . . . . . . . . . . . . . . . . . . . . . . . . . . . . . . . . . . . . . . . . . . . . . . . . . . . . . . . . . . . . . . . 33B. SEATON WILL GENERATE ABOUT 16,700 IN EMPLOYMENT ON EMPLOYMENT LANDS . . . . . . . . . . . . . . . . . . . . . . 36C. RATE OF EMPLOYMENT LAND ABSORPTION FOR SEATON . . . . . . . . . . . . . . . . . . . . . . . . . . . . . . . . . . . . . . . . . . . . . 39D. EMPLOYMENT LAND PARCEL SIZE ASSESSMENT . . . . . . . . . . . . . . . . . . . . . . . . . . . . . . . . . . . . . . . . . . . . . . . . . . . . . . 40
V MARKET PROSPECTS FOR SEATON . . . . . . . . . . . . . . . . . . . . . . . . . . . . . . . . . . . . . . . . . . . . . . . . . . . . . . . . . . . . . . . . . . . . . . 42
HEMSON

I BACKGROUND AND STUDY AREA CONTEXT
Ontario Realty Corporation is undertaking an Economic Development Study for the designated Prestige employment lands in the Highway 407 corridor in the planned community of Seaton in Pickering. This appendix report contains the employment land market analysis component of the Study. The market analysis consists of an assessment of employment land demand and supply conditions for the Seaton market area, an outlook for the potential types of employment land uses that would be attracted to the Highway 407 lands and a projection of the anticipated rate of absorption and potential land prices for the Study Area lands. The results of the market analysis were used as input to the development of the recommended land use concept for the Study Area and for other components of the Study including the proposed phasing and marketing strategy.
A. CENTRAL PICKERING DEVELOPMENT PLAN DEFINES THE OVERALL VISION FOR SEATON
The concept of a large new urban community in Pickering has been proposed since the early 1970s when the Province undertook a major land assembly in North Pickering for this purpose. The Seaton community was to be developed in conjunction with a major new airport to the north. Since this
time, there have been a number of different land use plans put forward by the Province and the City of Pickering.
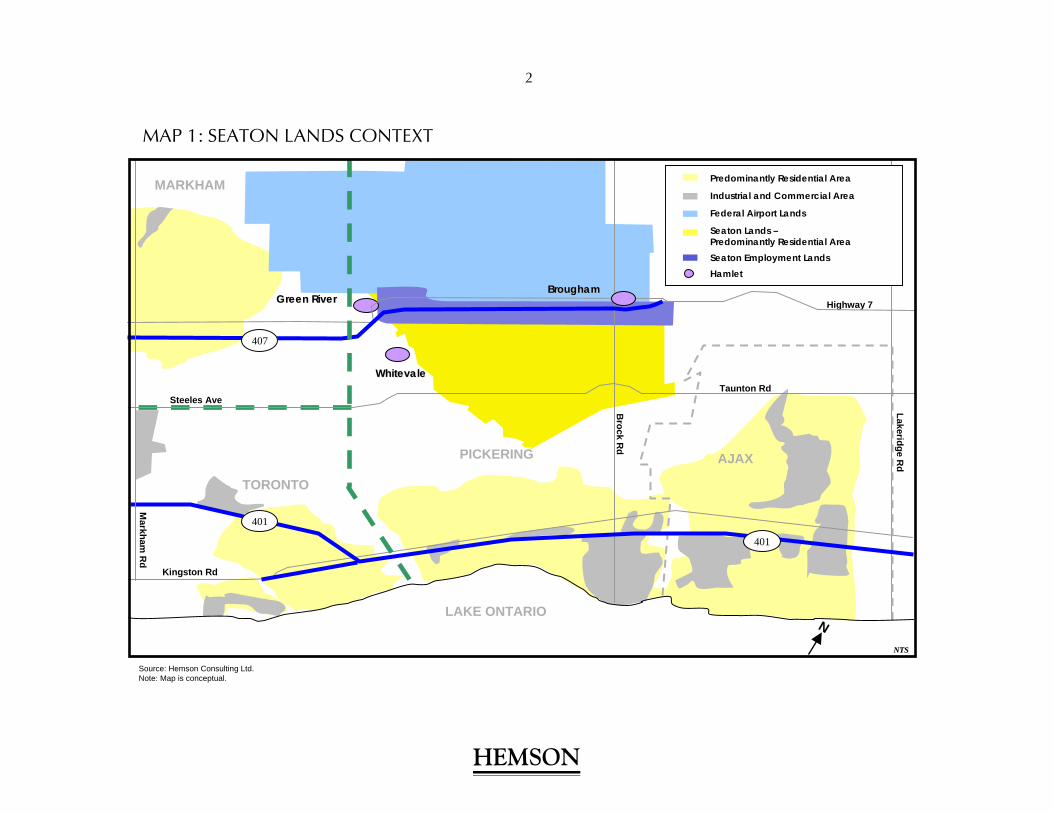
With the release of the Central Pickering Development Plan in May 2006, the Province established a final plan for the Seaton community. In the plan, lands along both sides of the Highway 407 corridor are designated for Prestige Employment uses. According to the Plan, Seaton is to accommodate 70,000 residents and total employment of 35,000 and is planned to be a showcase for a compact, sustainable urban community. Map 1 shows the location of Seaton and the designated Prestige Employment lands in the Highway 407 corridor in the context of the surrounding region.
B. EXISTING CONDITIONS IN SEATON
The designated Seaton employment lands are located on both sides of the 7 km Highway 407 corridor in Pickering from the hamlet of Green River at the western boundary, to Brock Road to the east (see Map 1). The majority of the employment lands are located north of Highway 407 and south of Highway 7 with a smaller proportion south of Highway 407.
HEMSON
MARKHAM
TORONTO
Taunton Rd
AJAXPICKERING
BroughamBroughamHighway 7
Source: Hemson Consulting Ltd.Note: Map is conceptual.
NTSNTS
WhitevaleWhitevale
LAKE ONTARIO
Steeles Ave
Kingston Rd
Brock R
d
N
407
401
401
Lakeridge Rd
Markham
Rd
Green RiverGreen River
MAP 1: SEATON LANDS CONTEXT
2
Predominantly Residential Area
Industrial and Commercial Area
Federal Airport Lands
Seaton Lands –Predominantly Residential AreaSeaton Employment LandsHamlet
HEMSON
3
In addition, there is one large employment block in the western part of the Study Area located north of Highway 7. Taking account of natural heritage features, planned transportation corridors, existing road rights-of-way and cultural heritage features, the estimated gross developable area amounts to approximately 331 ha (818 acres). The following sections summarize the major existing conditions in the Seaton employment area as they relate to the market for employment lands.
1. Seaton Is a Planned Greenfield Community Currently Isolated from Major Urban Areas
The Seaton employment lands are part of the larger Provincially planned Seaton community in Central Pickering. Seaton is a new community that will be just to the north of the existing Pickering urban area. The Seaton lands are currently occupied by mainly agricultural and rural residential uses. Owing to their location at the north end of Seaton, the Study Area lands are currently isolated from any existing major urban areas. Highway 404 is about a 10-minute drive along Highway 407 to the west of Seaton, while Highway 401 is about a 10-minute drive south along Brock Road.
2. Natural Heritage System Is Integrated into the Seaton Employment Areas
The Central Pickering Development Plan designates an extensive natural heritage system (NHS) integrated with both the residential and employment areas in Seaton. The topography of the Study Area is generally flat, sloping gently from north to
south and punctuated by more prominent rolling terrain near the valleys. The NHS areas create distinct employment precincts within the Study Area. North-south valleylands are prominent in a number of locations across the Study area helping to define the character of different parts of the Seaton employment lands.
3. Potential Site for Pickering Airport Is Located Immediately to the North of the Study Area
The Pickering Airport site is located immediately to the north of the Seaton employment lands. The Federal Government is currently conducting a due diligence review of the need for and potential timing of the Pickering Airport. The Airport would act as a regional airport at first, replacing Buttonville and Oshawa airports and would potentially evolve to act as a reliever facility for Pearson which is anticipated to reach its planned capacity by 2018.
The Seaton employment lands are well separated from the future residential communities in Seaton to the south by the NHS with the exception of a small area in the southeast part of the Study Area. The hamlets of Green River and Brougham are at the west and east ends of the Study Area respectively. Green River is largely a residential community while Brougham has a number of commercial establishments at the crossroads of Highway 7 and Old Brock Road.
4. Highways 407 and 7 Provide Access to the Seaton Employment Lands
The Seaton employment lands are well served by two major east-west transportation corridors: Highway 407 and Highway 7. Highway 407 currently terminates at Brock Road and is the only
HEMSON
4
existing highway interchange location within the Study Area. Two interchanges are planned in the Study Area to be located near Sideline 22 and Sideline 26. There are two existing Highway 407 flyovers at North Road and Sideline 24 providing access north and south of Highway 407. Highway 407 provides access to the central and western GTA. Highway 7 is a two-lane highway through Seaton which provides access to the GTA and other parts of south central Ontario. There is no existing east-west road south of Highway 407 connecting the designated employment land areas.
There is currently no transit service in the Seaton area. A transitway along the south side of Highway 407 has been identified as a future transit facility; however, it is likely to be a longer-term prospect. Transit stations have been identified at the interchanges with Highway 407 at Sidelines 22 and Sideline 26 and at Brock Road. Regional transit service along Highway 7 has also been proposed and is also likely to be a long-term project but could be in service before the Highway 407 transitway.
5. Timing of Water and Wastewater Servicing Is Uncertain
The Study Area currently does not have access to full water and wastewater services. Water and wastewater services for the Study Area will be extended from south to north from the Seaton residential areas. The Region is currently undertaking a Master Environmental Servicing Plan for the Region as a whole, including a specific study on the servicing of Seaton in particular. The exact timing of extension of servicing has not been determined but it is likely that given the timing of development of the residential areas to the south and the time needed to install major trunk services that development in Seaton’s employment lands would not commence until at least 2010-2011.
C. REPORT STRUCTURE
This appendix report is divided into five chapters. In Chapter 2, the key factors influencing the demand for employment lands are discussed. Chapter 3 provides an overview of the GTA employment land market and discusses Seaton’s position relative to other competing employment land markets. In Chapter 4, the Strengths, Weaknesses, Opportunities and Threats (SWOT analysis) are assessed for Seaton from a market perspective. Chapter 5 summarizes the overall market prospects for the Seaton employment lands.
HEMSON
5
II DEMAND FOR EMPLOYMENT LAND
This chapter discusses the demand for employment in terms of the types of uses typically accommodated on employment lands and assesses the major economic sectors in Durham and Pickering that are likely to demand employment land in Seaton.
A. GTA REMAINS AN INDUSTRIAL ECONOMY
The Seaton employment lands need to be planned and marketed in the context of the GTA economy. While there has been a definite shift from manufacturing to service sector employment, the GTA economy remains related to goods production. The shift in employment has been as a result of the emergence of a global manufacturing process where higher value aspects of the work is being undertaken in developed countries and less specialized work occurring elsewhere.
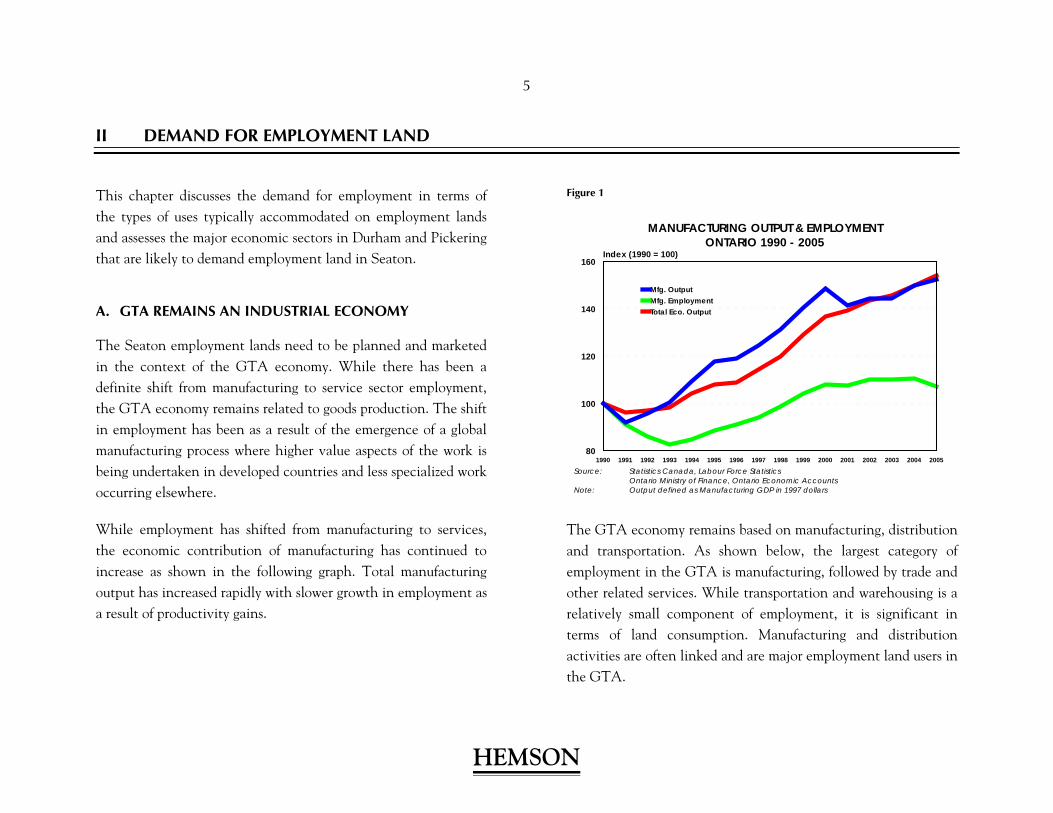
While employment has shifted from manufacturing to services, the economic contribution of manufacturing has continued to increase as shown in the following graph. Total manufacturing output has increased rapidly with slower growth in employment as a result of productivity gains.
Figure 1
MANUFACTURING OUTPUT & EMPLOYMENTONTARIO 1990 - 2005
1990 1991 1992 1993 1994 1995 1996 1997 1998 1999 2000 2001 2002 2003 2004 200580
100
120
140
160Index (1990 = 100)
Mfg. OutputMfg. EmploymentTotal Eco. Output
Source: Statistics Canada, Labour Force Statistics Ontario Ministry of Finance, Ontario Economic Accounts
Note: Output defined as Manufacturing GDP in 1997 dollars
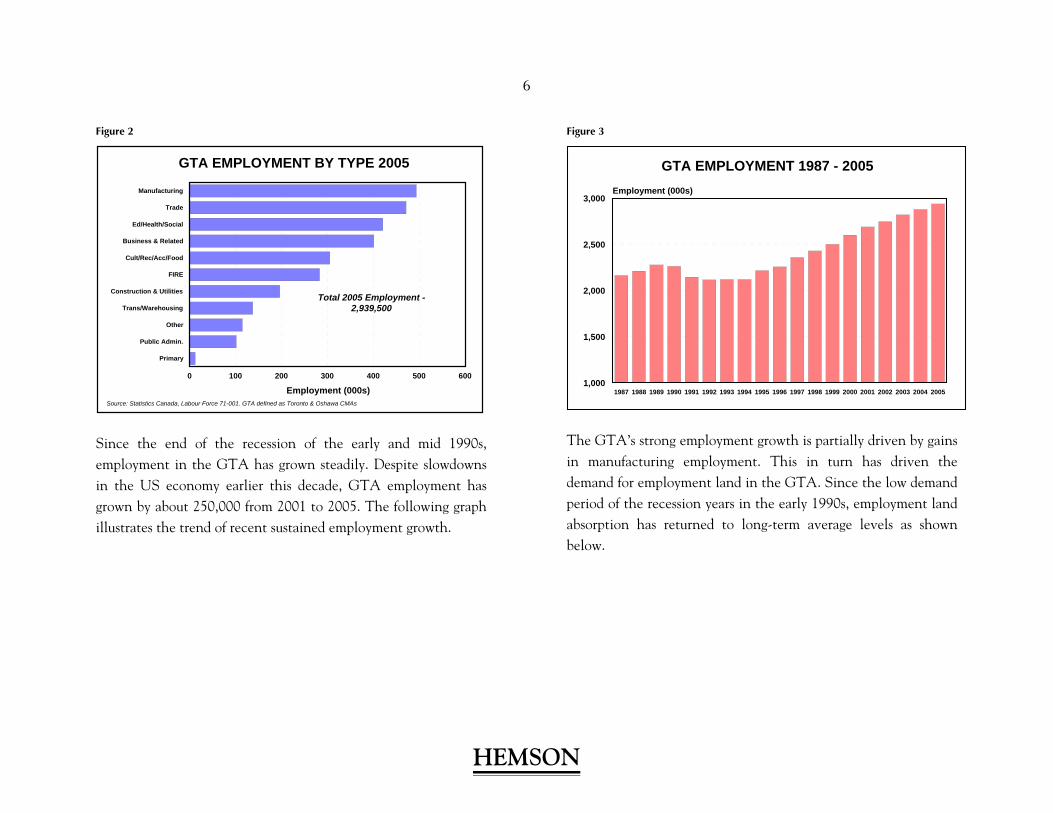
The GTA economy remains based on manufacturing, distribution and transportation. As shown below, the largest category of employment in the GTA is manufacturing, followed by trade and other related services. While transportation and warehousing is a relatively small component of employment, it is significant in terms of land consumption. Manufacturing and distribution activities are often linked and are major employment land users in the GTA.
HEMSON
6
Figure 2
GTA EMPLOYMENT BY TYPE 2005
Manufacturing
Trade
Ed/Health/Social
Business & Related
Cult/Rec/Acc/Food
FIRE
Construction & Utilities
Trans/Warehousing
Other
Public Admin.
Primary
0 100 200 300 400 500 600
Employment (000s)Source: Statistics Canada, Labour Force 71-001. GTA defined as Toronto & Oshawa CMAs
Total 2005 Employment -2,939,500
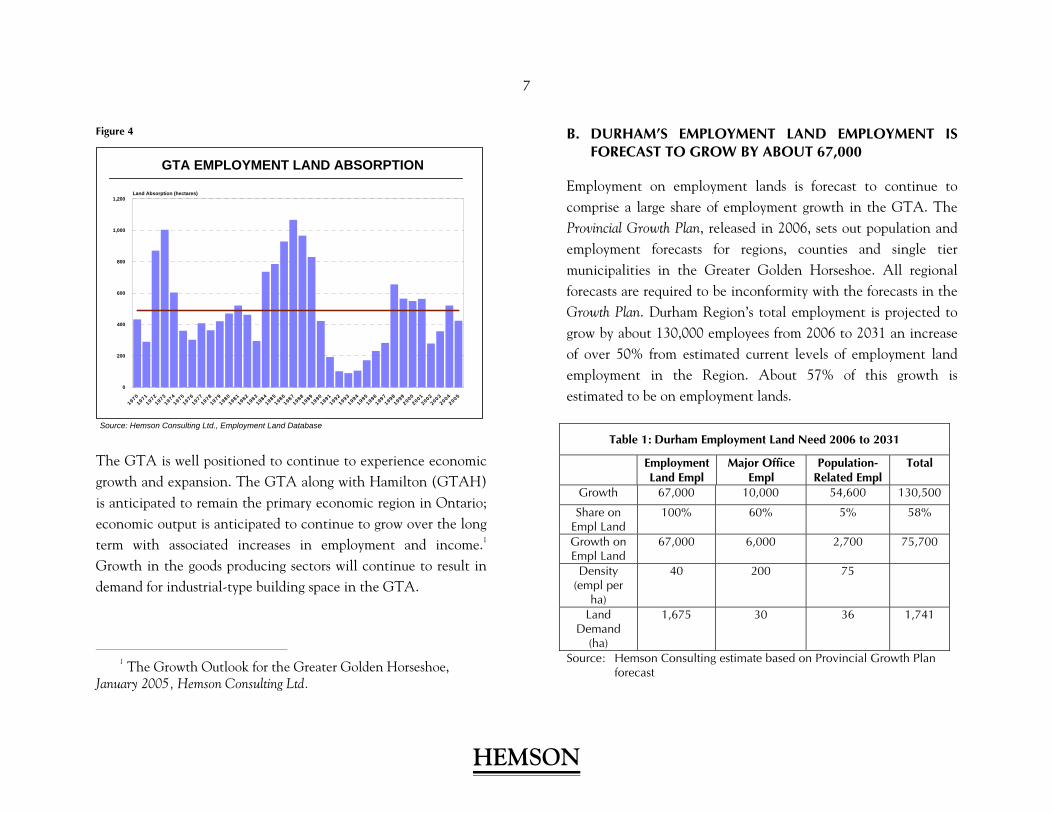
Since the end of the recession of the early and mid 1990s, employment in the GTA has grown steadily. Despite slowdowns in the US economy earlier this decade, GTA employment has grown by about 250,000 from 2001 to 2005. The following graph illustrates the trend of recent sustained employment growth.
Figure 3
GTA EMPLOYMENT 1987 - 2005
1987 1988 1989 1990 1991 1992 1993 1994 1995 1996 1997 1998 1999 2000 2001 2002 2003 2004 20051,000
1,500
2,000
2,500
3,000Employment (000s)
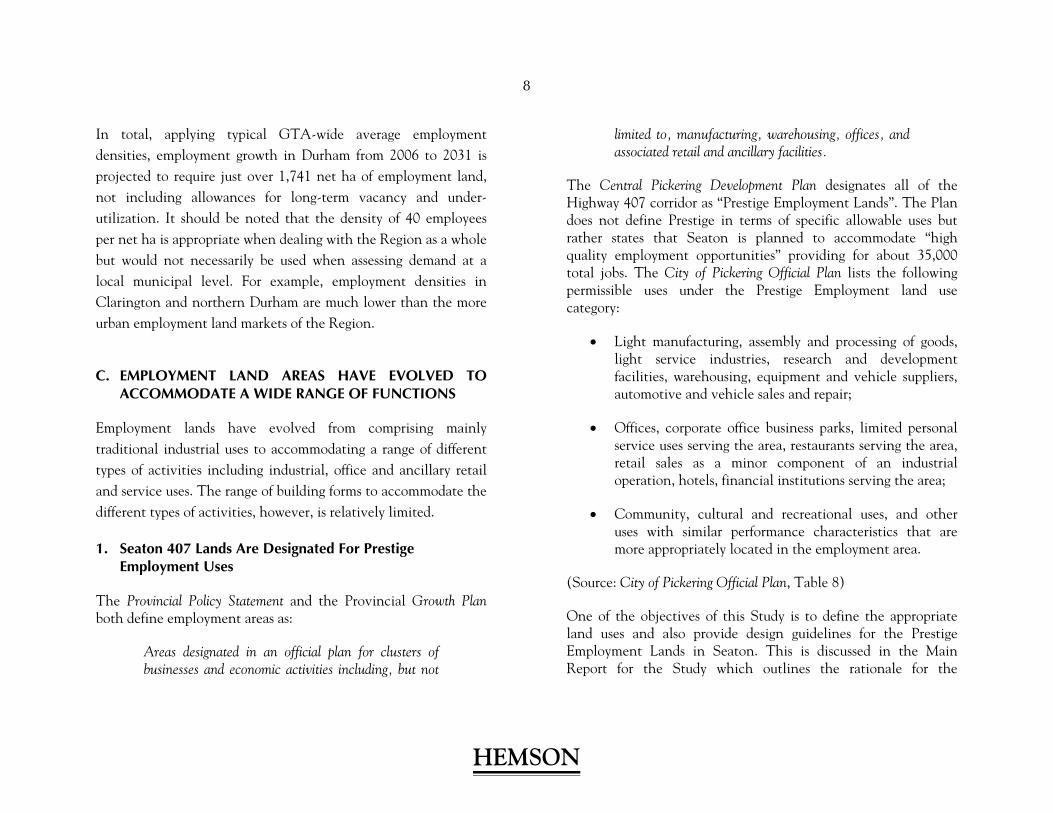
The GTA’s strong employment growth is partially driven by gains in manufacturing employment. This in turn has driven the demand for employment land in the GTA. Since the low demand period of the recession years in the early 1990s, employment land absorption has returned to long-term average levels as shown below.
HEMSON
7
Figure 4
Source: Hemson Consulting Ltd., Employment Land Database
GTA EMPLOYMENT LAND ABSORPTION
19701971
19721973
19741975
19761977
19781979
19801981
19821983
19841985
19861987
19881989
19901991
19921993
19941995
19961997
19981999
20002001
20022003
20042005
0
200
400
600
800
1,000
1,200Land Absorption (hectares)
The GTA is well positioned to continue to experience economic growth and expansion. The GTA along with Hamilton (GTAH) is anticipated to remain the primary economic region in Ontario; economic output is anticipated to continue to grow over the long term with associated increases in employment and income.1 Growth in the goods producing sectors will continue to result in demand for industrial-type building space in the GTA.
1 The Growth Outlook for the Greater Golden Horseshoe,
January 2005, Hemson Consulting Ltd.
B. DURHAM’S EMPLOYMENT LAND EMPLOYMENT IS FORECAST TO GROW BY ABOUT 67,000
Employment on employment lands is forecast to continue to comprise a large share of employment growth in the GTA. The Provincial Growth Plan, released in 2006, sets out population and employment forecasts for regions, counties and single tier municipalities in the Greater Golden Horseshoe. All regional forecasts are required to be inconformity with the forecasts in the Growth Plan. Durham Region’s total employment is projected to grow by about 130,000 employees from 2006 to 2031 an increase of over 50% from estimated current levels of employment land employment in the Region. About 57% of this growth is estimated to be on employment lands.
Table 1: Durham Employment Land Need 2006 to 2031
Employment Land Empl
Major Office Empl
Population-Related Empl
Total
Growth 67,000 10,000 54,600 130,500
Share on Empl Land
100% 60% 5% 58%
Growth on Empl Land
67,000 6,000 2,700 75,700
Density (empl per
ha)
40 200 75
Land Demand
(ha)
1,675 30 36 1,741
Source: Hemson Consulting estimate based on Provincial Growth Plan forecast
HEMSON
8
In total, applying typical GTA-wide average employment densities, employment growth in Durham from 2006 to 2031 is projected to require just over 1,741 net ha of employment land, not including allowances for long-term vacancy and under-utilization. It should be noted that the density of 40 employees per net ha is appropriate when dealing with the Region as a whole but would not necessarily be used when assessing demand at a local municipal level. For example, employment densities in Clarington and northern Durham are much lower than the more urban employment land markets of the Region.
C. EMPLOYMENT LAND AREAS HAVE EVOLVED TO ACCOMMODATE A WIDE RANGE OF FUNCTIONS
Employment lands have evolved from comprising mainly traditional industrial uses to accommodating a range of different types of activities including industrial, office and ancillary retail and service uses. The range of building forms to accommodate the different types of activities, however, is relatively limited.
1. Seaton 407 Lands Are Designated For Prestige Employment Uses
The Provincial Policy Statement and the Provincial Growth Plan both define employment areas as:
Areas designated in an official plan for clusters of businesses and economic activities including, but not
limited to, manufacturing, warehousing, offices, and associated retail and ancillary facilities.
The Central Pickering Development Plan designates all of the Highway 407 corridor as “Prestige Employment Lands”. The Plan does not define Prestige in terms of specific allowable uses but rather states that Seaton is planned to accommodate “high quality employment opportunities” providing for about 35,000 total jobs. The City of Pickering Official Plan lists the following permissible uses under the Prestige Employment land use category:
• Light manufacturing, assembly and processing of goods, light service industries, research and development facilities, warehousing, equipment and vehicle suppliers, automotive and vehicle sales and repair;
• Offices, corporate office business parks, limited personal service uses serving the area, restaurants serving the area, retail sales as a minor component of an industrial operation, hotels, financial institutions serving the area;
• Community, cultural and recreational uses, and other uses with similar performance characteristics that are more appropriately located in the employment area.
(Source: City of Pickering Official Plan, Table 8)
One of the objectives of this Study is to define the appropriate land uses and also provide design guidelines for the Prestige Employment Lands in Seaton. This is discussed in the Main Report for the Study which outlines the rationale for the
HEMSON
9
development of the land use concept for the Seaton employment lands.
Major retail and community facilities in Seaton are to be accommodated in the Local and Community Nodes and Mixed-Use Corridors and not in the employment land area.
2. Range of Uses Accommodated on Employment Lands Has Expanded
Employment land areas were traditionally home to largely industrial-type uses in a relatively narrow range of sectors. Today, employment land areas are home to a wide range of functions in many economic sectors. With continuing globalization, the nature of manufacturing in Canada has changed, becoming more specialized and customized and generally cleaner and higher value than in the past. The functions of warehousing and distribution have also become much more sophisticated. Logistics and supply chain management are major growing sectors responding to the need to efficiently move goods within and between major urban areas.
Today, employment land areas are still home to industrial-type activities such as manufacturing, assembly and warehousing but also include major office and ancillary retail and service uses as well as institutional and recreational uses. In addition, functions that were traditionally separated such as office and plant are increasingly being integrated on one site.
The mix of different types of employment varies by employment land area. For example, the business parks at Highways 404 and 7 in Markham and Richmond Hill tend to have much higher major office components than employment land areas in Brampton
which tend to be much more focused on manufacturing and warehousing. Most of retail and service uses in employment areas tend to be located at the edges of the business parks to allow for access to a wider community customer base in addition to the employees in the employment land area.
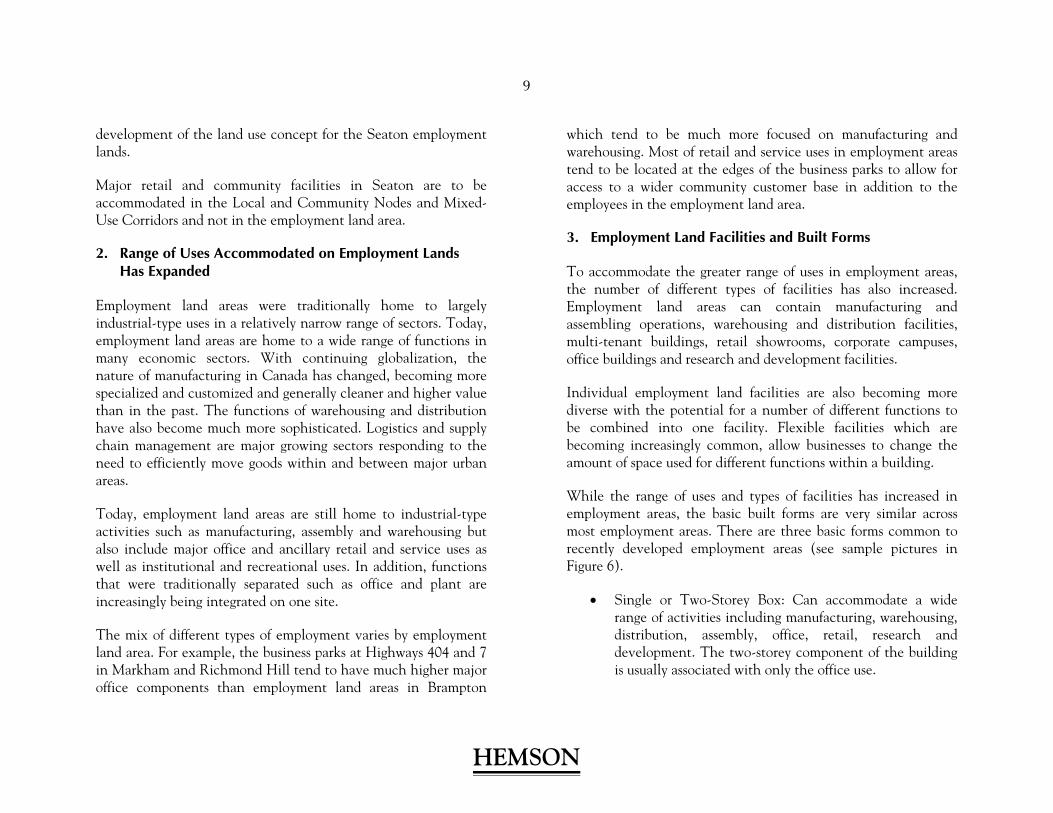
3. Employment Land Facilities and Built Forms
To accommodate the greater range of uses in employment areas, the number of different types of facilities has also increased. Employment land areas can contain manufacturing and assembling operations, warehousing and distribution facilities, multi-tenant buildings, retail showrooms, corporate campuses, office buildings and research and development facilities.
Individual employment land facilities are also becoming more diverse with the potential for a number of different functions to be combined into one facility. Flexible facilities which are becoming increasingly common, allow businesses to change the amount of space used for different functions within a building.
While the range of uses and types of facilities has increased in employment areas, the basic built forms are very similar across most employment areas. There are three basic forms common to recently developed employment areas (see sample pictures in Figure 6).
• Single or Two-Storey Box: Can accommodate a wide range of activities including manufacturing, warehousing, distribution, assembly, office, retail, research and development. The two-storey component of the building is usually associated with only the office use.
HEMSON
10
• Industrial Multiple: Contains smaller flexible space that can accommodate the functions of the large box buildings but at a smaller scale. Multiples can contain business support, small-scale retail and health-related uses in addition to light manufacturing and office uses.
• Pure Office Building: Contains administrative and other office functions in a pure office form, usually at least two storeys.
Within these basic categories, there are potential numerous variations based on building size and the share of different functions within each.
HEMSON
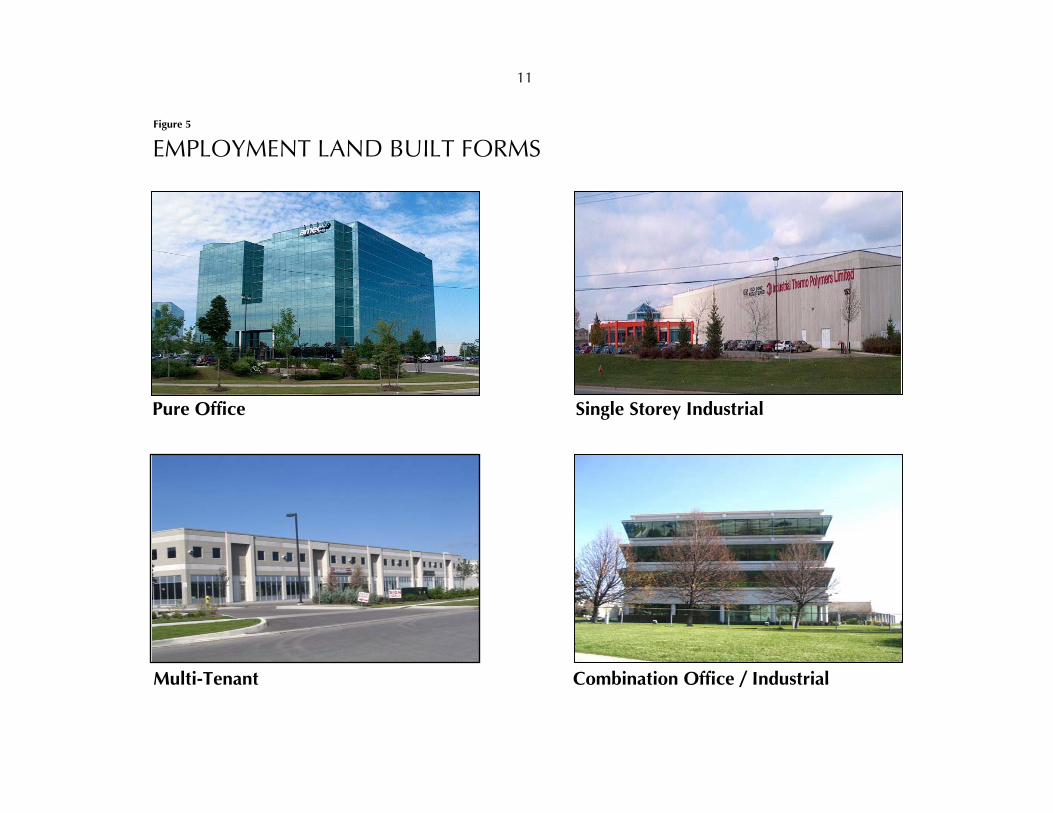
EMPLOYMENT LAND BUILT FORMS
Pure Office Single Storey Industrial
Multi-Tenant Combination Office / Industrial
11
Figure 5
12
Planning in new employment land areas in the GTA is tending to focus more on built form than the traditional focus on use. Because of the wide range of functions accommodated in employment areas in similar types of buildings, strict restrictions on use are usually not effective. A prestige employment development has a high level of investment and maintenance of the building and high quality site design and landscaping. Control of building and site design are the keys to developing prestige employment areas.
D. ECONOMIC SECTORS DEMANDING EMPLOYMENT LAND
The major economic sectors largely accommodated on employment lands are manufacturing, transportation and warehousing and wholesale trade. Many economic sector activities typically accommodated in office buildings such as Professional, Scientific and Management employment can also be found on employment lands. Finally, a small portion of a municipality’s employment lands are also occupied by retail, service and institutional type uses. In order to assess the potential employment land users for Seaton, the existing employment profiles of Durham and Pickering were examined.
1. Durham Is Dominated by the Auto Sector
In comparison to the other GTA Regions outside of the City of Toronto2, Durham has a relatively high proportion of its employment base in the utilities and service sector industries. Durham has relatively lower share of its employment base in warehouse-distribution (Wholesale Trade and Transportation and Warehousing) and in the industries that typically occupy office space including Finance, Insurance and Real Estate; and Professional, Scientific and Technical Services; and Management. The Region’s largest employers are General Motors in Oshawa and Ontario Power Generation, which has facilities in Pickering and Clarington. Durham has a relatively larger share of its employment base in the public sector than the other 905 GTA Regions.
2 The City of Toronto is not included in the comparison since the
employment base of the City is much different than the rest of the GTA because of the very large office employment base.
HEMSON
13
Table 2: Share of Total 2001 Employment by Industry (%)
Industry Durham Other 905 Difference
Primary Utilities Construction Manufacturing Wholesale Trade Retail Trade Transportation & Warehousing FIRE Prof., scientific, management Admin. & support, waste mgmnt Education, health, public admin Arts, entertainment, recreation Accommodation & Food & Other
1.9%4.4%5.8%
18.9%3.6%
14.1%3.8%4.4%4.4%3.6%
22.1%1.9%
11.2%
0.7%0.4%6.4%
20.6%9.3%
11.3%7.3%6.0%8.0%4.3%
15.2%1.6%8.9%
1.2%4.0%-0.5%-1.8%-5.7%2.8%
-3.6%-1.6%-3.5%-0.7%7.0%0.3%2.2%
Total 100.0% 100.0% Source: 2001 Census, Statistics Canada
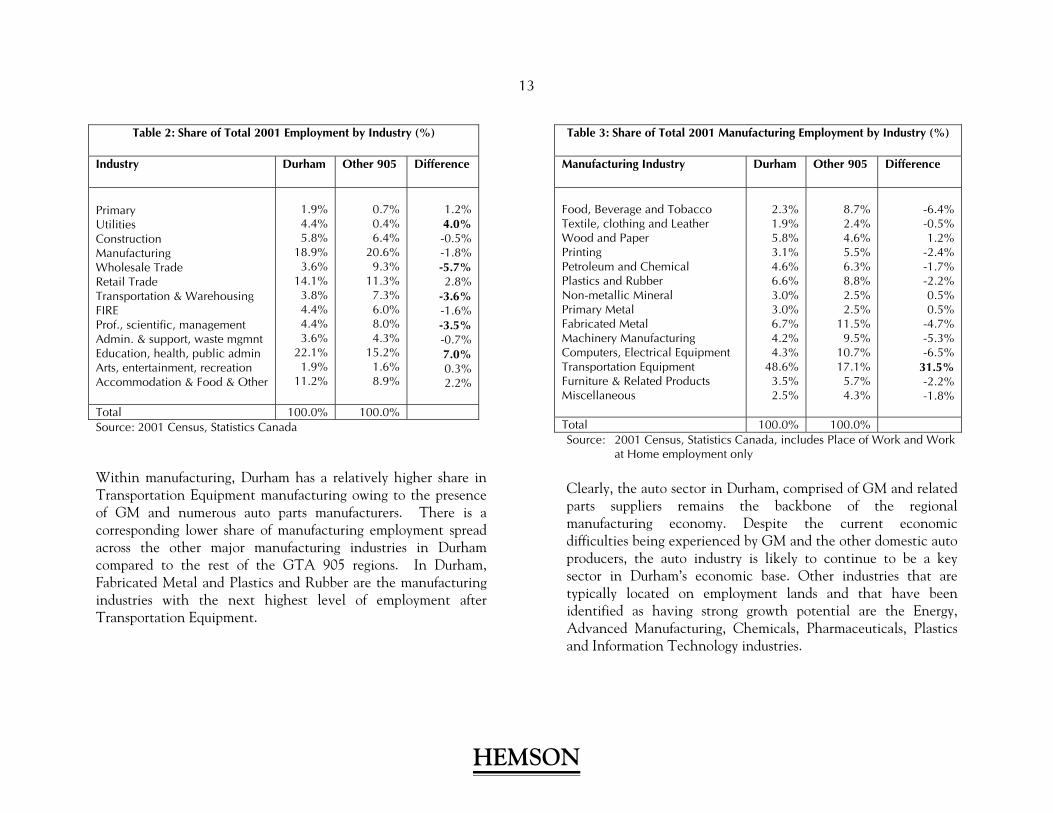
Within manufacturing, Durham has a relatively higher share in Transportation Equipment manufacturing owing to the presence of GM and numerous auto parts manufacturers. There is a corresponding lower share of manufacturing employment spread across the other major manufacturing industries in Durham compared to the rest of the GTA 905 regions. In Durham, Fabricated Metal and Plastics and Rubber are the manufacturing industries with the next highest level of employment after Transportation Equipment.
Table 3: Share of Total 2001 Manufacturing Employment by Industry (%)
Manufacturing Industry Durham Other 905 Difference
Food, Beverage and Tobacco Textile, clothing and Leather Wood and Paper Printing Petroleum and Chemical Plastics and Rubber Non-metallic Mineral Primary Metal Fabricated Metal Machinery Manufacturing Computers, Electrical Equipment Transportation Equipment Furniture & Related Products Miscellaneous
2.3%1.9%5.8%3.1%4.6%6.6%3.0%3.0%6.7%4.2%4.3%
48.6%3.5%2.5%
8.7%2.4%4.6%5.5%6.3%8.8%2.5%2.5%
11.5%9.5%
10.7%17.1%5.7%4.3%
-6.4%-0.5%1.2%
-2.4%-1.7%-2.2%0.5%0.5%
-4.7%-5.3%-6.5%
31.5%-2.2%-1.8%
Total 100.0% 100.0% Source: 2001 Census, Statistics Canada, includes Place of Work and Work
at Home employment only Clearly, the auto sector in Durham, comprised of GM and related parts suppliers remains the backbone of the regional manufacturing economy. Despite the current economic difficulties being experienced by GM and the other domestic auto producers, the auto industry is likely to continue to be a key sector in Durham’s economic base. Other industries that are typically located on employment lands and that have been identified as having strong growth potential are the Energy, Advanced Manufacturing, Chemicals, Pharmaceuticals, Plastics and Information Technology industries.
HEMSON
14
2. Durham’s Energy Industry Cluster Is Also Prominent
The Durham Strategic Energy Alliance was established in 2005, recognizing the presence in the Region of a strong cluster of businesses involved in the generation, transmission, and distribution of energy as well as various support industries. OPG forms the base for the Energy Cluster with nuclear power plants in Pickering and Clarington. Major distribution companies are located in Durham including Veridian, Enbridge and Siemens Canada. There are also a number of smaller firms undertaking research and development activities related to the Energy Industry.
Durham Region is also home to the University of Ontario Institute of Technology. Established in 2003, the UOIT has already been very successful in developing industry-based programs and research in the areas of energy and environmental technologies among other fields. The Energy industry is a growing industry that is already well established in Durham and would be ideally suited to the employment lands in Seaton.
3. Pickering Has Strengths in the Energy Sector
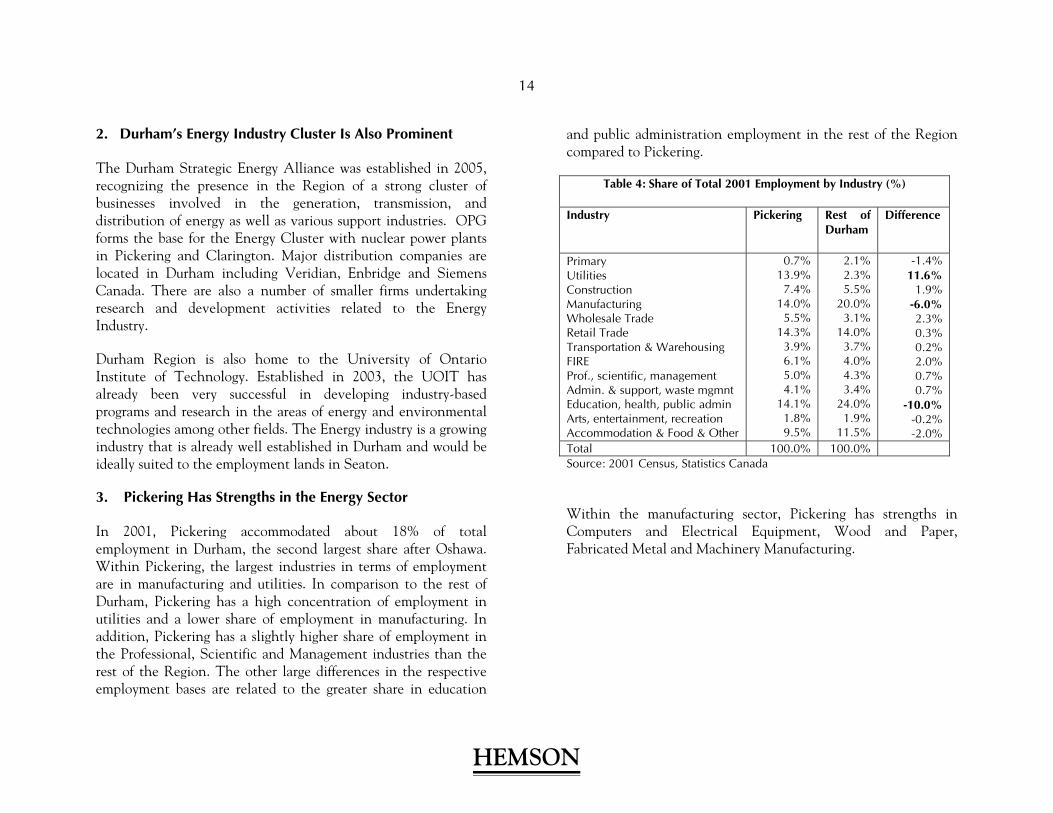
In 2001, Pickering accommodated about 18% of total employment in Durham, the second largest share after Oshawa. Within Pickering, the largest industries in terms of employment are in manufacturing and utilities. In comparison to the rest of Durham, Pickering has a high concentration of employment in utilities and a lower share of employment in manufacturing. In addition, Pickering has a slightly higher share of employment in the Professional, Scientific and Management industries than the rest of the Region. The other large differences in the respective employment bases are related to the greater share in education
and public administration employment in the rest of the Region compared to Pickering.
Table 4: Share of Total 2001 Employment by Industry (%)
Industry Pickering Rest of Durham
Difference
Primary Utilities Construction Manufacturing Wholesale Trade Retail Trade Transportation & Warehousing FIRE Prof., scientific, management Admin. & support, waste mgmnt Education, health, public admin Arts, entertainment, recreation Accommodation & Food & Other
0.7%13.9%7.4%
14.0%5.5%
14.3%3.9%6.1%5.0%4.1%
14.1%1.8%9.5%
2.1%2.3%5.5%
20.0%3.1%
14.0%3.7%4.0%4.3%3.4%
24.0%1.9%
11.5%
-1.4%11.6%
1.9%-6.0%2.3%0.3%0.2%2.0%0.7%0.7%
-10.0%-0.2%-2.0%
Total 100.0% 100.0% Source: 2001 Census, Statistics Canada
Within the manufacturing sector, Pickering has strengths in Computers and Electrical Equipment, Wood and Paper, Fabricated Metal and Machinery Manufacturing.
HEMSON
15
Table 5: Share of Total 2001 Manufacturing Employment by Industry (%)
Manufacturing Industry Pickering Rest of Durham
Difference
Food, Beverage and Tobacco Textile, clothing and Leather Wood and Paper Printing Petroleum and Chemical Plastics and Rubber Non-metallic Mineral Primary Metal Fabricated Metal Machinery Manufacturing Computers, Electrical Equipment Transportation Equipment Furniture & Related Products Miscellaneous
2.5%1.6%
12.2%9.5%5.5%9.1%1.1%3.4%
11.5%10.7%13.8%9.0%6.2%3.9%
2.3%2.0%4.8%2.1%4.4%6.2%3.3%2.9%6.0%3.2%2.8%
54.8%3.1%2.3%
0.3%-0.4%7.4%7.4%1.1%2.9%
-2.2%0.4%5.5%7.5%
11.1%-45.8%
3.2%1.6%
Total 100.0% 100.0% Source: 2001 Census, Statistics Canada, includes Place of Work and Work
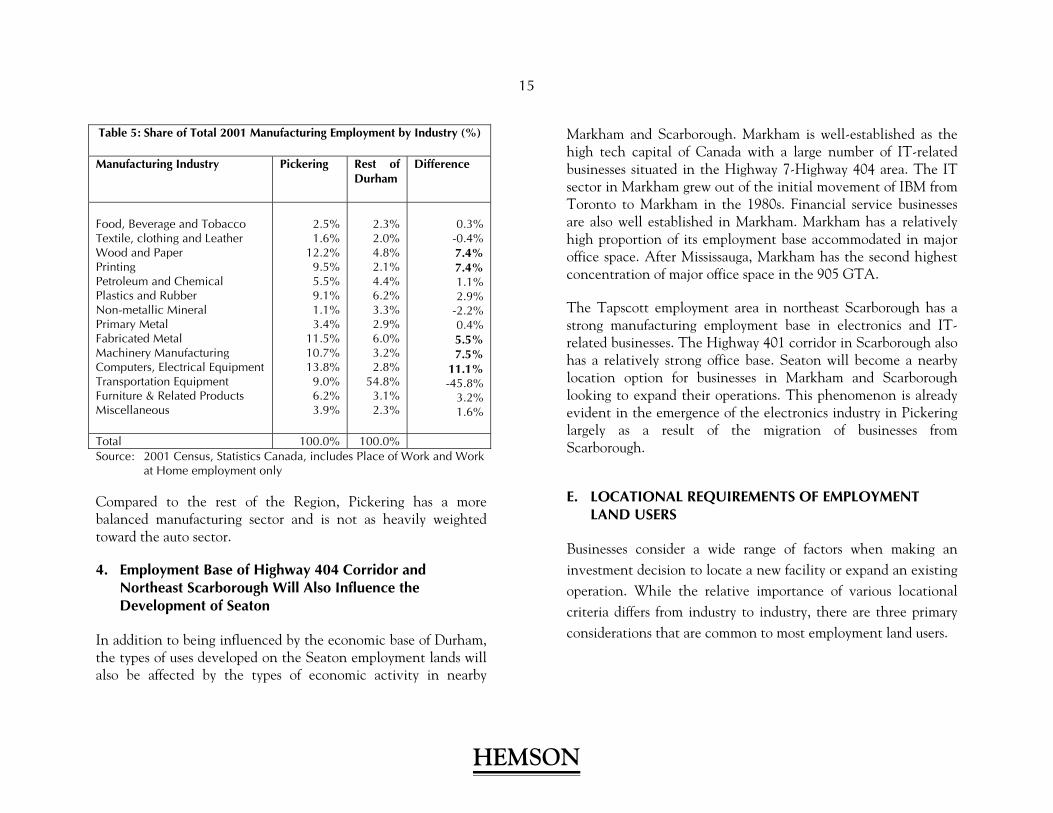
at Home employment only Compared to the rest of the Region, Pickering has a more balanced manufacturing sector and is not as heavily weighted toward the auto sector.
4. Employment Base of Highway 404 Corridor and Northeast Scarborough Will Also Influence the Development of Seaton
In addition to being influenced by the economic base of Durham, the types of uses developed on the Seaton employment lands will also be affected by the types of economic activity in nearby
Markham and Scarborough. Markham is well-established as the high tech capital of Canada with a large number of IT-related businesses situated in the Highway 7-Highway 404 area. The IT sector in Markham grew out of the initial movement of IBM from Toronto to Markham in the 1980s. Financial service businesses are also well established in Markham. Markham has a relatively high proportion of its employment base accommodated in major office space. After Mississauga, Markham has the second highest concentration of major office space in the 905 GTA.
The Tapscott employment area in northeast Scarborough has a strong manufacturing employment base in electronics and IT-related businesses. The Highway 401 corridor in Scarborough also has a relatively strong office base. Seaton will become a nearby location option for businesses in Markham and Scarborough looking to expand their operations. This phenomenon is already evident in the emergence of the electronics industry in Pickering largely as a result of the migration of businesses from Scarborough.
E. LOCATIONAL REQUIREMENTS OF EMPLOYMENT LAND USERS
Businesses consider a wide range of factors when making an investment decision to locate a new facility or expand an existing operation. While the relative importance of various locational criteria differs from industry to industry, there are three primary considerations that are common to most employment land users.
HEMSON
16
a. Access to Transportation Infrastructure
Most major employment land areas in the GTA have good access to a 400 series highway to allow for efficient goods movement, access to markets and access for labour. For some industries, proximity to other transportation infrastructure facilities such as intermodal facilities, ports or airports are also important locational factors.
b. Proximity to Labour Force
Similar to other businesses, employment land users need to be located within reasonable access of an abundant and appropriately skilled labour force for the type of work required. Although the GTA is a regional labour market, it is still important for the target labour market to have good access and be relatively close. Public transit access is more important for some users.
c. Compatible Business Setting
Employment land users want to be located in areas with similar types of uses to enhance their profile and to avoid potential land use conflicts. Prestige employment uses prefer business park settings with other like uses. Similarly, heavy industrial users prefer to be in an area with similar uses in order to avoid potential restrictions on operations resulting from proximity of incompatible uses.
For each employment land user, the relative importance of these and other secondary locational criteria have varying degrees of importance. For example,
• For technology-intensive businesses, access to a skilled labour pool is key.
• For logistics-distribution operations, good access to a 400 series highway is the prime consideration.
• For consumer product businesses, visibility to allow advertising of their brand name may be the most important factor.
Other potential secondary location criteria could include rail access, security of power supply, proximity to executive housing and others.
Seaton has access to a 400 series highway and is within easy commuting distance of the GTA East labour force. The development of the Seaton residential areas will provide a potential nearby labour force. The fact that Seaton is a large greenfield area will allow for the comprehensive planning of business parks with like users.
F. SEATON LIKELY TO DIFFER FROM MAJORITY OF MARKET
In order to gain a sense of the type of industrial/office buildings being developed in the major GTA markets, building permit data were examined in Pickering, Ajax, Whitby, Scarborough, Markham, Vaughan, Mississauga and Brampton. As the tables on the following pages illustrate, several important themes were
HEMSON
17
observed in the GTA industrial and commercial office/hotel market:
• Distribution uses (which include warehousing and self- storage), have been the most common function of new industrial buildings in most of the GTA jurisdictions studied.
• The GTA West has been experiencing the largest industrial growth both in terms of the quantity of buildings and space.
• The average lot size of new employment land development in the Durham municipalities is the lowest among the areas studied.
• There has been considerable speculative industrial development occurring in Mississauga, Brampton and Vaughan. Speculative development has been almost non-existent in Durham Region.
• Most of the new development in Durham Region has occurred in sectors that are already well established in the Region – energy, automotive, waste treatment, and furniture.
• The average industrial building size of new developments is much smaller in Durham than in other jurisdictions studied.
HEMSON
18
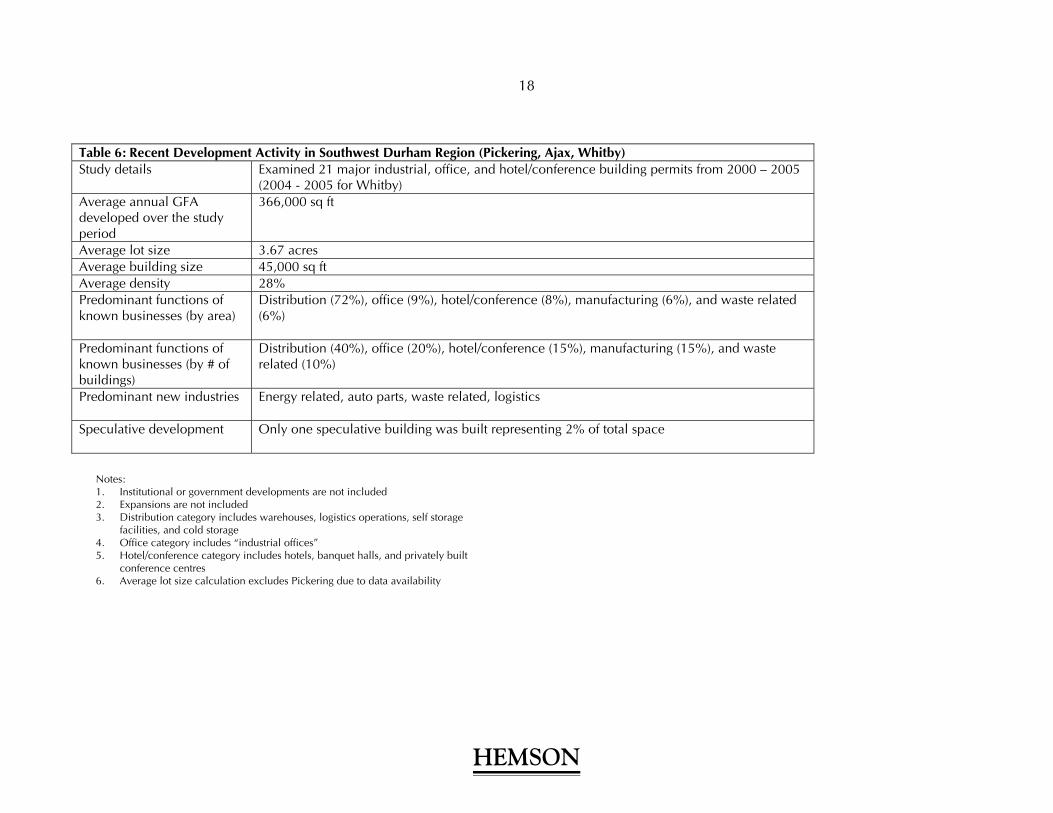
Table 6: Recent Development Activity in Southwest Durham Region (Pickering, Ajax, Whitby) Study details Examined 21 major industrial, office, and hotel/conference building permits from 2000 – 2005
(2004 - 2005 for Whitby) Average annual GFA developed over the study period
366,000 sq ft
Average lot size 3.67 acres Average building size 45,000 sq ft Average density 28% Predominant functions of known businesses (by area)
Distribution (72%), office (9%), hotel/conference (8%), manufacturing (6%), and waste related (6%)
Predominant functions of known businesses (by # of buildings)
Distribution (40%), office (20%), hotel/conference (15%), manufacturing (15%), and waste related (10%)
Predominant new industries Energy related, auto parts, waste related, logistics
Speculative development Only one speculative building was built representing 2% of total space
Notes: 1. Institutional or government developments are not included 2. Expansions are not included 3. Distribution category includes warehouses, logistics operations, self storage
facilities, and cold storage 4. Office category includes “industrial offices” 5. Hotel/conference category includes hotels, banquet halls, and privately built
conference centres 6. Average lot size calculation excludes Pickering due to data availability
HEMSON
19
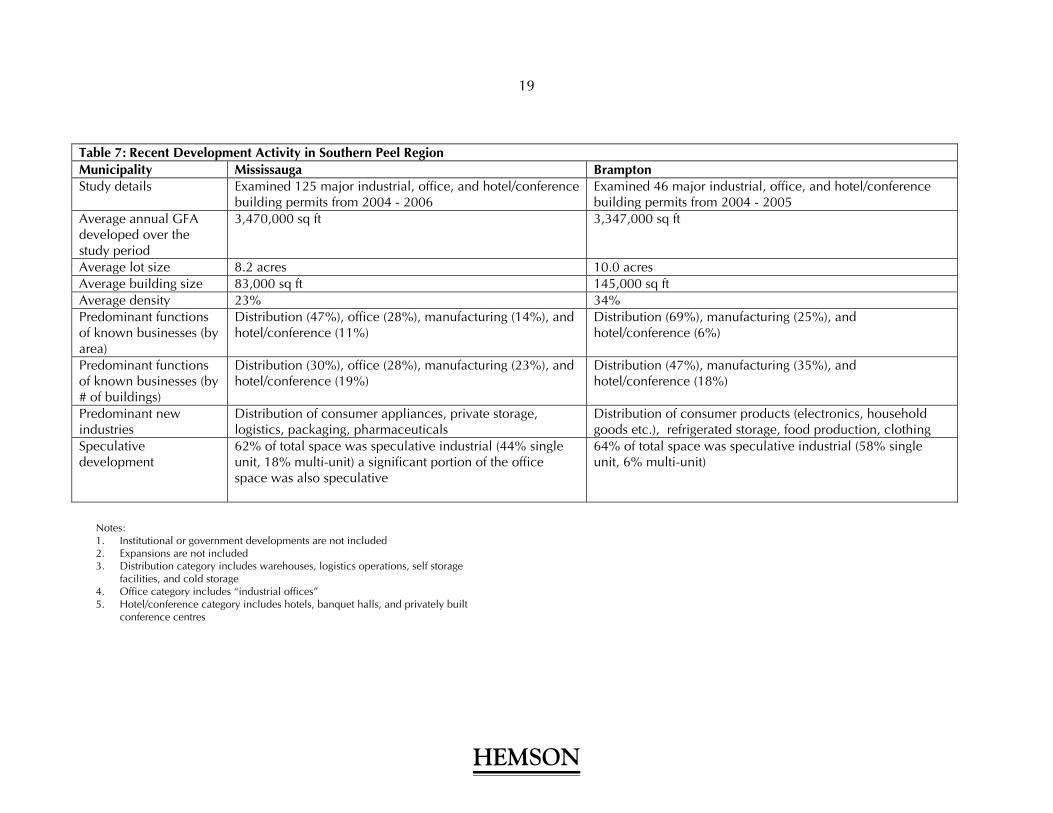
Table 7: Recent Development Activity in Southern Peel Region Municipality Mississauga Brampton Study details Examined 125 major industrial, office, and hotel/conference
building permits from 2004 - 2006 Examined 46 major industrial, office, and hotel/conference building permits from 2004 - 2005
Average annual GFA developed over the study period
3,470,000 sq ft 3,347,000 sq ft
Average lot size 8.2 acres 10.0 acres Average building size 83,000 sq ft 145,000 sq ft Average density 23% 34% Predominant functions of known businesses (by area)
Distribution (47%), office (28%), manufacturing (14%), and hotel/conference (11%)
Distribution (69%), manufacturing (25%), and hotel/conference (6%)
Predominant functions of known businesses (by # of buildings)
Distribution (30%), office (28%), manufacturing (23%), and hotel/conference (19%)
Distribution (47%), manufacturing (35%), and hotel/conference (18%)
Predominant new industries
Distribution of consumer appliances, private storage, logistics, packaging, pharmaceuticals
Distribution of consumer products (electronics, household goods etc.), refrigerated storage, food production, clothing
Speculative development
62% of total space was speculative industrial (44% single unit, 18% multi-unit) a significant portion of the office space was also speculative
64% of total space was speculative industrial (58% single unit, 6% multi-unit)
Notes: 1. Institutional or government developments are not included 2. Expansions are not included 3. Distribution category includes warehouses, logistics operations, self storage
facilities, and cold storage 4. Office category includes “industrial offices” 5. Hotel/conference category includes hotels, banquet halls, and privately built
conference centres
HEMSON
20
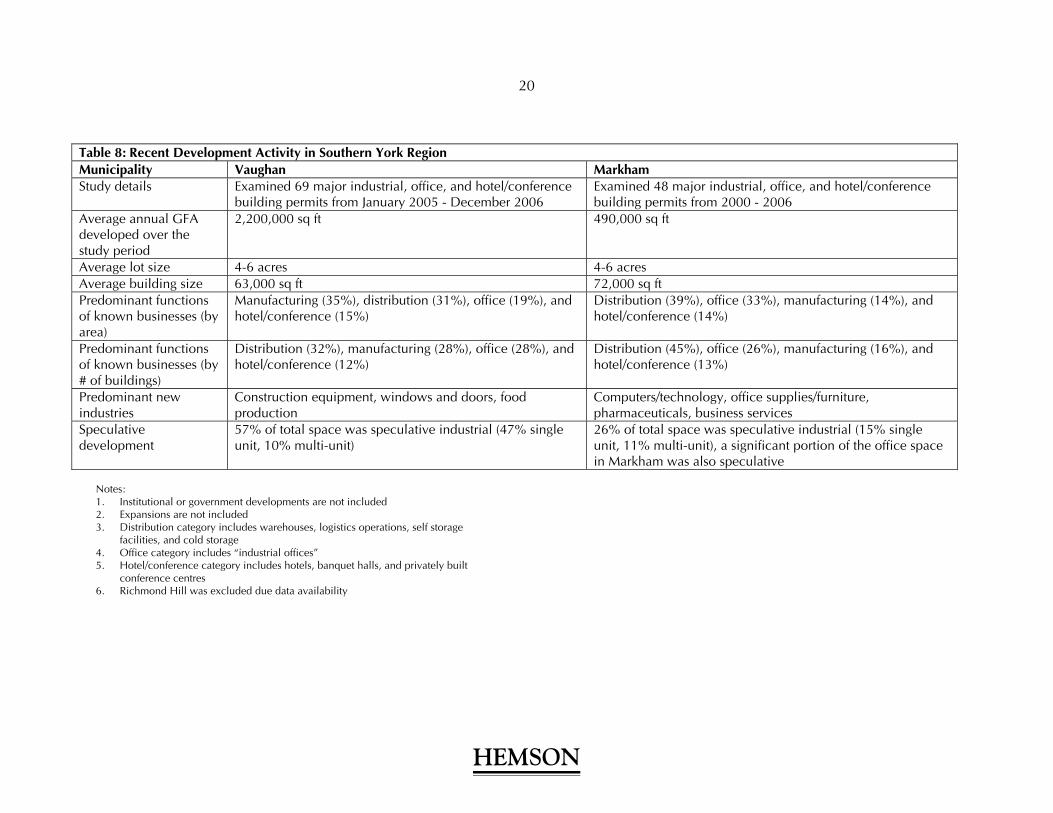
Table 8: Recent Development Activity in Southern York Region Municipality Vaughan Markham Study details Examined 69 major industrial, office, and hotel/conference
building permits from January 2005 - December 2006 Examined 48 major industrial, office, and hotel/conference building permits from 2000 - 2006
Average annual GFA developed over the study period
2,200,000 sq ft 490,000 sq ft
Average lot size 4-6 acres 4-6 acres Average building size 63,000 sq ft 72,000 sq ft Predominant functions of known businesses (by area)
Manufacturing (35%), distribution (31%), office (19%), and hotel/conference (15%)
Distribution (39%), office (33%), manufacturing (14%), and hotel/conference (14%)
Predominant functions of known businesses (by # of buildings)
Distribution (32%), manufacturing (28%), office (28%), and hotel/conference (12%)
Distribution (45%), office (26%), manufacturing (16%), and hotel/conference (13%)
Predominant new industries
Construction equipment, windows and doors, food production
Computers/technology, office supplies/furniture, pharmaceuticals, business services
Speculative development
57% of total space was speculative industrial (47% single unit, 10% multi-unit)
26% of total space was speculative industrial (15% single unit, 11% multi-unit), a significant portion of the office space in Markham was also speculative
Notes: 1. Institutional or government developments are not included 2. Expansions are not included 3. Distribution category includes warehouses, logistics operations, self storage
facilities, and cold storage 4. Office category includes “industrial offices” 5. Hotel/conference category includes hotels, banquet halls, and privately built
conference centres 6. Richmond Hill was excluded due data availability
HEMSON
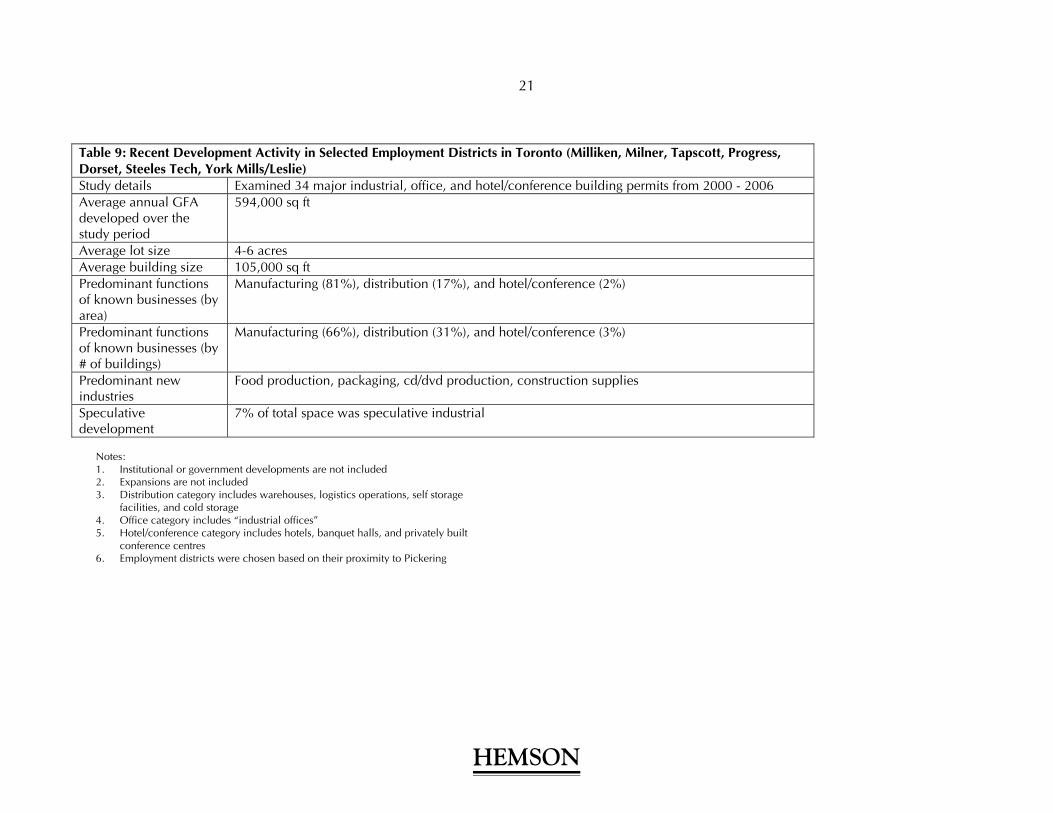
21
Table 9: Recent Development Activity in Selected Employment Districts in Toronto (Milliken, Milner, Tapscott, Progress, Dorset, Steeles Tech, York Mills/Leslie) Study details Examined 34 major industrial, office, and hotel/conference building permits from 2000 - 2006 Average annual GFA developed over the study period
594,000 sq ft
Average lot size 4-6 acres Average building size 105,000 sq ft Predominant functions of known businesses (by area)
Manufacturing (81%), distribution (17%), and hotel/conference (2%)
Predominant functions of known businesses (by # of buildings)
Manufacturing (66%), distribution (31%), and hotel/conference (3%)
Predominant new industries
Food production, packaging, cd/dvd production, construction supplies
Speculative development
7% of total space was speculative industrial
Notes: 1. Institutional or government developments are not included 2. Expansions are not included 3. Distribution category includes warehouses, logistics operations, self storage
facilities, and cold storage 4. Office category includes “industrial offices” 5. Hotel/conference category includes hotels, banquet halls, and privately built
conference centres 6. Employment districts were chosen based on their proximity to Pickering
HEMSON
22
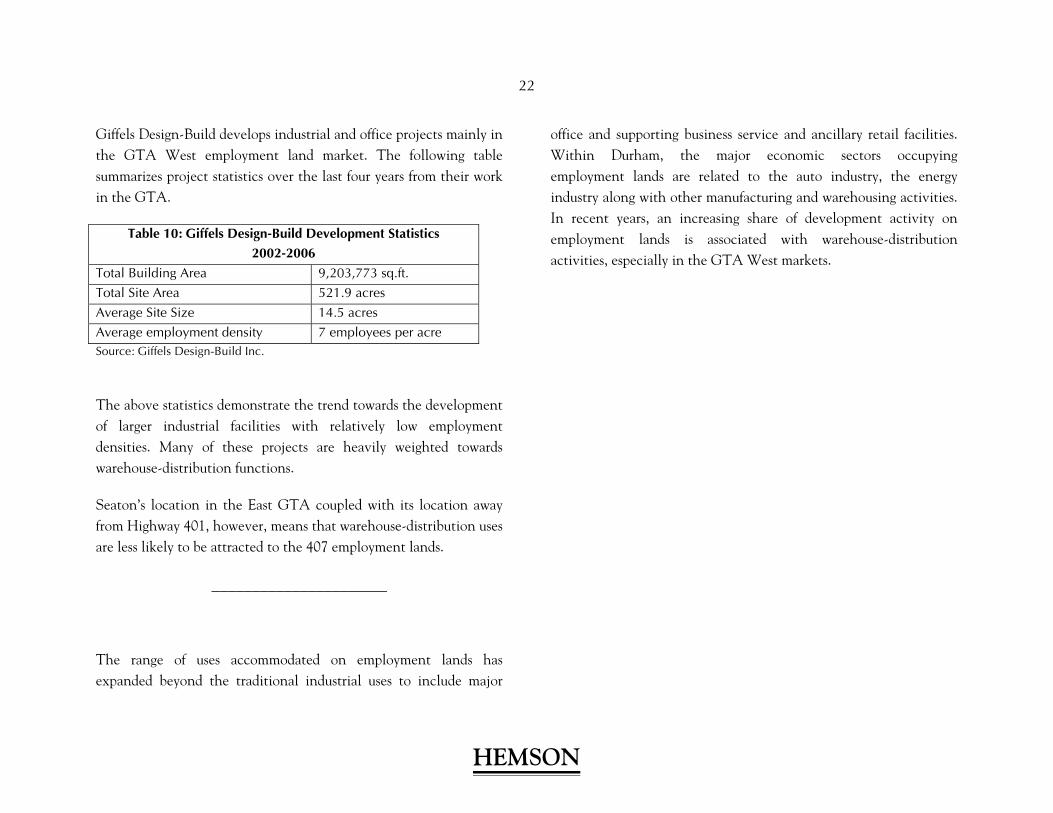
Giffels Design-Build develops industrial and office projects mainly in the GTA West employment land market. The following table summarizes project statistics over the last four years from their work in the GTA.
Table 10: Giffels Design-Build Development Statistics 2002-2006
Total Building Area 9,203,773 sq.ft. Total Site Area 521.9 acres Average Site Size 14.5 acres Average employment density 7 employees per acre Source: Giffels Design-Build Inc.
The above statistics demonstrate the trend towards the development of larger industrial facilities with relatively low employment densities. Many of these projects are heavily weighted towards warehouse-distribution functions.
Seaton’s location in the East GTA coupled with its location away from Highway 401, however, means that warehouse-distribution uses are less likely to be attracted to the 407 employment lands.
______________________
The range of uses accommodated on employment lands has expanded beyond the traditional industrial uses to include major
office and supporting business service and ancillary retail facilities. Within Durham, the major economic sectors occupying employment lands are related to the auto industry, the energy industry along with other manufacturing and warehousing activities. In recent years, an increasing share of development activity on employment lands is associated with warehouse-distribution activities, especially in the GTA West markets.
HEMSON
HEMSON
23
III GTA EMPLOYMENT LAND MARKET ASSESSMENT
This chapter examines the market demand and supply environment of the GTA and Durham in relation to the potential market for employment land uses in Seaton.
A. LARGE SHARE OF EMPLOYMENT LAND MARKET ACTIVITY IS IN THE GTA WEST
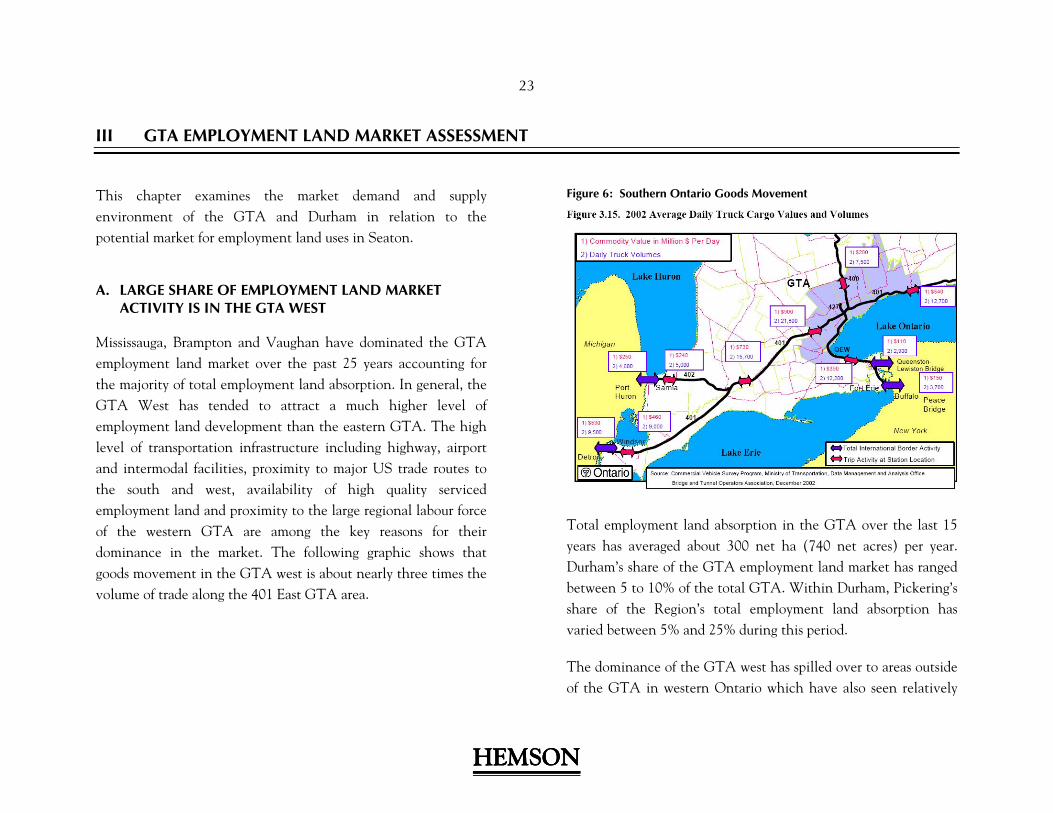
Mississauga, Brampton and Vaughan have dominated the GTA employment land market over the past 25 years accounting for the majority of total employment land absorption. In general, the GTA West has tended to attract a much higher level of employment land development than the eastern GTA. The high level of transportation infrastructure including highway, airport and intermodal facilities, proximity to major US trade routes to the south and west, availability of high quality serviced employment land and proximity to the large regional labour force of the western GTA are among the key reasons for their dominance in the market. The following graphic shows that goods movement in the GTA west is about nearly three times the volume of trade along the 401 East GTA area.
Figure 6: Southern Ontario Goods Movement
Total employment land absorption in the GTA over the last 15 years has averaged about 300 net ha (740 net acres) per year. Durham’s share of the GTA employment land market has ranged between 5 to 10% of the total GTA. Within Durham, Pickering’s share of the Region’s total employment land absorption has varied between 5% and 25% during this period.
The dominance of the GTA west has spilled over to areas outside of the GTA in western Ontario which have also seen relatively
HEMSONHEMSON
24
high levels of development activity in recent years. Brantford and the Kitchener-Waterloo area have experienced recent surges in employment land development along with Woodstock which will be home to a new auto assembly plant in 2008.
B. SEATON WILL CONTRIBUTE TO ACHIEVING DURHAM’S EMPLOYMENT GOALS
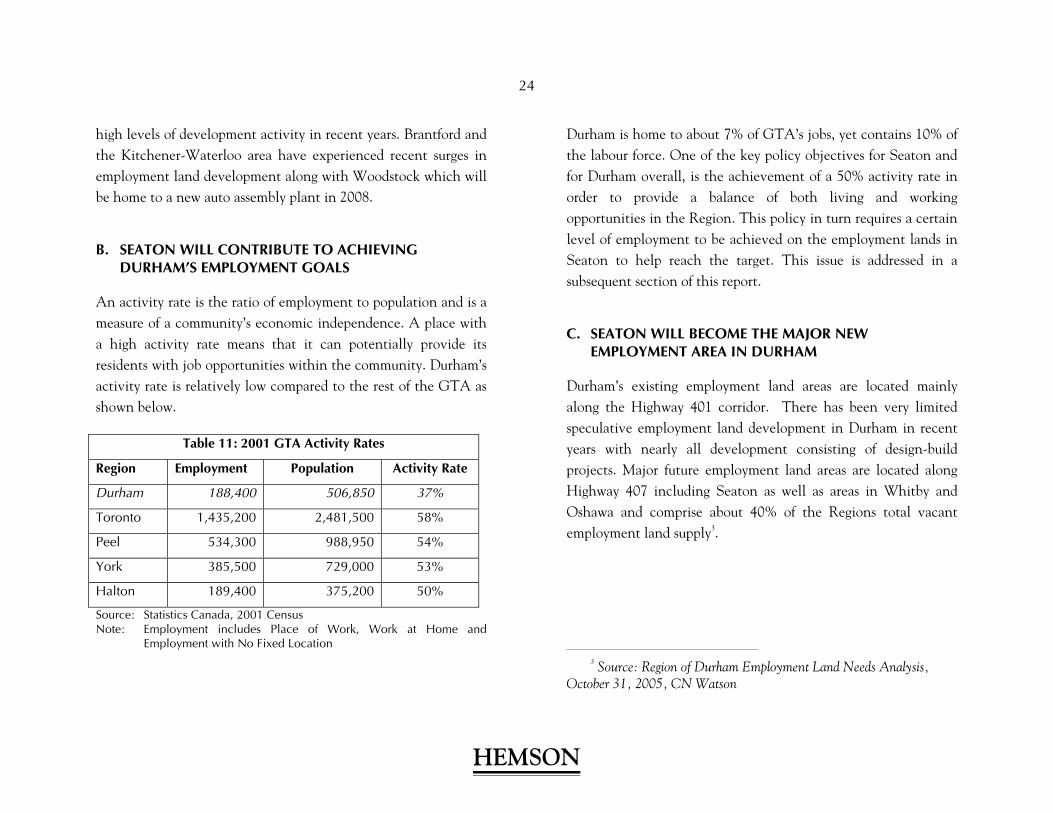
An activity rate is the ratio of employment to population and is a measure of a community’s economic independence. A place with a high activity rate means that it can potentially provide its residents with job opportunities within the community. Durham’s activity rate is relatively low compared to the rest of the GTA as shown below.
Table 11: 2001 GTA Activity Rates
Region Employment Population Activity Rate
Durham 188,400 506,850 37%
Toronto 1,435,200 2,481,500 58%
Peel 534,300 988,950 54%
York 385,500 729,000 53%
Halton 189,400 375,200 50%
Source: Statistics Canada, 2001 Census Note: Employment includes Place of Work, Work at Home and
Employment with No Fixed Location
Durham is home to about 7% of GTA’s jobs, yet contains 10% of the labour force. One of the key policy objectives for Seaton and for Durham overall, is the achievement of a 50% activity rate in order to provide a balance of both living and working opportunities in the Region. This policy in turn requires a certain level of employment to be achieved on the employment lands in Seaton to help reach the target. This issue is addressed in a subsequent section of this report.
C. SEATON WILL BECOME THE MAJOR NEW EMPLOYMENT AREA IN DURHAM
Durham’s existing employment land areas are located mainly along the Highway 401 corridor. There has been very limited speculative employment land development in Durham in recent years with nearly all development consisting of design-build projects. Major future employment land areas are located along Highway 407 including Seaton as well as areas in Whitby and Oshawa and comprise about 40% of the Regions total vacant employment land supply3.
3 Source: Region of Durham Employment Land Needs Analysis,
October 31, 2005, CN Watson
HEMSON
25
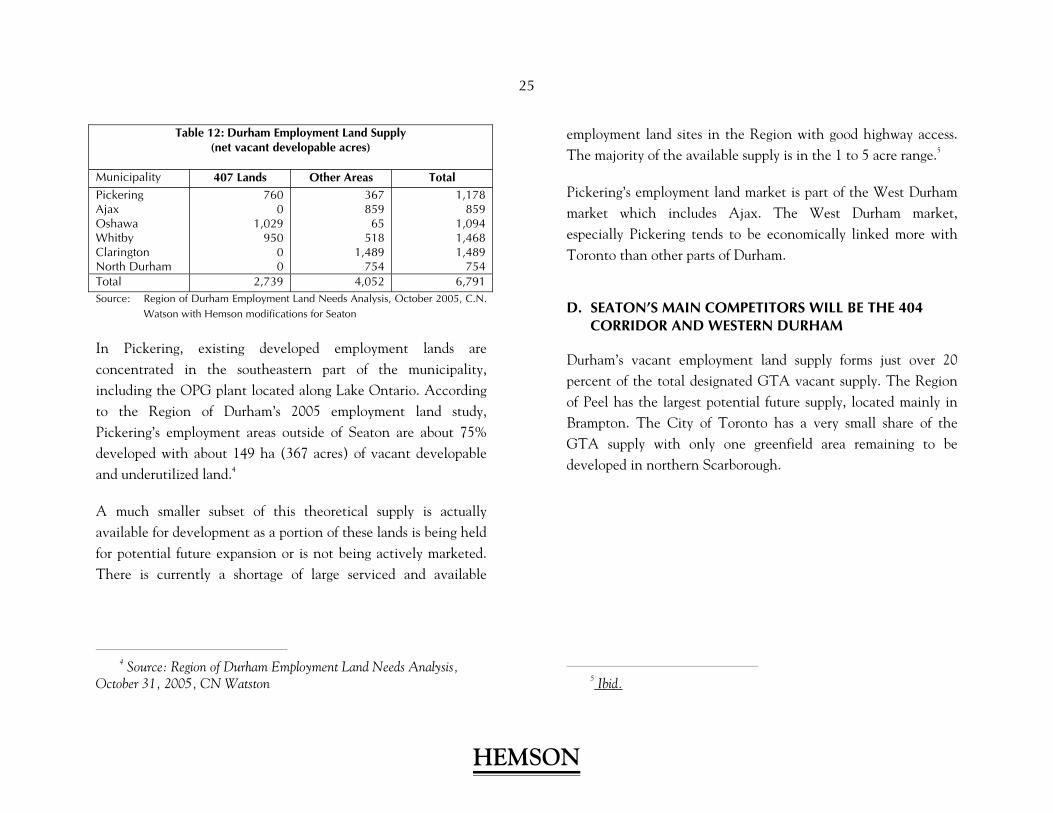
Table 12: Durham Employment Land Supply (net vacant developable acres)
Municipality 407 Lands Other Areas Total Pickering Ajax Oshawa Whitby Clarington North Durham
760 0
1,029 950
0 0
36785965
5181,489
754
1,178859
1,0941,4681,489
754 Total 2,739 4,052 6,791 Source: Region of Durham Employment Land Needs Analysis, October 2005, C.N.
Watson with Hemson modifications for Seaton
In Pickering, existing developed employment lands are concentrated in the southeastern part of the municipality, including the OPG plant located along Lake Ontario. According to the Region of Durham’s 2005 employment land study, Pickering’s employment areas outside of Seaton are about 75% developed with about 149 ha (367 acres) of vacant developable and underutilized land.4
A much smaller subset of this theoretical supply is actually available for development as a portion of these lands is being held for potential future expansion or is not being actively marketed. There is currently a shortage of large serviced and available
4 Source: Region of Durham Employment Land Needs Analysis,
October 31, 2005, CN Watston
employment land sites in the Region with good highway access. The majority of the available supply is in the 1 to 5 acre range.5
Pickering’s employment land market is part of the West Durham market which includes Ajax. The West Durham market, especially Pickering tends to be economically linked more with Toronto than other parts of Durham.
D. SEATON’S MAIN COMPETITORS WILL BE THE 404 CORRIDOR AND WESTERN DURHAM
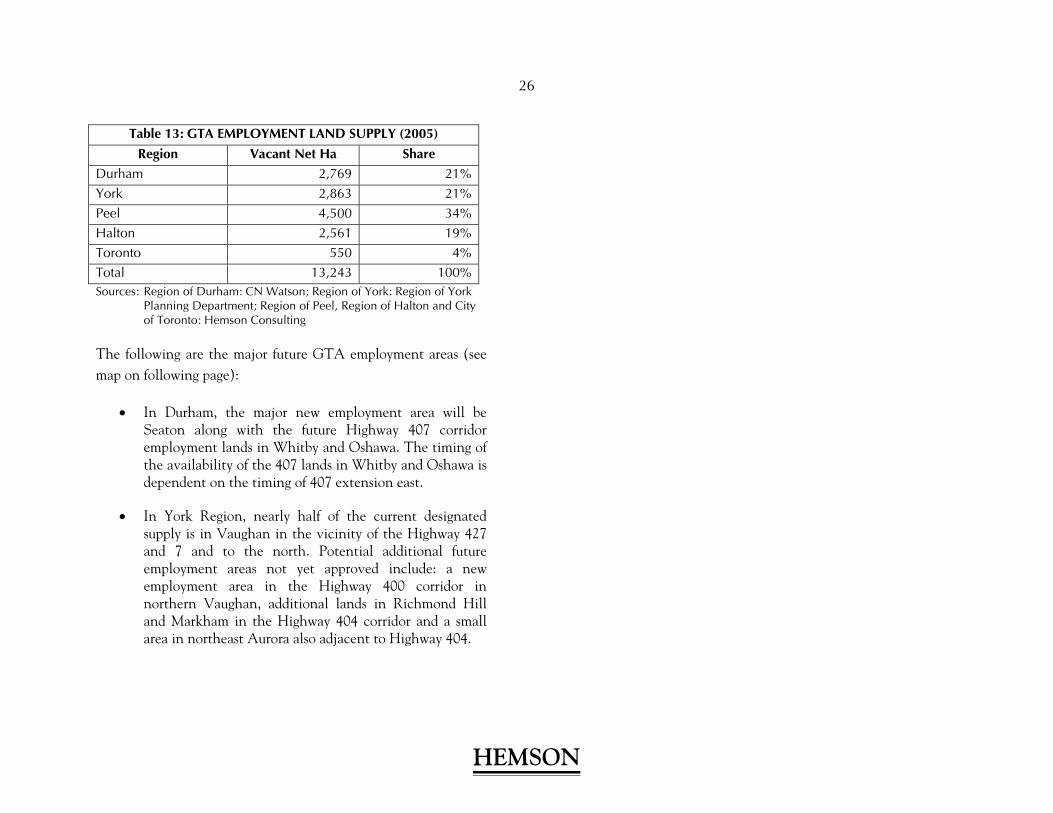
Durham’s vacant employment land supply forms just over 20 percent of the total designated GTA vacant supply. The Region of Peel has the largest potential future supply, located mainly in Brampton. The City of Toronto has a very small share of the GTA supply with only one greenfield area remaining to be developed in northern Scarborough.
5 Ibid.
HEMSON
26
Table 13: GTA EMPLOYMENT LAND SUPPLY (2005)
Region Vacant Net Ha Share Durham 2,769 21%York 2,863 21%Peel 4,500 34%Halton 2,561 19%Toronto 550 4%Total 13,243 100%Sources: Region of Durham: CN Watson; Region of York: Region of York
Planning Department; Region of Peel, Region of Halton and City of Toronto: Hemson Consulting
The following are the major future GTA employment areas (see map on following page):
• In Durham, the major new employment area will be Seaton along with the future Highway 407 corridor employment lands in Whitby and Oshawa. The timing of the availability of the 407 lands in Whitby and Oshawa is dependent on the timing of 407 extension east.
• In York Region, nearly half of the current designated supply is in Vaughan in the vicinity of the Highway 427 and 7 and to the north. Potential additional future employment areas not yet approved include: a new employment area in the Highway 400 corridor in northern Vaughan, additional lands in Richmond Hill and Markham in the Highway 404 corridor and a small area in northeast Aurora also adjacent to Highway 404.
HEMSON
HEMSON
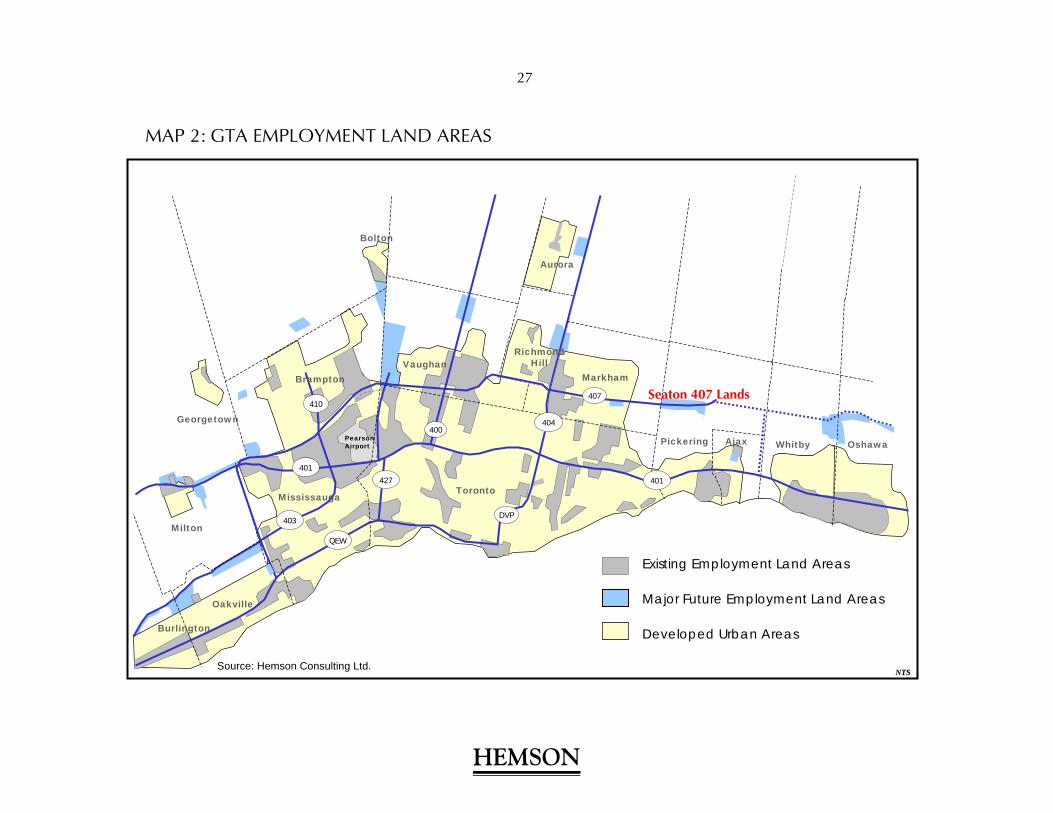
MAP 2: GTA EMPLOYMENT LAND AREAS
Existing Employment Land Areas
Major Future Employment Land Areas
Developed Urban Areas
Mississauga
VaughanMarkham
WhitbyPickering
RichmondHill
Aurora
Bolton
Toronto
Seaton 407 Lands
Georgetown
Milton
Oakville
Burlington
OshawaAjax
407
404
DVP
427
400
410
401
403
QEW
401
Source: Hemson Consulting Ltd.NTSNTS
PearsonAirport
Brampton
27
HEMSON
28
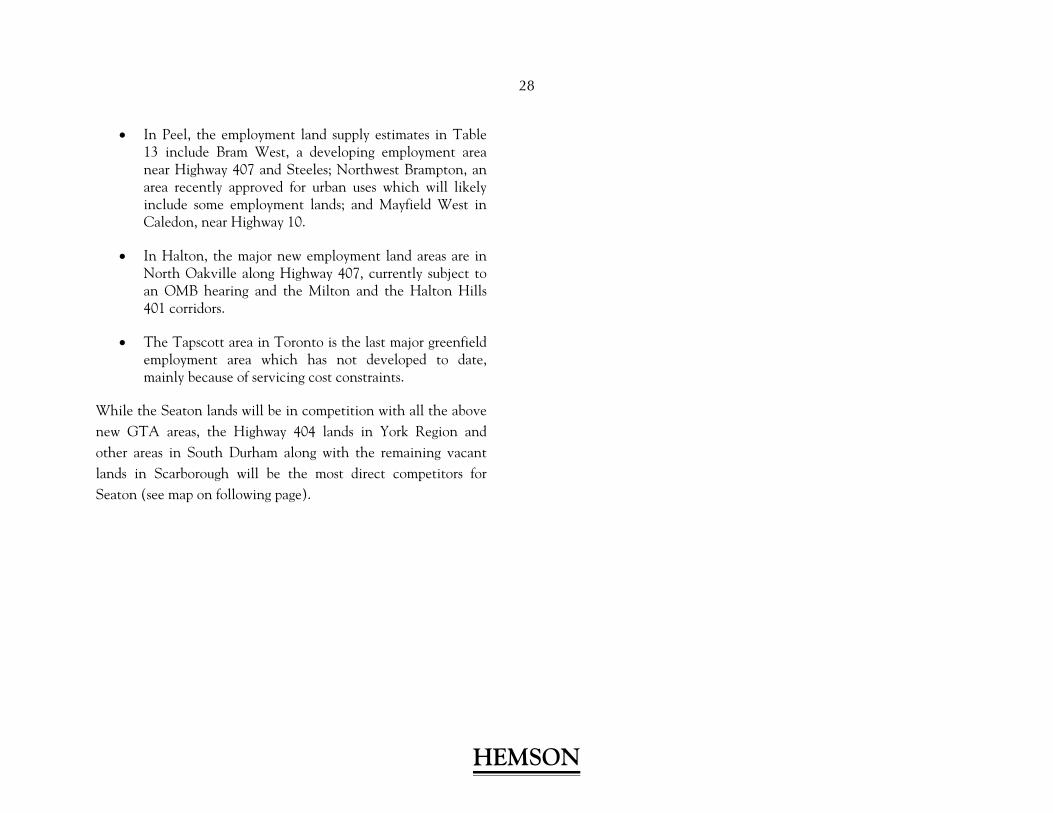
• In Peel, the employment land supply estimates in Table 13 include Bram West, a developing employment area near Highway 407 and Steeles; Northwest Brampton, an area recently approved for urban uses which will likely include some employment lands; and Mayfield West in Caledon, near Highway 10.
• In Halton, the major new employment land areas are in North Oakville along Highway 407, currently subject to an OMB hearing and the Milton and the Halton Hills 401 corridors.
• The Tapscott area in Toronto is the last major greenfield employment area which has not developed to date, mainly because of servicing cost constraints.
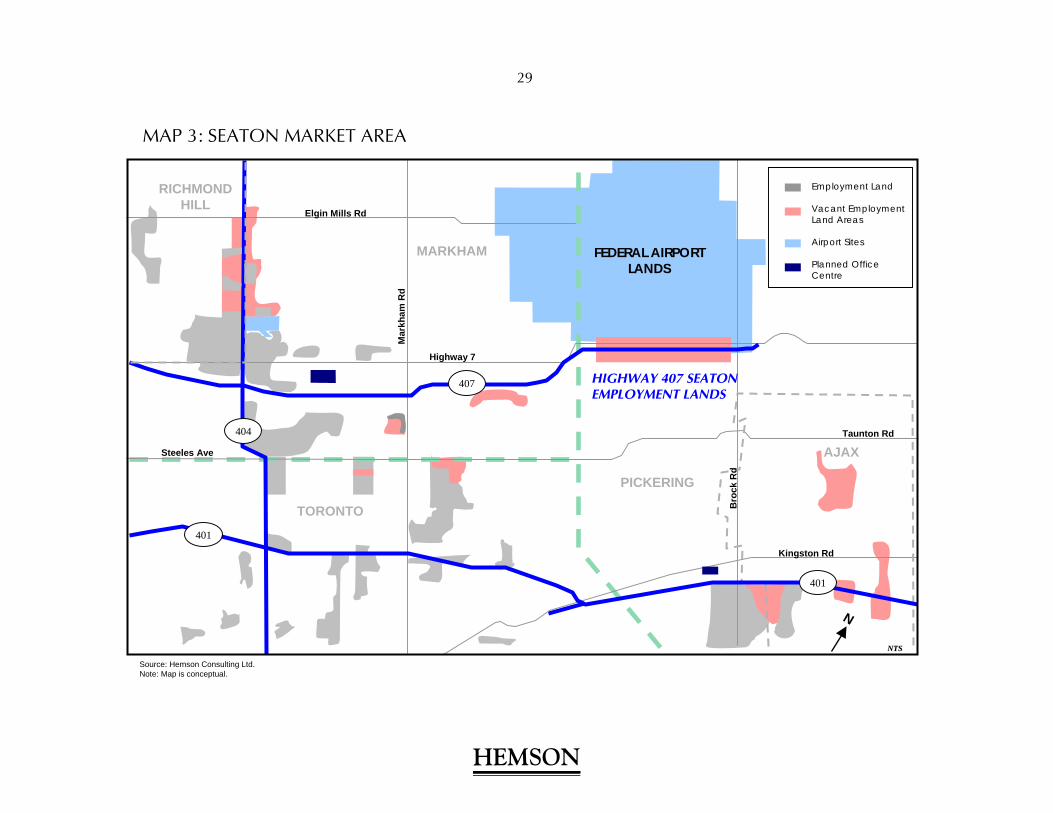
While the Seaton lands will be in competition with all the above new GTA areas, the Highway 404 lands in York Region and other areas in South Durham along with the remaining vacant lands in Scarborough will be the most direct competitors for Seaton (see map on following page).
HEMSON
HEMSON
MAP 3: SEATON MARKET AREA
PICKERING
MARKHAM
AJAXTaunton Rd
TORONTO
FEDERAL AIRPORT LANDS
Highway 7
Steeles Ave
Elgin Mills Rd
RICHMOND HILL
Source: Hemson Consulting Ltd.Note: Map is conceptual.
NTSNTS
401
404
401
Kingston Rd
Employment Land
Vacant Employment Land Areas
Airport Sites
Planned Office Centre
N
Bro
ck R
d
HIGHWAY 407 SEATONEMPLOYMENT LANDS
Mar
kham
Rd
407
29
HEMSON
30
Seaton will be well positioned relative to the competing surrounding opportunities in York, Toronto and Durham. While there are remaining designated vacant employment lands along the Highway 404 corridor in Markham and Richmond Hill, there is also a very high level of demand for employment land in York Region projected for the next 25 years. In addition, because of very high land prices in the 404 corridor, there will be limited opportunity for more campus and land extensive types of development. The nature of the land ownership in the 404 corridor is also a constraint for employment land users as most of the land is only for design-build purposes; there is not a lot of land available for purchase.
In Tapscott, the high cost of servicing has inhibited the development of the last greenfield employment land parcel in the City of Toronto. While the employment land supply in southern Durham would have the advantage of being closer to Highway 401 than Seaton, as described above, there is limited land actually available for development, especially large parcels and design-build limitations (over 80% of vacant available employment land in Pickering in being held for design-build purposes as the only development option).
E. DURHAM’S EMPLOYMENT LAND IS RELATIVELY LESS EXPENSIVE
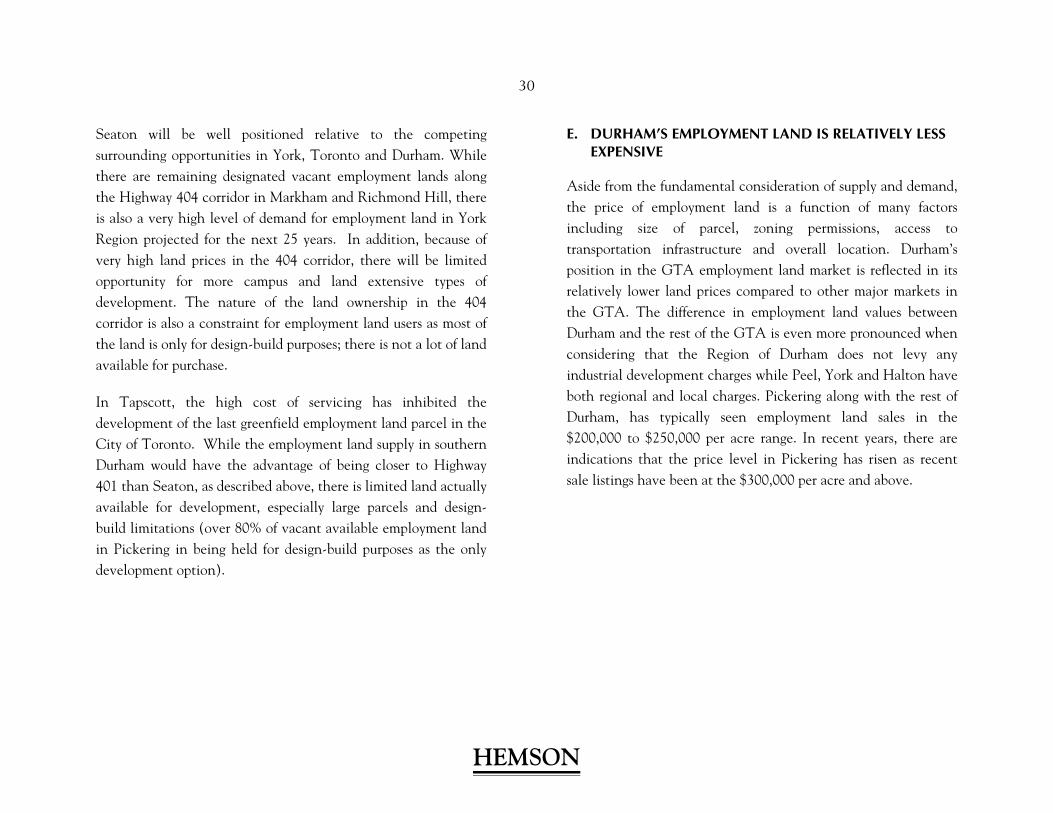
Aside from the fundamental consideration of supply and demand, the price of employment land is a function of many factors including size of parcel, zoning permissions, access to transportation infrastructure and overall location. Durham’s position in the GTA employment land market is reflected in its relatively lower land prices compared to other major markets in the GTA. The difference in employment land values between Durham and the rest of the GTA is even more pronounced when considering that the Region of Durham does not levy any industrial development charges while Peel, York and Halton have both regional and local charges. Pickering along with the rest of Durham, has typically seen employment land sales in the $200,000 to $250,000 per acre range. In recent years, there are indications that the price level in Pickering has risen as recent sale listings have been at the $300,000 per acre and above.
HEMSON
31
Table 14: 2006 GTA FULLY SERVICED EMPLOYMENT LAND PRICES
Municipality Typical Price Per Acre
Durham
Pickering $275,000 Ajax $250,000
York
Markham $575,000 Richmond Hill $475,000 Aurora $425,000 Newmarket $375,000 Vaughan $600,000
Toronto
Scarborough $360,000
Peel
Mississauga $550,000 Brampton $475,000
Halton
Oakville $400,000 Milton $400,000 Source: Municipal Economic Development Departments, real estate
broker listings, sales data from Realtrack database. Over the last 20 years, employment areas around the Pearson Airport and in Vaughan, Markham and Richmond Hill have experienced the largest increases in employment land values. In very recent years, with the development of new employment areas along Highway 401 and restricted supply in competing markets, Milton has seen large increases in employment land values from previous years.
Employment land prices in Seaton will be influenced by land values in Pickering and in the markets to immediate west, in Markham, Scarborough and the Highway 404 corridor. Having the required water and wastewater services along with the Highway 407 interchanges in place will be key in achieving the highest potential land values for the Seaton employment lands. It is anticipated that fully serviced employment lands in Seaton could sell in the range of $350,000 to $400,000 per acre when they come on the market. As the area becomes better known and as the better located supply elsewhere is used up, these prices can be expected to increase at a faster rate than any general increase that may occur in the price of GTA employment land.
F. SEATON’S CAMPUS OFFICE POTENTIAL WILL ASSIST IN A VERY COMPETITIVE MARKET
The market for major office development is an important subset of the employment land market that provides relatively large numbers of jobs over small areas. Office development in the GTA originated in the financial core of the City of Toronto which remains the largest concentration of office development in the region. Office development migrated outwards from the Downtown area to nodes on Yonge Street and north along the Don Valley Parkway and Highway 404. The 1980s saw the emergence of more suburban office concentrations in Mississauga around the Airport and at the City Centre, the Highway 427 corridor in Etobicoke as well as smaller nodes in Burlington and
HEMSON
32
Oakville. Today, outside of the City of Toronto, the largest concentrations of office development are in Mississauga and Markham. The majority of new office development continues to occur in business park settings as opposed to downtown or node locations.
Because most office development is not as land consumptive as industrial development, there are usually potential office sites to be found in most business parks in addition to office permissions in designated nodes and corridors and downtown areas. The office market is very competitive given that there is a limited amount of total demand for space and that many municipalities are competing to attract new office development. Office development is viewed as a “clean” employment use that provides a large number of jobs in a small area and can also contribute to enhancing the overall market profile of an area and also supports public transit.
Durham’s major office buildings comprise about only 5% of the total office space in the GTA outside of the City of Toronto. The Durham office market is concentrated in the major urban municipalities in Downtown Oshawa, the Pickering Town Centre node area and the employment areas of Pickering, Ajax and Whitby. A large share of the office space in Durham are non-competitive buildings occupied by single users such as the OPG office buildings in Pickering, the GM Canada headquarters in Oshawa and the Durham Regional offices in Whitby.
In appealing to office users, Seaton will directly compete with the Highway 404/Highway 7 area in Markham and Richmond Hill; Markham Centre, a planned community further east along Highway 7 and other locations in southern Durham. Seaton’s key competitive advantage will be its ability to provide campus-style office sites with nearby natural environment amenities at a lower land price than Markham.
______________________
Durham has historically formed a relatively small component of the GTA employment land market. In the coming years, however, the Seaton Highway 407 employment lands will become a major new greenfield area in the GTA East employment land market. Seaton’s main competition will be from the Highway 404 corridor, Scarborough and other parts of Durham. The next chapter examines Seaton’s locational and physical characteristics in more detail as they relate to the market potential for prestige employment lands.
HEMSON
33
IV SEATON MARKET ASSESSMENT
Following from the employment land market assessment in the previous chapters, this chapter examines the specific site and locational characteristics of Seaton from a market perspective.
A. SEATON SWOT ANALYSIS
The Seaton Highway 407 Employment Lands were assessed based on their market strengths, weaknesses, opportunities and threats. The assessment is summarized below:
1. Strengths
• The Seaton lands currently have good access to a 400 series highway (Highway 407) and will have even better access once the two proposed interchanges are constructed at Sideline 22 and Sideline 26.
• Because the Seaton lands are a large, greenfield corridor, this allows the ability to provide a range and variety of different parcel types and sizes.
• The attractive natural heritage system in Seaton is integrated with the employment areas and will be appealing to prestige employment uses.
• Seaton is currently under the ownership of one landowner (the Province) which is an important strategic
advantage in terms of being able to comprehensively plan the area and implement employment and sustainability policy objectives for the area.
• The employment lands along Highway 407 will become part of the overall Seaton community which is planned to be a showcase community for compact, mixed-use and sustainable development. The 407 employment lands will provide high quality job opportunities for Seaton residents.
• Although Seaton is currently removed from existing developed areas, it is within a relatively short commuting distance for the skilled labour forces in Durham, York Region and Toronto.
2. Weaknesses
• Seaton is located in the GTA East and is therefore further away from the major US trade routes to the south and west than the major competing employment land markets in the GTA west. The Seaton lands are located at the east end of Highway 407 which currently dead-ends at Brock Road. As discussed above, the GTA East market is much smaller than the GTA West.
• While the Seaton employment area will have good access to a major 400 series highway, it will be access to a toll highway. Evidence to date has indicated that commercial
HEMSON
34
trucks have not used the 407 to the extent projected. Notwithstanding this fact, North Oakville, another major new employment area also has major employment lands positioned along Highway 407.
• The Seaton area currently has no market profile and is relatively isolated as it is a completely undeveloped, greenfield area. This situation will change once development commences but will be challenging in attracting the first new employment uses.
• The long and narrow configuration of the lands is not ideal. This is especially problematic on the south side of Highway 407. Because of the NHS, there are parcels which will be difficult to develop. Infrastructure costs will also be relatively high because of the configuration.
• While the Seaton lands will have excellent access to Highway 407, access to Highway 401, the major eastern trade route, is currently less than ideal. The planned improvements to Brock Road will help alleviate this problem in the short to medium term. In the longer term, once Highway 407 is extended further east, a limited access north-south link with Highway 401 will likely be constructed just east of Seaton. Because of this situation, Seaton will likely be less attractive to major warehouse-distribution users as it will not have nearby access to the GTA west markets or at least initially, direct access to the eastern Ontario markets along Highway 401.
• Seaton is far removed from the GTA’s major intermodal facilities in Vaughan, Brampton and Milton which will
likely only be negative factors for major warehouse-distribution users.
• The Seaton lands will be costly to service. Preliminary estimate of the cost to extend major trunk services from the Seaton residential area to the employment lands is in the order of $40 million.
• The Seaton employment lands comprise a large greenfield corridor, however, the parcels available for development vary in terms of size, configuration and access. Many of the parcels on the south side of Highway 407 are awarkwardly shaped and difficult to access and would therefore be costly to service.
3. Opportunities
• Seaton provides an ideal location for the growing Energy Industry Cluster in Durham by providing a prestige business park setting that incorporates the principles of sustainable development. Seaton can also provide employment lands for uses related to the Region’s largest employer, the auto sector.
• The industry-driven programs of UOIT and Durham College in the Energy and Advance Manufacturing Sectors could be linked with new employment uses and also result in spin-off research and development activities. Under its fullest potential, a UOIT branded presence in the employment lands could be provided.
• The development of the Pickering Airport would both provide employment land development opportunities for
HEMSON
35
Seaton and also enhance the market profile of the area. Potential spin-off employment opportunities include aviation-related uses, logistics and cargo uses and enhancement of the attractiveness of the area for IT and bio-medical uses. A recent report estimates that at full development, the Pickering Airport could provide in the order of 5,400 to 11,000 jobs by 2032 on both the Airport lands and the surrounding area.6
• The need to incorporate sustainability principles into new residential and employment development is being increasingly recognized by all levels of government, business and the general public. With the Province as the sole landowner, Seaton represents a prime opportunity to develop a sustainable employment area consistent with the principles set out in the Central Pickering Development Plan.
• The relatively limited employment land supply in West Durham, the 404 Corridor and in Scarborough coupled with the forecast demand for employment land over the coming years means that Seaton will be the major new employment land area in the east GTA.
4. Threats
• The extension of Highway 407 east to Highway 35/115 along with the north-south limited access links to
6 Economic Development Study – Regional Reliever Airport on the
Pickering Lands, Prepared for the GTAA by Leigh Fisher Associates, January 2004
Highway 401 would greatly enhance the accessibility of the Seaton lands. The timing of the Highway 407 extension is not known at this time. A long delay in the construction of this extension would detract from the market for the lands.
• The uncertainty surrounding the timing and type of airport (a small regional airport vs. a larger reliever airport for Pearson International) that may be developed just north of the Seaton lands is a disadvantage. It is also uncertain at this time as to the extent to which employment lands for airport-related uses will be provided on the airport lands themselves, thus reducing the need for the Seaton lands to accommodate these types of uses.
• While the GTA is still a manufacturing and distribution-based economy, an increasing number of manufacturing functions are being “off-shored” to locations outside of North America. Warehouse-distribution is making up an increasing share of new employment land development in the GTA. The decreasing manufacturing opportunities in the GTA may have an impact on types of jobs and pace of development of Seaton.
• The economy of the GTA and especially Durham, is tied to the auto sector. While the “new domestics” including Toyota and Honda have been gaining market share, the traditional US manufacturers, including GM have been struggling, threatening the potential for additional supplier-related development. At the same time, the GM Oshawa plant has been successful within the ongoing restructuring of GM operations.
HEMSON
36
• While Seaton will directly compete mainly with central and eastern GTA employment areas, there are a number of large new employment areas coming to market in the next few years in the western GTA as discussed above.
B. SEATON WILL GENERATE ABOUT 16,700 IN EMPLOYMENT ON EMPLOYMENT LANDS
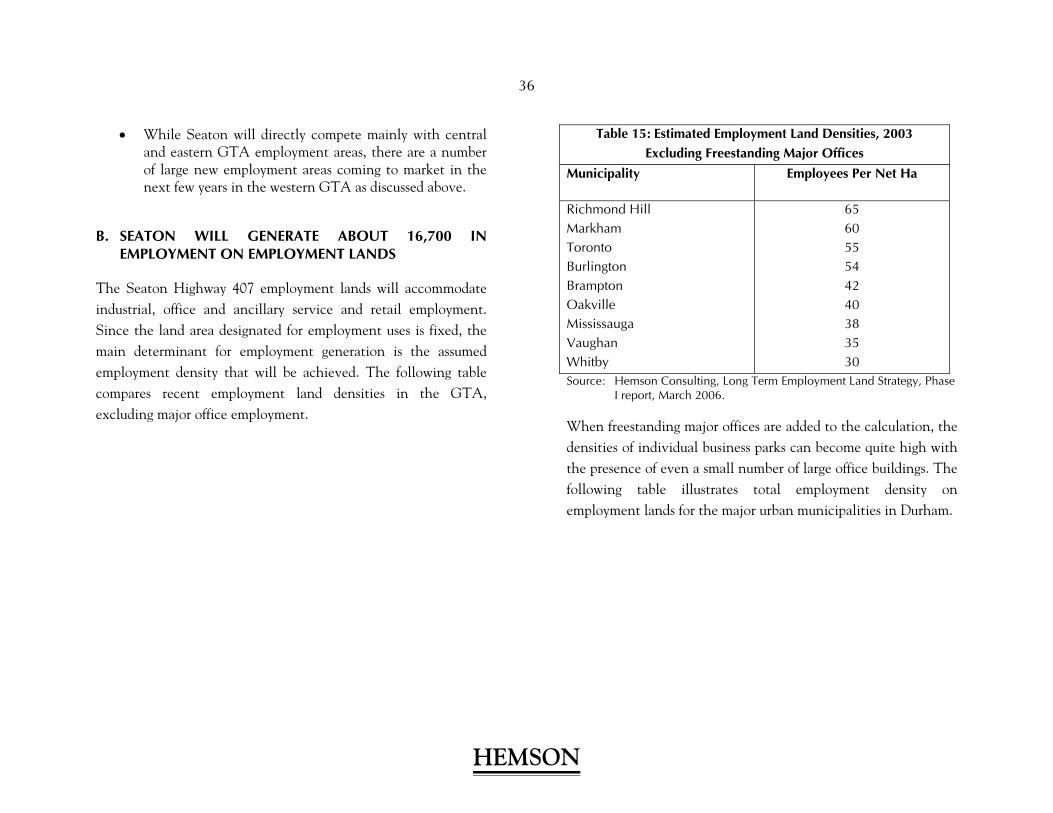
The Seaton Highway 407 employment lands will accommodate industrial, office and ancillary service and retail employment. Since the land area designated for employment uses is fixed, the main determinant for employment generation is the assumed employment density that will be achieved. The following table compares recent employment land densities in the GTA, excluding major office employment.
Table 15: Estimated Employment Land Densities, 2003 Excluding Freestanding Major Offices
Municipality Employees Per Net Ha
Richmond Hill Markham Toronto Burlington Brampton Oakville Mississauga Vaughan Whitby
65 60 55 54 42 40 38 35 30
Source: Hemson Consulting, Long Term Employment Land Strategy, Phase I report, March 2006.
When freestanding major offices are added to the calculation, the densities of individual business parks can become quite high with the presence of even a small number of large office buildings. The following table illustrates total employment density on employment lands for the major urban municipalities in Durham.
HEMSON
37
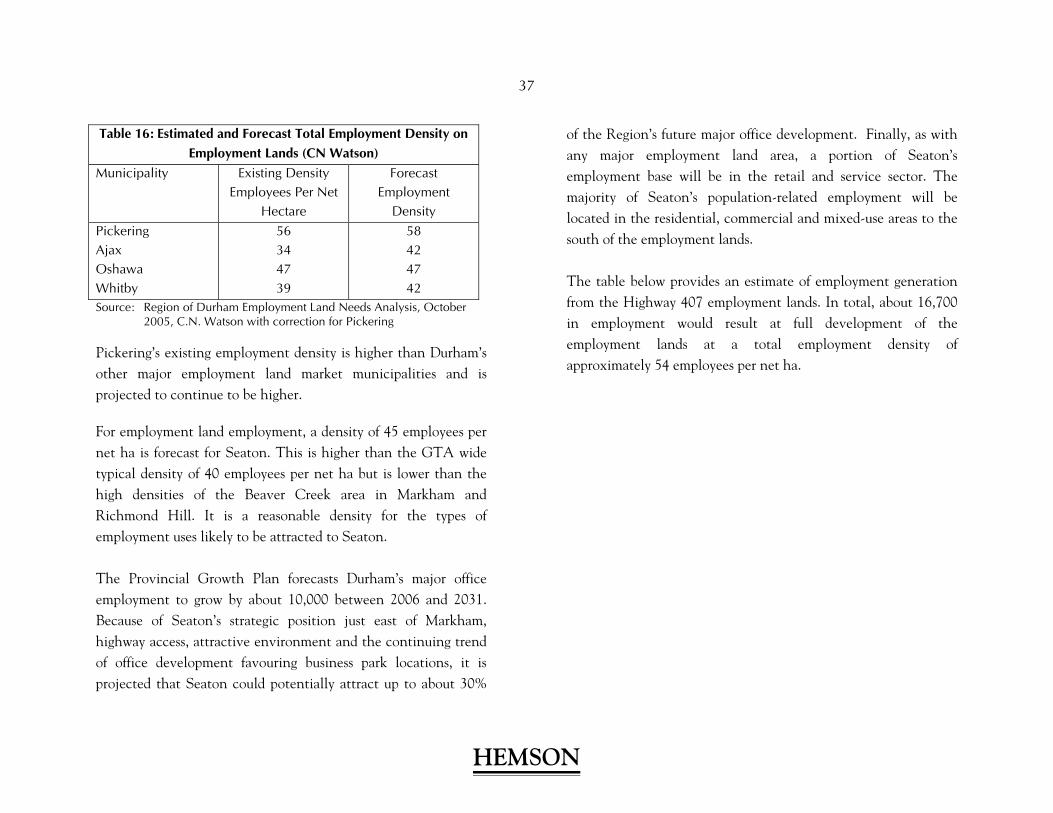
Table 16: Estimated and Forecast Total Employment Density on Employment Lands (CN Watson)
Municipality Existing Density Employees Per Net
Hectare
Forecast Employment
Density Pickering Ajax Oshawa Whitby
56 34 47 39
58 42 47 42
Source: Region of Durham Employment Land Needs Analysis, October 2005, C.N. Watson with correction for Pickering
Pickering’s existing employment density is higher than Durham’s other major employment land market municipalities and is projected to continue to be higher.
For employment land employment, a density of 45 employees per net ha is forecast for Seaton. This is higher than the GTA wide typical density of 40 employees per net ha but is lower than the high densities of the Beaver Creek area in Markham and Richmond Hill. It is a reasonable density for the types of employment uses likely to be attracted to Seaton. The Provincial Growth Plan forecasts Durham’s major office employment to grow by about 10,000 between 2006 and 2031. Because of Seaton’s strategic position just east of Markham, highway access, attractive environment and the continuing trend of office development favouring business park locations, it is projected that Seaton could potentially attract up to about 30%
of the Region’s future major office development. Finally, as with any major employment land area, a portion of Seaton’s employment base will be in the retail and service sector. The majority of Seaton’s population-related employment will be located in the residential, commercial and mixed-use areas to the south of the employment lands. The table below provides an estimate of employment generation from the Highway 407 employment lands. In total, about 16,700 in employment would result at full development of the employment lands at a total employment density of approximately 54 employees per net ha.
HEMSON
38
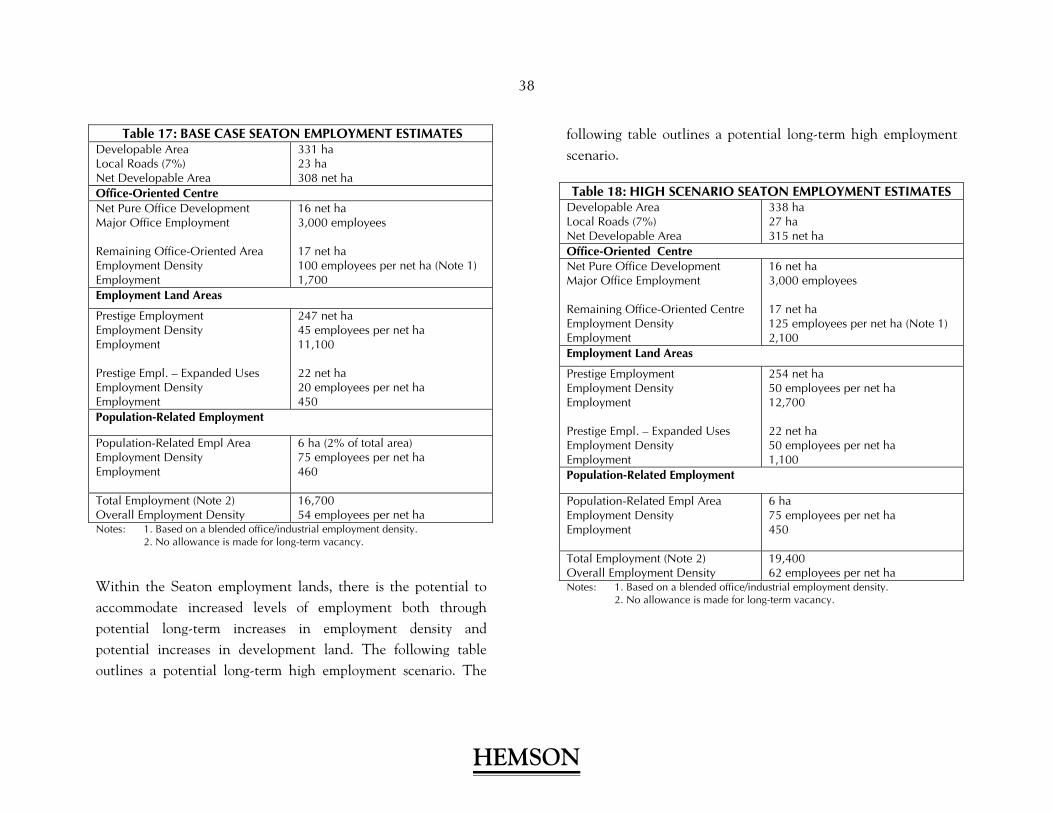
Table 17: BASE CASE SEATON EMPLOYMENT ESTIMATES Developable Area Local Roads (7%) Net Developable Area
331 ha 23 ha 308 net ha
Office-Oriented Centre Net Pure Office Development Major Office Employment Remaining Office-Oriented Area Employment Density Employment
16 net ha 3,000 employees 17 net ha 100 employees per net ha (Note 1) 1,700
Employment Land Areas
Prestige Employment Employment Density Employment Prestige Empl. – Expanded Uses Employment Density Employment
247 net ha 45 employees per net ha 11,100 22 net ha 20 employees per net ha 450
Population-Related Employment
Population-Related Empl Area Employment Density Employment
6 ha (2% of total area) 75 employees per net ha 460
Total Employment (Note 2) Overall Employment Density
16,700 54 employees per net ha
Notes: 1. Based on a blended office/industrial employment density. 2. No allowance is made for long-term vacancy.
Within the Seaton employment lands, there is the potential to accommodate increased levels of employment both through potential long-term increases in employment density and potential increases in development land. The following table outlines a potential long-term high employment scenario. The
following table outlines a potential long-term high employment scenario.
Table 18: HIGH SCENARIO SEATON EMPLOYMENT ESTIMATES Developable Area Local Roads (7%) Net Developable Area
338 ha 27 ha 315 net ha
Office-Oriented Centre Net Pure Office Development Major Office Employment Remaining Office-Oriented Centre Employment Density Employment
16 net ha 3,000 employees 17 net ha 125 employees per net ha (Note 1) 2,100
Employment Land Areas
Prestige Employment Employment Density Employment Prestige Empl. – Expanded Uses Employment Density Employment
254 net ha 50 employees per net ha 12,700 22 net ha 50 employees per net ha 1,100
Population-Related Employment
Population-Related Empl Area Employment Density Employment
6 ha 75 employees per net ha 450
Total Employment (Note 2) Overall Employment Density
19,400 62 employees per net ha
Notes: 1. Based on a blended office/industrial employment density. 2. No allowance is made for long-term vacancy.
HEMSON
39
The factors that would enable the high employment scenario to be achieved are as follows:
• A reduction in the Transitway ROW to 30 metres, providing an additional 7 ha of developable lands;
• An increase of office-type space in the Office-Oriented Centre resulting in an increased employment density and greater office employment;
• An increase in employment density in the Prestige Employment Areas from 45 to 50 employees per net ha;
• The Prestige Employment – Expanded Uses area develops at the same employment density as the Prestige Employment area.
In total, the High Scenario results in an employment estimate of approximately 19,400 for Seaton. Potential long-term intensification of the 407 Transitway stations for office and population-related uses could provide additional employment in Seaton resulting in total employment on employment lands of over 20,000. The overall employment target for Seaton is 35,000 in total employment as stated in the Central Pickering Development Plan. Of this total, levels of 20,000 to 22,000 would need to be achieved on employment lands. In the long term, the Seaton employment lands could potentially reach the required level of employment to allow Seaton to provide 35,000 jobs. In addition to the employment generation within the Seaton planning area, there is also scope for additional employment through the development of the nearby Pickering Airport and development on the surrounding Federal Lands.
C. RATE OF EMPLOYMENT LAND ABSORPTION FOR SEATON
The Seaton Highway 407 employment lands will be a new major greenfield employment area in Pickering and in Durham Region and the first employment area along Highway 407. Employment land absorption in Pickering and Durham has historically been relatively low compared to other GTA markets, especially in the GTA west. With the introduction of Seaton onto the market and the forecast level of employment land employment growth in Durham, employment land absorption is expected to increase significantly from past levels. The absorption rate for Seaton is projected to average about 40 acres per year. This rate is based on the following:
• Of the current total supply of employment lands in Durham, a large portion is in the Highway 407 corridor. Seaton represents about a 30% share of the supply of employment lands in Durham’s urban municipalities (Pickering, Ajax, Oshawa and Whitby) where the majority of the demand for future employment land development will occur.
• As outlined in Chapter 2, based on the Provincial Growth Plan, it is estimated that there will be about 1,741 net ha of employment land absorption in Durham from 2006 to 2031 which translates into an average annual absorption of about 70 ha (172 acres) per year. The urban municipalities in Durham are projected to accommodate about 75% of employment land demand in the Region. Using the 30% share applied against this
HEMSON
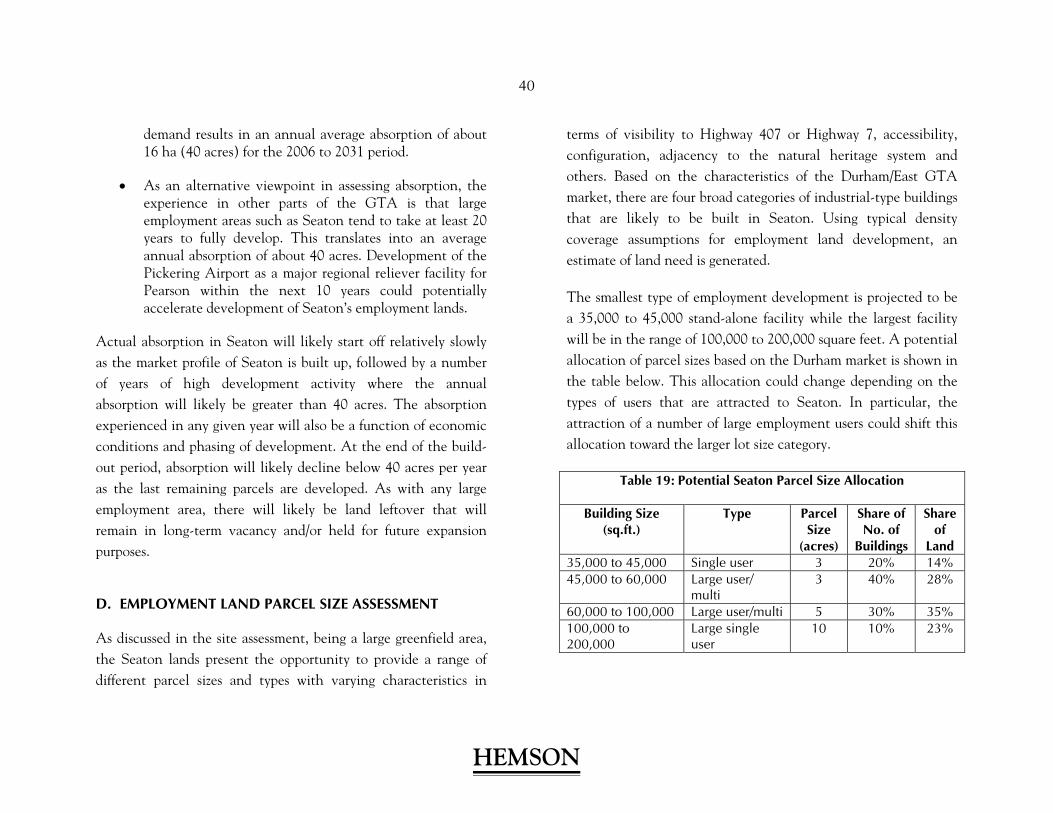
40
demand results in an annual average absorption of about 16 ha (40 acres) for the 2006 to 2031 period.
• As an alternative viewpoint in assessing absorption, the experience in other parts of the GTA is that large employment areas such as Seaton tend to take at least 20 years to fully develop. This translates into an average annual absorption of about 40 acres. Development of the Pickering Airport as a major regional reliever facility for Pearson within the next 10 years could potentially accelerate development of Seaton’s employment lands.
Actual absorption in Seaton will likely start off relatively slowly as the market profile of Seaton is built up, followed by a number of years of high development activity where the annual absorption will likely be greater than 40 acres. The absorption experienced in any given year will also be a function of economic conditions and phasing of development. At the end of the build-out period, absorption will likely decline below 40 acres per year as the last remaining parcels are developed. As with any large employment area, there will likely be land leftover that will remain in long-term vacancy and/or held for future expansion purposes.
D. EMPLOYMENT LAND PARCEL SIZE ASSESSMENT
As discussed in the site assessment, being a large greenfield area, the Seaton lands present the opportunity to provide a range of different parcel sizes and types with varying characteristics in
terms of visibility to Highway 407 or Highway 7, accessibility, configuration, adjacency to the natural heritage system and others. Based on the characteristics of the Durham/East GTA market, there are four broad categories of industrial-type buildings that are likely to be built in Seaton. Using typical density coverage assumptions for employment land development, an estimate of land need is generated.
The smallest type of employment development is projected to be a 35,000 to 45,000 stand-alone facility while the largest facility will be in the range of 100,000 to 200,000 square feet. A potential allocation of parcel sizes based on the Durham market is shown in the table below. This allocation could change depending on the types of users that are attracted to Seaton. In particular, the attraction of a number of large employment users could shift this allocation toward the larger lot size category.
Table 19: Potential Seaton Parcel Size Allocation
Building Size (sq.ft.)
Type Parcel Size
(acres)
Share of No. of
Buildings
Share of
Land 35,000 to 45,000 Single user 3 20% 14% 45,000 to 60,000 Large user/
multi 3 40% 28%
60,000 to 100,000 Large user/multi 5 30% 35% 100,000 to 200,000
Large single user
10 10% 23%
HEMSON
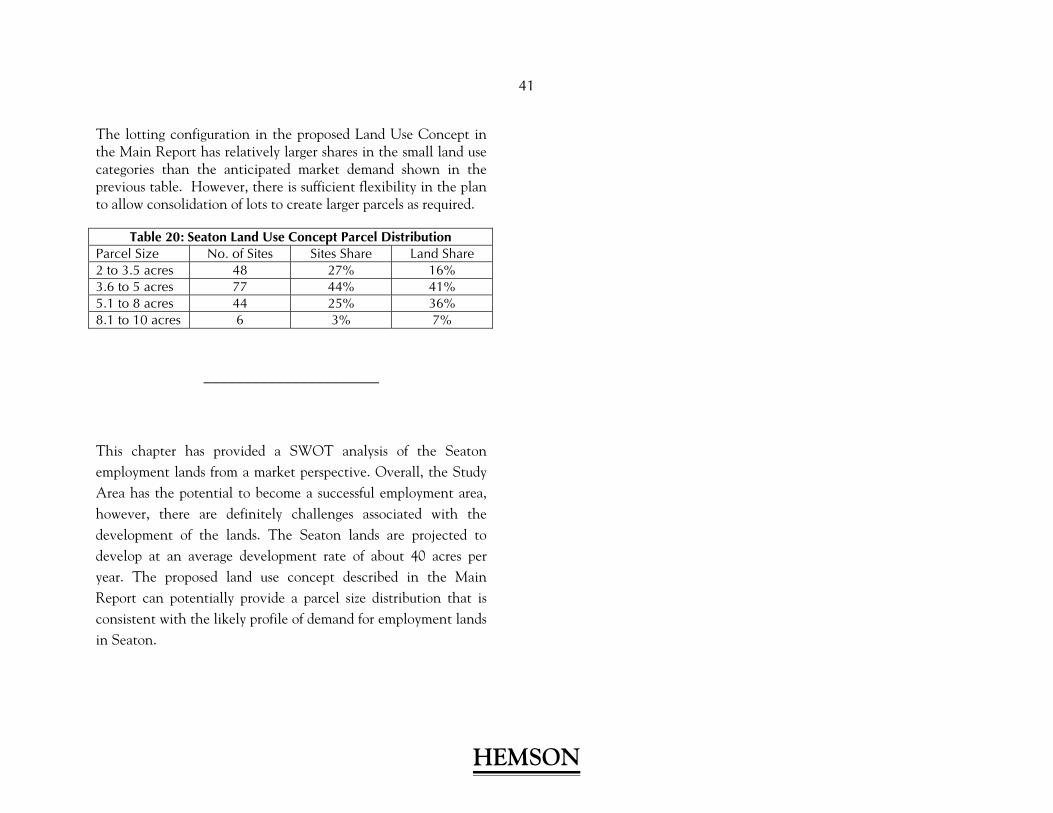
41
The lotting configuration in the proposed Land Use Concept in the Main Report has relatively larger shares in the small land use categories than the anticipated market demand shown in the previous table. However, there is sufficient flexibility in the plan to allow consolidation of lots to create larger parcels as required.
Table 20: Seaton Land Use Concept Parcel Distribution Parcel Size No. of Sites Sites Share Land Share 2 to 3.5 acres 48 27% 16% 3.6 to 5 acres 77 44% 41% 5.1 to 8 acres 44 25% 36% 8.1 to 10 acres 6 3% 7%
______________________
This chapter has provided a SWOT analysis of the Seaton employment lands from a market perspective. Overall, the Study Area has the potential to become a successful employment area, however, there are definitely challenges associated with the development of the lands. The Seaton lands are projected to develop at an average development rate of about 40 acres per year. The proposed land use concept described in the Main Report can potentially provide a parcel size distribution that is consistent with the likely profile of demand for employment lands in Seaton.
HEMSON

42
V MARKET PROSPECTS FOR SEATON
The Highway 407 corridor lands in Seaton possess the key attributes required for development of a prestige employment land area. The 407 lands provide a range of potential parcel sizes with excellent transportation access integrated with an attractive natural environment with potential opportunities arising from the Pickering Airport and links with UOIT. The timely provision of water and sewer servicing and the development of the two Highway 407 interchanges will be crucial factors in the development of Seaton. We would anticipate that the major types of activities on the Seaton employment lands will comprise high value manufacturing, assembly, major office uses and some warehousing with a relatively low level of goods movement. Because of Seaton’s location in the eastern GTA, it is unlikely that it will attract a large number of major warehouse-distribution uses. In particular, the areas adjacent to the natural heritage system have good potential for campus-style office development. The major industries that will be attracted to Seaton are anticipated to be in the Energy, auto, advanced manufacturing, information technology and other types of manufacturing, warehousing and assembly as well as smaller industrial-commercial users who are more likely to occupy units in industrial
multiples. The development of the Pickering Airport would potentially result in additional types of users for the Seaton employment lands in the air freight and logistics and other aviation-related uses. Because of its location relative to Markham and the City of Toronto, Seaton has the potential to attract financial service uses along with other types of major office uses. It is expected that development in the Highway 407 corridor will commence by approximately 2010 at the earliest, when the main water and wastewater trunk infrastructure will be extended to the employment lands. Land absorption is projected to average about 40 acres per year with higher absorption levels after the area gains market profile. It is anticipated that Seaton will be largely built out in about 20 years from the commencement of development. Serviced land in Seaton is expected to sell for between $350,000 and $400,000. Prices are expected to increase as the area gains market profile and as other competing employment areas are built out.
HEMSON

HIGHWAY 407 (SEATON LANDS)ECONOMIC DEVELOPMENT STUDY
APPENDIX B
Transportation Strategy
ENTRA Consultants

ENTRA Consultants 2007-05-09 Page i
ONTARIO REALTY CORPORATION HIGHWAY 407 (SEATON LANDS) ECONOMIC DEVELOPMENT STUDY
TRANSPORTATION STRATEGY
TABLE OF CONTENTS
INTRODUCTION 1
TRANSPORTATION BACKGROUND REVIEW 3
Existing Conditions 3 Roads 3 Transit 4 Travel Characteristics and Patterns 4
Planned and Proposed Improvements 5 Roads 5 Transit 7 Pedestrians and Cyclists 8
Timing and Commitments 8
Transportation Strengths, Weaknesses, Opportunities and Threats (SWOT) 9 Environment and Natural Heritage System 9 Highway 407 and 407 Transitway 9 Transportation Infrastructure Commitments 10 Highway 7 Role and Function 10 Road Rights-of-way 10 Transit-supportiveness 12 Goods Movement 12 Federal Airport Lands Ground Access Requirements 12
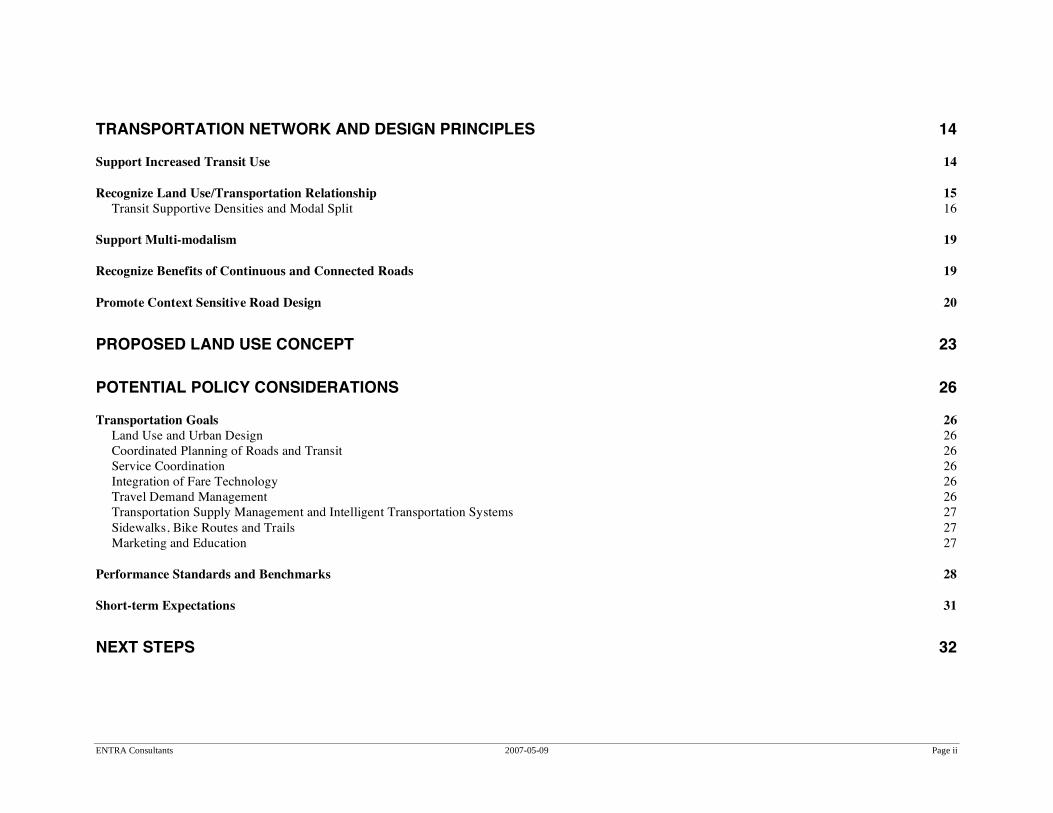
ENTRA Consultants 2007-05-09 Page ii
TRANSPORTATION NETWORK AND DESIGN PRINCIPLES 14
Support Increased Transit Use 14
Recognize Land Use/Transportation Relationship 15 Transit Supportive Densities and Modal Split 16
Support Multi-modalism 19
Recognize Benefits of Continuous and Connected Roads 19
Promote Context Sensitive Road Design 20
PROPOSED LAND USE CONCEPT 23
POTENTIAL POLICY CONSIDERATIONS 26
Transportation Goals 26 Land Use and Urban Design 26 Coordinated Planning of Roads and Transit 26 Service Coordination 26 Integration of Fare Technology 26 Travel Demand Management 26 Transportation Supply Management and Intelligent Transportation Systems 27 Sidewalks, Bike Routes and Trails 27 Marketing and Education 27
Performance Standards and Benchmarks 28
Short-term Expectations 31
NEXT STEPS 32
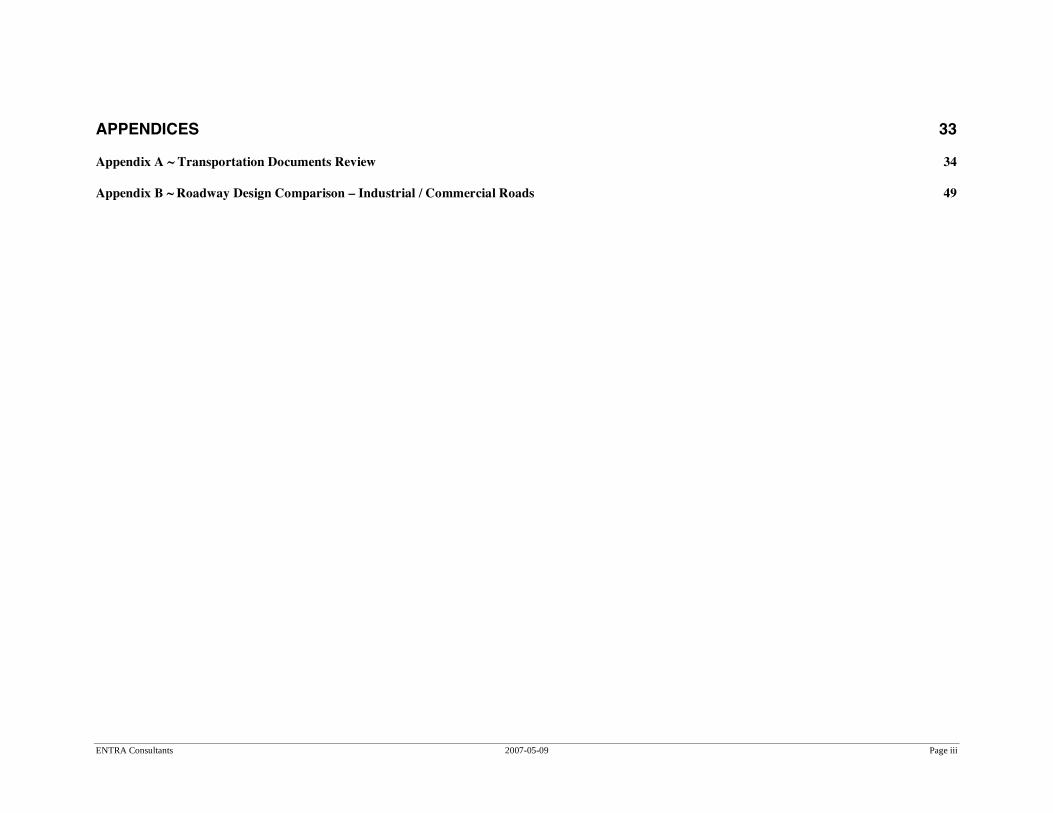
ENTRA Consultants 2007-05-09 Page iii
APPENDICES 33
Appendix A ~ Transportation Documents Review 34
Appendix B ~ Roadway Design Comparison – Industrial / Commercial Roads 49

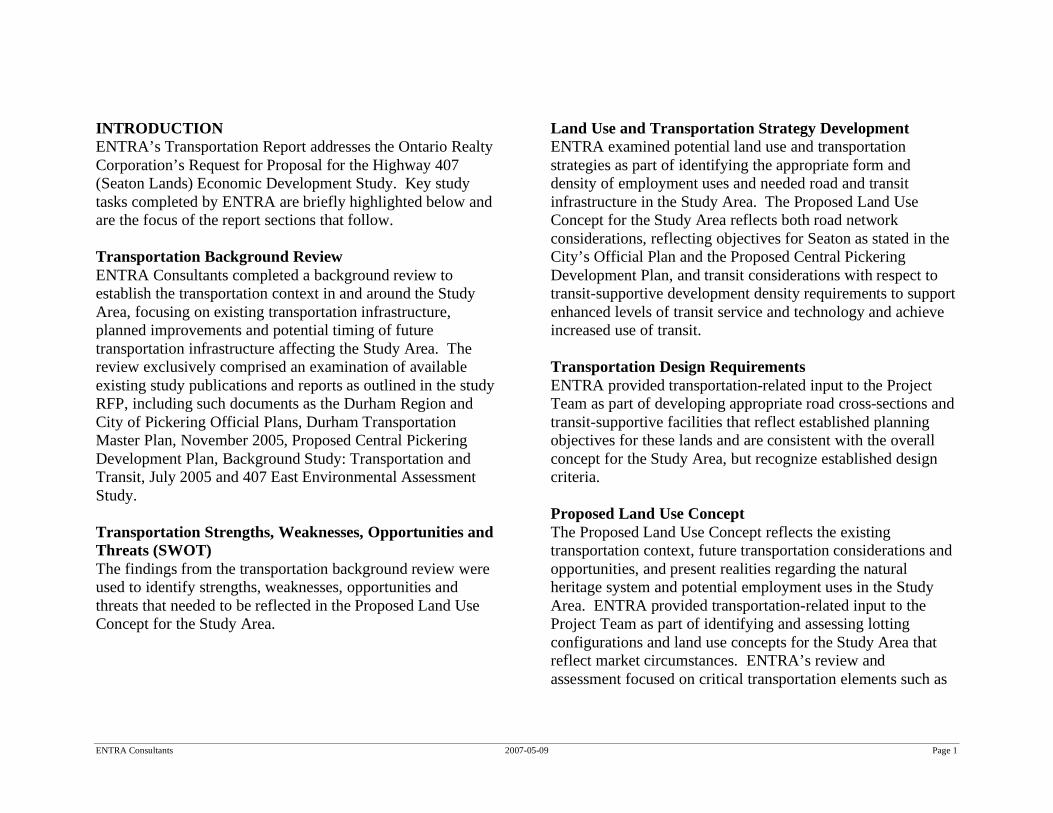
ENTRA Consultants 2007-05-09 Page 1
INTRODUCTION ENTRA’s Transportation Report addresses the Ontario Realty Corporation’s Request for Proposal for the Highway 407 (Seaton Lands) Economic Development Study. Key study tasks completed by ENTRA are briefly highlighted below and are the focus of the report sections that follow. Transportation Background Review ENTRA Consultants completed a background review to establish the transportation context in and around the Study Area, focusing on existing transportation infrastructure, planned improvements and potential timing of future transportation infrastructure affecting the Study Area. The review exclusively comprised an examination of available existing study publications and reports as outlined in the study RFP, including such documents as the Durham Region and City of Pickering Official Plans, Durham Transportation Master Plan, November 2005, Proposed Central Pickering Development Plan, Background Study: Transportation and Transit, July 2005 and 407 East Environmental Assessment Study. Transportation Strengths, Weaknesses, Opportunities and Threats (SWOT) The findings from the transportation background review were used to identify strengths, weaknesses, opportunities and threats that needed to be reflected in the Proposed Land Use Concept for the Study Area.
Land Use and Transportation Strategy Development ENTRA examined potential land use and transportation strategies as part of identifying the appropriate form and density of employment uses and needed road and transit infrastructure in the Study Area. The Proposed Land Use Concept for the Study Area reflects both road network considerations, reflecting objectives for Seaton as stated in the City’s Official Plan and the Proposed Central Pickering Development Plan, and transit considerations with respect to transit-supportive development density requirements to support enhanced levels of transit service and technology and achieve increased use of transit. Transportation Design Requirements ENTRA provided transportation-related input to the Project Team as part of developing appropriate road cross-sections and transit-supportive facilities that reflect established planning objectives for these lands and are consistent with the overall concept for the Study Area, but recognize established design criteria. Proposed Land Use Concept The Proposed Land Use Concept reflects the existing transportation context, future transportation considerations and opportunities, and present realities regarding the natural heritage system and potential employment uses in the Study Area. ENTRA provided transportation-related input to the Project Team as part of identifying and assessing lotting configurations and land use concepts for the Study Area that reflect market circumstances. ENTRA’s review and assessment focused on critical transportation elements such as
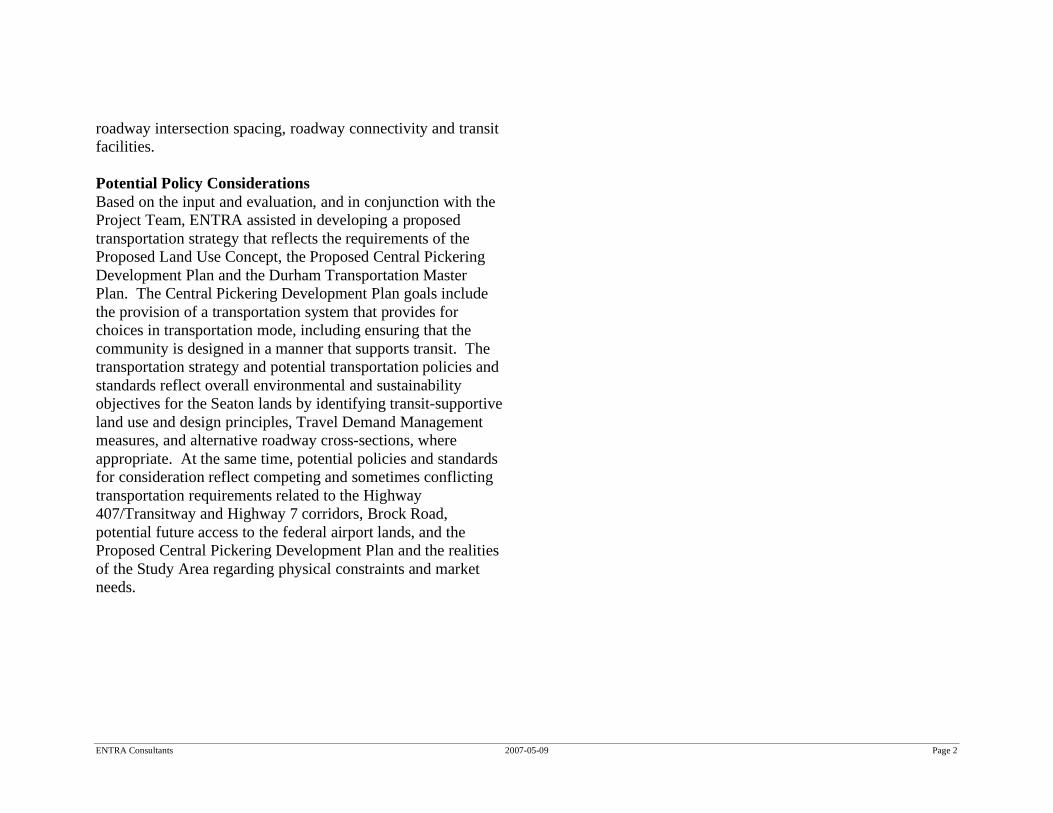
ENTRA Consultants 2007-05-09 Page 2
roadway intersection spacing, roadway connectivity and transit facilities. Potential Policy Considerations Based on the input and evaluation, and in conjunction with the Project Team, ENTRA assisted in developing a proposed transportation strategy that reflects the requirements of the Proposed Land Use Concept, the Proposed Central Pickering Development Plan and the Durham Transportation Master Plan. The Central Pickering Development Plan goals include the provision of a transportation system that provides for choices in transportation mode, including ensuring that the community is designed in a manner that supports transit. The transportation strategy and potential transportation policies and standards reflect overall environmental and sustainability objectives for the Seaton lands by identifying transit-supportive land use and design principles, Travel Demand Management measures, and alternative roadway cross-sections, where appropriate. At the same time, potential policies and standards for consideration reflect competing and sometimes conflicting transportation requirements related to the Highway 407/Transitway and Highway 7 corridors, Brock Road, potential future access to the federal airport lands, and the Proposed Central Pickering Development Plan and the realities of the Study Area regarding physical constraints and market needs.
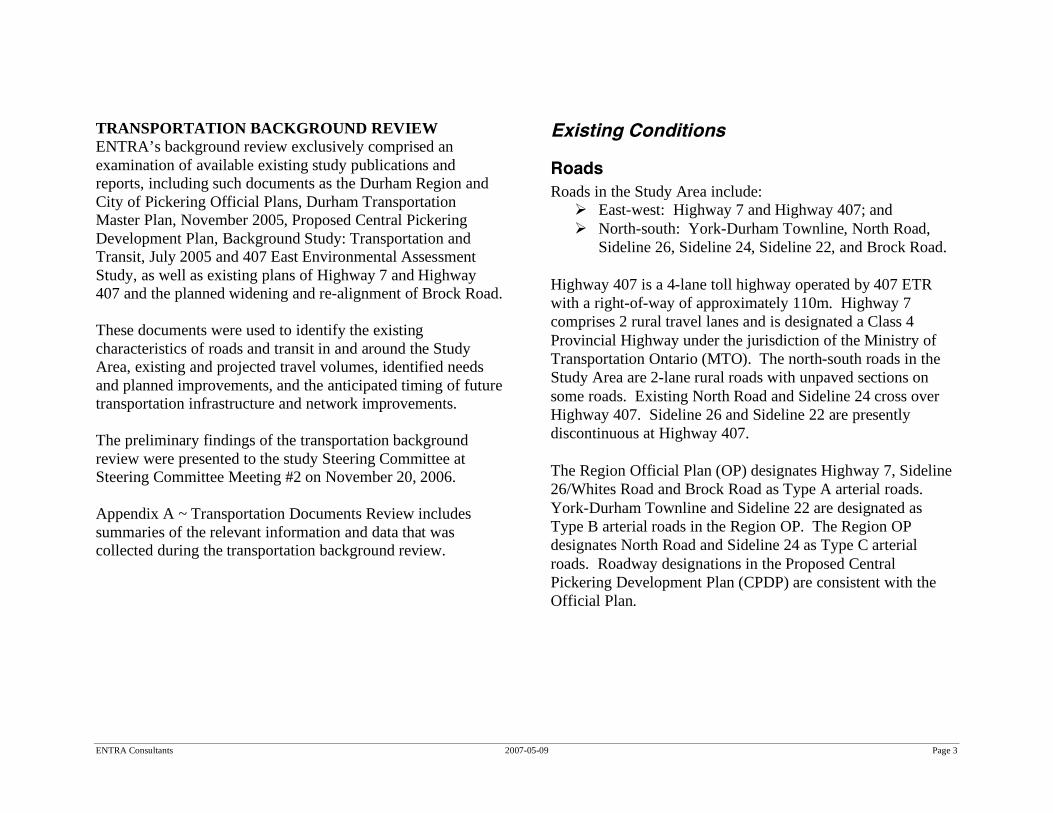
ENTRA Consultants 2007-05-09 Page 3
TRANSPORTATION BACKGROUND REVIEW ENTRA’s background review exclusively comprised an examination of available existing study publications and reports, including such documents as the Durham Region and City of Pickering Official Plans, Durham Transportation Master Plan, November 2005, Proposed Central Pickering Development Plan, Background Study: Transportation and Transit, July 2005 and 407 East Environmental Assessment Study, as well as existing plans of Highway 7 and Highway 407 and the planned widening and re-alignment of Brock Road. These documents were used to identify the existing characteristics of roads and transit in and around the Study Area, existing and projected travel volumes, identified needs and planned improvements, and the anticipated timing of future transportation infrastructure and network improvements. The preliminary findings of the transportation background review were presented to the study Steering Committee at Steering Committee Meeting #2 on November 20, 2006. Appendix A ~ Transportation Documents Review includes summaries of the relevant information and data that was collected during the transportation background review.
Existing Conditions
Roads Roads in the Study Area include:
East-west: Highway 7 and Highway 407; and North-south: York-Durham Townline, North Road,
Sideline 26, Sideline 24, Sideline 22, and Brock Road. Highway 407 is a 4-lane toll highway operated by 407 ETR with a right-of-way of approximately 110m. Highway 7 comprises 2 rural travel lanes and is designated a Class 4 Provincial Highway under the jurisdiction of the Ministry of Transportation Ontario (MTO). The north-south roads in the Study Area are 2-lane rural roads with unpaved sections on some roads. Existing North Road and Sideline 24 cross over Highway 407. Sideline 26 and Sideline 22 are presently discontinuous at Highway 407. The Region Official Plan (OP) designates Highway 7, Sideline 26/Whites Road and Brock Road as Type A arterial roads. York-Durham Townline and Sideline 22 are designated as Type B arterial roads in the Region OP. The Region OP designates North Road and Sideline 24 as Type C arterial roads. Roadway designations in the Proposed Central Pickering Development Plan (CPDP) are consistent with the Official Plan.
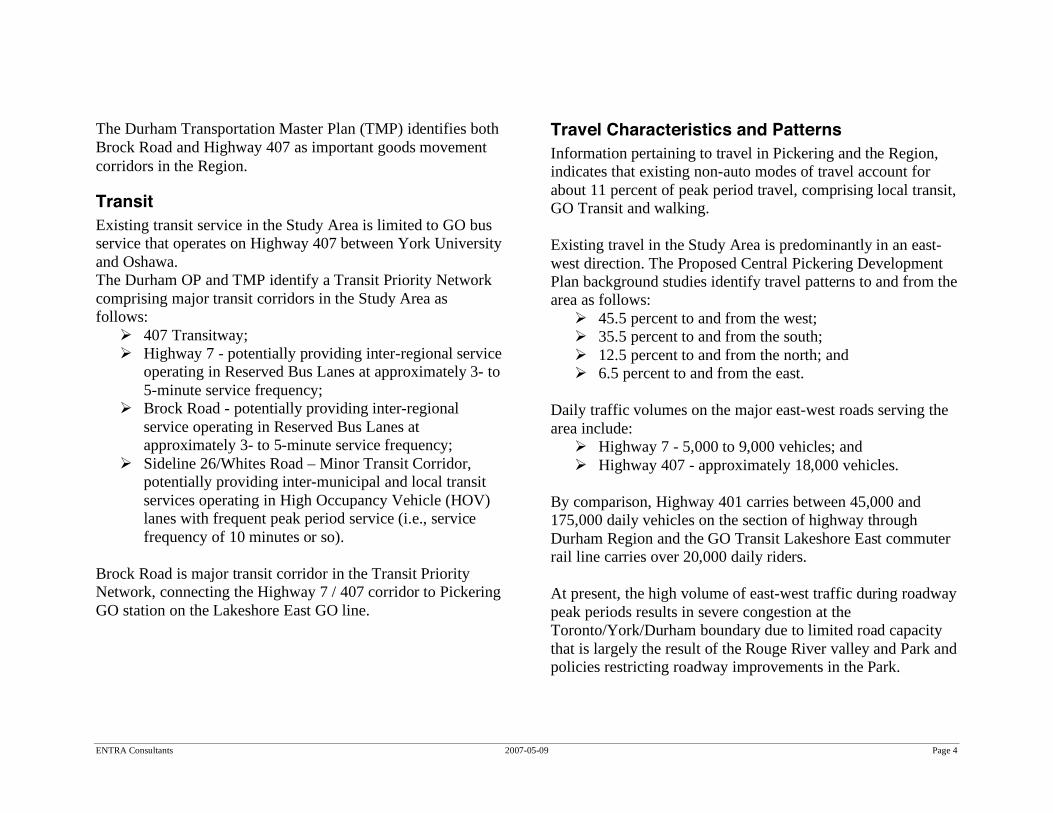
ENTRA Consultants 2007-05-09 Page 4
The Durham Transportation Master Plan (TMP) identifies both Brock Road and Highway 407 as important goods movement corridors in the Region.
Transit Existing transit service in the Study Area is limited to GO bus service that operates on Highway 407 between York University and Oshawa. The Durham OP and TMP identify a Transit Priority Network comprising major transit corridors in the Study Area as follows:
407 Transitway; Highway 7 - potentially providing inter-regional service
operating in Reserved Bus Lanes at approximately 3- to 5-minute service frequency;
Brock Road - potentially providing inter-regional service operating in Reserved Bus Lanes at approximately 3- to 5-minute service frequency;
Sideline 26/Whites Road – Minor Transit Corridor, potentially providing inter-municipal and local transit services operating in High Occupancy Vehicle (HOV) lanes with frequent peak period service (i.e., service frequency of 10 minutes or so).
Brock Road is major transit corridor in the Transit Priority Network, connecting the Highway 7 / 407 corridor to Pickering GO station on the Lakeshore East GO line.
Travel Characteristics and Patterns Information pertaining to travel in Pickering and the Region, indicates that existing non-auto modes of travel account for about 11 percent of peak period travel, comprising local transit, GO Transit and walking. Existing travel in the Study Area is predominantly in an east-west direction. The Proposed Central Pickering Development Plan background studies identify travel patterns to and from the area as follows:
45.5 percent to and from the west; 35.5 percent to and from the south; 12.5 percent to and from the north; and 6.5 percent to and from the east.
Daily traffic volumes on the major east-west roads serving the area include:
Highway 7 - 5,000 to 9,000 vehicles; and Highway 407 - approximately 18,000 vehicles.
By comparison, Highway 401 carries between 45,000 and 175,000 daily vehicles on the section of highway through Durham Region and the GO Transit Lakeshore East commuter rail line carries over 20,000 daily riders. At present, the high volume of east-west traffic during roadway peak periods results in severe congestion at the Toronto/York/Durham boundary due to limited road capacity that is largely the result of the Rouge River valley and Park and policies restricting roadway improvements in the Park.
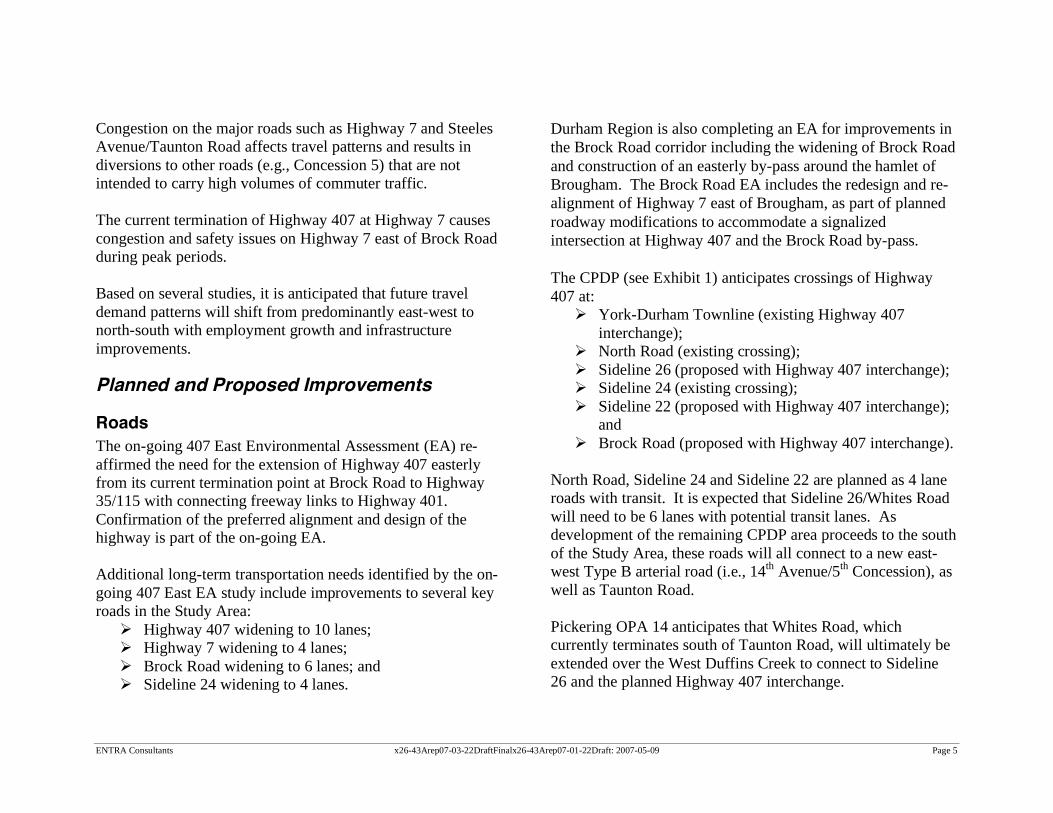
ENTRA Consultants x26-43Arep07-03-22DraftFinalx26-43Arep07-01-22Draft: 2007-05-09 Page 5
Congestion on the major roads such as Highway 7 and Steeles Avenue/Taunton Road affects travel patterns and results in diversions to other roads (e.g., Concession 5) that are not intended to carry high volumes of commuter traffic. The current termination of Highway 407 at Highway 7 causes congestion and safety issues on Highway 7 east of Brock Road during peak periods. Based on several studies, it is anticipated that future travel demand patterns will shift from predominantly east-west to north-south with employment growth and infrastructure improvements.
Planned and Proposed Improvements
Roads The on-going 407 East Environmental Assessment (EA) re-affirmed the need for the extension of Highway 407 easterly from its current termination point at Brock Road to Highway 35/115 with connecting freeway links to Highway 401. Confirmation of the preferred alignment and design of the highway is part of the on-going EA. Additional long-term transportation needs identified by the on-going 407 East EA study include improvements to several key roads in the Study Area:
Highway 407 widening to 10 lanes; Highway 7 widening to 4 lanes; Brock Road widening to 6 lanes; and Sideline 24 widening to 4 lanes.
Durham Region is also completing an EA for improvements in the Brock Road corridor including the widening of Brock Road and construction of an easterly by-pass around the hamlet of Brougham. The Brock Road EA includes the redesign and re-alignment of Highway 7 east of Brougham, as part of planned roadway modifications to accommodate a signalized intersection at Highway 407 and the Brock Road by-pass. The CPDP (see Exhibit 1) anticipates crossings of Highway 407 at:
York-Durham Townline (existing Highway 407 interchange);
North Road (existing crossing); Sideline 26 (proposed with Highway 407 interchange); Sideline 24 (existing crossing); Sideline 22 (proposed with Highway 407 interchange);
and Brock Road (proposed with Highway 407 interchange).
North Road, Sideline 24 and Sideline 22 are planned as 4 lane roads with transit. It is expected that Sideline 26/Whites Road will need to be 6 lanes with potential transit lanes. As development of the remaining CPDP area proceeds to the south of the Study Area, these roads will all connect to a new east-west Type B arterial road (i.e., 14th Avenue/5th Concession), as well as Taunton Road. Pickering OPA 14 anticipates that Whites Road, which currently terminates south of Taunton Road, will ultimately be extended over the West Duffins Creek to connect to Sideline 26 and the planned Highway 407 interchange.
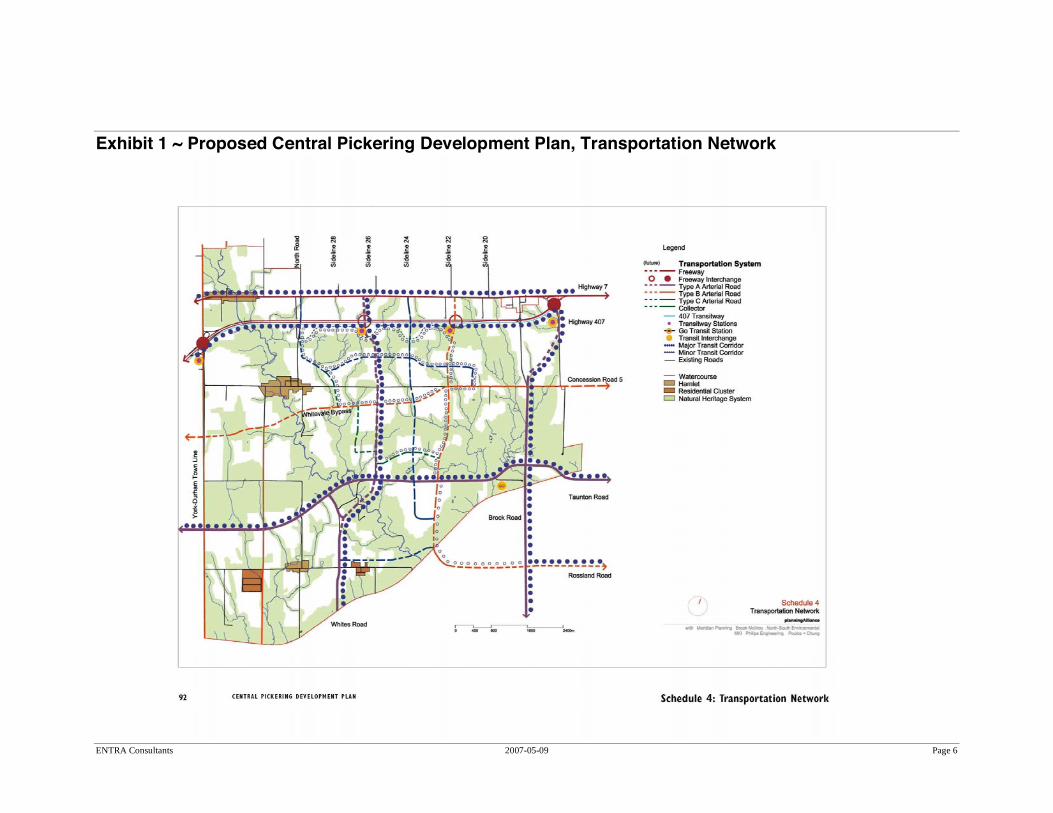
ENTRA Consultants 2007-05-09 Page 6
Exhibit 1 ~ Proposed Central Pickering Development Plan, Transportation Network
ENTRA Consultants 2007-05-09 Page 7
Transit As previously highlighted, the Durham OP (Regional Transit Spines) and (Transit Priority Network) identify major transit corridors in the Study Area as follows:
407 Transitway; Highway 7 - potentially providing inter-regional service
operating in Reserved Bus Lanes at approximately 3- to 5-minute service frequency;
Brock Road - potentially providing inter-regional service operating in Reserved Bus Lanes at approximately 3- to 5-minute service frequency;
Sideline 26/Whites Road –potentially providing inter-municipal and local transit services operating in High Occupancy Vehicle (HOV) lanes with frequent peak period service.
The CPDP re-affirms the anticipation of high-frequency transit services on Highway 407, Highway 7, Brock Road and Sideline 26/Whites Road. The Proposed Central Pickering Development Plan also anticipates frequent local transit service on internal roads in the Plan including Sideline 22 and North Road. It is estimated that these local transit services will operate on 15- to 20-minute service frequencies, with appropriate connections to inter-regional services. The Durham and Pickering Official Plans, the Durham TMP and the CPDP all identify additional opportunity for a future transportation corridor and associated transportation facilities on the Canadian Pacific Railway (CPR) Belleville and/or Havelock Subdivisions. These corridors are regarded to be
opportunities for future GO Rail services. The CPDP identifies a future GO station location on the west side of Brock Road, north of the CPR Belleville line. The plans for the 407 Transitway protect a 60m ROW along the south side of Highway 407. The Transitway is planned to be grade separated with north-south roads. Transitway stations are planned at York-Durham Townline, Sideline 26, Sideline 22 and re-aligned Brock Road. Station locations are planned in the southwest quadrant of the Highway 407 interchanges as follows:
York-Durham Townline - Major Station; Sideline 26 - Major Station; Sideline 22 - Minor Station; and re-aligned Brock Road - Major Station.
Major stations are envisioned as having higher volumes of passengers and are likely to have a higher proportion of passengers accessing the station by transit. Stations are anticipated to be in the order of 6 ha (15 acres) and comprise:
approximately 500 commuter parking spaces; bus terminal; taxi stand and passenger pick-up and drop-off facility;
and Transitway infrastructure and passenger platforms.
ENTRA Consultants 2007-05-09 Page 8
Pedestrians and Cyclists The CPDP recommends that sidewalks be provided on both sides of virtually all roads in the community and that, where possible, roads be designed with minimum pavement widths to calm and slow traffic, as well as minimize pedestrian crossing distances at intersections. The CPDP proposes a high level of connectivity within and between neighbourhoods to encourage walking and cycling. It is recommended that local streets be included within the community that have flexibility to accommodate bicycle lanes within the road pavement, and that north-south arterial road crossings of Highway 407 (including Sideline 26/Whites Road) contain additional pavement to accommodate bicycle lanes. The on-going Natural Heritage System (NHS) study also anticipates trails and trail head locations within the Study Area, appropriately located within the NHS and connected to the community network of pedestrian and cycling facilities.
Timing and Commitments The GTAA Toronto/York/Durham Transportation Base Case, FINAL Report, along with the Durham TMP, provide the most comprehensive documentation of the timing and status of road improvement projects affecting the Study Area. Anticipated timing of road improvements and the current status of projects in the Study Area follow:
Highway 407 Central (Markham Road to Brock Road) - widen from 4 to 6 lanes, and 2 new interchanges by 2012. The improvement is subject to 407
ETR/Provincial contract “triggers” and detailed design of the relocated interchanges;
Timing of interchanges at Sideline 26 and Sideline 22 are subject to a needs assessment conducted as part of Master Environmental Servicing Plan for the CPDP;
Highway 407 East extension (Brock Road to Highway 35/115). The EA regarding the preferred alignment and design of the 407 East extension is on-going. There is no current commitment for the timing of the planned extension;
Highway 407 (Markham Road to Brock Road) - widen from 6 to 8 lanes by 2032. The EA is complete, but requires an addendum. The improvement is subject to 407 ETR/Provincial contract “triggers”;
MTO has recently initiated an EA for the widening of Highway 7 from Brock Road to Baldwin Street in Whitby;
No significant roadway capacityimprovements are currently planned for Highway 7 between York-Durham Townline and Brock Road;
Brock Road (Taunton Road to 5th Concession) - widen from 2 to 4 lanes by 2012; and
Brock Road (5th Concession to north of Highway 7) - construct 4-lane Brougham by-pass by 2012.
Pertaining to planned and proposed transit improvements affecting the Study Area:
local transit in Pickering is to be extended to Taunton Road and Highway 7 in the long-term as development proceeds;
ENTRA Consultants 2007-05-09 Page 9
407 Transitway is a long-term Provincial inter-regional transit initiative. There are no current commitments for implementation of the 407 Transitway and related facilities;
Transitway stations subject to EA. It has been suggested by the MTO that the first stage of implementing the 407 Transitway (i.e., short-term) could involve using the station locations for commuter parking and Kiss and Ride facilities in association with GO Transit bus service on Highway 407;
GO Rail on the CPR Belleville line requires new track to implement. Given the insufficient extra capacity that is available for commuter rail service and projected freight traffic, there are no current plans for improvements; and
GO Rail on the CPR Havelock line does not have sufficient demand to warrant the introduction of service. There are some opportunities for such service in future, but the feasibility of service has not been studied. There are no commitments to this initiative.
Transportation Strengths, Weaknesses, Opportunities and Threats (SWOT) The findings from the transportation background review were used to identify strengths, weaknesses, opportunities and threats that needed to be reflected in the Proposed Land Use Concept and transportation strategy for the Study Area. The SWOT was presented to the study Steering Committee at Steering Committee Meeting #3 on December 18, 2006.
Environment and Natural Heritage System While the physical features and NHS potentially create some unique opportunities for the development and marketing of these employment lands, the extensive NHS does present some challenges with respect to:
achieving adequate and appropriate roadway connectivity within development blocks and between development parcels to accommodate potential traffic volumes, goods movement and transit circulation; and
achieving adequate and appropriate vehicle access to individual development parcels.
Highway 407 and 407 Transitway The existence of Highway 407 through the Study Area, along with the planned 407 East extension and connecting freeway links to Highway 401, provides excellent exposure to the Provincial 400-Series highway network. With the potential for four interchanges serving the Study Area at York-Durham Townline (existing), Sideline 26, Sideline 22 and Brock Road and the planned 407 Transitway and with stations planned at each interchange, the highway corridor provides excellent potential future opportunities for travel to and from the Study Area for goods movement, inter-regional transit and automobiles. The existing Highway 407 right-of-way of approximately 110m and the protected 407 Transitway right-of-way of an additional 60m along the south side of the highway, four planned Transitway stations totalling 6 ha (15 acres) each, and the identified NHS and the narrow depth of the Study Area
ENTRA Consultants 2007-05-09 Page 10
collectively contribute to possible limitations on roadway alignments and property access. Some potential opportunities for roadway connections and development access are precluded.
Transportation Infrastructure Commitments Exhibit 2 shows that current transportation infrastructure expectations in and around the Study Area are substantial, and that planned employment uses in the Study Area are likely well served in the long-term. However, the high level of uncertainty with respect to timing or long-term nature of many of the current transportation infrastructure expectations (e.g., Highway 407 improvements, Highway 7 widening, Steeles Avenue widening, 14th Avenue/5th Concession connection, Whites Road/Sideline 26 connection) creates some elevated sense of risk for planning, design and implementation of the Study Area. (It is noted that this may not be an issue if short-term development is not anticipated in the Study Area, based on market expectations and employment land needs.) This sense of risk is further heightened in light of identified limitations and the possible need for compromise to typically desirable engineering design guidelines and standards to achieve reasonable roadway capacity, development access and roadway connectivity for the Study Area.
Highway 7 Role and Function The existing role and function of Highway 7 as a commuter highway (i.e., Class 4 Provincial highway) is not entirely consistent with anticipated requirements for the Study Area. It is likely that successful implementation of the proposed land use concept for the Study Area will require changes in the existing role and function of Highway 7, so that it functions much more as a major arterial road. As already stated, it is also conceivable that successful planning and implementation will require considerable compromise to engineering design guidelines and standards that are applied to Highway 7 and the roads that intersect with Highway 7 (e.g., minimum desirable intersection spacing).
Road Rights-of-way Existing Region and City roadway design standards contemplate a range of right-of-way widths for most roadway classifications. Furthermore, the City’s policies for Seaton and the principles of the CPDP (Policy 9) encourage minimal road rights-of-way (where possible) to achieve community planning objectives. Opportunities for reduced rights-of-way in the Study Area need to be assessed relative to the needs of all road users, including trucks, transit vehicles, pedestrians and cyclists, as well as in light of economic, land use, urban design and natural heritage system objectives.
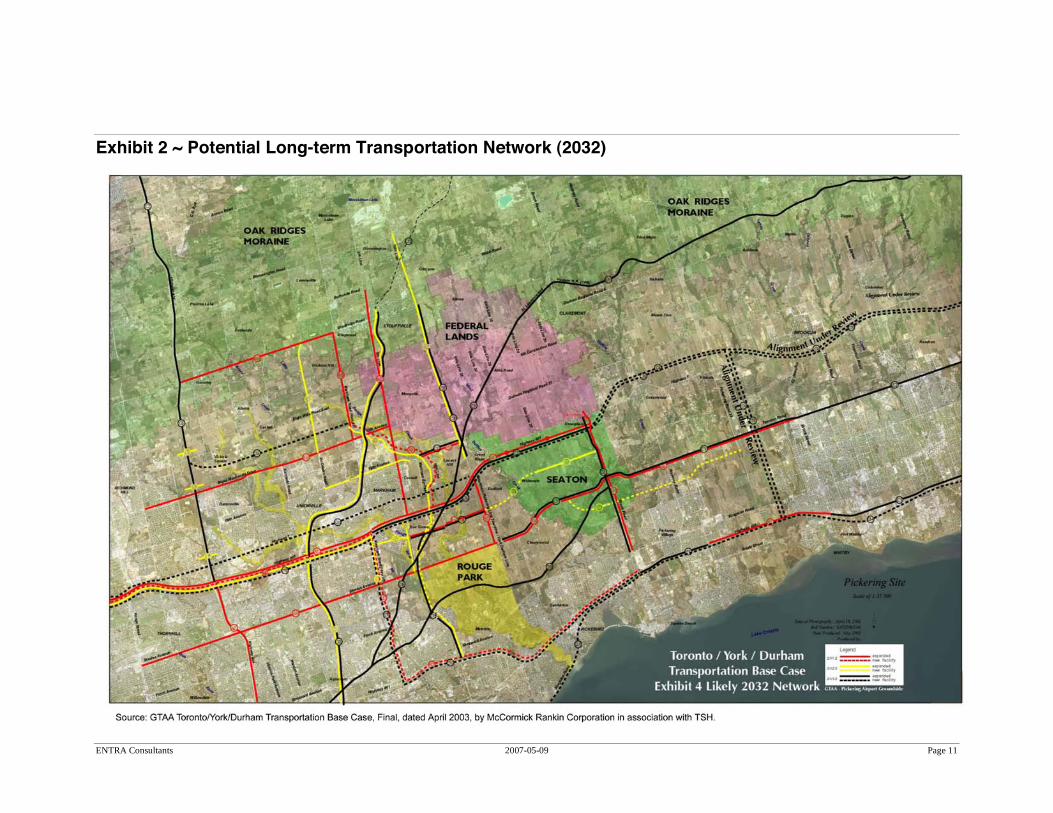
ENTRA Consultants 2007-05-09 Page 11
Exhibit 2 ~ Potential Long-term Transportation Network (2032)
ENTRA Consultants 2007-05-09 Page 12
Transit-supportiveness The Durham Transit Priority Network, as well as the 407 Transitway with stations planned at each of the highway interchange locations in the Study Area, are excellent opportunities that can help to achieve community planning objectives with respect to inter-regional travel by transit and enhanced use of transit in the long-term. Depending on how development proceeds in the short- to medium-term, local transit in the Study Area is likely to operate initially as low frequency bus service during peak periods only, and may require special financial consideration due to insufficient ridership potential, limited area roadway connectivity and other factors that can make it difficult to operate conventional transit in an effective, efficient and financially viable manner. The anticipated development of high-value manufacturing, office and warehousing, with potential for some campus-style office development, suggests that transit can play a substantial role in accommodating the future travel demands of the Study Area. However, the anticipated uses and the absence of a market for truly high-density nodal or corridor development means that planned transit infrastructure and service levels cannot be supported solely by the anticipated development in the Study Area. The planned transit infrastructure and service levels will require considerable other area development, such as the residential component of the CPDP, in order to be attainable and supportable.
Goods Movement The reality of Highway 407 being a toll highway weakens the relative attraction to the 400-series highway somewhat, particularly for goods movement. Trucks have historically used the 407 ETR in relatively low numbers. Committed roadway improvements to Brock Road (by 2012) will strengthen its role as a major corridor for goods movement in the Region and will provide a direct north-south connection from the Study Area to Highway 401.
Federal Airport Lands Ground Access Requirements Identified ground access requirements in the GTAA Pickering Project: Pickering Airport Draft Plan Report, November 2004, include:
a dedicated Highway 407 interchange to an Airport Access Road, located in the vicinity of North Road;
a additional connection to the Airport Access Road from Highway 407 via the planned Sideline 26 interchange and an extension of Sideline 26, north of Highway 7; and
connections from Brock Road, north of Brougham. It is evident that the proposed Airport Access Road ramps connecting to Highway 407 (as currently conceived) will have a physical impact on the Study Area, including potential lotting, placement of buildings, configuration of roads and location of intersections.
ENTRA Consultants 2007-05-09 Page 13
Additional road requirements that may be required to serve future development on surplus lands around a future potential airport are not known.
ENTRA Consultants 2007-05-09 Page 14
TRANSPORTATION NETWORK AND DESIGN PRINCIPLES ENTRA examined potential land use and transportation strategies as part of identifying the appropriate form and density of employment uses and needed road and transit infrastructure in the Study Area. The Proposed Land Use Concept for the Study Area reflects both road network considerations, reflecting objectives for Seaton as stated in the City’s Official Plan and the Proposed Central Pickering Development Plan, and transit considerations with respect to transit-supportive development density requirements to support enhanced levels of transit service and technology and achieve increased use of transit and incorporates appropriate road rights-of-way and transit-supportive facilities that reflect established planning objectives for these lands, but recognize established design criteria.
Support Increased Transit Use To effectively solve congestion in the long-term, promotion of a balanced transportation network is required that can work effectively for goods movement and for personal and business travel. To maximize this effectiveness, the transportation network must offer choice: a choice of routes for short and long trips, or for truck and area traffic; and a choice of modes for all trips as an alternative for those who cannot or choose not to drive a car. Transit is a valuable complement to other travel options: pedestrians can hop on transit to save time and effort, cyclists can park their bikes at the stop or the GO station or even bring
them on board, and long-distance commuters can park and ride to work. The Proposed Central Pickering Development Plan which this Study Area is part of has taken a balanced approach to the development of the transportation network and the availability of alternative choices for commuters. When looking for alternatives to the personal automobile it is important to present a range of options for personal choice, including pedestrian and cycling facilities, non-travel options and the range of transportation demand measures. However, it is likely, that in terms of the overall impact on the network, transit will be the most important alternative for the broadest range of trips to and from the Study Area. With enhanced use of transit, it can be expected that significant progress can be made towards:
improving traveller choice; keeping urban areas healthy; improving air quality and health; reducing greenhouse gas emissions; improving business access to the labour force; and improving municipal capability.
Effective transit is an important element in the success of local business - retail, commercial and industrial. In the GTA and other large urban areas in Canada, more than 20 percent of employees get to work by transit.1 1 Statistics Canada, “Where Canadians Work and How They Get There”, 2003
ENTRA Consultants 2007-05-09 Page 15
In Pickering, about 11 percent of peak hour travel - most of which is work trips - use transit. Most of these, however, are travelling to jobs in other communities - especially Toronto. The transit framework that has been established by previous studies and plans, including the CPDP, seeks to establish a greater balance for transit in the transportation network, serving local and inter-regional needs.
With the recent renewed interest in transit in the GTA, there is a lot of discussion about technological options - LRT, BRT, Subway and rail - and which is the best to adopt for the future. Technology is an important consideration in transit services - different technologies offer different advantages, disadvantages and carrying capacities. However, transit is about more than just technology and shaping plans around it. Transit is about creating an attractive, competitive travel alternative to automobile travel. Potentially, that means small buses in localized areas, for connecting or shuttle services between employment uses and the 407 Transitway stations, and for specialty accessibility needs. It means larger buses in corridors where routes combine to provide high frequency service such as Brock Road. It means potential signal priority and transit priority features to get transit vehicles around significant traffic bottlenecks to minimize delays in those same corridors. It means potential HOV lanes on Brock Road and Sideline 26/Whites Road in future to benefit transit travel times and auto drivers who share their ride. It means Bus Rapid Transit (high-order, inter-regional transit service) with dedicated transit facilities in key corridors like the 407 Transitway with priority access to the local road network.
For transit to be a practical choice for future employees in the Study Area it has to be attractive. Consistently, one factor overwhelmingly defines attractiveness - convenience. Convenience means frequent service, and fast travel times. In recent survey work in the GTA, the top attribute that determines mode choice - either auto or transit - is total travel time.
Recognize Land Use/Transportation Relationship The relationship between land use and transportation is reflected in the proposed placement of uses, road pattern and design of roads in the Study Area. In general, the more compact the urban form, the greater the support for walking, cycling and use of transit. In the Study Area it is vital that uses are planned with built form and streetscape that support the use of alternative travel modes to the greatest extent possible, particularly transit. Where there is a market for them, higher development densities are important to the efficient and cost-effective delivery of transit services. Generally, the denser the development and more transit-supportive the uses within walking distance of transit, the higher the level of transit service that can be supported. With a higher level of transit service, the attraction to transit is greater since the total travel time by transit and reliability of transit are improved. This can lead to less reliance on the automobile, a reduction in auto trips and reduced infrastructure requirements for automobiles.
ENTRA Consultants 2007-05-09 Page 16
For these reasons, it is proposed that the highest density office uses in the Study Area be located in pockets or nodes around or close to the planned future 407 Transitway stations and along the Highway 7 corridor at densities and in a form that supports and can be supported by frequent transit. With the complementary residential development planned in the CPDP to the south, it is expected that planned employment uses in the Study Area will help create an overall mix of uses in the area that will lead to potential utilization of the transit network (and roads) in both peak and off-peak travel directions. This is possible because the peak direction of travel for residential uses is most often in the reverse direction to the peak direction of travel for many employment uses. For example, residential uses generate trips primarily in the outbound direction in the morning, while employment uses most often generate trips in the inbound direction in the morning. An overall mix of residential and employment uses creates the opportunity to more effectively utilize roadway infrastructure and transit services in both inbound and outbound directions. With higher transit service levels, other areas beyond the office nodes also can realize some of the benefits. The higher level of transit service that is supported by higher density office uses in turn creates opportunities to increase transit ridership throughout the Study Area.
Transit Supportive Densities and Modal Split As already stated, the anticipated development of high-value manufacturing, office and warehousing, with potential for some office development, suggests that transit can play a substantial role in accommodating the future travel demands of the Study Area. The Proposed Land Use Concept recommends that the highest density office uses in the Study Area be located in pockets or nodes around or close to the planned future 407 Transitway stations and along the Highway 7 corridor so that it supports and can be supported by frequent transit. Exhibits 3 and 4 provide an indication of typical density thresholds for transit and generally accepted guidelines for densities in support of typical transit types and service levels. Form these general thresholds and guidelines it is evident that transit modal splits in excess of 30 per cent are only possible if the density in the vicinity of stations exceeds 100 jobs and/or residents per hectare, and that at densities below 100, the required ridership cannot be assured and operational performance may not be financially affordable.2 Based on a preliminary review, the proposed overall density of development in the Study Area is approximately 40 workers per net hectare. For locations adjacent the interchanges that have been identified as prestige locations for highly visible more intense office development, anticipated net densities may reach 200 workers per net hectare.
2 TTC Rapid Transit Extension Study, August 2001
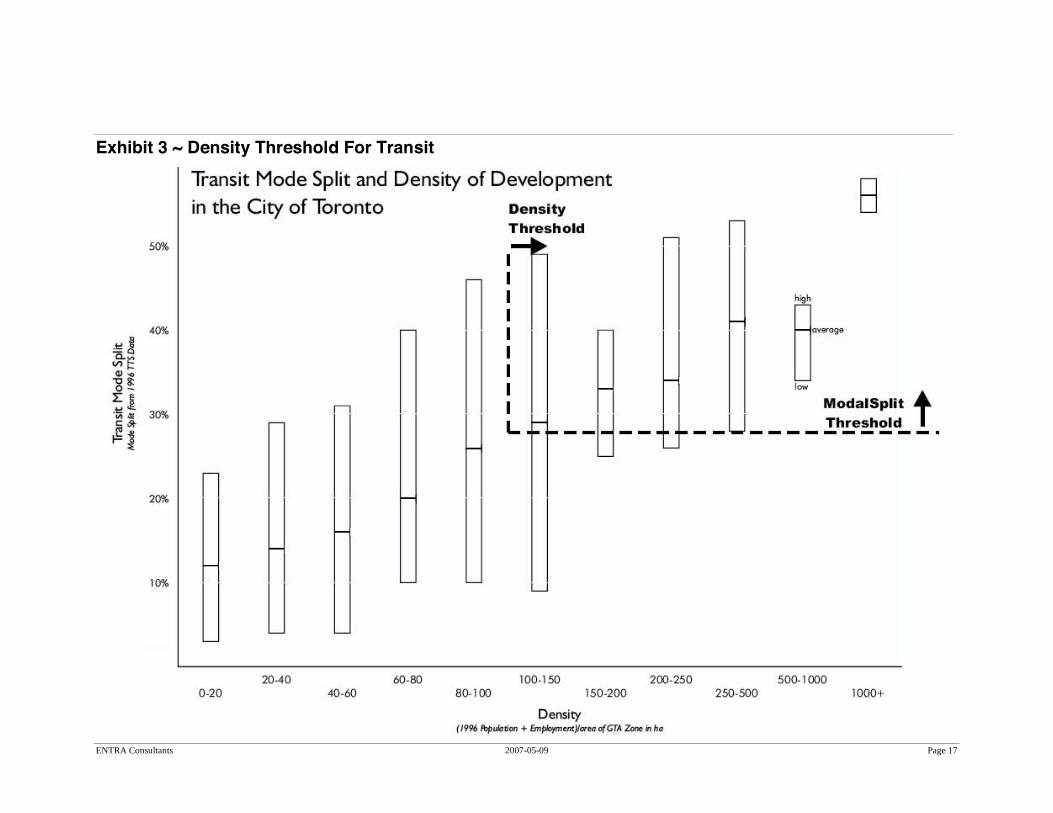
ENTRA Consultants 2007-05-09 Page 17
Exhibit 3 ~ Density Threshold For Transit
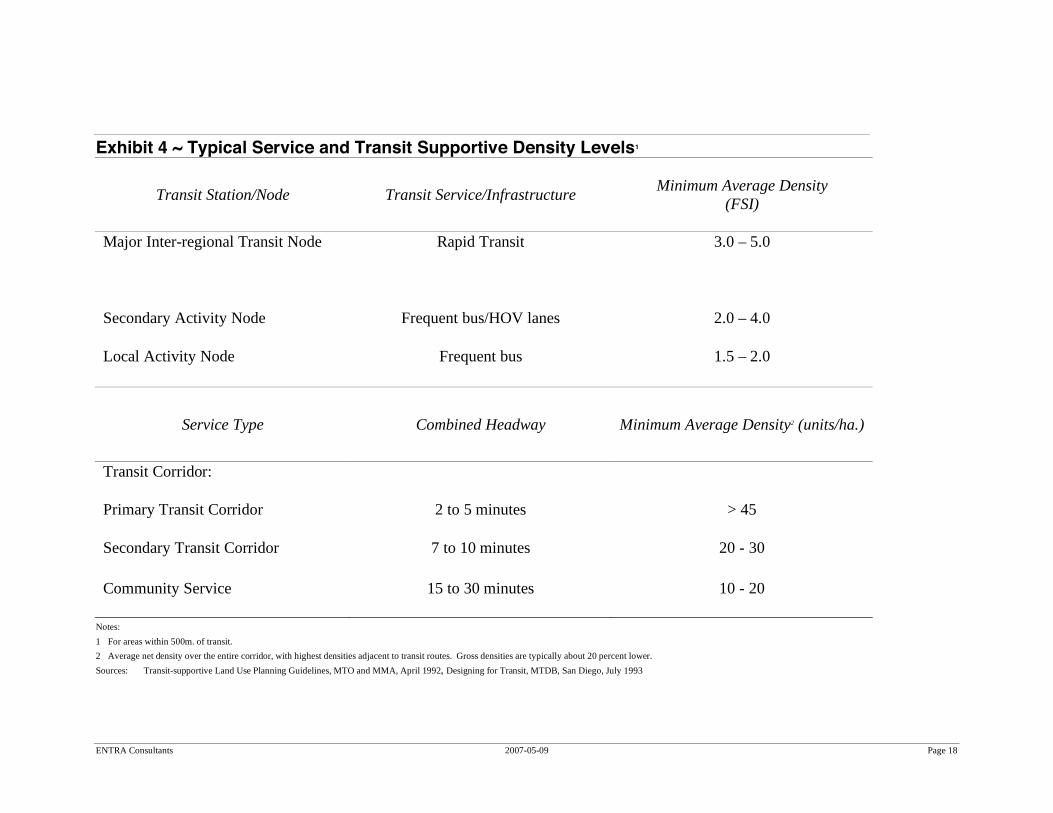
ENTRA Consultants 2007-05-09 Page 18
Exhibit 4 ~ Typical Service and Transit Supportive Density Levels1
Transit Station/Node Transit Service/Infrastructure Minimum Average Density
(FSI)
Major Inter-regional Transit Node Rapid Transit 3.0 – 5.0
Secondary Activity Node Frequent bus/HOV lanes 2.0 – 4.0
Local Activity Node Frequent bus 1.5 – 2.0
Service Type Combined Headway Minimum Average Density2 (units/ha.)
Transit Corridor:
Primary Transit Corridor 2 to 5 minutes > 45
Secondary Transit Corridor 7 to 10 minutes 20 - 30
Community Service 15 to 30 minutes 10 - 20
Notes: 1 For areas within 500m. of transit. 2 Average net density over the entire corridor, with highest densities adjacent to transit routes. Gross densities are typically about 20 percent lower. Sources: Transit-supportive Land Use Planning Guidelines, MTO and MMA, April 1992, Designing for Transit, MTDB, San Diego, July 1993
ENTRA Consultants 2007-05-09 Page 19
At these anticipated levels of development in the Study Area, supportable transit service likely comprises buses operating in mixed traffic at approximately 10- to 15-minute service frequency during peak periods. At these levels of development and transit service, supportable and achievable transit use in the Study Area may average around 10 to 20 percent. As previously highlighted, the anticipated uses and density of development suggest that employment in the Study Area cannot (alone) support planned transit infrastructure and service levels. The planned transit infrastructure and service levels will require considerable other area development, such as the residential component of the CPDP, in order to be attainable and supportable. With this additional development in the long-term, the 407 Transitway and planned 407 Transitway stations at Sideline 26 and 22 and the implementation of the Region’s Transit Priority Network may be supportable and achievable. This will result in substantially higher transit service levels to the area that may have the effect of attracting increasingly higher numbers of people to transit for travel to and from the Study Area.
Support Multi-modalism The Proposed Land Use Concept for the Study Area attempts to address the inter-relationship between transit, walking, cycling and roadway components of the transportation network in a comprehensive manner to accommodate total travel requirements. The approach to the planning and design of roads and transit recognizes that roadway infrastructure is being planned to accommodate transit, pedestrians and cyclists, as well as automobiles.
The connectivity of roads helps to encourage walking and cycling, as well as transit, by providing directing routing and reducing travel distances and times, wherever practical. Road rights-of-way reflect the desire to minimize road widths as part of encouraging pedestrian-friendly and transit-supportive streetscapes, while balancing this objective against the geometric requirements of trucks and transit vehicles and the potential needs of pedestrians and cyclists.
Recognize Benefits of Continuous and Connected Roads The proposed road network in the Proposed Land Use Concept reflects the principles of continuity and connectivity of roads to the extent it is practical. The network of internal roads, with direct connections to existing roads, provides an efficient way for future workers in the Study Area to travel between blocks, whether by automobile, transit, walking or cycling. The road connections in the Proposed Land Use Concept encourage direct travel and reduce the reliance and pressure placed on individual road intersections. This achieves the benefit of reducing potential vehicle queues and delays to motorists at intersections and contributes to potential reductions in overall travel distances and times for motorists. The continuous and connected road network in the Proposed Land Use Concept also supports an effective and efficient transit system in the Study Area.
ENTRA Consultants 2007-05-09 Page 20
Promote Context Sensitive Road Design The road network is one of the basic building blocks of the Proposed Land Use Concept, along with the Natural Heritage System, providing connections between different uses and to the future planned area-wide transportation system. Given the nature and extent of the NHS and the extent of the Highway 407/407 Transitway rights-of-way and related facilities in the Study Area, special consideration is required in the design of area roads to maximize development potential, support transit and the use of other alternative modes of travel, and provide access to all development parcels in the Study Area. The road network recognizes the prominent physical features of these lands and the goal of protecting the proposed NHS by minimizing intrusion into these sensitive areas, where possible. Roads are located in the NHS where reasonable alternatives to achieve development access are not considered practical. In these locations, where roads traverse the NHS, it may be possible to consider alternative roadway cross-sections that feature reduced pavement widths and thus minimize the impacts on the NHS. In some instances where the NHS is prominent and development parcels are isolated, cul-de-sac roads are proposed as a compromise to connected road networks that would likely be too costly from both a financial and environmental impact perspective.
At the boundary arterial roads, internal road connections are needed at spacings lower than typically desirable intersection spacings to achieve adequate connectivity, access and capacity. Typical engineering design guidelines establish 400m as a desirable or optimal signalized intersection spacing requirement. To maintain the operational integrity of Highway 7, the MTO controls the number of entrances onto the highway. On Class 4 highways like Highway 7, the MTO historically allowed up to six entrances per kilometre, an average of one entrance every 150m, provided that all Ministry concerns are addressed regarding, but not limited to:
safe operation of the entrance; no adverse affects to the highway; meet Ministry geometric design standards; and meet Ministry site access policy.
In addition, MTO required that all entrances be designed and constructed to MTO standards. Prior to the approval of any entrances onto the highway the MTO must be confident that a full review of any impacts to the highway have been assessed and any and all issues have been mitigated or resolved. The MTO’s on-going Highway Access Management (AM) Initiative identifies much more stringent intersection spacing along Provincial Highways (e.g., Highway 7) and for offsets from Provincial Highways on perpendicular roads (e.g., Sidelines 22, 24 and 26, North Road). Under the proposed AM standards, public road spacing along a Provincial Highway is limited to a minimum of 400m for local roads and 800m for
ENTRA Consultants 2007-05-09 Page 21
collector roads. Desirable offsets are 800m from an interchange ramp terminal and 400m from an at-grade highway intersection. Durham Region has recently produced its Arterial Corridor Guidelines (ACG), February 2007. The Region’s guidelines suggest that minimum signalized intersection spacing along east-west arterial road corridors is 300m to 500m, and under no circumstances should back-to-back 300m spaced signalized intersections be considered. The ACG recommend 700m signalized spacing on north-south Type A arterial roads and signalized intersections along north-south Type B arterial roads at approximately 525m spacing. Application of these standards would preclude signalized intersections on the north-south arterial roads in the Study Area and significantly limit opportunities for signalized intersections along Highway 7, eliminate local road continuity and connectivity in the Study Area and minimize development access. In light of this Study’s transportation objectives of increased transit use, transit-supportive land use, mulit-modalism, and continuous and connected streets, the Proposed Land Use Concept is based generally on achieving 400m signal spacing with 150m to 200m overall intersection spacing along the Highway 7 and north-south arterial road corridors. Given the NHS and Highway 407 and 407 Transitway requirements, the design of the road network in the Study Area will need to adopt minimal intersection spacings in several
instances in order to achieve reasonable access for automobiles and transit. The signal spacing of approximately 200m is a necessity in some areas of the Proposed Land Use Plan to achieve development of these lands to the extent that is proposed and desired, and to create opportunities for alternative modes of travel to play an effective role in serving future travel demands. This level of connectivity is achievable and is being planned and implemented in other locations throughout the GTA, but requires compromise and cooperation, as well as potential technology solutions for synchronization of traffic signals. The need to consider minimal intersection spacings is perhaps most critical on Sidelines 26 and 22 where signalized access to development parcels is likely a necessity, but the separation distances between Highway 407 ramp terminals and Highway 7 is less than 400m. In these locations, it is desirable to review and assess further options regarding the future operation, location and design of intersections, including consideration of modifications to the intersection spacing guidelines, synchronization of traffic signals, and alternative Highway 407 interchange designs (within the limits of good planning and engineering practice) that would allow traffic signals, if and when required in the future. Throughout the Proposed Land Use Concept road rights-of-way at the lower limit or narrower end of the range of engineering acceptability are recommended (see Appendix A ~ Transportation Documents Review for existing Region and City requirements by roadway classification). These narrower
ENTRA Consultants 2007-05-09 Page 22
rights-of-way can lead to streetscapes that are more pedestrian friendly and encourage high levels of activity. However, proposed road rights-of-way need to recognize the geometric requirements of trucks and transit vehicles and the potential needs of pedestrians and cyclists. For example, both trucks and transit vehicles have minimum requirements for turning radii that limit opportunities to implement tighter curb radii at intersections that can be of benefit to pedestrians. Transit operators generally desire a minimum pavement width of 9.0m for roads that transit is expected to operate on. Appendix B ~ Roadway Design Comparison – Industrial / Commercial Roads includes a select comparison of engineering design requirements for roads in employment areas. The proposed standards for the Study Area that are shown in the table are based on established standards, minimum vehicle requirements, and the overall planning objectives for the Study Area. The proposed rights-of-way that are applied in the Proposed Land Use Concept are generally within the range of rights-of-way that are advocated in the Region’s Arterial Corridor Guidelines, February 2007. Future more detailed implementation studies will need to review traffic operations and safety in much greater detail and develop detailed cross-sections for application to the Study Area, as well as make appropriate recommendations with respect to roadway geometric requirements such as vehicle turning radii, vehicle turn and storage lane requirements, driver stopping and sight distance requirements, weaving conflicts and the like. Detailed cross-sections will need to consider future land use, roadway
jurisdiction, the recently produced Region’s ACG, and the stated objectives and transportation requirements of the CPDP.
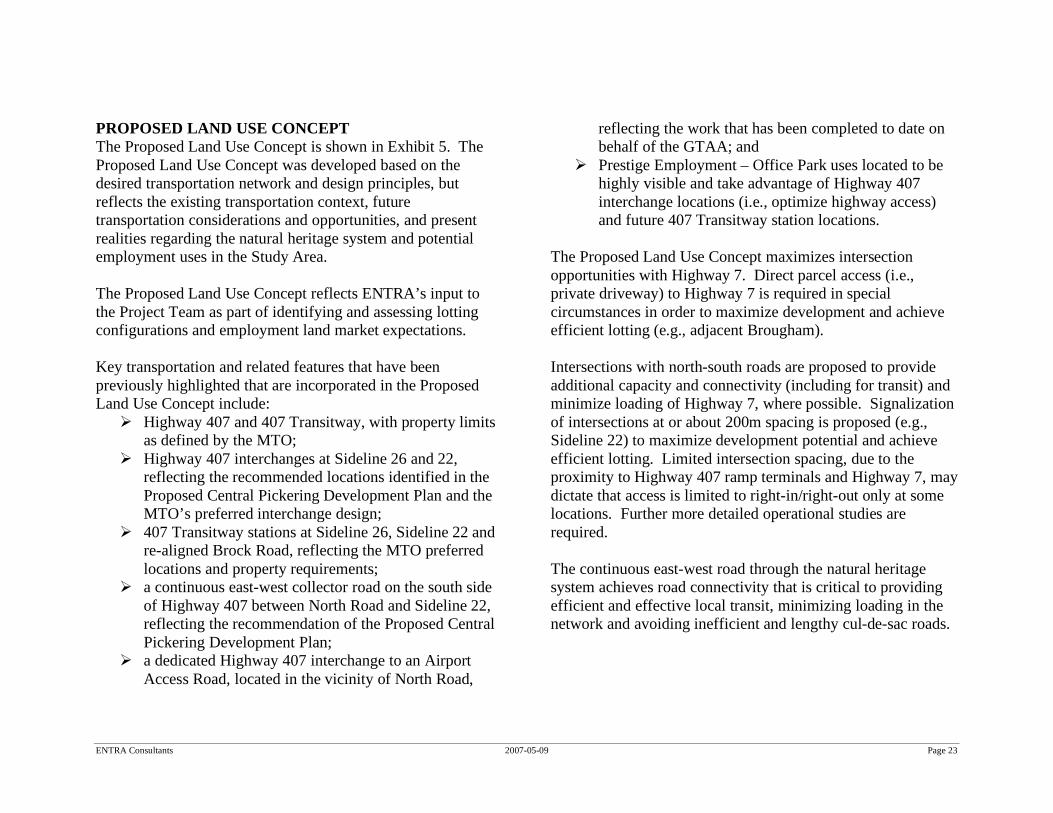
ENTRA Consultants 2007-05-09 Page 23
PROPOSED LAND USE CONCEPT The Proposed Land Use Concept is shown in Exhibit 5. The Proposed Land Use Concept was developed based on the desired transportation network and design principles, but reflects the existing transportation context, future transportation considerations and opportunities, and present realities regarding the natural heritage system and potential employment uses in the Study Area. The Proposed Land Use Concept reflects ENTRA’s input to the Project Team as part of identifying and assessing lotting configurations and employment land market expectations. Key transportation and related features that have been previously highlighted that are incorporated in the Proposed Land Use Concept include:
Highway 407 and 407 Transitway, with property limits as defined by the MTO;
Highway 407 interchanges at Sideline 26 and 22, reflecting the recommended locations identified in the Proposed Central Pickering Development Plan and the MTO’s preferred interchange design;
407 Transitway stations at Sideline 26, Sideline 22 and re-aligned Brock Road, reflecting the MTO preferred locations and property requirements;
a continuous east-west collector road on the south side of Highway 407 between North Road and Sideline 22, reflecting the recommendation of the Proposed Central Pickering Development Plan;
a dedicated Highway 407 interchange to an Airport Access Road, located in the vicinity of North Road,
reflecting the work that has been completed to date on behalf of the GTAA; and
Prestige Employment – Office Park uses located to be highly visible and take advantage of Highway 407 interchange locations (i.e., optimize highway access) and future 407 Transitway station locations.
The Proposed Land Use Concept maximizes intersection opportunities with Highway 7. Direct parcel access (i.e., private driveway) to Highway 7 is required in special circumstances in order to maximize development and achieve efficient lotting (e.g., adjacent Brougham). Intersections with north-south roads are proposed to provide additional capacity and connectivity (including for transit) and minimize loading of Highway 7, where possible. Signalization of intersections at or about 200m spacing is proposed (e.g., Sideline 22) to maximize development potential and achieve efficient lotting. Limited intersection spacing, due to the proximity to Highway 407 ramp terminals and Highway 7, may dictate that access is limited to right-in/right-out only at some locations. Further more detailed operational studies are required. The continuous east-west road through the natural heritage system achieves road connectivity that is critical to providing efficient and effective local transit, minimizing loading in the network and avoiding inefficient and lengthy cul-de-sac roads.
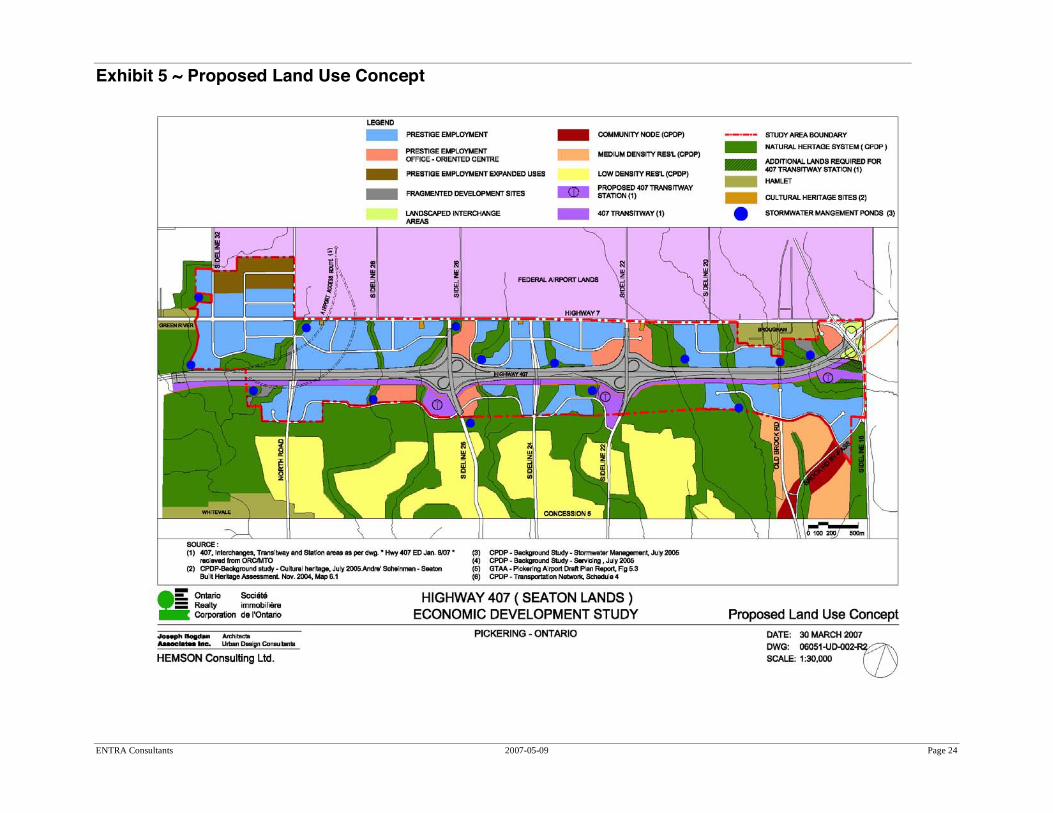
ENTRA Consultants 2007-05-09 Page 24
Exhibit 5 ~ Proposed Land Use Concept
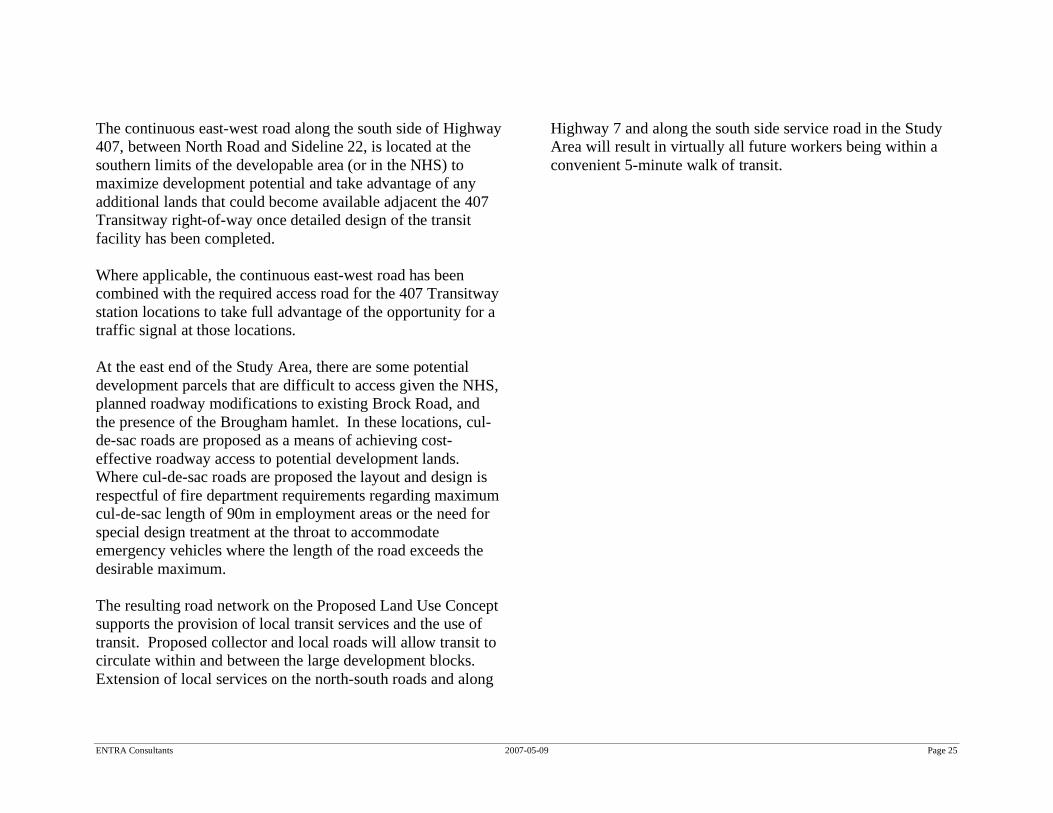
ENTRA Consultants 2007-05-09 Page 25
The continuous east-west road along the south side of Highway 407, between North Road and Sideline 22, is located at the southern limits of the developable area (or in the NHS) to maximize development potential and take advantage of any additional lands that could become available adjacent the 407 Transitway right-of-way once detailed design of the transit facility has been completed. Where applicable, the continuous east-west road has been combined with the required access road for the 407 Transitway station locations to take full advantage of the opportunity for a traffic signal at those locations. At the east end of the Study Area, there are some potential development parcels that are difficult to access given the NHS, planned roadway modifications to existing Brock Road, and the presence of the Brougham hamlet. In these locations, cul-de-sac roads are proposed as a means of achieving cost-effective roadway access to potential development lands. Where cul-de-sac roads are proposed the layout and design is respectful of fire department requirements regarding maximum cul-de-sac length of 90m in employment areas or the need for special design treatment at the throat to accommodate emergency vehicles where the length of the road exceeds the desirable maximum. The resulting road network on the Proposed Land Use Concept supports the provision of local transit services and the use of transit. Proposed collector and local roads will allow transit to circulate within and between the large development blocks. Extension of local services on the north-south roads and along
Highway 7 and along the south side service road in the Study Area will result in virtually all future workers being within a convenient 5-minute walk of transit.
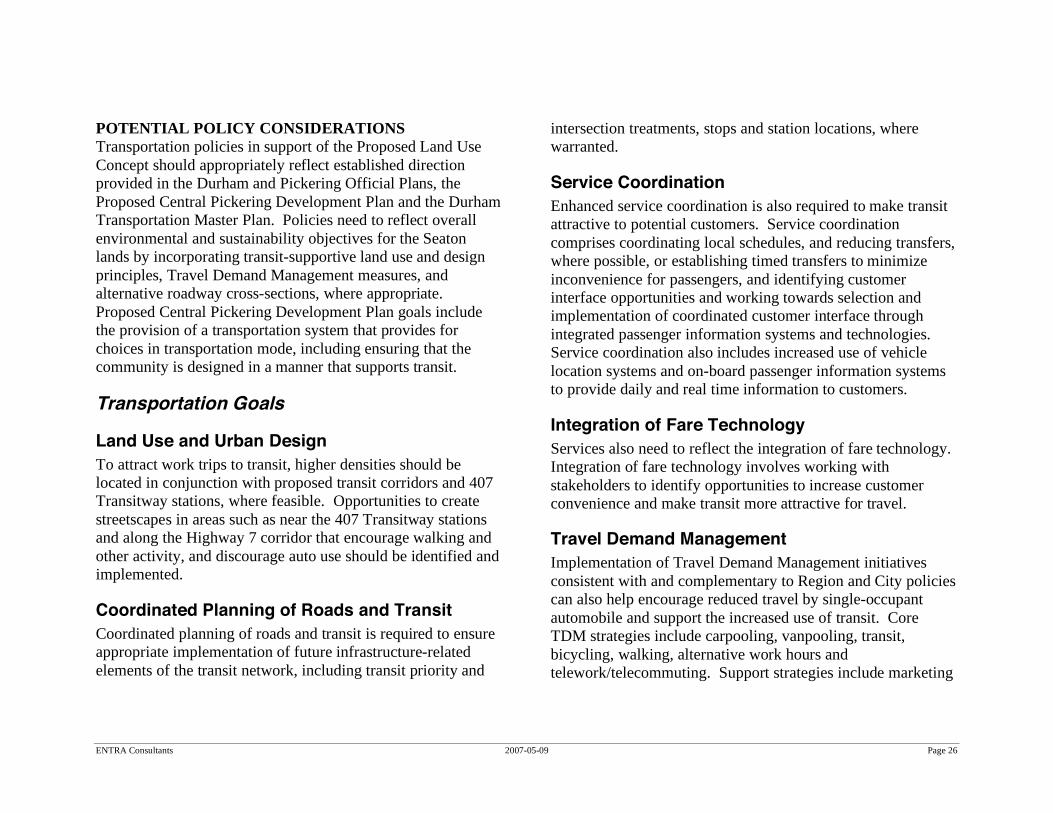
ENTRA Consultants 2007-05-09 Page 26
POTENTIAL POLICY CONSIDERATIONS Transportation policies in support of the Proposed Land Use Concept should appropriately reflect established direction provided in the Durham and Pickering Official Plans, the Proposed Central Pickering Development Plan and the Durham Transportation Master Plan. Policies need to reflect overall environmental and sustainability objectives for the Seaton lands by incorporating transit-supportive land use and design principles, Travel Demand Management measures, and alternative roadway cross-sections, where appropriate. Proposed Central Pickering Development Plan goals include the provision of a transportation system that provides for choices in transportation mode, including ensuring that the community is designed in a manner that supports transit.
Transportation Goals
Land Use and Urban Design To attract work trips to transit, higher densities should be located in conjunction with proposed transit corridors and 407 Transitway stations, where feasible. Opportunities to create streetscapes in areas such as near the 407 Transitway stations and along the Highway 7 corridor that encourage walking and other activity, and discourage auto use should be identified and implemented.
Coordinated Planning of Roads and Transit Coordinated planning of roads and transit is required to ensure appropriate implementation of future infrastructure-related elements of the transit network, including transit priority and
intersection treatments, stops and station locations, where warranted.
Service Coordination Enhanced service coordination is also required to make transit attractive to potential customers. Service coordination comprises coordinating local schedules, and reducing transfers, where possible, or establishing timed transfers to minimize inconvenience for passengers, and identifying customer interface opportunities and working towards selection and implementation of coordinated customer interface through integrated passenger information systems and technologies. Service coordination also includes increased use of vehicle location systems and on-board passenger information systems to provide daily and real time information to customers.
Integration of Fare Technology Services also need to reflect the integration of fare technology. Integration of fare technology involves working with stakeholders to identify opportunities to increase customer convenience and make transit more attractive for travel.
Travel Demand Management Implementation of Travel Demand Management initiatives consistent with and complementary to Region and City policies can also help encourage reduced travel by single-occupant automobile and support the increased use of transit. Core TDM strategies include carpooling, vanpooling, transit, bicycling, walking, alternative work hours and telework/telecommuting. Support strategies include marketing
ENTRA Consultants 2007-05-09 Page 27
and education, ride-matching, incentives and subsidies, parking management, guaranteed ride home and vehicle sharing. TDM measures that can be effective in reducing travel by single-occupant vehicles, while supporting increased transit use include parking management strategies related to the provision of park-and-ride and commuter lots, preferential parking, parking supply controls and parking pricing. Consideration of reduced parking supply in areas well served by transit is an objective of the Pickering OP. However, in establishing future opportunities for potential parking reductions in the employment lands, it is important to have regard for location and market factors that influence parking supply requirements. Consideration may be given to establishing a local Transportation Management Association (TMA) that will generate local interest in TDM, coordinate TDM programs and activities, and share information with government agencies about transportation needs and concerns.
Transportation Supply Management and Intelligent Transportation Systems Transportation System Management is crucial to the successful implementation of the Proposed Land Use Concept. Transportation Systems Management measures that can be effective in reducing traffic congestion include providing priority or HOV lanes, signal priority and/or optimization, and using Intelligent Transportation System (ITS) technologies for such things as incident management.
Sidewalks, Bike Routes and Trails Sidewalks should be provided on both sides of all roadways to facilitate safe and efficient pedestrian circulation within the employment lands and to the employment lands from residential areas to the south, and to support increased use of transit. For utilitarian cyclists (e.g., traveling to work), widened curb lanes are generally considered superior to cycling lanes and pathways because they are competent, confident and desire the fastest, most direct route. The connected network of local and collector roads, along with the cycling and trail system being developed through the on-going Natural Heritage System Management Study and Master Trails Plan, will provide convenient connections throughout the employment lands, as well as external connections to areas elsewhere in the CPDP and beyond. Potential facilities should be designed and implemented in accordance with the recommendations of the City’s Trails and Bikeway Master Plan.
Marketing and Education Part of making alternative modes of travel more attractive is educating people regarding the programs, facilities and services that are available. Marketing of transit, for instance, should consider initiatives such as:
on-going promotion and awareness campaigns; programs to change the public image of transit (e.g.,
public school education programs); participating in CUTA’s cross-country program
promoting the benefits of transit;
ENTRA Consultants 2007-05-09 Page 28
advertising campaigns and promotions that target specific groups in an effort to increase ridership; and
SmartCard technologies that allow discounts and promotions in conjunction with special events or business promotions in the downtown or elsewhere.
Performance Standards and Benchmarks Performance standards can be effective in defining how elements of the urban environment must function and are crucial in monitoring progress toward achieving goals and refining goals in response to measured performance. The standards chosen should be neither unrealistic, nor too easy to achieve. Standards should be challenging, worthwhile and achievable. Some standards can be implemented as design standards. If the design standard is being met, there can be reasonable confidence that the goal related to that standard is being met. This saves the need to regularly track the performance measure related to that goal, as long as care in taken to ensure that the design standard is appropriate and being followed. For roadways in the Study Area, Exhibit 6 establishes potential roadway design standards for consideration. Standards generally fall within the range of engineering design that is contemplated by existing City and Region standards, but reflect the principles that have been presented previously. All area roadways should have sidewalks on both sides of the road for the reasons previously identified. Given the desire to maintain roads at minimum widths to encourage and support pedestrian-friendly streets, as well as
maximize the developable area, and the need for pavement widths that can accommodate trucks and transit vehicles, it is recommended that cycling be accommodated within the pavement of all local and collector roads using a shared curb lane. Consideration may be given to marked bicycle lanes in response to particular conditions or needs that may be identified through further more detailed study (e.g., to make an important connection to or from the NHS). To the extent practical, parking supply should support objectives related to the increased use of alternative modes of travel, particularly transit. However, the marketability of employment lands in locations such as this is most often directly linked to the availability of inexpensive and abundant parking supply. In this location, there is likely a need to provide a minimum parking supply that will meet both anticipated travel demands and market desires. In general, it is recommended that the supply of parking in the Study Area be restricted to the lowest levels supportable in zoning for similar uses in other parts of the City or established through a separate parking demand study for employment uses. Consideration should be given to further reducing parking standards for uses and locations that are particularly supportable (e.g., around the 407 Transitway stations). However, even in these locations, reductions should be realistic and reflect marketability issues, and convenient and attractive alternatives to travel by automobile need to be established.
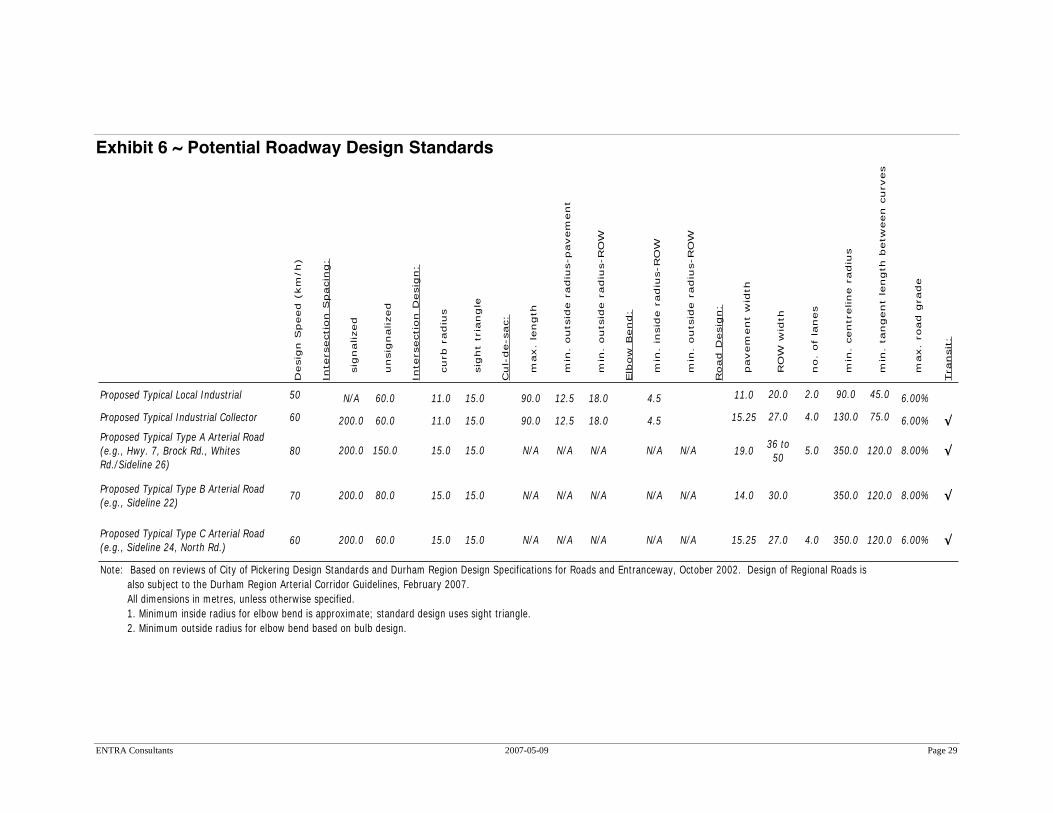
ENTRA Consultants 2007-05-09 Page 29
Exhibit 6 ~ Potential Roadway Design Standards
Desig
n S
peed (
km
/h)
Intersectio
n S
pacin
g:
sig
nalized
unsig
nalized
Intersectio
n D
esig
n:
curb r
adiu
s
sig
ht t
ria
ngle
Cul-
de-sac:
m
ax.
length
m
in.
outsid
e r
adiu
s-pavem
ent
m
in.
outsid
e r
adiu
s-RO
W
Elb
ow
Bend:
m
in.
insid
e r
adiu
s-RO
W
m
in.
outsid
e r
adiu
s-RO
W
Road D
esig
n:
pavem
ent w
idth
RO
W w
idth
no.
of
lanes
m
in.
centreline r
adiu
s
m
in.
tangent length b
etw
een c
urves
m
ax.
road g
rade
Transit:
Proposed Typical Local Industrial 50 N/A 60.0 11.0 15.0 90.0 12.5 18.0 4.5 11.0 20.0 2.0 90.0 45.0 6.00%
Proposed Typical Industrial Collector 60 200.0 60.0 11.0 15.0 90.0 12.5 18.0 4.5 15.25 27.0 4.0 130.0 75.0 6.00% !
Proposed Typical Type A Arterial Road
(e.g., Hwy. 7, Brock Rd., Whites
Rd./Sideline 26)
80 200.0 150.0 15.0 15.0 N/A N/A N/A N/A N/A 19.036 to
505.0 350.0 120.0 8.00% !
Proposed Typical Type B Arterial Road
(e.g., Sideline 22)70 200.0 80.0 15.0 15.0 N/A N/A N/A N/A N/A 14.0 30.0 350.0 120.0 8.00% !
Proposed Typical Type C Arterial Road
(e.g., Sideline 24, North Rd.)60 200.0 60.0 15.0 15.0 N/A N/A N/A N/A N/A 15.25 27.0 4.0 350.0 120.0 6.00% !
Note: Based on reviews of City of Pickering Design Standards and Durham Region Design Specifications for Roads and Entranceway, October 2002. Design of Regional Roads is
also subject to the Durham Region Arterial Corridor Guidelines, February 2007.
All dimensions in metres, unless otherwise specified.
1. Minimum inside radius for elbow bend is approximate; standard design uses sight triangle.
2. Minimum outside radius for elbow bend based on bulb design.
ENTRA Consultants 2007-05-09 Page 30
A fundamental element of Proposed Central Pickering Development Plan is support for the use of transit and support of potential transit service. To this end, it identifies 90 percent of the community as being within 400m of potential transit. Building on this and in keeping with the suggested approach to setting performance targets in the City’s Official Plan, it is appropriate to consider performance targets for the Proposed Land Use Concept such as:
90 percent of jobs within 400m of transit stop; and AM work trip transit modal split of 20 percent
(compared to current City-wide 11 percent). Any additional performance measures and benchmarks to be considered for application will by necessity need to reflect broader city-wide and Region-wide goals and objectives. These area-wide measures and benchmarks can include: For roads:
density: measured as passenger cars per hour per lane duration of congestion: measured by period of
congestion (usually defined as LOS E or F) level of service (LOS): qualitative assessment of
roadway point, segment or system using A to F based on measures of effectiveness
Annual Average Daily Traffic (AADT) or peak hour or peak period traffic measured as a comparison to a baseline;
traffic congestion: goal of significantly reducing or maintaining below Region average or an established target; measured using volume and lane data to estimate travel speeds and compare against theoretical free flow conditions
driver delay: goal of significantly reducing or maintaining below the Region average - measured as annual hours of delay per driver or person, or as daily vehicle hours of delay per km.
average speed; measured as distance / travel time; average travel time: measured as distance / speed; travel time reliability: several definitions are used that
include (1) variability of travel times, (2) percent of travellers who arrive at their destination within an acceptable time, and (3) range of travel times;
vehicle kilometres travelled (VKT): goal of maintaining per capita vehicle kilometres travelled at current levels - measured as annual VKT per capita
vehicle hours travelled (VHT): goal of maintaining per capita vehicle travel time at current levels - measured as annual VHT per capita;
vehicle occupancy: measured as average persons per vehicle;
non-auto share of commute trips: goal of increasing the non-auto share of commute trips - measured through surveys, utilization of carpool facilities and the like;
For transit: economic share: the R/C ratio indicates the share of the
investment in transit between the riders and the community at large;
system effectiveness: rides per hour measures how well the system meets the needs of riders;
system utilization: rides per capita measures how the system is keeping up with growth in the community - a key indicator of “balance” in the system. This statistic
ENTRA Consultants 2007-05-09 Page 31
could be compared against trips per capita in the auto network, either on a total basis, or peak period;
availability (e.g., workers with 400m straight line walking distance of transit);
service delivery (customer satisfaction); travel time (relative to alternatives such as the
automobile); and For pedestrians and cyclists:
Bicycle route, lane or path kilometres per capita or per street kilometre;
proportion of pedestrian-friendly streets (pedestrian oriented, continuous sidewalks in good repair, save pedestrian environment).
Short-term Expectations The principles, goals and standards identified for consideration reflect long-term expectations and requirements. On the roads side, it will be important to achieve adequate connections to the arterial roads at all stages of development to provide adequate roadway capacity and suitable connectivity that can meet the requirements of the development. It is anticipated that the major north-south arterial road connections across the Study Area will be constructed in a timely manner, coincident with development and that they will be extended to connect to the residential areas of the Proposed Central Pickering Development Plan as development proceeds. The roadway network connectivity and intersections that are assumed are contingent on design flexibility can only be confirmed through considerable further discussion with the
appropriate highway and road authorities, particularly on Highway 7 and adjacent the Highway 407 interchanges where Provincial interests in maintaining operations for relatively high volumes of commuter traffic may not be entirely consistent with the Proposed Land Use Concept. With respect to alternative modes of travel, it will be necessary to build demand for non-auto modes in an incremental fashion. It is anticipated that local transit will be extended to serve these employment lands. It will be crucial, in terms of building transit ridership and supporting long-term objectives, to introduce local transit at the very outset of development, at service frequencies that are supportable. In addition to the extension of limited local transit, it is anticipated that prior to implementation of the 407 Transitway the MTO will implement commuter parking lots at the station locations that have been identified. These commuter lots could serve as focal points for GO bus service on Highway 407 as well as potential carpooling and Kiss and Ride activity. However, prior to implementation of the Transit Priority Network in Durham and the 407 Transitway and related station facilities, and (in fact) considerable development of other areas of the Proposed Central Pickering Development Plan, it is unlikely that significant use of alternative modes of travel can be achieved and it should probably not be expected.
ENTRA Consultants 2007-05-09 Page 32
NEXT STEPS The Proposed Land Use Concept requires flexibility with respect to the application of typical roadway engineering design principles for a Provincial Highway or Arterial Road designation. There is need for a consultative approach to road network planning and design involving all stakeholders in the process. Detailed implementation plans will need to review traffic operations and safety in much greater detail and make appropriate recommendations with respect to roadway geometric requirements, such as vehicle turning radii, vehicle turn and storage lane requirements, driver stopping and sight distance requirements, weaving conflicts and the like. However, it is critical that these detailed studies recognize (within the limits of good planning and engineering practice) that this plan is and must continue to be founded upon flexibility for key structural elements, such as:
Highway 7, including its role and function, and design; Highway 407 interchanges, including opportunities for
alternative interchange configurations that could improve access to development lands;
407 Transitway right-of-way requirements that could free up developable land;
station access design that recognizes access opportunities are limited and reflects station access requirements, as well as development access needs;
roadway intersection spacing; and municipal road rights-of-way.
Without the presumed flexibility that is reflected in the Plan, it is unlikely that development objectives for the Study Area will be realized, that the transportation network in the Study Area will be able to effectively serve future development or that future development will support planned transit infrastructure and service levels.
ENTRA Consultants 2007-05-09 Page 33
ONTARIO REALTY CORPORATION HIGHWAY 407 (SEATON) ECONOMIC DEVELOPMENT STUDY
APPENDICES

ENTRA Consultants 2007-05-09 Page 34
ONTARIO REALTY CORPORATION HIGHWAY 407 (SEATON) ECONOMIC DEVELOPMENT STUDY
Appendix A ~ Transportation Documents Review
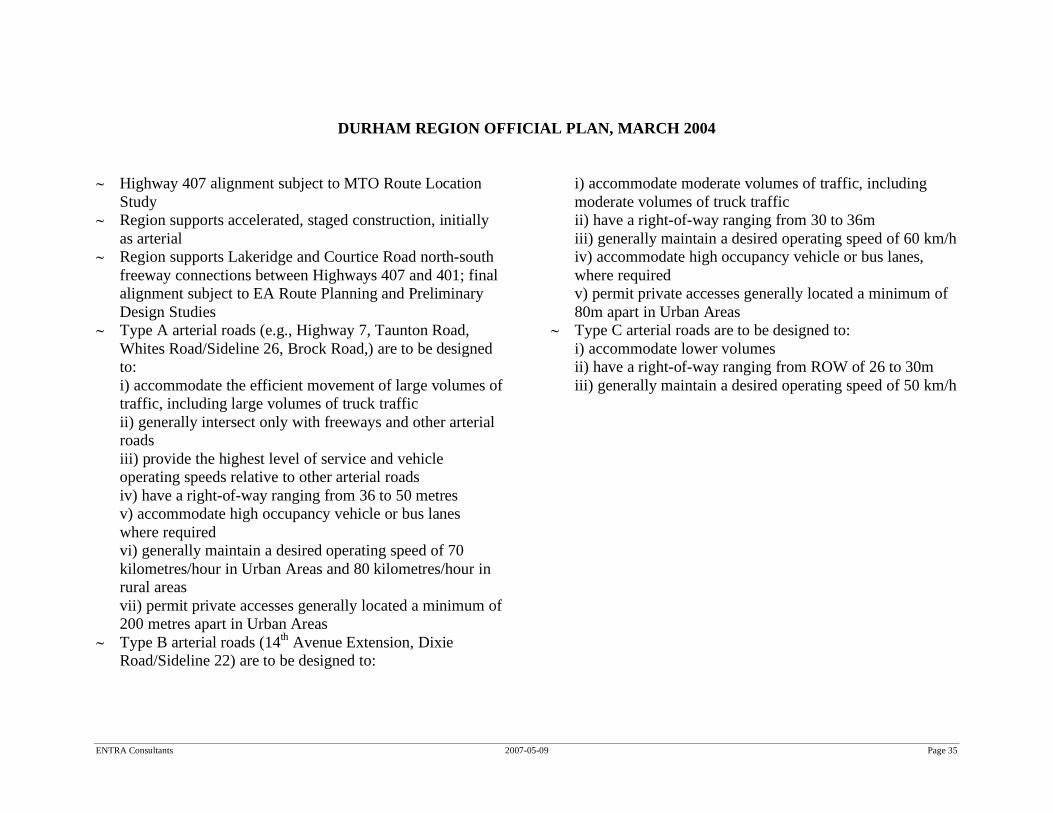
ENTRA Consultants 2007-05-09 Page 35
DURHAM REGION OFFICIAL PLAN, MARCH 2004
~ Highway 407 alignment subject to MTO Route Location Study
~ Region supports accelerated, staged construction, initially as arterial
~ Region supports Lakeridge and Courtice Road north-south freeway connections between Highways 407 and 401; final alignment subject to EA Route Planning and Preliminary Design Studies
~ Type A arterial roads (e.g., Highway 7, Taunton Road, Whites Road/Sideline 26, Brock Road,) are to be designed to: i) accommodate the efficient movement of large volumes of traffic, including large volumes of truck traffic ii) generally intersect only with freeways and other arterial roads iii) provide the highest level of service and vehicle operating speeds relative to other arterial roads iv) have a right-of-way ranging from 36 to 50 metres v) accommodate high occupancy vehicle or bus lanes where required vi) generally maintain a desired operating speed of 70 kilometres/hour in Urban Areas and 80 kilometres/hour in rural areas vii) permit private accesses generally located a minimum of 200 metres apart in Urban Areas
~ Type B arterial roads (14th Avenue Extension, Dixie Road/Sideline 22) are to be designed to:
i) accommodate moderate volumes of traffic, including moderate volumes of truck traffic ii) have a right-of-way ranging from 30 to 36m iii) generally maintain a desired operating speed of 60 km/h iv) accommodate high occupancy vehicle or bus lanes, where required v) permit private accesses generally located a minimum of 80m apart in Urban Areas
~ Type C arterial roads are to be designed to: i) accommodate lower volumes ii) have a right-of-way ranging from ROW of 26 to 30m iii) generally maintain a desired operating speed of 50 km/h
ENTRA Consultants 2007-05-09 Page 36
DURHAM REGION DESIGN SPECIFICATIONS FOR ROADS AND ENTRANCEWAYS, OCTOBER 2002
~ ROW: ~ Type A Arterial – 36.0-50.0m ~ Type B Arterial – 30.0-36.0m
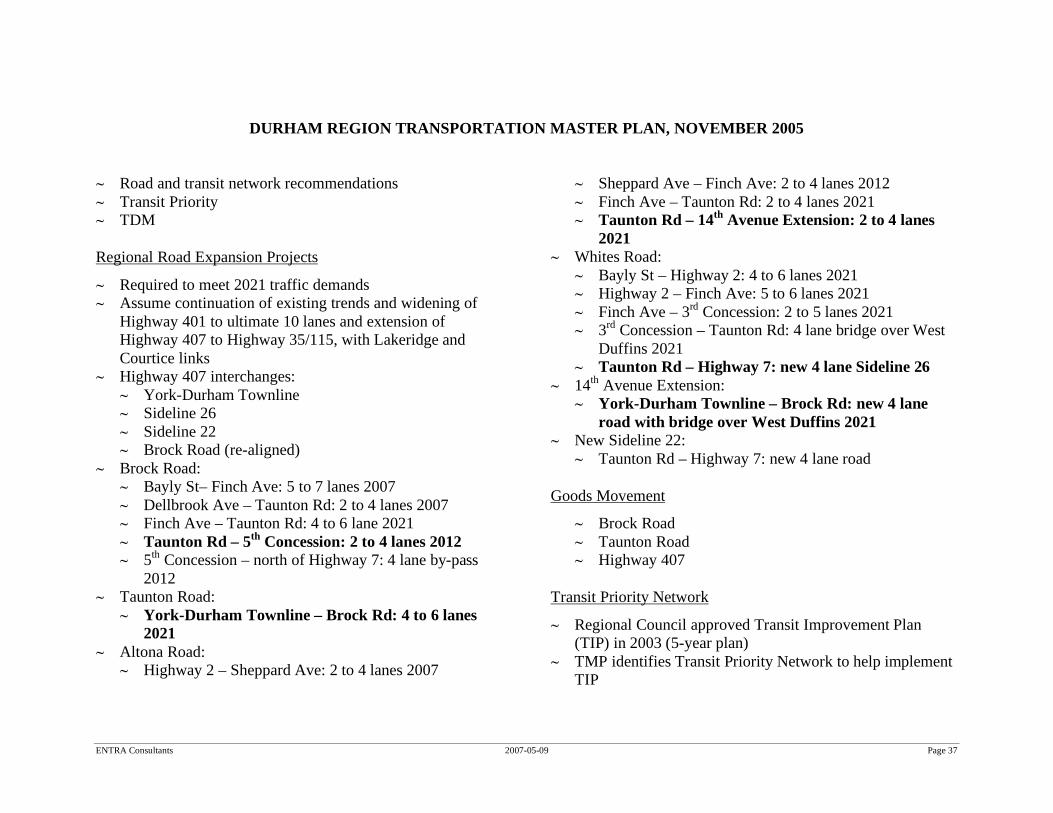
ENTRA Consultants 2007-05-09 Page 37
DURHAM REGION TRANSPORTATION MASTER PLAN, NOVEMBER 2005
~ Road and transit network recommendations ~ Transit Priority ~ TDM Regional Road Expansion Projects
~ Required to meet 2021 traffic demands ~ Assume continuation of existing trends and widening of
Highway 401 to ultimate 10 lanes and extension of Highway 407 to Highway 35/115, with Lakeridge and Courtice links
~ Highway 407 interchanges: ~ York-Durham Townline ~ Sideline 26 ~ Sideline 22 ~ Brock Road (re-aligned)
~ Brock Road: ~ Bayly St– Finch Ave: 5 to 7 lanes 2007 ~ Dellbrook Ave – Taunton Rd: 2 to 4 lanes 2007 ~ Finch Ave – Taunton Rd: 4 to 6 lane 2021 ~ Taunton Rd – 5th Concession: 2 to 4 lanes 2012 ~ 5th Concession – north of Highway 7: 4 lane by-pass
2012 ~ Taunton Road:
~ York-Durham Townline – Brock Rd: 4 to 6 lanes 2021
~ Altona Road: ~ Highway 2 – Sheppard Ave: 2 to 4 lanes 2007
~ Sheppard Ave – Finch Ave: 2 to 4 lanes 2012 ~ Finch Ave – Taunton Rd: 2 to 4 lanes 2021 ~ Taunton Rd – 14th Avenue Extension: 2 to 4 lanes
2021 ~ Whites Road:
~ Bayly St – Highway 2: 4 to 6 lanes 2021 ~ Highway 2 – Finch Ave: 5 to 6 lanes 2021 ~ Finch Ave – 3rd Concession: 2 to 5 lanes 2021 ~ 3rd Concession – Taunton Rd: 4 lane bridge over West
Duffins 2021 ~ Taunton Rd – Highway 7: new 4 lane Sideline 26
~ 14th Avenue Extension: ~ York-Durham Townline – Brock Rd: new 4 lane
road with bridge over West Duffins 2021 ~ New Sideline 22:
~ Taunton Rd – Highway 7: new 4 lane road Goods Movement
~ Brock Road ~ Taunton Road ~ Highway 407
Transit Priority Network
~ Regional Council approved Transit Improvement Plan (TIP) in 2003 (5-year plan)
~ TMP identifies Transit Priority Network to help implement TIP
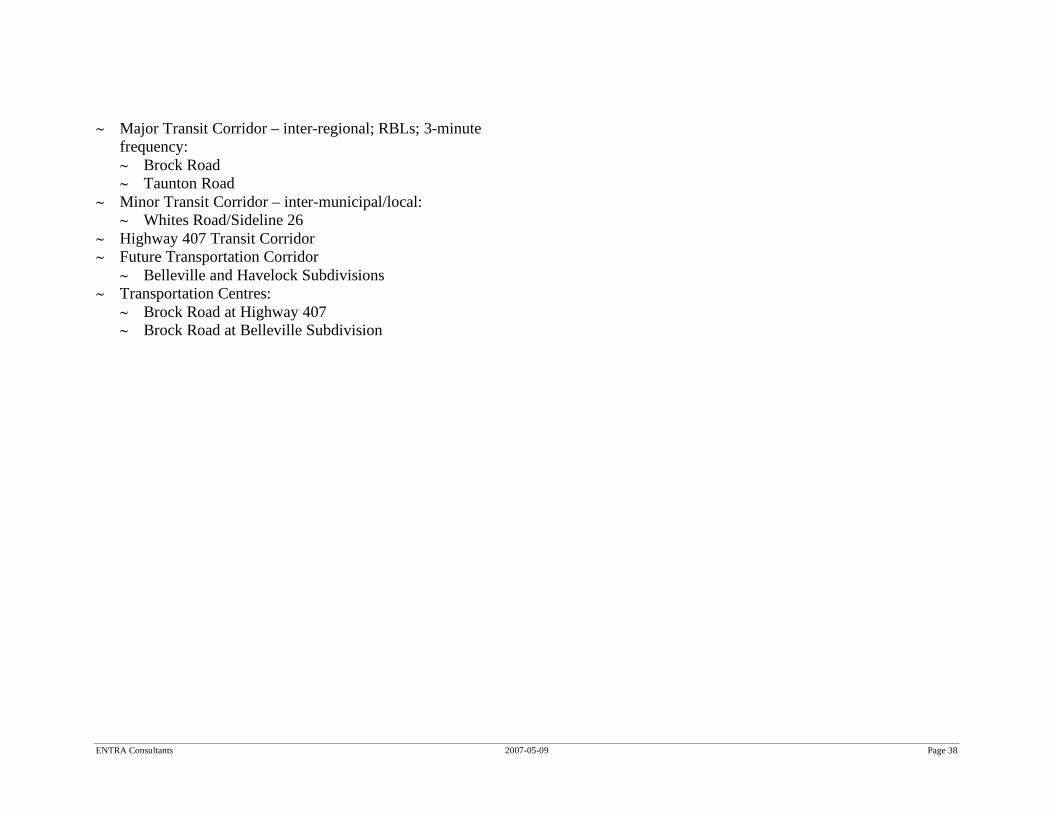
ENTRA Consultants 2007-05-09 Page 38
~ Major Transit Corridor – inter-regional; RBLs; 3-minute frequency: ~ Brock Road ~ Taunton Road
~ Minor Transit Corridor – inter-municipal/local: ~ Whites Road/Sideline 26
~ Highway 407 Transit Corridor ~ Future Transportation Corridor
~ Belleville and Havelock Subdivisions ~ Transportation Centres:
~ Brock Road at Highway 407 ~ Brock Road at Belleville Subdivision
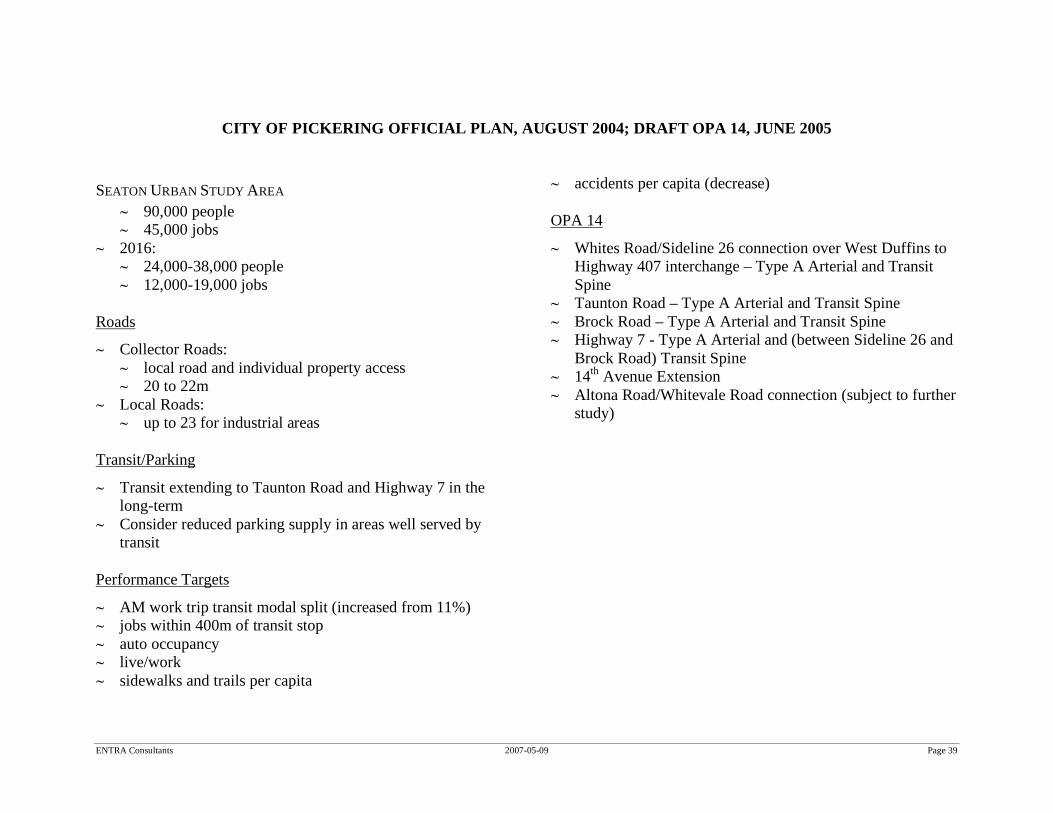
ENTRA Consultants 2007-05-09 Page 39
CITY OF PICKERING OFFICIAL PLAN, AUGUST 2004; DRAFT OPA 14, JUNE 2005
SEATON URBAN STUDY AREA ~ 90,000 people ~ 45,000 jobs
~ 2016: ~ 24,000-38,000 people ~ 12,000-19,000 jobs
Roads
~ Collector Roads: ~ local road and individual property access ~ 20 to 22m
~ Local Roads: ~ up to 23 for industrial areas
Transit/Parking
~ Transit extending to Taunton Road and Highway 7 in the long-term
~ Consider reduced parking supply in areas well served by transit
Performance Targets
~ AM work trip transit modal split (increased from 11%) ~ jobs within 400m of transit stop ~ auto occupancy ~ live/work ~ sidewalks and trails per capita
~ accidents per capita (decrease) OPA 14
~ Whites Road/Sideline 26 connection over West Duffins to Highway 407 interchange – Type A Arterial and Transit Spine
~ Taunton Road – Type A Arterial and Transit Spine ~ Brock Road – Type A Arterial and Transit Spine ~ Highway 7 - Type A Arterial and (between Sideline 26 and
Brock Road) Transit Spine ~ 14th Avenue Extension ~ Altona Road/Whitevale Road connection (subject to further
study)
ENTRA Consultants 2007-05-09 Page 40
CITY OF PICKERING DESIGN STANDARDS
~ ROW: ~ Arterial – 27.0m ~ Collector – 22.0-27.0m ~ Local – 22.0m
~ Pavement: ~ Arterial – 15.25-18.0m ~ Collector – 11.0-15.25m ~ Local – 11.0m
~ Signalization of Major Collector Roads
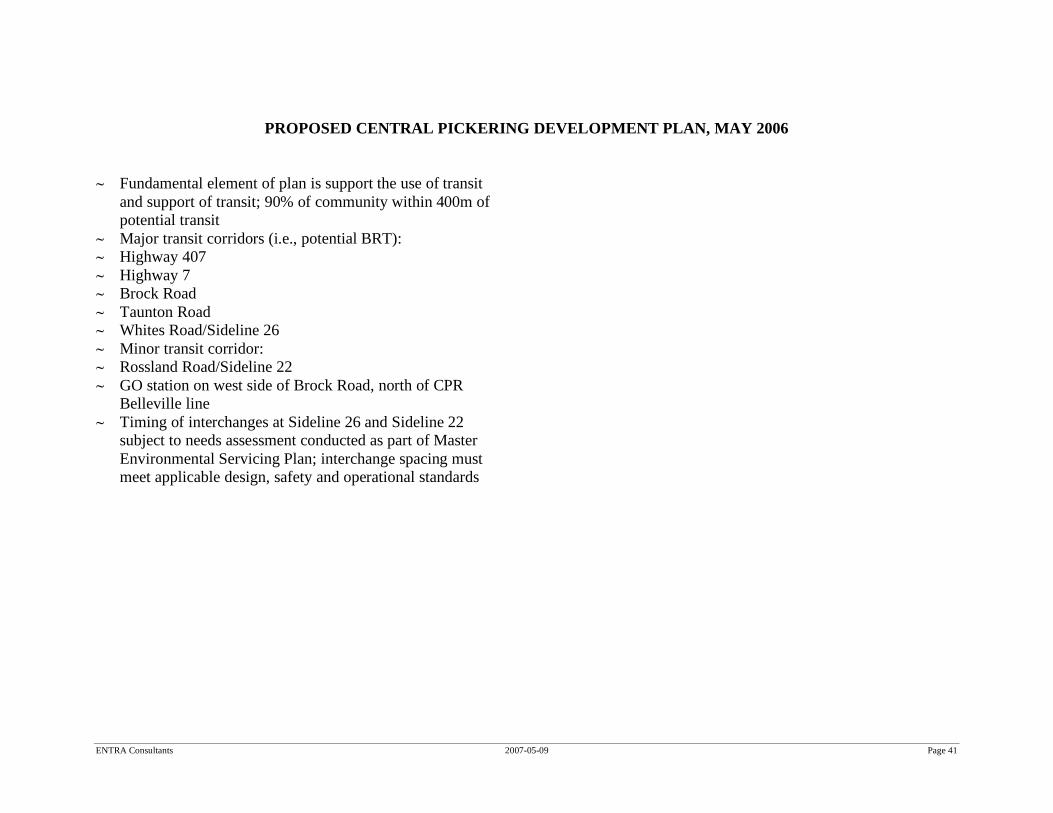
ENTRA Consultants 2007-05-09 Page 41
PROPOSED CENTRAL PICKERING DEVELOPMENT PLAN, MAY 2006
~ Fundamental element of plan is support the use of transit and support of transit; 90% of community within 400m of potential transit
~ Major transit corridors (i.e., potential BRT): ~ Highway 407 ~ Highway 7 ~ Brock Road ~ Taunton Road ~ Whites Road/Sideline 26 ~ Minor transit corridor: ~ Rossland Road/Sideline 22 ~ GO station on west side of Brock Road, north of CPR
Belleville line ~ Timing of interchanges at Sideline 26 and Sideline 22
subject to needs assessment conducted as part of Master Environmental Servicing Plan; interchange spacing must meet applicable design, safety and operational standards
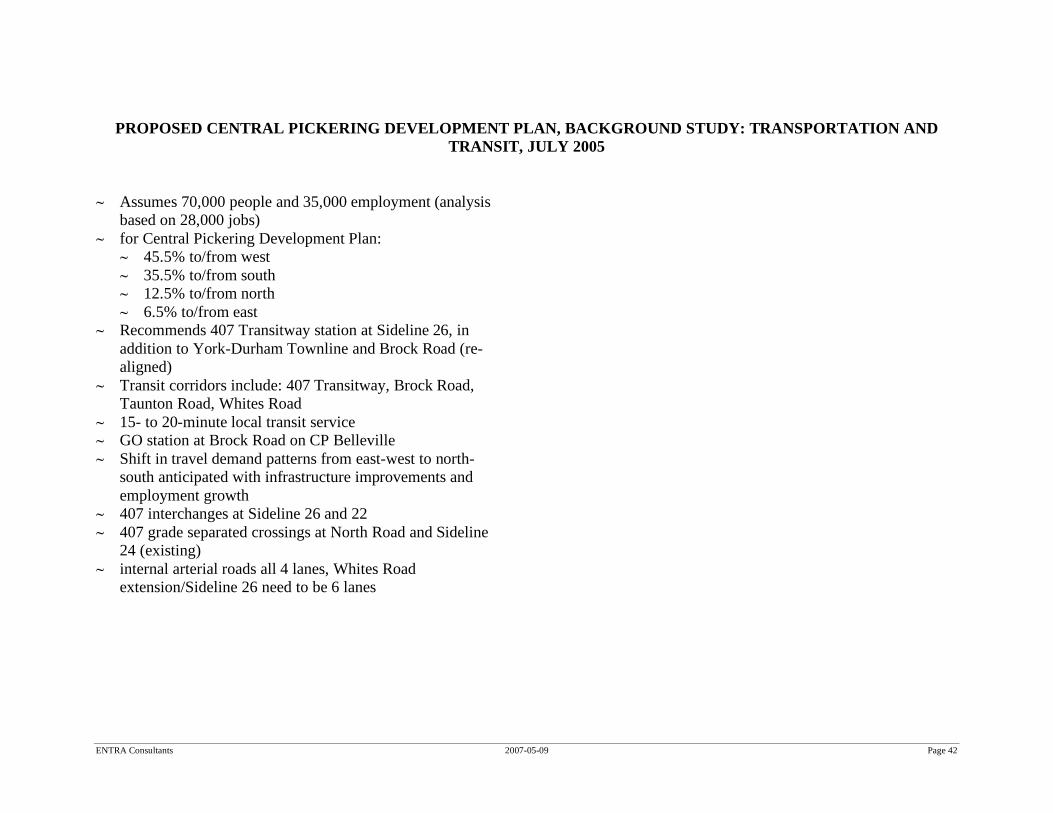
ENTRA Consultants 2007-05-09 Page 42
PROPOSED CENTRAL PICKERING DEVELOPMENT PLAN, BACKGROUND STUDY: TRANSPORTATION AND TRANSIT, JULY 2005
~ Assumes 70,000 people and 35,000 employment (analysis based on 28,000 jobs)
~ for Central Pickering Development Plan: ~ 45.5% to/from west ~ 35.5% to/from south ~ 12.5% to/from north ~ 6.5% to/from east
~ Recommends 407 Transitway station at Sideline 26, in addition to York-Durham Townline and Brock Road (re-aligned)
~ Transit corridors include: 407 Transitway, Brock Road, Taunton Road, Whites Road
~ 15- to 20-minute local transit service ~ GO station at Brock Road on CP Belleville ~ Shift in travel demand patterns from east-west to north-
south anticipated with infrastructure improvements and employment growth
~ 407 interchanges at Sideline 26 and 22 ~ 407 grade separated crossings at North Road and Sideline
24 (existing) ~ internal arterial roads all 4 lanes, Whites Road
extension/Sideline 26 need to be 6 lanes
ENTRA Consultants 2007-05-09 Page 43
407 EAST ENVIRONMENTAL ASSESSMENT TRANSPORTATION ASSESSMENT AND PROBLEM AND OPPORTUNITIES, DEFINITION REPORT, JUNE 2006
Travel Characteristics
~ Modal split (PM for Durham residents): ~ 77% driver ~ 14% auto passenger ~ 3% GO Rail ~ 4% transit ~ 2% walk ~ Trip distribution (for Durham): ~ 15% west ~ 2% east ~ 83% within Durham Roads
~ East-west travel constrained at Toronto/York/Durham boundary due to Rouge River valley and Park; Provincial policy that no new road be constructed through the Rouge Park;
~ Highway 7, Steeles Avenue/Taunton Road, Highway 407, Highway 401 at capacity, affects travel patterns and results in diversions to other roads that are not intended to carry high volumes of commuter traffic (Concession 5);
~ Highway 401 is at capacity during the peak periods ~ Highway 7 daily volumes range from 9,000 to 5,000; ~ Highway 7 role and function has transformed from rural
highway accommodating long distance travel to a major arterial road
~ Highway 407 daily volume in 2002 around 18,000 at Brock Road, compared to 45,000 on Highway 401 east of Highway 35/115 and 175,000 at Toronto/Durham boundary
~ Current termination at Highway 7 causes congestion and safety issues on Highway 7 east of Brock Road, MTO has recently initiated an EA for the widening of Highway 7 from Brock Road to Brock Street in Whitby;
~ Whites Road currently terminates at Taunton Road, proposed extension is opportunity to increase north-south capacity;
~ Additional north/south road capacity crossing Highway 407, need for crossings of Highway 407 at: ~ York-Durham Townline; ~ North Road (existing); ~ Sideline 26 (proposed interchange); ~ Sideline 24 (existing); ~ Sideline 22 (proposed interchange) ~ Brock Road
Transit
~ Expansion of local and inter-regional transit (area-wide); ~ DRT transit corridors – Region OP Brock Road is
designated as a regional north-south transit spine, Taunton Road is a regional east-west transit spine, Highway 407 is a transit spine; Durham TMP identified Whites Road as a
ENTRA Consultants 2007-05-09 Page 44
minor transit corridor; these corridors make up the Priority Transit Network
~ Brock Road is major transit corridor connecting to Pickering GO station on Lakeshore line
~ 11,000 westbound GO riders in AM peak period at Toronto-Durham line
~ 9,800 eastbound GO riders in PM peak period at Toronto-Durham line
~ existing GO bus on Highway 407 ~ Oshawa to York U: 6 peak direction AM and PM peak
period ~ Pickering GO to York U: 9 AM and 7 PM peak period
~ GO Transit Belleville and Havelock Subdivisions present opportunity, but feasibility has not been studied and no commitments have been made
~ Diverse distribution may make it difficult for transit to play substantial role in accommodating inter-regional and regional travel
~ Brock Road/Seaton GO station on Belleville Subdivision
ENTRA Consultants 2007-05-09 Page 45
407 EAST ENVIRONMENTAL ASSESSMENT ALTERNATIVES TO THE UNDERTAKING, AUGUST 2006
2031 Planned Improvements
~ Currently at capacity north-south and east-west ~ No Highway 401 scheduled improvements ~ Highway 7 widening from 2 to 4 lanes, from Brock Road to
Highway 12; EA initiated; widening beyond 4 lanes is undesirable
~ Analysis assumes: ~ Highway 401 widening to 12 lanes, Brock Road to Lake
Ridge Road ~ Highway 401 widening to 10 lanes, Lake Ridge Road to
Courtice Road ~ Projected to exceed capacity in 2011, 2021 and 2031 (1.2 –
N/S and 1.43 – E/W in 2031) ~ Capacity:
~ Freeway – 1,800 vehicles per hour per lane ~ Type A arterial road capacity of approximately 900 to
1,000 ~ Type B - 700 ~ Type C - 500
Transit
~ CPR Belleville Subdivision ~ Main line between Toronto and Montreal ~ Could provide connection between mid-town areas of
Durham and Toronto
~ Require new track, given insufficient extra capacity and projected freight traffic
~ No current plans ~ CPR Havelock Subdivision ~ Available capacity ~ Insufficient demand to warrant introduction of service Needs
~ Ongoing Highway 407 EA identifies 2011 need for: ~ Highway 407 widening to 6 lanes ~ Taunton Road widening to 6 lanes ~ Brock Road widening to 6 lanes
~ Ongoing Highway 407 EA identifies 2021 need for: ~ Highway 7 widening to 4 lanes ~ 5th Concession widening to 4 lanes ~ Sideline 24 widening to 4 lanes
~ Ongoing Highway 407 EA identifies 2031 need for: ~ Highway 407 widening to 10 lanes
~ Continuing issues beyond capacity: ~ Continuity of roads beyond Durham boundary ~ Widening of some arterial roads could preclude
identified high-order transit ~ Widening of some arterial roads could negatively
impact walking and cycling
ENTRA Consultants 2007-05-09 Page 46
~ Arterial road network not appropriate for accommodating long-distance trips and goods movement
~ Recommendation: ~ Re-affirmed extension to Highway 35/115 with Lake
Ridge and Courtice Road links and enhanced transit/TDM/TSM
~ Protecting 110m Highway right-of-way and 60m Transitway corridor
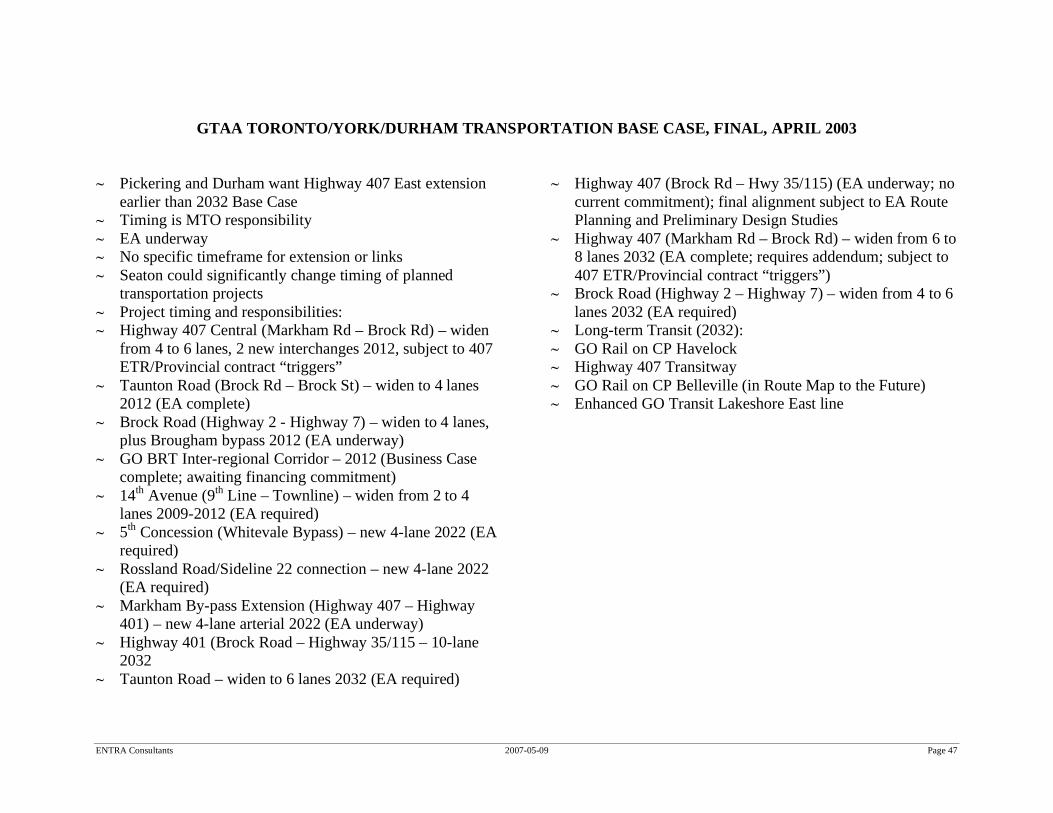
ENTRA Consultants 2007-05-09 Page 47
GTAA TORONTO/YORK/DURHAM TRANSPORTATION BASE CASE, FINAL, APRIL 2003
~ Pickering and Durham want Highway 407 East extension earlier than 2032 Base Case
~ Timing is MTO responsibility ~ EA underway ~ No specific timeframe for extension or links ~ Seaton could significantly change timing of planned
transportation projects ~ Project timing and responsibilities: ~ Highway 407 Central (Markham Rd – Brock Rd) – widen
from 4 to 6 lanes, 2 new interchanges 2012, subject to 407 ETR/Provincial contract “triggers”
~ Taunton Road (Brock Rd – Brock St) – widen to 4 lanes 2012 (EA complete)
~ Brock Road (Highway 2 - Highway 7) – widen to 4 lanes, plus Brougham bypass 2012 (EA underway)
~ GO BRT Inter-regional Corridor – 2012 (Business Case complete; awaiting financing commitment)
~ 14th Avenue (9th Line – Townline) – widen from 2 to 4 lanes 2009-2012 (EA required)
~ 5th Concession (Whitevale Bypass) – new 4-lane 2022 (EA required)
~ Rossland Road/Sideline 22 connection – new 4-lane 2022 (EA required)
~ Markham By-pass Extension (Highway 407 – Highway 401) – new 4-lane arterial 2022 (EA underway)
~ Highway 401 (Brock Road – Highway 35/115 – 10-lane 2032
~ Taunton Road – widen to 6 lanes 2032 (EA required)
~ Highway 407 (Brock Rd – Hwy 35/115) (EA underway; no current commitment); final alignment subject to EA Route Planning and Preliminary Design Studies
~ Highway 407 (Markham Rd – Brock Rd) – widen from 6 to 8 lanes 2032 (EA complete; requires addendum; subject to 407 ETR/Provincial contract “triggers”)
~ Brock Road (Highway 2 – Highway 7) – widen from 4 to 6 lanes 2032 (EA required)
~ Long-term Transit (2032): ~ GO Rail on CP Havelock ~ Highway 407 Transitway ~ GO Rail on CP Belleville (in Route Map to the Future) ~ Enhanced GO Transit Lakeshore East line
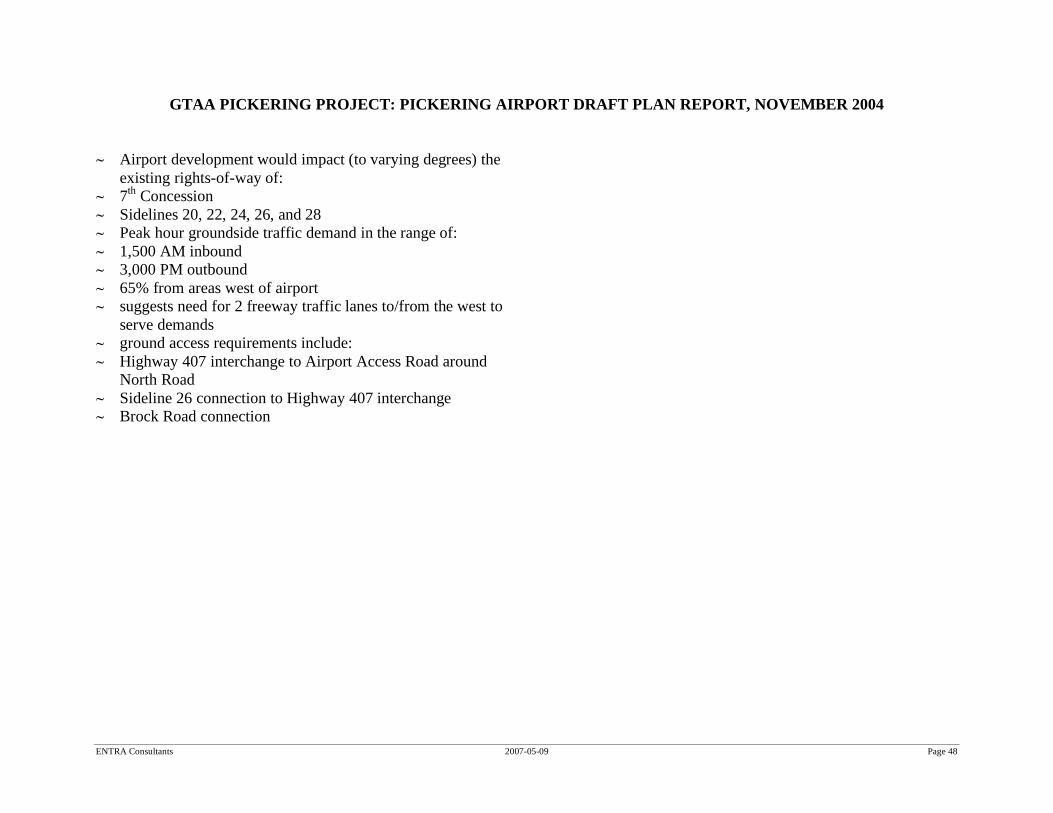
ENTRA Consultants 2007-05-09 Page 48
GTAA PICKERING PROJECT: PICKERING AIRPORT DRAFT PLAN REPORT, NOVEMBER 2004
~ Airport development would impact (to varying degrees) the existing rights-of-way of:
~ 7th Concession ~ Sidelines 20, 22, 24, 26, and 28 ~ Peak hour groundside traffic demand in the range of: ~ 1,500 AM inbound ~ 3,000 PM outbound ~ 65% from areas west of airport ~ suggests need for 2 freeway traffic lanes to/from the west to
serve demands ~ ground access requirements include: ~ Highway 407 interchange to Airport Access Road around
North Road ~ Sideline 26 connection to Highway 407 interchange ~ Brock Road connection

ENTRA Consultants 2007-05-09 Page 49
ONTARIO REALTY CORPORATION HIGHWAY 407 (SEATON) ECONOMIC DEVELOPMENT STUDY
Appendix B ~ Roadway Design Comparison – Industrial / Commercial Roads
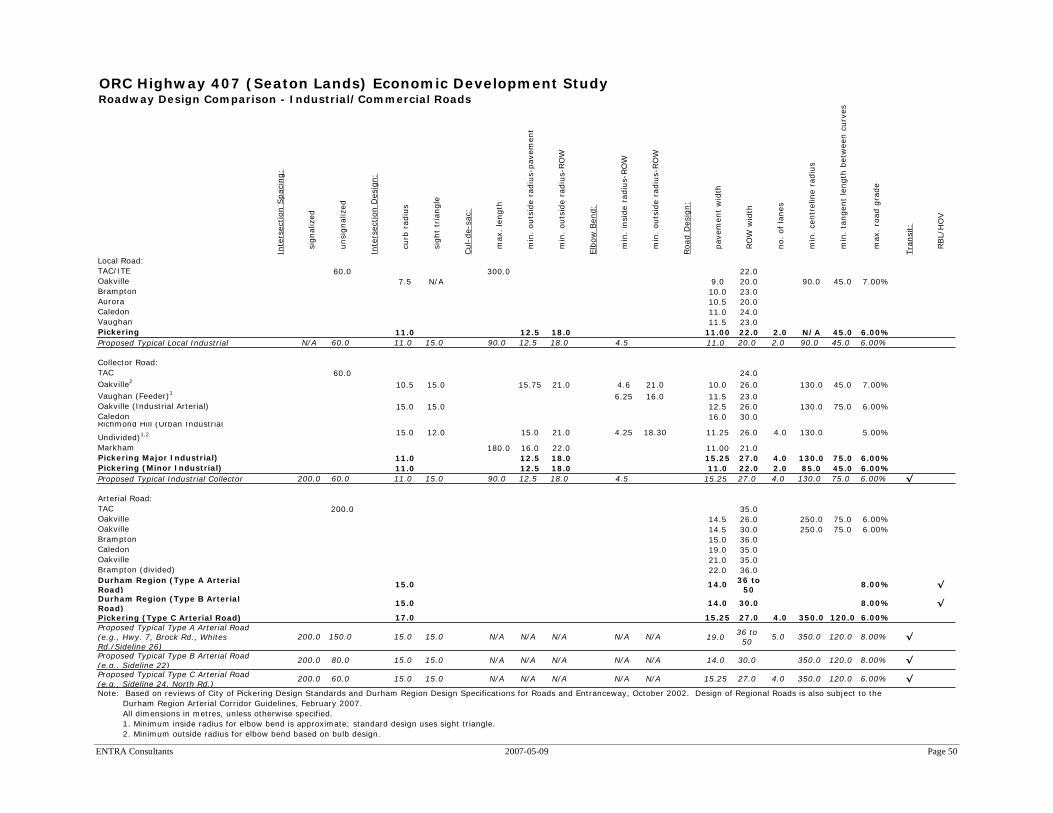
ENTRA Consultants 2007-05-09 Page 50
ORC Highway 407 (Seaton Lands) Economic Development StudyRoadway Design Comparison - Industrial/Commercial Roads
Inte
rsection S
pacin
g:
sig
nalized
unsig
nalized
Inte
rsection D
esig
n:
curb
radiu
s
sig
ht
tria
ngle
Cul-
de-s
ac:
m
ax.
length
m
in.
outs
ide r
adiu
s-p
avem
ent
m
in.
outs
ide r
adiu
s-R
OW
Elb
ow
Bend:
m
in.
insid
e r
adiu
s-R
OW
m
in.
outs
ide r
adiu
s-R
OW
Road D
esig
n:
pavem
ent
wid
th
RO
W w
idth
no.
of la
nes
m
in.
centr
eline r
adiu
s
m
in.
tangent
length
betw
een c
urv
es
m
ax.
road g
rade
Tra
nsit:
RBL/H
OV
Local Road:
TAC/ITE 60.0 300.0 22.0Oakville 7.5 N/A 9.0 20.0 90.0 45.0 7.00%Brampton 10.0 23.0Aurora 10.5 20.0Caledon 11.0 24.0Vaughan 11.5 23.0Pickering 11.0 12.5 18.0 11.00 22.0 2.0 N/A 45.0 6.00%
Proposed Typical Local Industrial N/A 60.0 11.0 15.0 90.0 12.5 18.0 4.5 11.0 20.0 2.0 90.0 45.0 6.00%
Collector Road:
TAC 60.0 24.0
Oakville2
10.5 15.0 15.75 21.0 4.6 21.0 10.0 26.0 130.0 45.0 7.00%
Vaughan (Feeder)1
6.25 16.0 11.5 23.0Oakville (Industrial Arterial) 15.0 15.0 12.5 26.0 130.0 75.0 6.00%Caledon 16.0 30.0Richmond Hill (Urban Industrial
Undivided)1,2 15.0 12.0 15.0 21.0 4.25 18.30 11.25 26.0 4.0 130.0 5.00%
Markham 180.0 16.0 22.0 11.00 21.0Pickering Major Industrial) 11.0 12.5 18.0 15.25 27.0 4.0 130.0 75.0 6.00%
Pickering (Minor Industrial) 11.0 12.5 18.0 11.0 22.0 2.0 85.0 45.0 6.00%
Proposed Typical Industrial Collector 200.0 60.0 11.0 15.0 90.0 12.5 18.0 4.5 15.25 27.0 4.0 130.0 75.0 6.00% !
Arterial Road:
TAC 200.0 35.0Oakville 14.5 26.0 250.0 75.0 6.00%Oakville 14.5 30.0 250.0 75.0 6.00%Brampton 15.0 36.0Caledon 19.0 35.0Oakville 21.0 35.0Brampton (divided) 22.0 36.0
Durham Region (Type A Arterial
Road)15.0 14.0
36 to
508.00% !
Durham Region (Type B Arterial
Road)15.0 14.0 30.0 8.00% !
Pickering (Type C Arterial Road) 17.0 15.25 27.0 4.0 350.0 120.0 6.00%
Proposed Typical Type A Arterial Road
(e.g., Hwy. 7, Brock Rd., Whites
Rd./Sideline 26)
200.0 150.0 15.0 15.0 N/A N/A N/A N/A N/A 19.036 to
505.0 350.0 120.0 8.00% !
Proposed Typical Type B Arterial Road
(e.g., Sideline 22)200.0 80.0 15.0 15.0 N/A N/A N/A N/A N/A 14.0 30.0 350.0 120.0 8.00% !
Proposed Typical Type C Arterial Road
(e.g., Sideline 24, North Rd.)200.0 60.0 15.0 15.0 N/A N/A N/A N/A N/A 15.25 27.0 4.0 350.0 120.0 6.00% !
Note: Based on reviews of City of Pickering Design Standards and Durham Region Design Specifications for Roads and Entranceway, October 2002. Design of Regional Roads is also subject to the
Durham Region Arterial Corridor Guidelines, February 2007.
All dimensions in metres, unless otherwise specified.
1. Minimum inside radius for elbow bend is approximate; standard design uses sight triangle.
2. Minimum outside radius for elbow bend based on bulb design.
HIGHWAY 407 (SEATON LANDS)ECONOMIC DEVELOPMENT STUDY
APPENDIX C
Urban Design and Built Form Guidelines
Joseph Bogdan Associates Inc.

HIGHWAY 407(SEATON LANDS) ECONOMIC DEVELOPMENT STUDY Urban Design and Built Form Guidelines Ontario Realty Corporation FINAL REPORT _____________________________________________________________________________________________________________________________________________________________________
i 30 March 2007
Table of Contents 1.0 Introduction 1
1.1. Summary of the Land Use Concept 1 1.2. Purpose of the Guidelines 7 1.3. Structure of the Guidelines 7 1.4. Implementation of the Guidelines 7
2.0 Design Principles 8
2.1. Integration with the Natural Heritage System 8 2.2. High Quality of Design 8 2.3. Sustainable Design 8 2.4. Highway Frontages 9 2.5. Response to Adjacent Development 9 2.6. Connected Street Pattern 9 2.7. Flexibility of Development Lots 9 2.8. Transit and Pedestrian Integration 10 2.9. Open Space 10
3.0 Site Planning Guidelines 11
3.1. Sustainable Site Development 11 3.2. Relationship to Natural Edges 11 3.3. Local Road Access 12 3.4 Site Access and Driveways 12 3.5 Recommended Building Setbacks 13 3.6 Parking Areas 14 3.7 Storage, Service and Loading Areas 16 3.8 Site Lighting and Safety 16 3.9 Pedestrian Movement 17
4.0 Built Form Guidelines 18
4.1. Sustainable Building Design 18 4.2. Building Height and Massing 19 4.3. Building Design 20
4.3.1 Entrances and Primary Road Frontage 20 4.3.2 Highway Frontage 20 4.3.3 Fenestration 20 4.3.4 Architectural Articulation 21 4.3.5 Building Materials 22 4.3 Rooftop and Mechanical Elements 22 4.4 Lighting 23 4.5 Signage 24 5.0 Open Space Guidelines 26 5.1 Landscape Requirements at Road Frontages 26 5.2 Landscape Quality and Typology 30 5.3 Paved Surfaces 30 5.4 Other Landscape Buffers 31 5.5 Outdoor Amenity Space 31 5.6 Pedestrian and Trail Connections 32 6.0 Site Specific Development 33
6.1 Prestige Employment – Office-Oriented Centre 33 6.2 Prestige Employment – Expanded Areas 33 6.3 Employment-Related Commercial Uses 33 6.4 Highway 407 Frontage 34 6.5 Highway 7 Frontage 34 6.6 Development at Existing Hamlets 35 6.7 Development Adjacent to Residential Uses 36
HIGHWAY 407(SEATON LANDS) ECONOMIC DEVELOPMENT STUDY Urban Design and Built Form Guidelines Ontario Realty Corporation FINAL REPORT _____________________________________________________________________________________________________________________________________________________________________
ii 30 March 2007
Table of Figures Proposed Land Use Concept 2 Proposed Transportation and Transit Network 4 Example of Potential Lotting Configuration 6 Proposed Road Cross Sections: Highway 407 27 Highway 7 28 Local Road 29 Interface between Medium Density Residential Uses and Employment Lands at Brock Road By-Pass 36 View from Highway 407 37

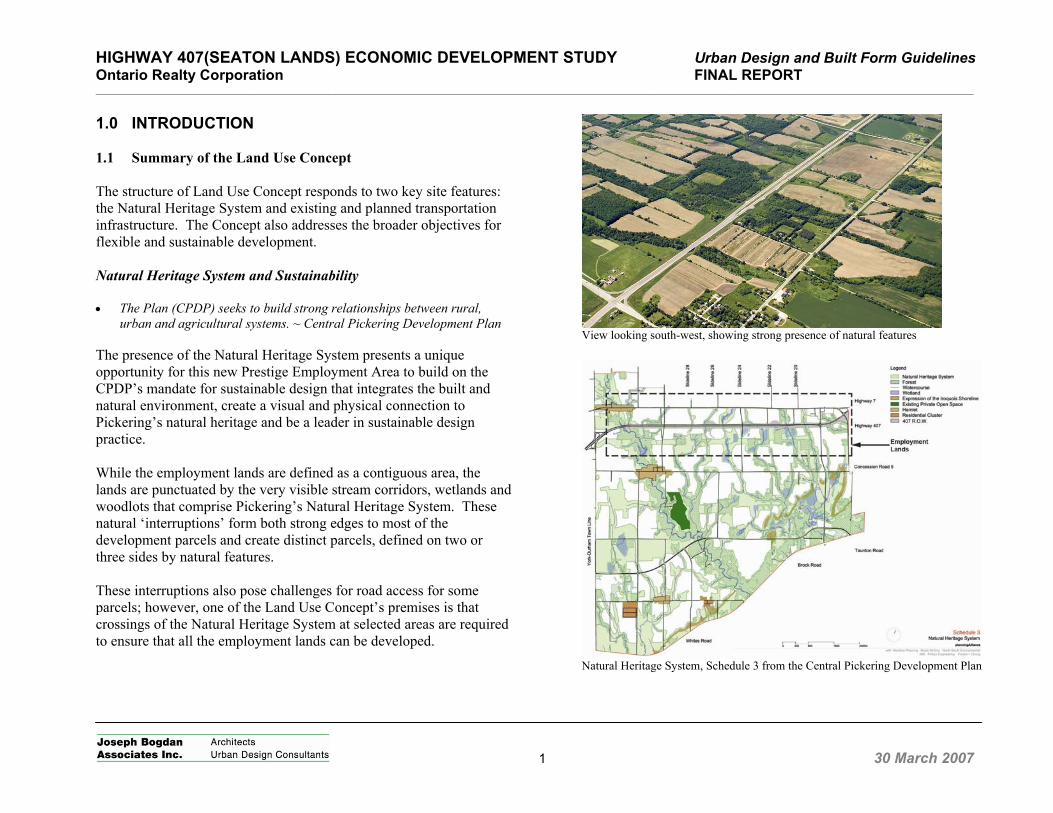
HIGHWAY 407(SEATON LANDS) ECONOMIC DEVELOPMENT STUDY Urban Design and Built Form Guidelines Ontario Realty Corporation FINAL REPORT _____________________________________________________________________________________________________________________________________________________________________
1 30 March 2007
1.0 INTRODUCTION 1.1 Summary of the Land Use Concept The structure of Land Use Concept responds to two key site features: the Natural Heritage System and existing and planned transportation infrastructure. The Concept also addresses the broader objectives for flexible and sustainable development. Natural Heritage System and Sustainability • The Plan (CPDP) seeks to build strong relationships between rural,
urban and agricultural systems. ~ Central Pickering Development Plan The presence of the Natural Heritage System presents a unique opportunity for this new Prestige Employment Area to build on the CPDP’s mandate for sustainable design that integrates the built and natural environment, create a visual and physical connection to Pickering’s natural heritage and be a leader in sustainable design practice. While the employment lands are defined as a contiguous area, the lands are punctuated by the very visible stream corridors, wetlands and woodlots that comprise Pickering’s Natural Heritage System. These natural ‘interruptions’ form both strong edges to most of the development parcels and create distinct parcels, defined on two or three sides by natural features. These interruptions also pose challenges for road access for some parcels; however, one of the Land Use Concept’s premises is that crossings of the Natural Heritage System at selected areas are required to ensure that all the employment lands can be developed.
View looking south-west, showing strong presence of natural features
Natural Heritage System, Schedule 3 from the Central Pickering Development Plan
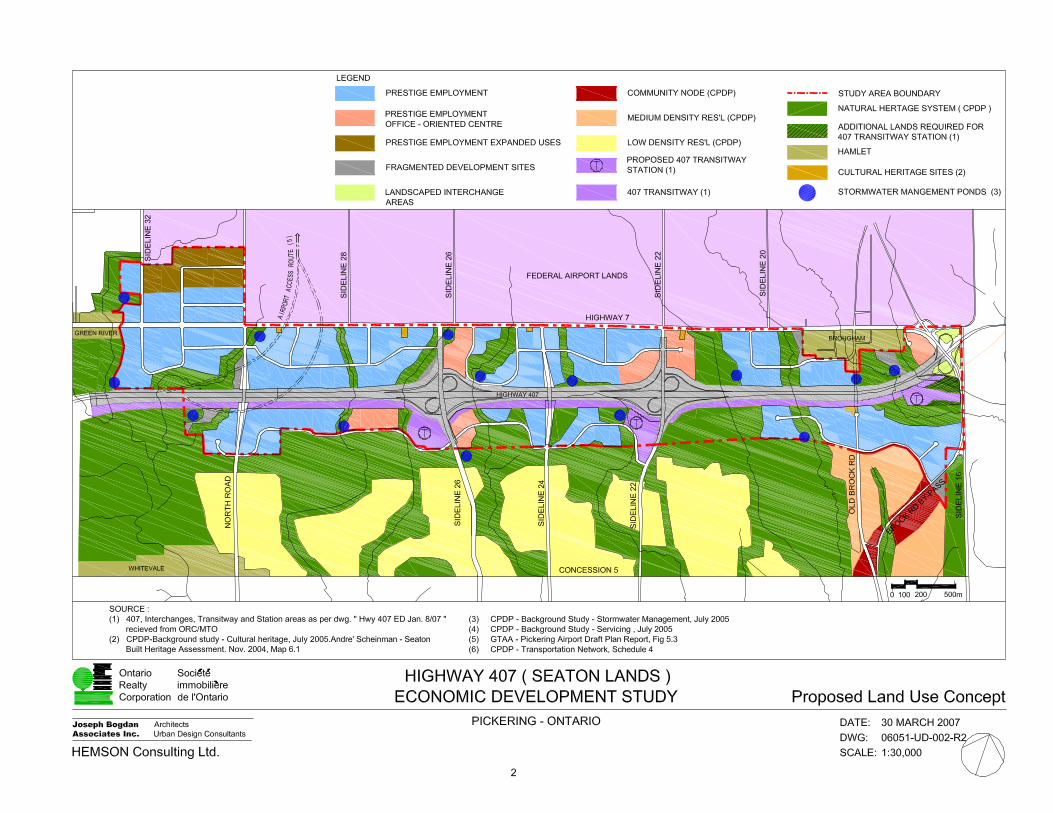
HIGHWAY 407(SEATON LANDS) ECONOMIC DEVELOPMENT STUDY Urban Design and Built Form Guidelines Ontario Realty Corporation FINAL REPORT _____________________________________________________________________________________________________________________________________________________________________
3 30 March 2007
Transportation Infrastructure The network of the existing east-west highways, Hwy 407 and Hwy 7, and the regular north-south concession lines, in combination with the two planned Hwy 407 interchanges and 407 Transitway sets the stage for a well-serviced employment area that supports a range of transport, vehicular and transit needs. The physical characteristics of these routes play a key role in determining access, local roads and urban design character along primary frontages. Highway 407 The Hwy 407 right-of-way, the MTO design limits of the interchanges and the 407 Transitway and stations occupy significant lands that fall within the development parcels, resulting in an overall reduction of developable parcel boundaries. The Land Use Concept mitigates the effect of smaller lot depths created by these boundaries by designating smaller Prestige Office sites along portions of the Hwy 407 frontage and at interchange frontage. Design guidelines will require a high standard of architectural, landscaping and signage design with the intent that these areas convey the desired higher quality of ‘signature’ development. Brock Road By-Pass Interchange The Brock Road By-Pass at the Hwy 407/Brock/Hwy 7 interchange also requires lands that fall within the development parcels, contributing to the overall reduction development area. While the remaining portions of these interchange lands may not have the potential to be developed as employment sites, the Land Use Concept recommends that they be developed as areas of high quality landscaping and signage, announcing the employment area.
Highway 7 As the route linking the hamlets of Green River and Brougham, and the presence of cultural heritage properties along its southern frontage, Hwy 7 has a special cultural heritage character. Currently, it is under the jurisdiction of MTO, but its transfer to Durham Region is planned and will be classified as a Type A Arterial Road, with a proposed ROW of 36-50m. Under the CPDP, it is designated as a Major Transit Corridor; however, it is not designated as such in the Region’s Transit Priority Network. This study assumes that Hwy 7 will be designated as a Regional road and that its function as a primary east-west artery will remain with the added provision for bus lanes. In keeping with the CPDP’s mandate to utilize reduced cross sections where possible, a 36 m ROW is assumed as a feasible ROW for Highway 7, that can satisfy its transport functions, respond to the preservation of existing built and features, create an appropriate streetscape for future built form and support transit and pedestrian needs. In keeping with Durham Region’s Arterial Corridor Guidelines (Feb. 2007), a cross section similar to Street Cross Section #11 (see Appendix) is envisioned. A 36m cross section permits a significant landscaped boulevard, for tree planting and enhancement of existing agricultural tree plantings and hedgerows. Full access intersections are limited along Hwy 7. Therefore, sites with Hwy 7 frontage will be accessed from an internal local road system. These Guidelines require that building and landscaping design along this Hwy 7 frontage are to create building ‘fronts’, be of high quality, with screening of parking and service areas.
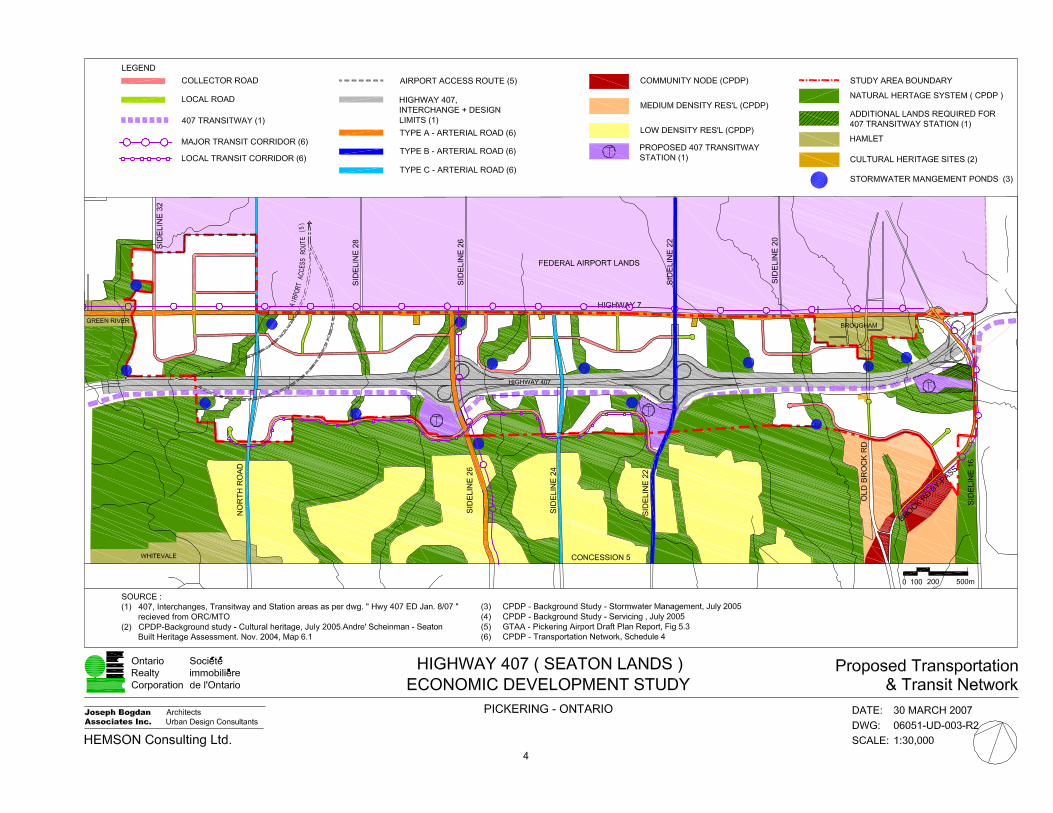
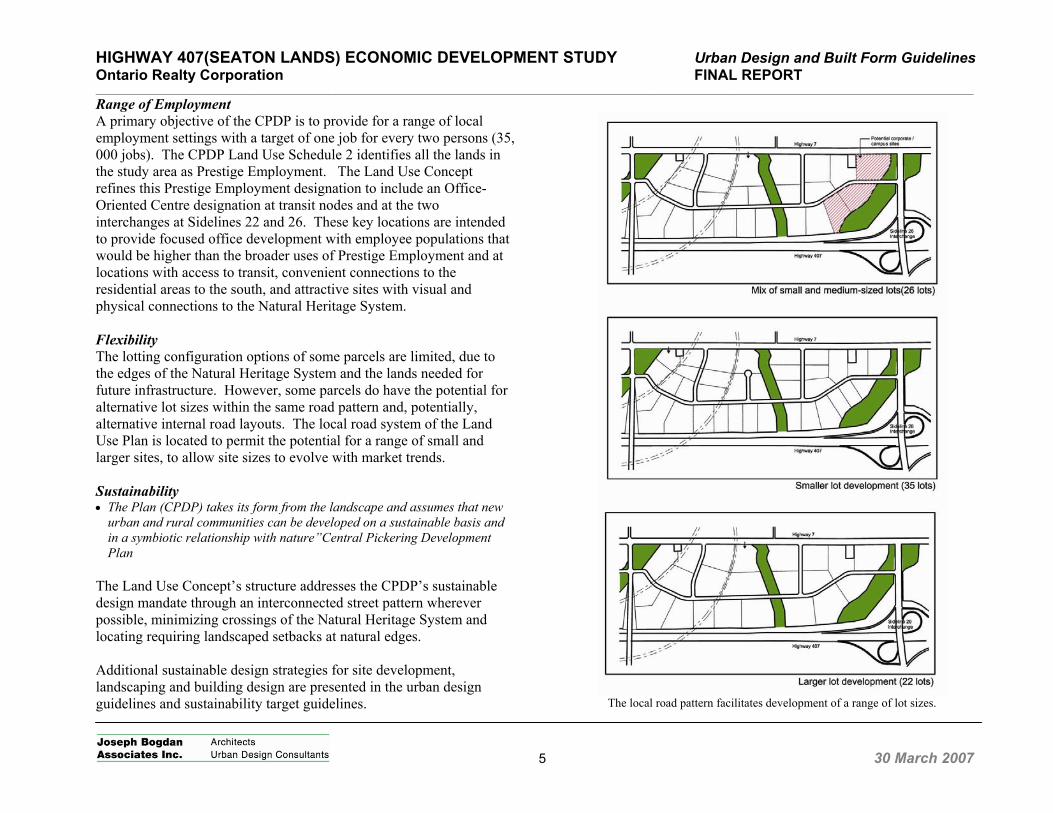
HIGHWAY 407(SEATON LANDS) ECONOMIC DEVELOPMENT STUDY Urban Design and Built Form Guidelines Ontario Realty Corporation FINAL REPORT _____________________________________________________________________________________________________________________________________________________________________
5 30 March 2007
Range of Employment A primary objective of the CPDP is to provide for a range of local employment settings with a target of one job for every two persons (35, 000 jobs). The CPDP Land Use Schedule 2 identifies all the lands in the study area as Prestige Employment. The Land Use Concept refines this Prestige Employment designation to include an Office-Oriented Centre designation at transit nodes and at the two interchanges at Sidelines 22 and 26. These key locations are intended to provide focused office development with employee populations that would be higher than the broader uses of Prestige Employment and at locations with access to transit, convenient connections to the residential areas to the south, and attractive sites with visual and physical connections to the Natural Heritage System. Flexibility The lotting configuration options of some parcels are limited, due to the edges of the Natural Heritage System and the lands needed for future infrastructure. However, some parcels do have the potential for alternative lot sizes within the same road pattern and, potentially, alternative internal road layouts. The local road system of the Land Use Plan is located to permit the potential for a range of small and larger sites, to allow site sizes to evolve with market trends. Sustainability • The Plan (CPDP) takes its form from the landscape and assumes that new
urban and rural communities can be developed on a sustainable basis and in a symbiotic relationship with nature”Central Pickering Development Plan
The Land Use Concept’s structure addresses the CPDP’s sustainable design mandate through an interconnected street pattern wherever possible, minimizing crossings of the Natural Heritage System and locating requiring landscaped setbacks at natural edges. Additional sustainable design strategies for site development, landscaping and building design are presented in the urban design guidelines and sustainability target guidelines.
The local road pattern facilitates development of a range of lot sizes.
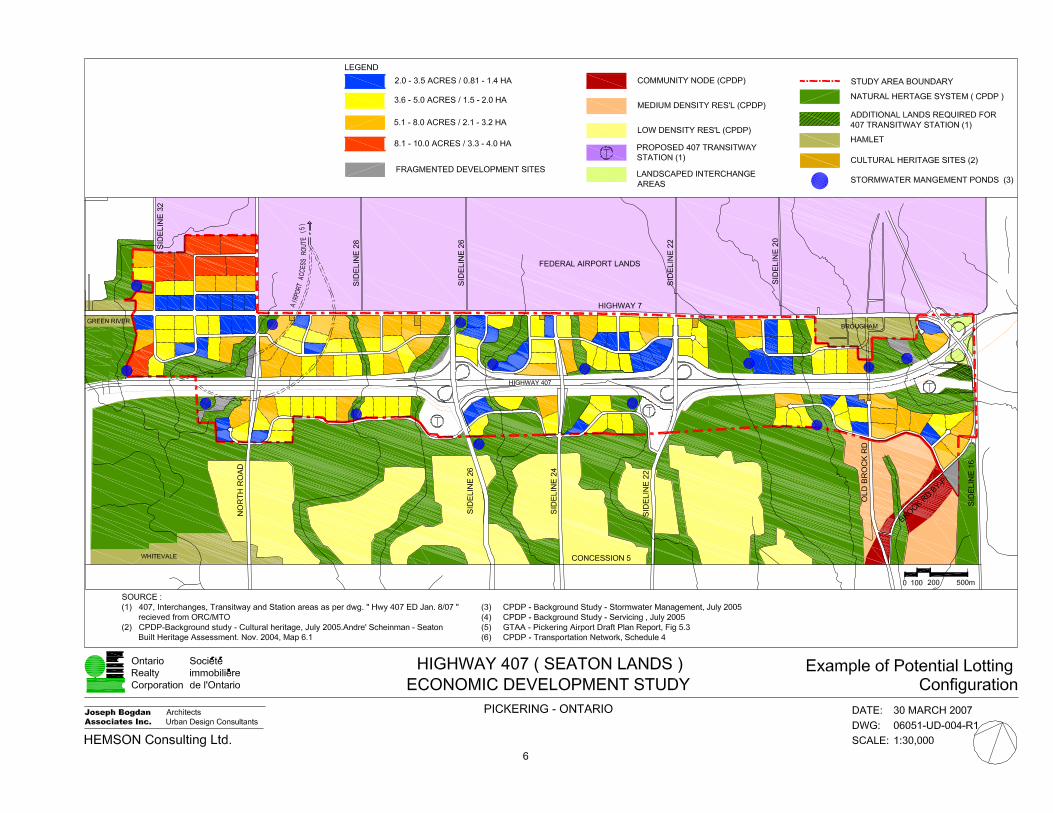
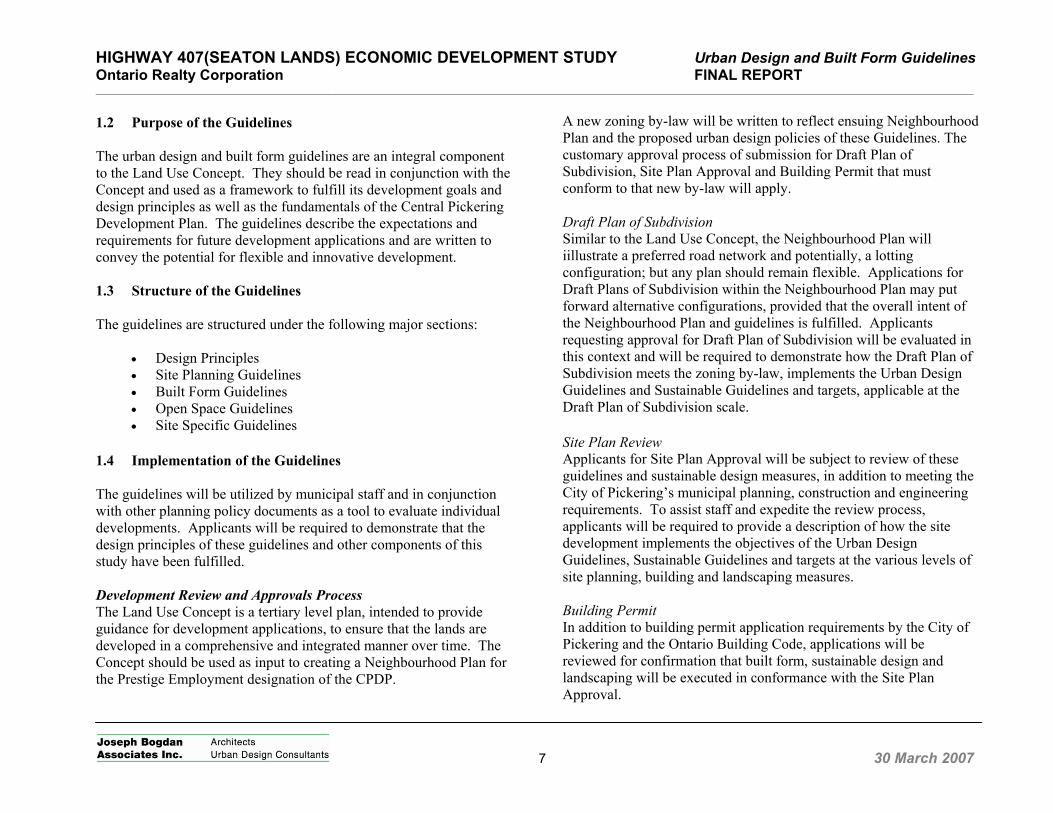
HIGHWAY 407(SEATON LANDS) ECONOMIC DEVELOPMENT STUDY Urban Design and Built Form Guidelines Ontario Realty Corporation FINAL REPORT _____________________________________________________________________________________________________________________________________________________________________
7 30 March 2007
1.2 Purpose of the Guidelines The urban design and built form guidelines are an integral component to the Land Use Concept. They should be read in conjunction with the Concept and used as a framework to fulfill its development goals and design principles as well as the fundamentals of the Central Pickering Development Plan. The guidelines describe the expectations and requirements for future development applications and are written to convey the potential for flexible and innovative development. 1.3 Structure of the Guidelines The guidelines are structured under the following major sections:
• Design Principles • Site Planning Guidelines • Built Form Guidelines • Open Space Guidelines • Site Specific Guidelines
1.4 Implementation of the Guidelines The guidelines will be utilized by municipal staff and in conjunction with other planning policy documents as a tool to evaluate individual developments. Applicants will be required to demonstrate that the design principles of these guidelines and other components of this study have been fulfilled. Development Review and Approvals Process The Land Use Concept is a tertiary level plan, intended to provide guidance for development applications, to ensure that the lands are developed in a comprehensive and integrated manner over time. The Concept should be used as input to creating a Neighbourhood Plan for the Prestige Employment designation of the CPDP.
A new zoning by-law will be written to reflect ensuing Neighbourhood Plan and the proposed urban design policies of these Guidelines. The customary approval process of submission for Draft Plan of Subdivision, Site Plan Approval and Building Permit that must conform to that new by-law will apply. Draft Plan of Subdivision Similar to the Land Use Concept, the Neighbourhood Plan will iillustrate a preferred road network and potentially, a lotting configuration; but any plan should remain flexible. Applications for Draft Plans of Subdivision within the Neighbourhood Plan may put forward alternative configurations, provided that the overall intent of the Neighbourhood Plan and guidelines is fulfilled. Applicants requesting approval for Draft Plan of Subdivision will be evaluated in this context and will be required to demonstrate how the Draft Plan of Subdivision meets the zoning by-law, implements the Urban Design Guidelines and Sustainable Guidelines and targets, applicable at the Draft Plan of Subdivision scale. Site Plan Review Applicants for Site Plan Approval will be subject to review of these guidelines and sustainable design measures, in addition to meeting the City of Pickering’s municipal planning, construction and engineering requirements. To assist staff and expedite the review process, applicants will be required to provide a description of how the site development implements the objectives of the Urban Design Guidelines, Sustainable Guidelines and targets at the various levels of site planning, building and landscaping measures. Building Permit In addition to building permit application requirements by the City of Pickering and the Ontario Building Code, applications will be reviewed for confirmation that built form, sustainable design and landscaping will be executed in conformance with the Site Plan Approval.
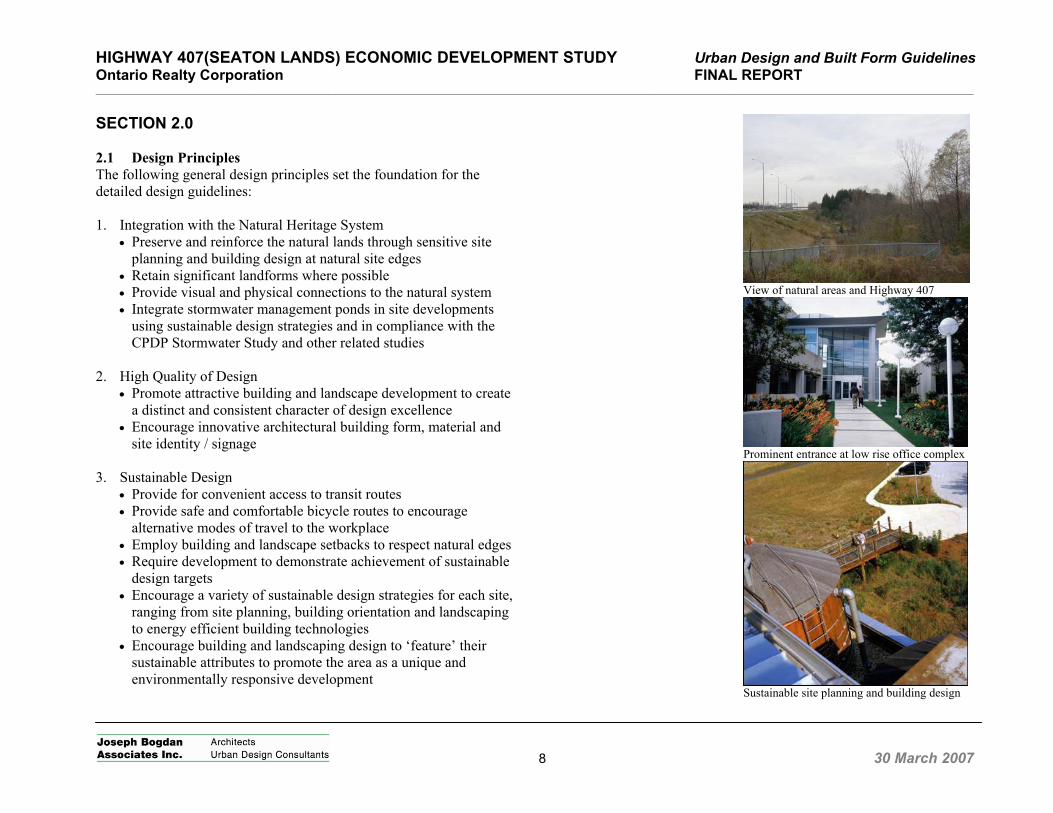
HIGHWAY 407(SEATON LANDS) ECONOMIC DEVELOPMENT STUDY Urban Design and Built Form Guidelines Ontario Realty Corporation FINAL REPORT _____________________________________________________________________________________________________________________________________________________________________
8 30 March 2007
SECTION 2.0 2.1 Design Principles The following general design principles set the foundation for the detailed design guidelines: 1. Integration with the Natural Heritage System
• Preserve and reinforce the natural lands through sensitive site planning and building design at natural site edges
• Retain significant landforms where possible • Provide visual and physical connections to the natural system • Integrate stormwater management ponds in site developments
using sustainable design strategies and in compliance with the CPDP Stormwater Study and other related studies
2. High Quality of Design
• Promote attractive building and landscape development to create a distinct and consistent character of design excellence
• Encourage innovative architectural building form, material and site identity / signage
3. Sustainable Design
• Provide for convenient access to transit routes • Provide safe and comfortable bicycle routes to encourage
alternative modes of travel to the workplace • Employ building and landscape setbacks to respect natural edges • Require development to demonstrate achievement of sustainable
design targets • Encourage a variety of sustainable design strategies for each site,
ranging from site planning, building orientation and landscaping to energy efficient building technologies
• Encourage building and landscaping design to ‘feature’ their sustainable attributes to promote the area as a unique and environmentally responsive development
View of natural areas and Highway 407
Prominent entrance at low rise office complex
Sustainable site planning and building design
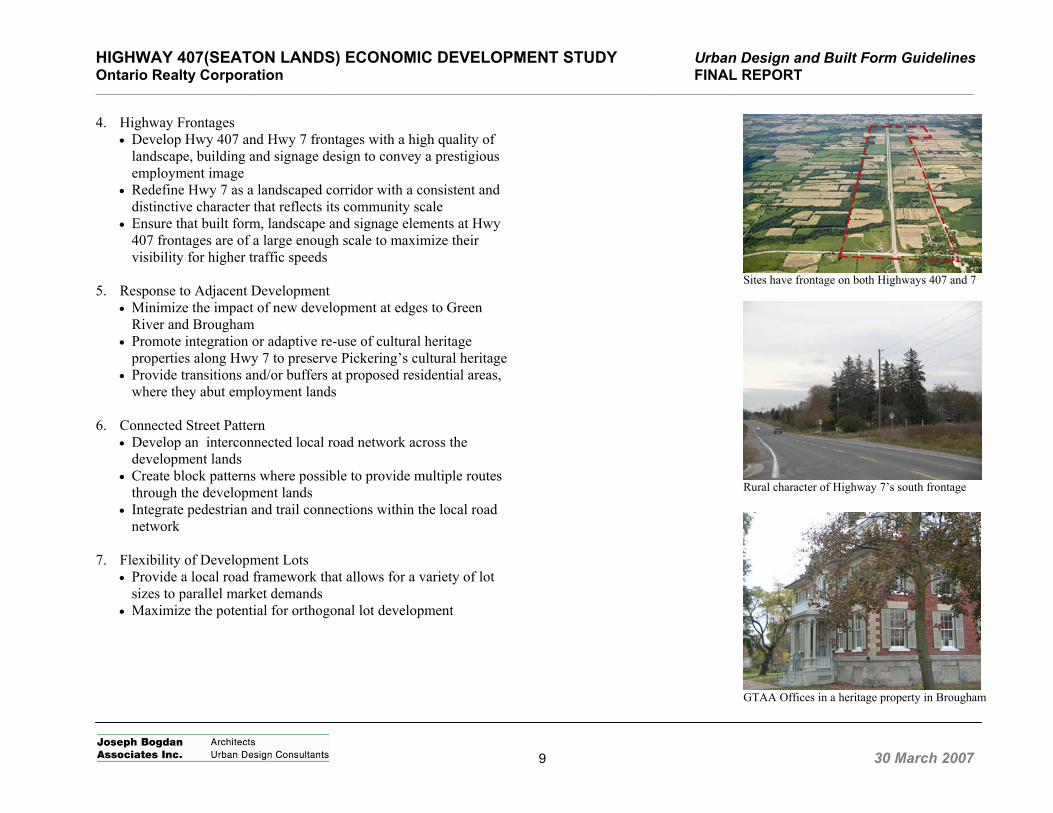
HIGHWAY 407(SEATON LANDS) ECONOMIC DEVELOPMENT STUDY Urban Design and Built Form Guidelines Ontario Realty Corporation FINAL REPORT _____________________________________________________________________________________________________________________________________________________________________
9 30 March 2007
4. Highway Frontages
• Develop Hwy 407 and Hwy 7 frontages with a high quality of landscape, building and signage design to convey a prestigious employment image
• Redefine Hwy 7 as a landscaped corridor with a consistent and distinctive character that reflects its community scale
• Ensure that built form, landscape and signage elements at Hwy 407 frontages are of a large enough scale to maximize their visibility for higher traffic speeds
5. Response to Adjacent Development
• Minimize the impact of new development at edges to Green River and Brougham
• Promote integration or adaptive re-use of cultural heritage properties along Hwy 7 to preserve Pickering’s cultural heritage
• Provide transitions and/or buffers at proposed residential areas, where they abut employment lands
6. Connected Street Pattern
• Develop an interconnected local road network across the development lands
• Create block patterns where possible to provide multiple routes through the development lands
• Integrate pedestrian and trail connections within the local road network
7. Flexibility of Development Lots
• Provide a local road framework that allows for a variety of lot sizes to parallel market demands
• Maximize the potential for orthogonal lot development
Sites have frontage on both Highways 407 and 7
Rural character of Highway 7’s south frontage
GTAA Offices in a heritage property in Brougham
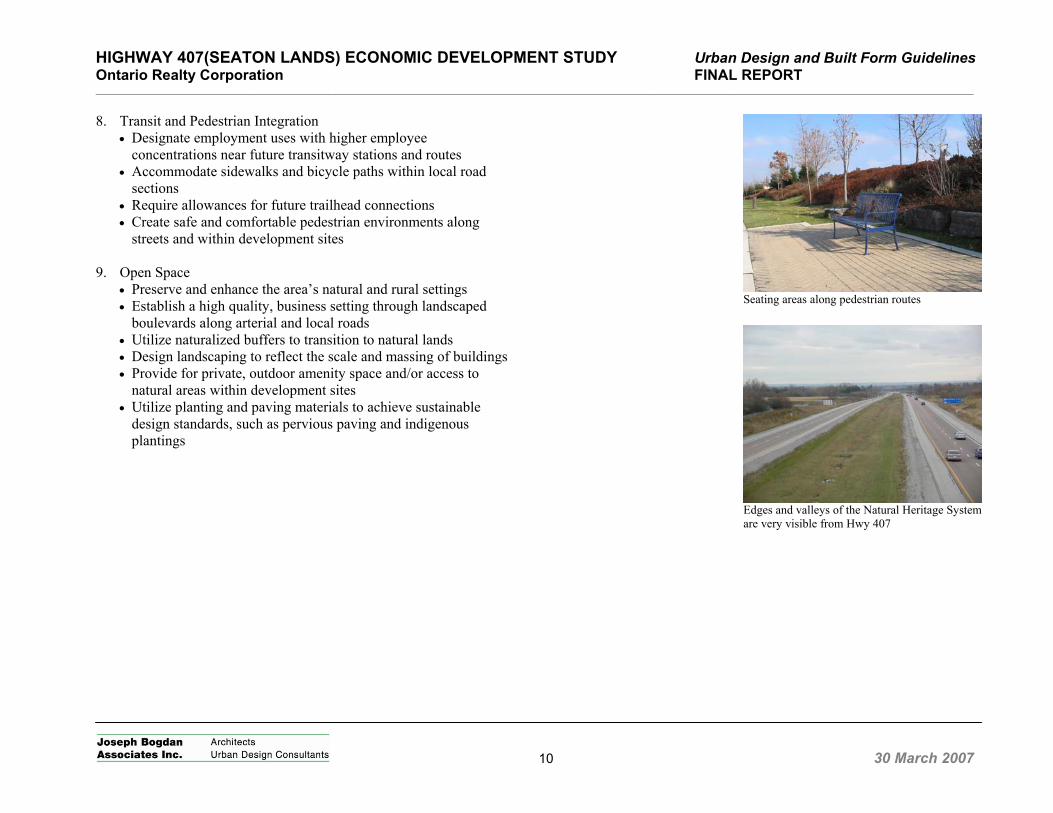
HIGHWAY 407(SEATON LANDS) ECONOMIC DEVELOPMENT STUDY Urban Design and Built Form Guidelines Ontario Realty Corporation FINAL REPORT _____________________________________________________________________________________________________________________________________________________________________
10 30 March 2007
8. Transit and Pedestrian Integration
• Designate employment uses with higher employee concentrations near future transitway stations and routes
• Accommodate sidewalks and bicycle paths within local road sections
• Require allowances for future trailhead connections • Create safe and comfortable pedestrian environments along
streets and within development sites 9. Open Space
• Preserve and enhance the area’s natural and rural settings • Establish a high quality, business setting through landscaped
boulevards along arterial and local roads • Utilize naturalized buffers to transition to natural lands • Design landscaping to reflect the scale and massing of buildings • Provide for private, outdoor amenity space and/or access to
natural areas within development sites • Utilize planting and paving materials to achieve sustainable
design standards, such as pervious paving and indigenous plantings
Seating areas along pedestrian routes
Edges and valleys of the Natural Heritage System are very visible from Hwy 407
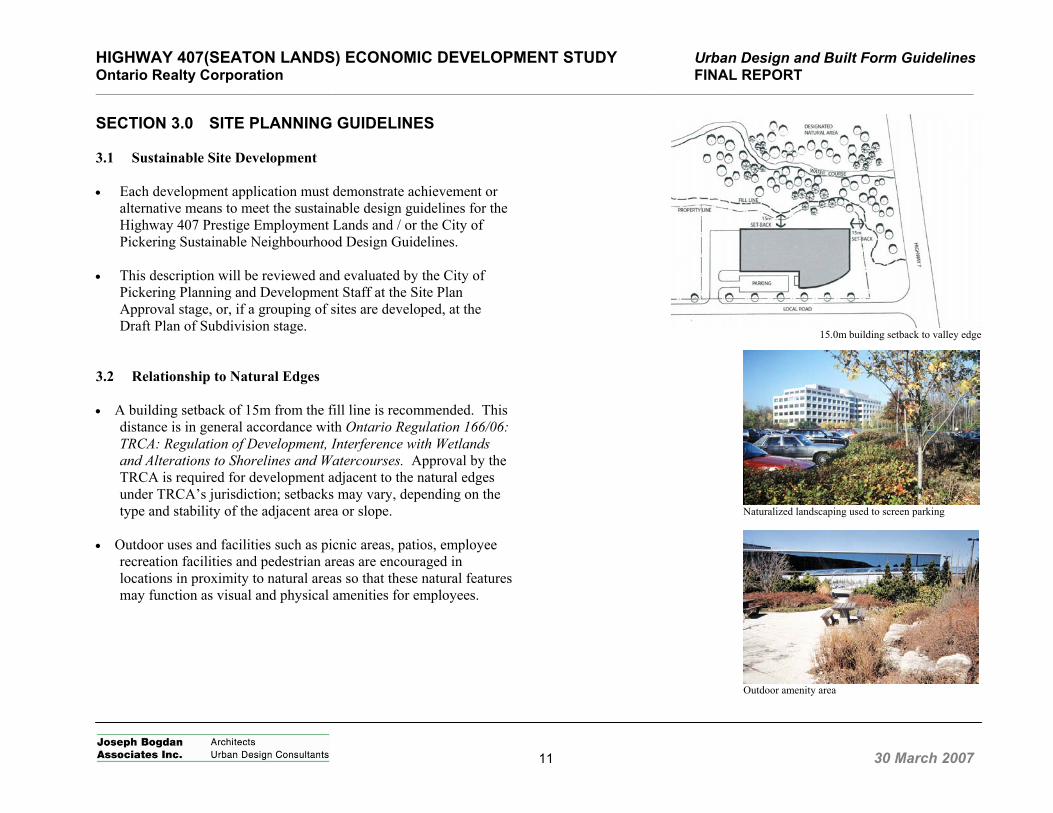
HIGHWAY 407(SEATON LANDS) ECONOMIC DEVELOPMENT STUDY Urban Design and Built Form Guidelines Ontario Realty Corporation FINAL REPORT _____________________________________________________________________________________________________________________________________________________________________
11 30 March 2007
SECTION 3.0 SITE PLANNING GUIDELINES 3.1 Sustainable Site Development • Each development application must demonstrate achievement or
alternative means to meet the sustainable design guidelines for the Highway 407 Prestige Employment Lands and / or the City of Pickering Sustainable Neighbourhood Design Guidelines.
• This description will be reviewed and evaluated by the City of
Pickering Planning and Development Staff at the Site Plan Approval stage, or, if a grouping of sites are developed, at the Draft Plan of Subdivision stage.
3.2 Relationship to Natural Edges • A building setback of 15m from the fill line is recommended. This
distance is in general accordance with Ontario Regulation 166/06: TRCA: Regulation of Development, Interference with Wetlands and Alterations to Shorelines and Watercourses. Approval by the TRCA is required for development adjacent to the natural edges under TRCA’s jurisdiction; setbacks may vary, depending on the type and stability of the adjacent area or slope.
• Outdoor uses and facilities such as picnic areas, patios, employee
recreation facilities and pedestrian areas are encouraged in locations in proximity to natural areas so that these natural features may function as visual and physical amenities for employees.
15.0m building setback to valley edge
Naturalized landscaping used to screen parking
Outdoor amenity area
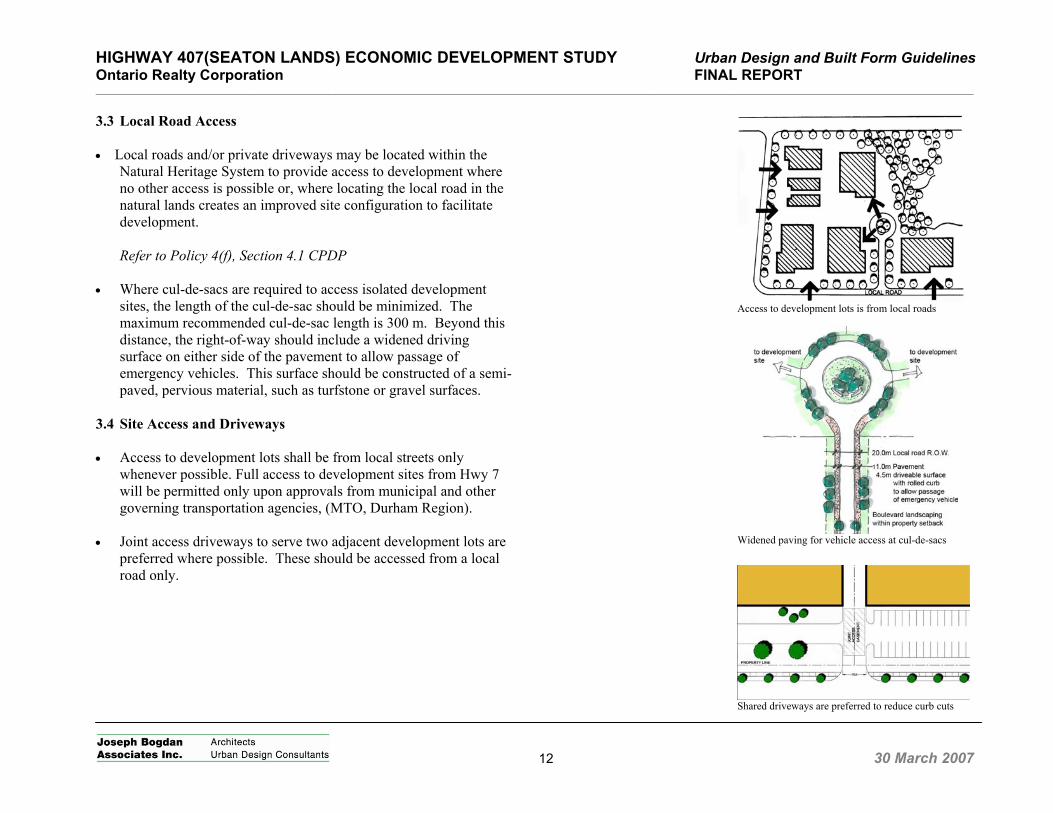
HIGHWAY 407(SEATON LANDS) ECONOMIC DEVELOPMENT STUDY Urban Design and Built Form Guidelines Ontario Realty Corporation FINAL REPORT _____________________________________________________________________________________________________________________________________________________________________
12 30 March 2007
3.3 Local Road Access • Local roads and/or private driveways may be located within the
Natural Heritage System to provide access to development where no other access is possible or, where locating the local road in the natural lands creates an improved site configuration to facilitate development.
Refer to Policy 4(f), Section 4.1 CPDP
• Where cul-de-sacs are required to access isolated development sites, the length of the cul-de-sac should be minimized. The maximum recommended cul-de-sac length is 300 m. Beyond this distance, the right-of-way should include a widened driving surface on either side of the pavement to allow passage of emergency vehicles. This surface should be constructed of a semi-paved, pervious material, such as turfstone or gravel surfaces.
3.4 Site Access and Driveways • Access to development lots shall be from local streets only
whenever possible. Full access to development sites from Hwy 7 will be permitted only upon approvals from municipal and other governing transportation agencies, (MTO, Durham Region).
• Joint access driveways to serve two adjacent development lots are
preferred where possible. These should be accessed from a local road only.
Access to development lots is from local roads
Widened paving for vehicle access at cul-de-sacs
Shared driveways are preferred to reduce curb cuts
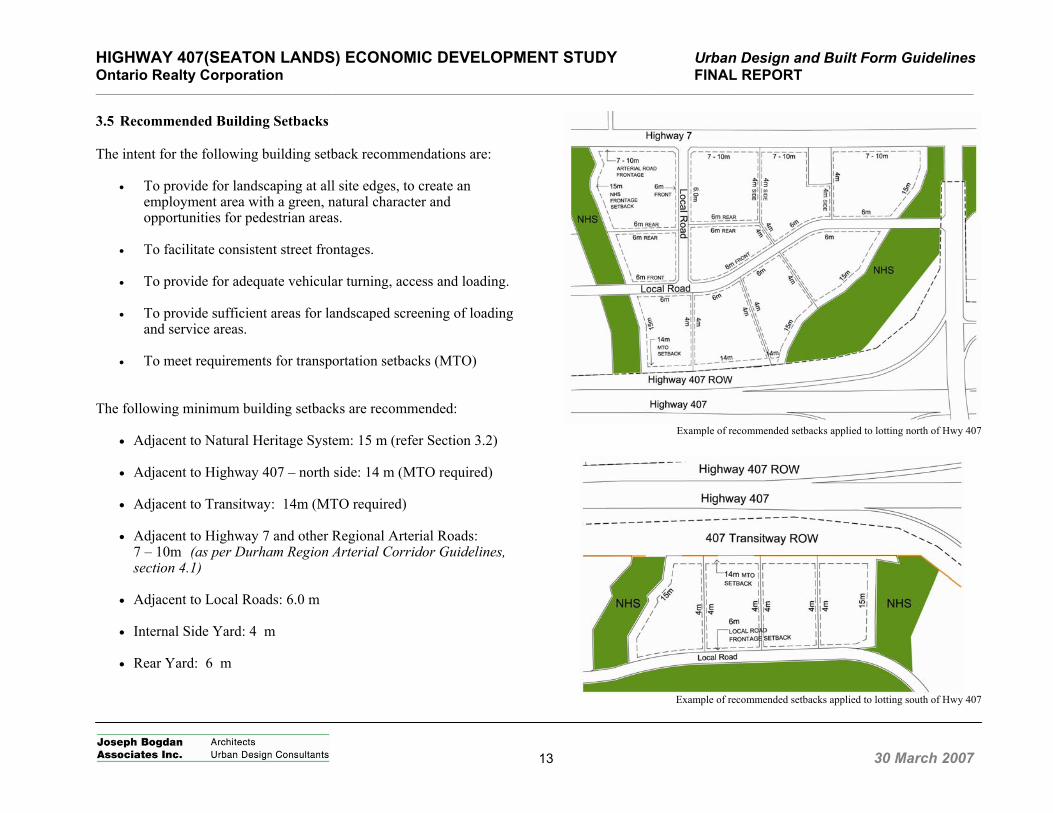
HIGHWAY 407(SEATON LANDS) ECONOMIC DEVELOPMENT STUDY Urban Design and Built Form Guidelines Ontario Realty Corporation FINAL REPORT _____________________________________________________________________________________________________________________________________________________________________
13 30 March 2007
3.5 Recommended Building Setbacks The intent for the following building setback recommendations are:
• To provide for landscaping at all site edges, to create an employment area with a green, natural character and opportunities for pedestrian areas.
• To facilitate consistent street frontages.
• To provide for adequate vehicular turning, access and loading.
• To provide sufficient areas for landscaped screening of loading
and service areas.
• To meet requirements for transportation setbacks (MTO) The following minimum building setbacks are recommended:
• Adjacent to Natural Heritage System: 15 m (refer Section 3.2)
• Adjacent to Highway 407 – north side: 14 m (MTO required)
• Adjacent to Transitway: 14m (MTO required) • Adjacent to Highway 7 and other Regional Arterial Roads:
7 – 10m (as per Durham Region Arterial Corridor Guidelines, section 4.1)
• Adjacent to Local Roads: 6.0 m • Internal Side Yard: 4 m • Rear Yard: 6 m
Example of recommended setbacks applied to lotting north of Hwy 407
Example of recommended setbacks applied to lotting south of Hwy 407
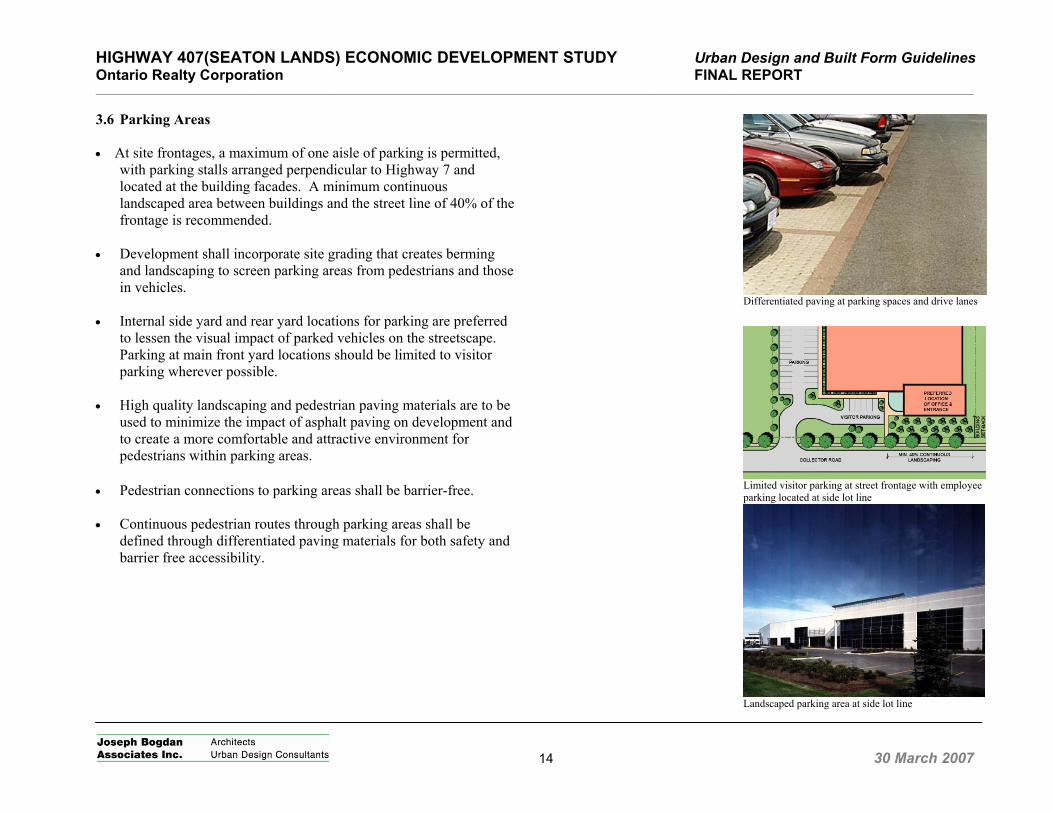
HIGHWAY 407(SEATON LANDS) ECONOMIC DEVELOPMENT STUDY Urban Design and Built Form Guidelines Ontario Realty Corporation FINAL REPORT _____________________________________________________________________________________________________________________________________________________________________
14 30 March 2007
3.6 Parking Areas • At site frontages, a maximum of one aisle of parking is permitted,
with parking stalls arranged perpendicular to Highway 7 and located at the building facades. A minimum continuous landscaped area between buildings and the street line of 40% of the frontage is recommended.
• Development shall incorporate site grading that creates berming
and landscaping to screen parking areas from pedestrians and those in vehicles.
• Internal side yard and rear yard locations for parking are preferred
to lessen the visual impact of parked vehicles on the streetscape. Parking at main front yard locations should be limited to visitor parking wherever possible.
• High quality landscaping and pedestrian paving materials are to be
used to minimize the impact of asphalt paving on development and to create a more comfortable and attractive environment for pedestrians within parking areas.
• Pedestrian connections to parking areas shall be barrier-free. • Continuous pedestrian routes through parking areas shall be
defined through differentiated paving materials for both safety and barrier free accessibility.
Differentiated paving at parking spaces and drive lanes
Limited visitor parking at street frontage with employee parking located at side lot line
Landscaped parking area at side lot line
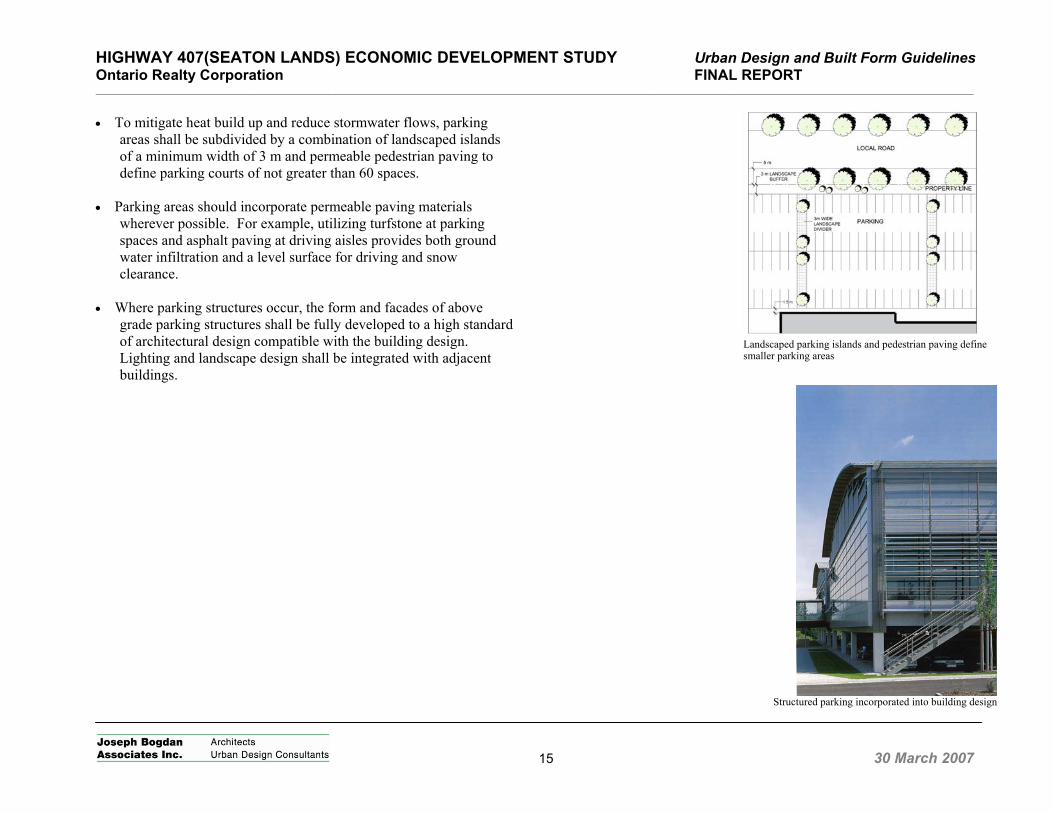
HIGHWAY 407(SEATON LANDS) ECONOMIC DEVELOPMENT STUDY Urban Design and Built Form Guidelines Ontario Realty Corporation FINAL REPORT _____________________________________________________________________________________________________________________________________________________________________
15 30 March 2007
• To mitigate heat build up and reduce stormwater flows, parking
areas shall be subdivided by a combination of landscaped islands of a minimum width of 3 m and permeable pedestrian paving to define parking courts of not greater than 60 spaces.
• Parking areas should incorporate permeable paving materials
wherever possible. For example, utilizing turfstone at parking spaces and asphalt paving at driving aisles provides both ground water infiltration and a level surface for driving and snow clearance.
• Where parking structures occur, the form and facades of above
grade parking structures shall be fully developed to a high standard of architectural design compatible with the building design. Lighting and landscape design shall be integrated with adjacent buildings.
Landscaped parking islands and pedestrian paving define smaller parking areas
Structured parking incorporated into building design
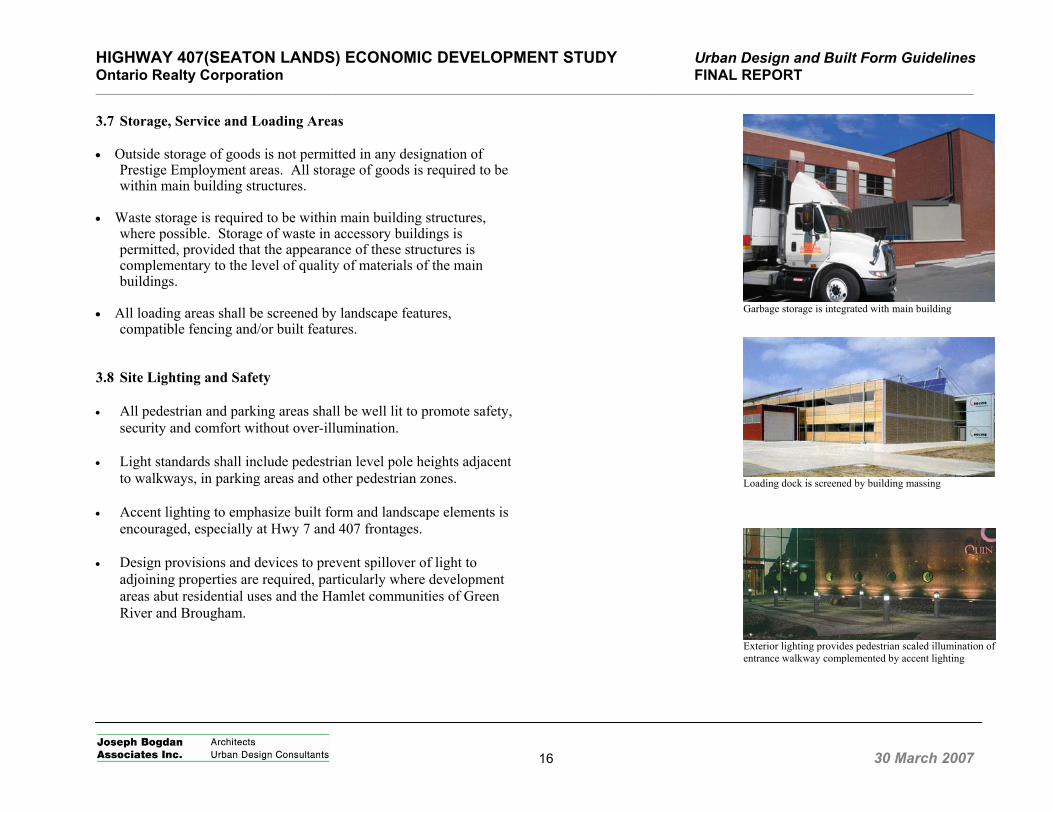
HIGHWAY 407(SEATON LANDS) ECONOMIC DEVELOPMENT STUDY Urban Design and Built Form Guidelines Ontario Realty Corporation FINAL REPORT _____________________________________________________________________________________________________________________________________________________________________
16 30 March 2007
3.7 Storage, Service and Loading Areas • Outside storage of goods is not permitted in any designation of
Prestige Employment areas. All storage of goods is required to be within main building structures.
• Waste storage is required to be within main building structures,
where possible. Storage of waste in accessory buildings is permitted, provided that the appearance of these structures is complementary to the level of quality of materials of the main buildings.
• All loading areas shall be screened by landscape features,
compatible fencing and/or built features. 3.8 Site Lighting and Safety • All pedestrian and parking areas shall be well lit to promote safety,
security and comfort without over-illumination. • Light standards shall include pedestrian level pole heights adjacent
to walkways, in parking areas and other pedestrian zones. • Accent lighting to emphasize built form and landscape elements is
encouraged, especially at Hwy 7 and 407 frontages. • Design provisions and devices to prevent spillover of light to
adjoining properties are required, particularly where development areas abut residential uses and the Hamlet communities of Green River and Brougham.
Garbage storage is integrated with main building
Loading dock is screened by building massing
Exterior lighting provides pedestrian scaled illumination of entrance walkway complemented by accent lighting
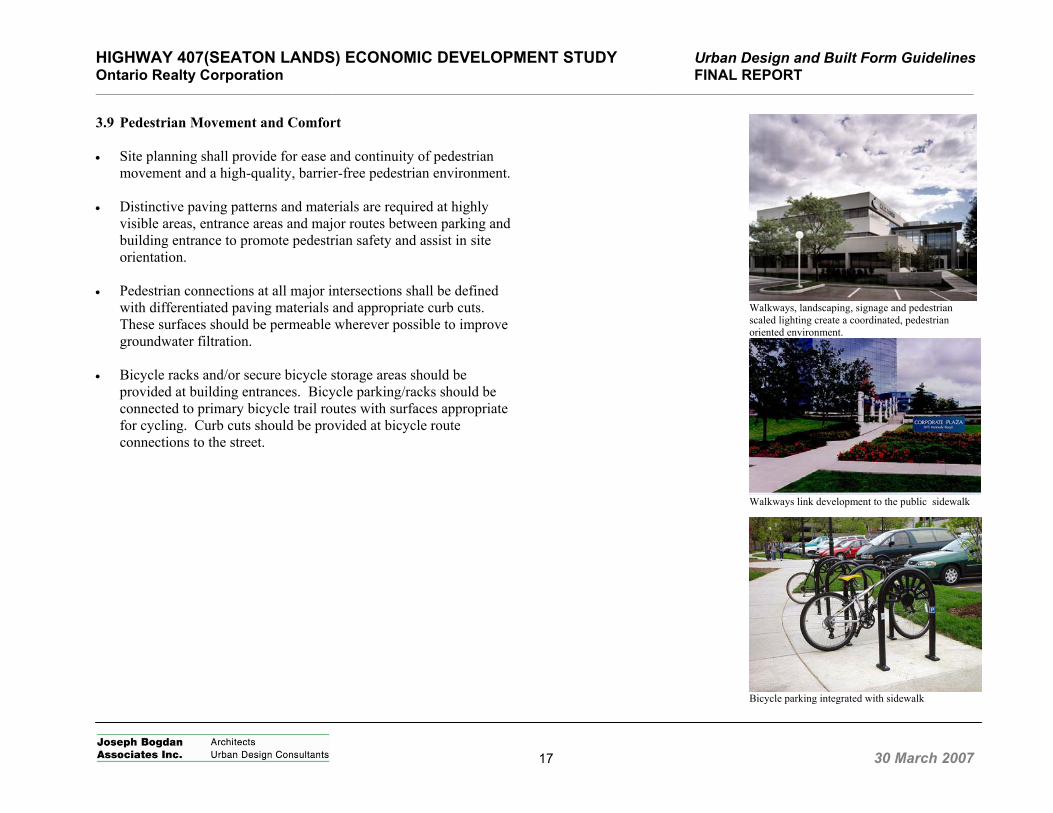
HIGHWAY 407(SEATON LANDS) ECONOMIC DEVELOPMENT STUDY Urban Design and Built Form Guidelines Ontario Realty Corporation FINAL REPORT _____________________________________________________________________________________________________________________________________________________________________
17 30 March 2007
3.9 Pedestrian Movement and Comfort
• Site planning shall provide for ease and continuity of pedestrian
movement and a high-quality, barrier-free pedestrian environment. • Distinctive paving patterns and materials are required at highly
visible areas, entrance areas and major routes between parking and building entrance to promote pedestrian safety and assist in site orientation.
• Pedestrian connections at all major intersections shall be defined with differentiated paving materials and appropriate curb cuts. These surfaces should be permeable wherever possible to improve groundwater filtration.
• Bicycle racks and/or secure bicycle storage areas should be
provided at building entrances. Bicycle parking/racks should be connected to primary bicycle trail routes with surfaces appropriate for cycling. Curb cuts should be provided at bicycle route connections to the street.
Walkways, landscaping, signage and pedestrian scaled lighting create a coordinated, pedestrian oriented environment.
Walkways link development to the public sidewalk
Bicycle parking integrated with sidewalk
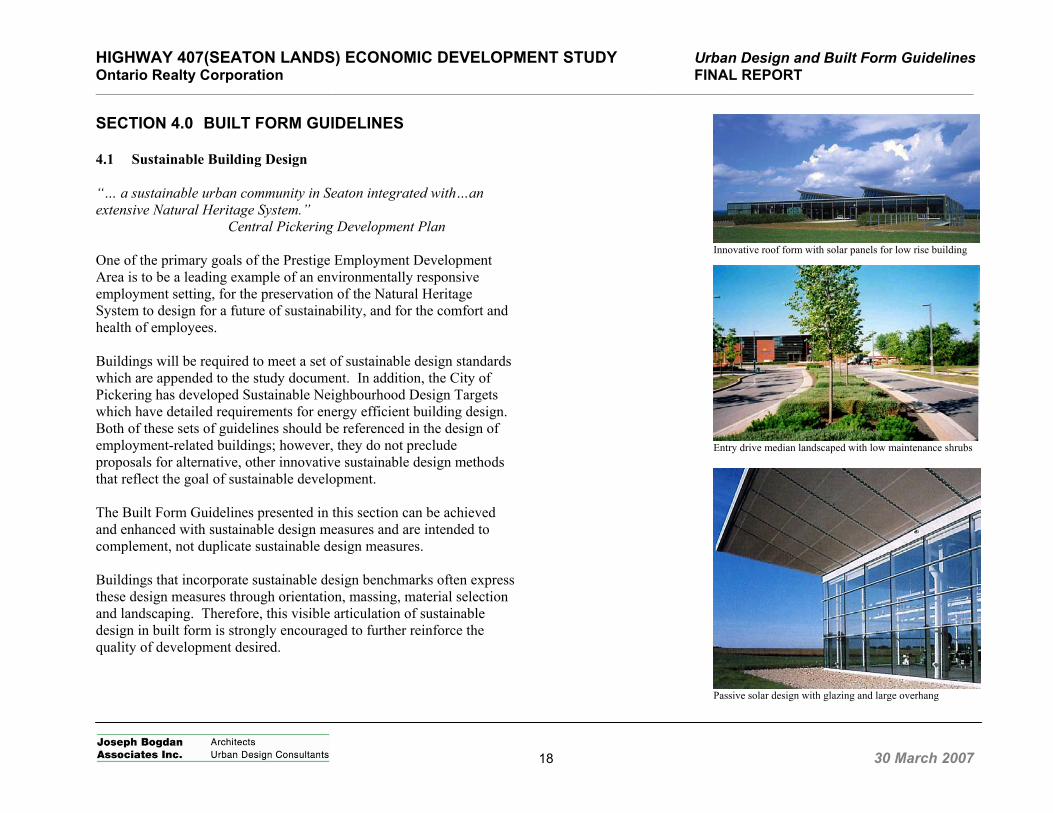
HIGHWAY 407(SEATON LANDS) ECONOMIC DEVELOPMENT STUDY Urban Design and Built Form Guidelines Ontario Realty Corporation FINAL REPORT _____________________________________________________________________________________________________________________________________________________________________
18 30 March 2007
SECTION 4.0 BUILT FORM GUIDELINES 4.1 Sustainable Building Design “… a sustainable urban community in Seaton integrated with…an extensive Natural Heritage System.” Central Pickering Development Plan One of the primary goals of the Prestige Employment Development Area is to be a leading example of an environmentally responsive employment setting, for the preservation of the Natural Heritage System to design for a future of sustainability, and for the comfort and health of employees. Buildings will be required to meet a set of sustainable design standards which are appended to the study document. In addition, the City of Pickering has developed Sustainable Neighbourhood Design Targets which have detailed requirements for energy efficient building design. Both of these sets of guidelines should be referenced in the design of employment-related buildings; however, they do not preclude proposals for alternative, other innovative sustainable design methods that reflect the goal of sustainable development. The Built Form Guidelines presented in this section can be achieved and enhanced with sustainable design measures and are intended to complement, not duplicate sustainable design measures. Buildings that incorporate sustainable design benchmarks often express these design measures through orientation, massing, material selection and landscaping. Therefore, this visible articulation of sustainable design in built form is strongly encouraged to further reinforce the quality of development desired.
Innovative roof form with solar panels for low rise building
Entry drive median landscaped with low maintenance shrubs
Passive solar design with glazing and large overhang
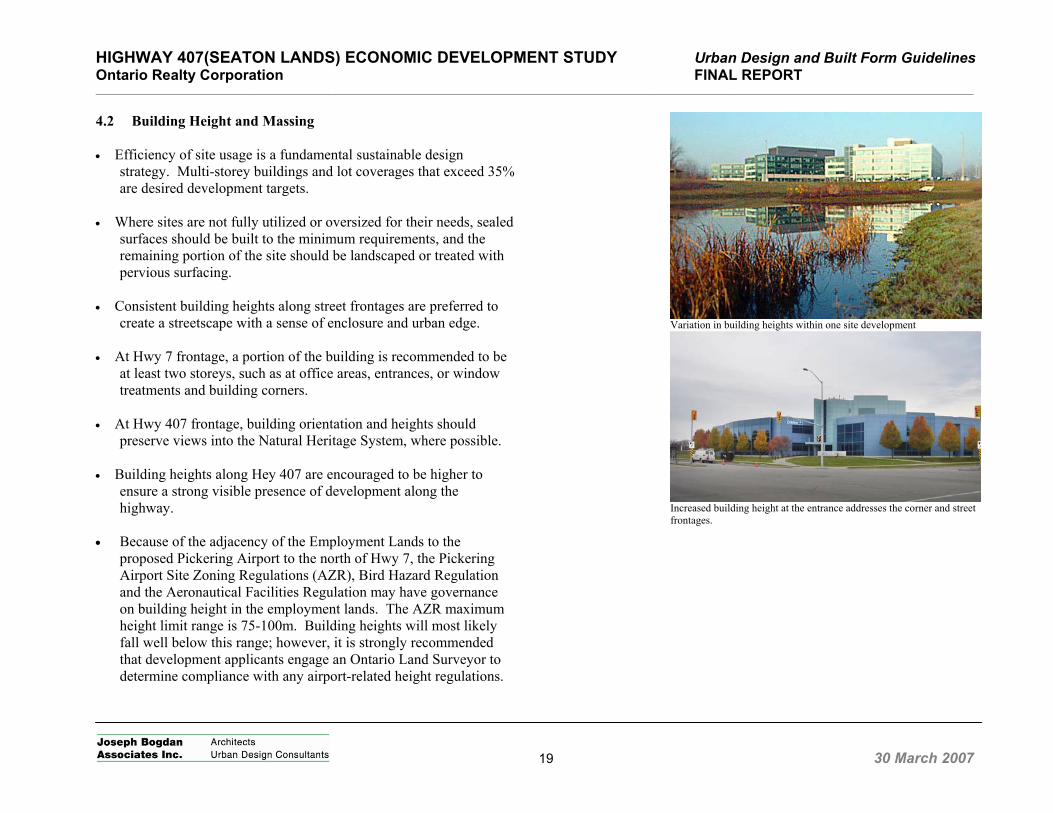
HIGHWAY 407(SEATON LANDS) ECONOMIC DEVELOPMENT STUDY Urban Design and Built Form Guidelines Ontario Realty Corporation FINAL REPORT _____________________________________________________________________________________________________________________________________________________________________
19 30 March 2007
4.2 Building Height and Massing • Efficiency of site usage is a fundamental sustainable design
strategy. Multi-storey buildings and lot coverages that exceed 35% are desired development targets.
• Where sites are not fully utilized or oversized for their needs, sealed
surfaces should be built to the minimum requirements, and the remaining portion of the site should be landscaped or treated with pervious surfacing.
• Consistent building heights along street frontages are preferred to
create a streetscape with a sense of enclosure and urban edge. • At Hwy 7 frontage, a portion of the building is recommended to be
at least two storeys, such as at office areas, entrances, or window treatments and building corners.
• At Hwy 407 frontage, building orientation and heights should
preserve views into the Natural Heritage System, where possible. • Building heights along Hey 407 are encouraged to be higher to
ensure a strong visible presence of development along the highway.
• Because of the adjacency of the Employment Lands to the
proposed Pickering Airport to the north of Hwy 7, the Pickering Airport Site Zoning Regulations (AZR), Bird Hazard Regulation and the Aeronautical Facilities Regulation may have governance on building height in the employment lands. The AZR maximum height limit range is 75-100m. Building heights will most likely fall well below this range; however, it is strongly recommended that development applicants engage an Ontario Land Surveyor to determine compliance with any airport-related height regulations.
Variation in building heights within one site development
Increased building height at the entrance addresses the corner and street frontages.
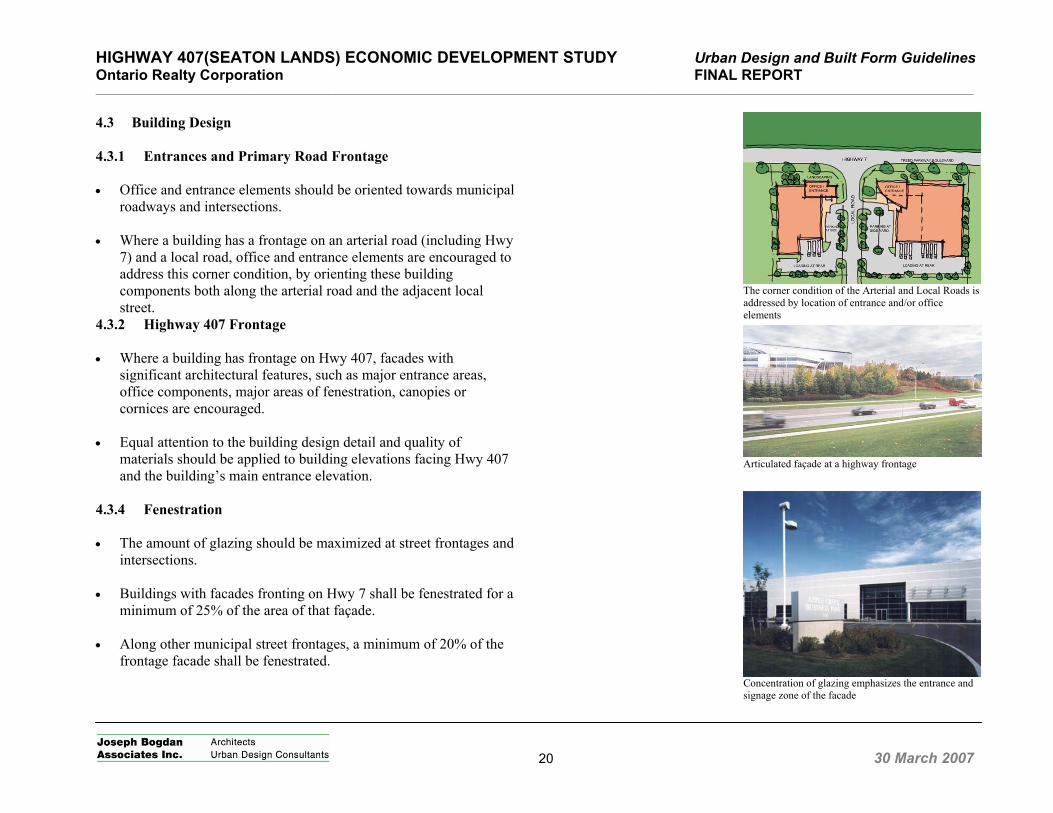
HIGHWAY 407(SEATON LANDS) ECONOMIC DEVELOPMENT STUDY Urban Design and Built Form Guidelines Ontario Realty Corporation FINAL REPORT _____________________________________________________________________________________________________________________________________________________________________
20 30 March 2007
4.3 Building Design 4.3.1 Entrances and Primary Road Frontage • Office and entrance elements should be oriented towards municipal
roadways and intersections. • Where a building has a frontage on an arterial road (including Hwy
7) and a local road, office and entrance elements are encouraged to address this corner condition, by orienting these building components both along the arterial road and the adjacent local street.
4.3.2 Highway 407 Frontage • Where a building has frontage on Hwy 407, facades with
significant architectural features, such as major entrance areas, office components, major areas of fenestration, canopies or cornices are encouraged.
• Equal attention to the building design detail and quality of
materials should be applied to building elevations facing Hwy 407 and the building’s main entrance elevation.
4.3.4 Fenestration • The amount of glazing should be maximized at street frontages and
intersections. • Buildings with facades fronting on Hwy 7 shall be fenestrated for a
minimum of 25% of the area of that façade. • Along other municipal street frontages, a minimum of 20% of the
frontage facade shall be fenestrated.
The corner condition of the Arterial and Local Roads is addressed by location of entrance and/or office elements
Articulated façade at a highway frontage
Concentration of glazing emphasizes the entrance and signage zone of the facade
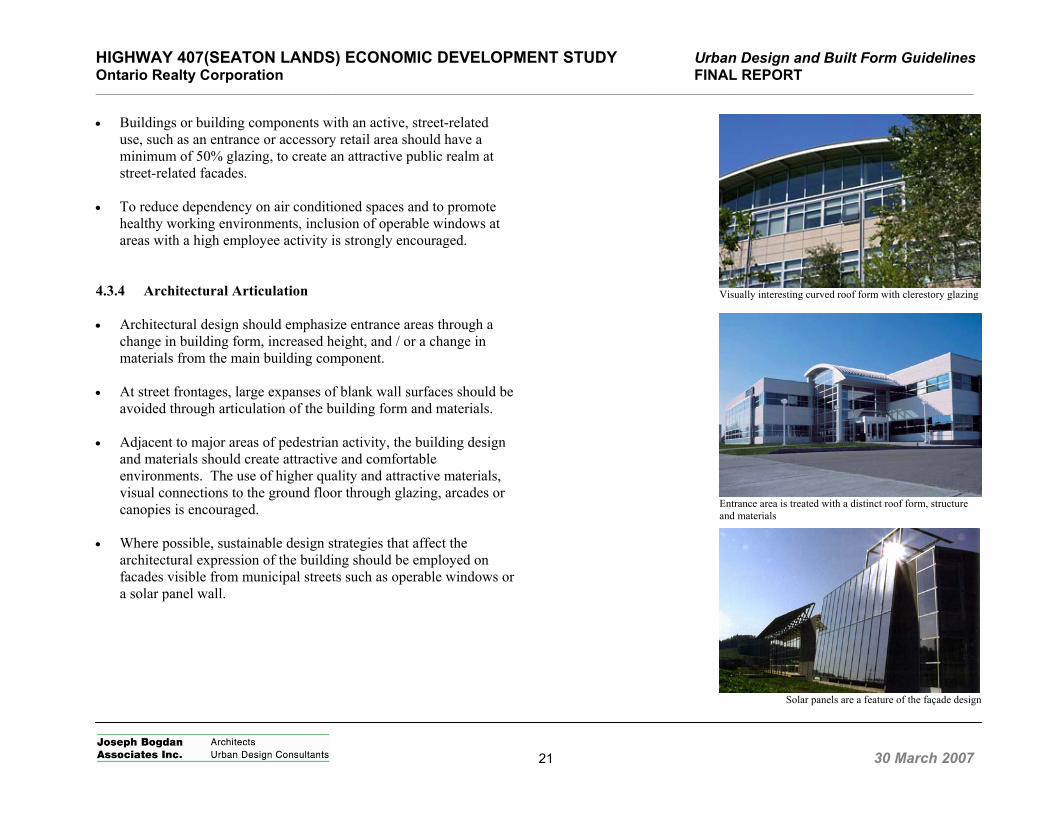
HIGHWAY 407(SEATON LANDS) ECONOMIC DEVELOPMENT STUDY Urban Design and Built Form Guidelines Ontario Realty Corporation FINAL REPORT _____________________________________________________________________________________________________________________________________________________________________
21 30 March 2007
• Buildings or building components with an active, street-related
use, such as an entrance or accessory retail area should have a minimum of 50% glazing, to create an attractive public realm at street-related facades.
• To reduce dependency on air conditioned spaces and to promote
healthy working environments, inclusion of operable windows at areas with a high employee activity is strongly encouraged.
4.3.4 Architectural Articulation • Architectural design should emphasize entrance areas through a
change in building form, increased height, and / or a change in materials from the main building component.
• At street frontages, large expanses of blank wall surfaces should be
avoided through articulation of the building form and materials. • Adjacent to major areas of pedestrian activity, the building design
and materials should create attractive and comfortable environments. The use of higher quality and attractive materials, visual connections to the ground floor through glazing, arcades or canopies is encouraged.
• Where possible, sustainable design strategies that affect the
architectural expression of the building should be employed on facades visible from municipal streets such as operable windows or a solar panel wall.
Visually interesting curved roof form with clerestory glazing
Entrance area is treated with a distinct roof form, structure and materials
Solar panels are a feature of the façade design
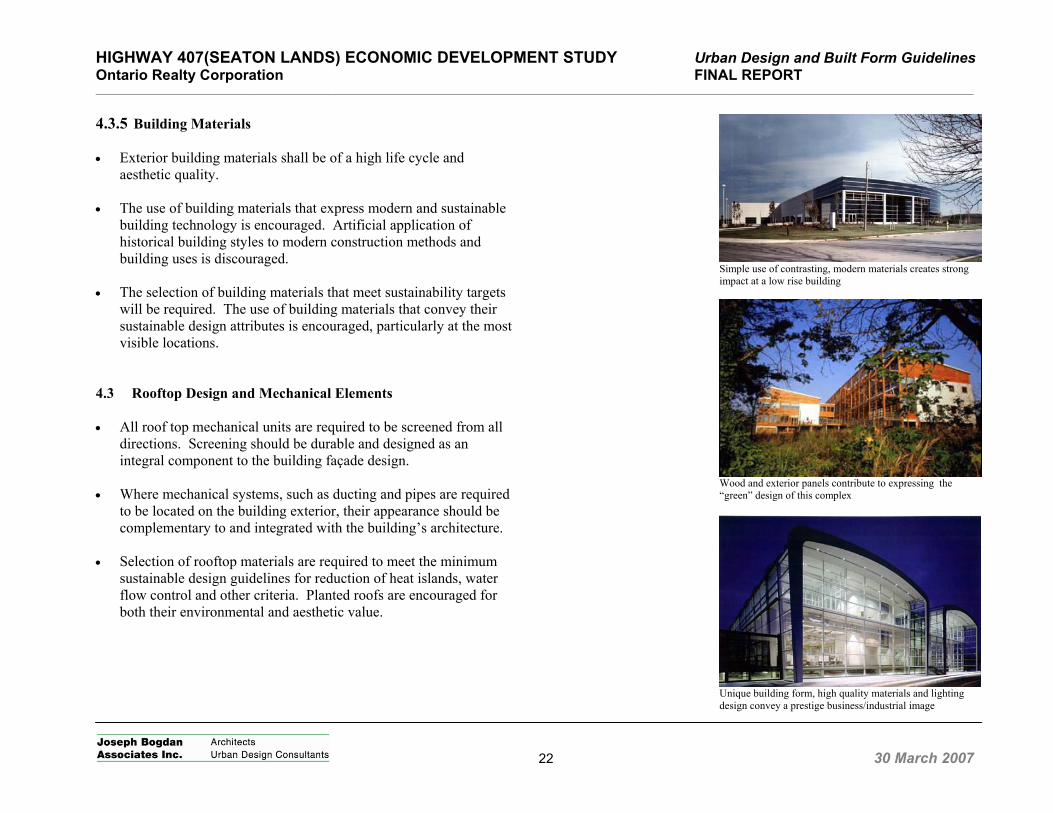
HIGHWAY 407(SEATON LANDS) ECONOMIC DEVELOPMENT STUDY Urban Design and Built Form Guidelines Ontario Realty Corporation FINAL REPORT _____________________________________________________________________________________________________________________________________________________________________
22 30 March 2007
4.3.5 Building Materials • Exterior building materials shall be of a high life cycle and
aesthetic quality. • The use of building materials that express modern and sustainable
building technology is encouraged. Artificial application of historical building styles to modern construction methods and building uses is discouraged.
• The selection of building materials that meet sustainability targets
will be required. The use of building materials that convey their sustainable design attributes is encouraged, particularly at the most visible locations.
4.3 Rooftop Design and Mechanical Elements • All roof top mechanical units are required to be screened from all
directions. Screening should be durable and designed as an integral component to the building façade design.
• Where mechanical systems, such as ducting and pipes are required
to be located on the building exterior, their appearance should be complementary to and integrated with the building’s architecture.
• Selection of rooftop materials are required to meet the minimum
sustainable design guidelines for reduction of heat islands, water flow control and other criteria. Planted roofs are encouraged for both their environmental and aesthetic value.
Simple use of contrasting, modern materials creates strong impact at a low rise building
Wood and exterior panels contribute to expressing the “green” design of this complex
Unique building form, high quality materials and lighting design convey a prestige business/industrial image
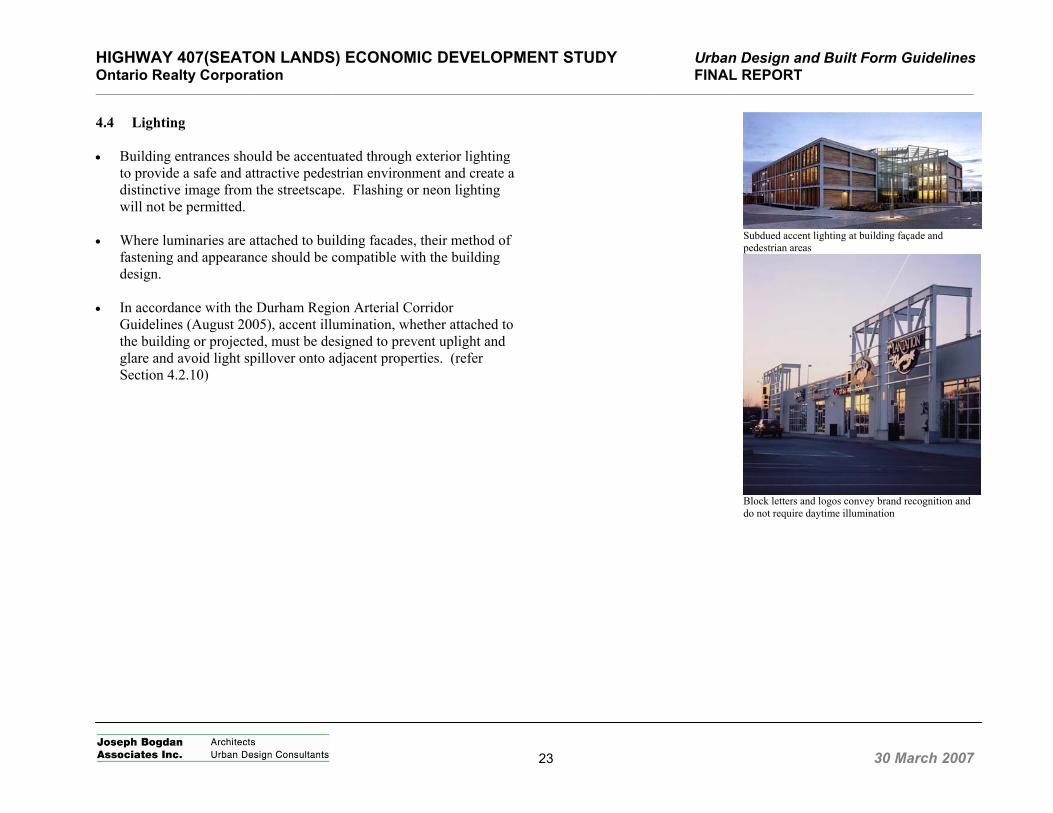
HIGHWAY 407(SEATON LANDS) ECONOMIC DEVELOPMENT STUDY Urban Design and Built Form Guidelines Ontario Realty Corporation FINAL REPORT _____________________________________________________________________________________________________________________________________________________________________
23 30 March 2007
4.4 Lighting • Building entrances should be accentuated through exterior lighting
to provide a safe and attractive pedestrian environment and create a distinctive image from the streetscape. Flashing or neon lighting will not be permitted.
• Where luminaries are attached to building facades, their method of
fastening and appearance should be compatible with the building design.
• In accordance with the Durham Region Arterial Corridor
Guidelines (August 2005), accent illumination, whether attached to the building or projected, must be designed to prevent uplight and glare and avoid light spillover onto adjacent properties. (refer Section 4.2.10)
Subdued accent lighting at building façade and pedestrian areas
Block letters and logos convey brand recognition and do not require daytime illumination
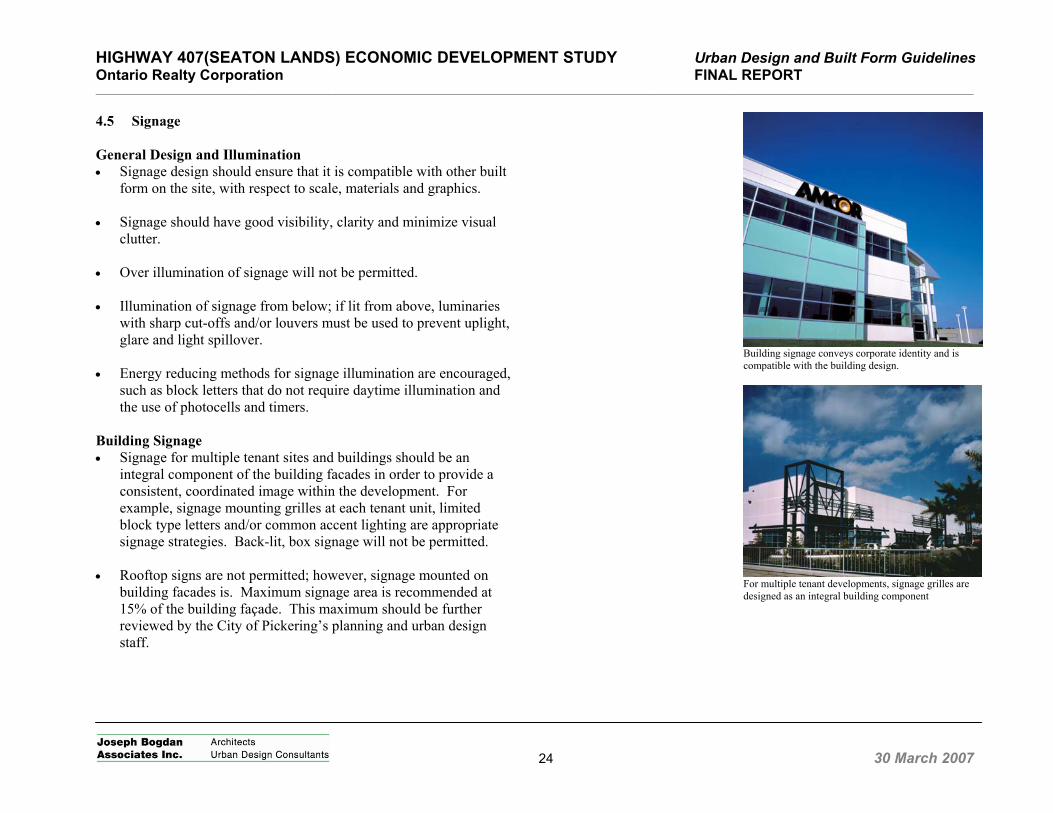
HIGHWAY 407(SEATON LANDS) ECONOMIC DEVELOPMENT STUDY Urban Design and Built Form Guidelines Ontario Realty Corporation FINAL REPORT _____________________________________________________________________________________________________________________________________________________________________
24 30 March 2007
4.5 Signage General Design and Illumination • Signage design should ensure that it is compatible with other built
form on the site, with respect to scale, materials and graphics. • Signage should have good visibility, clarity and minimize visual
clutter. • Over illumination of signage will not be permitted. • Illumination of signage from below; if lit from above, luminaries
with sharp cut-offs and/or louvers must be used to prevent uplight, glare and light spillover.
• Energy reducing methods for signage illumination are encouraged,
such as block letters that do not require daytime illumination and the use of photocells and timers.
Building Signage • Signage for multiple tenant sites and buildings should be an
integral component of the building facades in order to provide a consistent, coordinated image within the development. For example, signage mounting grilles at each tenant unit, limited block type letters and/or common accent lighting are appropriate signage strategies. Back-lit, box signage will not be permitted.
• Rooftop signs are not permitted; however, signage mounted on
building facades is. Maximum signage area is recommended at 15% of the building façade. This maximum should be further reviewed by the City of Pickering’s planning and urban design staff.
Building signage conveys corporate identity and is compatible with the building design.
For multiple tenant developments, signage grilles are designed as an integral building component
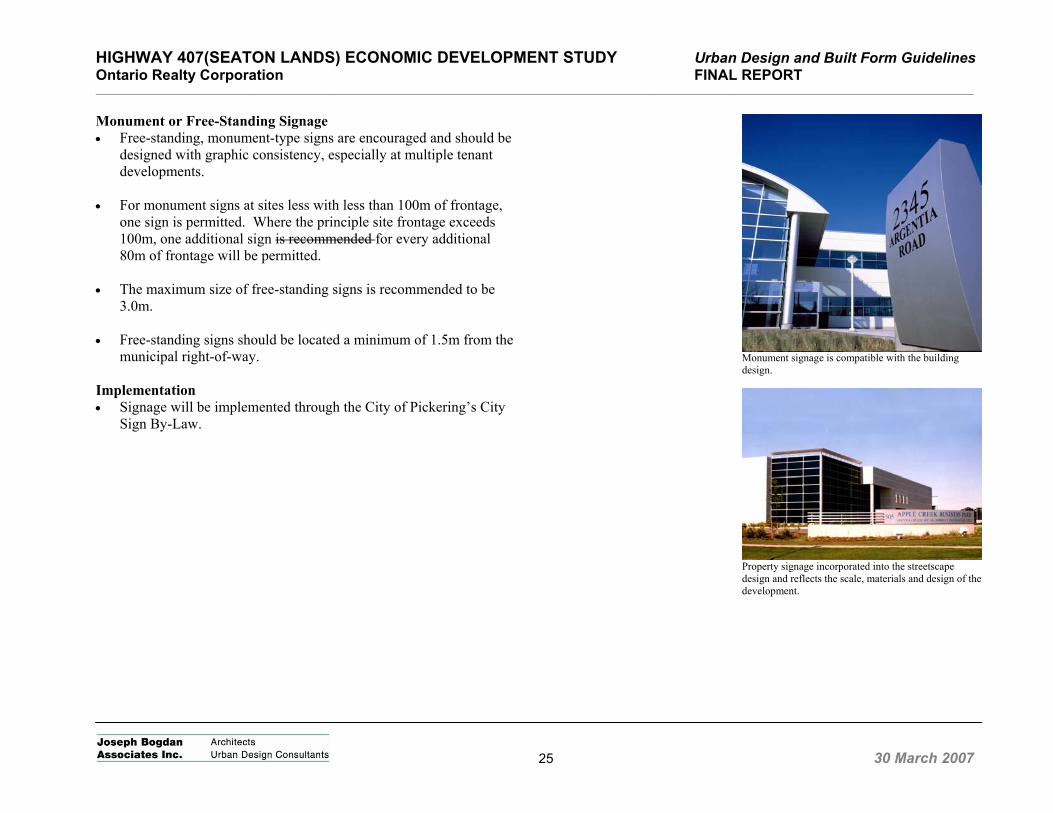
HIGHWAY 407(SEATON LANDS) ECONOMIC DEVELOPMENT STUDY Urban Design and Built Form Guidelines Ontario Realty Corporation FINAL REPORT _____________________________________________________________________________________________________________________________________________________________________
25 30 March 2007
Monument or Free-Standing Signage • Free-standing, monument-type signs are encouraged and should be
designed with graphic consistency, especially at multiple tenant developments.
• For monument signs at sites less with less than 100m of frontage,
one sign is permitted. Where the principle site frontage exceeds 100m, one additional sign is recommended for every additional 80m of frontage will be permitted.
• The maximum size of free-standing signs is recommended to be
3.0m. • Free-standing signs should be located a minimum of 1.5m from the
municipal right-of-way. Implementation • Signage will be implemented through the City of Pickering’s City
Sign By-Law.
Monument signage is compatible with the building design.
Property signage incorporated into the streetscape design and reflects the scale, materials and design of the development.
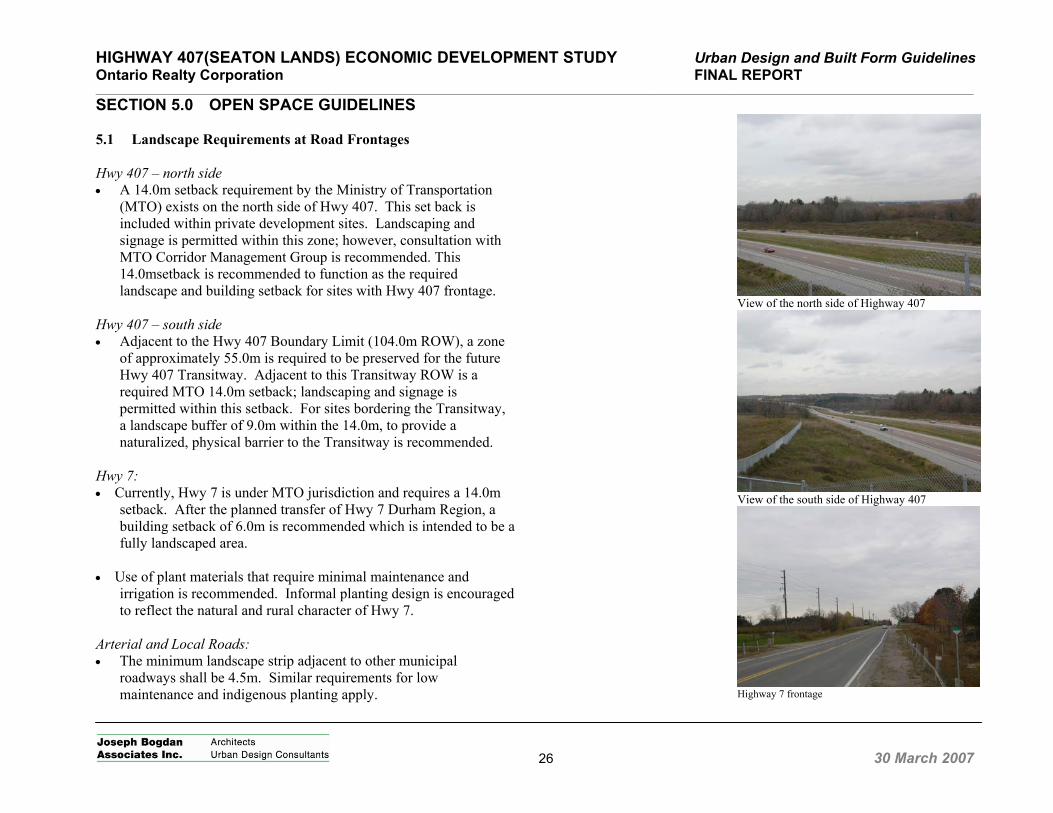
HIGHWAY 407(SEATON LANDS) ECONOMIC DEVELOPMENT STUDY Urban Design and Built Form Guidelines Ontario Realty Corporation FINAL REPORT _____________________________________________________________________________________________________________________________________________________________________
26 30 March 2007
SECTION 5.0 OPEN SPACE GUIDELINES 5.1 Landscape Requirements at Road Frontages Hwy 407 – north side • A 14.0m setback requirement by the Ministry of Transportation
(MTO) exists on the north side of Hwy 407. This set back is included within private development sites. Landscaping and signage is permitted within this zone; however, consultation with MTO Corridor Management Group is recommended. This 14.0msetback is recommended to function as the required landscape and building setback for sites with Hwy 407 frontage.
Hwy 407 – south side • Adjacent to the Hwy 407 Boundary Limit (104.0m ROW), a zone
of approximately 55.0m is required to be preserved for the future Hwy 407 Transitway. Adjacent to this Transitway ROW is a required MTO 14.0m setback; landscaping and signage is permitted within this setback. For sites bordering the Transitway, a landscape buffer of 9.0m within the 14.0m, to provide a naturalized, physical barrier to the Transitway is recommended.
Hwy 7: • Currently, Hwy 7 is under MTO jurisdiction and requires a 14.0m
setback. After the planned transfer of Hwy 7 Durham Region, a building setback of 6.0m is recommended which is intended to be a fully landscaped area.
• Use of plant materials that require minimal maintenance and
irrigation is recommended. Informal planting design is encouraged to reflect the natural and rural character of Hwy 7.
Arterial and Local Roads: • The minimum landscape strip adjacent to other municipal
roadways shall be 4.5m. Similar requirements for low maintenance and indigenous planting apply.
View of the north side of Highway 407
View of the south side of Highway 407
Highway 7 frontage
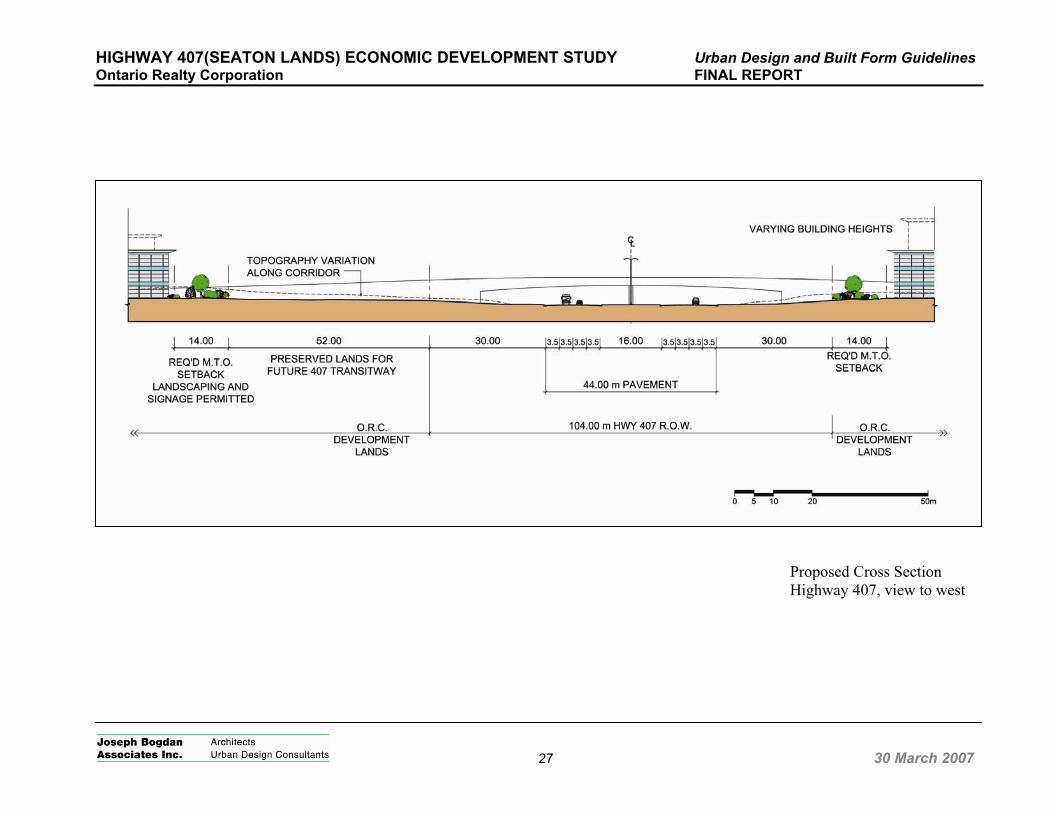
HIGHWAY 407(SEATON LANDS) ECONOMIC DEVELOPMENT STUDY Urban Design and Built Form Guidelines Ontario Realty Corporation FINAL REPORT
27 30 March 2007
Proposed Cross Section Highway 407, view to west
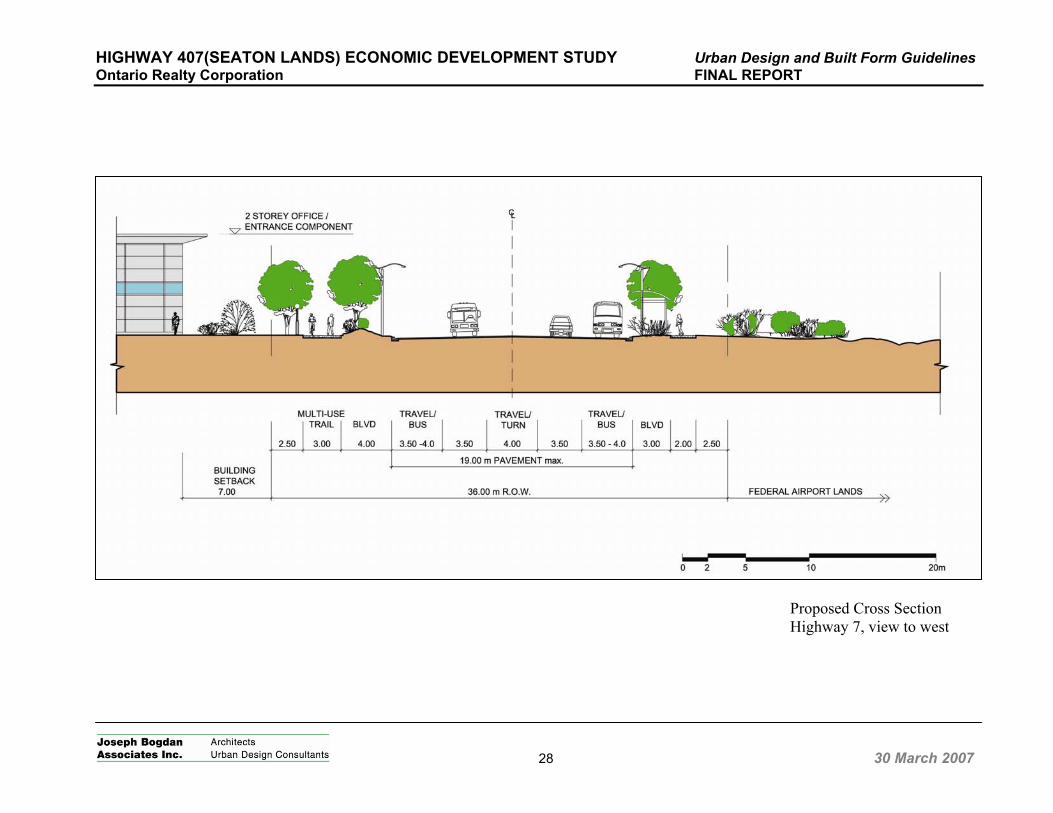
HIGHWAY 407(SEATON LANDS) ECONOMIC DEVELOPMENT STUDY Urban Design and Built Form Guidelines Ontario Realty Corporation FINAL REPORT
28 30 March 2007
Proposed Cross Section Highway 7, view to west
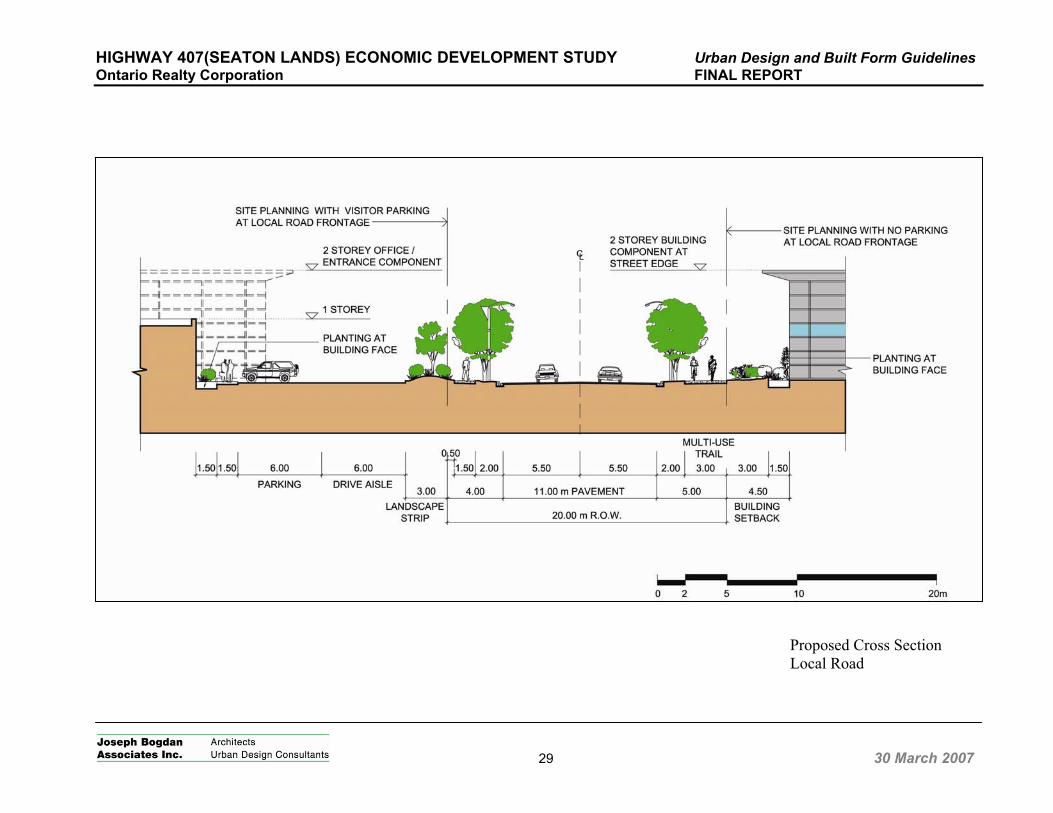
HIGHWAY 407(SEATON LANDS) ECONOMIC DEVELOPMENT STUDY Urban Design and Built Form Guidelines Ontario Realty Corporation FINAL REPORT
29 30 March 2007
Proposed Cross Section Local Road
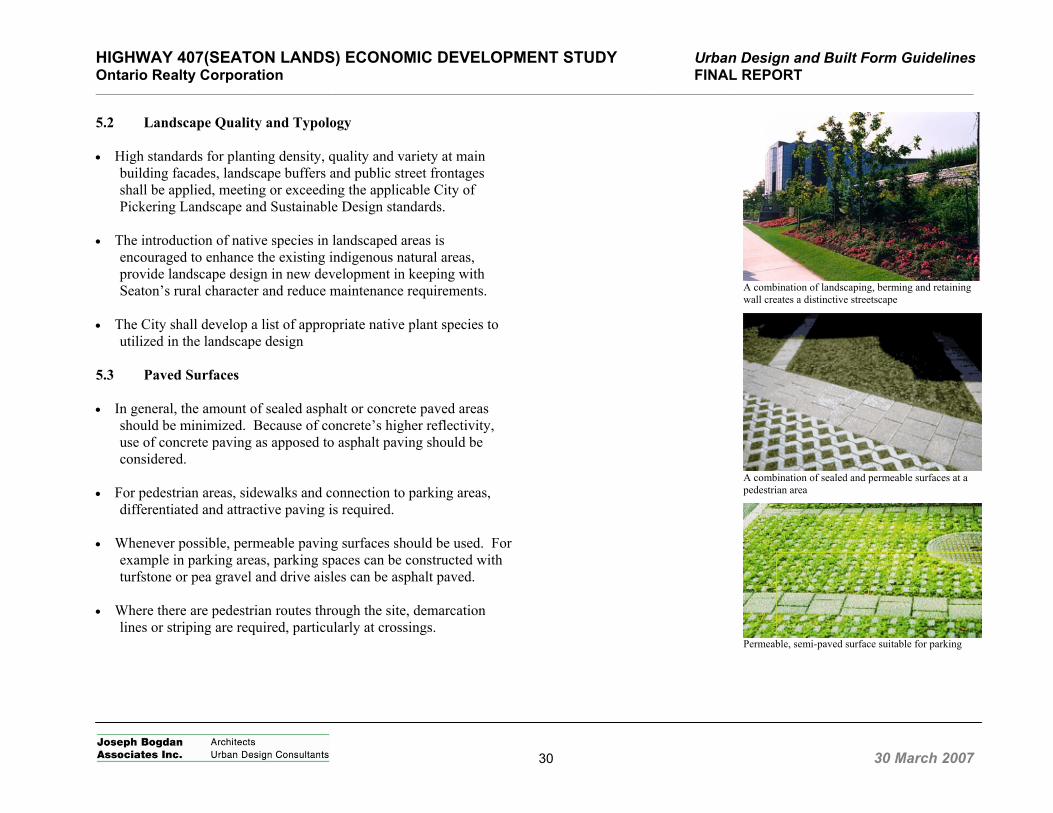
HIGHWAY 407(SEATON LANDS) ECONOMIC DEVELOPMENT STUDY Urban Design and Built Form Guidelines Ontario Realty Corporation FINAL REPORT _____________________________________________________________________________________________________________________________________________________________________
30 30 March 2007
5.2 Landscape Quality and Typology • High standards for planting density, quality and variety at main
building facades, landscape buffers and public street frontages shall be applied, meeting or exceeding the applicable City of Pickering Landscape and Sustainable Design standards.
• The introduction of native species in landscaped areas is
encouraged to enhance the existing indigenous natural areas, provide landscape design in new development in keeping with Seaton’s rural character and reduce maintenance requirements.
• The City shall develop a list of appropriate native plant species to
utilized in the landscape design 5.3 Paved Surfaces • In general, the amount of sealed asphalt or concrete paved areas
should be minimized. Because of concrete’s higher reflectivity, use of concrete paving as apposed to asphalt paving should be considered.
• For pedestrian areas, sidewalks and connection to parking areas,
differentiated and attractive paving is required. • Whenever possible, permeable paving surfaces should be used. For
example in parking areas, parking spaces can be constructed with turfstone or pea gravel and drive aisles can be asphalt paved.
• Where there are pedestrian routes through the site, demarcation
lines or striping are required, particularly at crossings.
A combination of landscaping, berming and retaining wall creates a distinctive streetscape
A combination of sealed and permeable surfaces at a pedestrian area
Permeable, semi-paved surface suitable for parking
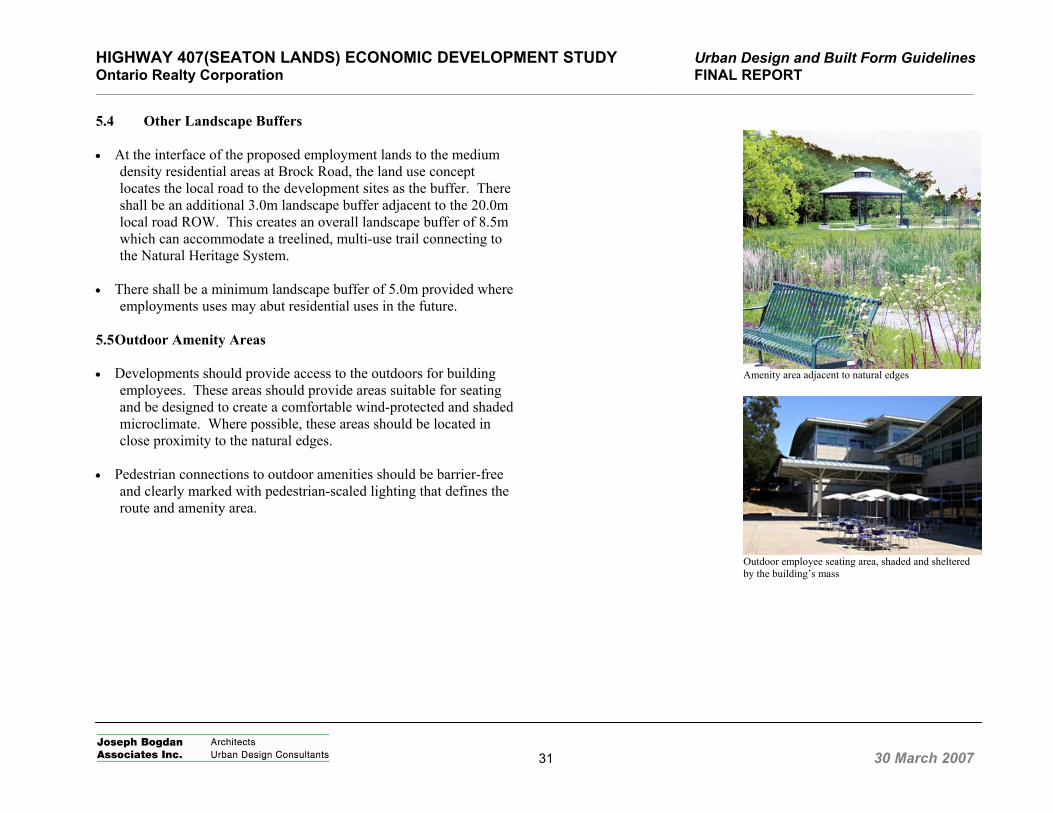
HIGHWAY 407(SEATON LANDS) ECONOMIC DEVELOPMENT STUDY Urban Design and Built Form Guidelines Ontario Realty Corporation FINAL REPORT _____________________________________________________________________________________________________________________________________________________________________
31 30 March 2007
5.4 Other Landscape Buffers • At the interface of the proposed employment lands to the medium
density residential areas at Brock Road, the land use concept locates the local road to the development sites as the buffer. There shall be an additional 3.0m landscape buffer adjacent to the 20.0m local road ROW. This creates an overall landscape buffer of 8.5m which can accommodate a treelined, multi-use trail connecting to the Natural Heritage System.
• There shall be a minimum landscape buffer of 5.0m provided where
employments uses may abut residential uses in the future. 5.5 Outdoor Amenity Areas • Developments should provide access to the outdoors for building
employees. These areas should provide areas suitable for seating and be designed to create a comfortable wind-protected and shaded microclimate. Where possible, these areas should be located in close proximity to the natural edges.
• Pedestrian connections to outdoor amenities should be barrier-free
and clearly marked with pedestrian-scaled lighting that defines the route and amenity area.
Amenity area adjacent to natural edges
Outdoor employee seating area, shaded and sheltered by the building’s mass
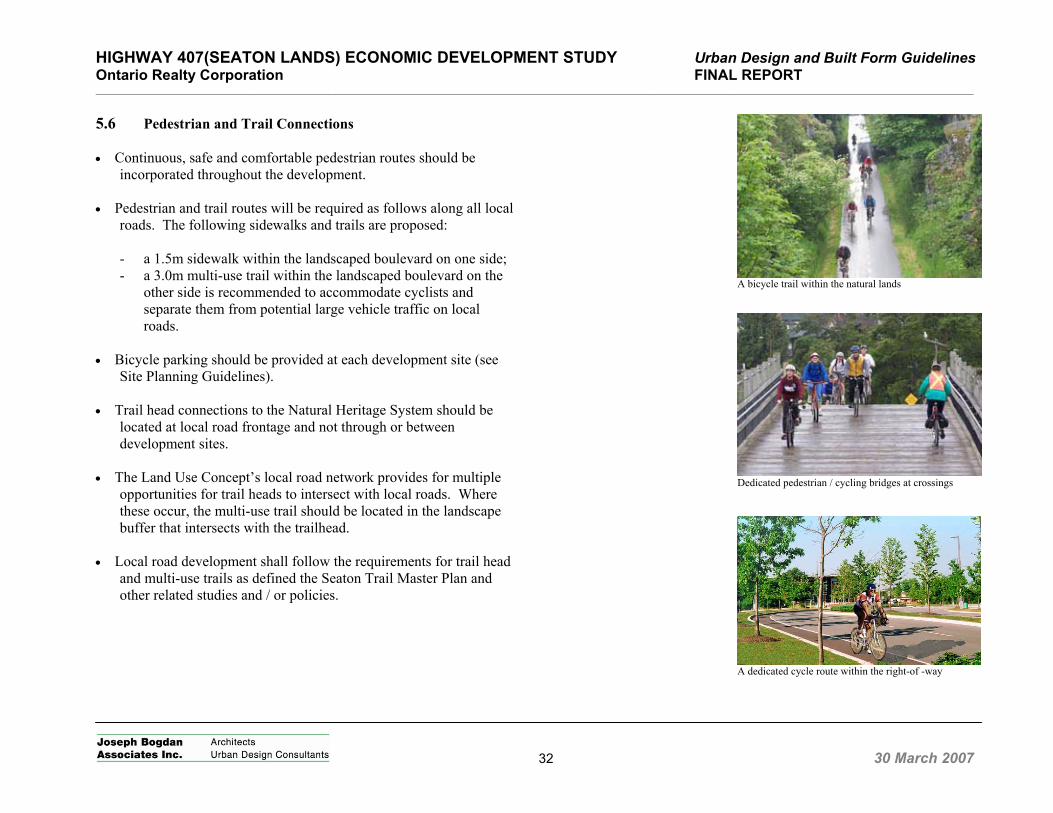
HIGHWAY 407(SEATON LANDS) ECONOMIC DEVELOPMENT STUDY Urban Design and Built Form Guidelines Ontario Realty Corporation FINAL REPORT _____________________________________________________________________________________________________________________________________________________________________
32 30 March 2007
5.6 Pedestrian and Trail Connections • Continuous, safe and comfortable pedestrian routes should be
incorporated throughout the development. • Pedestrian and trail routes will be required as follows along all local
roads. The following sidewalks and trails are proposed:
- a 1.5m sidewalk within the landscaped boulevard on one side; - a 3.0m multi-use trail within the landscaped boulevard on the
other side is recommended to accommodate cyclists and separate them from potential large vehicle traffic on local roads.
• Bicycle parking should be provided at each development site (see
Site Planning Guidelines). • Trail head connections to the Natural Heritage System should be
located at local road frontage and not through or between development sites.
• The Land Use Concept’s local road network provides for multiple
opportunities for trail heads to intersect with local roads. Where these occur, the multi-use trail should be located in the landscape buffer that intersects with the trailhead.
• Local road development shall follow the requirements for trail head
and multi-use trails as defined the Seaton Trail Master Plan and other related studies and / or policies.
A bicycle trail within the natural lands
Dedicated pedestrian / cycling bridges at crossings
A dedicated cycle route within the right-of -way
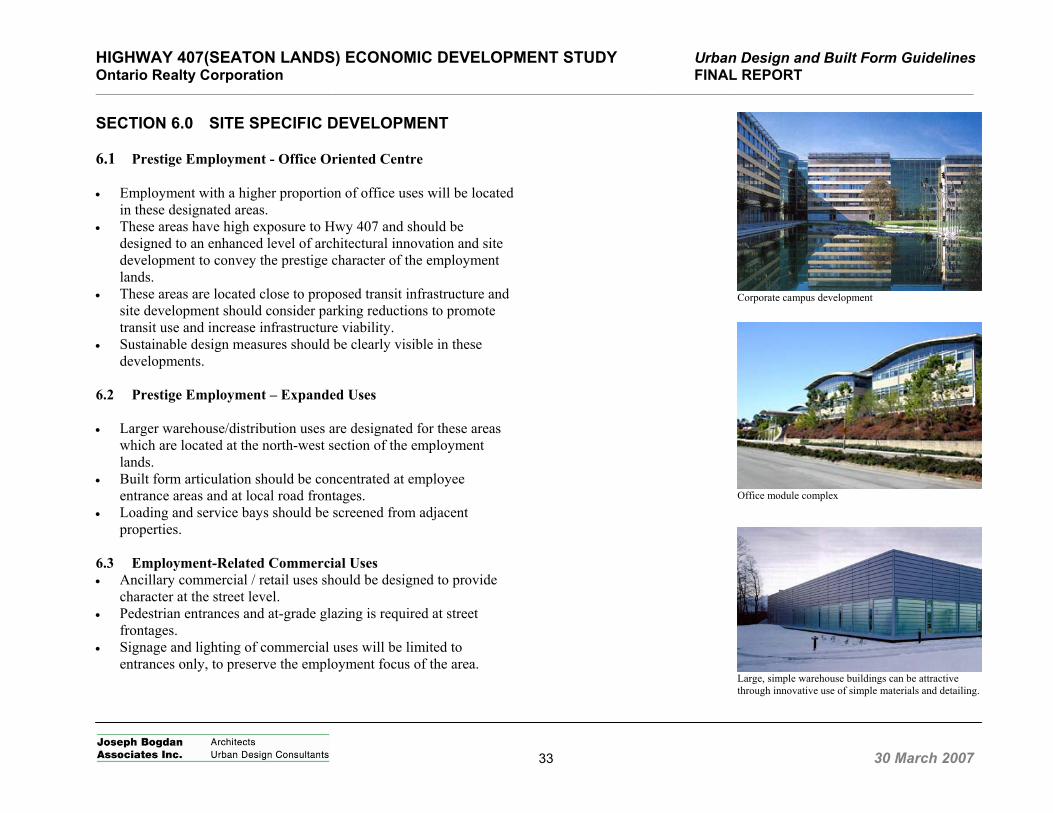
HIGHWAY 407(SEATON LANDS) ECONOMIC DEVELOPMENT STUDY Urban Design and Built Form Guidelines Ontario Realty Corporation FINAL REPORT _____________________________________________________________________________________________________________________________________________________________________
33 30 March 2007
SECTION 6.0 SITE SPECIFIC DEVELOPMENT
6.1 Prestige Employment - Office Oriented Centre • Employment with a higher proportion of office uses will be located
in these designated areas. • These areas have high exposure to Hwy 407 and should be
designed to an enhanced level of architectural innovation and site development to convey the prestige character of the employment lands.
• These areas are located close to proposed transit infrastructure and site development should consider parking reductions to promote transit use and increase infrastructure viability.
• Sustainable design measures should be clearly visible in these developments.
6.2 Prestige Employment – Expanded Uses • Larger warehouse/distribution uses are designated for these areas
which are located at the north-west section of the employment lands.
• Built form articulation should be concentrated at employee entrance areas and at local road frontages.
• Loading and service bays should be screened from adjacent properties.
6.3 Employment-Related Commercial Uses • Ancillary commercial / retail uses should be designed to provide
character at the street level. • Pedestrian entrances and at-grade glazing is required at street
frontages. • Signage and lighting of commercial uses will be limited to
entrances only, to preserve the employment focus of the area.
Corporate campus development
Office module complex
Large, simple warehouse buildings can be attractive through innovative use of simple materials and detailing.
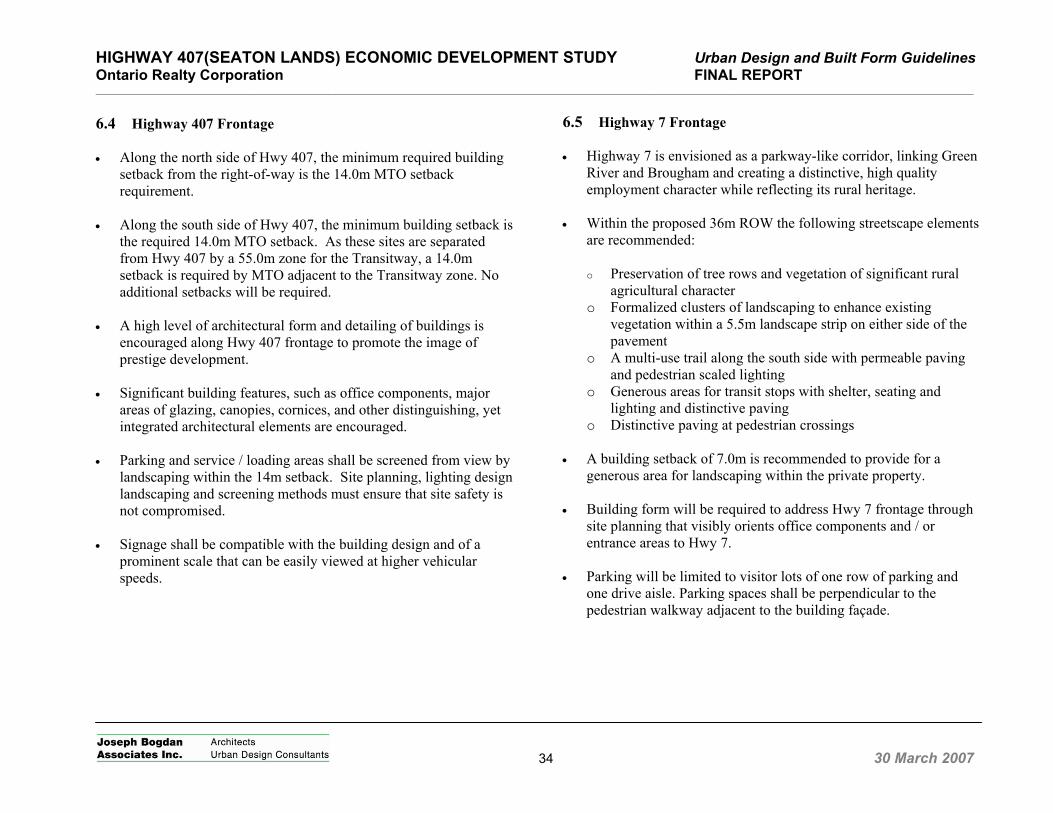
HIGHWAY 407(SEATON LANDS) ECONOMIC DEVELOPMENT STUDY Urban Design and Built Form Guidelines Ontario Realty Corporation FINAL REPORT _____________________________________________________________________________________________________________________________________________________________________
34 30 March 2007
6.4 Highway 407 Frontage • Along the north side of Hwy 407, the minimum required building
setback from the right-of-way is the 14.0m MTO setback requirement.
• Along the south side of Hwy 407, the minimum building setback is
the required 14.0m MTO setback. As these sites are separated from Hwy 407 by a 55.0m zone for the Transitway, a 14.0m setback is required by MTO adjacent to the Transitway zone. No additional setbacks will be required.
• A high level of architectural form and detailing of buildings is
encouraged along Hwy 407 frontage to promote the image of prestige development.
• Significant building features, such as office components, major
areas of glazing, canopies, cornices, and other distinguishing, yet integrated architectural elements are encouraged.
• Parking and service / loading areas shall be screened from view by
landscaping within the 14m setback. Site planning, lighting design landscaping and screening methods must ensure that site safety is not compromised.
• Signage shall be compatible with the building design and of a
prominent scale that can be easily viewed at higher vehicular speeds.
6.5 Highway 7 Frontage • Highway 7 is envisioned as a parkway-like corridor, linking Green
River and Brougham and creating a distinctive, high quality employment character while reflecting its rural heritage.
• Within the proposed 36m ROW the following streetscape elements
are recommended: o Preservation of tree rows and vegetation of significant rural
agricultural character o Formalized clusters of landscaping to enhance existing
vegetation within a 5.5m landscape strip on either side of the pavement
o A multi-use trail along the south side with permeable paving and pedestrian scaled lighting
o Generous areas for transit stops with shelter, seating and lighting and distinctive paving
o Distinctive paving at pedestrian crossings • A building setback of 7.0m is recommended to provide for a
generous area for landscaping within the private property. • Building form will be required to address Hwy 7 frontage through
site planning that visibly orients office components and / or entrance areas to Hwy 7.
• Parking will be limited to visitor lots of one row of parking and
one drive aisle. Parking spaces shall be perpendicular to the pedestrian walkway adjacent to the building façade.
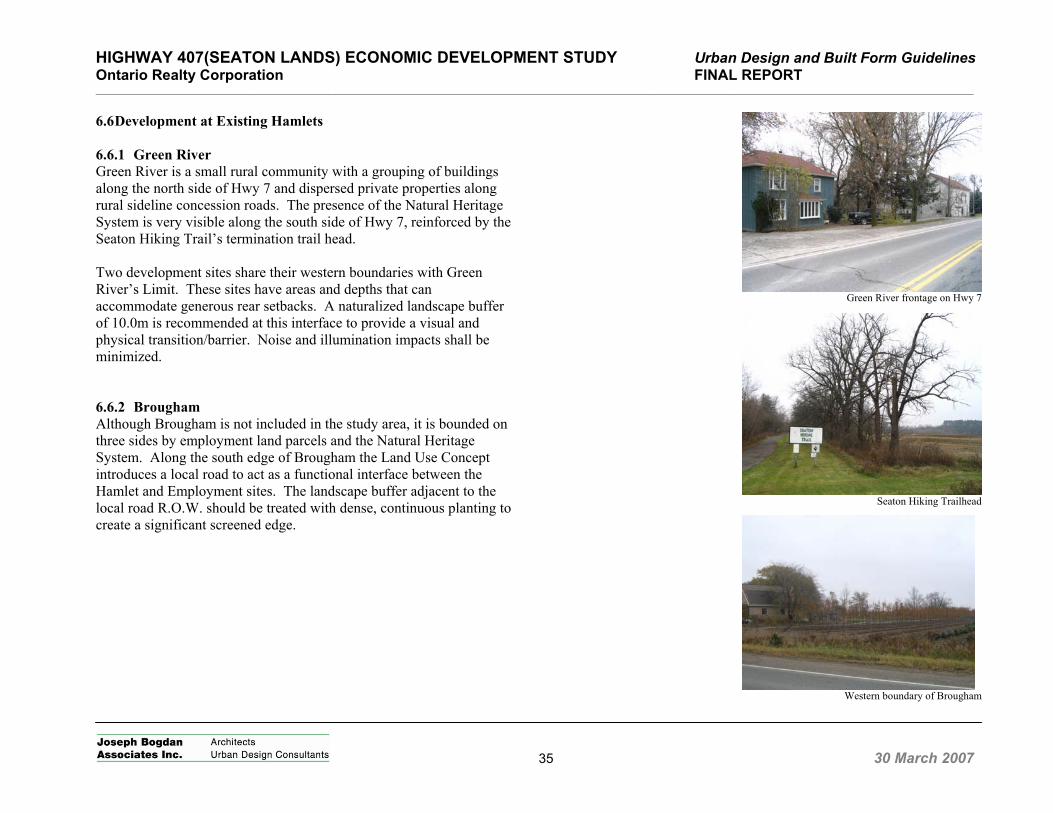
HIGHWAY 407(SEATON LANDS) ECONOMIC DEVELOPMENT STUDY Urban Design and Built Form Guidelines Ontario Realty Corporation FINAL REPORT _____________________________________________________________________________________________________________________________________________________________________
35 30 March 2007
6.6 Development at Existing Hamlets 6.6.1 Green River Green River is a small rural community with a grouping of buildings along the north side of Hwy 7 and dispersed private properties along rural sideline concession roads. The presence of the Natural Heritage System is very visible along the south side of Hwy 7, reinforced by the Seaton Hiking Trail’s termination trail head. Two development sites share their western boundaries with Green River’s Limit. These sites have areas and depths that can accommodate generous rear setbacks. A naturalized landscape buffer of 10.0m is recommended at this interface to provide a visual and physical transition/barrier. Noise and illumination impacts shall be minimized. 6.6.2 Brougham Although Brougham is not included in the study area, it is bounded on three sides by employment land parcels and the Natural Heritage System. Along the south edge of Brougham the Land Use Concept introduces a local road to act as a functional interface between the Hamlet and Employment sites. The landscape buffer adjacent to the local road R.O.W. should be treated with dense, continuous planting to create a significant screened edge.
Green River frontage on Hwy 7
Seaton Hiking Trailhead
Western boundary of Brougham
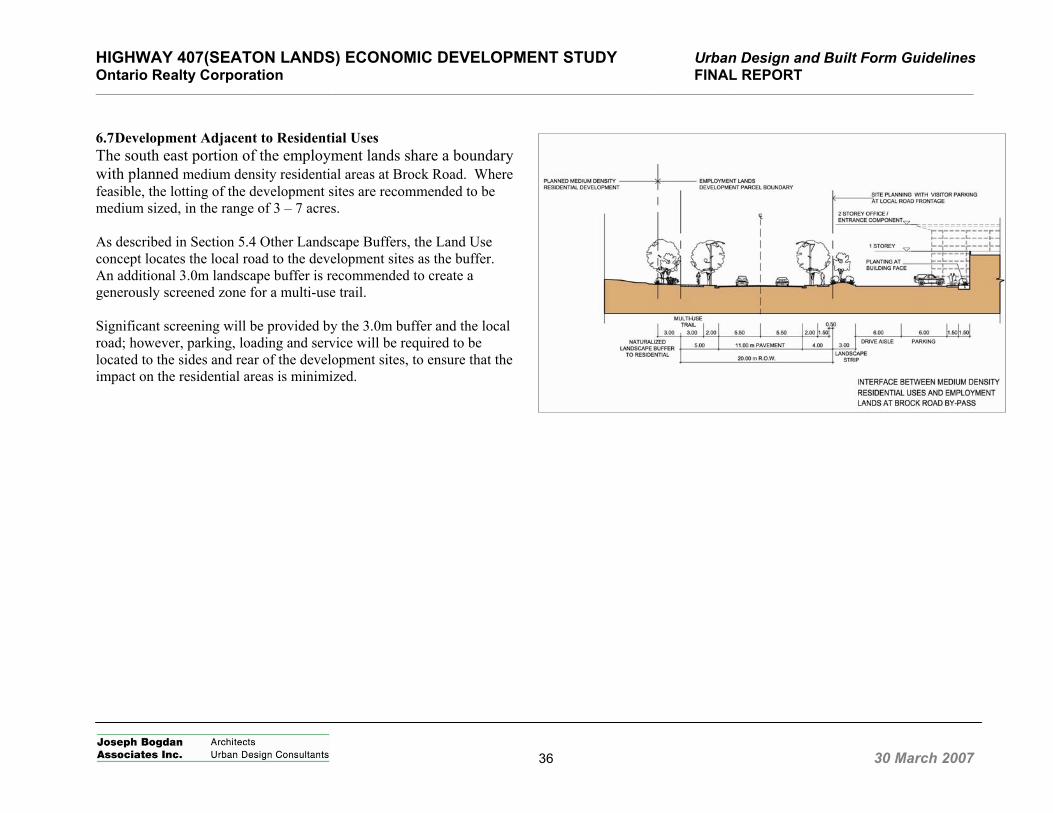
HIGHWAY 407(SEATON LANDS) ECONOMIC DEVELOPMENT STUDY Urban Design and Built Form Guidelines Ontario Realty Corporation FINAL REPORT _____________________________________________________________________________________________________________________________________________________________________
36 30 March 2007
6.7 Development Adjacent to Residential Uses The south east portion of the employment lands share a boundary with planned medium density residential areas at Brock Road. Where feasible, the lotting of the development sites are recommended to be medium sized, in the range of 3 – 7 acres. As described in Section 5.4 Other Landscape Buffers, the Land Use concept locates the local road to the development sites as the buffer. An additional 3.0m landscape buffer is recommended to create a generously screened zone for a multi-use trail. Significant screening will be provided by the 3.0m buffer and the local road; however, parking, loading and service will be required to be located to the sides and rear of the development sites, to ensure that the impact on the residential areas is minimized.
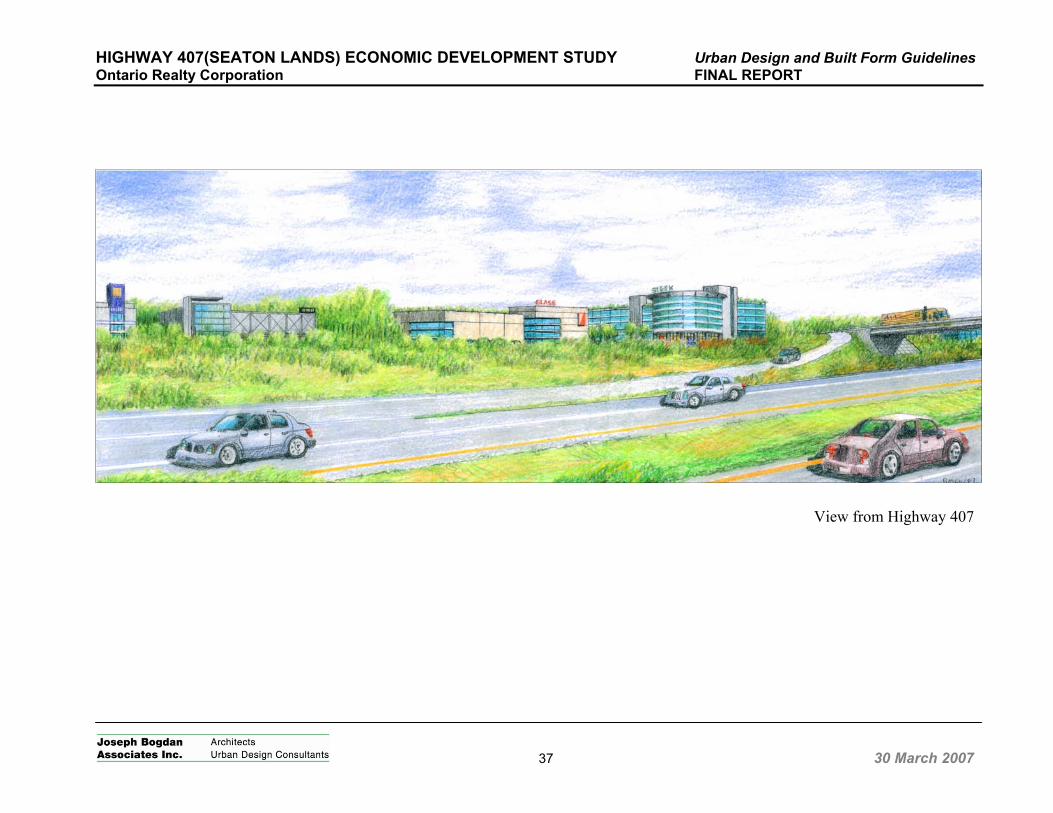
HIGHWAY 407(SEATON LANDS) ECONOMIC DEVELOPMENT STUDY Urban Design and Built Form Guidelines Ontario Realty Corporation FINAL REPORT
37 30 March 2007
View from Highway 407

HIGHWAY 407 (SEATON LANDS)ECONOMIC DEVELOPMENT STUDY
APPENDIX D
Sustainability Guidelines
ECD Energy and Environment Canada Ltd.

Sustainable Development Guidelines
ECD Energy and Environment Canada, Ltd. March 2007
5/28/2007 Sustainability Development Guidelines for the Seaton Employment Lands Page 2
Index
1. Introduction
2. The “Cost of Green”
3. Guideline Implementation
a. Implementation through Neighbourhood Plans
b. Addressing of Guidelines Requiring Additional Capital Cost Expenditure
c. Operational Savings
d. Potential Implementation Incentives
4. Conclusions
Appendix 1: Sustainable Development Guidelines
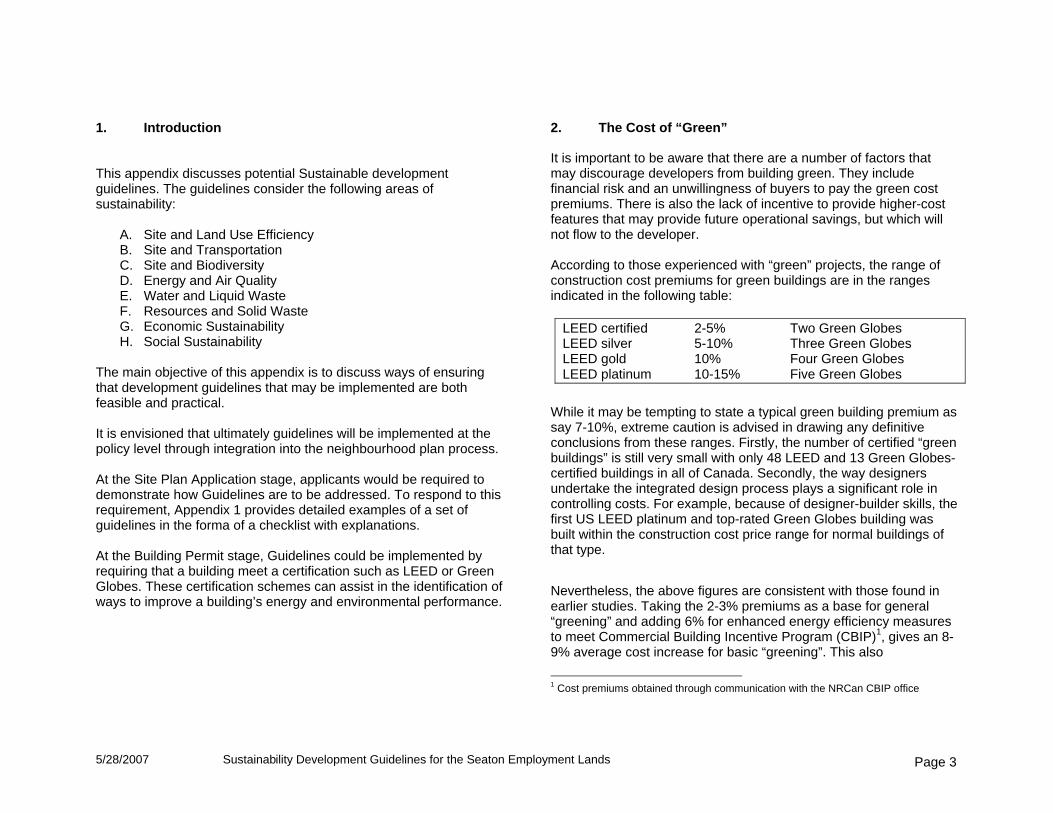
5/28/2007 Sustainability Development Guidelines for the Seaton Employment Lands Page 3
1. Introduction This appendix discusses potential Sustainable development guidelines. The guidelines consider the following areas of sustainability:
A. Site and Land Use Efficiency B. Site and Transportation C. Site and Biodiversity D. Energy and Air Quality E. Water and Liquid Waste F. Resources and Solid Waste G. Economic Sustainability H. Social Sustainability
The main objective of this appendix is to discuss ways of ensuring that development guidelines that may be implemented are both feasible and practical. It is envisioned that ultimately guidelines will be implemented at the policy level through integration into the neighbourhood plan process. At the Site Plan Application stage, applicants would be required to demonstrate how Guidelines are to be addressed. To respond to this requirement, Appendix 1 provides detailed examples of a set of guidelines in the forma of a checklist with explanations. At the Building Permit stage, Guidelines could be implemented by requiring that a building meet a certification such as LEED or Green Globes. These certification schemes can assist in the identification of ways to improve a building’s energy and environmental performance.
2. The Cost of “Green” It is important to be aware that there are a number of factors that may discourage developers from building green. They include financial risk and an unwillingness of buyers to pay the green cost premiums. There is also the lack of incentive to provide higher-cost features that may provide future operational savings, but which will not flow to the developer. According to those experienced with “green” projects, the range of construction cost premiums for green buildings are in the ranges indicated in the following table:
LEED certified 2-5% Two Green Globes LEED silver 5-10% Three Green Globes LEED gold 10% Four Green Globes LEED platinum 10-15% Five Green Globes
While it may be tempting to state a typical green building premium as say 7-10%, extreme caution is advised in drawing any definitive conclusions from these ranges. Firstly, the number of certified “green buildings” is still very small with only 48 LEED and 13 Green Globes-certified buildings in all of Canada. Secondly, the way designers undertake the integrated design process plays a significant role in controlling costs. For example, because of designer-builder skills, the first US LEED platinum and top-rated Green Globes building was built within the construction cost price range for normal buildings of that type. Nevertheless, the above figures are consistent with those found in earlier studies. Taking the 2-3% premiums as a base for general “greening” and adding 6% for enhanced energy efficiency measures to meet Commercial Building Incentive Program (CBIP)1, gives an 8-9% average cost increase for basic “greening”. This also
1 Cost premiums obtained through communication with the NRCan CBIP office
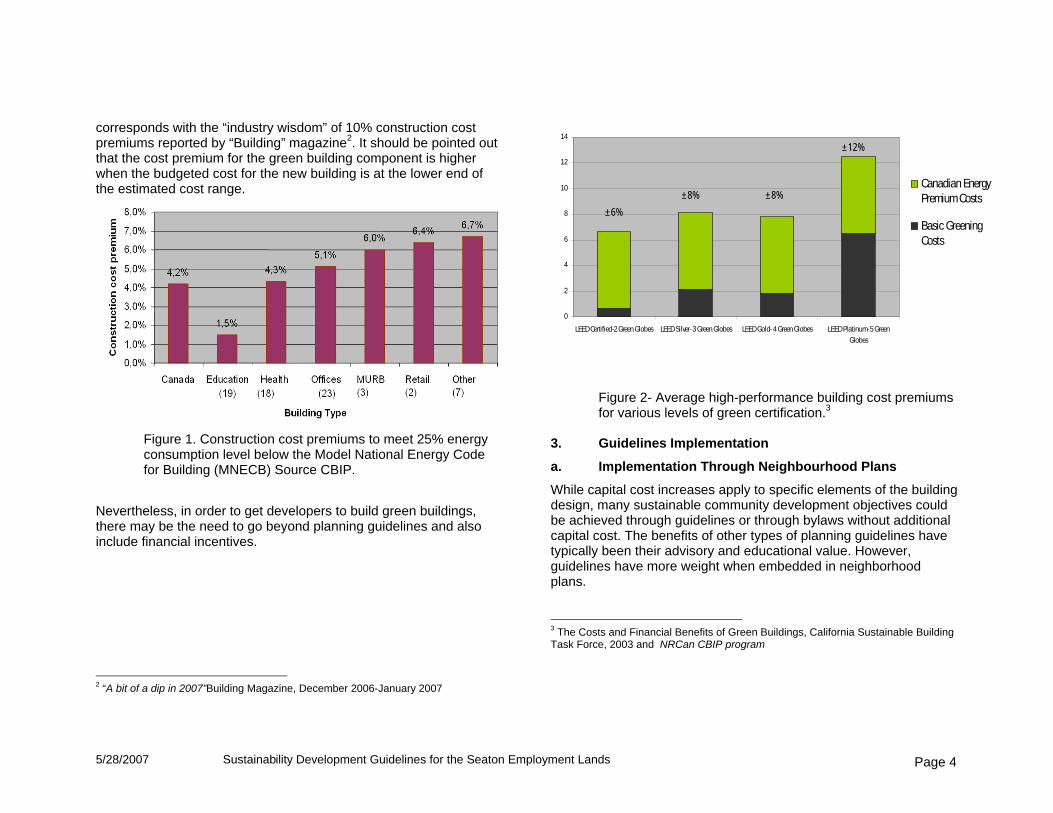
5/28/2007 Sustainability Development Guidelines for the Seaton Employment Lands Page 4
corresponds with the “industry wisdom” of 10% construction cost premiums reported by “Building” magazine2. It should be pointed out that the cost premium for the green building component is higher when the budgeted cost for the new building is at the lower end of the estimated cost range.
Figure 1. Construction cost premiums to meet 25% energy consumption level below the Model National Energy Code for Building (MNECB) Source CBIP.
Nevertheless, in order to get developers to build green buildings, there may be the need to go beyond planning guidelines and also include financial incentives.
2 “A bit of a dip in 2007”Building Magazine, December 2006-January 2007
Figure 2- Average high-performance building cost premiums for various levels of green certification.3
3. Guidelines Implementation
a. Implementation Through Neighbourhood Plans
While capital cost increases apply to specific elements of the building design, many sustainable community development objectives could be achieved through guidelines or through bylaws without additional capital cost. The benefits of other types of planning guidelines have typically been their advisory and educational value. However, guidelines have more weight when embedded in neighborhood plans. 3 The Costs and Financial Benefits of Green Buildings, California Sustainable Building Task Force, 2003 and NRCan CBIP program
0
2
4
6
8
10
12
14
LEED Certified-2 Green Globes LEED Silver- 3 Green Globes LEED Gold- 4 Green Globes LEED Platinum- 5 GreenGlobes
Canadian EnergyPremium Costs
Basic GreeningCosts
±6% ±8% ±8%
±12%
5/28/2007 Sustainability Development Guidelines for the Seaton Employment Lands Page 5
Many of the following sustainable development criteria, particularly those in the Site and Land Use Efficiency category, could be implemented either through urban design guidelines or through municipal bylaws.
A.3 Development Intensity A.4 Pedestrian and Bicycle Routes Network A.5 Roadway Design A.6 Connection of Natural Areas and Corridors B.1 Access Routes B.2 Pedestrian Movement and Reduced Auto Speeds B.3 Parking Requirements B.4 Carpool Parking, and Sheltered Waiting Spaces B.5 Bicycle Parking B.6 Loading Areas C.4 Preservation of Natural and Ecologically Sensitive Areas C.5 Erosion And Sedimentation Control C.6 Local Species Habitat C.7 Native Plant Species C.8 Forest Cover D.2 Microclimatic Conditions D.3 South Orientation E.6 Paved Areas E.7 Curb and Gutter Systems E.8 Contamination of Sewers and Waterways E.9 Salt and Spring Run-off E.10 Ice Hazards E.14 Integrated Pest Management Strategy F.1 Composting Yard Waste H.2 Childcare and nursery school space H.3 School Bus Routes H.4 Medical Clinic H.5 Health Club Facilities H.6 Cultural Facilities
b. Implementation of Guidelines That Would Necessitate Additional Capital Investment
Sustainability strategies and technologies for energy, water and waste can be classified into three groups based on the additional capital expenditure. They require:
• Group A: General high performance strategies requiring minimal
capital outlay • Group B: Improved high performance strategies requiring
marginal capital cost increase • Group C: High performance strategies requiring more significant
capital cost4 Group A: The implementation of these strategies could add additional minimal capital costs, ranging from 0% to 3%. Some examples are:
C.1 Heat island reduction using reflective low-albedo paving, plus a white roof adds about $1 per sq ft to building cost.
E.1 Water efficiency in buildings adds a minimal incremental cost. For example, upgrading from a standard toilet to a dual-flush toilet amounts to only $150 per toilet and upgrading to in-sink aerators is less than $150 per faucet. E.5 Surface runoff management systems, providing the land is available, adds minimal incremental cost. Group B: Initiatives that would involve modest building cost increases. For example: D.1 Energy efficiency in buildings, such as a 30-35% energy reduction relative to Model National Energy Code for Buildings (MNECB) can be implemented with approx. 6% increase in overall
4 Financial Incentives to Foster Sustainability and Environmental Technologies for Toronto Central Waterfront: Final Report, ECD Energy and Environment Canada, Ltd., April 2004.
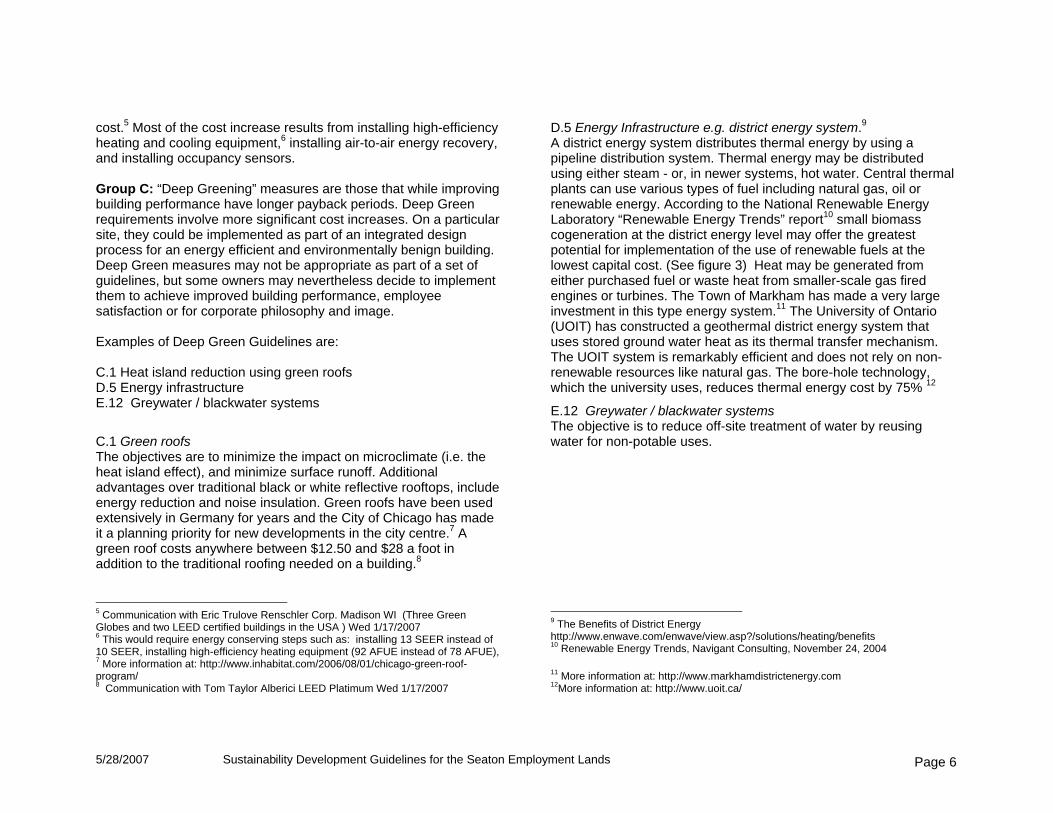
5/28/2007 Sustainability Development Guidelines for the Seaton Employment Lands Page 6
cost.5 Most of the cost increase results from installing high-efficiency heating and cooling equipment,6 installing air-to-air energy recovery, and installing occupancy sensors. Group C: “Deep Greening” measures are those that while improving building performance have longer payback periods. Deep Green requirements involve more significant cost increases. On a particular site, they could be implemented as part of an integrated design process for an energy efficient and environmentally benign building. Deep Green measures may not be appropriate as part of a set of guidelines, but some owners may nevertheless decide to implement them to achieve improved building performance, employee satisfaction or for corporate philosophy and image. Examples of Deep Green Guidelines are: C.1 Heat island reduction using green roofs D.5 Energy infrastructure E.12 Greywater / blackwater systems
C.1 Green roofs The objectives are to minimize the impact on microclimate (i.e. the heat island effect), and minimize surface runoff. Additional advantages over traditional black or white reflective rooftops, include energy reduction and noise insulation. Green roofs have been used extensively in Germany for years and the City of Chicago has made it a planning priority for new developments in the city centre.7 A green roof costs anywhere between $12.50 and $28 a foot in addition to the traditional roofing needed on a building.8
5 Communication with Eric Trulove Renschler Corp. Madison WI (Three Green Globes and two LEED certified buildings in the USA ) Wed 1/17/2007 6 This would require energy conserving steps such as: installing 13 SEER instead of 10 SEER, installing high-efficiency heating equipment (92 AFUE instead of 78 AFUE), 7 More information at: http://www.inhabitat.com/2006/08/01/chicago-green-roof-program/ 8 Communication with Tom Taylor Alberici LEED Platimum Wed 1/17/2007
D.5 Energy Infrastructure e.g. district energy system.9 A district energy system distributes thermal energy by using a pipeline distribution system. Thermal energy may be distributed using either steam - or, in newer systems, hot water. Central thermal plants can use various types of fuel including natural gas, oil or renewable energy. According to the National Renewable Energy Laboratory “Renewable Energy Trends” report10 small biomass cogeneration at the district energy level may offer the greatest potential for implementation of the use of renewable fuels at the lowest capital cost. (See figure 3) Heat may be generated from either purchased fuel or waste heat from smaller-scale gas fired engines or turbines. The Town of Markham has made a very large investment in this type energy system.11 The University of Ontario (UOIT) has constructed a geothermal district energy system that uses stored ground water heat as its thermal transfer mechanism. The UOIT system is remarkably efficient and does not rely on non-renewable resources like natural gas. The bore-hole technology, which the university uses, reduces thermal energy cost by 75% 12
E.12 Greywater / blackwater systems The objective is to reduce off-site treatment of water by reusing water for non-potable uses.
9 The Benefits of District Energy http://www.enwave.com/enwave/view.asp?/solutions/heating/benefits 10 Renewable Energy Trends, Navigant Consulting, November 24, 2004 11 More information at: http://www.markhamdistrictenergy.com 12More information at: http://www.uoit.ca/
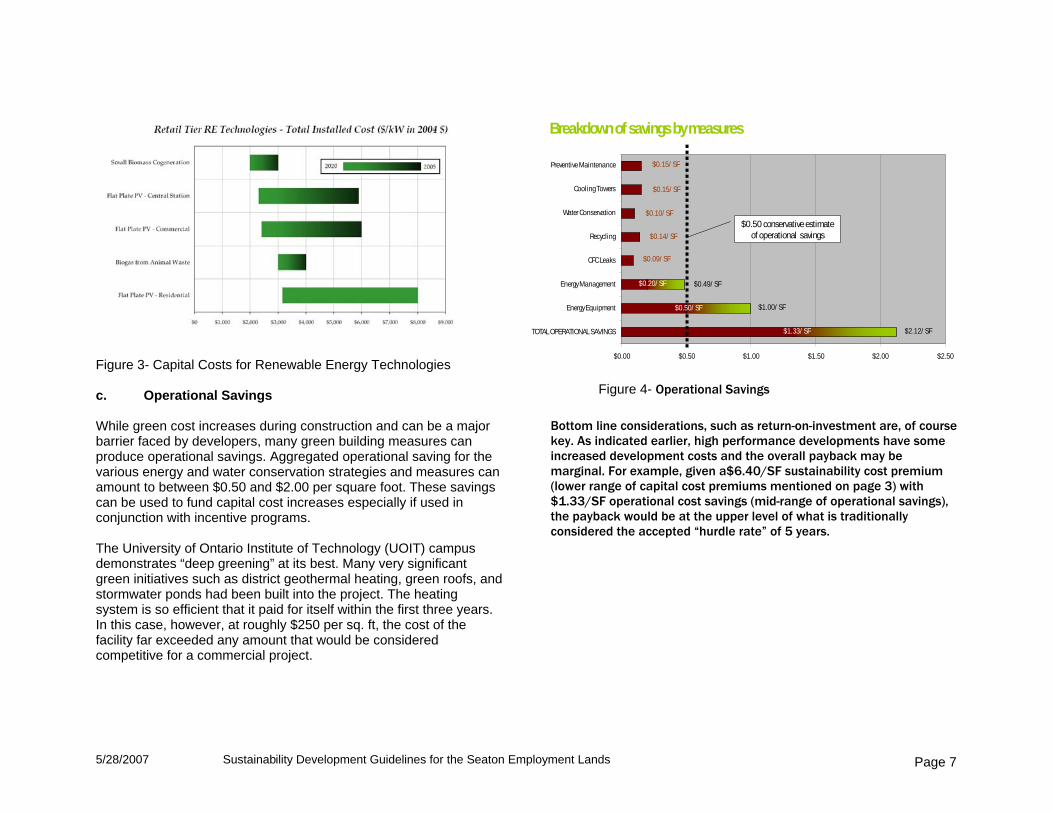
5/28/2007 Sustainability Development Guidelines for the Seaton Employment Lands Page 7
Figure 3- Capital Costs for Renewable Energy Technologies c. Operational Savings While green cost increases during construction and can be a major barrier faced by developers, many green building measures can produce operational savings. Aggregated operational saving for the various energy and water conservation strategies and measures can amount to between $0.50 and $2.00 per square foot. These savings can be used to fund capital cost increases especially if used in conjunction with incentive programs. The University of Ontario Institute of Technology (UOIT) campus demonstrates “deep greening” at its best. Many very significant green initiatives such as district geothermal heating, green roofs, and stormwater ponds had been built into the project. The heating system is so efficient that it paid for itself within the first three years. In this case, however, at roughly $250 per sq. ft, the cost of the facility far exceeded any amount that would be considered competitive for a commercial project.
$0.20/ SF
$0.50/ SF
$1.33/ SF
$0.09/ SF
$0.14/ SF
$0.10/ SF
$0.15/ SF
$0.15/ SF
$0.49/ SF
$1.00/ SF
$2.12/ SF
$0.00 $0.50 $1.00 $1.50 $2.00 $2.50
TOTAL OPERATIONAL SAVINGS
Energy Equipment
Energy Management
CFC Leaks
Recycling
Water Conservation
Cooling Towers
Preventive Maintenance
$0.50 conservative estimateof operational savings
Breakdown of savings by measures
Figure 4- Operational Savings
Bottom line considerations, such as return-on-investment are, of course key. As indicated earlier, high performance developments have some increased development costs and the overall payback may be marginal. For example, given a$6.40/SF sustainability cost premium (lower range of capital cost premiums mentioned on page 3) with $1.33/SF operational cost savings (mid-range of operational savings), the payback would be at the upper level of what is traditionally considered the accepted “hurdle rate” of 5 years.
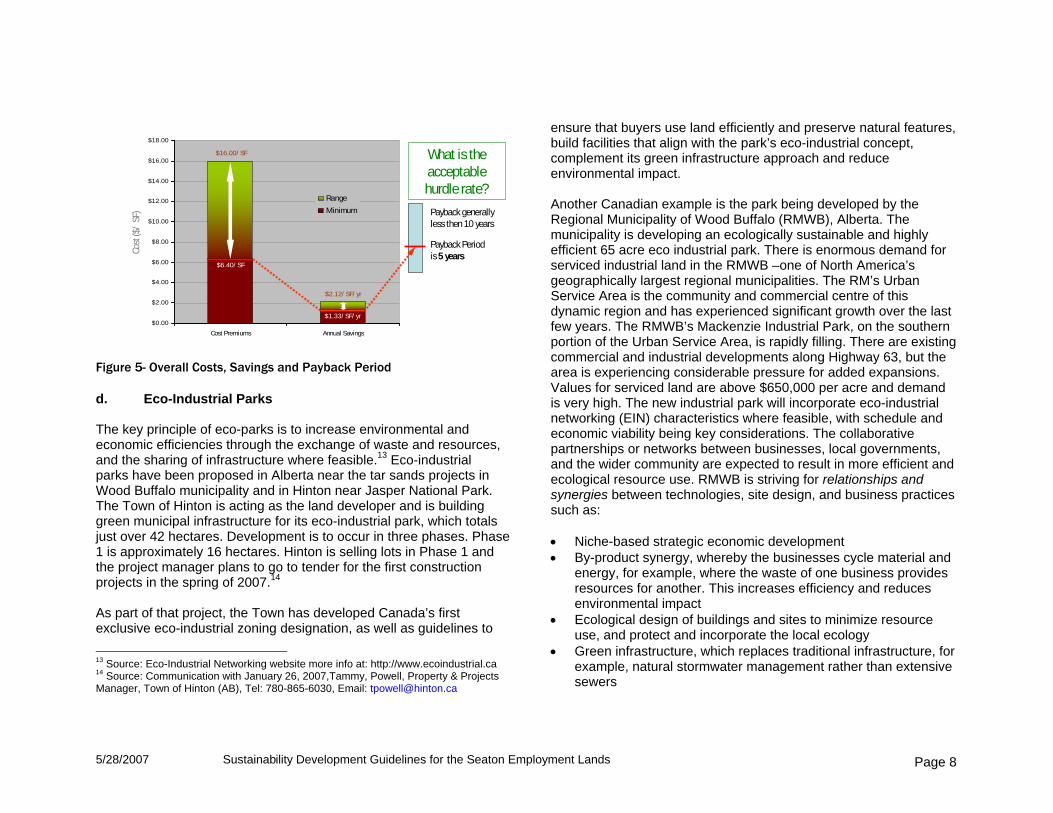
5/28/2007 Sustainability Development Guidelines for the Seaton Employment Lands Page 8
$1.33/ SF/ yr
$6.40/ SF
$2.12/ SF/ yr
$16.00/ SF
$0.00
$2.00
$4.00
$6.00
$8.00
$10.00
$12.00
$14.00
$16.00
$18.00
Cost Premiums Annual Savings
RangeMinimum
Payback Period is 5 yearsCo
st ($
/ SF
)
What is the acceptable hurdle rate?
Payback generally less then 10 years
Figure 5- Overall Costs, Savings and Payback Period d. Eco-Industrial Parks The key principle of eco-parks is to increase environmental and economic efficiencies through the exchange of waste and resources, and the sharing of infrastructure where feasible.13 Eco-industrial parks have been proposed in Alberta near the tar sands projects in Wood Buffalo municipality and in Hinton near Jasper National Park. The Town of Hinton is acting as the land developer and is building green municipal infrastructure for its eco-industrial park, which totals just over 42 hectares. Development is to occur in three phases. Phase 1 is approximately 16 hectares. Hinton is selling lots in Phase 1 and the project manager plans to go to tender for the first construction projects in the spring of 2007.14 As part of that project, the Town has developed Canada’s first exclusive eco-industrial zoning designation, as well as guidelines to 13 Source: Eco-Industrial Networking website more info at: http://www.ecoindustrial.ca 14 Source: Communication with January 26, 2007,Tammy, Powell, Property & Projects Manager, Town of Hinton (AB), Tel: 780-865-6030, Email: [email protected]
ensure that buyers use land efficiently and preserve natural features, build facilities that align with the park’s eco-industrial concept, complement its green infrastructure approach and reduce environmental impact. Another Canadian example is the park being developed by the Regional Municipality of Wood Buffalo (RMWB), Alberta. The municipality is developing an ecologically sustainable and highly efficient 65 acre eco industrial park. There is enormous demand for serviced industrial land in the RMWB –one of North America’s geographically largest regional municipalities. The RM’s Urban Service Area is the community and commercial centre of this dynamic region and has experienced significant growth over the last few years. The RMWB’s Mackenzie Industrial Park, on the southern portion of the Urban Service Area, is rapidly filling. There are existing commercial and industrial developments along Highway 63, but the area is experiencing considerable pressure for added expansions. Values for serviced land are above $650,000 per acre and demand is very high. The new industrial park will incorporate eco-industrial networking (EIN) characteristics where feasible, with schedule and economic viability being key considerations. The collaborative partnerships or networks between businesses, local governments, and the wider community are expected to result in more efficient and ecological resource use. RMWB is striving for relationships and synergies between technologies, site design, and business practices such as: • Niche-based strategic economic development • By-product synergy, whereby the businesses cycle material and
energy, for example, where the waste of one business provides resources for another. This increases efficiency and reduces environmental impact
• Ecological design of buildings and sites to minimize resource use, and protect and incorporate the local ecology
• Green infrastructure, which replaces traditional infrastructure, for example, natural stormwater management rather than extensive sewers
5/28/2007 Sustainability Development Guidelines for the Seaton Employment Lands Page 9
• Networking services that enable businesses to save money by sharing services, such as transportation.
Both communities hope to entice industries that have a symbiotic relationship with each other. These sites are relatively small and compare in size larger parcels in the Seaton Employment Lands. The eco-park model is not a new concept. It has been successful for over 20 years in Denmark in the town of Kalundborg where a group of industries have been able to supply each others needs and increase profitability while reducing waste and environmental damage.
e. Implementation Incentives
Incentives can act as an equalizer to offset the increased capital costs of high-performance buildings. The following are a number of such incentives: grants and loans such as subsidized land or occupancies; fee reductions such as development charges and application fees; financing techniques such as revolving loan funds and guarantees; and tax measures such as tax increment financing and grants.
4. Conclusions: Were the example Development Sustainability Guidelines discussed in this Appendix to be implemented, a “deep greening” of the Seaton Employment Lands would be achieved. However, to do so, would require a quite different development strategy than is currently followed. The implications of changing the way development is undertaken would require a detailed investigation to test the feasibility of concepts such as a campus-style eco-industrial park with district energy services. Such a study would need to consider savings in building operations as a way to pay for additional capital costs. Discounting the cost of land and/or amortizing the capital costs of district-wide services would also have to be considered in
order to pay for the up front cost premiums associated with such “deep green” initiatives. However, with careful planning and analysis, the Seaton employment lands could be developed using innovative sustainable development guidelines while remaining competitive with other employment land locations.

ECD Energy and Environment Canada Ltd. – Sustainable Development Guidelines
SUSTAINABLE DEVELOPMENT GUIDELINES FOR SEATON
EMPLOYMENT LANDS
Highway 407 (Seaton) Employment Lands Study
January, 2007
ECD Energy and Environment Canada Ltd. – Sustainable Development Guidelines 1
SUSTAINABLE DEVELOPMENT GUIDELINES FOR SEATON EMPLOYMENT LANDS Highway 407 (Seaton) Employment Land Study
TABLE OF CONTENTS Introduction ............................................................................................................. 2 A Site and Land Use Efficiency Questionnaire ........................................................... 3 B Site and Transportation Questionnaire.................................................................... 4 C Site and Biodiversity Questionnaire ........................................................................ 5 D Energy and Air Quality Questionnaire ..................................................................... 7 E Water and Liquid Questionnaire.............................................................................. 8 F Resources and Solid Waste Questionnaire........................................................... 11 G Economic Sustainability Questionnaire ................................................................. 12 H Social Sustainability Questionnaire ....................................................................... 13 A Site and Land Use Efficiency Background Information ......................................... 14 B Site and Transportation Background Information .................................................. 16 C Site and Biodiversity Background Information....................................................... 18 D Energy and Air Quality Background Information ................................................... 21 E Water and Liquid Background Information ............................................................ 24 F Resources and Solid Waste Background Information ........................................... 33 G Economic Sustainability Background Information ................................................. 36 H Social Sustainability Background Information ....................................................... 39
ECD Energy and Environment Canada Ltd. – Sustainable Development Guidelines 2
Introduction This document can be used to guide sustainable choices for land use development in Highway 407 (Seaton) Employment Lands, Central Pickering. It supports many other initiatives underway in the city that reflect sustainable thinking. Its purpose is to illustrate how the planning department could monitor the achievement of sustainable goals and the extent to which developments in Highway 407 (Seaton) Employment Lands comply with the City’s Sustainable policies. It could also be used to assist the municipal planners in the preparation and review of site plan development approval submissions to ensure that these meet the criteria in accordance with the City sustainable policies. It is intended for a broad cross-section of people in both the public and private sector, including residents, property owners and managers, developers, architects, and municipal planners, policy makers and politicians, this document is intended to be: This documents provides:
• An introduction to the principles and practices of environmental sustainability. • A resource guide on sustainable development practices. • A complement to planning application forms that will help developers and architects incorporate sustainable design from a project’s
outset. • A example of checklist for municipal planners to aid in the monitoring and review of development applications, and to ensure that
development submissions meet sustainability goals laid out in the Highway 407 (Seaton) Employment Lands and City of Pickering Sustainability Guidelines.
• A monitoring tool that measures the growth of sustainable practices in the City of Pickering. How to Use this Document ECD has identified five broad areas of sustainability for the region to concentrate on: Site and Land Use Efficiency, Site and Transportation, Site and Biodiversity, Energy and Air Quality, Water and Liquid Waste, Resources and Solid Waste, Economic and Social Sustainability. Each area of sustainability is divided into two parts:
1 Questionnaire and Checklist Issues concerning each area of sustainability are outlined in an easy-to-read table format that identifies objectives, questions and suggested practices for each issue. Associated with each question is a Yes/No/NA checklist that helps readers determine whether or not an issue has been properly addressed.
2 Background Information
A short description of each sustainability issue provides a brief assessment of current practices and their environmental impacts, and identifies areas for change and improvement. Included with each description is a list of online resources which readers can access for further information.
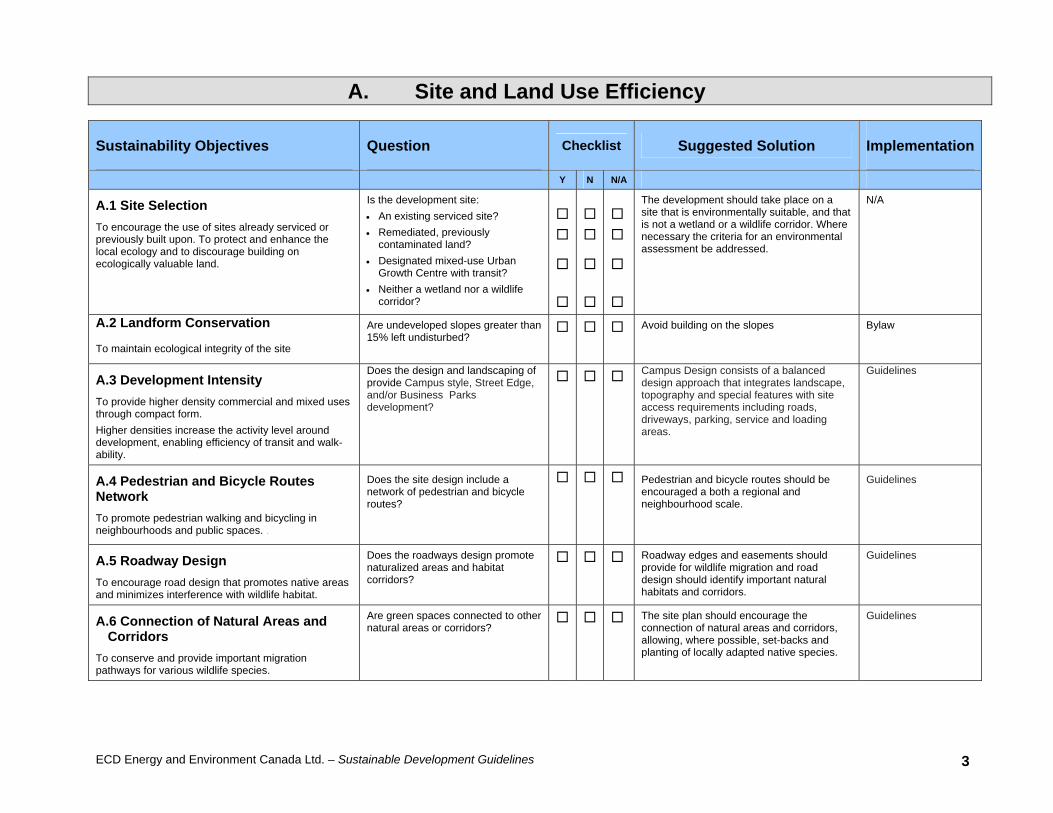
ECD Energy and Environment Canada Ltd. – Sustainable Development Guidelines 3
A. Site and Land Use Efficiency
Sustainability Objectives Question Checklist Suggested Solution Implementation
Y N N/A
A.1 Site Selection To encourage the use of sites already serviced or previously built upon. To protect and enhance the local ecology and to discourage building on ecologically valuable land.
Is the development site: • An existing serviced site? • Remediated, previously
contaminated land? • Designated mixed-use Urban
Growth Centre with transit? • Neither a wetland nor a wildlife
corridor?
The development should take place on a site that is environmentally suitable, and that is not a wetland or a wildlife corridor. Where necessary the criteria for an environmental assessment be addressed.
N/A
A.2 Landform Conservation To maintain ecological integrity of the site
Are undeveloped slopes greater than 15% left undisturbed?
Avoid building on the slopes Bylaw
A.3 Development Intensity To provide higher density commercial and mixed uses through compact form. Higher densities increase the activity level around development, enabling efficiency of transit and walk-ability.
Does the design and landscaping of provide Campus style, Street Edge, and/or Business Parks development?
Campus Design consists of a balanced design approach that integrates landscape, topography and special features with site access requirements including roads, driveways, parking, service and loading areas.
Guidelines
A.4 Pedestrian and Bicycle Routes Network To promote pedestrian walking and bicycling in neighbourhoods and public spaces. .
Does the site design include a network of pedestrian and bicycle routes?
Pedestrian and bicycle routes should be encouraged a both a regional and neighbourhood scale.
Guidelines
A.5 Roadway Design To encourage road design that promotes native areas and minimizes interference with wildlife habitat.
Does the roadways design promote naturalized areas and habitat corridors?
Roadway edges and easements should provide for wildlife migration and road design should identify important natural habitats and corridors.
Guidelines
A.6 Connection of Natural Areas and Corridors
To conserve and provide important migration pathways for various wildlife species.
Are green spaces connected to other natural areas or corridors?
The site plan should encourage the connection of natural areas and corridors, allowing, where possible, set-backs and planting of locally adapted native species.
Guidelines
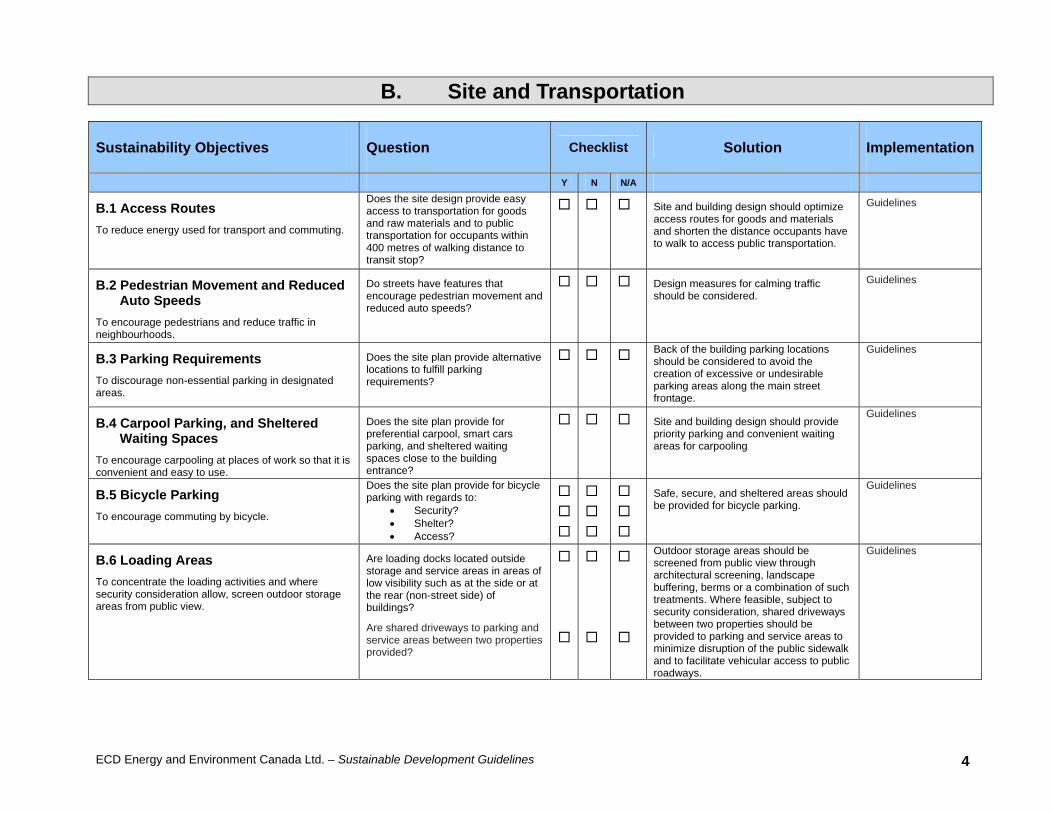
ECD Energy and Environment Canada Ltd. – Sustainable Development Guidelines 4
B. Site and Transportation
Sustainability Objectives Question Checklist Solution Implementation
Y N N/A
B.1 Access Routes To reduce energy used for transport and commuting.
Does the site design provide easy access to transportation for goods and raw materials and to public transportation for occupants within 400 metres of walking distance to transit stop?
Site and building design should optimize access routes for goods and materials and shorten the distance occupants have to walk to access public transportation.
Guidelines
B.2 Pedestrian Movement and Reduced Auto Speeds
To encourage pedestrians and reduce traffic in neighbourhoods.
Do streets have features that encourage pedestrian movement and reduced auto speeds?
Design measures for calming traffic should be considered.
Guidelines
B.3 Parking Requirements To discourage non-essential parking in designated areas.
Does the site plan provide alternative locations to fulfill parking requirements?
Back of the building parking locations should be considered to avoid the creation of excessive or undesirable parking areas along the main street frontage.
Guidelines
B.4 Carpool Parking, and Sheltered Waiting Spaces
To encourage carpooling at places of work so that it is convenient and easy to use.
Does the site plan provide for preferential carpool, smart cars parking, and sheltered waiting spaces close to the building entrance?
Site and building design should provide priority parking and convenient waiting areas for carpooling
Guidelines
B.5 Bicycle Parking To encourage commuting by bicycle.
Does the site plan provide for bicycle parking with regards to:
• Security? • Shelter? • Access?
Safe, secure, and sheltered areas should be provided for bicycle parking.
Guidelines
B.6 Loading Areas To concentrate the loading activities and where security consideration allow, screen outdoor storage areas from public view.
Are loading docks located outside storage and service areas in areas of low visibility such as at the side or at the rear (non-street side) of buildings?
Are shared driveways to parking and service areas between two properties provided?
Outdoor storage areas should be screened from public view through architectural screening, landscape buffering, berms or a combination of such treatments. Where feasible, subject to security consideration, shared driveways between two properties should be provided to parking and service areas to minimize disruption of the public sidewalk and to facilitate vehicular access to public roadways.
Guidelines
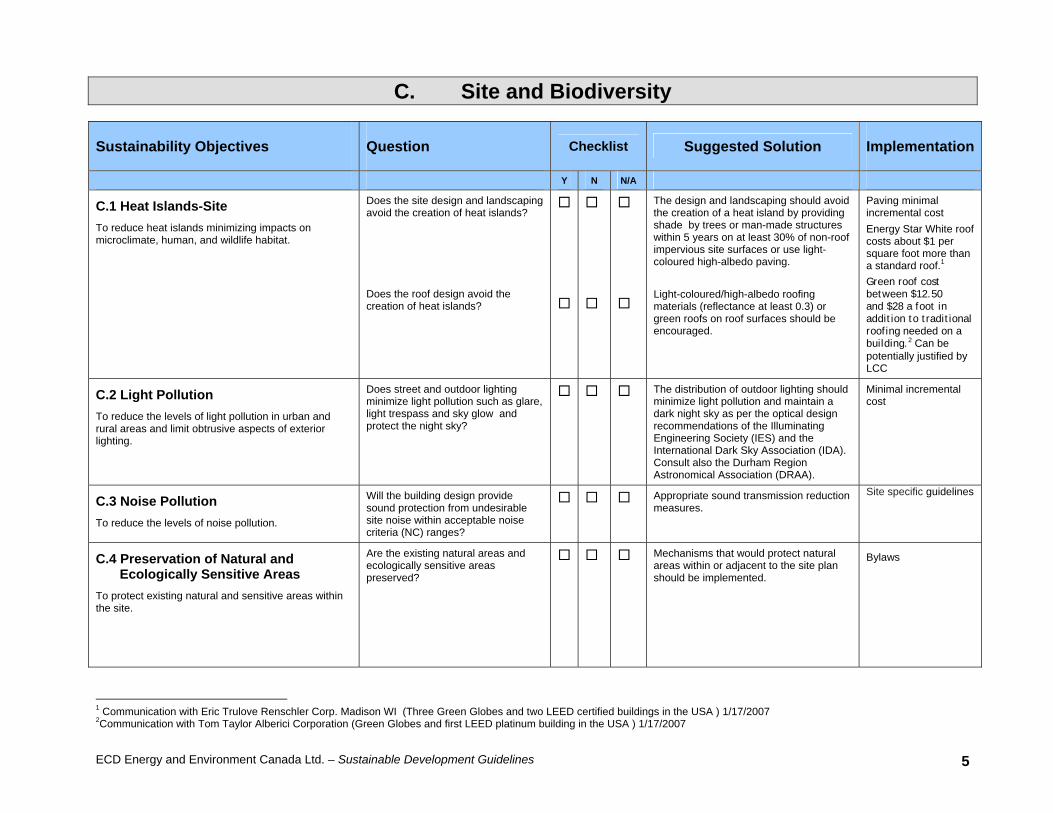
ECD Energy and Environment Canada Ltd. – Sustainable Development Guidelines 5
C. Site and Biodiversity
Sustainability Objectives Question Checklist Suggested Solution Implementation
Y N N/A
C.1 Heat Islands-Site To reduce heat islands minimizing impacts on microclimate, human, and wildlife habitat.
Does the site design and landscaping avoid the creation of heat islands? Does the roof design avoid the creation of heat islands?
The design and landscaping should avoid the creation of a heat island by providing shade by trees or man-made structures within 5 years on at least 30% of non-roof impervious site surfaces or use light-coloured high-albedo paving. Light-coloured/high-albedo roofing materials (reflectance at least 0.3) or green roofs on roof surfaces should be encouraged.
Paving minimal incremental cost Energy Star White roof costs about $1 per square foot more than a standard roof.1 Green roof cost between $12.50 and $28 a foot in addition to traditional roofing needed on a building.2 Can be potentially justified by LCC
C.2 Light Pollution To reduce the levels of light pollution in urban and rural areas and limit obtrusive aspects of exterior lighting.
Does street and outdoor lighting minimize light pollution such as glare, light trespass and sky glow and protect the night sky?
The distribution of outdoor lighting should minimize light pollution and maintain a dark night sky as per the optical design recommendations of the Illuminating Engineering Society (IES) and the International Dark Sky Association (IDA). Consult also the Durham Region Astronomical Association (DRAA).
Minimal incremental cost
C.3 Noise Pollution To reduce the levels of noise pollution.
Will the building design provide sound protection from undesirable site noise within acceptable noise criteria (NC) ranges?
Appropriate sound transmission reduction measures.
Site specific guidelines
C.4 Preservation of Natural and Ecologically Sensitive Areas
To protect existing natural and sensitive areas within the site.
Are the existing natural areas and ecologically sensitive areas preserved?
Mechanisms that would protect natural areas within or adjacent to the site plan should be implemented.
Bylaws
1 Communication with Eric Trulove Renschler Corp. Madison WI (Three Green Globes and two LEED certified buildings in the USA ) 1/17/2007 2Communication with Tom Taylor Alberici Corporation (Green Globes and first LEED platinum building in the USA ) 1/17/2007
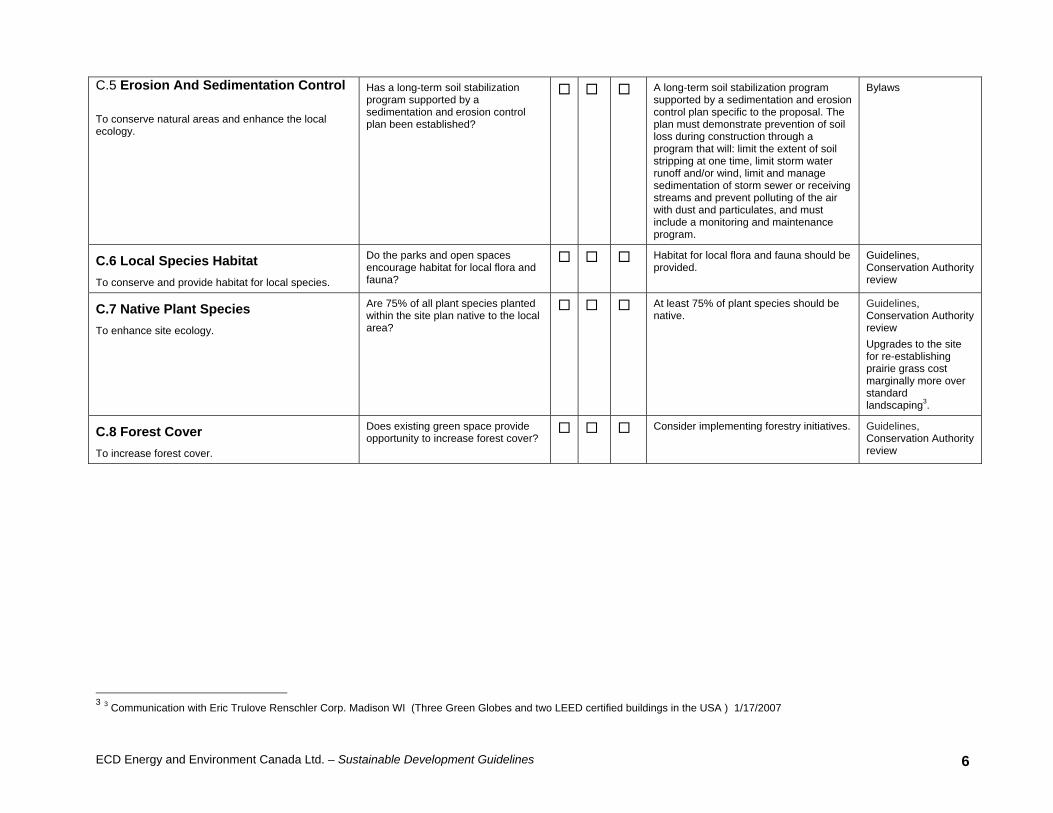
ECD Energy and Environment Canada Ltd. – Sustainable Development Guidelines 6
C.5 Erosion And Sedimentation Control To conserve natural areas and enhance the local ecology.
Has a long-term soil stabilization program supported by a sedimentation and erosion control plan been established?
A long-term soil stabilization program supported by a sedimentation and erosion control plan specific to the proposal. The plan must demonstrate prevention of soil loss during construction through a program that will: limit the extent of soil stripping at one time, limit storm water runoff and/or wind, limit and manage sedimentation of storm sewer or receiving streams and prevent polluting of the air with dust and particulates, and must include a monitoring and maintenance program.
Bylaws
C.6 Local Species Habitat To conserve and provide habitat for local species.
Do the parks and open spaces encourage habitat for local flora and fauna?
Habitat for local flora and fauna should be provided.
Guidelines, Conservation Authority review
C.7 Native Plant Species To enhance site ecology.
Are 75% of all plant species planted within the site plan native to the local area?
At least 75% of plant species should be native.
Guidelines, Conservation Authority review Upgrades to the site for re-establishing prairie grass cost marginally more over standard landscaping3.
C.8 Forest Cover To increase forest cover.
Does existing green space provide opportunity to increase forest cover?
Consider implementing forestry initiatives.
Guidelines, Conservation Authority review
3 3 Communication with Eric Trulove Renschler Corp. Madison WI (Three Green Globes and two LEED certified buildings in the USA ) 1/17/2007

ECD Energy and Environment Canada Ltd. – Sustainable Development Guidelines 7
D. Energy and Air Quality
Sustainability Objectives Question Checklist Solution Implementation
Y N N/A
D.1 Energy Performance To reduce energy consumption in buildings beyond minimum requirements.
Does the building design achieve 25% reduction relative to the consumption of the reference building designed to the Model National Energy Code for Buildings 1997 (MNECB).
Use accepted energy modelling protocol (such as .CBIP) to document the achievement of 25% energy reduction relative to MNECB.
Studies show that 30-35% energy reduction relative to MNECB are possible with approx. 6% cost increase4
D.2 Microclimatic Conditions To reduce the need for energy consumption, increase comfort and mitigate the urban heat island effect by improving local microclimate conditions.
Does site plan provide the following microclimatic conditions:
• Maximum community solar access and day lighting?
• Minimal wind and snow effects?
• Trees and windbreaks for shade?
The site plan should optimize microclimatic conditions on the site by maximizing solar access, minimizing wind and snow exposure and employing trees and windbreaks.
Guidelines
D.3 South Orientation To encourage energy savings and maximize the potential for sunlight and natural ventilation in heating and cooling applications.
Are buildings oriented south to provide opportunities for passive heating, cooling and hybrid or natural ventilation?
Buildings should be oriented south to encourage the integration of passive building systems and to reduce energy consumption.
Guidelines
D.4 Renewable Energy To encourage the use of renewable energy in street furniture and buildings.
Are renewable energy systems integrated into street furniture or building design?
Renewable energy systems should be considered for street furniture and building design.
Medium to significant incremental cost.
D.5 Pollution Sources To identify and mitigate environmental impacts from point source and non-point source pollution sources.
Are there any pollution sources which could affect the development identified?
Possible sources of point source and non-point source pollution should be sufficiently investigated.
Ontario. Regulation 127/01
4 Communication with the NRCan (CBIP) office
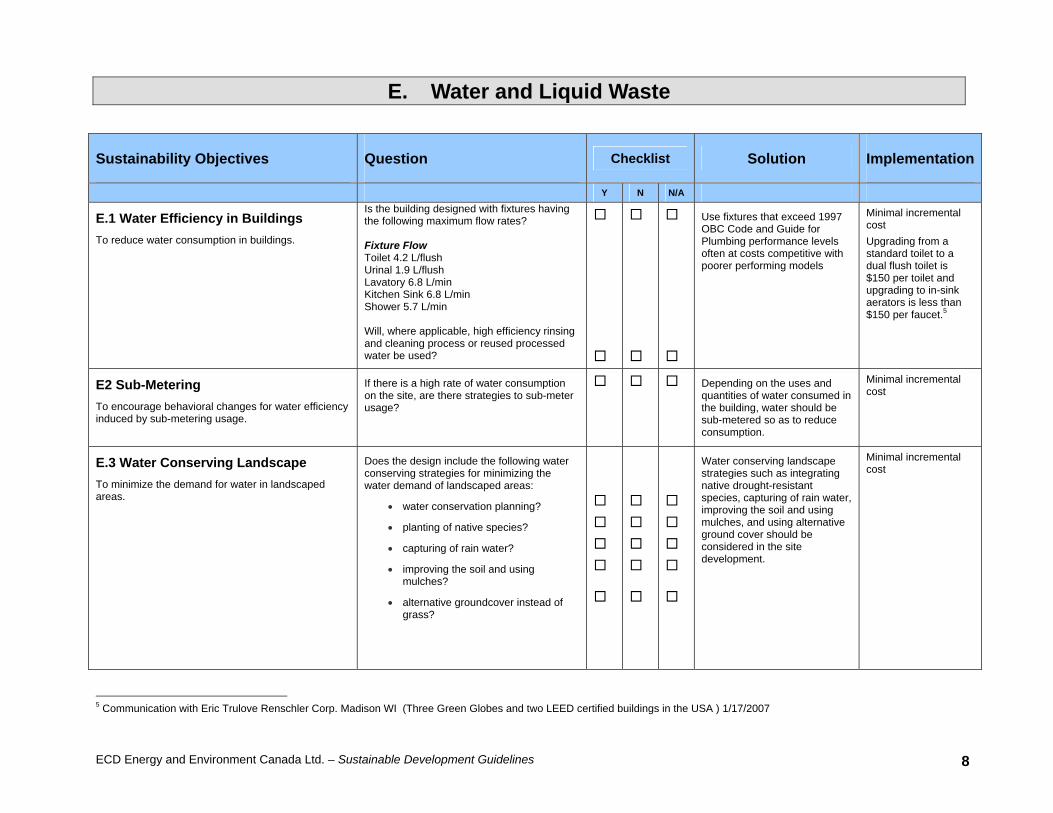
ECD Energy and Environment Canada Ltd. – Sustainable Development Guidelines 8
E. Water and Liquid Waste
Sustainability Objectives Question Checklist Solution Implementation
Y N N/A
E.1 Water Efficiency in Buildings To reduce water consumption in buildings.
Is the building designed with fixtures having the following maximum flow rates? Fixture Flow Toilet 4.2 L/flush Urinal 1.9 L/flush Lavatory 6.8 L/min Kitchen Sink 6.8 L/min Shower 5.7 L/min Will, where applicable, high efficiency rinsing and cleaning process or reused processed water be used?
Use fixtures that exceed 1997 OBC Code and Guide for Plumbing performance levels often at costs competitive with poorer performing models
Minimal incremental cost Upgrading from a standard toilet to a dual flush toilet is $150 per toilet and upgrading to in-sink aerators is less than $150 per faucet.5
E2 Sub-Metering To encourage behavioral changes for water efficiency induced by sub-metering usage.
If there is a high rate of water consumption on the site, are there strategies to sub-meter usage?
Depending on the uses and quantities of water consumed in the building, water should be sub-metered so as to reduce consumption.
Minimal incremental cost
E.3 Water Conserving Landscape To minimize the demand for water in landscaped areas.
Does the design include the following water conserving strategies for minimizing the water demand of landscaped areas:
• water conservation planning?
• planting of native species?
• capturing of rain water?
• improving the soil and using mulches?
• alternative groundcover instead of grass?
Water conserving landscape strategies such as integrating native drought-resistant species, capturing of rain water, improving the soil and using mulches, and using alternative ground cover should be considered in the site development.
Minimal incremental cost
5 Communication with Eric Trulove Renschler Corp. Madison WI (Three Green Globes and two LEED certified buildings in the USA ) 1/17/2007
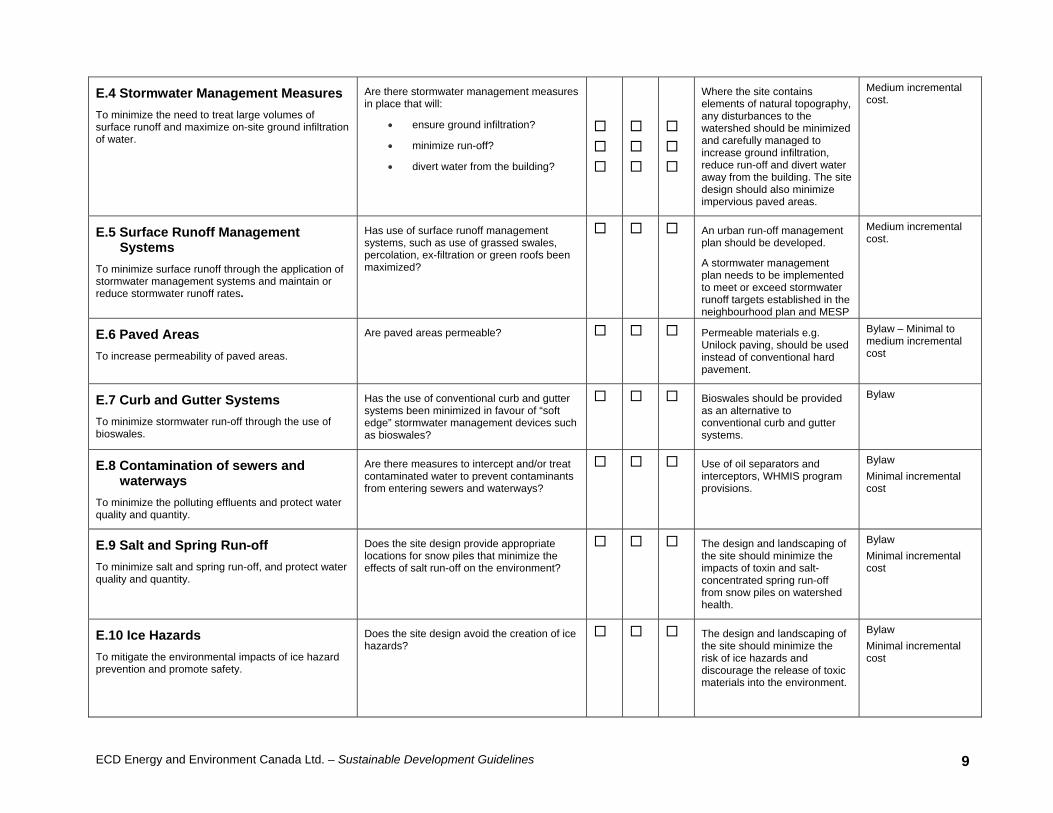
ECD Energy and Environment Canada Ltd. – Sustainable Development Guidelines 9
E.4 Stormwater Management Measures To minimize the need to treat large volumes of surface runoff and maximize on-site ground infiltration of water.
Are there stormwater management measures in place that will:
• ensure ground infiltration?
• minimize run-off?
• divert water from the building?
Where the site contains elements of natural topography, any disturbances to the watershed should be minimized and carefully managed to increase ground infiltration, reduce run-off and divert water away from the building. The site design should also minimize impervious paved areas.
Medium incremental cost.
E.5 Surface Runoff Management Systems
To minimize surface runoff through the application of stormwater management systems and maintain or reduce stormwater runoff rates.
Has use of surface runoff management systems, such as use of grassed swales, percolation, ex-filtration or green roofs been maximized?
An urban run-off management plan should be developed.
A stormwater management plan needs to be implemented to meet or exceed stormwater runoff targets established in the neighbourhood plan and MESP
Medium incremental cost.
E.6 Paved Areas To increase permeability of paved areas.
Are paved areas permeable? Permeable materials e.g. Unilock paving, should be used instead of conventional hard pavement.
Bylaw – Minimal to medium incremental cost
E.7 Curb and Gutter Systems To minimize stormwater run-off through the use of bioswales.
Has the use of conventional curb and gutter systems been minimized in favour of “soft edge” stormwater management devices such as bioswales?
Bioswales should be provided as an alternative to conventional curb and gutter systems.
Bylaw
E.8 Contamination of sewers and waterways
To minimize the polluting effluents and protect water quality and quantity.
Are there measures to intercept and/or treat contaminated water to prevent contaminants from entering sewers and waterways?
Use of oil separators and interceptors, WHMIS program provisions.
Bylaw Minimal incremental cost
E.9 Salt and Spring Run-off To minimize salt and spring run-off, and protect water quality and quantity.
Does the site design provide appropriate locations for snow piles that minimize the effects of salt run-off on the environment?
The design and landscaping of the site should minimize the impacts of toxin and salt-concentrated spring run-off from snow piles on watershed health.
Bylaw Minimal incremental cost
E.10 Ice Hazards To mitigate the environmental impacts of ice hazard prevention and promote safety.
Does the site design avoid the creation of ice hazards?
The design and landscaping of the site should minimize the risk of ice hazards and discourage the release of toxic materials into the environment.
Bylaw Minimal incremental cost
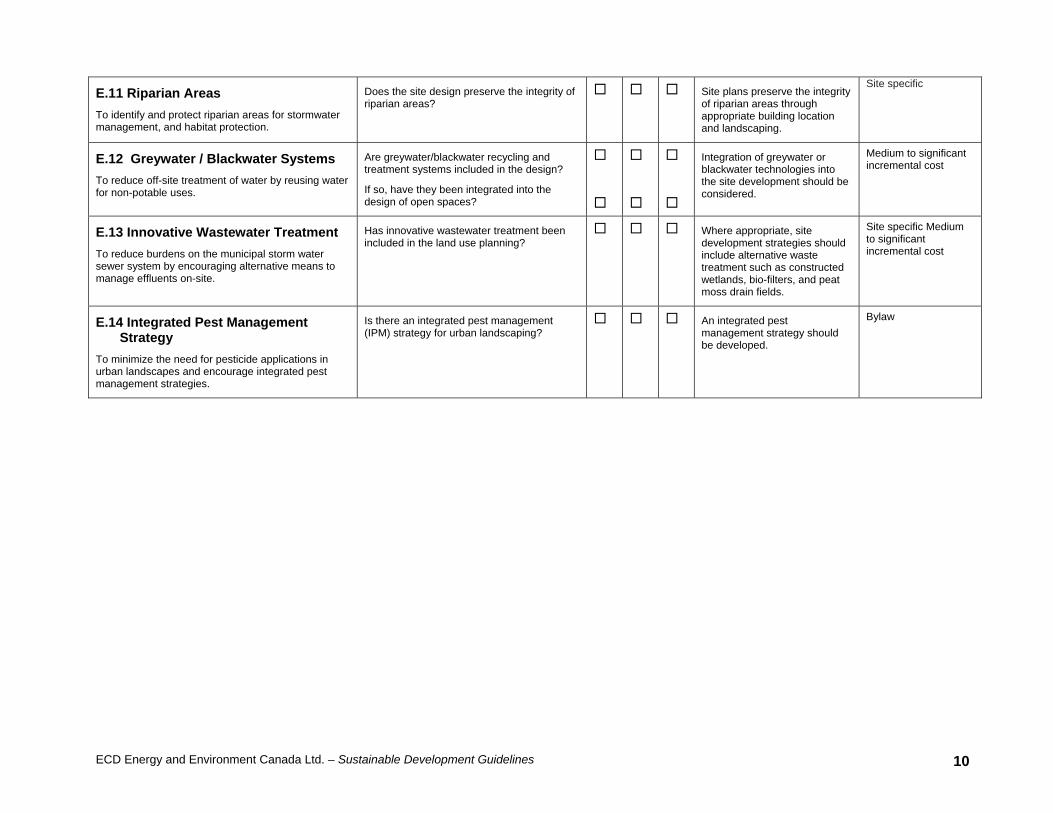
ECD Energy and Environment Canada Ltd. – Sustainable Development Guidelines 10
E.11 Riparian Areas To identify and protect riparian areas for stormwater management, and habitat protection.
Does the site design preserve the integrity of riparian areas?
Site plans preserve the integrity of riparian areas through appropriate building location and landscaping.
Site specific
E.12 Greywater / Blackwater Systems To reduce off-site treatment of water by reusing water for non-potable uses.
Are greywater/blackwater recycling and treatment systems included in the design?
If so, have they been integrated into the design of open spaces?
Integration of greywater or blackwater technologies into the site development should be considered.
Medium to significant incremental cost
E.13 Innovative Wastewater Treatment To reduce burdens on the municipal storm water sewer system by encouraging alternative means to manage effluents on-site.
Has innovative wastewater treatment been included in the land use planning?
Where appropriate, site development strategies should include alternative waste treatment such as constructed wetlands, bio-filters, and peat moss drain fields.
Site specific Medium to significant incremental cost
E.14 Integrated Pest Management Strategy
To minimize the need for pesticide applications in urban landscapes and encourage integrated pest management strategies.
Is there an integrated pest management (IPM) strategy for urban landscaping?
An integrated pest management strategy should be developed.
Bylaw
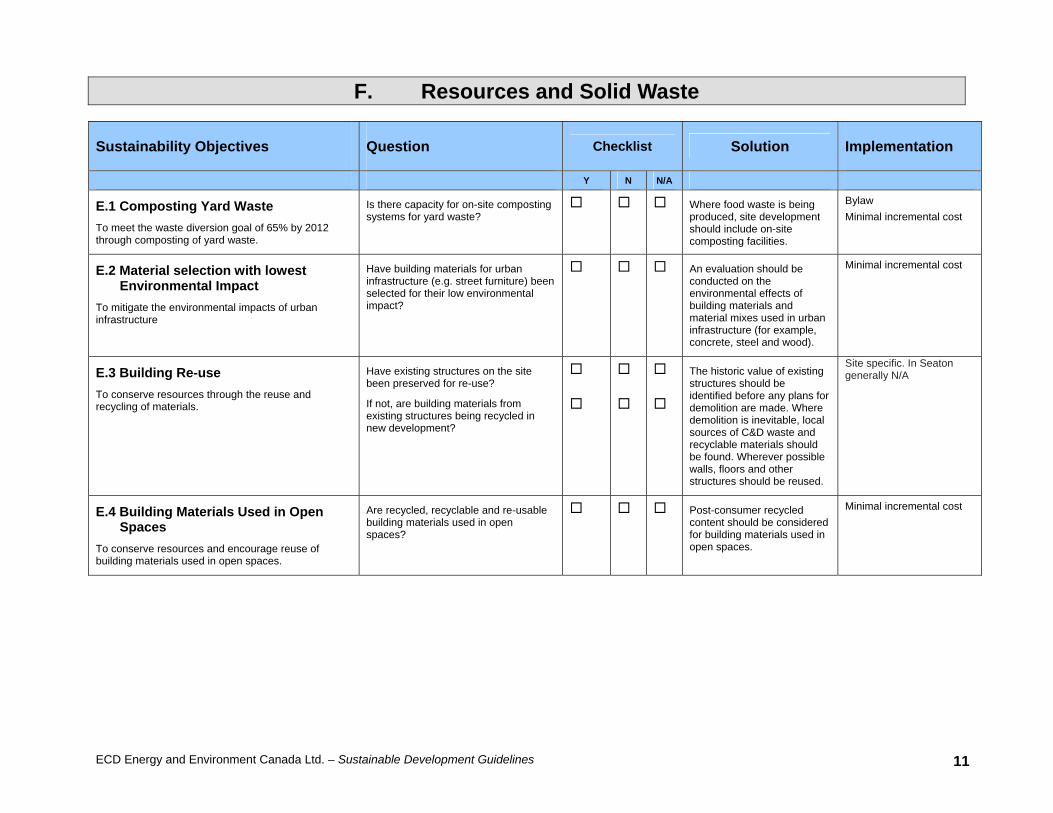
ECD Energy and Environment Canada Ltd. – Sustainable Development Guidelines 11
F. Resources and Solid Waste
Sustainability Objectives Question Checklist Solution Implementation
Y N N/A
E.1 Composting Yard Waste To meet the waste diversion goal of 65% by 2012 through composting of yard waste.
Is there capacity for on-site composting systems for yard waste?
Where food waste is being produced, site development should include on-site composting facilities.
Bylaw Minimal incremental cost
E.2 Material selection with lowest Environmental Impact
To mitigate the environmental impacts of urban infrastructure
Have building materials for urban infrastructure (e.g. street furniture) been selected for their low environmental impact?
An evaluation should be conducted on the environmental effects of building materials and material mixes used in urban infrastructure (for example, concrete, steel and wood).
Minimal incremental cost
E.3 Building Re-use To conserve resources through the reuse and recycling of materials.
Have existing structures on the site been preserved for re-use?
If not, are building materials from existing structures being recycled in new development?
The historic value of existing structures should be identified before any plans for demolition are made. Where demolition is inevitable, local sources of C&D waste and recyclable materials should be found. Wherever possible walls, floors and other structures should be reused.
Site specific. In Seaton generally N/A
E.4 Building Materials Used in Open Spaces
To conserve resources and encourage reuse of building materials used in open spaces.
Are recycled, recyclable and re-usable building materials used in open spaces?
Post-consumer recycled content should be considered for building materials used in open spaces.
Minimal incremental cost
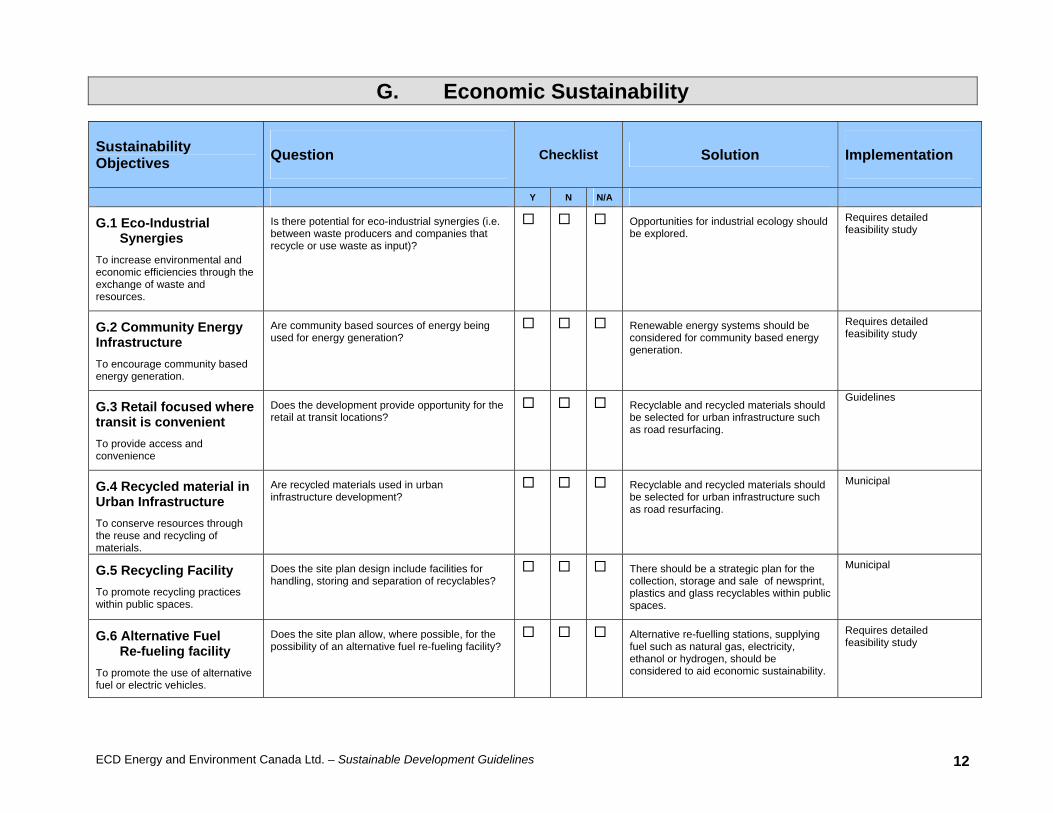
ECD Energy and Environment Canada Ltd. – Sustainable Development Guidelines 12
G. Economic Sustainability
Sustainability Objectives Question Checklist Solution Implementation
Y N N/A
G.1 Eco-Industrial Synergies
To increase environmental and economic efficiencies through the exchange of waste and resources.
Is there potential for eco-industrial synergies (i.e. between waste producers and companies that recycle or use waste as input)?
Opportunities for industrial ecology should be explored.
Requires detailed feasibility study
G.2 Community Energy Infrastructure To encourage community based energy generation.
Are community based sources of energy being used for energy generation?
Renewable energy systems should be considered for community based energy generation.
Requires detailed feasibility study
G.3 Retail focused where transit is convenient To provide access and convenience
Does the development provide opportunity for the retail at transit locations?
Recyclable and recycled materials should be selected for urban infrastructure such as road resurfacing.
Guidelines
G.4 Recycled material in Urban Infrastructure To conserve resources through the reuse and recycling of materials.
Are recycled materials used in urban infrastructure development?
Recyclable and recycled materials should be selected for urban infrastructure such as road resurfacing.
Municipal
G.5 Recycling Facility To promote recycling practices within public spaces.
Does the site plan design include facilities for handling, storing and separation of recyclables?
There should be a strategic plan for the collection, storage and sale of newsprint, plastics and glass recyclables within public spaces.
Municipal
G.6 Alternative Fuel Re-fueling facility
To promote the use of alternative fuel or electric vehicles.
Does the site plan allow, where possible, for the possibility of an alternative fuel re-fueling facility?
Alternative re-fuelling stations, supplying fuel such as natural gas, electricity, ethanol or hydrogen, should be considered to aid economic sustainability.
Requires detailed feasibility study
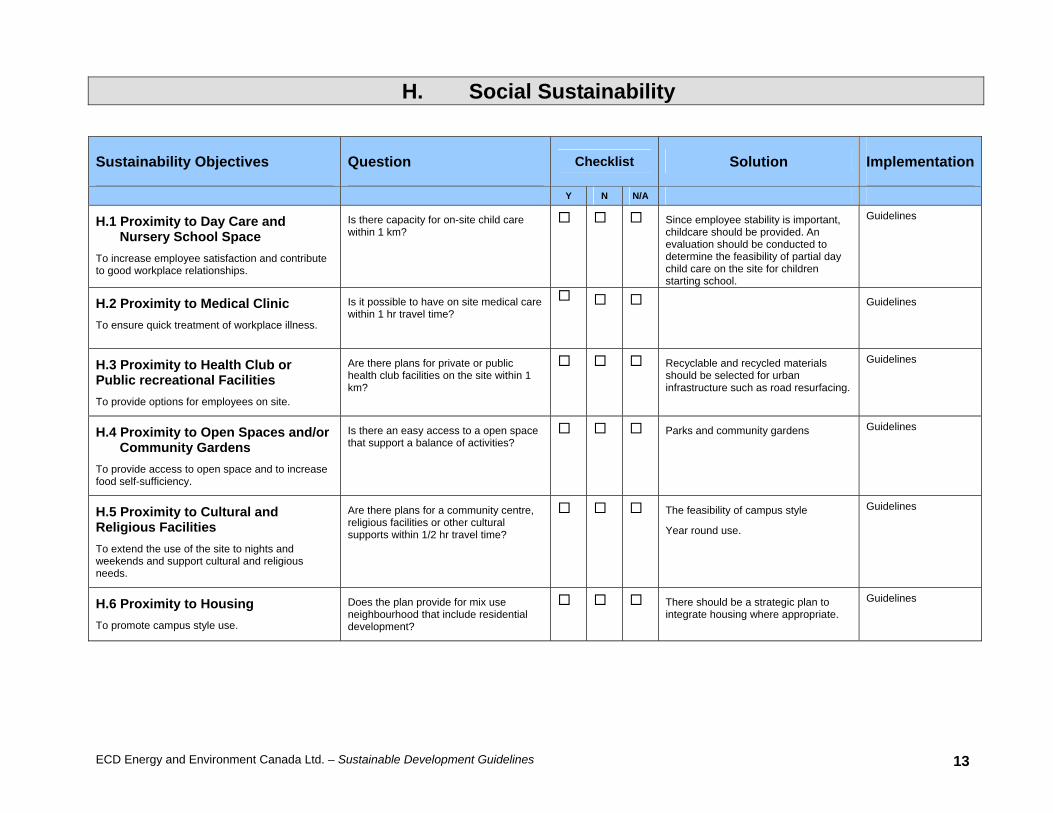
ECD Energy and Environment Canada Ltd. – Sustainable Development Guidelines 13
H. Social Sustainability
Sustainability Objectives Question Checklist Solution Implementation
Y N N/A
H.1 Proximity to Day Care and Nursery School Space
To increase employee satisfaction and contribute to good workplace relationships.
Is there capacity for on-site child care within 1 km?
Since employee stability is important, childcare should be provided. An evaluation should be conducted to determine the feasibility of partial day child care on the site for children starting school.
Guidelines
H.2 Proximity to Medical Clinic
To ensure quick treatment of workplace illness.
Is it possible to have on site medical care within 1 hr travel time?
Guidelines
H.3 Proximity to Health Club or Public recreational Facilities To provide options for employees on site.
Are there plans for private or public health club facilities on the site within 1 km?
Recyclable and recycled materials should be selected for urban infrastructure such as road resurfacing.
Guidelines
H.4 Proximity to Open Spaces and/or Community Gardens
To provide access to open space and to increase food self-sufficiency.
Is there an easy access to a open space that support a balance of activities?
Parks and community gardens Guidelines
H.5 Proximity to Cultural and Religious Facilities To extend the use of the site to nights and weekends and support cultural and religious needs.
Are there plans for a community centre, religious facilities or other cultural supports within 1/2 hr travel time?
The feasibility of campus style
Year round use.
Guidelines
H.6 Proximity to Housing To promote campus style use.
Does the plan provide for mix use neighbourhood that include residential development?
There should be a strategic plan to integrate housing where appropriate.
Guidelines
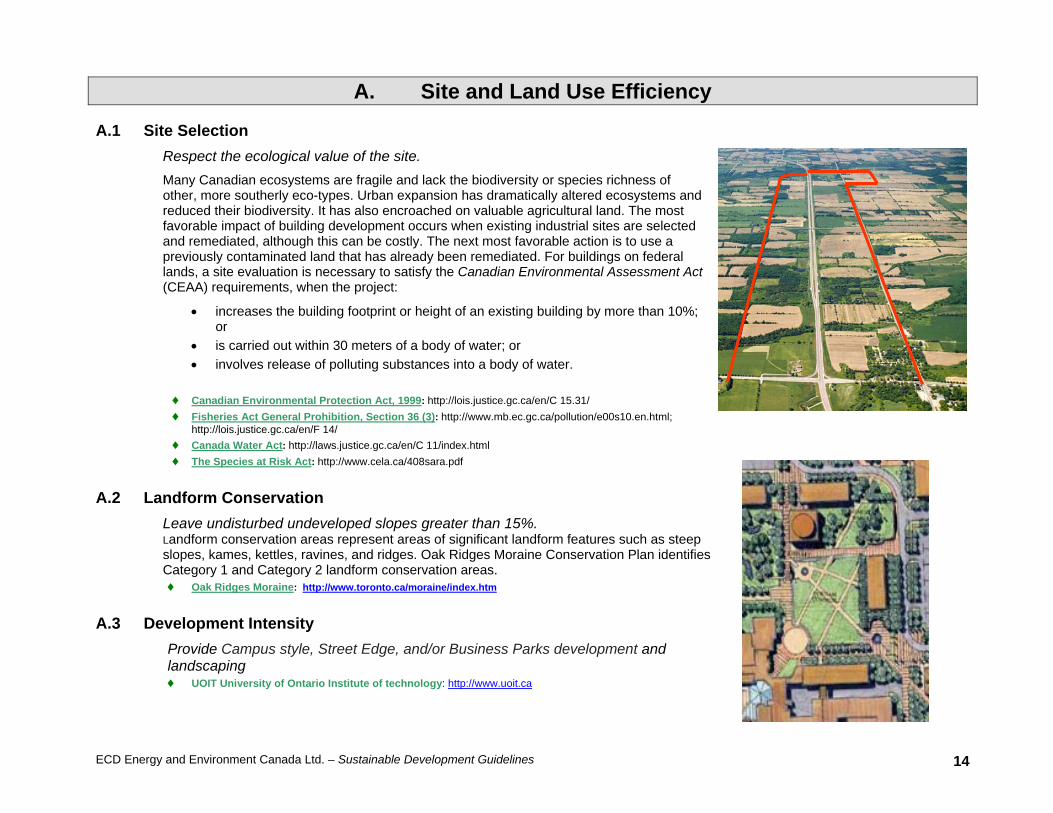
ECD Energy and Environment Canada Ltd. – Sustainable Development Guidelines 14
A. Site and Land Use Efficiency
A.1 Site Selection Respect the ecological value of the site. Many Canadian ecosystems are fragile and lack the biodiversity or species richness of other, more southerly eco-types. Urban expansion has dramatically altered ecosystems and reduced their biodiversity. It has also encroached on valuable agricultural land. The most favorable impact of building development occurs when existing industrial sites are selected and remediated, although this can be costly. The next most favorable action is to use a previously contaminated land that has already been remediated. For buildings on federal lands, a site evaluation is necessary to satisfy the Canadian Environmental Assessment Act (CEAA) requirements, when the project:
• increases the building footprint or height of an existing building by more than 10%; or
• is carried out within 30 meters of a body of water; or • involves release of polluting substances into a body of water.
♦ Canadian Environmental Protection Act, 1999: http://lois.justice.gc.ca/en/C 15.31/ ♦ Fisheries Act General Prohibition, Section 36 (3): http://www.mb.ec.gc.ca/pollution/e00s10.en.html;
http://lois.justice.gc.ca/en/F 14/ ♦ Canada Water Act: http://laws.justice.gc.ca/en/C 11/index.html ♦ The Species at Risk Act: http://www.cela.ca/408sara.pdf
A.2 Landform Conservation Leave undisturbed undeveloped slopes greater than 15%. Landform conservation areas represent areas of significant landform features such as steep slopes, kames, kettles, ravines, and ridges. Oak Ridges Moraine Conservation Plan identifies Category 1 and Category 2 landform conservation areas. ♦ Oak Ridges Moraine: http://www.toronto.ca/moraine/index.htm
A.3 Development Intensity Provide Campus style, Street Edge, and/or Business Parks development and landscaping ♦ UOIT University of Ontario Institute of technology: http://www.uoit.ca
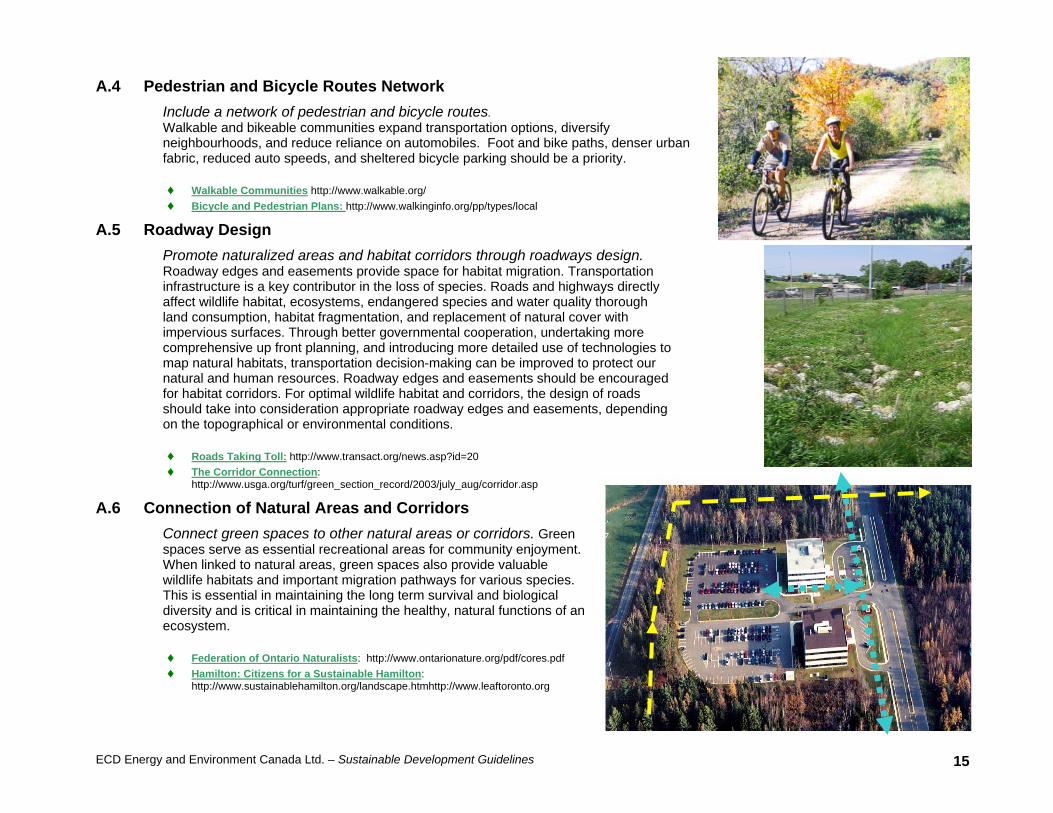
ECD Energy and Environment Canada Ltd. – Sustainable Development Guidelines 15
A.4 Pedestrian and Bicycle Routes Network Include a network of pedestrian and bicycle routes. Walkable and bikeable communities expand transportation options, diversify neighbourhoods, and reduce reliance on automobiles. Foot and bike paths, denser urban fabric, reduced auto speeds, and sheltered bicycle parking should be a priority.
♦ Walkable Communities http://www.walkable.org/ ♦ Bicycle and Pedestrian Plans: http://www.walkinginfo.org/pp/types/local
A.5 Roadway Design Promote naturalized areas and habitat corridors through roadways design. Roadway edges and easements provide space for habitat migration. Transportation infrastructure is a key contributor in the loss of species. Roads and highways directly affect wildlife habitat, ecosystems, endangered species and water quality thorough land consumption, habitat fragmentation, and replacement of natural cover with impervious surfaces. Through better governmental cooperation, undertaking more comprehensive up front planning, and introducing more detailed use of technologies to map natural habitats, transportation decision-making can be improved to protect our natural and human resources. Roadway edges and easements should be encouraged for habitat corridors. For optimal wildlife habitat and corridors, the design of roads should take into consideration appropriate roadway edges and easements, depending on the topographical or environmental conditions. ♦ Roads Taking Toll: http://www.transact.org/news.asp?id=20 ♦ The Corridor Connection:
http://www.usga.org/turf/green_section_record/2003/july_aug/corridor.asp
A.6 Connection of Natural Areas and Corridors Connect green spaces to other natural areas or corridors. Green spaces serve as essential recreational areas for community enjoyment. When linked to natural areas, green spaces also provide valuable wildlife habitats and important migration pathways for various species. This is essential in maintaining the long term survival and biological diversity and is critical in maintaining the healthy, natural functions of an ecosystem. ♦ Federation of Ontario Naturalists: http://www.ontarionature.org/pdf/cores.pdf ♦ Hamilton: Citizens for a Sustainable Hamilton:
http://www.sustainablehamilton.org/landscape.htmhttp://www.leaftoronto.org
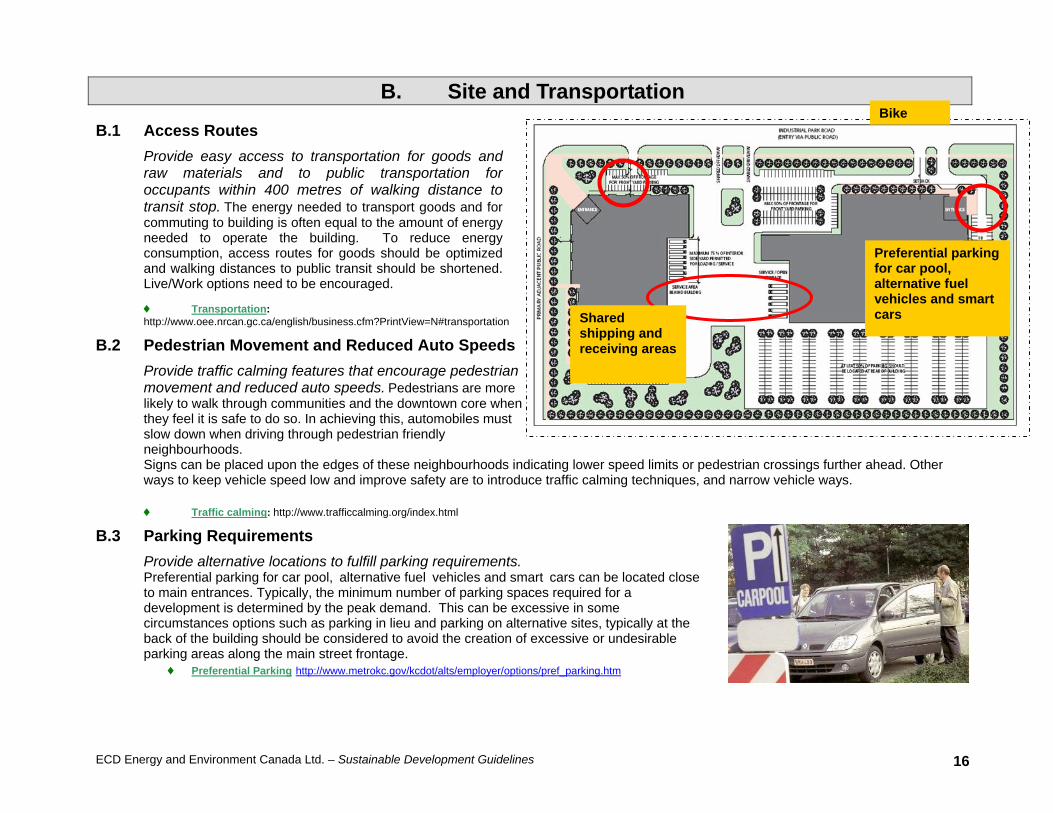
ECD Energy and Environment Canada Ltd. – Sustainable Development Guidelines 16
B. Site and Transportation
B.1 Access Routes Provide easy access to transportation for goods and raw materials and to public transportation for occupants within 400 metres of walking distance to transit stop. The energy needed to transport goods and for commuting to building is often equal to the amount of energy needed to operate the building. To reduce energy consumption, access routes for goods should be optimized and walking distances to public transit should be shortened. Live/Work options need to be encouraged.
♦ Transportation: http://www.oee.nrcan.gc.ca/english/business.cfm?PrintView=N#transportation
B.2 Pedestrian Movement and Reduced Auto Speeds Provide traffic calming features that encourage pedestrian movement and reduced auto speeds. Pedestrians are more likely to walk through communities and the downtown core when they feel it is safe to do so. In achieving this, automobiles must slow down when driving through pedestrian friendly neighbourhoods. Signs can be placed upon the edges of these neighbourhoods indicating lower speed limits or pedestrian crossings further ahead. Other ways to keep vehicle speed low and improve safety are to introduce traffic calming techniques, and narrow vehicle ways. ♦ Traffic calming: http://www.trafficcalming.org/index.html
B.3 Parking Requirements Provide alternative locations to fulfill parking requirements. Preferential parking for car pool, alternative fuel vehicles and smart cars can be located close to main entrances. Typically, the minimum number of parking spaces required for a development is determined by the peak demand. This can be excessive in some circumstances options such as parking in lieu and parking on alternative sites, typically at the back of the building should be considered to avoid the creation of excessive or undesirable parking areas along the main street frontage.
♦ Preferential Parking http://www.metrokc.gov/kcdot/alts/employer/options/pref_parking.htm
Bike
Preferential parking for car pool, alternative fuel vehicles and smart cars Shared
shipping and receiving areas
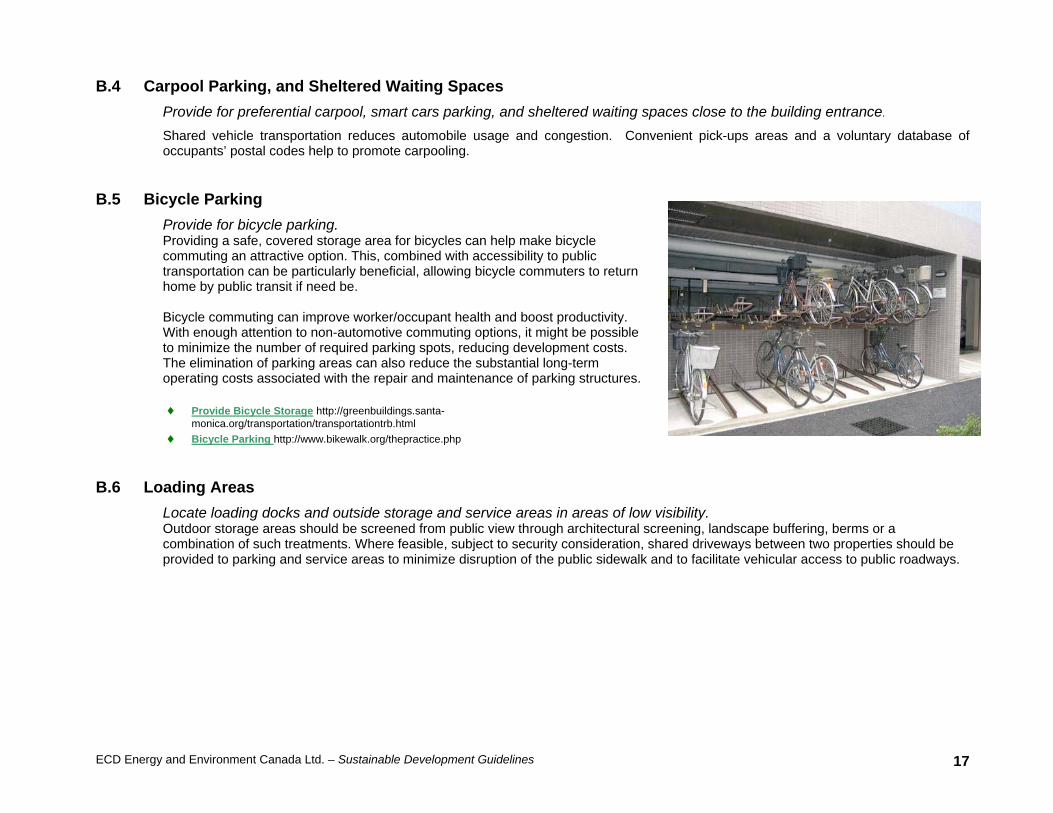
ECD Energy and Environment Canada Ltd. – Sustainable Development Guidelines 17
B.4 Carpool Parking, and Sheltered Waiting Spaces Provide for preferential carpool, smart cars parking, and sheltered waiting spaces close to the building entrance.
Shared vehicle transportation reduces automobile usage and congestion. Convenient pick-ups areas and a voluntary database of occupants’ postal codes help to promote carpooling.
B.5 Bicycle Parking Provide for bicycle parking. Providing a safe, covered storage area for bicycles can help make bicycle commuting an attractive option. This, combined with accessibility to public transportation can be particularly beneficial, allowing bicycle commuters to return home by public transit if need be. Bicycle commuting can improve worker/occupant health and boost productivity. With enough attention to non-automotive commuting options, it might be possible to minimize the number of required parking spots, reducing development costs. The elimination of parking areas can also reduce the substantial long-term operating costs associated with the repair and maintenance of parking structures. ♦ Provide Bicycle Storage http://greenbuildings.santa-
monica.org/transportation/transportationtrb.html ♦ Bicycle Parking http://www.bikewalk.org/thepractice.php
B.6 Loading Areas Locate loading docks and outside storage and service areas in areas of low visibility. Outdoor storage areas should be screened from public view through architectural screening, landscape buffering, berms or a combination of such treatments. Where feasible, subject to security consideration, shared driveways between two properties should be provided to parking and service areas to minimize disruption of the public sidewalk and to facilitate vehicular access to public roadways.
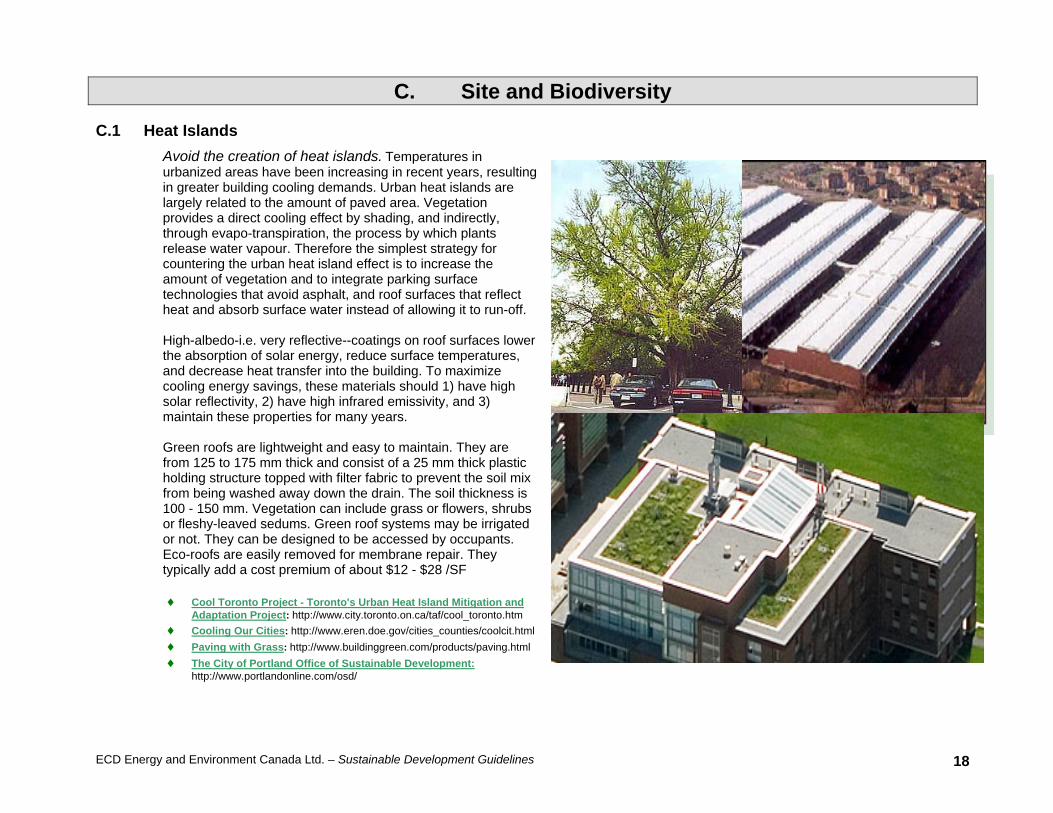
ECD Energy and Environment Canada Ltd. – Sustainable Development Guidelines 18
C. Site and Biodiversity
C.1 Heat Islands Avoid the creation of heat islands. Temperatures in urbanized areas have been increasing in recent years, resulting in greater building cooling demands. Urban heat islands are largely related to the amount of paved area. Vegetation provides a direct cooling effect by shading, and indirectly, through evapo-transpiration, the process by which plants release water vapour. Therefore the simplest strategy for countering the urban heat island effect is to increase the amount of vegetation and to integrate parking surface technologies that avoid asphalt, and roof surfaces that reflect heat and absorb surface water instead of allowing it to run-off. High-albedo-i.e. very reflective--coatings on roof surfaces lower the absorption of solar energy, reduce surface temperatures, and decrease heat transfer into the building. To maximize cooling energy savings, these materials should 1) have high solar reflectivity, 2) have high infrared emissivity, and 3) maintain these properties for many years. Green roofs are lightweight and easy to maintain. They are from 125 to 175 mm thick and consist of a 25 mm thick plastic holding structure topped with filter fabric to prevent the soil mix from being washed away down the drain. The soil thickness is 100 - 150 mm. Vegetation can include grass or flowers, shrubs or fleshy-leaved sedums. Green roof systems may be irrigated or not. They can be designed to be accessed by occupants. Eco-roofs are easily removed for membrane repair. They typically add a cost premium of about $12 - $28 /SF ♦ Cool Toronto Project - Toronto's Urban Heat Island Mitigation and
Adaptation Project: http://www.city.toronto.on.ca/taf/cool_toronto.htm ♦ Cooling Our Cities: http://www.eren.doe.gov/cities_counties/coolcit.html ♦ Paving with Grass: http://www.buildinggreen.com/products/paving.html ♦ The City of Portland Office of Sustainable Development:
http://www.portlandonline.com/osd/
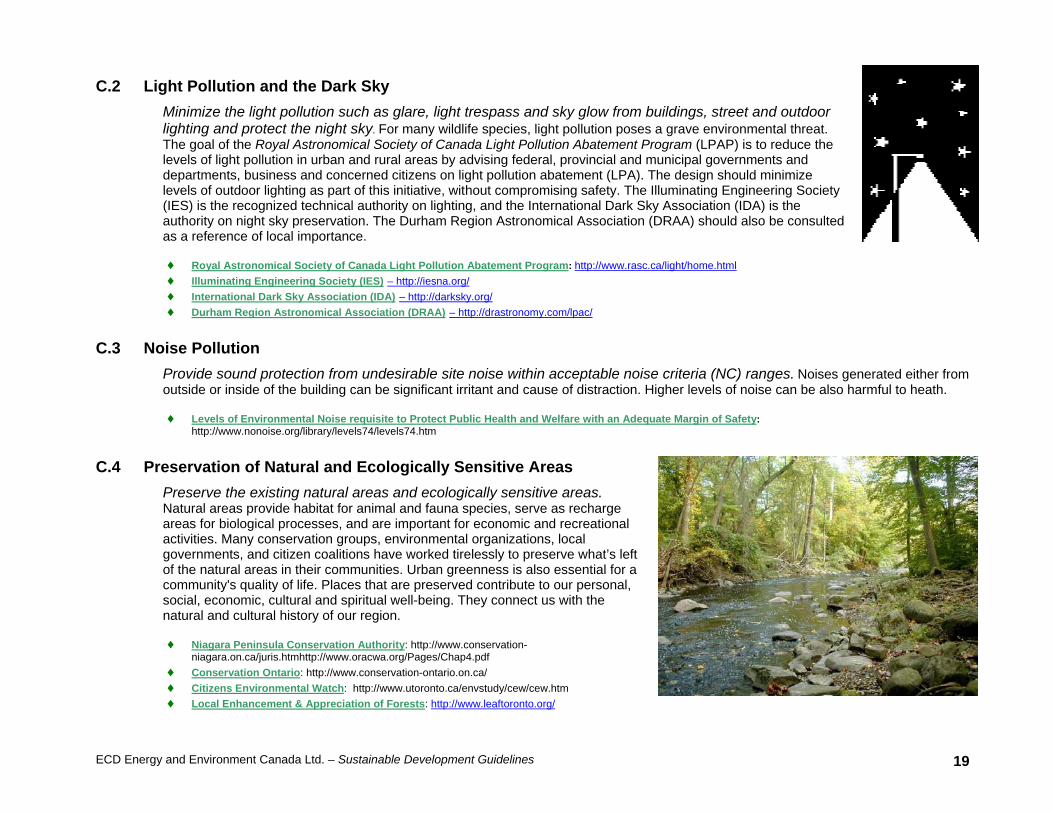
ECD Energy and Environment Canada Ltd. – Sustainable Development Guidelines 19
C.2 Light Pollution and the Dark Sky Minimize the light pollution such as glare, light trespass and sky glow from buildings, street and outdoor lighting and protect the night sky. For many wildlife species, light pollution poses a grave environmental threat. The goal of the Royal Astronomical Society of Canada Light Pollution Abatement Program (LPAP) is to reduce the levels of light pollution in urban and rural areas by advising federal, provincial and municipal governments and departments, business and concerned citizens on light pollution abatement (LPA). The design should minimize levels of outdoor lighting as part of this initiative, without compromising safety. The Illuminating Engineering Society (IES) is the recognized technical authority on lighting, and the International Dark Sky Association (IDA) is the authority on night sky preservation. The Durham Region Astronomical Association (DRAA) should also be consulted as a reference of local importance. ♦ Royal Astronomical Society of Canada Light Pollution Abatement Program: http://www.rasc.ca/light/home.html ♦ Illuminating Engineering Society (IES) – http://iesna.org/ ♦ International Dark Sky Association (IDA) – http://darksky.org/ ♦ Durham Region Astronomical Association (DRAA) – http://drastronomy.com/lpac/
C.3 Noise Pollution Provide sound protection from undesirable site noise within acceptable noise criteria (NC) ranges. Noises generated either from outside or inside of the building can be significant irritant and cause of distraction. Higher levels of noise can be also harmful to heath. ♦ Levels of Environmental Noise requisite to Protect Public Health and Welfare with an Adequate Margin of Safety:
http://www.nonoise.org/library/levels74/levels74.htm
C.4 Preservation of Natural and Ecologically Sensitive Areas Preserve the existing natural areas and ecologically sensitive areas. Natural areas provide habitat for animal and fauna species, serve as recharge areas for biological processes, and are important for economic and recreational activities. Many conservation groups, environmental organizations, local governments, and citizen coalitions have worked tirelessly to preserve what’s left of the natural areas in their communities. Urban greenness is also essential for a community's quality of life. Places that are preserved contribute to our personal, social, economic, cultural and spiritual well-being. They connect us with the natural and cultural history of our region.
♦ Niagara Peninsula Conservation Authority: http://www.conservation-
niagara.on.ca/juris.htmhttp://www.oracwa.org/Pages/Chap4.pdf ♦ Conservation Ontario: http://www.conservation-ontario.on.ca/ ♦ Citizens Environmental Watch: http://www.utoronto.ca/envstudy/cew/cew.htm ♦ Local Enhancement & Appreciation of Forests: http://www.leaftoronto.org/
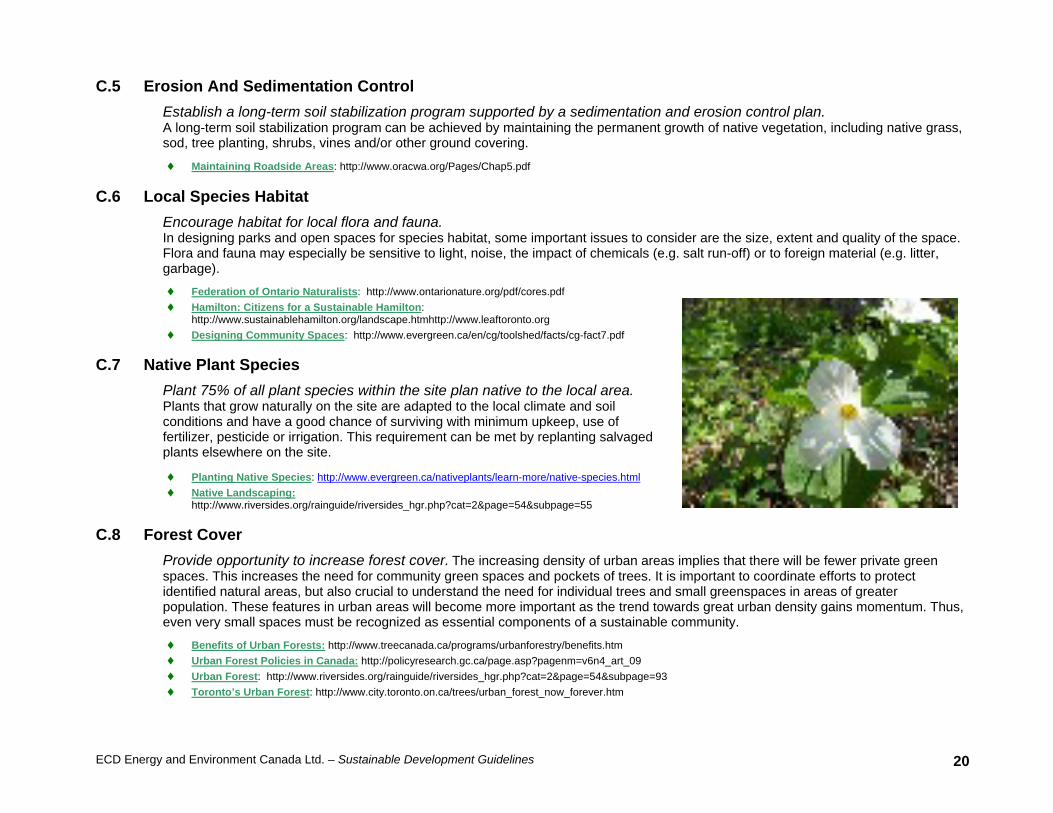
ECD Energy and Environment Canada Ltd. – Sustainable Development Guidelines 20
C.5 Erosion And Sedimentation Control Establish a long-term soil stabilization program supported by a sedimentation and erosion control plan. A long-term soil stabilization program can be achieved by maintaining the permanent growth of native vegetation, including native grass, sod, tree planting, shrubs, vines and/or other ground covering.
♦ Maintaining Roadside Areas: http://www.oracwa.org/Pages/Chap5.pdf
C.6 Local Species Habitat Encourage habitat for local flora and fauna. In designing parks and open spaces for species habitat, some important issues to consider are the size, extent and quality of the space. Flora and fauna may especially be sensitive to light, noise, the impact of chemicals (e.g. salt run-off) or to foreign material (e.g. litter, garbage).
♦ Federation of Ontario Naturalists: http://www.ontarionature.org/pdf/cores.pdf ♦ Hamilton: Citizens for a Sustainable Hamilton:
http://www.sustainablehamilton.org/landscape.htmhttp://www.leaftoronto.org ♦ Designing Community Spaces: http://www.evergreen.ca/en/cg/toolshed/facts/cg-fact7.pdf
C.7 Native Plant Species Plant 75% of all plant species within the site plan native to the local area. Plants that grow naturally on the site are adapted to the local climate and soil conditions and have a good chance of surviving with minimum upkeep, use of fertilizer, pesticide or irrigation. This requirement can be met by replanting salvaged plants elsewhere on the site.
♦ Planting Native Species: http://www.evergreen.ca/nativeplants/learn-more/native-species.html ♦ Native Landscaping:
http://www.riversides.org/rainguide/riversides_hgr.php?cat=2&page=54&subpage=55
C.8 Forest Cover Provide opportunity to increase forest cover. The increasing density of urban areas implies that there will be fewer private green spaces. This increases the need for community green spaces and pockets of trees. It is important to coordinate efforts to protect identified natural areas, but also crucial to understand the need for individual trees and small greenspaces in areas of greater population. These features in urban areas will become more important as the trend towards great urban density gains momentum. Thus, even very small spaces must be recognized as essential components of a sustainable community.
♦ Benefits of Urban Forests: http://www.treecanada.ca/programs/urbanforestry/benefits.htm ♦ Urban Forest Policies in Canada: http://policyresearch.gc.ca/page.asp?pagenm=v6n4_art_09 ♦ Urban Forest: http://www.riversides.org/rainguide/riversides_hgr.php?cat=2&page=54&subpage=93 ♦ Toronto’s Urban Forest: http://www.city.toronto.on.ca/trees/urban_forest_now_forever.htm
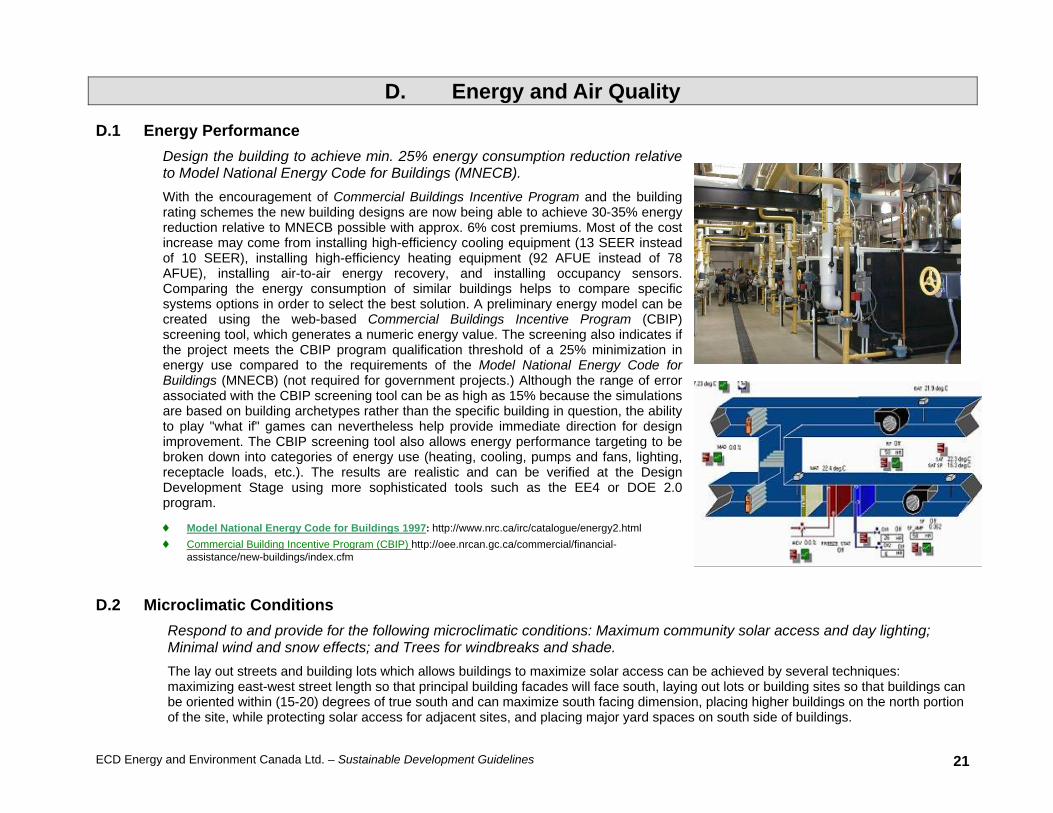
ECD Energy and Environment Canada Ltd. – Sustainable Development Guidelines 21
D. Energy and Air Quality
D.1 Energy Performance Design the building to achieve min. 25% energy consumption reduction relative to Model National Energy Code for Buildings (MNECB). With the encouragement of Commercial Buildings Incentive Program and the building rating schemes the new building designs are now being able to achieve 30-35% energy reduction relative to MNECB possible with approx. 6% cost premiums. Most of the cost increase may come from installing high-efficiency cooling equipment (13 SEER instead of 10 SEER), installing high-efficiency heating equipment (92 AFUE instead of 78 AFUE), installing air-to-air energy recovery, and installing occupancy sensors. Comparing the energy consumption of similar buildings helps to compare specific systems options in order to select the best solution. A preliminary energy model can be created using the web-based Commercial Buildings Incentive Program (CBIP) screening tool, which generates a numeric energy value. The screening also indicates if the project meets the CBIP program qualification threshold of a 25% minimization in energy use compared to the requirements of the Model National Energy Code for Buildings (MNECB) (not required for government projects.) Although the range of error associated with the CBIP screening tool can be as high as 15% because the simulations are based on building archetypes rather than the specific building in question, the ability to play "what if" games can nevertheless help provide immediate direction for design improvement. The CBIP screening tool also allows energy performance targeting to be broken down into categories of energy use (heating, cooling, pumps and fans, lighting, receptacle loads, etc.). The results are realistic and can be verified at the Design Development Stage using more sophisticated tools such as the EE4 or DOE 2.0 program.
♦ Model National Energy Code for Buildings 1997: http://www.nrc.ca/irc/catalogue/energy2.html ♦ Commercial Building Incentive Program (CBIP) http://oee.nrcan.gc.ca/commercial/financial-
assistance/new-buildings/index.cfm
D.2 Microclimatic Conditions Respond to and provide for the following microclimatic conditions: Maximum community solar access and day lighting; Minimal wind and snow effects; and Trees for windbreaks and shade. The lay out streets and building lots which allows buildings to maximize solar access can be achieved by several techniques: maximizing east-west street length so that principal building facades will face south, laying out lots or building sites so that buildings can be oriented within (15-20) degrees of true south and can maximize south facing dimension, placing higher buildings on the north portion of the site, while protecting solar access for adjacent sites, and placing major yard spaces on south side of buildings.
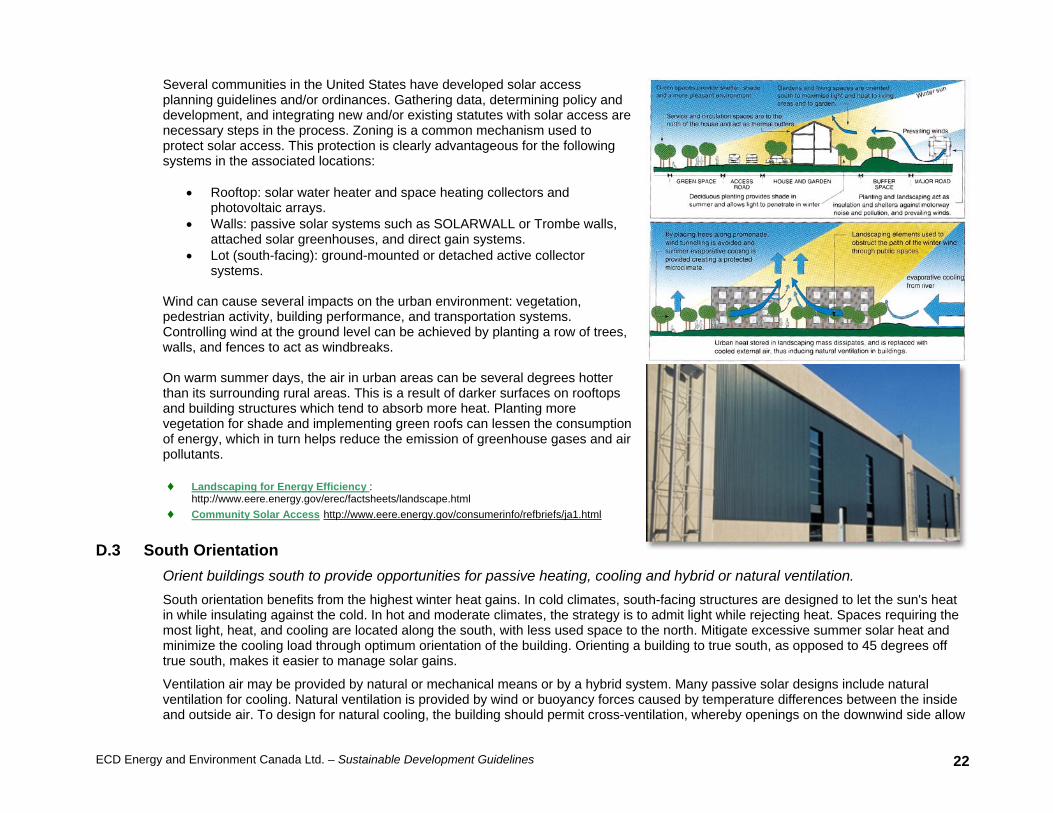
ECD Energy and Environment Canada Ltd. – Sustainable Development Guidelines 22
Several communities in the United States have developed solar access planning guidelines and/or ordinances. Gathering data, determining policy and development, and integrating new and/or existing statutes with solar access are necessary steps in the process. Zoning is a common mechanism used to protect solar access. This protection is clearly advantageous for the following systems in the associated locations:
• Rooftop: solar water heater and space heating collectors and photovoltaic arrays.
• Walls: passive solar systems such as SOLARWALL or Trombe walls, attached solar greenhouses, and direct gain systems.
• Lot (south-facing): ground-mounted or detached active collector systems.
Wind can cause several impacts on the urban environment: vegetation, pedestrian activity, building performance, and transportation systems. Controlling wind at the ground level can be achieved by planting a row of trees, walls, and fences to act as windbreaks. On warm summer days, the air in urban areas can be several degrees hotter than its surrounding rural areas. This is a result of darker surfaces on rooftops and building structures which tend to absorb more heat. Planting more vegetation for shade and implementing green roofs can lessen the consumption of energy, which in turn helps reduce the emission of greenhouse gases and air pollutants. ♦ Landscaping for Energy Efficiency :
http://www.eere.energy.gov/erec/factsheets/landscape.html ♦ Community Solar Access http://www.eere.energy.gov/consumerinfo/refbriefs/ja1.html
D.3 South Orientation Orient buildings south to provide opportunities for passive heating, cooling and hybrid or natural ventilation. South orientation benefits from the highest winter heat gains. In cold climates, south-facing structures are designed to let the sun's heat in while insulating against the cold. In hot and moderate climates, the strategy is to admit light while rejecting heat. Spaces requiring the most light, heat, and cooling are located along the south, with less used space to the north. Mitigate excessive summer solar heat and minimize the cooling load through optimum orientation of the building. Orienting a building to true south, as opposed to 45 degrees off true south, makes it easier to manage solar gains.
Ventilation air may be provided by natural or mechanical means or by a hybrid system. Many passive solar designs include natural ventilation for cooling. Natural ventilation is provided by wind or buoyancy forces caused by temperature differences between the inside and outside air. To design for natural cooling, the building should permit cross-ventilation, whereby openings on the downwind side allow
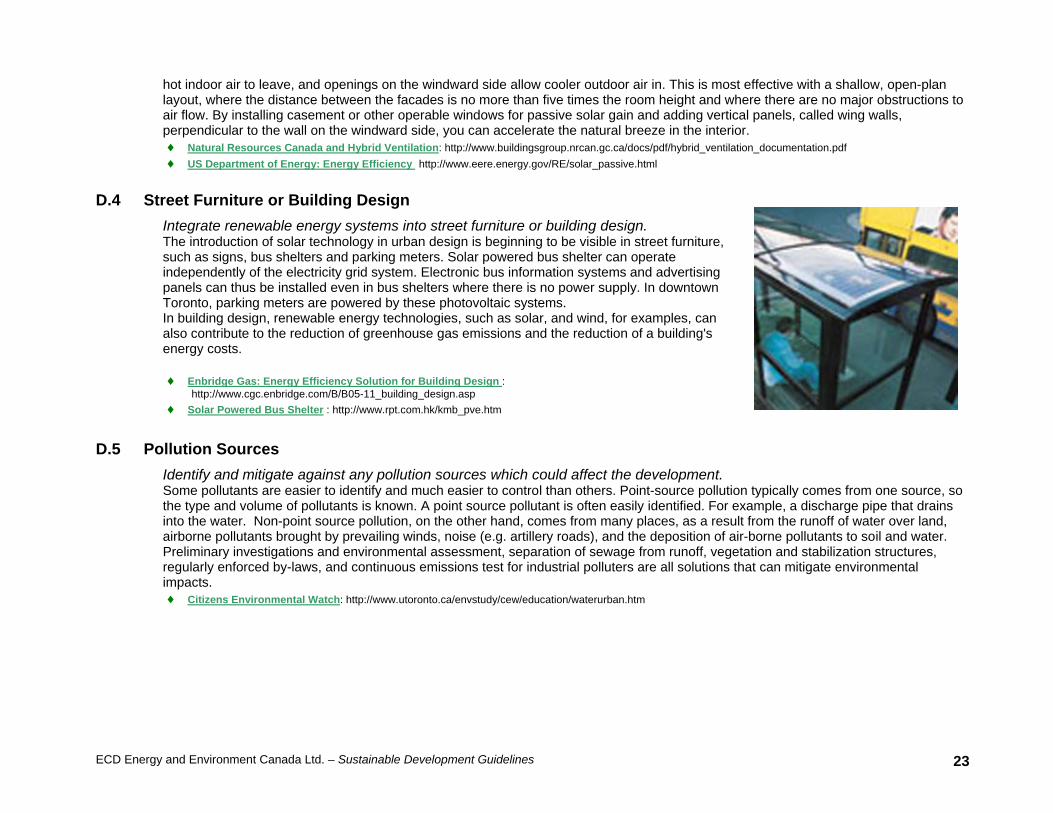
ECD Energy and Environment Canada Ltd. – Sustainable Development Guidelines 23
hot indoor air to leave, and openings on the windward side allow cooler outdoor air in. This is most effective with a shallow, open-plan layout, where the distance between the facades is no more than five times the room height and where there are no major obstructions to air flow. By installing casement or other operable windows for passive solar gain and adding vertical panels, called wing walls, perpendicular to the wall on the windward side, you can accelerate the natural breeze in the interior. ♦ Natural Resources Canada and Hybrid Ventilation: http://www.buildingsgroup.nrcan.gc.ca/docs/pdf/hybrid_ventilation_documentation.pdf ♦ US Department of Energy: Energy Efficiency http://www.eere.energy.gov/RE/solar_passive.html
D.4 Street Furniture or Building Design Integrate renewable energy systems into street furniture or building design. The introduction of solar technology in urban design is beginning to be visible in street furniture, such as signs, bus shelters and parking meters. Solar powered bus shelter can operate independently of the electricity grid system. Electronic bus information systems and advertising panels can thus be installed even in bus shelters where there is no power supply. In downtown Toronto, parking meters are powered by these photovoltaic systems. In building design, renewable energy technologies, such as solar, and wind, for examples, can also contribute to the reduction of greenhouse gas emissions and the reduction of a building's energy costs. ♦ Enbridge Gas: Energy Efficiency Solution for Building Design :
http://www.cgc.enbridge.com/B/B05-11_building_design.asp ♦ Solar Powered Bus Shelter : http://www.rpt.com.hk/kmb_pve.htm
D.5 Pollution Sources Identify and mitigate against any pollution sources which could affect the development. Some pollutants are easier to identify and much easier to control than others. Point-source pollution typically comes from one source, so the type and volume of pollutants is known. A point source pollutant is often easily identified. For example, a discharge pipe that drains into the water. Non-point source pollution, on the other hand, comes from many places, as a result from the runoff of water over land, airborne pollutants brought by prevailing winds, noise (e.g. artillery roads), and the deposition of air-borne pollutants to soil and water. Preliminary investigations and environmental assessment, separation of sewage from runoff, vegetation and stabilization structures, regularly enforced by-laws, and continuous emissions test for industrial polluters are all solutions that can mitigate environmental impacts. ♦ Citizens Environmental Watch: http://www.utoronto.ca/envstudy/cew/education/waterurban.htm
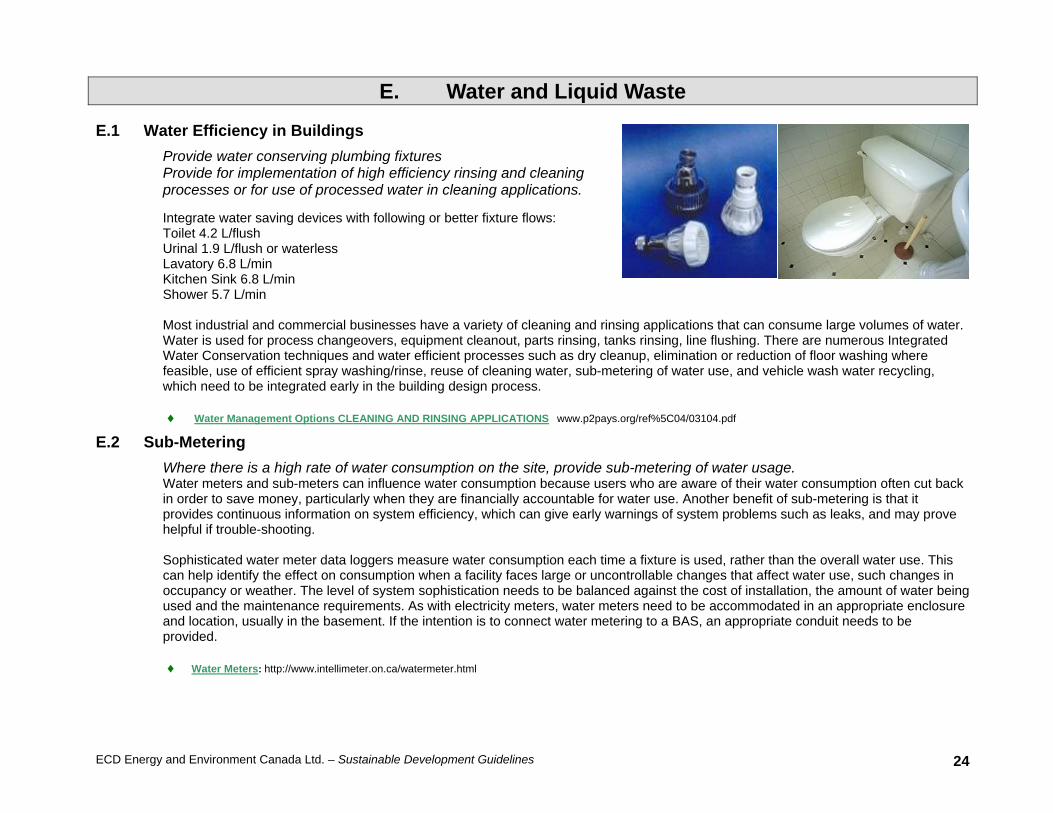
ECD Energy and Environment Canada Ltd. – Sustainable Development Guidelines 24
E. Water and Liquid Waste
E.1 Water Efficiency in Buildings Provide water conserving plumbing fixtures Provide for implementation of high efficiency rinsing and cleaning processes or for use of processed water in cleaning applications. Integrate water saving devices with following or better fixture flows: Toilet 4.2 L/flush Urinal 1.9 L/flush or waterless Lavatory 6.8 L/min Kitchen Sink 6.8 L/min Shower 5.7 L/min Most industrial and commercial businesses have a variety of cleaning and rinsing applications that can consume large volumes of water. Water is used for process changeovers, equipment cleanout, parts rinsing, tanks rinsing, line flushing. There are numerous Integrated Water Conservation techniques and water efficient processes such as dry cleanup, elimination or reduction of floor washing where feasible, use of efficient spray washing/rinse, reuse of cleaning water, sub-metering of water use, and vehicle wash water recycling, which need to be integrated early in the building design process.
♦ Water Management Options CLEANING AND RINSING APPLICATIONS www.p2pays.org/ref%5C04/03104.pdf
E.2 Sub-Metering Where there is a high rate of water consumption on the site, provide sub-metering of water usage. Water meters and sub-meters can influence water consumption because users who are aware of their water consumption often cut back in order to save money, particularly when they are financially accountable for water use. Another benefit of sub-metering is that it provides continuous information on system efficiency, which can give early warnings of system problems such as leaks, and may prove helpful if trouble-shooting. Sophisticated water meter data loggers measure water consumption each time a fixture is used, rather than the overall water use. This can help identify the effect on consumption when a facility faces large or uncontrollable changes that affect water use, such changes in occupancy or weather. The level of system sophistication needs to be balanced against the cost of installation, the amount of water being used and the maintenance requirements. As with electricity meters, water meters need to be accommodated in an appropriate enclosure and location, usually in the basement. If the intention is to connect water metering to a BAS, an appropriate conduit needs to be provided. ♦ Water Meters: http://www.intellimeter.on.ca/watermeter.html
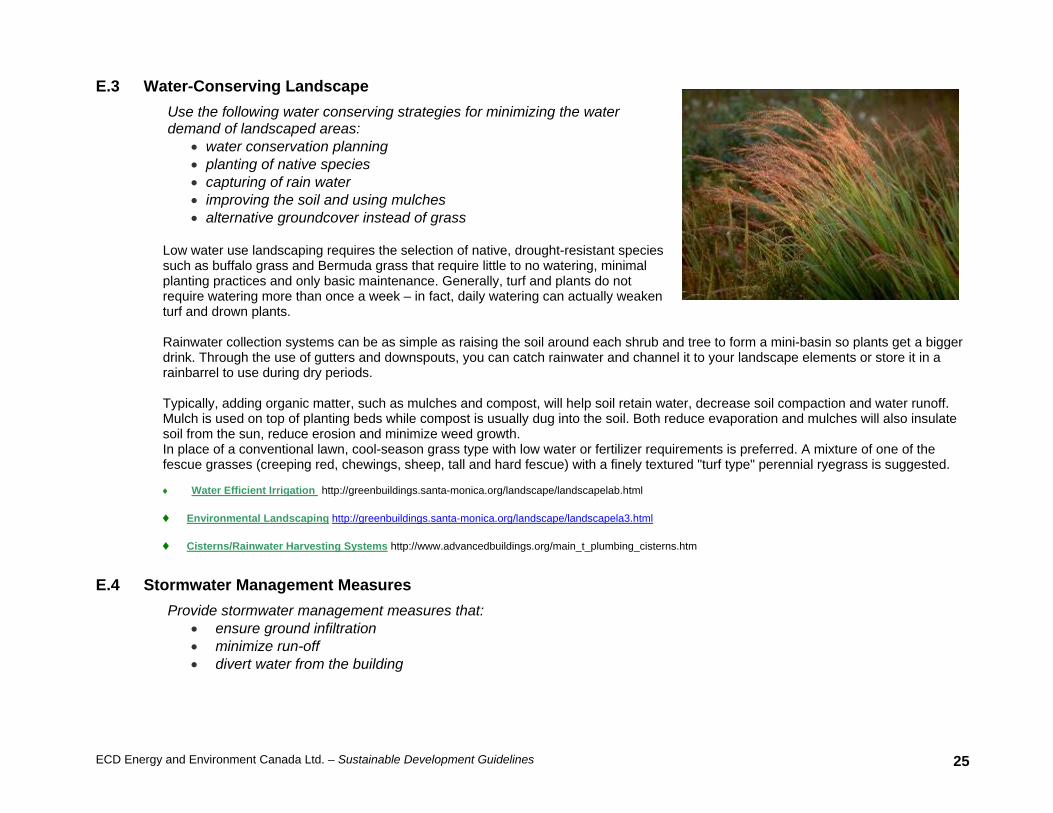
ECD Energy and Environment Canada Ltd. – Sustainable Development Guidelines 25
E.3 Water-Conserving Landscape Use the following water conserving strategies for minimizing the water demand of landscaped areas:
• water conservation planning • planting of native species • capturing of rain water • improving the soil and using mulches • alternative groundcover instead of grass
Low water use landscaping requires the selection of native, drought-resistant species such as buffalo grass and Bermuda grass that require little to no watering, minimal planting practices and only basic maintenance. Generally, turf and plants do not require watering more than once a week – in fact, daily watering can actually weaken turf and drown plants. Rainwater collection systems can be as simple as raising the soil around each shrub and tree to form a mini-basin so plants get a bigger drink. Through the use of gutters and downspouts, you can catch rainwater and channel it to your landscape elements or store it in a rainbarrel to use during dry periods. Typically, adding organic matter, such as mulches and compost, will help soil retain water, decrease soil compaction and water runoff. Mulch is used on top of planting beds while compost is usually dug into the soil. Both reduce evaporation and mulches will also insulate soil from the sun, reduce erosion and minimize weed growth. In place of a conventional lawn, cool-season grass type with low water or fertilizer requirements is preferred. A mixture of one of the fescue grasses (creeping red, chewings, sheep, tall and hard fescue) with a finely textured "turf type" perennial ryegrass is suggested.
♦ Water Efficient Irrigation http://greenbuildings.santa-monica.org/landscape/landscapelab.html ♦ Environmental Landscaping http://greenbuildings.santa-monica.org/landscape/landscapela3.html ♦ Cisterns/Rainwater Harvesting Systems http://www.advancedbuildings.org/main_t_plumbing_cisterns.htm
E.4 Stormwater Management Measures Provide stormwater management measures that:
• ensure ground infiltration • minimize run-off • divert water from the building
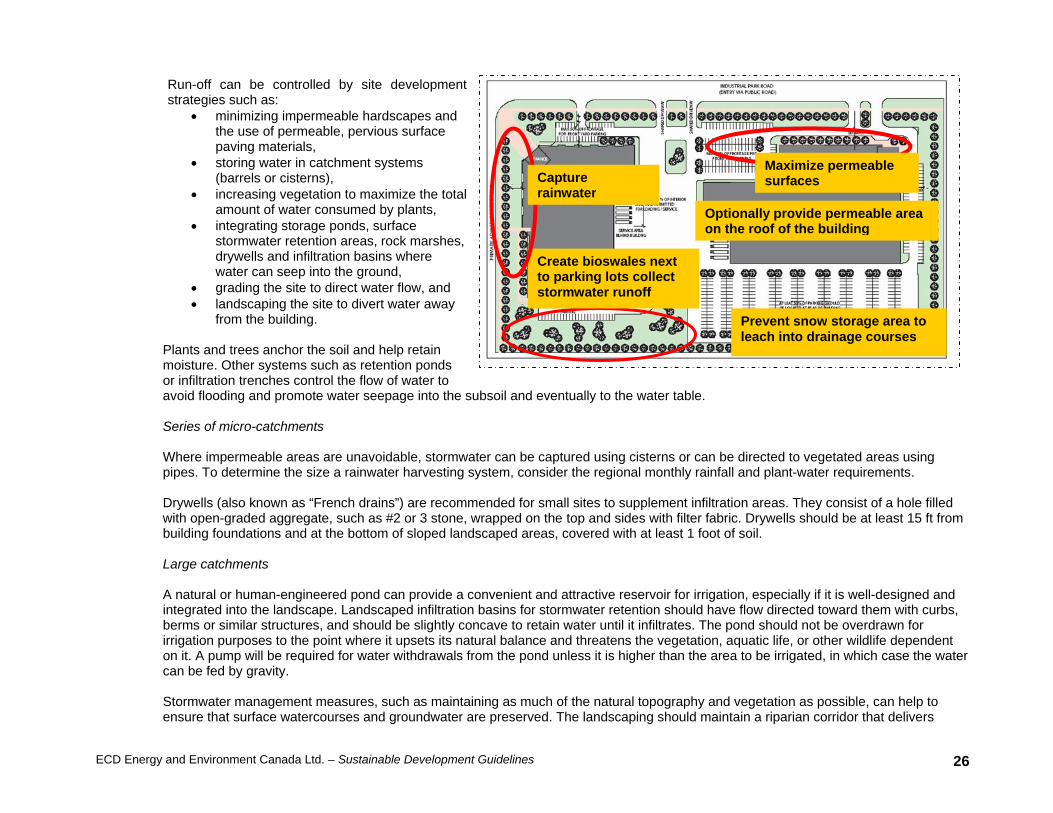
ECD Energy and Environment Canada Ltd. – Sustainable Development Guidelines 26
Run-off can be controlled by site development strategies such as:
• minimizing impermeable hardscapes and the use of permeable, pervious surface paving materials,
• storing water in catchment systems (barrels or cisterns),
• increasing vegetation to maximize the total amount of water consumed by plants,
• integrating storage ponds, surface stormwater retention areas, rock marshes, drywells and infiltration basins where water can seep into the ground,
• grading the site to direct water flow, and • landscaping the site to divert water away
from the building.
Plants and trees anchor the soil and help retain moisture. Other systems such as retention ponds or infiltration trenches control the flow of water to avoid flooding and promote water seepage into the subsoil and eventually to the water table. Series of micro-catchments Where impermeable areas are unavoidable, stormwater can be captured using cisterns or can be directed to vegetated areas using pipes. To determine the size a rainwater harvesting system, consider the regional monthly rainfall and plant-water requirements. Drywells (also known as “French drains”) are recommended for small sites to supplement infiltration areas. They consist of a hole filled with open-graded aggregate, such as #2 or 3 stone, wrapped on the top and sides with filter fabric. Drywells should be at least 15 ft from building foundations and at the bottom of sloped landscaped areas, covered with at least 1 foot of soil. Large catchments A natural or human-engineered pond can provide a convenient and attractive reservoir for irrigation, especially if it is well-designed and integrated into the landscape. Landscaped infiltration basins for stormwater retention should have flow directed toward them with curbs, berms or similar structures, and should be slightly concave to retain water until it infiltrates. The pond should not be overdrawn for irrigation purposes to the point where it upsets its natural balance and threatens the vegetation, aquatic life, or other wildlife dependent on it. A pump will be required for water withdrawals from the pond unless it is higher than the area to be irrigated, in which case the water can be fed by gravity. Stormwater management measures, such as maintaining as much of the natural topography and vegetation as possible, can help to ensure that surface watercourses and groundwater are preserved. The landscaping should maintain a riparian corridor that delivers
Optionally provide permeable area on the roof of the building
Create bioswales next to parking lots collect stormwater runoff
Maximize permeable surfacesCapture
rainwater
Prevent snow storage area to leach into drainage courses
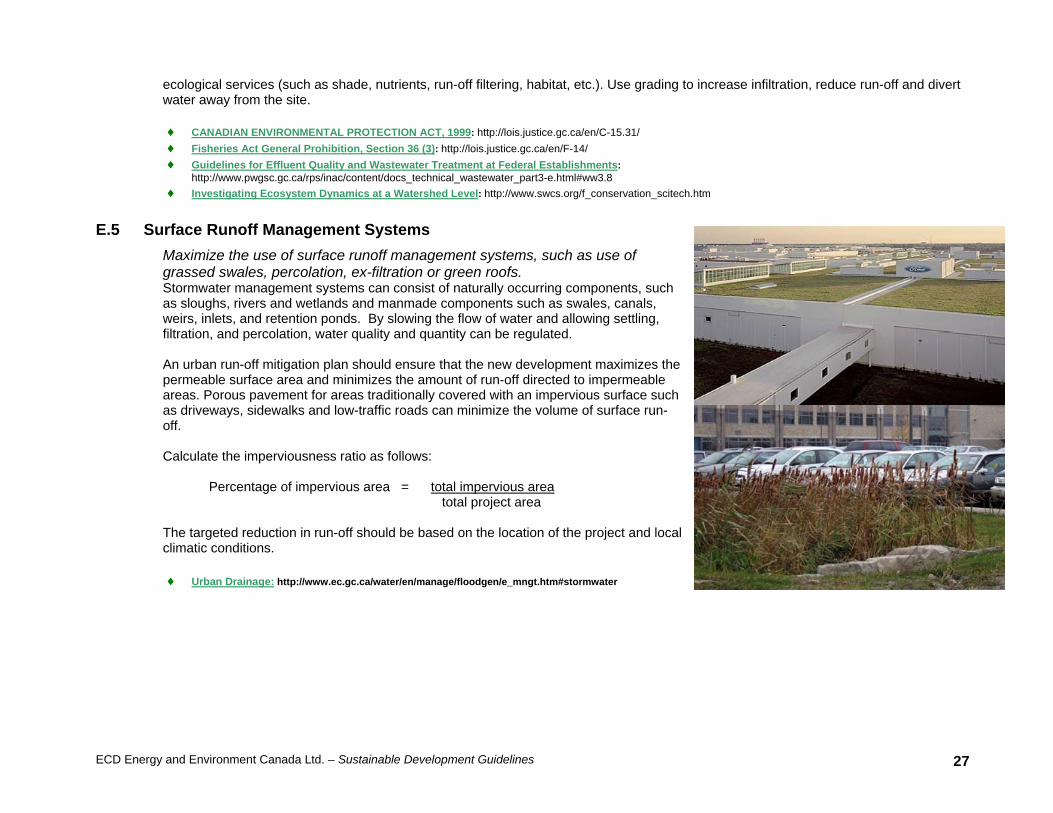
ECD Energy and Environment Canada Ltd. – Sustainable Development Guidelines 27
ecological services (such as shade, nutrients, run-off filtering, habitat, etc.). Use grading to increase infiltration, reduce run-off and divert water away from the site. ♦ CANADIAN ENVIRONMENTAL PROTECTION ACT, 1999: http://lois.justice.gc.ca/en/C-15.31/ ♦ Fisheries Act General Prohibition, Section 36 (3): http://lois.justice.gc.ca/en/F-14/ ♦ Guidelines for Effluent Quality and Wastewater Treatment at Federal Establishments:
http://www.pwgsc.gc.ca/rps/inac/content/docs_technical_wastewater_part3-e.html#ww3.8 ♦ Investigating Ecosystem Dynamics at a Watershed Level: http://www.swcs.org/f_conservation_scitech.htm
E.5 Surface Runoff Management Systems Maximize the use of surface runoff management systems, such as use of grassed swales, percolation, ex-filtration or green roofs. Stormwater management systems can consist of naturally occurring components, such as sloughs, rivers and wetlands and manmade components such as swales, canals, weirs, inlets, and retention ponds. By slowing the flow of water and allowing settling, filtration, and percolation, water quality and quantity can be regulated. An urban run-off mitigation plan should ensure that the new development maximizes the permeable surface area and minimizes the amount of run-off directed to impermeable areas. Porous pavement for areas traditionally covered with an impervious surface such as driveways, sidewalks and low-traffic roads can minimize the volume of surface run-off. Calculate the imperviousness ratio as follows:
Percentage of impervious area = total impervious area total project area
The targeted reduction in run-off should be based on the location of the project and local climatic conditions.
♦ Urban Drainage: http://www.ec.gc.ca/water/en/manage/floodgen/e_mngt.htm#stormwater
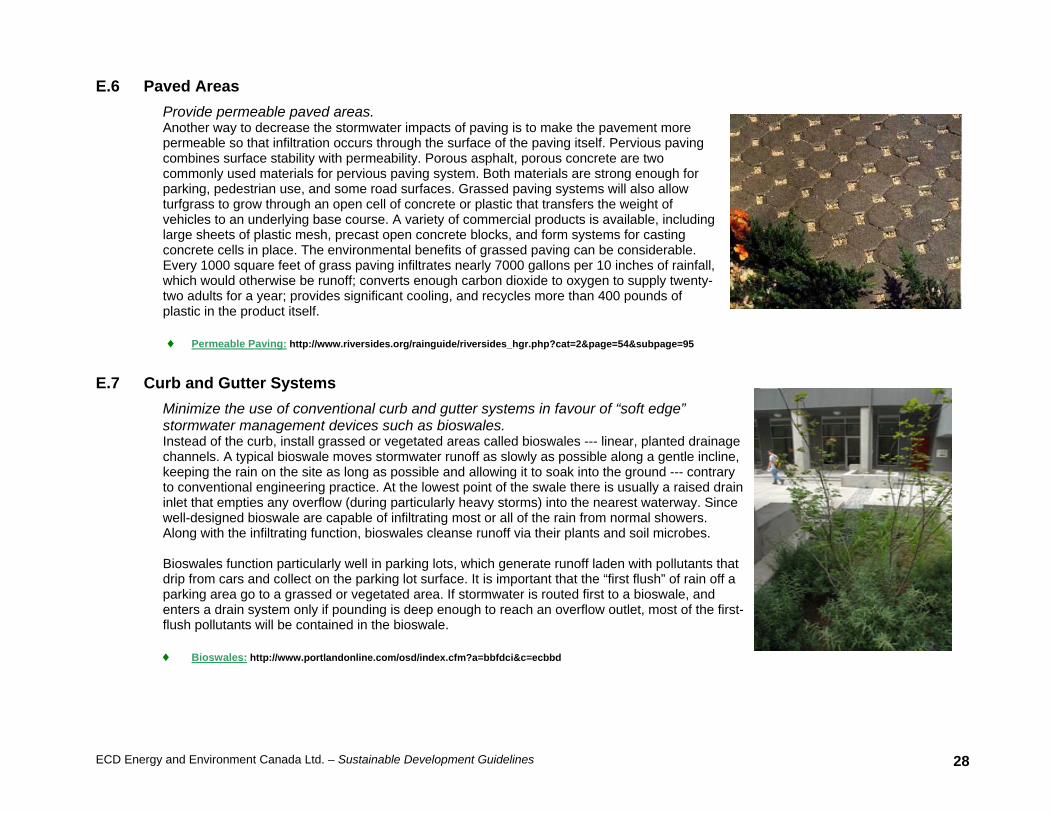
ECD Energy and Environment Canada Ltd. – Sustainable Development Guidelines 28
E.6 Paved Areas Provide permeable paved areas. Another way to decrease the stormwater impacts of paving is to make the pavement more permeable so that infiltration occurs through the surface of the paving itself. Pervious paving combines surface stability with permeability. Porous asphalt, porous concrete are two commonly used materials for pervious paving system. Both materials are strong enough for parking, pedestrian use, and some road surfaces. Grassed paving systems will also allow turfgrass to grow through an open cell of concrete or plastic that transfers the weight of vehicles to an underlying base course. A variety of commercial products is available, including large sheets of plastic mesh, precast open concrete blocks, and form systems for casting concrete cells in place. The environmental benefits of grassed paving can be considerable. Every 1000 square feet of grass paving infiltrates nearly 7000 gallons per 10 inches of rainfall, which would otherwise be runoff; converts enough carbon dioxide to oxygen to supply twenty-two adults for a year; provides significant cooling, and recycles more than 400 pounds of plastic in the product itself. ♦ Permeable Paving: http://www.riversides.org/rainguide/riversides_hgr.php?cat=2&page=54&subpage=95
E.7 Curb and Gutter Systems Minimize the use of conventional curb and gutter systems in favour of “soft edge” stormwater management devices such as bioswales. Instead of the curb, install grassed or vegetated areas called bioswales --- linear, planted drainage channels. A typical bioswale moves stormwater runoff as slowly as possible along a gentle incline, keeping the rain on the site as long as possible and allowing it to soak into the ground --- contrary to conventional engineering practice. At the lowest point of the swale there is usually a raised drain inlet that empties any overflow (during particularly heavy storms) into the nearest waterway. Since well-designed bioswale are capable of infiltrating most or all of the rain from normal showers. Along with the infiltrating function, bioswales cleanse runoff via their plants and soil microbes. Bioswales function particularly well in parking lots, which generate runoff laden with pollutants that drip from cars and collect on the parking lot surface. It is important that the “first flush” of rain off a parking area go to a grassed or vegetated area. If stormwater is routed first to a bioswale, and enters a drain system only if pounding is deep enough to reach an overflow outlet, most of the first-flush pollutants will be contained in the bioswale. ♦ Bioswales: http://www.portlandonline.com/osd/index.cfm?a=bbfdci&c=ecbbd
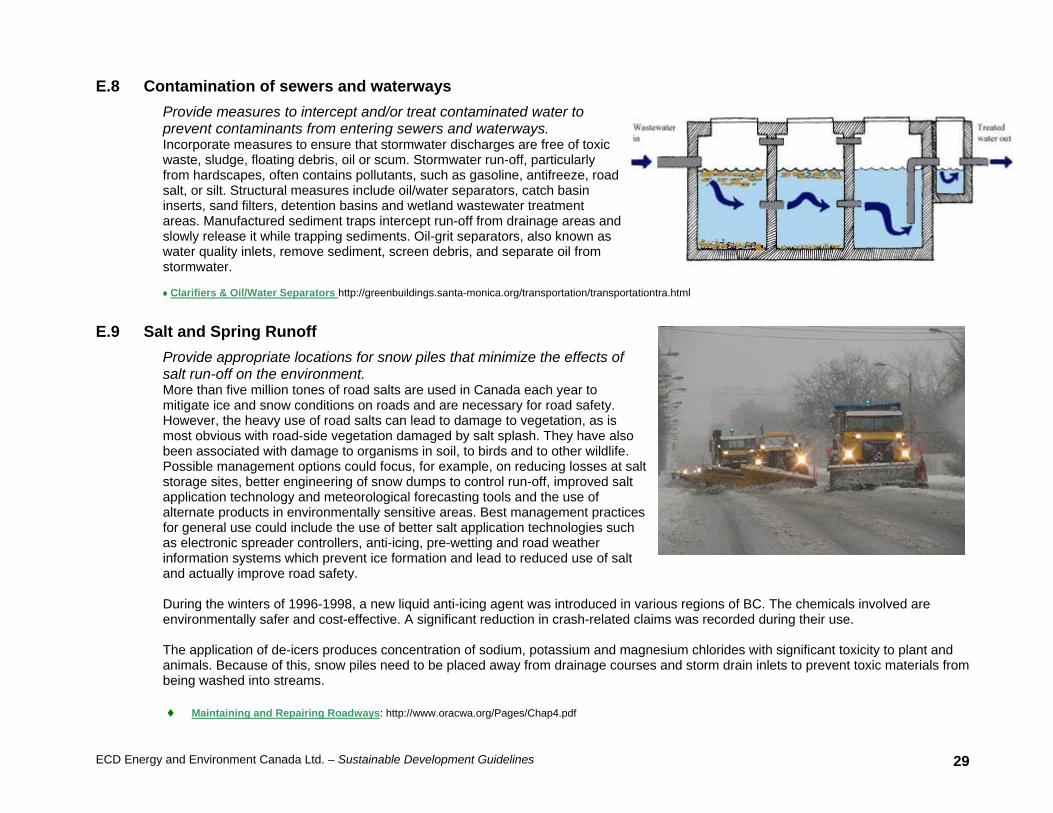
ECD Energy and Environment Canada Ltd. – Sustainable Development Guidelines 29
E.8 Contamination of sewers and waterways Provide measures to intercept and/or treat contaminated water to prevent contaminants from entering sewers and waterways. Incorporate measures to ensure that stormwater discharges are free of toxic waste, sludge, floating debris, oil or scum. Stormwater run-off, particularly from hardscapes, often contains pollutants, such as gasoline, antifreeze, road salt, or silt. Structural measures include oil/water separators, catch basin inserts, sand filters, detention basins and wetland wastewater treatment areas. Manufactured sediment traps intercept run-off from drainage areas and slowly release it while trapping sediments. Oil-grit separators, also known as water quality inlets, remove sediment, screen debris, and separate oil from stormwater. ♦Clarifiers & Oil/Water Separators http://greenbuildings.santa-monica.org/transportation/transportationtra.html
E.9 Salt and Spring Runoff Provide appropriate locations for snow piles that minimize the effects of salt run-off on the environment. More than five million tones of road salts are used in Canada each year to mitigate ice and snow conditions on roads and are necessary for road safety. However, the heavy use of road salts can lead to damage to vegetation, as is most obvious with road-side vegetation damaged by salt splash. They have also been associated with damage to organisms in soil, to birds and to other wildlife. Possible management options could focus, for example, on reducing losses at salt storage sites, better engineering of snow dumps to control run-off, improved salt application technology and meteorological forecasting tools and the use of alternate products in environmentally sensitive areas. Best management practices for general use could include the use of better salt application technologies such as electronic spreader controllers, anti-icing, pre-wetting and road weather information systems which prevent ice formation and lead to reduced use of salt and actually improve road safety. During the winters of 1996-1998, a new liquid anti-icing agent was introduced in various regions of BC. The chemicals involved are environmentally safer and cost-effective. A significant reduction in crash-related claims was recorded during their use. The application of de-icers produces concentration of sodium, potassium and magnesium chlorides with significant toxicity to plant and animals. Because of this, snow piles need to be placed away from drainage courses and storm drain inlets to prevent toxic materials from being washed into streams. ♦ Maintaining and Repairing Roadways: http://www.oracwa.org/Pages/Chap4.pdf
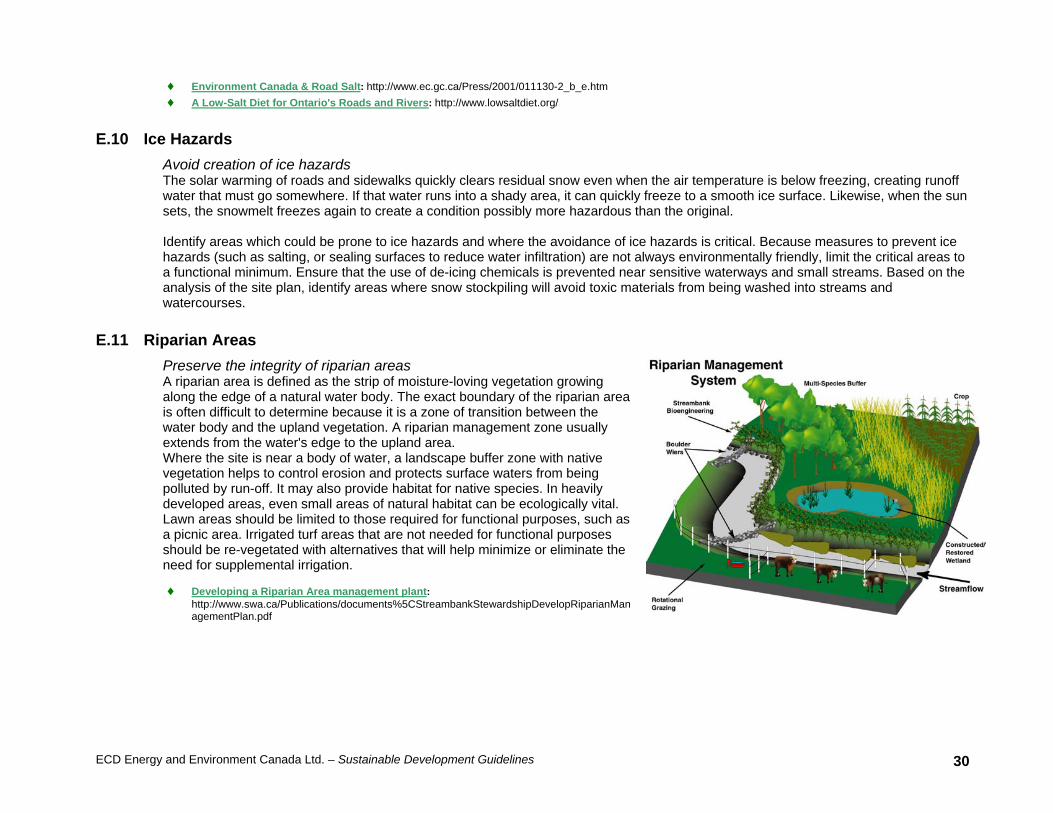
ECD Energy and Environment Canada Ltd. – Sustainable Development Guidelines 30
♦ Environment Canada & Road Salt: http://www.ec.gc.ca/Press/2001/011130-2_b_e.htm ♦ A Low-Salt Diet for Ontario's Roads and Rivers: http://www.lowsaltdiet.org/
E.10 Ice Hazards Avoid creation of ice hazards The solar warming of roads and sidewalks quickly clears residual snow even when the air temperature is below freezing, creating runoff water that must go somewhere. If that water runs into a shady area, it can quickly freeze to a smooth ice surface. Likewise, when the sun sets, the snowmelt freezes again to create a condition possibly more hazardous than the original. Identify areas which could be prone to ice hazards and where the avoidance of ice hazards is critical. Because measures to prevent ice hazards (such as salting, or sealing surfaces to reduce water infiltration) are not always environmentally friendly, limit the critical areas to a functional minimum. Ensure that the use of de-icing chemicals is prevented near sensitive waterways and small streams. Based on the analysis of the site plan, identify areas where snow stockpiling will avoid toxic materials from being washed into streams and watercourses.
E.11 Riparian Areas Preserve the integrity of riparian areas A riparian area is defined as the strip of moisture-loving vegetation growing along the edge of a natural water body. The exact boundary of the riparian area is often difficult to determine because it is a zone of transition between the water body and the upland vegetation. A riparian management zone usually extends from the water's edge to the upland area. Where the site is near a body of water, a landscape buffer zone with native vegetation helps to control erosion and protects surface waters from being polluted by run-off. It may also provide habitat for native species. In heavily developed areas, even small areas of natural habitat can be ecologically vital. Lawn areas should be limited to those required for functional purposes, such as a picnic area. Irrigated turf areas that are not needed for functional purposes should be re-vegetated with alternatives that will help minimize or eliminate the need for supplemental irrigation.
♦ Developing a Riparian Area management plant: http://www.swa.ca/Publications/documents%5CStreambankStewardshipDevelopRiparianManagementPlan.pdf
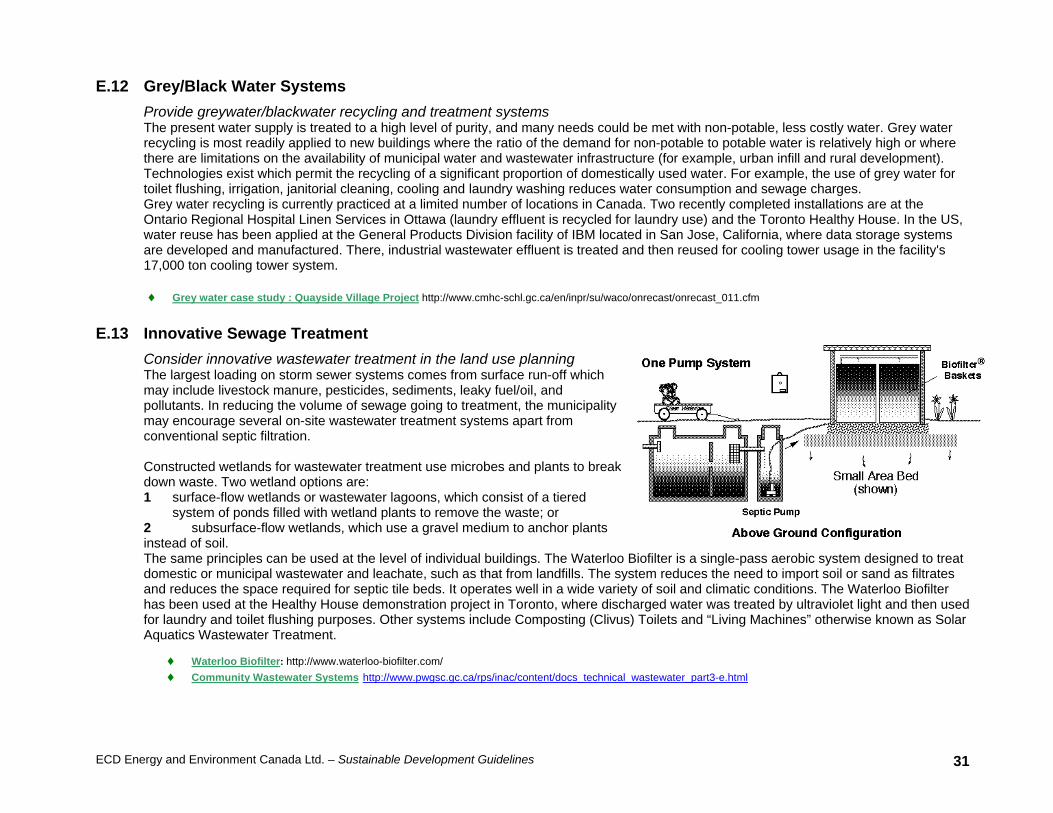
ECD Energy and Environment Canada Ltd. – Sustainable Development Guidelines 31
E.12 Grey/Black Water Systems Provide greywater/blackwater recycling and treatment systems The present water supply is treated to a high level of purity, and many needs could be met with non-potable, less costly water. Grey water recycling is most readily applied to new buildings where the ratio of the demand for non-potable to potable water is relatively high or where there are limitations on the availability of municipal water and wastewater infrastructure (for example, urban infill and rural development). Technologies exist which permit the recycling of a significant proportion of domestically used water. For example, the use of grey water for toilet flushing, irrigation, janitorial cleaning, cooling and laundry washing reduces water consumption and sewage charges. Grey water recycling is currently practiced at a limited number of locations in Canada. Two recently completed installations are at the Ontario Regional Hospital Linen Services in Ottawa (laundry effluent is recycled for laundry use) and the Toronto Healthy House. In the US, water reuse has been applied at the General Products Division facility of IBM located in San Jose, California, where data storage systems are developed and manufactured. There, industrial wastewater effluent is treated and then reused for cooling tower usage in the facility's 17,000 ton cooling tower system. ♦ Grey water case study : Quayside Village Project http://www.cmhc-schl.gc.ca/en/inpr/su/waco/onrecast/onrecast_011.cfm
E.13 Innovative Sewage Treatment Consider innovative wastewater treatment in the land use planning The largest loading on storm sewer systems comes from surface run-off which may include livestock manure, pesticides, sediments, leaky fuel/oil, and pollutants. In reducing the volume of sewage going to treatment, the municipality may encourage several on-site wastewater treatment systems apart from conventional septic filtration. Constructed wetlands for wastewater treatment use microbes and plants to break down waste. Two wetland options are: 1 surface-flow wetlands or wastewater lagoons, which consist of a tiered
system of ponds filled with wetland plants to remove the waste; or 2 subsurface-flow wetlands, which use a gravel medium to anchor plants instead of soil. The same principles can be used at the level of individual buildings. The Waterloo Biofilter is a single-pass aerobic system designed to treat domestic or municipal wastewater and leachate, such as that from landfills. The system reduces the need to import soil or sand as filtrates and reduces the space required for septic tile beds. It operates well in a wide variety of soil and climatic conditions. The Waterloo Biofilter has been used at the Healthy House demonstration project in Toronto, where discharged water was treated by ultraviolet light and then used for laundry and toilet flushing purposes. Other systems include Composting (Clivus) Toilets and “Living Machines” otherwise known as Solar Aquatics Wastewater Treatment.
♦ Waterloo Biofilter: http://www.waterloo-biofilter.com/ ♦ Community Wastewater Systems http://www.pwgsc.gc.ca/rps/inac/content/docs_technical_wastewater_part3-e.html
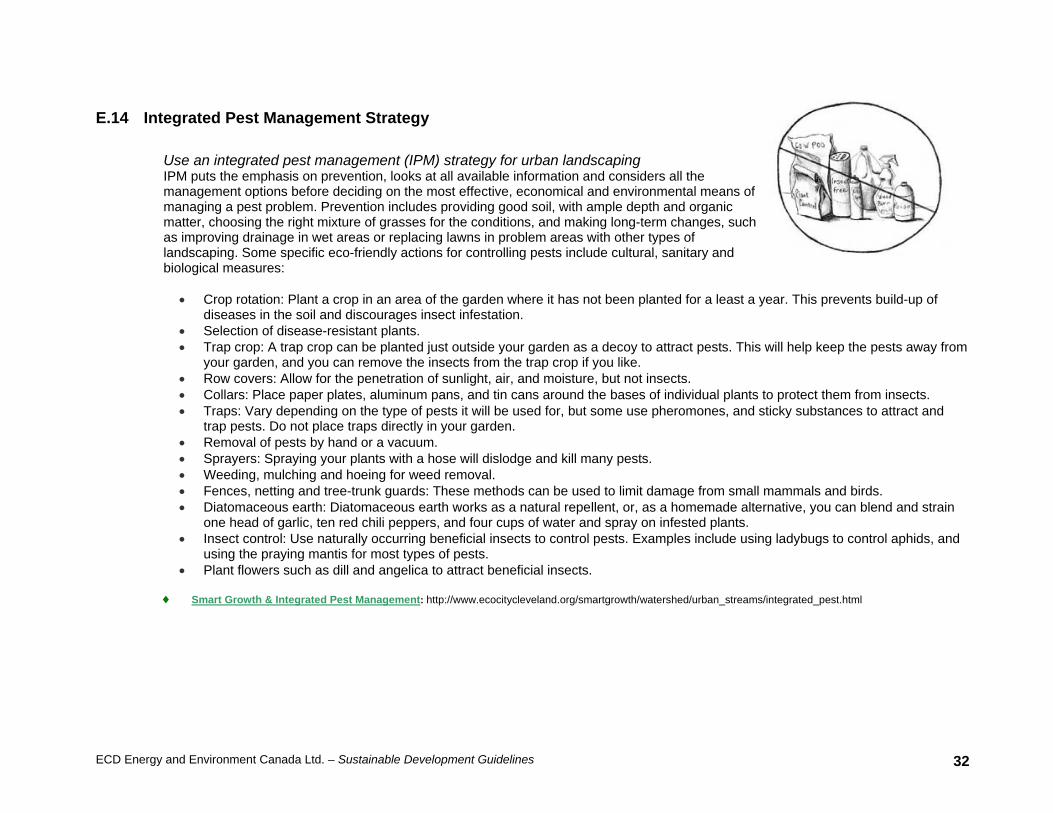
ECD Energy and Environment Canada Ltd. – Sustainable Development Guidelines 32
E.14 Integrated Pest Management Strategy
Use an integrated pest management (IPM) strategy for urban landscaping IPM puts the emphasis on prevention, looks at all available information and considers all the
management options before deciding on the most effective, economical and environmental means of managing a pest problem. Prevention includes providing good soil, with ample depth and organic matter, choosing the right mixture of grasses for the conditions, and making long-term changes, such as improving drainage in wet areas or replacing lawns in problem areas with other types of landscaping. Some specific eco-friendly actions for controlling pests include cultural, sanitary and biological measures:
• Crop rotation: Plant a crop in an area of the garden where it has not been planted for a least a year. This prevents build-up of
diseases in the soil and discourages insect infestation. • Selection of disease-resistant plants. • Trap crop: A trap crop can be planted just outside your garden as a decoy to attract pests. This will help keep the pests away from
your garden, and you can remove the insects from the trap crop if you like. • Row covers: Allow for the penetration of sunlight, air, and moisture, but not insects. • Collars: Place paper plates, aluminum pans, and tin cans around the bases of individual plants to protect them from insects. • Traps: Vary depending on the type of pests it will be used for, but some use pheromones, and sticky substances to attract and
trap pests. Do not place traps directly in your garden. • Removal of pests by hand or a vacuum. • Sprayers: Spraying your plants with a hose will dislodge and kill many pests. • Weeding, mulching and hoeing for weed removal. • Fences, netting and tree-trunk guards: These methods can be used to limit damage from small mammals and birds. • Diatomaceous earth: Diatomaceous earth works as a natural repellent, or, as a homemade alternative, you can blend and strain
one head of garlic, ten red chili peppers, and four cups of water and spray on infested plants. • Insect control: Use naturally occurring beneficial insects to control pests. Examples include using ladybugs to control aphids, and
using the praying mantis for most types of pests. • Plant flowers such as dill and angelica to attract beneficial insects.
♦ Smart Growth & Integrated Pest Management: http://www.ecocitycleveland.org/smartgrowth/watershed/urban_streams/integrated_pest.html
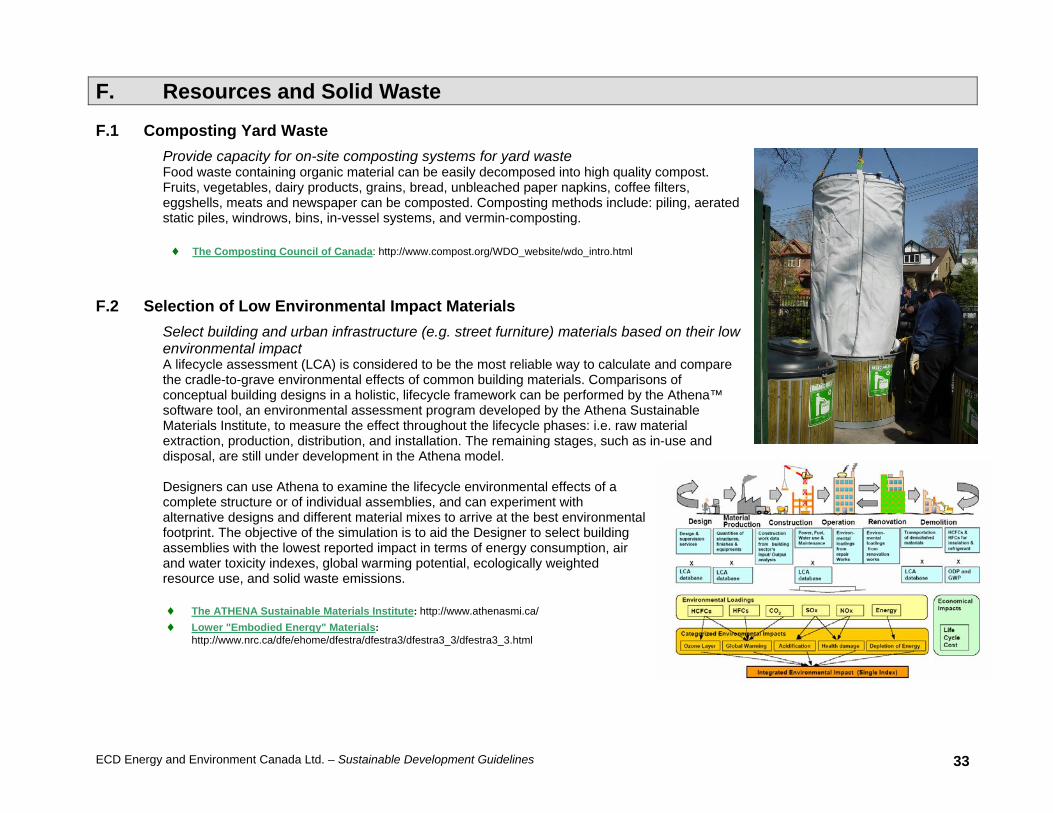
ECD Energy and Environment Canada Ltd. – Sustainable Development Guidelines 33
F. Resources and Solid Waste
F.1 Composting Yard Waste Provide capacity for on-site composting systems for yard waste Food waste containing organic material can be easily decomposed into high quality compost. Fruits, vegetables, dairy products, grains, bread, unbleached paper napkins, coffee filters, eggshells, meats and newspaper can be composted. Composting methods include: piling, aerated static piles, windrows, bins, in-vessel systems, and vermin-composting.
♦ The Composting Council of Canada: http://www.compost.org/WDO_website/wdo_intro.html
F.2 Selection of Low Environmental Impact Materials Select building and urban infrastructure (e.g. street furniture) materials based on their low environmental impact A lifecycle assessment (LCA) is considered to be the most reliable way to calculate and compare the cradle-to-grave environmental effects of common building materials. Comparisons of conceptual building designs in a holistic, lifecycle framework can be performed by the Athena™ software tool, an environmental assessment program developed by the Athena Sustainable Materials Institute, to measure the effect throughout the lifecycle phases: i.e. raw material extraction, production, distribution, and installation. The remaining stages, such as in-use and disposal, are still under development in the Athena model. Designers can use Athena to examine the lifecycle environmental effects of a complete structure or of individual assemblies, and can experiment with alternative designs and different material mixes to arrive at the best environmental footprint. The objective of the simulation is to aid the Designer to select building assemblies with the lowest reported impact in terms of energy consumption, air and water toxicity indexes, global warming potential, ecologically weighted resource use, and solid waste emissions. ♦ The ATHENA Sustainable Materials Institute: http://www.athenasmi.ca/ ♦ Lower "Embodied Energy" Materials:
http://www.nrc.ca/dfe/ehome/dfestra/dfestra3/dfestra3_3/dfestra3_3.html
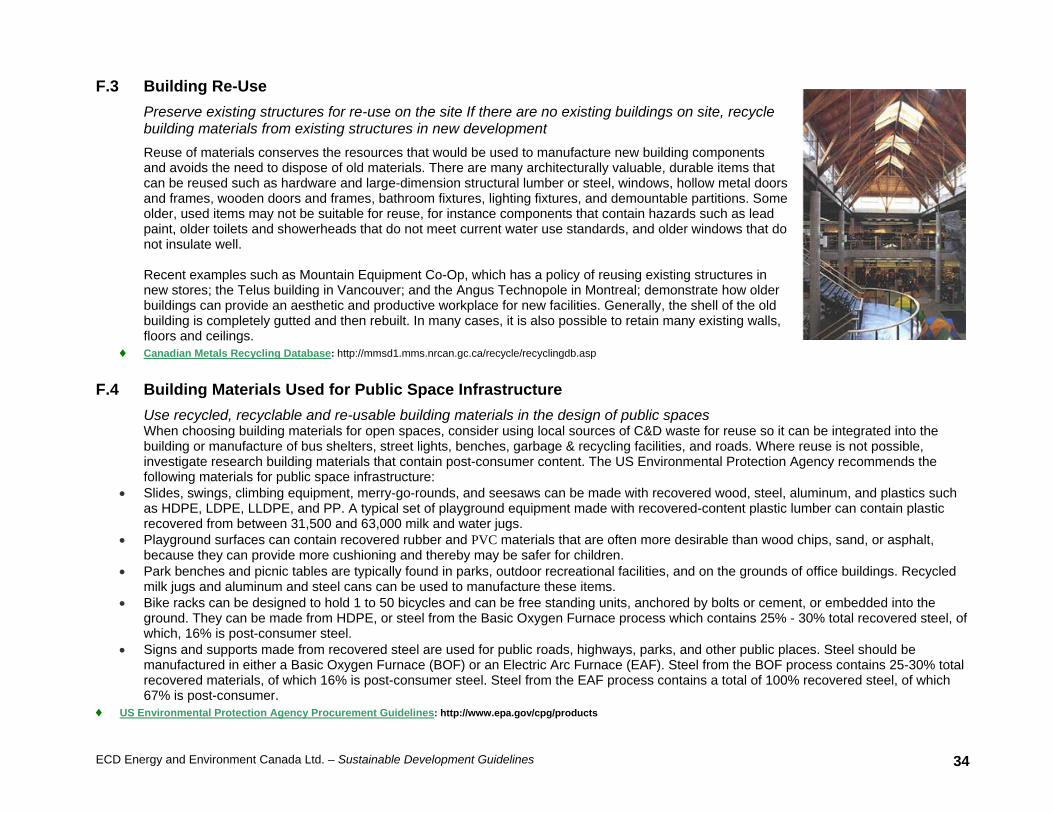
ECD Energy and Environment Canada Ltd. – Sustainable Development Guidelines 34
F.3 Building Re-Use Preserve existing structures for re-use on the site If there are no existing buildings on site, recycle building materials from existing structures in new development Reuse of materials conserves the resources that would be used to manufacture new building components and avoids the need to dispose of old materials. There are many architecturally valuable, durable items that can be reused such as hardware and large-dimension structural lumber or steel, windows, hollow metal doors and frames, wooden doors and frames, bathroom fixtures, lighting fixtures, and demountable partitions. Some older, used items may not be suitable for reuse, for instance components that contain hazards such as lead paint, older toilets and showerheads that do not meet current water use standards, and older windows that do not insulate well. Recent examples such as Mountain Equipment Co-Op, which has a policy of reusing existing structures in new stores; the Telus building in Vancouver; and the Angus Technopole in Montreal; demonstrate how older buildings can provide an aesthetic and productive workplace for new facilities. Generally, the shell of the old building is completely gutted and then rebuilt. In many cases, it is also possible to retain many existing walls, floors and ceilings.
♦ Canadian Metals Recycling Database: http://mmsd1.mms.nrcan.gc.ca/recycle/recyclingdb.asp
F.4 Building Materials Used for Public Space Infrastructure Use recycled, recyclable and re-usable building materials in the design of public spaces When choosing building materials for open spaces, consider using local sources of C&D waste for reuse so it can be integrated into the building or manufacture of bus shelters, street lights, benches, garbage & recycling facilities, and roads. Where reuse is not possible, investigate research building materials that contain post-consumer content. The US Environmental Protection Agency recommends the following materials for public space infrastructure:
• Slides, swings, climbing equipment, merry-go-rounds, and seesaws can be made with recovered wood, steel, aluminum, and plastics such as HDPE, LDPE, LLDPE, and PP. A typical set of playground equipment made with recovered-content plastic lumber can contain plastic recovered from between 31,500 and 63,000 milk and water jugs.
• Playground surfaces can contain recovered rubber and PVC materials that are often more desirable than wood chips, sand, or asphalt, because they can provide more cushioning and thereby may be safer for children.
• Park benches and picnic tables are typically found in parks, outdoor recreational facilities, and on the grounds of office buildings. Recycled milk jugs and aluminum and steel cans can be used to manufacture these items.
• Bike racks can be designed to hold 1 to 50 bicycles and can be free standing units, anchored by bolts or cement, or embedded into the ground. They can be made from HDPE, or steel from the Basic Oxygen Furnace process which contains 25% - 30% total recovered steel, of which, 16% is post-consumer steel.
• Signs and supports made from recovered steel are used for public roads, highways, parks, and other public places. Steel should be manufactured in either a Basic Oxygen Furnace (BOF) or an Electric Arc Furnace (EAF). Steel from the BOF process contains 25-30% total recovered materials, of which 16% is post-consumer steel. Steel from the EAF process contains a total of 100% recovered steel, of which 67% is post-consumer.
♦ US Environmental Protection Agency Procurement Guidelines: http://www.epa.gov/cpg/products
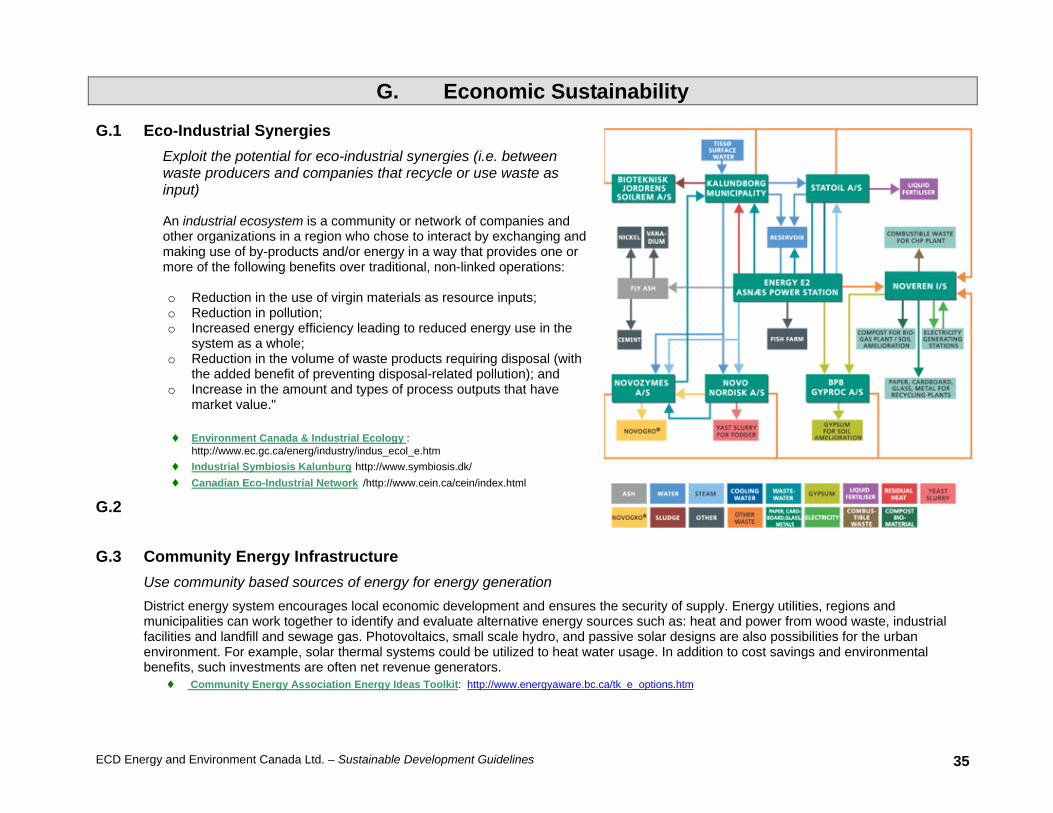
ECD Energy and Environment Canada Ltd. – Sustainable Development Guidelines 35
G. Economic Sustainability
G.1 Eco-Industrial Synergies Exploit the potential for eco-industrial synergies (i.e. between waste producers and companies that recycle or use waste as input) An industrial ecosystem is a community or network of companies and other organizations in a region who chose to interact by exchanging and making use of by-products and/or energy in a way that provides one or more of the following benefits over traditional, non-linked operations: o Reduction in the use of virgin materials as resource inputs; o Reduction in pollution; o Increased energy efficiency leading to reduced energy use in the
system as a whole; o Reduction in the volume of waste products requiring disposal (with
the added benefit of preventing disposal-related pollution); and o Increase in the amount and types of process outputs that have
market value."
♦ Environment Canada & Industrial Ecology : http://www.ec.gc.ca/energ/industry/indus_ecol_e.htm
♦ Industrial Symbiosis Kalunburg http://www.symbiosis.dk/ ♦ Canadian Eco-Industrial Network /http://www.cein.ca/cein/index.html
G.2
G.3 Community Energy Infrastructure Use community based sources of energy for energy generation District energy system encourages local economic development and ensures the security of supply. Energy utilities, regions and municipalities can work together to identify and evaluate alternative energy sources such as: heat and power from wood waste, industrial facilities and landfill and sewage gas. Photovoltaics, small scale hydro, and passive solar designs are also possibilities for the urban environment. For example, solar thermal systems could be utilized to heat water usage. In addition to cost savings and environmental benefits, such investments are often net revenue generators.
♦ Community Energy Association Energy Ideas Toolkit: http://www.energyaware.bc.ca/tk_e_options.htm
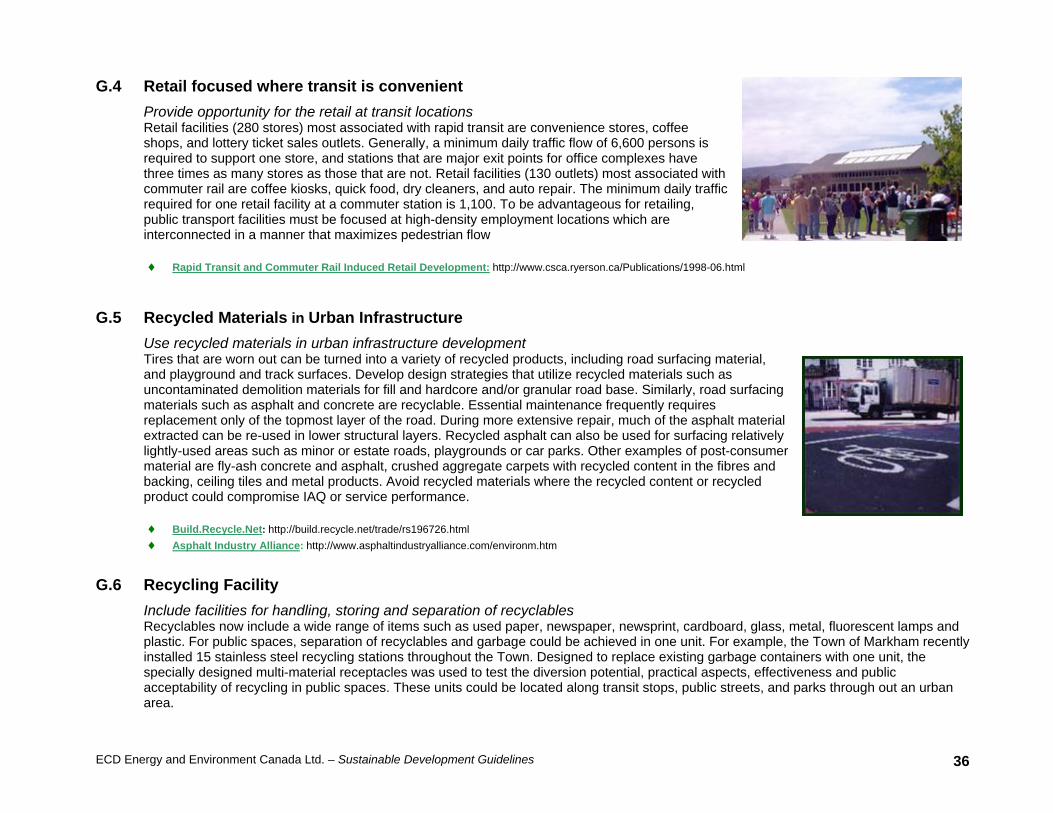
ECD Energy and Environment Canada Ltd. – Sustainable Development Guidelines 36
G.4 Retail focused where transit is convenient Provide opportunity for the retail at transit locations Retail facilities (280 stores) most associated with rapid transit are convenience stores, coffee shops, and lottery ticket sales outlets. Generally, a minimum daily traffic flow of 6,600 persons is required to support one store, and stations that are major exit points for office complexes have three times as many stores as those that are not. Retail facilities (130 outlets) most associated with commuter rail are coffee kiosks, quick food, dry cleaners, and auto repair. The minimum daily traffic required for one retail facility at a commuter station is 1,100. To be advantageous for retailing, public transport facilities must be focused at high-density employment locations which are interconnected in a manner that maximizes pedestrian flow ♦ Rapid Transit and Commuter Rail Induced Retail Development: http://www.csca.ryerson.ca/Publications/1998-06.html
G.5 Recycled Materials in Urban Infrastructure
Use recycled materials in urban infrastructure development Tires that are worn out can be turned into a variety of recycled products, including road surfacing material, and playground and track surfaces. Develop design strategies that utilize recycled materials such as uncontaminated demolition materials for fill and hardcore and/or granular road base. Similarly, road surfacing materials such as asphalt and concrete are recyclable. Essential maintenance frequently requires replacement only of the topmost layer of the road. During more extensive repair, much of the asphalt material extracted can be re-used in lower structural layers. Recycled asphalt can also be used for surfacing relatively lightly-used areas such as minor or estate roads, playgrounds or car parks. Other examples of post-consumer material are fly-ash concrete and asphalt, crushed aggregate carpets with recycled content in the fibres and backing, ceiling tiles and metal products. Avoid recycled materials where the recycled content or recycled product could compromise IAQ or service performance. ♦ Build.Recycle.Net: http://build.recycle.net/trade/rs196726.html ♦ Asphalt Industry Alliance: http://www.asphaltindustryalliance.com/environm.htm
G.6 Recycling Facility Include facilities for handling, storing and separation of recyclables Recyclables now include a wide range of items such as used paper, newspaper, newsprint, cardboard, glass, metal, fluorescent lamps and plastic. For public spaces, separation of recyclables and garbage could be achieved in one unit. For example, the Town of Markham recently installed 15 stainless steel recycling stations throughout the Town. Designed to replace existing garbage containers with one unit, the specially designed multi-material receptacles was used to test the diversion potential, practical aspects, effectiveness and public acceptability of recycling in public spaces. These units could be located along transit stops, public streets, and parks through out an urban area.
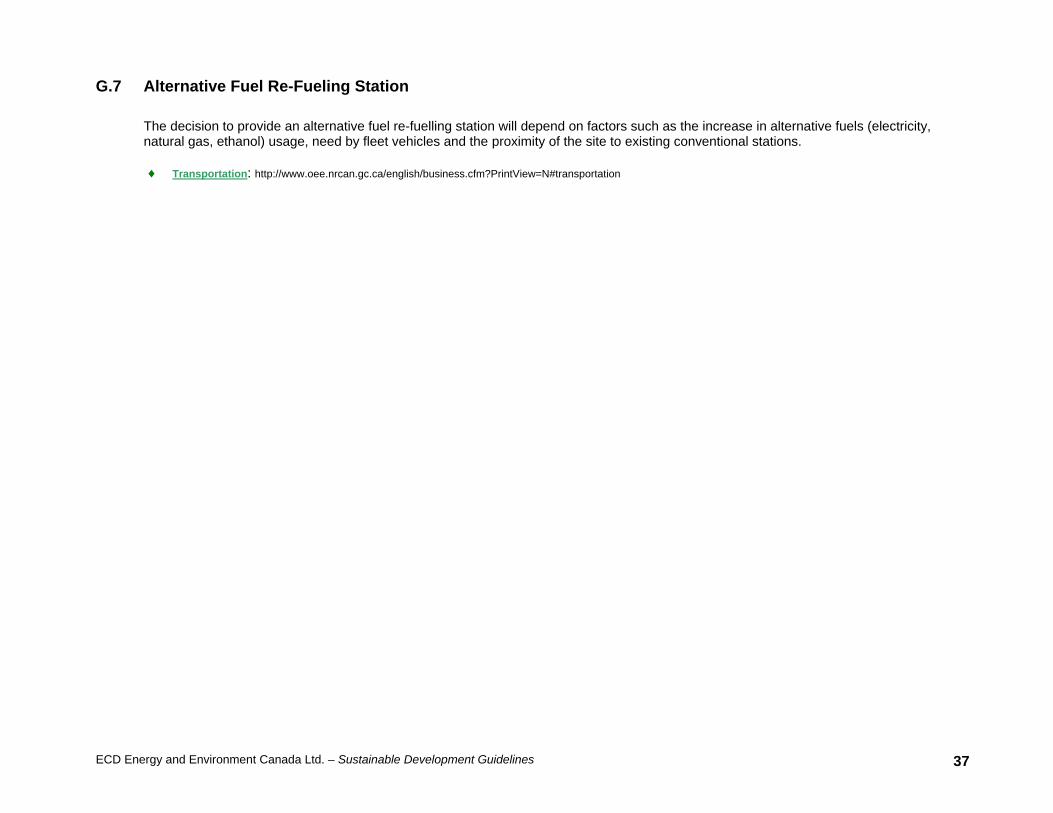
ECD Energy and Environment Canada Ltd. – Sustainable Development Guidelines 37
G.7 Alternative Fuel Re-Fueling Station The decision to provide an alternative fuel re-fuelling station will depend on factors such as the increase in alternative fuels (electricity, natural gas, ethanol) usage, need by fleet vehicles and the proximity of the site to existing conventional stations. ♦ Transportation: http://www.oee.nrcan.gc.ca/english/business.cfm?PrintView=N#transportation
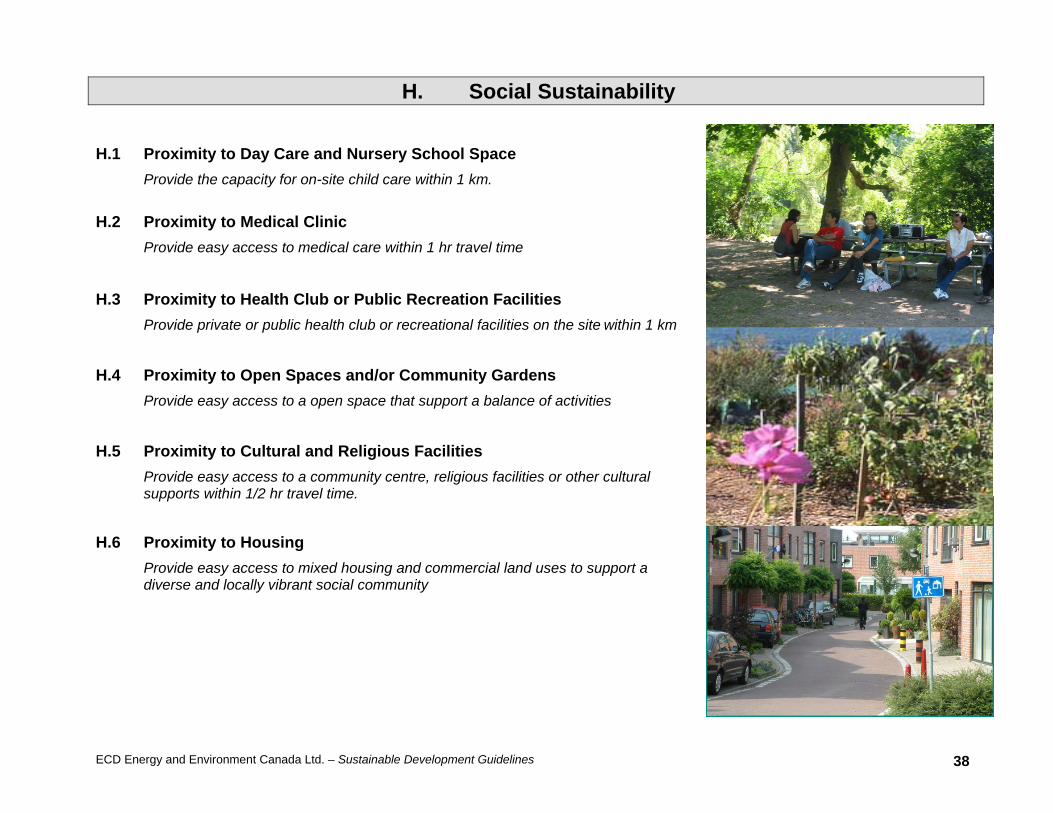
ECD Energy and Environment Canada Ltd. – Sustainable Development Guidelines 38
H. Social Sustainability
H.1 Proximity to Day Care and Nursery School Space Provide the capacity for on-site child care within 1 km.
H.2 Proximity to Medical Clinic Provide easy access to medical care within 1 hr travel time
H.3 Proximity to Health Club or Public Recreation Facilities
Provide private or public health club or recreational facilities on the site within 1 km
H.4 Proximity to Open Spaces and/or Community Gardens Provide easy access to a open space that support a balance of activities
H.5 Proximity to Cultural and Religious Facilities Provide easy access to a community centre, religious facilities or other cultural supports within 1/2 hr travel time.
H.6 Proximity to Housing Provide easy access to mixed housing and commercial land uses to support a diverse and locally vibrant social community

HIGHWAY 407 (SEATON LANDS)ECONOMIC DEVELOPMENT STUDY
APPENDIX E
Development Pro Formas
Hemson Consulting Ltd.

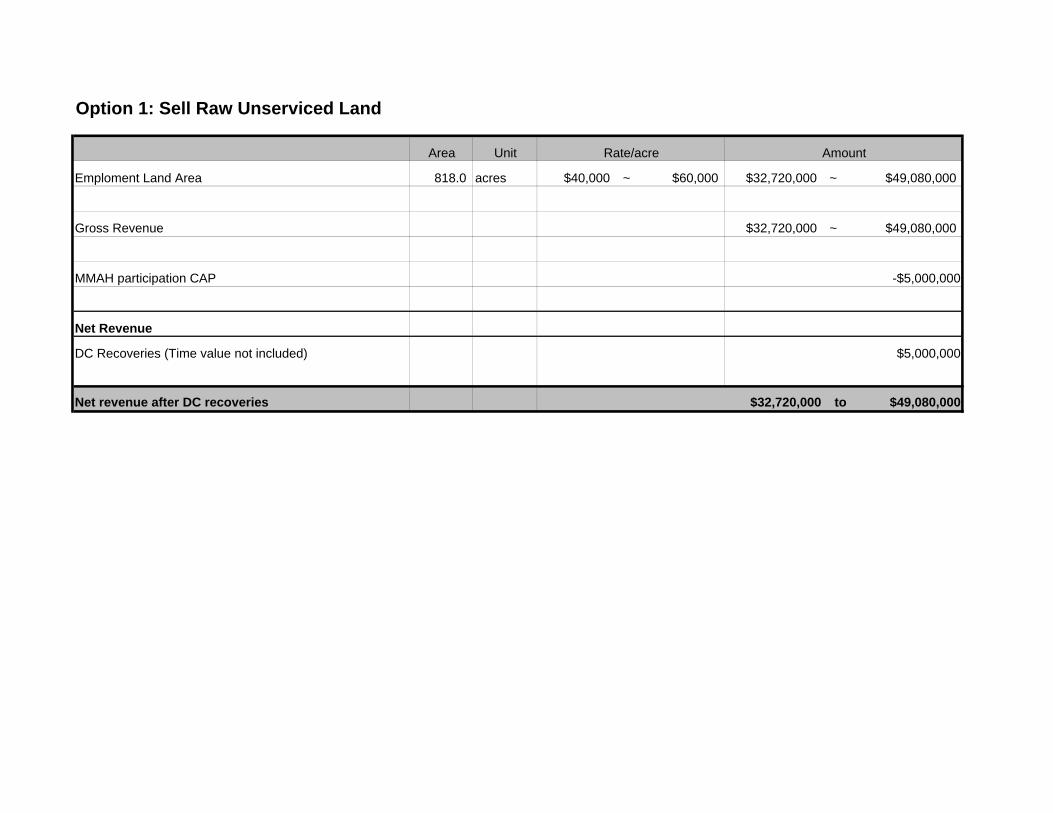
Option 1: Sell Raw Unserviced Land
Area Unit
Emploment Land Area 818.0 acres $40,000 ~ $60,000 $32,720,000 ~ $49,080,000
Gross Revenue $32,720,000 ~ $49,080,000
MMAH participation CAP -$5,000,000
Net Revenue
DC Recoveries (Time value not included) $5,000,000
Net revenue after DC recoveries $32,720,000 to $49,080,000
Rate/acre Amount
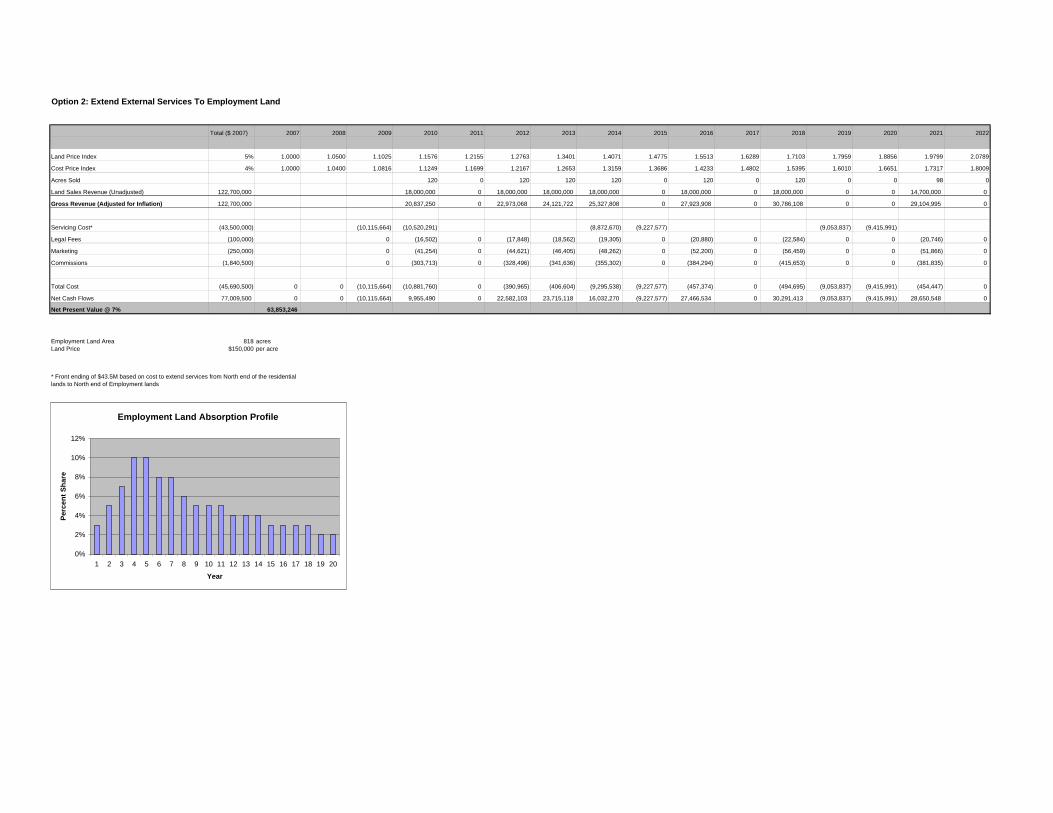
Option 2: Extend External Services To Employment Land
Total ($ 2007) 2007 2008 2009 2010 2011 2012 2013 2014 2015 2016 2017 2018 2019 2020 2021 2022
Land Price Index 5% 1.0000 1.0500 1.1025 1.1576 1.2155 1.2763 1.3401 1.4071 1.4775 1.5513 1.6289 1.7103 1.7959 1.8856 1.9799 2.0789
Cost Price Index 4% 1.0000 1.0400 1.0816 1.1249 1.1699 1.2167 1.2653 1.3159 1.3686 1.4233 1.4802 1.5395 1.6010 1.6651 1.7317 1.8009
Acres Sold 120 0 120 120 120 0 120 0 120 0 0 98 0
Land Sales Revenue (Unadjusted) 122,700,000 18,000,000 0 18,000,000 18,000,000 18,000,000 0 18,000,000 0 18,000,000 0 0 14,700,000 0
Gross Revenue (Adjusted for Inflation) 122,700,000 20,837,250 0 22,973,068 24,121,722 25,327,808 0 27,923,908 0 30,786,108 0 0 29,104,995 0
Servicing Cost* (43,500,000) (10,115,664) (10,520,291) (8,872,670) (9,227,577) (9,053,837) (9,415,991)
Legal Fees (100,000) 0 (16,502) 0 (17,848) (18,562) (19,305) 0 (20,880) 0 (22,584) 0 0 (20,746) 0
Marketing (250,000) 0 (41,254) 0 (44,621) (46,405) (48,262) 0 (52,200) 0 (56,459) 0 0 (51,866) 0
Commissions (1,840,500) 0 (303,713) 0 (328,496) (341,636) (355,302) 0 (384,294) 0 (415,653) 0 0 (381,835) 0
Total Cost (45,690,500) 0 0 (10,115,664) (10,881,760) 0 (390,965) (406,604) (9,295,538) (9,227,577) (457,374) 0 (494,695) (9,053,837) (9,415,991) (454,447) 0
Net Cash Flows 77,009,500 0 0 (10,115,664) 9,955,490 0 22,582,103 23,715,118 16,032,270 (9,227,577) 27,466,534 0 30,291,413 (9,053,837) (9,415,991) 28,650,548 0
Net Present Value @ 7% 63,853,246
Employment Land Area 818 acresLand Price $150,000 per acre
* Front ending of $43.5M based on cost to extend services from North end of the residential lands to North end of Employment lands
Employment Land Absorption Profile
0%
2%
4%
6%
8%
10%
12%
1 2 3 4 5 6 7 8 9 10 11 12 13 14 15 16 17 18 19 20
Year
Perc
ent S
hare
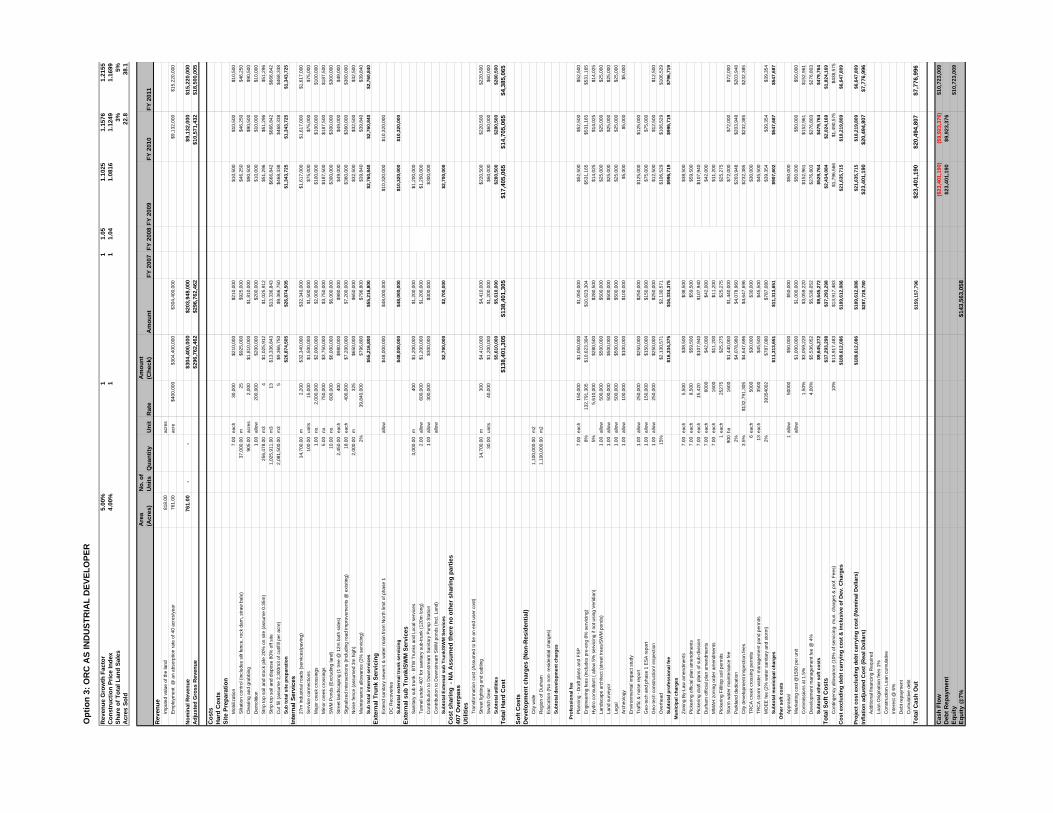
Opt
ion
3: O
RC
AS
IND
UST
RIA
L D
EVEL
OPE
R
Rev
enue
Gro
wth
Fac
tor
5.00
%1
11.
051.
1025
1.15
761.
2155
Con
stru
ctio
n Pr
ice
Inde
x4.
00%
11
1.04
1.08
161.
1249
1.16
99Sh
are
of T
otal
Lan
d Sa
les
3%5%
Acr
es S
old
22.8
38.1
Are
a (A
cres
)N
o. o
f U
nits
Qua
ntity
Uni
tR
ate
Am
ount
(C
heck
)A
mou
ntFY
200
7FY
200
8FY
200
9FY
201
0FY
201
1R
even
ueIm
pute
d va
lue
of th
e la
nd81
8.00
acre
sE
mpl
oym
ent
@ a
n ab
sorp
tion
rate
of 4
0 ac
res/
year
761.
00
ac
re$4
00,0
00$3
04,4
00,0
00$3
04,4
00,0
00$9
,132
,000
$15,
220,
000
Nom
inal
Rev
enue
761.
00
-
-
$3
04,4
00,0
00$2
03,9
48,0
00$9
,132
,000
$15,
220,
000
Adj
uste
d G
ross
Rev
enue
$296
,762
,462
$296
,762
,462
$10,
571,
432
$18,
500,
005
Cos
tsH
ard
Cos
tsSi
te P
repa
ratio
nM
obili
zatio
n7.
00
ea
ch30
,000
$2
10,0
00$2
10,0
00$1
0,50
0$1
0,50
0$1
0,50
0S
iltat
ion
cont
rol (
incl
udes
silt
fenc
e, ro
ck d
am, s
traw
bal
e)37
,000
.00
m
25
$925
,000
$925
,000
$46,
250
$46,
250
$46,
250
Cle
arin
g an
d gr
ubbi
ng90
5.00
ac
res
2,00
0
$1
,810
,000
$1,8
10,0
00$9
0,50
0$9
0,50
0$9
0,50
0D
emol
ition
1.00
allo
w20
0,00
0
$2
00,0
00$2
00,0
00$1
0,00
0$1
0,00
0$1
0,00
0S
trip
top
soil
and
stoc
k pi
le 2
0% o
n si
te (a
ssum
e 0.
35m
)25
6,47
8.00
m
34
$1,0
25,9
12$1
,025
,912
$51,
296
$51,
296
$51,
296
Stri
p to
p so
il an
d di
spos
e 80
% o
ff si
te1,
025,
911.
00
m
313
$1
3,33
6,84
3$1
3,33
6,84
3$6
66,8
42$6
66,8
42$6
66,8
42C
ut fi
ll (a
ssum
e 2,
300m
3 of
cut
/fill
per a
cre)
2,08
1,50
0.00
m3
5
$9
,366
,750
$9,3
66,7
50$4
68,3
38$4
68,3
38$4
68,3
38Su
b to
tal s
ite p
repa
ratio
n$2
6,87
4,50
5$2
6,87
4,50
5$1
,343
,725
$1,3
43,7
25$1
,343
,725
Inte
rnal
Ser
vice
s27
m In
dust
rial r
oads
(ser
vice
s/pa
ving
)14
,700
.00
m
2,20
0
$3
2,34
0,00
0$3
2,34
0,00
0$1
,617
,000
$1,6
17,0
00$1
,617
,000
Ser
vice
con
nect
ions
100.
00
units
15,0
00
$1,5
00,0
00$1
,500
,000
$75,
000
$75,
000
$75,
000
Maj
or c
reek
cro
ssin
gs1.
00
no
.2,
000,
000
$2
,000
,000
$2,0
00,0
00$1
00,0
00$1
00,0
00$1
00,0
00M
inor
cre
ek c
ross
ings
5.00
no.
750,
000
$3,7
50,0
00$3
,750
,000
$187
,500
$187
,500
$187
,500
SW
M P
onds
(Exc
ludi
ng la
nd)
10.0
0
no
.60
0,00
0
$6
,000
,000
$6,0
00,0
00$3
00,0
00$3
00,0
00$3
00,0
00S
treet
land
scap
ing
(1 tr
ee @
12m
bot
h si
des)
2,45
0.00
each
400
$980
,000
$980
,000
$49,
000
$49,
000
$49,
000
Sig
naliz
ed in
ters
ectio
ns (i
nclu
ding
road
impr
ovem
ents
@ e
xist
ing)
18.0
0
ea
ch40
0,00
0
$7
,200
,000
$7,2
00,0
00$3
60,0
00$3
60,0
00$3
60,0
00N
oise
fenc
e (a
ssum
ed 3
m h
igh)
2,00
0.00
m32
5
$6
50,0
00$6
50,0
00$3
2,50
0$3
2,50
0$3
2,50
0M
aint
enan
ce a
llow
ance
(2%
ser
vici
ng)
2%39
,840
,000
$796
,800
$796
,800
$39,
840
$39,
840
$39,
840
Sub
tota
l int
erna
l ser
vice
s$5
5,21
6,80
0$5
5,21
6,80
0$2
,760
,840
$2,7
60,8
40$2
,760
,840
Exte
rnal
Tru
nk S
ervi
cing
Ext
end
sani
tary
sew
ers
& w
ater
mai
n fro
m N
orth
lim
it of
pha
se 1
allo
w$4
8,00
0,00
0$4
8,00
0,00
0$1
0,32
0,00
0$1
0,32
0,00
0D
C R
ecov
erie
sSu
btot
al e
xter
nal t
runk
ser
vici
ng$4
8,00
0,00
0$4
8,00
0,00
0$1
0,32
0,00
0$1
0,32
0,00
0Ex
tern
al s
ub T
runk
/SW
M S
ervi
ces
San
itary
sub
trun
k - B
TW T
runk
s an
d Lo
cal s
ervi
ces
3,00
0.00
m40
0
$1
,200
,000
$1,2
00,0
00$1
,200
,000
Tunn
el u
nder
407
for s
anita
ry s
ub-tr
unk
(120
m lo
ng)
2.00
allo
w60
0,00
0
$1
,200
,000
$1,2
00,0
00$1
,200
,000
Con
tribu
tion
to D
owns
tream
San
itary
Pum
p S
tatio
n1.
00
al
low
300,
000
$300
,000
$300
,000
$300
,000
Con
tribu
tion
to D
owns
tream
SW
M p
onds
(Inc
l. La
nd)
allo
wSu
btot
al E
xter
nal s
ub T
runk
/SW
M S
ervi
ces
$2,7
00,0
00$2
,700
,000
$2,7
00,0
00C
ost s
harin
g -
NA
Ass
umed
ther
e no
oth
er s
harin
g pa
rtie
s40
7 O
verp
ass
Util
ities
Tran
sfor
mat
ion
cost
(Ass
umed
to b
e an
end
use
r cos
t)S
treet
ligh
ting
and
cabl
ing
14,7
00.0
0
m30
0
$4
,410
,000
$4,4
10,0
00$2
20,5
00$2
20,5
00$2
20,5
00S
witc
h G
ear
30.0
0
un
its40
,000
$1
,200
,000
$1,2
00,0
00$6
0,00
0$6
0,00
0$6
0,00
0Su
btot
al u
tiliti
es$5
,610
,000
$5,6
10,0
00$2
80,5
00$2
80,5
00$2
80,5
00To
tal H
ard
Cos
t$1
38,4
01,3
05$1
38,4
01,3
05$1
7,40
5,06
5$1
4,70
5,06
5$4
,385
,065
Soft
Cos
tsD
evel
opm
ent c
harg
es (N
on-R
esid
entia
l)C
ity w
ide
1,10
0,00
0.00
m2
Reg
ion
of D
urha
m1,
100,
000.
00
m
2E
duca
tion
(No
non-
resi
dent
ial c
harg
es)
Subt
otal
dev
elop
men
t cha
rges
Prof
essi
onal
fee
Pla
nnin
g - D
raft
plan
s an
d FS
P7.
00
ea
ch15
0,00
0
$1
,050
,000
$1,0
50,0
00$5
2,50
0$5
2,50
0$5
2,50
0E
ngin
eerin
g fe
es (i
nclu
des
pre-
eng
8% s
ervi
cing
)8%
132,
791,
305
$10,
623,
304
$10,
623,
304
$531
,165
$531
,165
$531
,165
Hyd
ro c
onsu
ltant
( al
low
5%
ser
vici
ng if
not
usi
ng V
erid
ian)
5%5,
610,
000
$2
80,5
00$2
80,5
00$1
4,02
5$1
4,02
5$1
4,02
5La
ndsc
ape
arch
itect
(stre
et tr
ees/
SW
M p
onds
)1.
00
al
low
500,
000
$500
,000
$500
,000
$25,
000
$25,
000
$25,
000
Land
sur
veyo
r1.
00
al
low
500,
000
$500
,000
$500
,000
$25,
000
$25,
000
$25,
000
Lega
l1.
00
al
low
500,
000
$500
,000
$500
,000
$25,
000
$25,
000
$25,
000
Arc
heol
ogy
1.00
allo
w10
0,00
0
$1
00,0
00$1
00,0
00$5
,000
$5,0
00$5
,000
Env
ironm
enta
l im
pact
stu
dyTr
affic
& n
oise
repo
rt1.
00
al
low
250,
000
$250
,000
$250
,000
$125
,000
$125
,000
Geo
-tech
and
pha
se 1
ES
A re
port
1.00
allo
w15
0,00
0
$1
50,0
00$1
50,0
00$7
5,00
0$7
5,00
0G
eo-te
ch c
onst
ruct
ion/
insp
ectio
n1.
00
al
low
250,
000
$250
,000
$250
,000
$12,
500
$12,
500
$12,
500
Ove
rhea
d15
%$2
,130
,571
$2,1
30,5
71$1
06,5
29$1
06,5
29$1
06,5
29Su
btot
al p
rofe
ssio
nal f
ee$1
6,33
4,37
5$1
6,33
4,37
5$9
96,7
19$9
96,7
19$7
96,7
19M
unic
ipal
cha
rges
Zoni
ng B
y-La
w a
men
dmen
ts7.
00
ea
ch5,
500
$38,
500
$38,
500
$38,
500
Pic
kerin
g of
ficia
l pla
n am
endm
ents
7.00
each
8,50
0
$5
9,50
0$5
9,50
0$5
9,50
0P
icke
ring
draf
t pla
ns o
f sub
-div
isio
n7.
00
ea
ch15
,420
$1
07,9
40$1
07,9
40$1
07,9
40D
urha
m o
ffici
al p
lan
amen
dmen
ts7.
00
ea
ch60
00$4
2,00
0$4
2,00
0$4
2,00
0M
MA
H z
onin
g or
der a
men
dmen
ts7.
00
ea
ch16
00$1
1,20
0$1
1,20
0$1
1,20
0P
icke
ring
Fill/
top
soil
perm
its1
each
2527
5$2
5,27
5$2
5,27
5$2
5,27
5S
torm
wat
er m
aint
enan
ce fe
e90
0ha
1600
$1,4
40,0
00$1
,440
,000
$72,
000
$72,
000
$72,
000
Par
klan
d de
dica
tion
2%$4
,078
,960
$4,0
78,9
60$2
03,9
48$2
03,9
48$2
03,9
48C
ity d
evel
opm
ent i
nspe
ctio
n fe
es3.
5%$1
32,7
91,3
05$4
,647
,696
$4,6
47,6
96$2
32,3
85$2
32,3
85$2
32,3
85TR
CA
cre
ek c
ross
ing
perm
its6
each
5000
$30,
000
$30,
000
$30,
000
TRC
A s
torm
wat
er m
anag
emen
t pon
d pe
rmits
13ea
ch35
00$4
5,50
0$4
5,50
0$4
5,50
0M
OE
E fe
e (2
% w
ater
san
itary
and
sto
rm)
2%39
3540
02$7
87,0
80$7
87,0
80$3
9,35
4$3
9,35
4$3
9,35
4Su
btot
al m
unic
ipal
cha
rges
$11,
313,
651
$11,
313,
651
$907
,602
$547
,687
$547
,687
Oth
er s
oft c
osts
App
rais
al1
allo
w50
000
$50,
000
$50,
000
$50,
000
Mar
ketin
g co
st @
1500
per
uni
tal
low
$1,0
00,0
00$1
,000
,000
$50,
000
$50,
000
$50,
000
Com
mis
sion
s at
1.5
%1.
50%
$3,0
59,2
20$3
,059
,220
$152
,961
$152
,961
$152
,961
Dev
elop
men
t man
agem
ent f
ee @
4%
4.00
%$5
,536
,052
$5,5
36,0
52$2
76,8
03$2
76,8
03$2
76,8
03Su
btot
al o
ther
sof
t cos
ts$9
,645
,272
$9,6
45,2
72$5
29,7
64$4
79,7
64$4
79,7
64To
tal S
oft C
osts
$37,
293,
298
$37,
293,
298
$2,4
34,0
84$2
,024
,169
$1,8
24,1
69C
ontin
genc
y al
low
ance
(10%
of s
ervi
cing
- mun
. cha
rges
& p
rof.
Fees
)10
%$1
3,91
7,48
3$1
3,91
7,48
3$1
,796
,566
$1,4
90,5
75$4
38,5
75C
ost e
xclu
ding
deb
t car
ryin
g co
st &
incl
usiv
e of
Dev
. Cha
rges
$189
,612
,086
$189
,612
,086
$21,
635,
715
$18,
219,
809
$6,6
47,8
09
Proj
ect c
ost e
xclu
ding
deb
t car
ryin
g co
st (N
omin
al D
olla
rs)
$189
,612
,086
$189
,612
,086
$21,
635,
715
$18,
219,
809
$6,6
47,8
09In
flatio
n ad
just
ed C
ost (
Rea
l Dol
lars
)$2
87,7
28,7
80$2
3,40
1,19
0$2
0,49
4,80
7$7
,776
,996
Add
ition
al fi
nanc
ing
Req
uire
dLo
an O
rigin
atio
n fe
es 1
%C
onst
ruct
ion
Loan
cum
ulat
ive
Inte
rest
@ 6
%D
ebt r
epay
men
tC
umul
ativ
e de
btTo
tal C
ash
Out
$159
,157
,796
$23,
401,
190
$20,
494,
807
$7,7
76,9
96
Cas
h Fl
ow($
23,4
01,1
90)
($9,
923,
376)
$10,
723,
009
Deb
t Rep
aym
ent
$23,
401,
190
$9,9
23,3
76Eq
uity
$10,
723,
009
Equi
ty @
7%$1
43,5
63,0
58
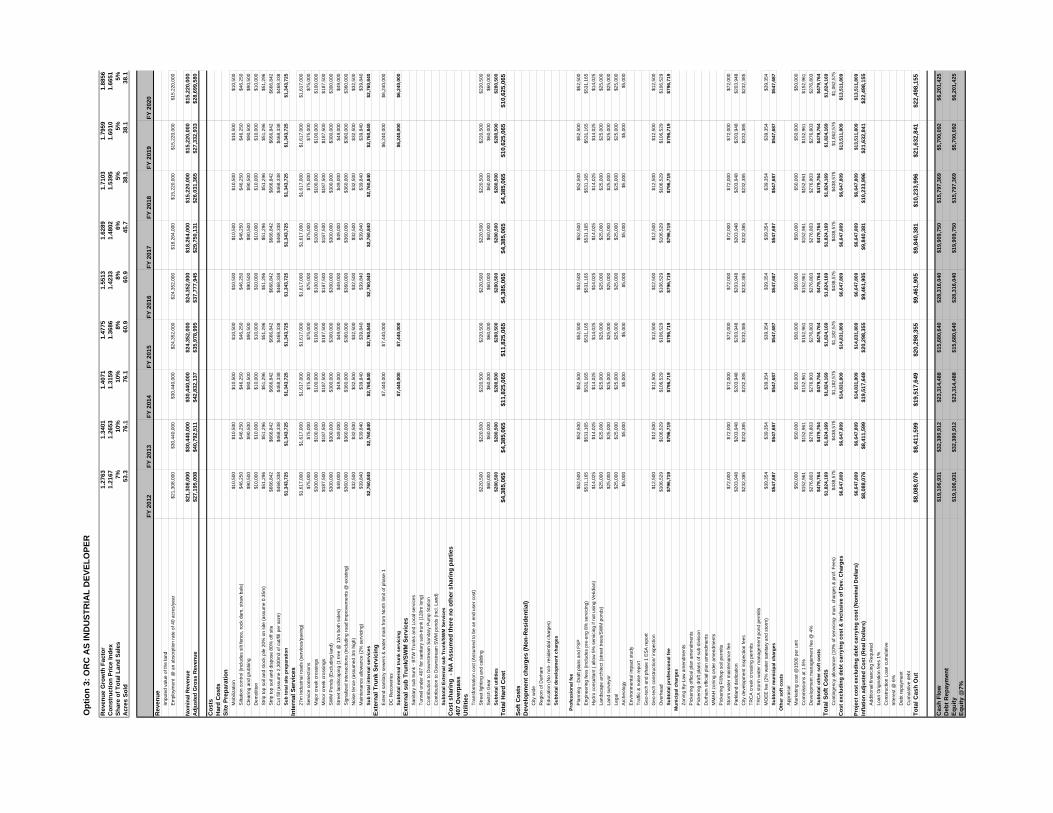
Opt
ion
3: O
RC
AS
IND
UST
RIA
L D
EVEL
OPE
R
Rev
enue
Gro
wth
Fac
tor
Con
stru
ctio
n Pr
ice
Inde
xSh
are
of T
otal
Lan
d Sa
les
Acr
es S
old
Rev
enue
Impu
ted
valu
e of
the
land
Em
ploy
men
t @
an
abso
rptio
n ra
te o
f 40
acre
s/ye
ar
Nom
inal
Rev
enue
Adj
uste
d G
ross
Rev
enue
Cos
tsH
ard
Cos
tsSi
te P
repa
ratio
nM
obili
zatio
nS
iltat
ion
cont
rol (
incl
udes
silt
fenc
e, ro
ck d
am, s
traw
bal
e)C
lear
ing
and
grub
bing
Dem
oliti
onS
trip
top
soil
and
stoc
k pi
le 2
0% o
n si
te (a
ssum
e 0.
35m
)S
trip
top
soil
and
disp
ose
80%
off
site
Cut
fill
(ass
ume
2,30
0m3
of c
ut/fi
ll pe
r acr
e)Su
b to
tal s
ite p
repa
ratio
nIn
tern
al S
ervi
ces
27m
Indu
stria
l roa
ds (s
ervi
ces/
pavi
ng)
Ser
vice
con
nect
ions
Maj
or c
reek
cro
ssin
gsM
inor
cre
ek c
ross
ings
SW
M P
onds
(Exc
ludi
ng la
nd)
Stre
et la
ndsc
apin
g (1
tree
@ 1
2m b
oth
side
s)S
igna
lized
inte
rsec
tions
(inc
ludi
ng ro
ad im
prov
emen
ts @
exi
stin
g)N
oise
fenc
e (a
ssum
ed 3
m h
igh)
Mai
nten
ance
allo
wan
ce (2
% s
ervi
cing
)Su
b to
tal i
nter
nal s
ervi
ces
Exte
rnal
Tru
nk S
ervi
cing
Ext
end
sani
tary
sew
ers
& w
ater
mai
n fro
m N
orth
lim
it of
pha
se 1
DC
Rec
over
ies
Subt
otal
ext
erna
l tru
nk s
ervi
cing
Exte
rnal
sub
Tru
nk/S
WM
Ser
vice
sS
anita
ry s
ub tr
unk
- BTW
Tru
nks
and
Loca
l ser
vice
sTu
nnel
und
er 4
07 fo
r san
itary
sub
-trun
k (1
20m
long
)C
ontri
butio
n to
Dow
nstre
am S
anita
ry P
ump
Sta
tion
Con
tribu
tion
to D
owns
tream
SW
M p
onds
(Inc
l. La
nd)
Subt
otal
Ext
erna
l sub
Tru
nk/S
WM
Ser
vice
sC
ost s
harin
g -
NA
Ass
umed
ther
e no
oth
er s
harin
g pa
rtie
s40
7 O
verp
ass
Util
ities
Tran
sfor
mat
ion
cost
(Ass
umed
to b
e an
end
use
r cos
t)S
treet
ligh
ting
and
cabl
ing
Sw
itch
Gea
rSu
btot
al u
tiliti
esTo
tal H
ard
Cos
t
Soft
Cos
tsD
evel
opm
ent c
harg
es (N
on-R
esid
entia
l)C
ity w
ide
Reg
ion
of D
urha
mE
duca
tion
(No
non-
resi
dent
ial c
harg
es)
Subt
otal
dev
elop
men
t cha
rges
Prof
essi
onal
fee
Pla
nnin
g - D
raft
plan
s an
d FS
PE
ngin
eerin
g fe
es (i
nclu
des
pre-
eng
8% s
ervi
cing
)H
ydro
con
sulta
nt (
allo
w 5
% s
ervi
cing
if n
ot u
sing
Ver
idia
n)La
ndsc
ape
arch
itect
(stre
et tr
ees/
SW
M p
onds
)La
nd s
urve
yor
Lega
lA
rche
olog
yE
nviro
nmen
tal i
mpa
ct s
tudy
Traf
fic &
noi
se re
port
Geo
-tech
and
pha
se 1
ES
A re
port
Geo
-tech
con
stru
ctio
n/ in
spec
tion
Ove
rhea
dSu
btot
al p
rofe
ssio
nal f
eeM
unic
ipal
cha
rges
Zoni
ng B
y-La
w a
men
dmen
tsP
icke
ring
offic
ial p
lan
amen
dmen
tsP
icke
ring
draf
t pla
ns o
f sub
-div
isio
nD
urha
m o
ffici
al p
lan
amen
dmen
tsM
MA
H z
onin
g or
der a
men
dmen
tsP
icke
ring
Fill/
top
soil
perm
itsS
torm
wat
er m
aint
enan
ce fe
eP
arkl
and
dedi
catio
nC
ity d
evel
opm
ent i
nspe
ctio
n fe
esTR
CA
cre
ek c
ross
ing
perm
itsTR
CA
sto
rm w
ater
man
agem
ent p
ond
perm
itsM
OE
E fe
e (2
% w
ater
san
itary
and
sto
rm)
Subt
otal
mun
icip
al c
harg
esO
ther
sof
t cos
tsA
ppra
isal
Mar
ketin
g co
st @
1500
per
uni
tC
omm
issi
ons
at 1
.5%
Dev
elop
men
t man
agem
ent f
ee @
4%
Subt
otal
oth
er s
oft c
osts
Tota
l Sof
t Cos
tsC
ontin
genc
y al
low
ance
(10%
of s
ervi
cing
- mun
. cha
rges
& p
rof.
Fees
)C
ost e
xclu
ding
deb
t car
ryin
g co
st &
incl
usiv
e of
Dev
. Cha
rges
Proj
ect c
ost e
xclu
ding
deb
t car
ryin
g co
st (N
omin
al D
olla
rs)
Infla
tion
adju
sted
Cos
t (R
eal D
olla
rs)
Add
ition
al fi
nanc
ing
Req
uire
dLo
an O
rigin
atio
n fe
es 1
%C
onst
ruct
ion
Loan
cum
ulat
ive
Inte
rest
@ 6
%D
ebt r
epay
men
tC
umul
ativ
e de
btTo
tal C
ash
Out
Cas
h Fl
owD
ebt R
epay
men
tEq
uity
Equi
ty @
7%
1.27
631.
3401
1.40
711.
4775
1.55
131.
6289
1.71
031.
7959
1.88
561.
2167
1.26
531.
3159
1.36
861.
4233
1.48
021.
5395
1.60
101.
6651
7%10
%10
%8%
8%6%
5%5%
5%53
.376
.176
.160
.960
.945
.738
.138
.138
.1
FY 2
012
FY 2
013
FY 2
014
FY 2
015
FY 2
016
FY 2
017
FY 2
018
FY 2
019
FY 2
020
$21,
308,
000
$30,
440,
000
$30,
440,
000
$24,
352,
000
$24,
352,
000
$18,
264,
000
$15,
220,
000
$15,
220,
000
$15,
220,
000
$21,
308,
000
$30,
440,
000
$30,
440,
000
$24,
352,
000
$24,
352,
000
$18,
264,
000
$15,
220,
000
$15,
220,
000
$15,
220,
000
$27,
195,
008
$40,
792,
511
$42,
832,
137
$35,
978,
995
$37,
777,
945
$29,
750,
131
$26,
031,
365
$27,
332,
933
$28,
699,
580
$10,
500
$10,
500
$10,
500
$10,
500
$10,
500
$10,
500
$10,
500
$10,
500
$10,
500
$46,
250
$46,
250
$46,
250
$46,
250
$46,
250
$46,
250
$46,
250
$46,
250
$46,
250
$90,
500
$90,
500
$90,
500
$90,
500
$90,
500
$90,
500
$90,
500
$90,
500
$90,
500
$10,
000
$10,
000
$10,
000
$10,
000
$10,
000
$10,
000
$10,
000
$10,
000
$10,
000
$51,
296
$51,
296
$51,
296
$51,
296
$51,
296
$51,
296
$51,
296
$51,
296
$51,
296
$666
,842
$666
,842
$666
,842
$666
,842
$666
,842
$666
,842
$666
,842
$666
,842
$666
,842
$468
,338
$468
,338
$468
,338
$468
,338
$468
,338
$468
,338
$468
,338
$468
,338
$468
,338
$1,3
43,7
25$1
,343
,725
$1,3
43,7
25$1
,343
,725
$1,3
43,7
25$1
,343
,725
$1,3
43,7
25$1
,343
,725
$1,3
43,7
25
$1,6
17,0
00$1
,617
,000
$1,6
17,0
00$1
,617
,000
$1,6
17,0
00$1
,617
,000
$1,6
17,0
00$1
,617
,000
$1,6
17,0
00$7
5,00
0$7
5,00
0$7
5,00
0$7
5,00
0$7
5,00
0$7
5,00
0$7
5,00
0$7
5,00
0$7
5,00
0$1
00,0
00$1
00,0
00$1
00,0
00$1
00,0
00$1
00,0
00$1
00,0
00$1
00,0
00$1
00,0
00$1
00,0
00$1
87,5
00$1
87,5
00$1
87,5
00$1
87,5
00$1
87,5
00$1
87,5
00$1
87,5
00$1
87,5
00$1
87,5
00$3
00,0
00$3
00,0
00$3
00,0
00$3
00,0
00$3
00,0
00$3
00,0
00$3
00,0
00$3
00,0
00$3
00,0
00$4
9,00
0$4
9,00
0$4
9,00
0$4
9,00
0$4
9,00
0$4
9,00
0$4
9,00
0$4
9,00
0$4
9,00
0$3
60,0
00$3
60,0
00$3
60,0
00$3
60,0
00$3
60,0
00$3
60,0
00$3
60,0
00$3
60,0
00$3
60,0
00$3
2,50
0$3
2,50
0$3
2,50
0$3
2,50
0$3
2,50
0$3
2,50
0$3
2,50
0$3
2,50
0$3
2,50
0$3
9,84
0$3
9,84
0$3
9,84
0$3
9,84
0$3
9,84
0$3
9,84
0$3
9,84
0$3
9,84
0$3
9,84
0$2
,760
,840
$2,7
60,8
40$2
,760
,840
$2,7
60,8
40$2
,760
,840
$2,7
60,8
40$2
,760
,840
$2,7
60,8
40$2
,760
,840
$7,4
40,0
00$7
,440
,000
$6,2
40,0
00$6
,240
,000
$7,4
40,0
00$7
,440
,000
$6,2
40,0
00$6
,240
,000
$220
,500
$220
,500
$220
,500
$220
,500
$220
,500
$220
,500
$220
,500
$220
,500
$220
,500
$60,
000
$60,
000
$60,
000
$60,
000
$60,
000
$60,
000
$60,
000
$60,
000
$60,
000
$280
,500
$280
,500
$280
,500
$280
,500
$280
,500
$280
,500
$280
,500
$280
,500
$280
,500
$4,3
85,0
65$4
,385
,065
$11,
825,
065
$11,
825,
065
$4,3
85,0
65$4
,385
,065
$4,3
85,0
65$1
0,62
5,06
5$1
0,62
5,06
5
$52,
500
$52,
500
$52,
500
$52,
500
$52,
500
$52,
500
$52,
500
$52,
500
$52,
500
$531
,165
$531
,165
$531
,165
$531
,165
$531
,165
$531
,165
$531
,165
$531
,165
$531
,165
$14,
025
$14,
025
$14,
025
$14,
025
$14,
025
$14,
025
$14,
025
$14,
025
$14,
025
$25,
000
$25,
000
$25,
000
$25,
000
$25,
000
$25,
000
$25,
000
$25,
000
$25,
000
$25,
000
$25,
000
$25,
000
$25,
000
$25,
000
$25,
000
$25,
000
$25,
000
$25,
000
$25,
000
$25,
000
$25,
000
$25,
000
$25,
000
$25,
000
$25,
000
$25,
000
$25,
000
$5,0
00$5
,000
$5,0
00$5
,000
$5,0
00$5
,000
$5,0
00$5
,000
$5,0
00
$12,
500
$12,
500
$12,
500
$12,
500
$12,
500
$12,
500
$12,
500
$12,
500
$12,
500
$106
,529
$106
,529
$106
,529
$106
,529
$106
,529
$106
,529
$106
,529
$106
,529
$106
,529
$796
,719
$796
,719
$796
,719
$796
,719
$796
,719
$796
,719
$796
,719
$796
,719
$796
,719
$72,
000
$72,
000
$72,
000
$72,
000
$72,
000
$72,
000
$72,
000
$72,
000
$72,
000
$203
,948
$203
,948
$203
,948
$203
,948
$203
,948
$203
,948
$203
,948
$203
,948
$203
,948
$232
,385
$232
,385
$232
,385
$232
,385
$232
,385
$232
,385
$232
,385
$232
,385
$232
,385
$39,
354
$39,
354
$39,
354
$39,
354
$39,
354
$39,
354
$39,
354
$39,
354
$39,
354
$547
,687
$547
,687
$547
,687
$547
,687
$547
,687
$547
,687
$547
,687
$547
,687
$547
,687
$50,
000
$50,
000
$50,
000
$50,
000
$50,
000
$50,
000
$50,
000
$50,
000
$50,
000
$152
,961
$152
,961
$152
,961
$152
,961
$152
,961
$152
,961
$152
,961
$152
,961
$152
,961
$276
,803
$276
,803
$276
,803
$276
,803
$276
,803
$276
,803
$276
,803
$276
,803
$276
,803
$479
,764
$479
,764
$479
,764
$479
,764
$479
,764
$479
,764
$479
,764
$479
,764
$479
,764
$1,8
24,1
69$1
,824
,169
$1,8
24,1
69$1
,824
,169
$1,8
24,1
69$1
,824
,169
$1,8
24,1
69$1
,824
,169
$1,8
24,1
69$4
38,5
75$4
38,5
75$1
,182
,575
$1,1
82,5
75$4
38,5
75$4
38,5
75$4
38,5
75$1
,062
,575
$1,0
62,5
75$6
,647
,809
$6,6
47,8
09$1
4,83
1,80
9$1
4,83
1,80
9$6
,647
,809
$6,6
47,8
09$6
,647
,809
$13,
511,
809
$13,
511,
809
$6,6
47,8
09$6
,647
,809
$14,
831,
809
$14,
831,
809
$6,6
47,8
09$6
,647
,809
$6,6
47,8
09$1
3,51
1,80
9$1
3,51
1,80
9$8
,088
,076
$8,4
11,5
99$1
9,51
7,64
9$2
0,29
8,35
5$9
,461
,905
$9,8
40,3
81$1
0,23
3,99
6$2
1,63
2,84
1$2
2,49
8,15
5
$8,0
88,0
76$8
,411
,599
$19,
517,
649
$20,
298,
355
$9,4
61,9
05$9
,840
,381
$10,
233,
996
$21,
632,
841
$22,
498,
155
$19,
106,
931
$32,
380,
912
$23,
314,
488
$15,
680,
640
$28,
316,
040
$19,
909,
750
$15,
797,
369
$5,7
00,0
92$6
,201
,425
$19,
106,
931
$32,
380,
912
$23,
314,
488
$15,
680,
640
$28,
316,
040
$19,
909,
750
$15,
797,
369
$5,7
00,0
92$6
,201
,425
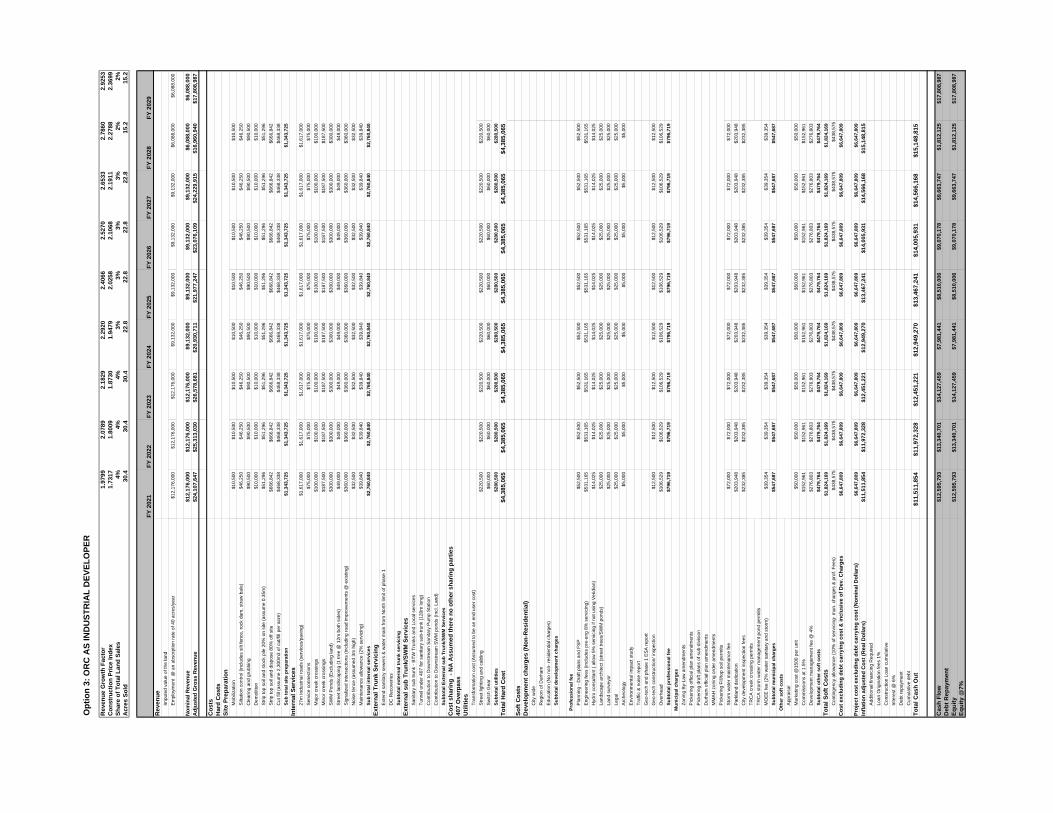
Opt
ion
3: O
RC
AS
IND
UST
RIA
L D
EVEL
OPE
R
Rev
enue
Gro
wth
Fac
tor
Con
stru
ctio
n Pr
ice
Inde
xSh
are
of T
otal
Lan
d Sa
les
Acr
es S
old
Rev
enue
Impu
ted
valu
e of
the
land
Em
ploy
men
t @
an
abso
rptio
n ra
te o
f 40
acre
s/ye
ar
Nom
inal
Rev
enue
Adj
uste
d G
ross
Rev
enue
Cos
tsH
ard
Cos
tsSi
te P
repa
ratio
nM
obili
zatio
nS
iltat
ion
cont
rol (
incl
udes
silt
fenc
e, ro
ck d
am, s
traw
bal
e)C
lear
ing
and
grub
bing
Dem
oliti
onS
trip
top
soil
and
stoc
k pi
le 2
0% o
n si
te (a
ssum
e 0.
35m
)S
trip
top
soil
and
disp
ose
80%
off
site
Cut
fill
(ass
ume
2,30
0m3
of c
ut/fi
ll pe
r acr
e)Su
b to
tal s
ite p
repa
ratio
nIn
tern
al S
ervi
ces
27m
Indu
stria
l roa
ds (s
ervi
ces/
pavi
ng)
Ser
vice
con
nect
ions
Maj
or c
reek
cro
ssin
gsM
inor
cre
ek c
ross
ings
SW
M P
onds
(Exc
ludi
ng la
nd)
Stre
et la
ndsc
apin
g (1
tree
@ 1
2m b
oth
side
s)S
igna
lized
inte
rsec
tions
(inc
ludi
ng ro
ad im
prov
emen
ts @
exi
stin
g)N
oise
fenc
e (a
ssum
ed 3
m h
igh)
Mai
nten
ance
allo
wan
ce (2
% s
ervi
cing
)Su
b to
tal i
nter
nal s
ervi
ces
Exte
rnal
Tru
nk S
ervi
cing
Ext
end
sani
tary
sew
ers
& w
ater
mai
n fro
m N
orth
lim
it of
pha
se 1
DC
Rec
over
ies
Subt
otal
ext
erna
l tru
nk s
ervi
cing
Exte
rnal
sub
Tru
nk/S
WM
Ser
vice
sS
anita
ry s
ub tr
unk
- BTW
Tru
nks
and
Loca
l ser
vice
sTu
nnel
und
er 4
07 fo
r san
itary
sub
-trun
k (1
20m
long
)C
ontri
butio
n to
Dow
nstre
am S
anita
ry P
ump
Sta
tion
Con
tribu
tion
to D
owns
tream
SW
M p
onds
(Inc
l. La
nd)
Subt
otal
Ext
erna
l sub
Tru
nk/S
WM
Ser
vice
sC
ost s
harin
g -
NA
Ass
umed
ther
e no
oth
er s
harin
g pa
rtie
s40
7 O
verp
ass
Util
ities
Tran
sfor
mat
ion
cost
(Ass
umed
to b
e an
end
use
r cos
t)S
treet
ligh
ting
and
cabl
ing
Sw
itch
Gea
rSu
btot
al u
tiliti
esTo
tal H
ard
Cos
t
Soft
Cos
tsD
evel
opm
ent c
harg
es (N
on-R
esid
entia
l)C
ity w
ide
Reg
ion
of D
urha
mE
duca
tion
(No
non-
resi
dent
ial c
harg
es)
Subt
otal
dev
elop
men
t cha
rges
Prof
essi
onal
fee
Pla
nnin
g - D
raft
plan
s an
d FS
PE
ngin
eerin
g fe
es (i
nclu
des
pre-
eng
8% s
ervi
cing
)H
ydro
con
sulta
nt (
allo
w 5
% s
ervi
cing
if n
ot u
sing
Ver
idia
n)La
ndsc
ape
arch
itect
(stre
et tr
ees/
SW
M p
onds
)La
nd s
urve
yor
Lega
lA
rche
olog
yE
nviro
nmen
tal i
mpa
ct s
tudy
Traf
fic &
noi
se re
port
Geo
-tech
and
pha
se 1
ES
A re
port
Geo
-tech
con
stru
ctio
n/ in
spec
tion
Ove
rhea
dSu
btot
al p
rofe
ssio
nal f
eeM
unic
ipal
cha
rges
Zoni
ng B
y-La
w a
men
dmen
tsP
icke
ring
offic
ial p
lan
amen
dmen
tsP
icke
ring
draf
t pla
ns o
f sub
-div
isio
nD
urha
m o
ffici
al p
lan
amen
dmen
tsM
MA
H z
onin
g or
der a
men
dmen
tsP
icke
ring
Fill/
top
soil
perm
itsS
torm
wat
er m
aint
enan
ce fe
eP
arkl
and
dedi
catio
nC
ity d
evel
opm
ent i
nspe
ctio
n fe
esTR
CA
cre
ek c
ross
ing
perm
itsTR
CA
sto
rm w
ater
man
agem
ent p
ond
perm
itsM
OE
E fe
e (2
% w
ater
san
itary
and
sto
rm)
Subt
otal
mun
icip
al c
harg
esO
ther
sof
t cos
tsA
ppra
isal
Mar
ketin
g co
st @
1500
per
uni
tC
omm
issi
ons
at 1
.5%
Dev
elop
men
t man
agem
ent f
ee @
4%
Subt
otal
oth
er s
oft c
osts
Tota
l Sof
t Cos
tsC
ontin
genc
y al
low
ance
(10%
of s
ervi
cing
- mun
. cha
rges
& p
rof.
Fees
)C
ost e
xclu
ding
deb
t car
ryin
g co
st &
incl
usiv
e of
Dev
. Cha
rges
Proj
ect c
ost e
xclu
ding
deb
t car
ryin
g co
st (N
omin
al D
olla
rs)
Infla
tion
adju
sted
Cos
t (R
eal D
olla
rs)
Add
ition
al fi
nanc
ing
Req
uire
dLo
an O
rigin
atio
n fe
es 1
%C
onst
ruct
ion
Loan
cum
ulat
ive
Inte
rest
@ 6
%D
ebt r
epay
men
tC
umul
ativ
e de
btTo
tal C
ash
Out
Cas
h Fl
owD
ebt R
epay
men
tEq
uity
Equi
ty @
7%
1.97
992.
0789
2.18
292.
2920
2.40
662.
5270
2.65
332.
7860
2.92
531.
7317
1.80
091.
8730
1.94
792.
0258
2.10
682.
1911
2.27
882.
3699
4%4%
4%3%
3%3%
3%2%
2%30
.430
.430
.422
.822
.822
.822
.815
.215
.2
FY 2
021
FY 2
022
FY 2
023
FY 2
024
FY 2
025
FY 2
026
FY 2
027
FY 2
028
FY 2
029
$12,
176,
000
$12,
176,
000
$12,
176,
000
$9,1
32,0
00$9
,132
,000
$9,1
32,0
00$9
,132
,000
$6,0
88,0
00$6
,088
,000
$12,
176,
000
$12,
176,
000
$12,
176,
000
$9,1
32,0
00$9
,132
,000
$9,1
32,0
00$9
,132
,000
$6,0
88,0
00$6
,088
,000
$24,
107,
647
$25,
313,
030
$26,
578,
681
$20,
930,
711
$21,
977,
247
$23,
076,
109
$24,
229,
915
$16,
960,
940
$17,
808,
987
$10,
500
$10,
500
$10,
500
$10,
500
$10,
500
$10,
500
$10,
500
$10,
500
$46,
250
$46,
250
$46,
250
$46,
250
$46,
250
$46,
250
$46,
250
$46,
250
$90,
500
$90,
500
$90,
500
$90,
500
$90,
500
$90,
500
$90,
500
$90,
500
$10,
000
$10,
000
$10,
000
$10,
000
$10,
000
$10,
000
$10,
000
$10,
000
$51,
296
$51,
296
$51,
296
$51,
296
$51,
296
$51,
296
$51,
296
$51,
296
$666
,842
$666
,842
$666
,842
$666
,842
$666
,842
$666
,842
$666
,842
$666
,842
$468
,338
$468
,338
$468
,338
$468
,338
$468
,338
$468
,338
$468
,338
$468
,338
$1,3
43,7
25$1
,343
,725
$1,3
43,7
25$1
,343
,725
$1,3
43,7
25$1
,343
,725
$1,3
43,7
25$1
,343
,725
$1,6
17,0
00$1
,617
,000
$1,6
17,0
00$1
,617
,000
$1,6
17,0
00$1
,617
,000
$1,6
17,0
00$1
,617
,000
$75,
000
$75,
000
$75,
000
$75,
000
$75,
000
$75,
000
$75,
000
$75,
000
$100
,000
$100
,000
$100
,000
$100
,000
$100
,000
$100
,000
$100
,000
$100
,000
$187
,500
$187
,500
$187
,500
$187
,500
$187
,500
$187
,500
$187
,500
$187
,500
$300
,000
$300
,000
$300
,000
$300
,000
$300
,000
$300
,000
$300
,000
$300
,000
$49,
000
$49,
000
$49,
000
$49,
000
$49,
000
$49,
000
$49,
000
$49,
000
$360
,000
$360
,000
$360
,000
$360
,000
$360
,000
$360
,000
$360
,000
$360
,000
$32,
500
$32,
500
$32,
500
$32,
500
$32,
500
$32,
500
$32,
500
$32,
500
$39,
840
$39,
840
$39,
840
$39,
840
$39,
840
$39,
840
$39,
840
$39,
840
$2,7
60,8
40$2
,760
,840
$2,7
60,8
40$2
,760
,840
$2,7
60,8
40$2
,760
,840
$2,7
60,8
40$2
,760
,840
$220
,500
$220
,500
$220
,500
$220
,500
$220
,500
$220
,500
$220
,500
$220
,500
$60,
000
$60,
000
$60,
000
$60,
000
$60,
000
$60,
000
$60,
000
$60,
000
$280
,500
$280
,500
$280
,500
$280
,500
$280
,500
$280
,500
$280
,500
$280
,500
$4,3
85,0
65$4
,385
,065
$4,3
85,0
65$4
,385
,065
$4,3
85,0
65$4
,385
,065
$4,3
85,0
65$4
,385
,065
$52,
500
$52,
500
$52,
500
$52,
500
$52,
500
$52,
500
$52,
500
$52,
500
$531
,165
$531
,165
$531
,165
$531
,165
$531
,165
$531
,165
$531
,165
$531
,165
$14,
025
$14,
025
$14,
025
$14,
025
$14,
025
$14,
025
$14,
025
$14,
025
$25,
000
$25,
000
$25,
000
$25,
000
$25,
000
$25,
000
$25,
000
$25,
000
$25,
000
$25,
000
$25,
000
$25,
000
$25,
000
$25,
000
$25,
000
$25,
000
$25,
000
$25,
000
$25,
000
$25,
000
$25,
000
$25,
000
$25,
000
$25,
000
$5,0
00$5
,000
$5,0
00$5
,000
$5,0
00$5
,000
$5,0
00$5
,000
$12,
500
$12,
500
$12,
500
$12,
500
$12,
500
$12,
500
$12,
500
$12,
500
$106
,529
$106
,529
$106
,529
$106
,529
$106
,529
$106
,529
$106
,529
$106
,529
$796
,719
$796
,719
$796
,719
$796
,719
$796
,719
$796
,719
$796
,719
$796
,719
$72,
000
$72,
000
$72,
000
$72,
000
$72,
000
$72,
000
$72,
000
$72,
000
$203
,948
$203
,948
$203
,948
$203
,948
$203
,948
$203
,948
$203
,948
$203
,948
$232
,385
$232
,385
$232
,385
$232
,385
$232
,385
$232
,385
$232
,385
$232
,385
$39,
354
$39,
354
$39,
354
$39,
354
$39,
354
$39,
354
$39,
354
$39,
354
$547
,687
$547
,687
$547
,687
$547
,687
$547
,687
$547
,687
$547
,687
$547
,687
$50,
000
$50,
000
$50,
000
$50,
000
$50,
000
$50,
000
$50,
000
$50,
000
$152
,961
$152
,961
$152
,961
$152
,961
$152
,961
$152
,961
$152
,961
$152
,961
$276
,803
$276
,803
$276
,803
$276
,803
$276
,803
$276
,803
$276
,803
$276
,803
$479
,764
$479
,764
$479
,764
$479
,764
$479
,764
$479
,764
$479
,764
$479
,764
$1,8
24,1
69$1
,824
,169
$1,8
24,1
69$1
,824
,169
$1,8
24,1
69$1
,824
,169
$1,8
24,1
69$1
,824
,169
$438
,575
$438
,575
$438
,575
$438
,575
$438
,575
$438
,575
$438
,575
$438
,575
$6,6
47,8
09$6
,647
,809
$6,6
47,8
09$6
,647
,809
$6,6
47,8
09$6
,647
,809
$6,6
47,8
09$6
,647
,809
$6,6
47,8
09$6
,647
,809
$6,6
47,8
09$6
,647
,809
$6,6
47,8
09$6
,647
,809
$6,6
47,8
09$6
,647
,809
$11,
511,
854
$11,
972,
328
$12,
451,
221
$12,
949,
270
$13,
467,
241
$14,
005,
931
$14,
566,
168
$15,
148,
815
$11,
511,
854
$11,
972,
328
$12,
451,
221
$12,
949,
270
$13,
467,
241
$14,
005,
931
$14,
566,
168
$15,
148,
815
$12,
595,
793
$13,
340,
701
$14,
127,
459
$7,9
81,4
41$8
,510
,006
$9,0
70,1
78$9
,663
,747
$1,8
12,1
25$1
7,80
8,98
7
$12,
595,
793
$13,
340,
701
$14,
127,
459
$7,9
81,4
41$8
,510
,006
$9,0
70,1
78$9
,663
,747
$1,8
12,1
25$1
7,80
8,98
7


