

HIS MAJESTY SULTAN QABOOS BIN SAID

HIS MAJESTY SULTAN QABOOS BIN SAID

CONTENTSCHAIRMANS MESSAGESenior Management TeamManagement TeamThe Board of DirectorsCorporate Governance
PROFILE & DISCUSSIONAbout usVision, Missions & Objectives Corporate InformationOur Industry
FINANCIAL & OPERATIONAL HIGHLIGHTS OF 2014Financial HighlightsFinancial & Operational Performance
INDUSTRY ANALYSISHuman ResourcesStaff CategoryCustomer ScenarioCustomer Distribution
POWER GENERATIONPower sent out from RAECO Power StationsRegional Energy Generation in 2014Peak DemandElectricity Generation CostsFuel Efficiency Fuel Consumption kWh/L by StationComparison between Energy Supplied from RAECOs Power Station & Energy Purchased from PDOSystem losses
WATER DESALINATIONGrowth in Desalination Business Desalination Operational Cost
ISO Certificate 9001:2008
OTHER BUISNESSRenewable Energy ProjectsProposed Strategy for Customer Services (Blueprint)GIS in RAECBilling SystemBOD visit to Al Wusta GovernoredProjects overview
PRICE CONTROL & SUBSIDIES
FINANCIAL STATEMENT
69101113
141414 1416
171819
2122232525
28282829293031
3232
333334
34
35353636363737
38
44
LIST of TABLESTable (1): 2013 Board of Directors Meetings ScheduleTable (2): 2014 Board of Directors Meetings ScheduleTable (3): Key Highlights of 2014Table (4): Summary of Key Financial Statement Significant ItemsTable (5): No. Omanis & Non-Omanis StaffTable (6): Creative Ideas in 2014Table (7): Customer Category and ConsumptionTable (8): Customer Distribution by Area and CategoryTable (9): Customers GrowthTable (10): Growth in Power SupplyTable (11): Growth in Regional Power GenerationTable (12): Electricity Generation Direct Cost by Region in 2014Table (13): Desalination YoY (‘13-’14 Growth) of sent m3Table (14): Desalination Operational Costs by plant (RO)Table (15): Current Pilot Project in Rural AreaTable (16): Future Projects in Renewable EnergyTable (17): List of 10 largest projects under execution in 2014Table (18): Price control and Subsidies (2013-2014)Table (19-A): Maximum Allowed Revenue 2015 (RO 000)Table (19-B): Subsidy Requirements 2015 (RO)Table (20): Details about the Subsidy and Economic Cost per kWhTable (21): 2014 Operational Data Summary – DhofarTable (22): 2014 Operational Data Summary – Al-WustaTable (23): 2014 Operational Data Summary – MusandamTable (24): 2014 Operational Data Summary for Desalination plants
LIST of FIGURESFigure (1): Financial and Operational Performance 2014Figure (2): Omanization in each FunctionFigure (3): Functional Staff DistributionFigure (4): Regional Staff DistributionFigure (5): Average Consumption per Customer (MWh) - Al WustaFigure (6): Average Consumption per Customer (MWh) – DhofarFigure (7): Average Consumption per Customer (MWh) – MusandamFigures (8): Overall Average Consumption (MWh)Figure (9): Power sent out from RAECO Power StationsFigure (10): Regional Power Generation 2014Figure (11): Khasab System Peak Demand MW (2013-2014)Figure (12): Percentage of Electricity Generation Cost By Region in 2014Figure (13): Fuel Efficiency (kWh/Ltr) (2013-2014)Figure (14): Electricity Production (kWh) per litre fuel –MusandamFigure (15): Electricity Production (kWh) litre fuel -Al WustaFigure (16): Electricity Production (kWh) per litre fuel –DhofarFigure (17): Energy Produced By RAECO and Energy Purchased from PDOFigure (18): Technical & Non-Technical LossesFigure (19): Water Desalination % by Plant – 2014Figure (20): 2015 Economic Costs of Electricity Supply
12131820222425252727292933343535373939394041424343
1922232326262626282829303031313132323340
Dear Shareholders,
I am pleased to present our Annual Report for the Rural Areas Electricity Company SAOC for the year ending 31st
December 2014.
It is my pleasure to announce that the company has achieved most of the targeted KPI’s in 2014. This success is attributed to the continuous development of the company’s operations, improvement of operational performance, human resources development and commitment to using the latest techniques and technology in the company’s programs.
The company is proud to be the first in the Sultanate of Oman that signed an agreement to produce power using wind energy, which will be constructed in Harweel in Dhofar region with production capacity of 50 MW to be connected to the Oman electricity transmission grid. This is the first of its kind in the Sultanate of Oman and in the Arabian Gulf region. The project is expected to contribute to the financial savings in the field of electricity production .
The company has provided all relevant information for the price control on time to the Authority for Electricity Regulation and has adopted the price control for the period (2015-2017). The new price control mechanism determines the maximum allowed revenue entitled to the company. It also determines the amount of operating and capital allocations to the company for the next three years, as well as the efficiency indicators that the company must achieve.
The Rural Areas Electricity Company has successfully passed the renewal of quality management certification stage ISO 9001: 2008. This certificate will be valid for the next three years. The new certificate included all the activities of the Rural Areas Electricity Company, while the previous certification did not include the activity of water desalination.
The company has developed an occupational safety system through the application of the INTELEX software application in collecting all the information and analysis of the sites which has a significant impact on the safety of its operations.
The key highlights of our operational performance during the year are summarized below:
Total customers increased by 9.3 % from 28,287 in 2013 to 30,904 in 2014.
The company achieved a profit before tax of more than RO 3.7 Million.
RAECO has achieved 94% Omanization by employing 430 Omanis out of 456 permanent employees as on 31 December 2014.
Fuel efficiency level increased to 3.57 kWh/L in 2014 compared with 3.54 kWh/L in 2013.
CHAIRMAN’S MESSAGE
6

Rural power generation had increased from 685,004 MWh in 2013 to 756,712 MWh in 2014 reflecting an increase by more than 10% in total power generation.
Water Desalination output increased by 5 %, from 2,291,143 m3 in 2013 to 2,397,487 m3 in 2014. This increase is attributed to the increase in demand for water from Al Duqm new desalination plant and the installation of new desalination units in other plants.
Subsidy allocated to the company in 2014 reached R.O. 43.558 million.
The Interlinking Program is progressing as planned, which involves closing down small power stations and feeding the systems from the nearest more efficient stations. For example, the link between the two regions Al-Ajaiz and Ras Madraka in Duqm electricity system.
Improved compliance to regulations and license conditions and continuous cooperation with the Authority for Electricity Regulation (AER), Electricity Holding Company (EHC) and other relevant stakeholders of the company.
I would take this opportunity to express our heartfelt gratitude and appreciation to His Majesty Sultan Qaboos Bin Said for his continuous support and guidance through which the company was able to achieve recognized success and development.
I also thank all our stakeholders, board members, our suppliers, our customers, other sector companies and regulatory bodies for their support. The Board of Directors highly appreciates the efforts of the management team and employees who have led improved performance and recognized success.
Mr. Faisal Khamis Al Hashar Chairman
7
Board of Directors
Mr. Faisal Khamis Al HasharChairman
Mr. Osama Ahmed YunusDeputy Chairman
Mr. Suliman Al-AdiMember
Mr. Salim AhmedMember
Eng. Saleh Al-RashdiMember
BOARD OF DIRECTORS
Ahmed Said Saloum Al HarthyChief Supply Of�cer – Acting
Eng. Abdullah Ahmed Mohammed Al ShehiChief Engineer
Salim Abdullah Salim Al HumaidiAdministrative Services Senior Manager
Eng. Shouqi Noor Mohammed Al BalushiSenior Manager Technical Services
Eng. Mohammed Abdulkader Al GhasaniChief Operating Of�cer
Rashid Mohammed Marhoun Al AzriCustomer Affairs Senior Manager
Saud Hilal Saud Al GhafriFinancial Controller
Eng. Hamed Salim Hamed Al-MaghderiChief Executive Of�cer
SENIOR MANAGEMENT TEAM
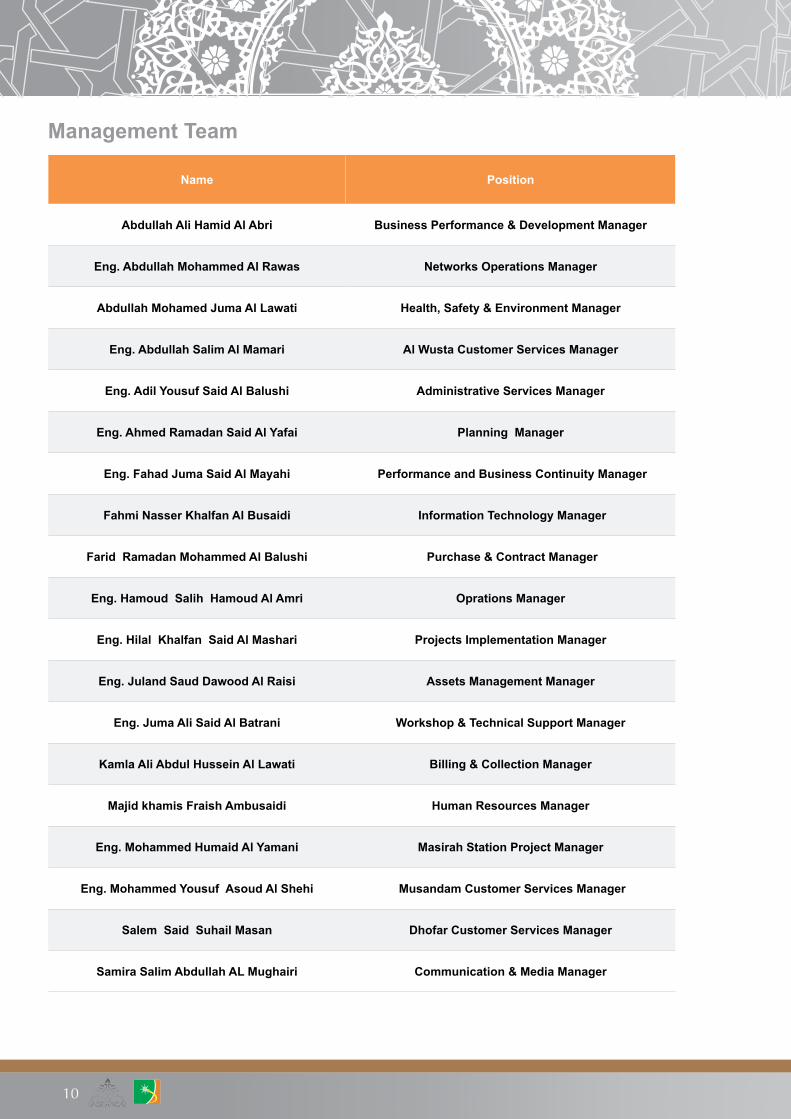
Management Team
Name Position
Abdullah Ali Hamid Al Abri Business Performance & Development Manager
Eng. Abdullah Mohammed Al Rawas Networks Operations Manager
Abdullah Mohamed Juma Al Lawati Health, Safety & Environment Manager
Eng. Abdullah Salim Al Mamari Al Wusta Customer Services Manager
Eng. Adil Yousuf Said Al Balushi Administrative Services Manager
Eng. Ahmed Ramadan Said Al Yafai Planning Manager
Eng. Fahad Juma Said Al Mayahi Performance and Business Continuity Manager
Fahmi Nasser Khalfan Al Busaidi Information Technology Manager
Farid Ramadan Mohammed Al Balushi Purchase & Contract Manager
Eng. Hamoud Salih Hamoud Al Amri Oprations Manager
Eng. Hilal Khalfan Said Al Mashari Projects Implementation Manager
Eng. Juland Saud Dawood Al Raisi Assets Management Manager
Eng. Juma Ali Said Al Batrani Workshop & Technical Support Manager
Kamla Ali Abdul Hussein Al Lawati Billing & Collection Manager
Majid khamis Fraish Ambusaidi Human Resources Manager
Eng. Mohammed Humaid Al Yamani Masirah Station Project Manager
Eng. Mohammed Yousuf Asoud Al Shehi Musandam Customer Services Manager
Salem Said Suhail Masan Dhofar Customer Services Manager
Samira Salim Abdullah AL Mughairi Communication & Media Manager
10

The Board of DirectorsThe Board of Directors is accountable to the shareholders for the governance of the company. All Directors are accountable for the proper stewardship of the company’s affairs and share a responsibility in ensuring the highest standards of disclosure and reporting, ethics and integrity across the group.
Powers specifically reserved for the board include:
Providing direction and guidance to the company in the formulation of its strategies and in the pursuance of its operational and financial goals
Monitoring systems of governance and compliance
Overseeing systems of internal control and risk management
Approving major acquisitions and disposals and capital expenditure
Reviewing HR processes with emphasis on top management succession planning, approving annual budgets and strategic plans
Sub Committees of the BoardThe Board is responsible for the establishment and functioning of all Sub Committees, the appointment of members to these committees and their compensation. The Board has delegated responsibilities to four board sub committees namely, Tender Committee, Internal Audit Committee, Human Resources Committee and Capital Investment Committee, which operate within clearly defined terms of reference.
Tender Committee (TC)The Tender Committee is composed of two directors from the board and three internal members from the management team which are the Chief Executive Officer, Financial Controller and Senior Manager Technical Affairs.The functional heads attend meetings by invitation. The main function of the Tender Committee is obtaining the most favorable terms for acquisition of goods and services required for the main activities of the company on the principles of competitiveness, transparency and team decision making.
Internal Audit Committee (IAC)The Audit Committee comprises of three board directors and from the management team, the Chief Executive Officer, the Financial Controller and the Internal Audit head section. The functional heads attend meetings by invitation. IAC covers the principles governing financial reporting, internal control and the management of risks, both financial and operational.
Human Resource Committee (HRC)The Human Resource Committee comprises of two board directors and from the management team the Chief Executive Officer and the Human Resources Manager. The functional heads attend meetings by invitation. HRC shall ensure on behalf of the board that the HR policies are implemented by the company and ensure that all matters related to employees are conducted in a fair and transparent manner. The committee also reviews and approves the corporate KPIs.
Commercial Investment Committee (CIC)CIC is a committee of mix of members of the BOD and the management considering its nature of decision making. Senior Managers and Managers directly reporting to CEO, except who are members of the committee, may be invited to the meeting but without having voting rights in decisions. Project Managers/owners responsible for the proposed projects may be requested to present proposals and also secretary should present the quarterly Project Update reports, consolidating the reports from respective managers. The Committee is authorized by the Board of Directors to take decisions on capital investments related to following categories:
11
Generation capacity requirement that exceed 10MW
Desalination capacity requirement exceed 5000M3/day
Renewable energy investment
132KV and 33KV networks Investments;
Customer extensions and 11 KV LT load related/non load related investments of OMR 1 Million and above
Any other Capital Investment Project, other than the points mentioned above, of investments of OMR 1 Million and above.
Agree on procurement strategy for each Pre-investment Appraisal document (PIAD) that falls under scope of CIC
ComplianceThe Board places significant emphasis on strong internal compliance procedures. The financial statements of the Group are prepared in strict compliance with the guidelines of the International Accounting Standards, compliance to Sector Law provision, License and Conditions Issued by the Authority for Electricity and other statutory regulations. The Board of Directors, to the best of their knowledge and belief, are satisfied that all statutory payments have been made to date.
Corporate responsibilityThe Company recognizes that it exists not only to maximize long term shareholder value but also to look after the rights and appropriate claims of many non-shareholder groups such as employees, consumers, clients, suppliers, lenders, environmentalists, host communities and governments. We recognize that they have a stake in the outcome of the company’s actions and, accordingly, we will accord to them an increasing status when making corporate decisions. More importantly, we are becoming more aware of the impact of our business decisions on these stakeholder groups, the environment and broader communities
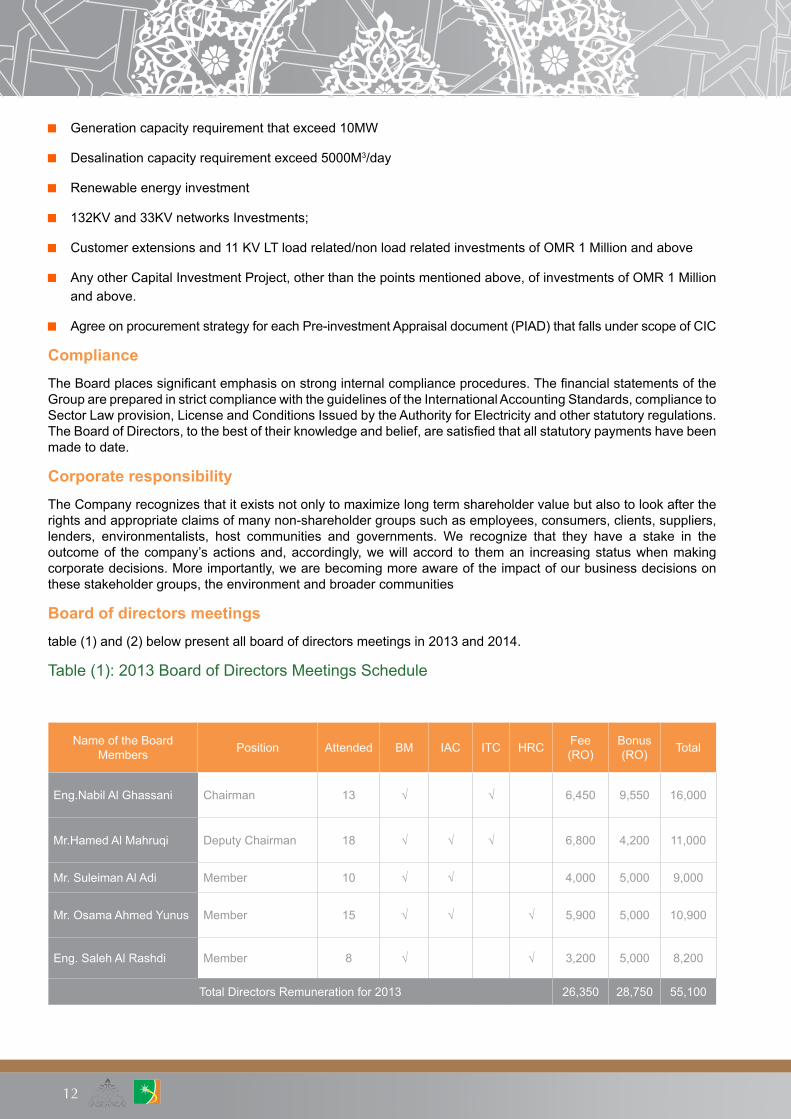
Board of directors meetingstable (1) and (2) below present all board of directors meetings in 2013 and 2014.
Table (1): 2013 Board of Directors Meetings Schedule
Name of the BoardMembers Position Attended BM IAC ITC HRC Fee
(RO)Bonus (RO) Total
Eng.Nabil Al Ghassani Chairman 13 √ √ 6,450 9,550 16,000
Mr.Hamed Al Mahruqi Deputy Chairman 18 √ √ √ 6,800 4,200 11,000
Mr. Suleiman Al Adi Member 10 √ √ 4,000 5,000 9,000
Mr. Osama Ahmed Yunus Member 15 √ √ √ 5,900 5,000 10,900
Eng. Saleh Al Rashdi Member 8 √ √ 3,200 5,000 8,200
Total Directors Remuneration for 2013 26,350 28,750 55,100
12
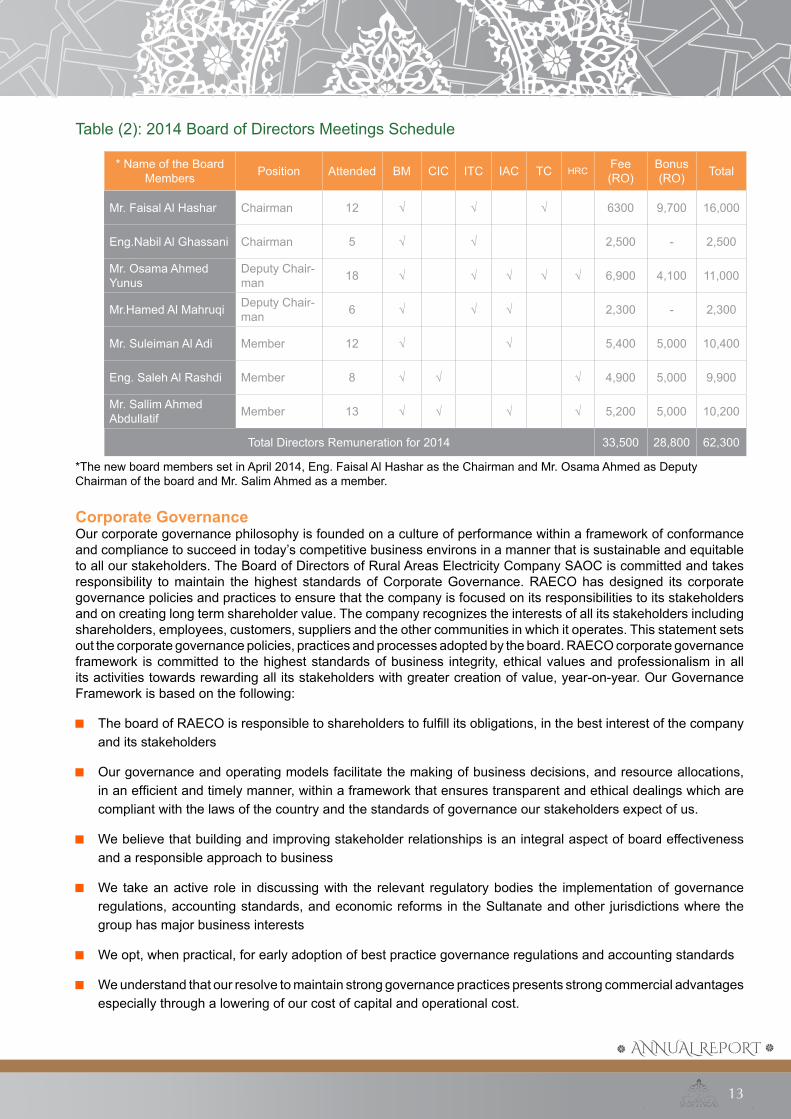
Table (2): 2014 Board of Directors Meetings Schedule
* Name of the Board Members Position Attended BM CIC ITC IAC TC HRC
Fee (RO)
Bonus (RO) Total
Mr. Faisal Al Hashar Chairman 12 √ √ √ 6300 9,700 16,000
Eng.Nabil Al Ghassani Chairman 5 √ √ 2,500 - 2,500
Mr. Osama Ahmed Yunus
Deputy Chair-man 18 √ √ √ √ √ 6,900 4,100 11,000
Mr.Hamed Al Mahruqi Deputy Chair-man 6 √ √ √ 2,300 - 2,300
Mr. Suleiman Al Adi Member 12 √ √ 5,400 5,000 10,400
Eng. Saleh Al Rashdi Member 8 √ √ √ 4,900 5,000 9,900
Mr. Sallim Ahmed Abdullatif Member 13 √ √ √ √ 5,200 5,000 10,200
Total Directors Remuneration for 2014 33,500 28,800 62,300
*The new board members set in April 2014, Eng. Faisal Al Hashar as the Chairman and Mr. Osama Ahmed as Deputy Chairman of the board and Mr. Salim Ahmed as a member.
Corporate GovernanceOur corporate governance philosophy is founded on a culture of performance within a framework of conformance and compliance to succeed in today’s competitive business environs in a manner that is sustainable and equitable to all our stakeholders. The Board of Directors of Rural Areas Electricity Company SAOC is committed and takes responsibility to maintain the highest standards of Corporate Governance. RAECO has designed its corporate governance policies and practices to ensure that the company is focused on its responsibilities to its stakeholders and on creating long term shareholder value. The company recognizes the interests of all its stakeholders including shareholders, employees, customers, suppliers and the other communities in which it operates. This statement sets out the corporate governance policies, practices and processes adopted by the board. RAECO corporate governance framework is committed to the highest standards of business integrity, ethical values and professionalism in all its activities towards rewarding all its stakeholders with greater creation of value, year-on-year. Our Governance Framework is based on the following:
The board of RAECO is responsible to shareholders to fulfill its obligations, in the best interest of the company and its stakeholders
Our governance and operating models facilitate the making of business decisions, and resource allocations, in an efficient and timely manner, within a framework that ensures transparent and ethical dealings which are compliant with the laws of the country and the standards of governance our stakeholders expect of us.
We believe that building and improving stakeholder relationships is an integral aspect of board effectiveness and a responsible approach to business
We take an active role in discussing with the relevant regulatory bodies the implementation of governance regulations, accounting standards, and economic reforms in the Sultanate and other jurisdictions where the group has major business interests
We opt, when practical, for early adoption of best practice governance regulations and accounting standards
We understand that our resolve to maintain strong governance practices presents strong commercial advantages especially through a lowering of our cost of capital and operational cost.
13

Vision
Mission
Objectives- Significantly improve cash flow management throughout the company- Become a more ‘customer focused ’ organization- Provide Omani nationals with a challenging work environment- Significantly improve operational efficiencies and operate the system in a safe and environmentally responsible manner.
- To supply reliable electricity & where deemed appropriate, potable water, to customers at the Lowest per unit delivery cost.
- To provide Omani nationals with challenging and rewarding employment opportunities.- To operate its generation facilities, production
plants & distribution networks in a safe and environmentally responsible manner.
“To provide cost effective electricity to all premises in rural areas in the Sultanate of Oman”
PROFILE AND DISCUSSIONAbout UsRural Areas Electricity Company SAOC (RAECO) is a closed Omani Joint Stock Company incorporated under the Commercial Companies Law No. 4/74 of Oman. The company commenced its operations on 1st May 2005 (the “Transfer Date”) following the implementation of (the “Transfer Scheme”) issued pursuant to the Law for the Regulation and Privatization of the Electricity and Related Water Sector (the “Sector Law”) promulgated by Royal Decree 78/2004. RAECO is a wholly owned subsidiary of the Electricity Holding Company SAOC which holds 99.99% of the shares and the remaining 0.01% shares are held by the Ministry of Finance. In turn EHC is 100% owned by the government of the Sultanate of Oman. RAECO is primarily undertaking electricity generation, water desalination and electricity distribution activities in its authorized areas, in accordance with the license granted to it by the Authority for Electricity Regulation, Oman. RAECO’s license covers its authorized areas which extend from Musandam in the north of Oman, through the Interior, and to the South of Oman but excluding the concession areas of the Dhofar Power Company SAOG, the authorized areas of Muscat Electricity Distribution Company SAOC, Mazoon Electricity Company SAOC and Majan Electricity Company SAOC.
CORPORATE INFORMATION • Name of the Company: Rural Areas Electricity Company SAOC
• Legal Form: Closed Omani Joint Stock Company incorporated under the Commercial Companies Law No.4/74 of Oman.
14

Rural Campaign for the 5th Year to Rationalize the Consumption of Electricity and Safety 2014
Dhofar
Musandam
Al Wusta
RAEC Campaign
15
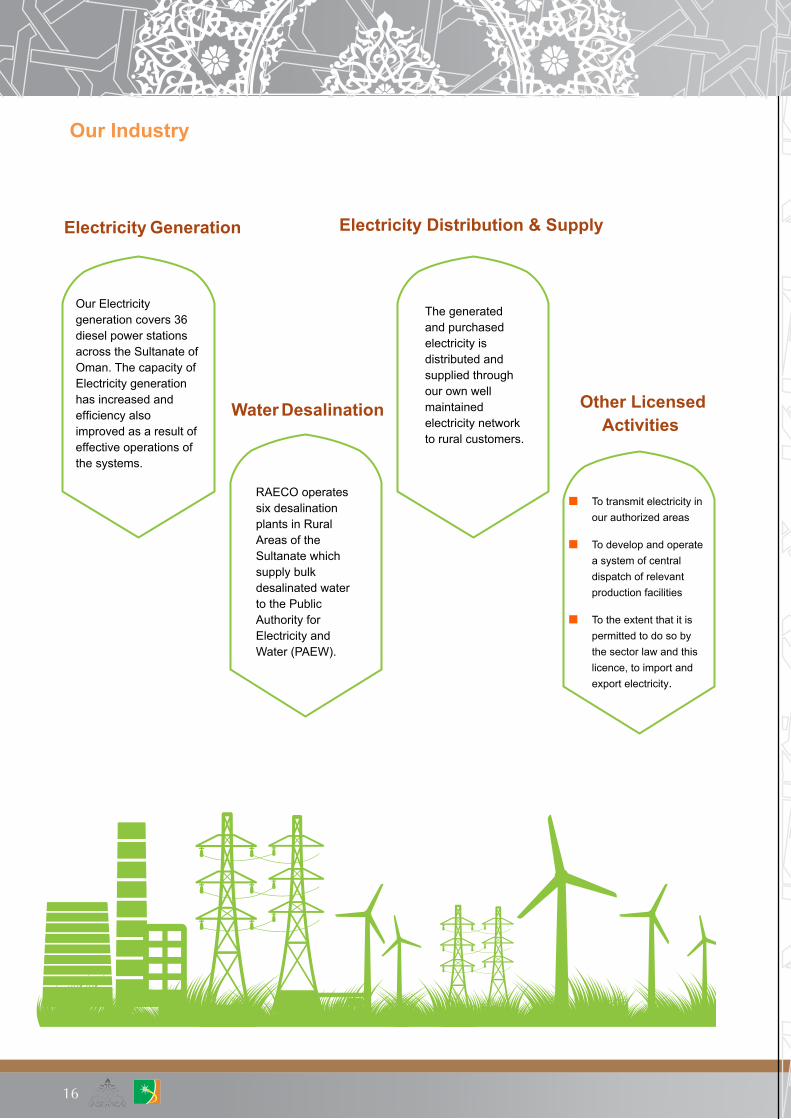
Our Industry
Our Electricity generation covers 36 diesel power stations across the Sultanate of Oman. The capacity of Electricity generation has increased and efficiency also improved as a result of effective operations of the systems.
Electricity Generation Electricity Distribution & Supply
Water Desalination Other Licensed Activities
RAECO operates six desalination plants in Rural Areas of the Sultanate which supply bulk desalinated water to the Public Authority for Electricity and Water (PAEW).
The generated and purchased electricity is distributed and supplied through our own well maintained electricity network to rural customers.
To transmit electricity in our authorized areas
To develop and operate a system of central dispatch of relevant production facilities
To the extent that it is permitted to do so by the sector law and this licence, to import and export electricity.
16

FINANCIAL & OPERATIONAL HIGHLIGHTS OF 2014

FINANCIAL & OPERATIONAL HIGHLIGHTS OF 2014Financial Highlights of 2014
Table (3): Key Highlights of 2014
Key Highlights Unit 2010 2011 2012 2013 2014
Balance Sheet Highlights and Ratios
Total Assets (RO’ 000) 167,312 197,143 191,651 221,829 245,080
Net Asset Per Share RO 99.86 100.43 96.784 106.728 219.352
Current Assets Over Current Liability % 105 177 63 128 39
Quick Asset Over Current Liability % 82 151 37 107 31
Fixed Assets Over Total Liability % 109 95 121 108 161
Earning Highlights and Ratios
Revenue (RO’ 000) 45,513 53,021 52,711 64,266 61,033
Total Revenue/MWh Supplied RO 108.96 114.74 94.22 98.73 87.42
Gross Profit Over Sales Ratio % 19.6 22.5 18.3 25.4 13
Net Profit Over Sales Ratio % 6.8 6.3 (1.6) 9.3 4
Return On Capital Employed % 7.5 8.4 2.7 12.5 3
Return On Equity % 6.2 6.7 (1.7) 11 2
Operating Cost Over Sales Ratio % 80.5 77.5 81.8 74.6 87
Admin Cost Over Sales Ratio % 14 17 20 19.8 22
Total Cost Over Sales Ratio % 97 97 105.9 96 112
Other Operational Highlights and Ratios
Total Number Of Customers Number 21,662 22,648 25,375 28,287 30,904
Total Number Of New Customers Number 1,424 986 2,727 2,912 2,617
Total Number Of Employees * Number 233 345 373 425 457
Electricity Generated For sent to Distribution Network KWh 444,914,714 513,038,743 555,808,415 685,004,406 756,711,730
Power Purchased From PDO KWh 48,731,200 59,867,000 74,742,000 94,270,000 124,684,000
Total kWh Supplied KWh 417,709,278 462,094,189 559,437,802 635,314,790 698,134,427
Total (Technical & Non-Technical) Losses % 9.84 12.62 11.3 10.8 14.5
Total Water Production m3 958,040 1,413,080 1,985,724 2,291,143 2,397,487
Total Water Dispatched (Sent Out) m3 958,745 1,349,087 1,948,833 2,160,352 2,236,582
* Number of Staff not included Distribution Code Review Panel staff (16 Staff in DCRP)
18

Financial and Operational PerformanceOur financial and operational performance is highlighted hereunder for the last five years of operation including 2014.
Figure (1): Financial and Operational Performance 2014
Operation, Revenue and Earning
(MWH)Electricity generated
Operating cost over sales ratio
Total water Production(m3)
Government Subsidy
Electricity Generation (MWh)
Operating Cost Over Sales Ratio Government Subsidy (mRO)
Return On Capital EmployedAssets Growth
Total Assets (RO 000) Return on Capital Employed Assets Base & Return
Total water Production (m3)
19

Table (4): Summary of Key Financial Statement Significant Items
Main items 2014 2013 Change
in YoYChange
% Explanatory highlights for YoY changesRO’000 RO’000
Revenue 61,033 64,266 (3,233) (5.0)
• Government subsidy received in 2014 is lower than 2013• Penalty income in 2014 is lower than 2013 by OMR (750k)
due to change of policy of charging penalty income against VOWD of respective projects.
• Installation Charge from Public, Connection Sales to Public and Connection Sales to Govt are lower than actual 2013 by OMR (55 k), (19 k) and (71 k) respectively.
Operating costs 53,341 47,971 5,370 11
• The net power generated and sent out had been increased from 635,167 MWh to 756,711 MWh representing 19% increases in 2014 compared to 2013.
• Desalinated water generation 2,397,487 m3 in 2014 has increased by 106,453 m3 over 2013 mainly due to Duqm Desalination Plant.
General and administrative expenses
13,480 12,735 745 6 • Increase staff cost due to general increase in number of staff & Increase in PASSI as per rules.
Non- CurrentAssets 217,852 181,944 35,908 19.7 • Increase in value of work done for capital projects RO 21mil-
lion.
Current Assets 27,228 39,885 (12,657) (31.7)
• Decrease in short term bank deposits RO 18 million, Inven-tories decreased by RO .351 million and Decrease in cash and cash equivalents by 1.6 million.
• Increase in receivables 4.9 million.
Current liability 69,041 31,184 37,857 121.4 • Increase in trade and other payable by 19,333 Million. • Increase in deferred revenue by 8,598 increase in bank
overdraft by 9,895 million.
Cash flow from Operating Activi-ties
15,155 10,259 4,896 47.7
• 3,765 million Profit before tax • working capital change-( movement in trade receivable
Payable and inventory) inventory & trade receivable has decreased by 3.5 million and increase in trade payables by 18 million.
Cash flow from Investing Activi-ties
(24,990) (35,122) 10,132 (28.6)• CAPEX out flow has increased by 12.8 million compared to
year 2013.• Bank deposit decrease by 18 million.
20

INDUSTRY ANALYSIS

CEO& Deputy
Technical Operations & Maintenance
Managers
Managers of Administration
& Finance
Deputy Managers & Head of Sections
Engineers Technicians Skilled Manpower
Total Direct Employees
INDUSTRY ANALYSISHuman ResourcesRAECO functioned with 456 permanent employees and 1 temporary employee in 2014, which reflects an increase of 7% over 2014. Our staff are talented and result oriented, which is reflected in full achievement of corporate KPIs.
Table (5): NO. Omanis & Non-Omanis Staff
Job Category Omani Staff No. Expatriate Staff No.General managers and deputies 3 0Operations and maintenance managers of technical departments (including senior manager) 16 1
Managers of administration and finance 12 0Deputy managers and head of sections 46 9Engineers 65 12Technicians 95 5Skilled manpower 193 0Total Direct Employees 430 27
Figure (2): Omanization in Each Function
One of the missions of our company is “To provide Omani nationals with challenging and rewarding employment opportunities”. RAECO has achieved 94% Omanization, by employing 430 Omanis out of 456 permanent employees as on 31 December 2014. The percentage of each functional staff distribution almost exceeds the overall Omanization target set by the Ministry of Manpower. Figures (2) and table (5) above shows the level of Omanization and the numbers of Omanis and non-Omani employees in each functional distribution.
22

Staff Category
Figure (3) shows functional staff distribution by job category.
Functional Staff DistributionFigure (3): Functional Staff Distribution
RAECO has 32 staff in managerial level including the CEO. The above figure shows that the majority of RAECO staff fall under administrative and technical categories. This reflects the skills required to operate the business undertaken by RAECO in accordance with the requirements of its license.
Regional Staff DistributionIt can be observed from figure (4) that, 46% of total RAECO direct staff is located in the head office in Muscat. The rest are distributed among the authorized areas according to the needs and the size of the networks and customers distribution. Customer regional offices are providing direct support to customers services and address their needs.
Figure (4): Regional Staff Distribution
Muscat Alsharqyah Al Wusta Dakhilya Dhahirah Dhofar Musandam
23

Staff Training and DevelopmentRAECO considers training and development for the staff as one of the main priorities. To put this into effect, we have provided training locally and internationally at a cost of RO 581,718 during year 2014. Further, RAECO provided staff scholarships for selected staff as part of their development plans.
Employee of the Month Program Our management is proud to continue the employee of the month program since 2010. Performance, integrity, hard work, teamwork and morality are the criteria for selection of employee of the month. This program aims at increasing staff loyalty, productivity and motivates other employees to maximize their performance.
Career Creativity CommitteeFor the third year RAECO continues its program of career creativity, which aims at enhancing talented employees and guides them towards success and creativity. The following table shows the creative ideas selected in 2014.
Table (6): Creative Ideas in 2014
Name Month Idea Description of the Idea
1 Raad Salim Al Afani January 5S Organize office work space for efficiency & effectiveness by identifying & storing the items used.
2 Fahmi Nasser Al Busaidy March E-Newspaper To view all the leading newspapers in electronic form from their computers at one centralized location and will reduce the cost
3 Abdulhameed Abdullah Al Badri April Pay bills and
review It is a program that is downloaded to smart phones to facilitate many of the participants at all times Services
4 Jokha Ali Al Amri June Electronic form It is transfering and converting all manual work or forms to electronic forms. The staff will be able to get any report easily.
5 Abdulaziz Khalaf Al Abri July Smart Invoice It is a system for checking, approving and controlling all income invoice online by use system.
6 Sultan Mohamed AL Akhzami October ASSAI document
control systemIt is a document control and management system for engineering and construction projects.
7 Ahmed Saleh Ambusaidi December Best station
award
Award allows competition between contracting companies to improve business performance in terms of quality in maintenance and problem-solving in a short time and encourage RAECO contractors to work harder at the work site
24

Customers ScenarioWe are serving customers located in our authorized areas in all rural areas across the Sultanate of Oman. Total customers increased by 9.3 %, from 28,287 in 2013 to 30,904 in 2014. Table (7) presents the 2014 customer data by category and consumption.
Table (7): Customer Category and Consumption
Tariff CategoryCustomers * Power Consumption
NO % MWH %Domestic 21,688 70.2 342,147 46Commercial 5,651 18.3 117,945 16Government 3,047 9.9 168,156 22Ministry of Defence 75 0.24 31,664 4Agriculture & Fisheries 336 1.1 26,191 4Tourism 63 0.20 23,028 3Industrial 44 0.14 37,989 5Total 30,904 100 747,120 100
* The value shows the power consumption prior to meter reading adjustment
The above table shows that 70% of RAECO customers are in domestic category and consume around 46% of total energy supplied. Government and Commercial customers consumed 23% and 16% respectively of the total MWh supplied. The total consumption of other categories is around 15%.
The consumption pattern may change in future years when more large industrial and tourism customers are connected to RAECO networks, especially after connection of large customers to Duqm distribution networks, high voltage network projects in Musandam and feed new areas with electricity.
Customers DistributionTable (8) shows the customer distribution by area and customer category, Indicating that the majority of RAECO customers are located in Musandam and Al Wusta Governorates with 41% each, and 18% of the total customers are located in rural areas of Dhofar Governorate. Table (8) shows that most of the distributed power is consumed in Al Wusta and Musandam with 40% and 39% respectively while in Dhofar consumption was 21%.
Table (8): Customer Distribution and consumption by area and Category
Tariff Category
Dhofar Musandam Al Wusta Total
Customer NO
PowerConsumption
MWh
Customer NO
PowerConsump-tion MWh
Custom-er NO
PowerConsump-tion MWh
Customer NO
* Power Consumption
MWh
Domestic 3,640 62,460 9,276 157,785 8,772 121,903 21,688 342,147
Commercial 923 29,442 2,069 43,442 2,659 45,061 5,651 117,945
Government 1,022 46,752 931 53,632 1,094 67,771 3,047 168,156
Ministry of Defence 30 1,101 33 14,980 12 15,583 75 31,664
Agriculture & Fisheries 78 22,446 225 2,947 33 798 336 26,191
Tourism - - 22 14,597 41 8,431 63 23,028
Industrial 3 298 12 1,091 29 36,600 44 37,989
Total 5,696 162,499 12,568 288,473 12,640 296,148 30,904 747,120% of customer/MWh distribution by Area 18% 21% 41% 39% 41% 40%
* The value shows the power consumption prior to meter reading adjustment
25
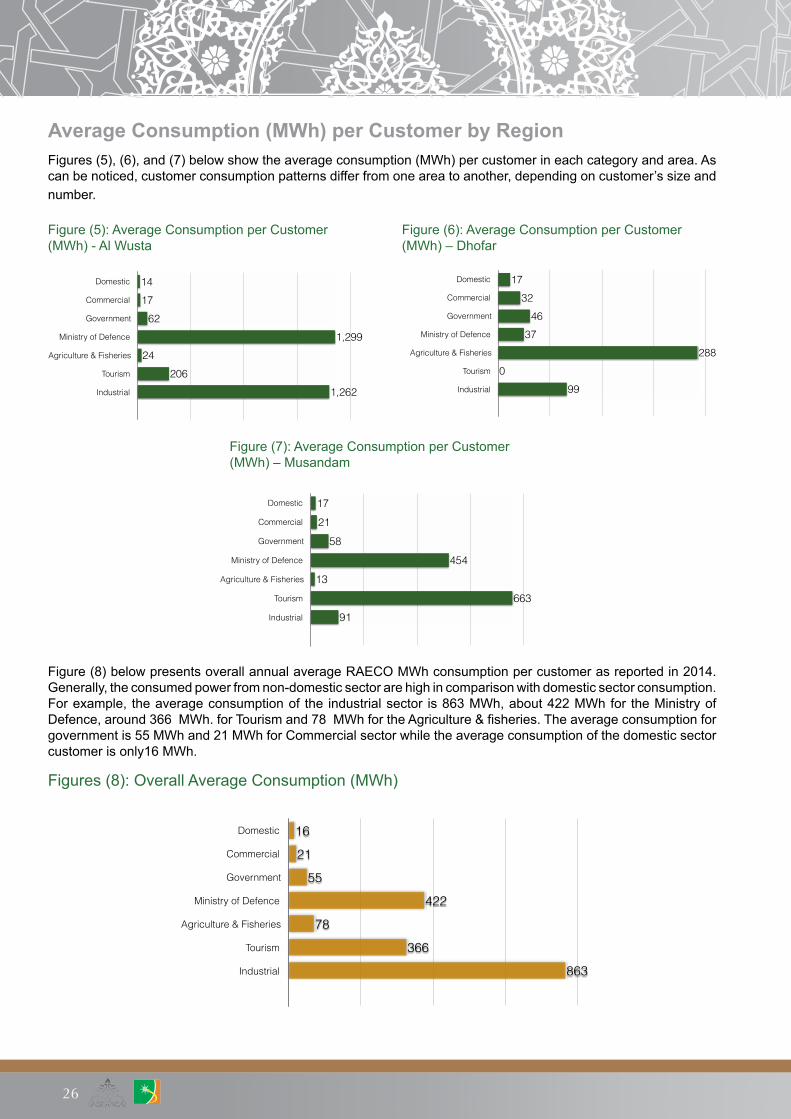
Average Consumption (MWh) per Customer by RegionFigures (5), (6), and (7) below show the average consumption (MWh) per customer in each category and area. As can be noticed, customer consumption patterns differ from one area to another, depending on customer’s size and number.
Figure (8) below presents overall annual average RAECO MWh consumption per customer as reported in 2014.Generally, the consumed power from non-domestic sector are high in comparison with domestic sector consumption. For example, the average consumption of the industrial sector is 863 MWh, about 422 MWh for the Ministry of Defence, around 366 MWh. for Tourism and 78 MWh for the Agriculture & fisheries. The average consumption for government is 55 MWh and 21 MWh for Commercial sector while the average consumption of the domestic sector customer is only16 MWh.
Figures (8): Overall Average Consumption (MWh)
Average Consumption Per Customer (MWh) Al Wusta
Domestic
Commercial
Government
Ministry of Defence
Agriculture & Fisheries
Tourism
Industrial 1,262206
241,299
621714
Average Consumption Per Customer (MWh) Dhofar
Domestic
Commercial
Government
Ministry of Defence
Agriculture & Fisheries
Tourism
Industrial 990
28837
4632
17
Average Consumption Per Customer (MWh) Musandam
Domestic
Commercial
Government
Ministry of Defence
Agriculture & Fisheries
Tourism
Industrial 91663
13454
582117
Figure (5): Average Consumption per Customer(MWh) - Al Wusta
Figure (6): Average Consumption per Customer (MWh) – Dhofar
Figure (7): Average Consumption per Customer (MWh) – Musandam
Domestic
Commercial
Government
Ministry of Defence
Agriculture & Fisheries
Tourism
Industrial 863
366
78
422
55
21
16
Overall Average Consumption Per Customer (MWh) Total
26

Customers GrowthOverall the number of RAECO customers has grown by 9.3 % in 2014. Net additions of 2,617 customers were added to the customer base in 2014. 62% of the net addition represents the resedenteial customers, 20% and 15% represent commercial and government customers, respectively. The rest is represented by other customer categories. The following table shows the growth in customer accounts over the last 4 years.
Table (9): Customers Growth
Customer category 2011 2012 2013 2014YOY
growth (‘11-’12)%
YOY growth
(‘12-’13)%
YOY growth
(‘13-’14)%
Domestic 16,200 18,087 20,054 21,688 12 11 8
Commercial 3,825 4,420 5,135 5,651 16 16 10
Government 2,333 2,490 2,662 3,047 7 7 14
Ministry of Defense 44 45 45 75 2 0 67
Agriculture & Fisheries 196 237 300 336 21 27 12
Tourism 23 40 49 63 74 23 29
Industrial 27 56 42 44 107 -25 5
Total 22,648 25,375 28,287 30,904 12 11 9.3
Net addition 986 2,727 2,912 2,617
Growth in Power SupplyPower supplied to rural customers increased by 15% over 2014, where the amount of power supplied to the customers reached 747 GWh compared to 650 GWh in 2013. Table (10) shows the power supplied to customers category for the last four years.
Table (10): Growth in Power Supply
Customer category 2011MWh
2012 MWh
2013 MWh
* 2014 MWh
YOY growth
(‘11-’12)%
YOY growth
(‘12-’13)%
YOY growth
(‘13-’14)%
Domestic 224,927 266,127 301,562 342,147 18 13 13
Commercial 85,807 87,771 106,399 117,945 2 21 11
Government 112,613 125,420 144,645 168,156 11 15 16
Ministry of Defense 11,750 19,968 18,449 31,664 70 -8 72
Agriculture & Fisheries 11,654 14,011 25,857 26,191 20 85 1
Tourism 12,512 13,968 21,031 23,028 12 51 9
Industrial 9,653 32,173 32,976 37,989 233 2 15
Total 462,094 559,438 650,920 747,120 21 16 15
Net addition 144,386 97,344 91,482 96,200
* The value shows the power consumption prior to meter reading adjustment
27

Musandam
Dhofar
AL Wusta
MWh Net MWh Gross
Regional Power Generation
Power GenerationPower Sent Out from RAECO Power StationsThe power sent to RAECO electrical networks increased to 698,134 MWh in 2014 from 635,315 MWh in 2013 reflecting an increase of 10% in total power sent out from RAECO power stations.Figure (9) shows the growth in MWh sent out from RAECO power stations to the distribution networks. This growth is due to the increase in demand by existing customers as well as new customers connected in 2014.
Figure (9): Power sent out from RAECO Power Stations MWh
Regional Energy Generation in 2014The following figure portrays the regional power generation from RAECO power stations in 2014 by region as well as the power sent out to the distrbution networks.
Figure (10): Regional Power Generation 2014 MWh
It can be noticed that, around 44% of power was produced from Musandam power plants, 33% and 23% from Al Wusta and Dhofar power plants respectively. The power generation reflects RAECO customer density and consumption pattern in each region.
Table (11) details the gross and net MWh production and the growth rate in 2013 and 2014 by region. The net Power (MWh) sent to the distribution network increased by 10% over last year. From the table we can notice that there is 7.7% of gross production used as auxiliary by the power plants in 2014 compared to around 7.3% in 2013.
315,131
332,154
161,792
172,216
221,210
252,340
28
JAN. FEB. MAR. APR. MAY JUN. JUL. AUG. SEP. OCT. NOV. DEC.
19.5
30.136.8
41.542.744.64039.1
35
22.116.416.4
20.3
31.4
40.144.547.747.745.943.5
38.3
23.317.117.4
2014 2013
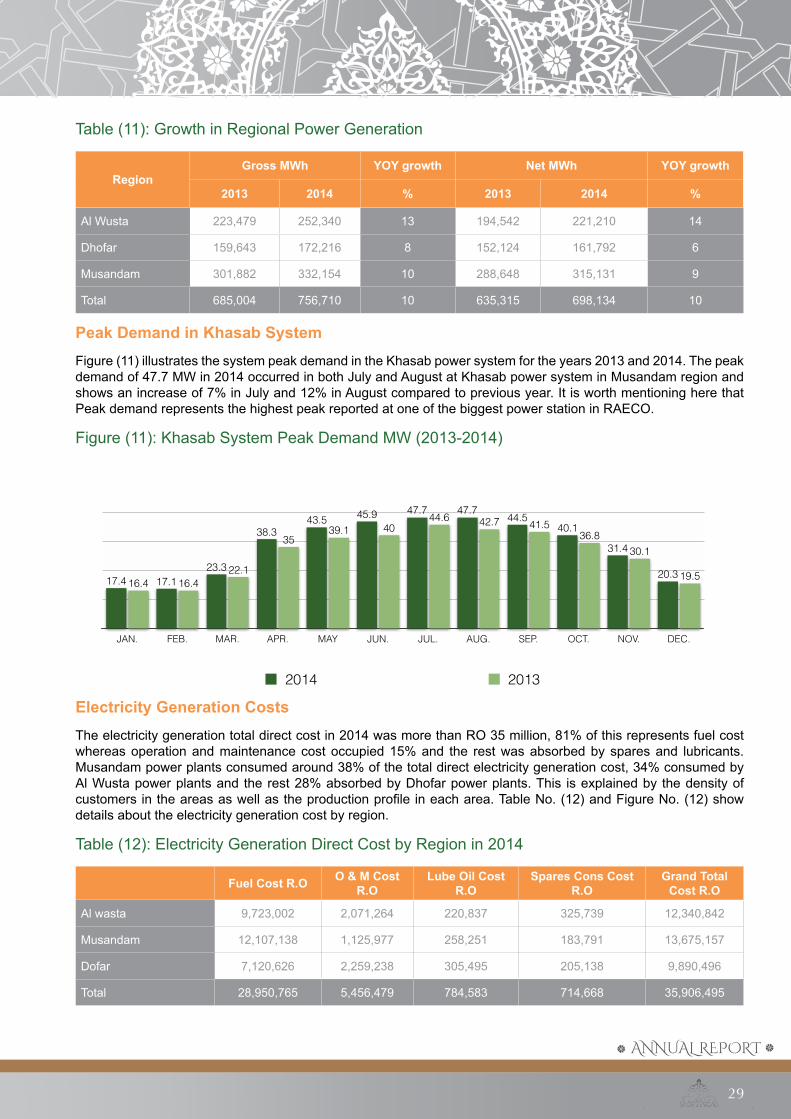
Table (11): Growth in Regional Power Generation
Region Gross MWh YOY growth Net MWh YOY growth
2013 2014 % 2013 2014 %
Al Wusta 223,479 252,340 13 194,542 221,210 14
Dhofar 159,643 172,216 8 152,124 161,792 6
Musandam 301,882 332,154 10 288,648 315,131 9
Total 685,004 756,710 10 635,315 698,134 10
Peak Demand in Khasab SystemFigure (11) illustrates the system peak demand in the Khasab power system for the years 2013 and 2014. The peak demand of 47.7 MW in 2014 occurred in both July and August at Khasab power system in Musandam region and shows an increase of 7% in July and 12% in August compared to previous year. It is worth mentioning here that Peak demand represents the highest peak reported at one of the biggest power station in RAECO.
Figure (11): Khasab System Peak Demand MW (2013-2014)
Electricity Generation CostsThe electricity generation total direct cost in 2014 was more than RO 35 million, 81% of this represents fuel cost whereas operation and maintenance cost occupied 15% and the rest was absorbed by spares and lubricants. Musandam power plants consumed around 38% of the total direct electricity generation cost, 34% consumed by Al Wusta power plants and the rest 28% absorbed by Dhofar power plants. This is explained by the density of customers in the areas as well as the production profile in each area. Table No. (12) and Figure No. (12) show details about the electricity generation cost by region.
Table (12): Electricity Generation Direct Cost by Region in 2014
Fuel Cost R.O O & M Cost R.O
Lube Oil Cost R.O
Spares Cons Cost R.O
Grand Total Cost R.O
Al wasta 9,723,002 2,071,264 220,837 325,739 12,340,842
Musandam 12,107,138 1,125,977 258,251 183,791 13,675,157
Dofar 7,120,626 2,259,238 305,495 205,138 9,890,496
Total 28,950,765 5,456,479 784,583 714,668 35,906,495
29

Dhofar Musandam Al Wusta
Generation Cost Distribution By RegionFigure (12): Percentage of Electricity Generation Cost by Region in 2014
Fuel EfficiencyFuel efficiency simply computes the number of kWh produced by each litre of diesel. Our business plan targeted an average of 3.3 kWh per litre of diesel. The target has been achieved as the average fuel efficiency from RAECO power plants reached 3.5 kWh per litre of fuel in 2014. It is noticed that fuel efficiency generally increased in most of the company’s stations, especially in stations with the largest production capacity. The following chart shows the fuel efficiency by region in 2013 and 2014.
Figure (13): Fuel Efficiency (kWh/Ltr) (2013-2014)
Al Wusta
Dhofar
Musandam 3.7
3.3
3.6
3.7
3.4
3.4
2013 2014
Fuel Efficiency(kWh/Ltr) 2013-2014
30
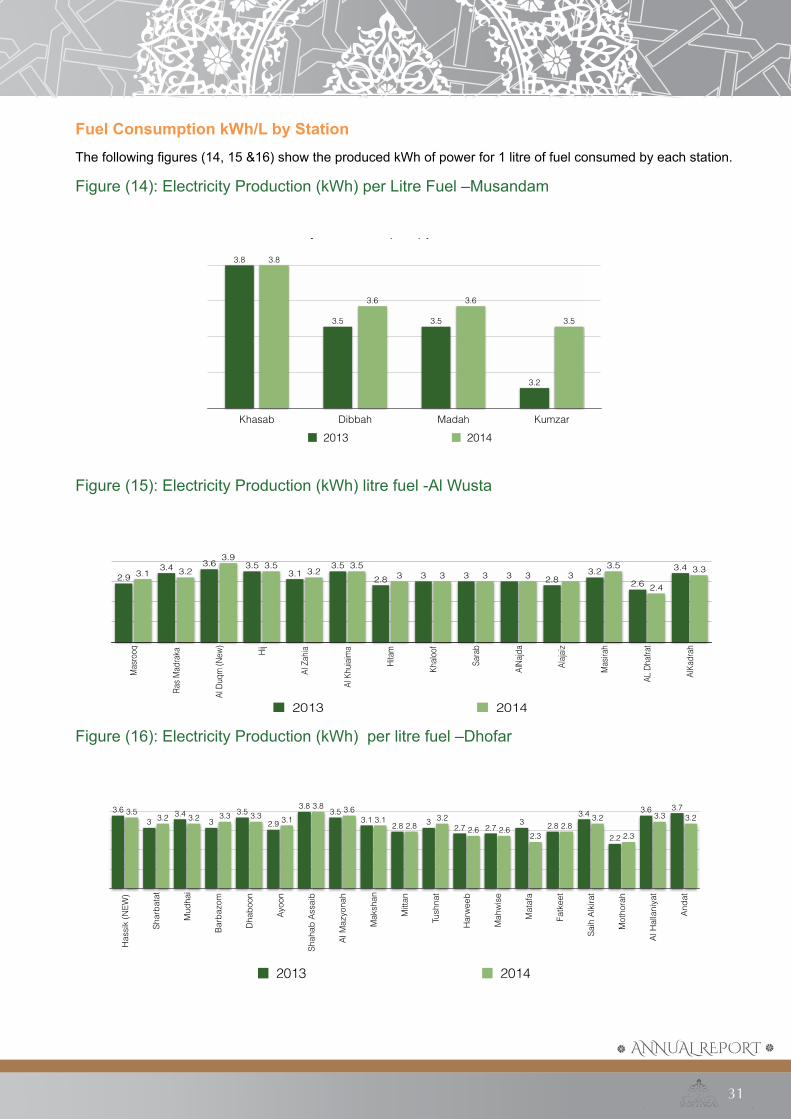
Fuel Consumption kWh/L by StationThe following figures (14, 15 &16) show the produced kWh of power for 1 litre of fuel consumed by each station.
Figure (14): Electricity Production (kWh) per Litre Fuel –Musandam
Figure (15): Electricity Production (kWh) litre fuel -Al Wusta
Figure (16): Electricity Production (kWh) per litre fuel –Dhofar
Mas
rooq
Ras M
adra
ka
Al D
uqm
(New
)
Hij
Al Z
ahia
Al K
huiai
ma
Hita
m
Khalo
of
Sara
b
AlNa
jda
Alaja
iz
Mas
irah
AL D
hafra
t
AlKa
drah
3.3
2.4
3.533333
3.53.2
3.53.9
3.23.13.4
2.63.2
2.83332.83.5
3.13.53.63.4
2.9
2013 2014
Electricity Production (kWh) per Litre Fuel - Al - Wusta
Has
sik
(NEW
)
Shar
bata
t
Mud
hai
Barb
azom
Dha
boon
Ayoo
n
Shah
ab A
ssai
b
Al M
azyo
nah
Mak
shan
Mitt
an
Tush
nat
Har
wee
b
Mah
wis
e
Mat
afa
Fatk
eet
Saih
Alk
irat
Mot
hora
h
Al H
alla
niya
t
Anda
t
3.23.3
2.3
3.22.8
2.32.62.6
3.22.8
3.13.63.8
3.13.33.33.23.23.5 3.73.6
2.2
3.42.83
2.72.732.8
3.13.5
3.8
2.93.5
33.4
33.6
2013 2014
Electricity Production (kWh) per Litre Fuel-Dhofar
Khasab Dibbah Madah Kumzar
3.5
3.63.6
3.8
3.2
3.53.5
3.8
2013 2014
Electricity Production (kWh) per Litre fuel - Musandam
31

Comparision between Energy Supplied from RAECO's Power Stations & Energy Purchased from PDOMost of RAECO Customers are supplied from RAECO’s power stations. However, some power is purchased from Petroleum Development of Oman (PDO) electrical system as this offers a more economic means of providing power to some very remote locations where RAECO power generation systems do not exist and customers are located near PDO power plants. Therefore, RAECO signs agreements for power purchase (PPA) with PDO to feed its customers at these areas of license. In 2014, about 85 % of energy supplied to RAECO customers was produced through RAEC own power plants and the remaining 15 % was purchased from PDO. Figure (17) below compares the energy supplied from RAECO power plants with energy purchased from PDO electrical systems in 2013 and 2014.
System LossesSystem loss for the year 2014 is 14.5 %. The company has put great efforts to reduce the technical and non-technical system losses as much as possible. Currently, the loss is identified by calculating the difference between the power sent to the distribution network and the power metered at final customers. Figure (18) shows system losses in last 5 years.
Figure (18): Technical & Non-Technical Losses
Figure (17): Energy Produced By RAECO and Energy Purchased from PDO(MWh)
2013 2014
124,68494,290
698,133635,315
MWh RAECO MWh PDO
Energy Produced by RAECO and Energy Purchased from PDO
Technical & Non-Technical Losses
32
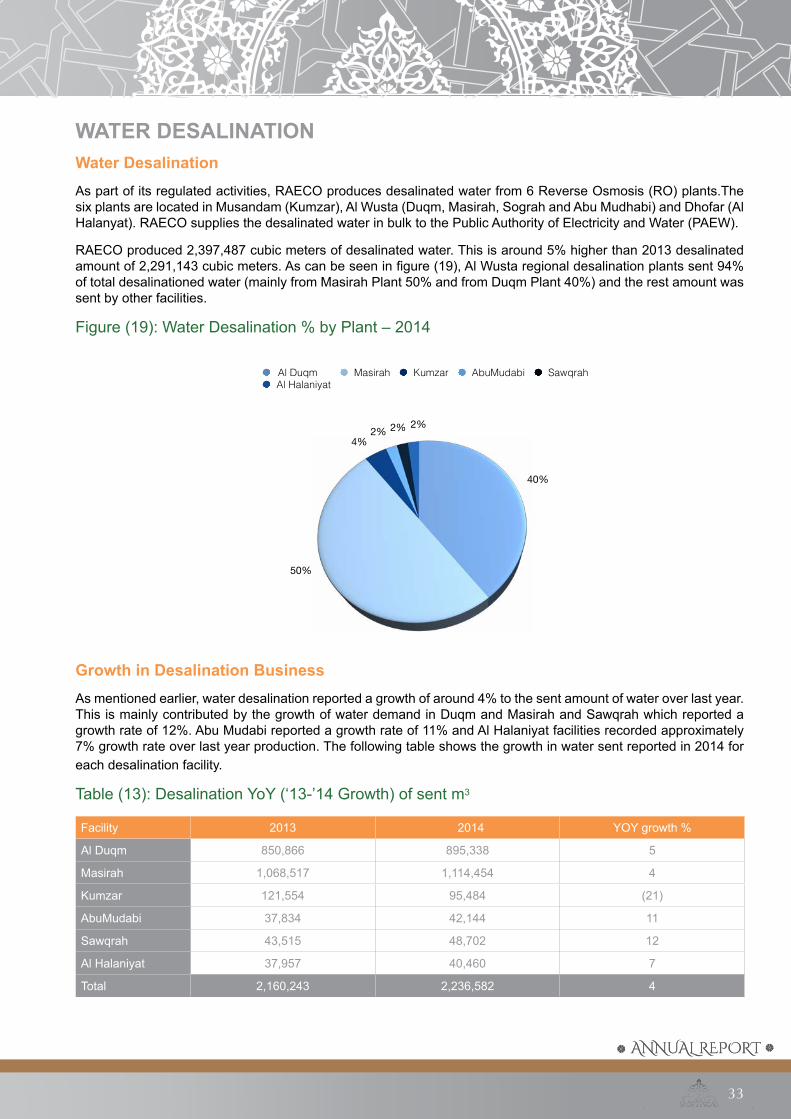
WATER DESALINATIONWater DesalinationAs part of its regulated activities, RAECO produces desalinated water from 6 Reverse Osmosis (RO) plants.The six plants are located in Musandam (Kumzar), Al Wusta (Duqm, Masirah, Sograh and Abu Mudhabi) and Dhofar (Al Halanyat). RAECO supplies the desalinated water in bulk to the Public Authority of Electricity and Water (PAEW).
RAECO produced 2,397,487 cubic meters of desalinated water. This is around 5% higher than 2013 desalinated amount of 2,291,143 cubic meters. As can be seen in figure (19), Al Wusta regional desalination plants sent 94% of total desalinationed water (mainly from Masirah Plant 50% and from Duqm Plant 40%) and the rest amount was sent by other facilities.
Figure (19): Water Desalination % by Plant – 2014
Growth in Desalination BusinessAs mentioned earlier, water desalination reported a growth of around 4% to the sent amount of water over last year. This is mainly contributed by the growth of water demand in Duqm and Masirah and Sawqrah which reported a growth rate of 12%. Abu Mudabi reported a growth rate of 11% and Al Halaniyat facilities recorded approximately 7% growth rate over last year production. The following table shows the growth in water sent reported in 2014 for each desalination facility.
Table (13): Desalination YoY (‘13-’14 Growth) of sent m3
Facility 2013 2014 YOY growth %
Al Duqm 850,866 895,338 5
Masirah 1,068,517 1,114,454 4
Kumzar 121,554 95,484 (21)
AbuMudabi 37,834 42,144 11
Sawqrah 43,515 48,702 12
Al Halaniyat 37,957 40,460 7
Total 2,160,243 2,236,582 4
Al Duqm Masirah Kumzar AbuMudabi SawqrahAl Halaniyat
50%
4%2% 2% 2%
40%
33

Desalination Operational CostThe desalination operational direct cost in 2014 was RO 1,907,877. Around 55% of this represents the operation and maintenance cost whereas internal power consumption cost (the cost of power used to operate the plants) occupied 38% and the rest was absorbed by spares and chemicals. Table (14) presents operational costs by desalination plant.
Table (14): Desalination Operational Costs by Plant (RO)
Facility O & M Cost Spares Cons Cost Chemical Cost kWh Cost Total
Al Duqm 491,188 * * 275,849 767,037
Masirah 237,804 57,772 61,921 329,564 687,061
Kumzar 70,374 7,675 1,638 38,159 117,846
AbuMudabi 91,857 552 774 1,303 94,486
Sawqrah 100,131 2,159 941 25,855 129,086
Al Halaniyat 59,838 4,584 * 47,939 112,361
Total 1,051,192 72,742 65,273 718,669 1,907,877
* These costs are inclouded in the O & M cost
ISO Certificate 9001:2008ISO Certificate 9001:2008 is an International Quality Management Standard (QMS) which companies can use to demonstrate their ability to meet their job quality requirements based on specific standards. In 2010 RAEC became an ISO certified organization (9001:2008) the certification included generation, transmission, distribution, supply of power. Recently, RAEC has been renewed its ISO 9001:2008 certificate in May 2014 which will be valid for 3 years and added the desalination business in its scope. The QMS ensures that the company applies the approved policies and procedures through internal and external audits. The QMS implmentation resulted in developing the quality manual, standard operating procedures for all departments as well as ISO forms.
34

OTHER BUSINESSRenewable Energy Projects: RAEC has undertaken certain initiatives in order to administer the deployment of renewable energy in Oman. RAEC started the implementation of the renewable energy projects in its authorized areas. RAEC has initiated solar and wind projects to assess the performance and efficiency of renewable technologies under local conditions. Pilot projects will also help to attract the investments from local and international developers to the Sultanate’s significant renewable energy resources. These projects will reduce the use of fossil fuels which will lead to financial saving in fuel cost and reduce CO2 emmissions. Current Pilot Projects in Rural AreaThe table below shows the list of the pilot projects that are in an advanced stage.
Table (15): Current Pilot Project in Rural Area
StatusSiteProjectJDA-signed, Evaluation stageHarweel - Dhofar50 MW Wind Farm
In OperationAl-Mazyunah303 kW Solar PV Power Plant
Discussion is going on between RAEC and the investorMasirah1600 kW Wind Farm Al-Mazyunah Solar Power Plant RAECO signed the power purchase agreement for the first solar energy project in the Sultanate of Oman. The project will help in the production of electricity as a hybrid system with the existing diesel power station and feed the existing electrical network. It is expected that the project will be able to cover most of the current demand for electricity in the winter period at Al Mazyunah. The project will contribute to reduce fossil fuel usage and related emissions that are caused by the diesel fuel. It also establishes a platform for future use of renewable energy in Oman. Dhofar Wind Farm Project The sultanate of Oman represented by Rural Areas Electricity Company with Abu Dhabi Government represented by (Masdar) has signed an agreement to construct the first plant to generate electricity from wind in the area of Herweel in the Governorate of Dhofar with 50 MW capacity.
The project comprises the development, design, engineering, procurement, construction, testing, commissioning, of 50MW wind power plant, substation and all associated components. It will include all interface works with all stakeholders to enable successfully commissioning of the work and handover.
The total production capability of this plant can reach up to 50 MW of clean energy, capable of producing 160 Gigawatts hour annually. The delivery period of the project shall start in the first quarter of 2017. The initial production capability will cover around 7% of the total load of the electricity grid in Dhofar governorate. The project will contribute in training local manpower, and provide job opportunities for people in those areas. Proposed Renewable Energy ProjectsA list of future projects in renewable energy is in the table below.
Table (16): Future Projects in Renewable Energy.
Project Site2000 kW Solar power Ibri - Al Dahriah2000 kW Solar power Al- Sharqiah2000 kW Solar power Mudhai - Dhofar500 kW Solar power Fatkhait- Dhofar500 kW Solar power Harweel - Dhofar
35

Proposed Strategy for Customer Services (Blueprint)The "Blueprint Strategy" is an important initiative for future customer service quality, and is strand of a Comprehensive strategic business plan for the Omani Electricity sector that has been developed by consultant ESBI Client, for EHC – the Electricity Holding Company.
Accordingly, the Blueprint has been designed to take account of key strategic projects (insourcing of billing, new meter reading system, contact center & reporting performance monitoring). The development is under way or planned for RAECO, in conjunction with EHC. The Blueprint aims at foucusing in customer services through the sepration of supply and distribution activities to provide better service to the customer and use latest ways and technologies to acheive this.
The formal basis of all these projects, including the Customer Service Blueprint, is the Set of 5 strategic themes developed by EHC, comprising: HR Development, Communications, Customer Service, HSE and Asset Management. The first three, together with EHC’s IT Master Plan, directly impact on the areas of focus of the Present Blueprint Design, which is started implementation in RAECO on 2014 and disseninated for the upcoming three years up to 2017.
GIS in RAECGIS is abbreviation of Geographic Information Systems.GIS integrates hardware, software, and data for capturing,managing, analyzing, and displaying all forms of geographically referenced information. GIS allows us to view, understand, question, interpret, and visualize data in many ways that reveal relationships, patterns, and trends in the form of maps, globes, reports, and charts.
In 2013 RAEC decided to enhance its business through utilizing GIS system. GIS started by preparing GIS strategic plan which has been issued for three years including the main concepts of GIS, implementation methodology and the GIS investment strategy which includes application, hardware, software, data, staff and estimated time and cost. The strategic plan has been closed with some of expected risks and challenges with recommendations.
GIS attains a couple of positive results in less than a year since the great support from the top management. The GIS implantation methodology started by build an understanding of RAEC’s main drivers, business imperatives, stakeholders and processes which was done by collecting information needs from departments. Based on the result from the information needs, the GIS database has been built which includes all department requirements. Next the GIS web application has been built to view geographic data.
Billing SystemAll process of Meter Reads, Billing and collection is out sourced to contractors to run these operations. EHC group (Electricity Holding Company) has decided to in house these operations to deliver accurate bills and excellent customer service. Excellent customer service means bills that are accurate, consistently calculated and fair to the customer and the company.
So, in brief, billing system is a process started from receiving Meter Reads, validating Reads, and issuing customers’ bills. To apply this project in a professional way, Billing System has been divided in different stages. data migration stage which is required to shift all customer data to the new system (ORION). Then RAEC started a Pilot stage to implement this project in Khasab area to evaluate system capability. The new project is delivered as planed and RAEC decided to rollout all RAEC customers which started in Dec.14.
Notably, RAEC is leading other EHC subsidaries in the first rollout.
36
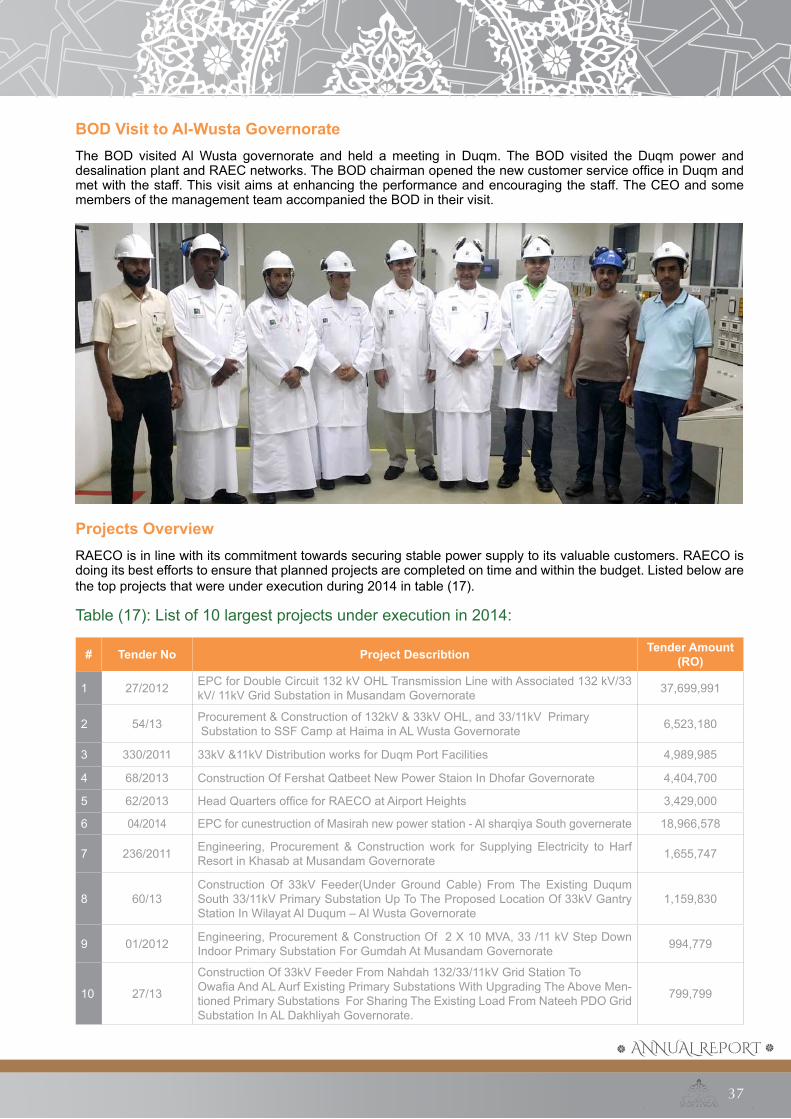
BOD Visit to Al-Wusta GovernorateThe BOD visited Al Wusta governorate and held a meeting in Duqm. The BOD visited the Duqm power and desalination plant and RAEC networks. The BOD chairman opened the new customer service office in Duqm and met with the staff. This visit aims at enhancing the performance and encouraging the staff. The CEO and some members of the management team accompanied the BOD in their visit.
Projects OverviewRAECO is in line with its commitment towards securing stable power supply to its valuable customers. RAECO is doing its best efforts to ensure that planned projects are completed on time and within the budget. Listed below are the top projects that were under execution during 2014 in table (17).
Table (17): List of 10 largest projects under execution in 2014:
# Tender No Project Describtion Tender Amount (RO)
1 27/2012 EPC for Double Circuit 132 kV OHL Transmission Line with Associated 132 kV/33 kV/ 11kV Grid Substation in Musandam Governorate 37,699,991
2 54/13 Procurement & Construction of 132kV & 33kV OHL, and 33/11kV Primary Substation to SSF Camp at Haima in AL Wusta Governorate 6,523,180
3 330/2011 33kV &11kV Distribution works for Duqm Port Facilities 4,989,985
4 68/2013 Construction Of Fershat Qatbeet New Power Staion In Dhofar Governorate 4,404,700
5 62/2013 Head Quarters office for RAECO at Airport Heights 3,429,000
6 04/2014 EPC for cunestruction of Masirah new power station - Al sharqiya South governerate 18,966,578
7 236/2011 Engineering, Procurement & Construction work for Supplying Electricity to Harf Resort in Khasab at Musandam Governorate 1,655,747
8 60/13Construction Of 33kV Feeder(Under Ground Cable) From The Existing Duqum South 33/11kV Primary Substation Up To The Proposed Location Of 33kV Gantry Station In Wilayat Al Duqum – Al Wusta Governorate
1,159,830
9 01/2012 Engineering, Procurement & Construction Of 2 X 10 MVA, 33 /11 kV Step Down Indoor Primary Substation For Gumdah At Musandam Governorate 994,779
10 27/13
Construction Of 33kV Feeder From Nahdah 132/33/11kV Grid Station To Owafia And AL Aurf Existing Primary Substations With Upgrading The Above Men-tioned Primary Substations For Sharing The Existing Load From Nateeh PDO Grid Substation In AL Dakhliyah Governorate.
799,799
37

Price Control & Subsidies 2014During 2014, RAECO had followed price control mechanism as agreed with AER. Under this mechanism RAECO’s Maximum Allowed Revenue (MAR) is driven as follows:
Electricity Maximum Allowed Revenue
MAREt =Gt+TD&St+Mt+Fuelt+PCt+LFt-Kwt
Where:
TD&St= at+ (bt*RUD) + (ct*CAt)
The price control mechanism also determines the water maximum allowed revenue through the following formula.
MARWt = DESt + Fuelt + LFt-Kwt
Table (18): Price control and Subsidies (2013-2014)
t=2014t=2013Item
15,707,96615,541,098Gt(Generation Costs)
15,603,06314,833,204TD&St(Trans, Dist&Supply Costs)
30,539,59425,847,703Fuelt
1,240,000942,900PCt(Electricity Purchase Costs)
284,357202,002Lisence Fees
63,374,98057,366,908MAREt (Maximum Allowed Revenue)
14,685,95112,470,045Customer Revenue
48,689,02944,896,863Mart-Customer Revenue
1,513,028-2,166,820Over/Under recovery
2,540,000-650,188Other Adjustments
44,636,00147,713,872Financial Subsidy
43,558,00049,226,900Actual Subsidy Payments
62,571,40658,032,974Economic Subsidy@$85/barrel oil
73,267,74068,161,606Economic Subsidy@$105.5/barrel oil
Sources:RAEC 2013 SCRC, Authority calculations
QuarterlyROROQuarterly Subsidy Payments
18%7,885,0506,456,489Q1 Subsidy
41%18,398,44912,289,592Q2 Subsidy
23%10,477,45117,229,415Q3 Subsidy
18%7,885,05013,251,404Q4 Subsidy
100%44,646,00049,226,900Subsidy Entitlement Year t
38

Price Control Proposal (2015-2017): RAECO has administered a newly modified price control mechanism as agreed with AER to outline the Opex and Capex allowances for all RAEC regulated activities and determines the maximum allowed revenue for electricity and water for the period (2015-2017). Under this mechanism RAECO’s Maximum Allowed Revenue (MAR) is driven as follows:
MAERt=MAGRt+MANRt+MASRt+LFEt-KEt where:
MAGRt= Gt+FuelEt +PCt-PTt
MANRt=TDt+Mt
MASRt=SBt
MARWt= DESt+PTt+LFt+-Kwt
2015 Electricity Subsidy Calculation
A- Maximum Allowed Revenue (million Rial Omani)Table (19-A): Maximum Allowed Revenue
B: 2015 Subsidy Requirements (Rial Omani)Table (19-B): Subsidy Requirements (RO)
2015 Subsidy
MAGRt MANRt MASRt LFEt KEt MAERt
57.12 18.63 5.25 .303 -.114 81.413
Total Economic Cost of Supply in Relevant Year t (1st Jan-31st December 2015) 81.413
RAEC Maximum Allowed Electricity Revenue
Supply Revenue
SBt
dt CAt MASRt
158.5 0.033 5.247
TDt
at bt RUDt ct CAt Mt MANRt
11.64 3.9 862 109.7 0.033 0 18.633
Transmission and Distribution RevenueGeneration Revenue
MAER Customer Revenue
81,412,855 14,478,45
Total bz/kWh
66,936,405 77.7
Econ. Costbz/kWh
Customer Rev.bz/kWh
94.5 16.8
Gt Fuel Et PCt PTt MAGRt
23.85 33.096 1.25 1.08 57.116
39

Figure (20): 2015 Economic Costs of Electricity Supply (Rural Areas Electricity Company)
The following table shows details about the subsidy and economic cost per KWh over the last four years
Table (20): Details about the subsidy and economic cost per kWh
Cost and Subsidy per KWh 2011 2012 2013 2014
Economic Cost per KWh 79.39 78.19 89.5 84
Revenue per KWh 16.02 14.24 19.5 19.5
Subsidy per KWh 61.64 64.62 70 64.5
Fuel Cost per KWh 42.90 41.27 40.3 40.5
Customer Revenue SubsidySupply Trasmission&Distribution Production
40

Customer Revenue Subsidy
Tabl
e (2
1): 2
014
Ope
ratio
nal D
ata
Sum
mar
y - D
hofa
r
RS
Num
ber
Rem
ote
Sys-
tem
Nam
e
Inst
alle
d C
apac
-ity
KW
Der
ated
C
apac
ity
KW
No
of
unit
Min
imum
Pe
akM
onth
Max
imum
Pe
akM
onth
Kw
h _
Net
Kw
h-
Gro
ssFu
el
Cos
tFu
el- C
on-
Ltr
01/0
01A
l Hal
aniy
at1,
053
842
310
0Ja
n.,F
eb. &
Jul
.33
5O
CT.
1,13
2,78
01,
710,
710
88,3
6151
6,73
0
01/0
02A
l Mat
hfa
360
288
416
Feb.
228
MAY
643,
899
649,
374
40,0
7928
3,34
4
01/0
07Ay
un72
057
64
20A
ug.,N
ov. &
Dec
.18
2M
AY59
1,24
160
4,06
926
,993
196,
029
01/0
08B
arba
zum
880
704
310
5D
ec.
685
SE
P.2,
996,
803
3,01
3,49
712
5,52
889
9,84
101
/012
Dha
habu
n2,
389
1,91
15
200
Jun.
1350
JUN
.5,
263,
208
5,27
6,21
922
2,17
51,
604,
155
01/0
14Fa
tkha
t54
243
44
25Fe
b. &
Mar
.22
0S
EP.
840,
816
863,
120
43,7
5930
7,72
7
01/0
16H
irwee
b37
530
03
100
Jan.
860
JUN
. &
JUL.
3,11
2,29
73,
134,
224
168,
395
1,21
3,22
3
01/0
19M
ahw
ice
397
318
417
Mar
.22
0M
AY78
1,07
278
8,35
042
,415
298,
695
01/0
20M
aqsh
an1,
802
1,44
25
50Ja
n.58
5JU
N.
2,34
3,70
32,
386,
116
107,
738
759,
786
01/0
21M
azyu
nah
9,00
07,
200
665
4Fe
b.58
70JU
L.21
,315
,495
22,6
97,5
1187
5,73
86,
304,
809
01/0
23M
itan
1,88
71,
510
490
Dec
.89
8JU
L.&
A
UG
.3,
757,
511
3,78
1,19
519
0,12
41,
337,
015
01/0
24M
otho
rah
600
480
328
Nov
.35
0JU
L.1,
115,
025
1,15
7,47
869
,143
493,
879
01/0
32S
aih
Alk
irat
32,4
0025
,920
1418
00A
pr.
1385
0S
EP
T.66
,928
,708
73,5
56,3
583,
084,
799
22,6
82,3
4201
/035
Sha
hb A
sayb
11,0
008,
800
717
50A
ug.
7320
JUN
.31
,324
,320
32,0
54,2
301,
169,
631
8,50
0,22
301
/037
Sha
rbat
at3,
542
2,83
35
106
Jul.
1075
AP
R.
4,21
5,34
54,
285,
438
185,
368
1,32
1,22
601
/004
And
at76
060
83
44Fe
b.68
8S
EP.
2,69
3,48
92,
700,
058
119,
831
848,
659
01/0
46M
udha
i (ne
w)
3,84
83,
078
625
0Ja
n.16
40JU
L.5,
978,
348
6,42
8,36
427
3,79
91,
989,
821
01/0
47H
asik
(new
)5,
000
4,00
06
260
Jan.
1393
MAY
5,43
0,51
65,
777,
738
227,
670
1,64
8,59
101
/040
Tush
nat
905
724
428
Dec
.33
2JU
L.1,
328,
116
1,35
2,39
559
,081
422,
004
Tota
l Dho
far S
tatio
ns =
19
122,
460
97,9
6893
161,
792,
692
172,
216,
444
7,12
0,62
751
,628
,099
41
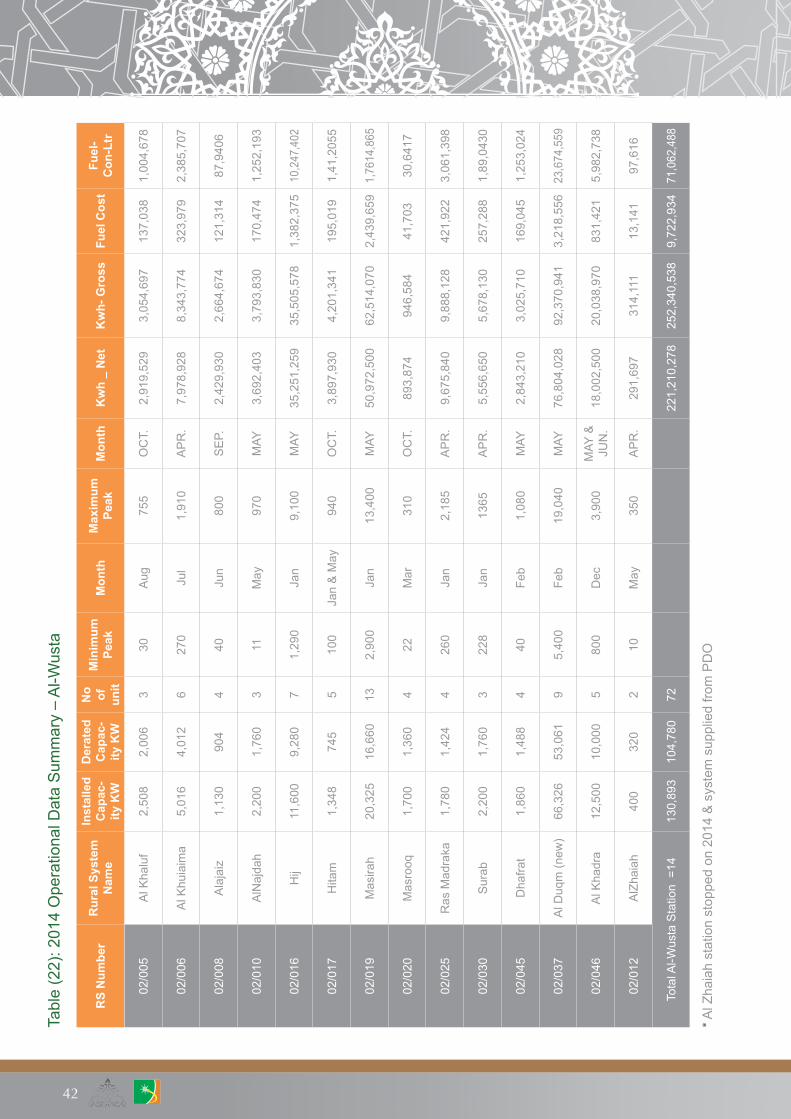
Tabl
e (2
2): 2
014
Ope
ratio
nal D
ata
Sum
mar
y –
Al-W
usta
RS
Num
ber
Rur
al S
yste
m
Nam
e
Inst
alle
d C
apac
-ity
KW
Der
ated
C
apac
-ity
KW
No of
unit
Min
imum
Pe
akM
onth
Max
imum
Pe
akM
onth
Kw
h _
Net
Kw
h- G
ross
Fuel
Cos
tFu
el-
Con
-Ltr
02/0
05A
l Kha
luf
2,50
82,
006
330
Aug
755
OC
T.2,
919,
529
3,05
4,69
713
7,03
81,
004,
678
02/0
06A
l Khu
iaim
a5,
016
4,01
26
270
Jul
1,91
0A
PR
.7,
978,
928
8,34
3,77
432
3,97
92,
385,
707
02/0
08A
laja
iz1,
130
904
440
Jun
800
SE
P.2,
429,
930
2,66
4,67
412
1,31
487
,940
6
02/0
10A
lNaj
dah
2,20
01,
760
311
May
970
MAY
3,69
2,40
33,
793,
830
170,
474
1,25
2,19
3
02/0
16H
ij11
,600
9,28
07
1,29
0Ja
n9,
100
MAY
35,2
51,2
5935
,505
,578
1,38
2,37
510
,247
,402
02/0
17H
itam
1,34
874
55
100
Jan
& M
ay94
0O
CT.
3,89
7,93
04,
201,
341
195,
019
1,41
,205
5
02/0
19M
asira
h20
,325
16,6
6013
2,90
0Ja
n13
,400
MAY
50,9
72,5
0062
,514
,070
2,43
9,65
91,
7614
,865
02/0
20M
asro
oq1,
700
1,36
04
22M
ar31
0O
CT.
893,
874
946,
584
41,7
0330
,641
7
02/0
25R
as M
adra
ka1,
780
1,42
44
260
Jan
2,18
5A
PR
.9,
675,
840
9,88
8,12
842
1,92
23,
061,
398
02/0
30S
urab
2,20
01,
760
322
8Ja
n13
65A
PR
.5,
556,
650
5,67
8,13
025
7,28
81,
89,0
430
02/0
45D
hafra
t1,
860
1,48
84
40Fe
b1,
080
MAY
2,84
3,21
03,
025,
710
169,
045
1,25
3,02
4
02/0
37A
l Duq
m (n
ew)
66,3
2653
,061
95,
400
Feb
19,0
40M
AY76
,804
,028
92,3
70,9
413,
218,
556
23,6
74,5
59
02/0
46A
l Kha
dra
12,5
0010
,000
580
0D
ec3,
900
MAY
&
JUN
.18
,002
,500
20,0
38,9
7083
1,42
15,
982,
738
02/0
12A
lZha
iah
400
320
210
May
350
AP
R.
291,
697
314,
111
13,1
4197
,616
Tota
l Al-W
usta
Sta
tion
=14
130,
893
104,
780
7222
1,21
0,27
825
2,34
0,53
89,
722,
934
71,0
62,4
88
* Al Z
haia
h st
atio
n st
oppe
d on
201
4 &
sys
tem
sup
plie
d fro
m P
DO
42
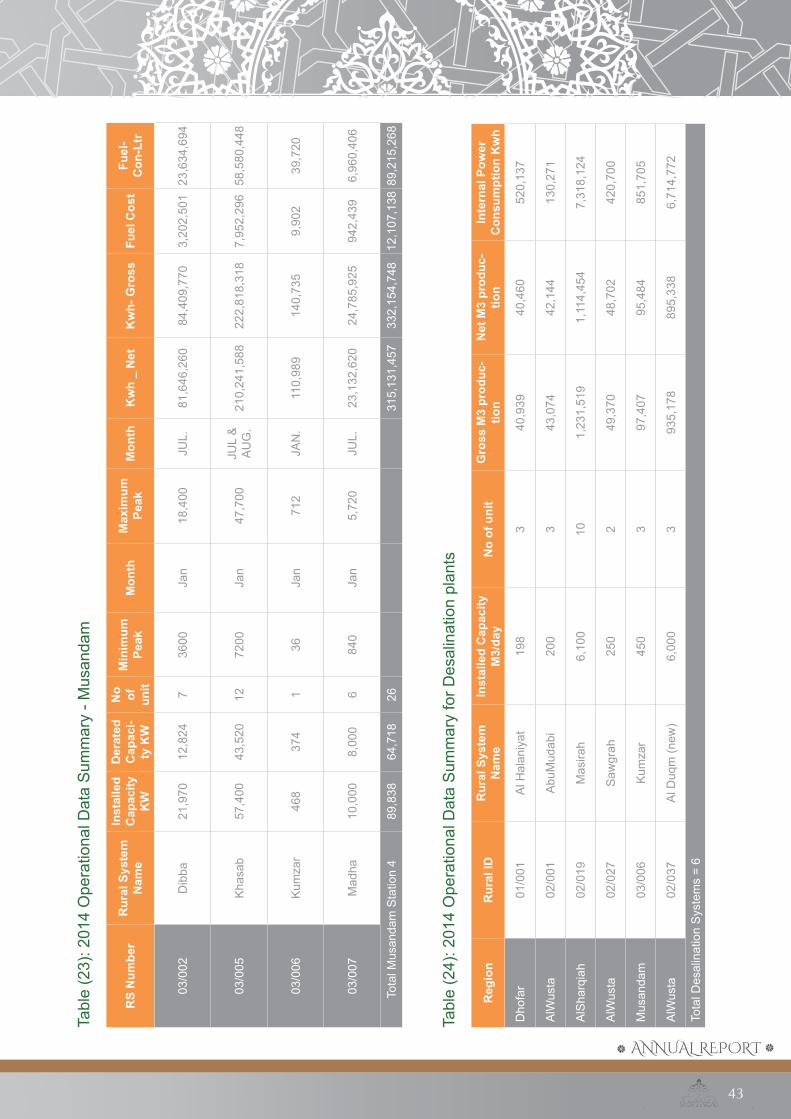
Tabl
e (2
3): 2
014
Ope
ratio
nal D
ata
Sum
mar
y - M
usan
dam
RS
Num
ber
Rur
al S
yste
m
Nam
e
Inst
alle
d C
apac
ity
KW
Der
ated
C
apac
i-ty
KW
No of
unit
Min
imum
Pe
akM
onth
Max
imum
Pe
akM
onth
Kw
h _
Net
Kw
h- G
ross
Fuel
Cos
tFu
el-
Con
-Ltr
03/0
02D
ibba
21,9
7012
,824
736
00Ja
n18
,400
JUL.
81,6
46,2
6084
,409
,770
3,20
2,50
123
,634
,694
03/0
05K
hasa
b57
,400
43,5
2012
7200
Jan
47,7
00JU
L &
A
UG
.21
0,24
1,58
822
2,81
8,31
87,
952,
296
58,5
80,4
48
03/0
06K
umza
r46
837
41
36Ja
n71
2JA
N.
110,
989
140,
735
9,90
239
,720
03/0
07M
adha
10,0
008,
000
684
0Ja
n5,
720
JUL.
23,1
32,6
2024
,785
,925
942,
439
6,96
0,40
6
Tota
l Mus
anda
m S
tatio
n 4
89,8
3864
,718
2631
5,13
1,45
733
2,15
4,74
812
,107
,138
89,2
15,2
68
Tabl
e (2
4): 2
014
Ope
ratio
nal D
ata
Sum
mar
y fo
r Des
alin
atio
n pl
ants
Reg
ion
Rur
al ID
Rur
al S
yste
m
Nam
eIn
stal
led
Cap
acity
M
3/da
yN
o of
uni
tG
ross
M3
prod
uc-
tion
Net
M3
prod
uc-
tion
Inte
rnal
Pow
er
Con
sum
ptio
n K
wh
Dho
far
01/0
01A
l Hal
aniy
at19
83
40,9
3940
,460
520,
137
AlW
usta
02/0
01A
buM
udab
i20
03
43,0
7442
,144
130,
271
AlS
harq
iah
02/0
19M
asira
h6,
100
101,
231,
519
1,11
4,45
47,
318,
124
AlW
usta
02/0
27S
awgr
ah25
02
49,3
7048
,702
420,
700
Mus
anda
m03
/006
Kum
zar
450
397
,407
95,4
8485
1,70
5
AlW
usta
02/0
37A
l Duq
m (n
ew)
6,00
03
935,
178
895,
338
6,71
4,77
2
Tota
l Des
alin
atio
n S
yste
ms
= 6
43

Report & Financial Statementsfor the year ended 31 December 2014

45

46
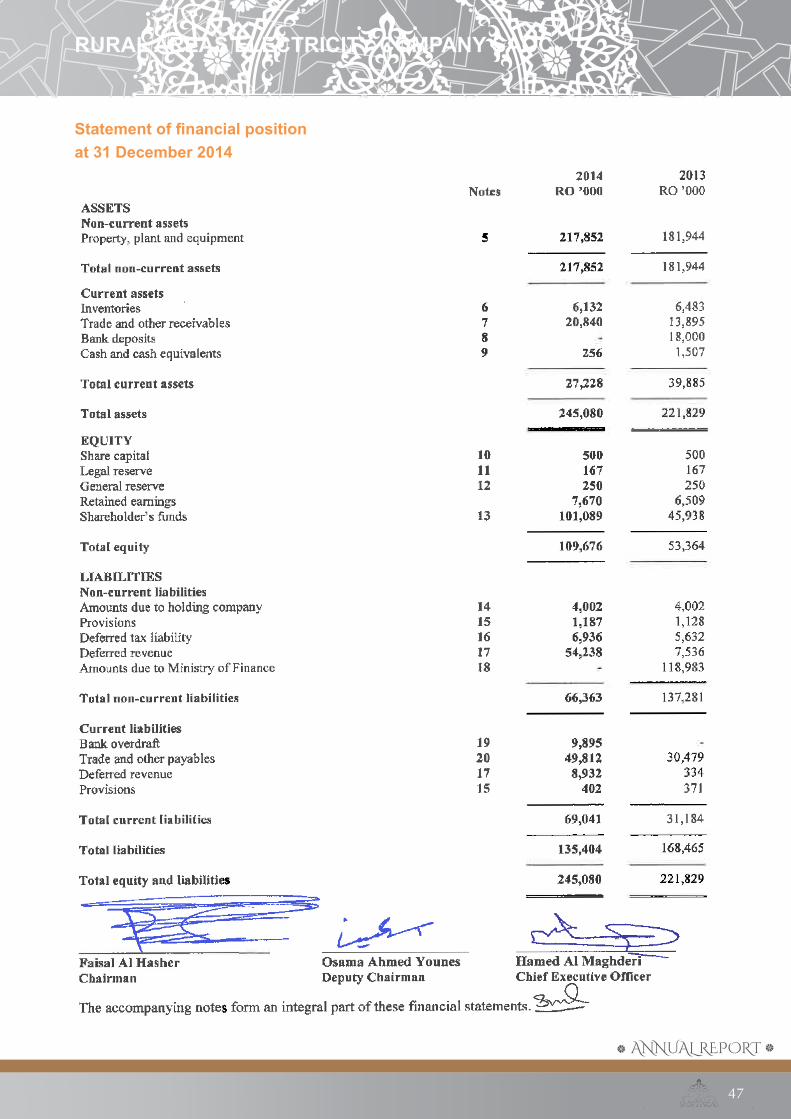
Statement of financial position at 31 December 2014
RURAL AREAS ELECTRICITY COMPANY SAOC
47
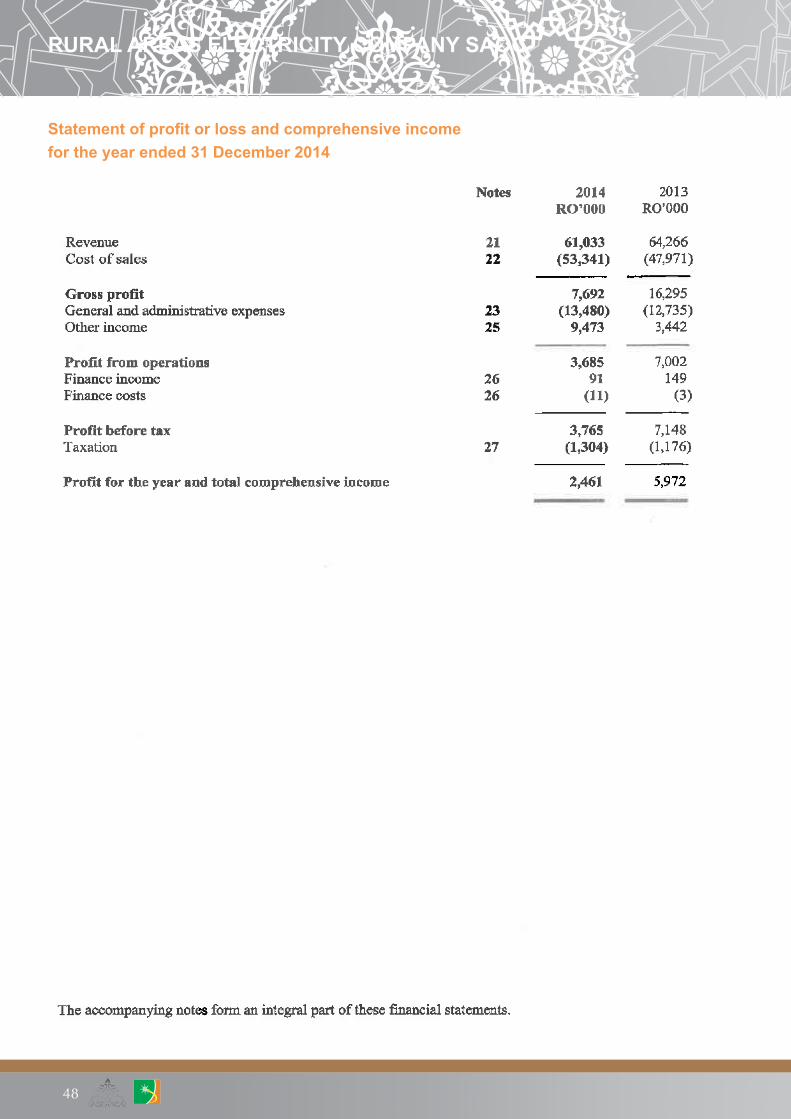
RURAL AREAS ELECTRICITY COMPANY SAOC
Statement of profit or loss and comprehensive incomefor the year ended 31 December 2014
48
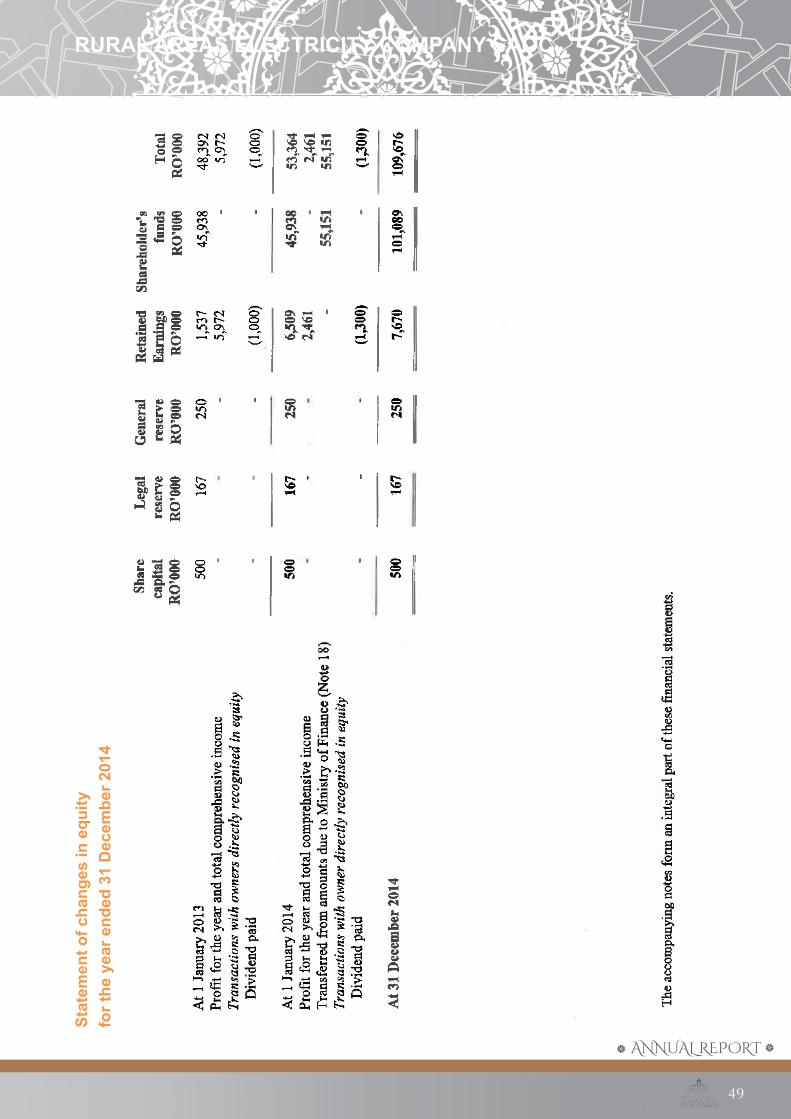
Stat
emen
t of c
hang
es in
equ
ityfo
r the
yea
r end
ed 3
1 D
ecem
ber 2
014
RURAL AREAS ELECTRICITY COMPANY SAOC
49

Statement of cash flows for the year ended 31 December 2014
RURAL AREAS ELECTRICITY COMPANY SAOC
50

Notes to the financial statementsfor the year ended 31 December 2014
RURAL AREAS ELECTRICITY COMPANY SAOC
51

Notes to the financial statementsfor the year ended 31 December 2014 (continued)
RURAL AREAS ELECTRICITY COMPANY SAOC
52

Notes to the financial statementsfor the year ended 31 December 2014 (continued)
RURAL AREAS ELECTRICITY COMPANY SAOC
53

Notes to the financial statementsfor the year ended 31 December 2014 (continued)
RURAL AREAS ELECTRICITY COMPANY SAOC
54
Notes to the financial statementsfor the year ended 31 December 2014 (continued)
RURAL AREAS ELECTRICITY COMPANY SAOC
55

Notes to the financial statementsfor the year ended 31 December 2014 (continued)
RURAL AREAS ELECTRICITY COMPANY SAOC
56

Notes to the financial statementsfor the year ended 31 December 2014 (continued)
RURAL AREAS ELECTRICITY COMPANY SAOC
57

Notes to the financial statementsfor the year ended 31 December 2014 (continued)
RURAL AREAS ELECTRICITY COMPANY SAOC
58
Notes to the financial statementsfor the year ended 31 December 2014 (continued)
RURAL AREAS ELECTRICITY COMPANY SAOC
59

Notes to the financial statementsfor the year ended 31 December 2014 (continued)
RURAL AREAS ELECTRICITY COMPANY SAOC
60

Notes to the financial statementsfor the year ended 31 December 2014 (continued)
RURAL AREAS ELECTRICITY COMPANY SAOC
61

Notes to the financial statementsfor the year ended 31 December 2014 (continued)
RURAL AREAS ELECTRICITY COMPANY SAOC
62

Notes to the financial statementsfor the year ended 31 December 2014 (continued)
RURAL AREAS ELECTRICITY COMPANY SAOC
63

Notes to the financial statementsfor the year ended 31 December 2014 (continued)
RURAL AREAS ELECTRICITY COMPANY SAOC
64

Not
es to
the
finan
cial
sta
tem
ents
for t
he y
ear e
nded
31
Dec
embe
r 201
4 (c
ontin
ued)
RURAL AREAS ELECTRICITY COMPANY SAOC
65

Not
es to
the
finan
cial
sta
tem
ents
for t
he y
ear e
nded
31
Dec
embe
r 201
4 (c
ontin
ued)
RURAL AREAS ELECTRICITY COMPANY SAOC
66
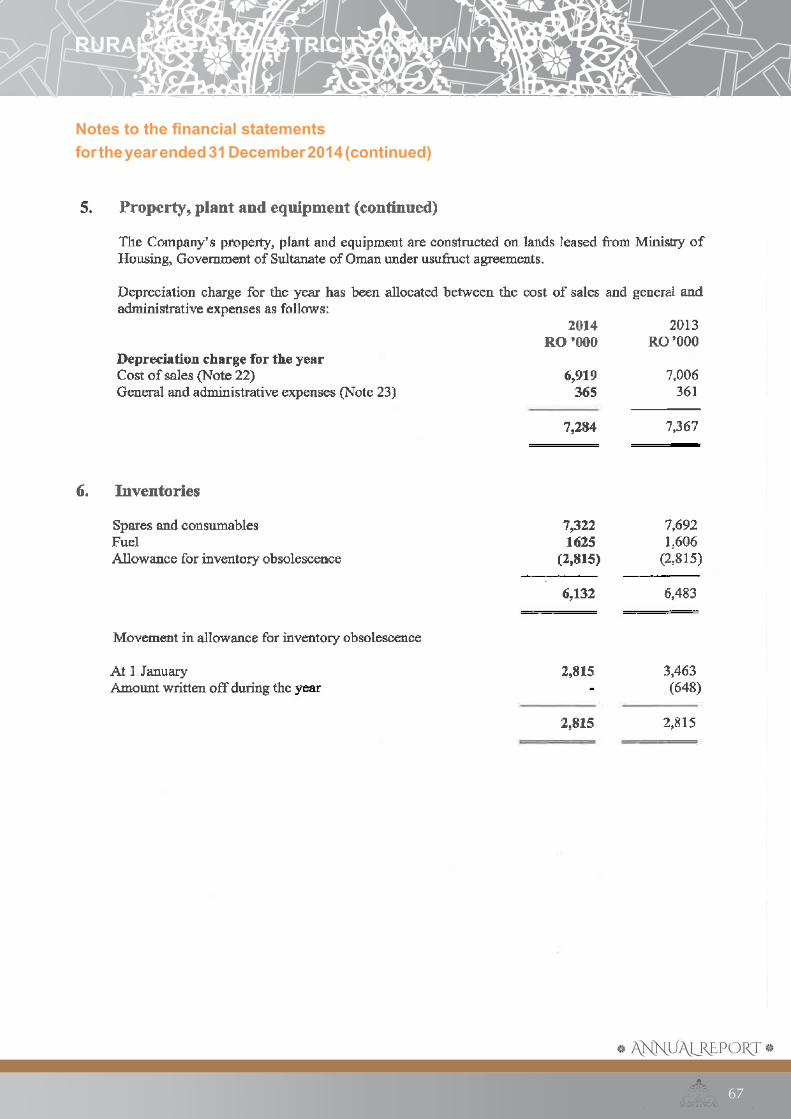
Notes to the financial statementsfor the year ended 31 December 2014 (continued)
RURAL AREAS ELECTRICITY COMPANY SAOC
67

Notes to the financial statementsfor the year ended 31 December 2014 (continued)
RURAL AREAS ELECTRICITY COMPANY SAOC
68

Notes to the financial statementsfor the year ended 31 December 2014 (continued)
RURAL AREAS ELECTRICITY COMPANY SAOC
69

Notes to the financial statementsfor the year ended 31 December 2014 (continued)
RURAL AREAS ELECTRICITY COMPANY SAOC
70

Notes to the financial statementsfor the year ended 31 December 2014 (continued)
RURAL AREAS ELECTRICITY COMPANY SAOC
71
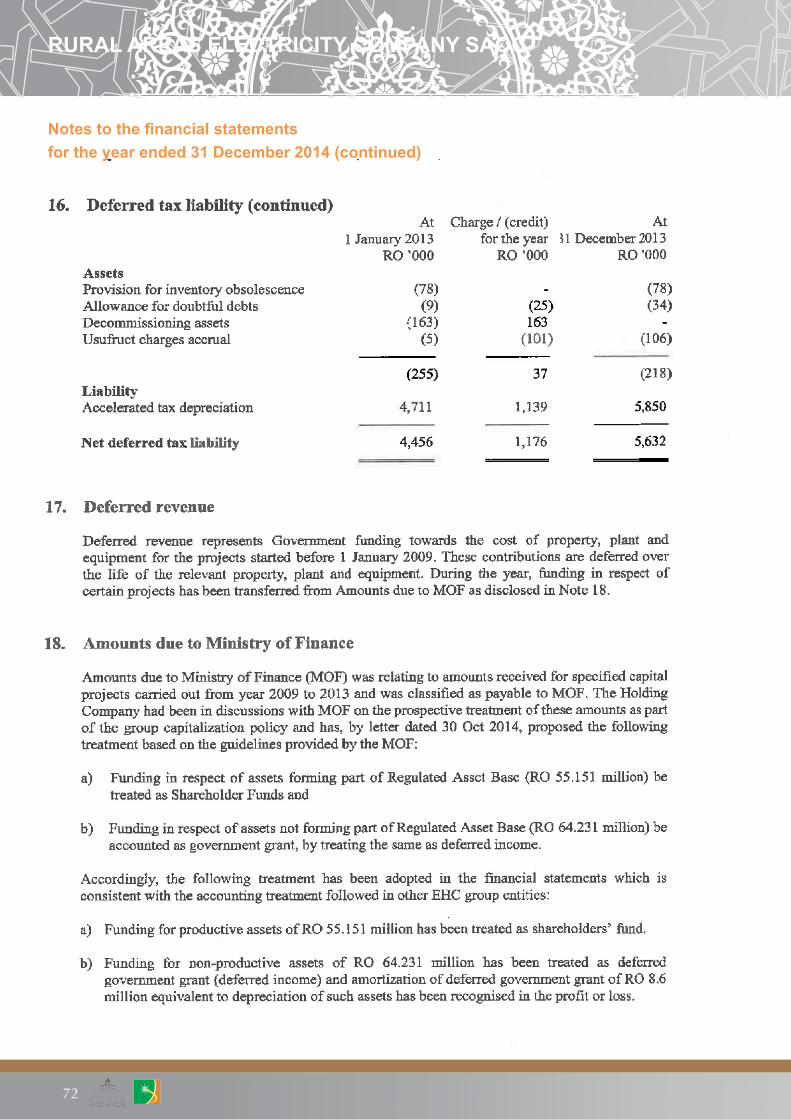
Notes to the financial statementsfor the year ended 31 December 2014 (continued)
RURAL AREAS ELECTRICITY COMPANY SAOC
72

Notes to the financial statementsfor the year ended 31 December 2014 (continued)
RURAL AREAS ELECTRICITY COMPANY SAOC
73

Notes to the financial statementsfor the year ended 31 December 2014 (continued)
RURAL AREAS ELECTRICITY COMPANY SAOC
74

Statement of financial position at 31 December 2014
RURAL AREAS ELECTRICITY COMPANY SAOC
75

Statement of profit or loss and comprehensive incomefor the year ended 31 December 2014
RURAL AREAS ELECTRICITY COMPANY SAOC
76

Notes to the financial statementsfor the year ended 31 December 2014 (continued)
RURAL AREAS ELECTRICITY COMPANY SAOC
77

Notes to the financial statementsfor the year ended 31 December 2014 (continued)
RURAL AREAS ELECTRICITY COMPANY SAOC
78

Notes to the financial statementsfor the year ended 31 December 2014 (continued)
RURAL AREAS ELECTRICITY COMPANY SAOC
79

Notes to the financial statementsfor the year ended 31 December 2014 (continued)
RURAL AREAS ELECTRICITY COMPANY SAOC
80

Notes to the financial statementsfor the year ended 31 December 2014 (continued)
RURAL AREAS ELECTRICITY COMPANY SAOC
81

Notes to the financial statementsfor the year ended 31 December 2014 (continued)
RURAL AREAS ELECTRICITY COMPANY SAOC
82

Notes to the financial statementsfor the year ended 31 December 2014 (continued)
RURAL AREAS ELECTRICITY COMPANY SAOC
83


