
HOUSING SUMMIT 2013HOUSING SUMMIT 2013Thursday 17 October 2013Thursday 17 October 2013
The Mortgage and Housing MarketsThe Mortgage and Housing Markets
Adrian Coles
Director-General
The Building Societies Association
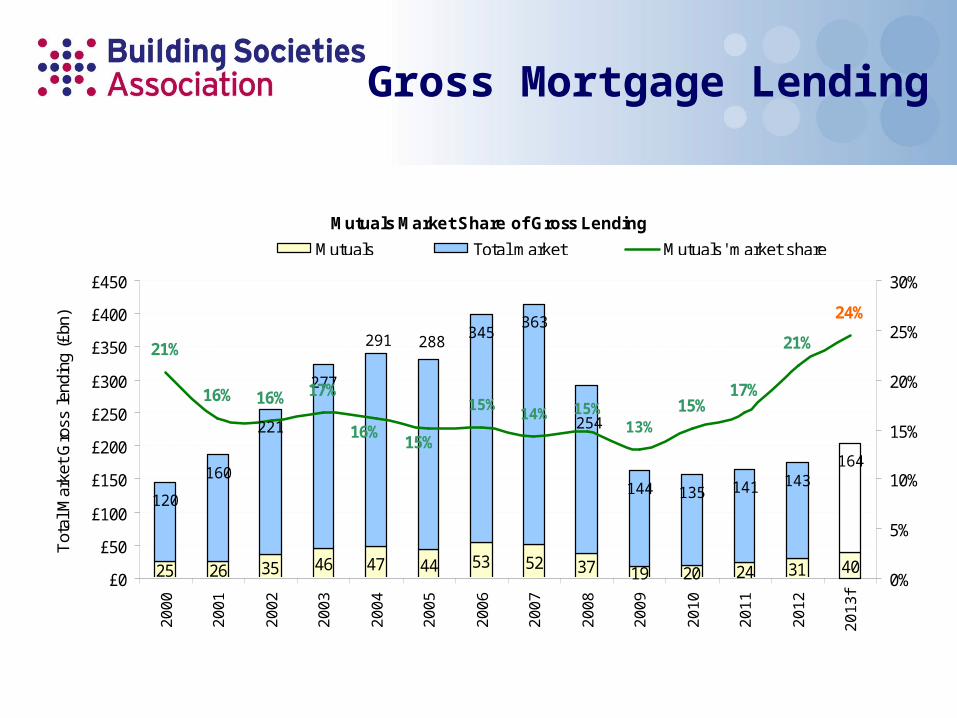
Gross Mortgage Lending
Mutuals Market Share of Gross Lending
25 26 35 46 47 44 53 52 37 19 20 24 31 40
135 141 143164
363
254
120
160
221
277
291 288345
144
15%17%
21%
24%
15%13%
14%
15%
17%16%16%
21%
15%
16%
£0
£50
£100
£150
£200
£250
£300
£350
£400
£450
20
00
20
01
20
02
20
03
20
04
20
05
20
06
20
07
20
08
20
09
20
10
20
11
20
12
20
13
f
Tot
al M
arke
t G
ross
lend
ing
(£bn
)
0%
5%
10%
15%
20%
25%
30%
Mutuals Total market Mutuals' market share
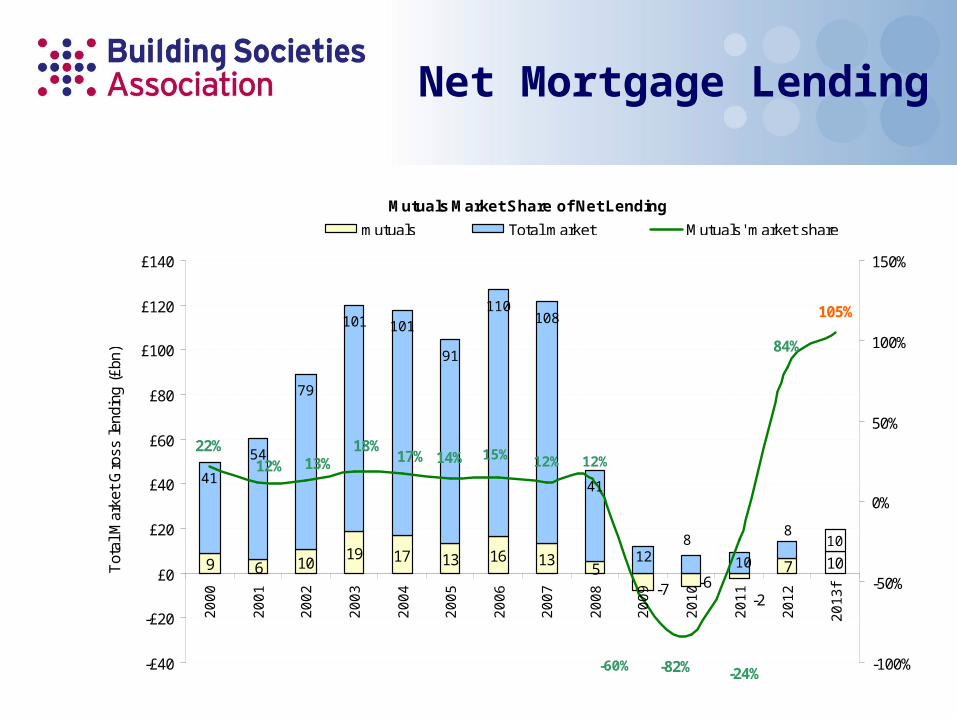
Net Mortgage Lending
Mutuals Market Share of Net Lending
9 6 1019 17 13 16 13
5 7 10
-2-6-7
108
108
4141
54
79
101 101
91
110
12 10
8
84%
105%
12%
-60%
12%14%18%
13%12%22%
15%17%
-82% -24%-£40
-£20
£0
£20
£40
£60
£80
£100
£120
£140
20
00
20
01
20
02
20
03
20
04
20
05
20
06
20
07
20
08
20
09
20
10
20
11
20
12
20
13
f
Tot
al M
arke
t G
ross
lend
ing
(£bn
)
-100%
-50%
0%
50%
100%
150%
mutuals Total market Mutuals' market share

Net lending by institutions participating in the Funding for Lending Scheme (£bn) July 2012 - June 2013
£11.3
-£13.6
-£15.0
-£10.0
-£5.0
£0.0
£5.0
£10.0
£15.0
Mutuals Other Lenders
Funding for Lending Scheme

90%+ LTV loans by mutuals Jan-Aug in each year
-
5,000
10,000
15,000
20,000
25,000
30,000
35,000
40,000
45,000
50,000
2006 2007 2008 2009 2010 2011 2012 2013
0%
2%
4%
6%
8%
10%
12%
14%
16%Number of loans
Proportion of all loans
BSA
High LTV Lending by Mutuals
Help to Buy: Mortgage Guarantees – Issues for
Lenders
• Cost• Complexity• Certainty (of continuation of scheme)• Existing market relationships• Business model• Capital relief – PRA – sound underwriting – safety of
institutions• Consumer understanding of costs and benefits – FCA –
safety of consumers• Other regulatory priorities – eg MMR, ring-fencing
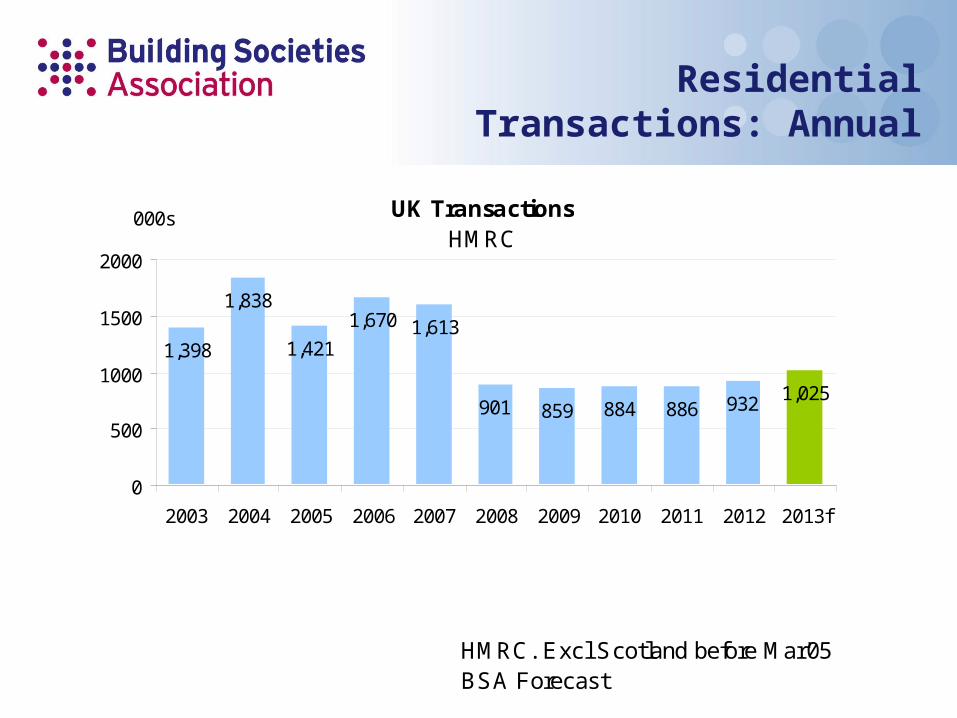
UK TransactionsHMRC
1,398
1,838
1,421
1,670 1,613
901 859 884 886 932 1,025
0
500
1000
1500
2000
2003 2004 2005 2006 2007 2008 2009 2010 2011 2012 2013f
000s
HMRC. Excl Scotland before Mar'05BSA Forecast
Residential Transactions: Annual
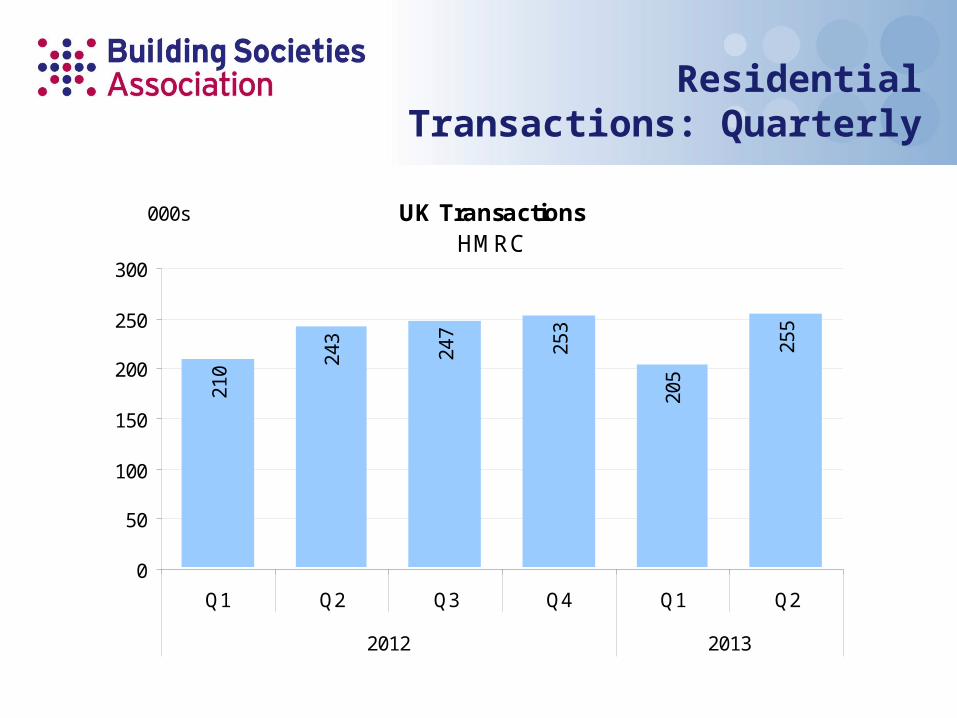
UK TransactionsHMRC
210 24
3
247
253
205
255
0
50
100
150
200
250
300
Q1 Q2 Q3 Q4 Q1 Q2
2012 2013
000s
Residential Transactions: Quarterly
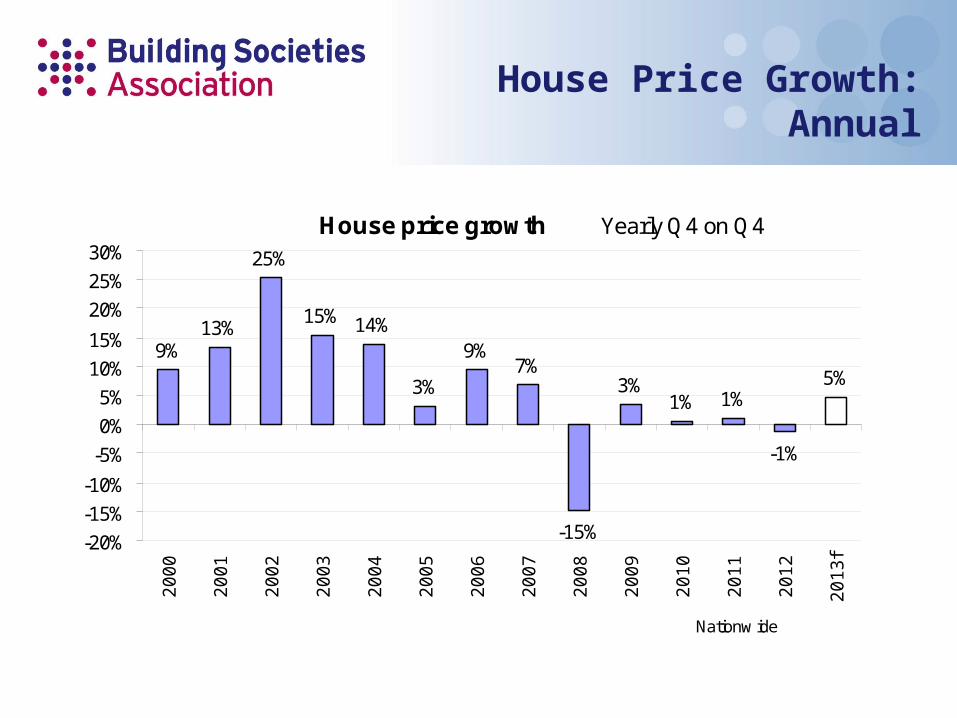
House Price Growth: Annual
House price growth Yearly Q4 on Q4
9%13%
25%
15% 14%
3%
9%7%
-15%
3%1% 1%
-1%
5%
-20%
-15%
-10%
-5%
0%
5%
10%
15%
20%
25%
30%
20
00
20
01
20
02
20
03
20
04
20
05
20
06
20
07
20
08
20
09
20
10
20
11
20
12
20
13
f
Nationw ide
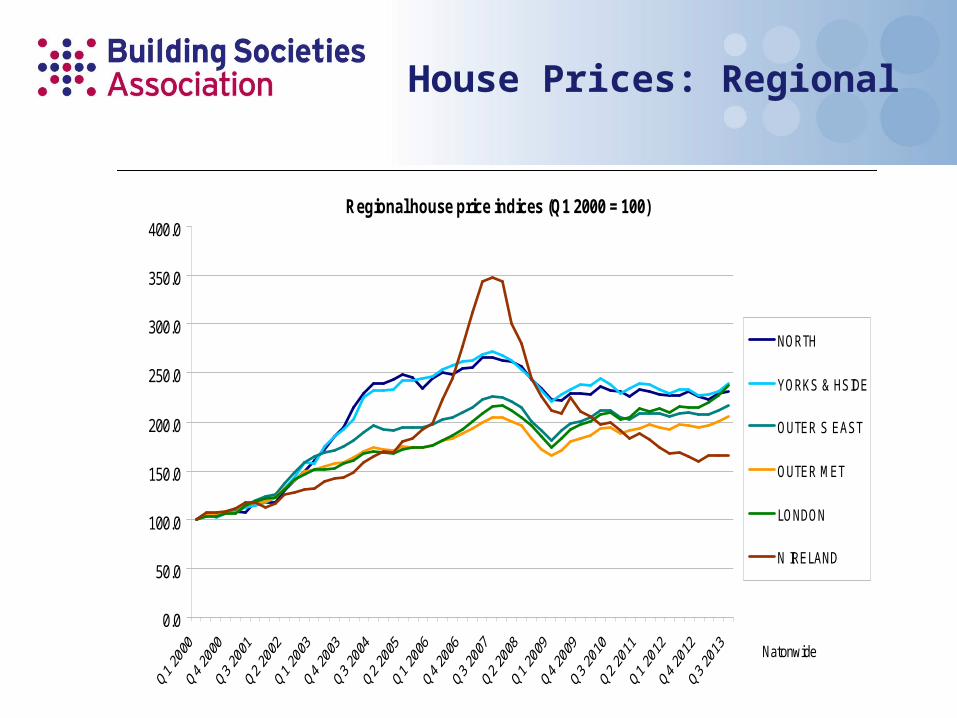
Regional house price indices (Q1 2000 = 100)
0.0
50.0
100.0
150.0
200.0
250.0
300.0
350.0
400.0
NORTH
YORKS & HSIDE
OUTER S EAST
OUTER MET
LONDON
N IRELAND
Natonwide
House Prices: Regional
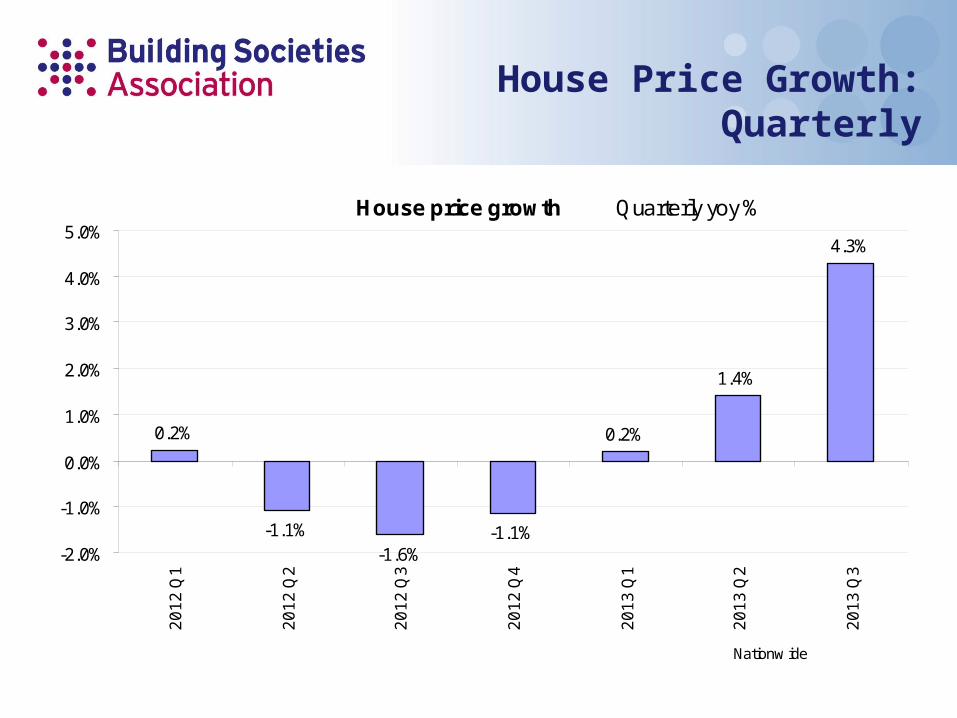
House price growth Quarterly yoy %
0.2%
-1.1%-1.6%
-1.1%
0.2%
1.4%
4.3%
-2.0%
-1.0%
0.0%
1.0%
2.0%
3.0%
4.0%
5.0%
20
12
Q1
20
12
Q2
20
12
Q3
20
12
Q4
20
13
Q1
20
13
Q2
20
13
Q3
Nationw ide
House Price Growth: Quarterly
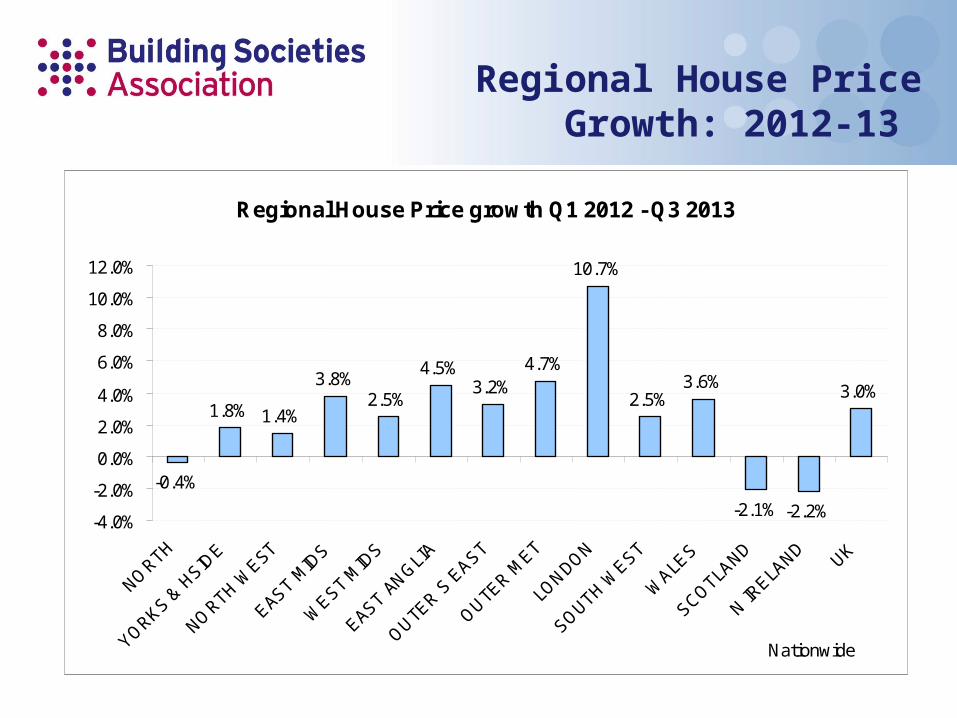
Regional House Price growth Q1 2012 - Q3 2013
-0.4%
1.8% 1.4%
3.8%2.5%
4.5%3.2%
4.7%
10.7%
2.5%3.6%
-2.1% -2.2%
3.0%
-4.0%
-2.0%
0.0%
2.0%
4.0%
6.0%
8.0%
10.0%
12.0%
NORTH
YORKS & H
SIDE
NORTH W
EST
EAST MID
S
WEST M
IDS
EAST ANGLI
A
OUTER S
EAST
OUTER M
ET
LONDON
SOUTH WEST
WALE
S
SCOTLAND
N IRELA
NDUK
Nationwide
Regional House Price Growth: 2012-13

Real House Prices
£40,000£60,000£80,000
£100,000£120,000£140,000£160,000£180,000£200,000£220,000£240,000
2000
Q1
2002
Q1
2004
Q1
2006
Q1
2008
Q1
2010
Q1
2012
Q1
Trend Real House Price
Nationwide Building Society
Real House Prices
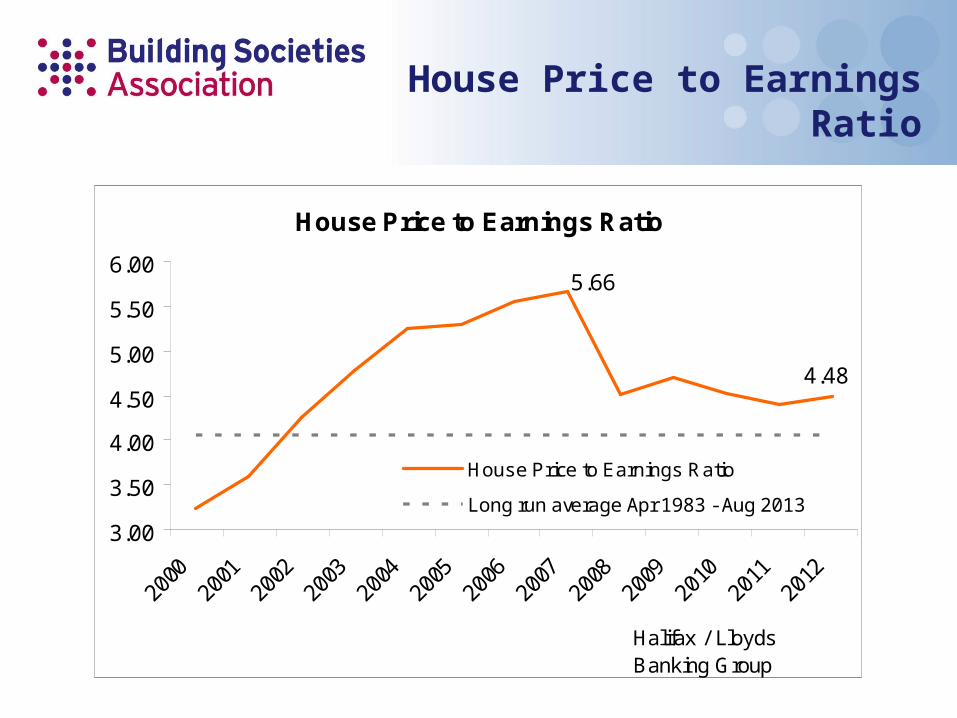
House Price to Earnings Ratio
5.66
4.48
3.00
3.50
4.00
4.50
5.00
5.50
6.00
2000
2001
2002
2003
2004
2005
2006
2007
2008
2009
2010
2011
2012
House Price to Earnings Ratio
Long run average Apr 1983 - Aug 2013
Halifax / Lloyds Banking Group
House Price to Earnings Ratio

Mortgage payments as % of Income
16.8
21.1
23.5
18.3
10.0
12.0
14.0
16.0
18.0
20.0
22.0
24.0
26.0
2000 2001 2002 2003 2004 2005 2006 2007 2008 2009 2010 2011 2012
%
All buyers First-time buyers
ONS
Mortgage Payments as % of Income
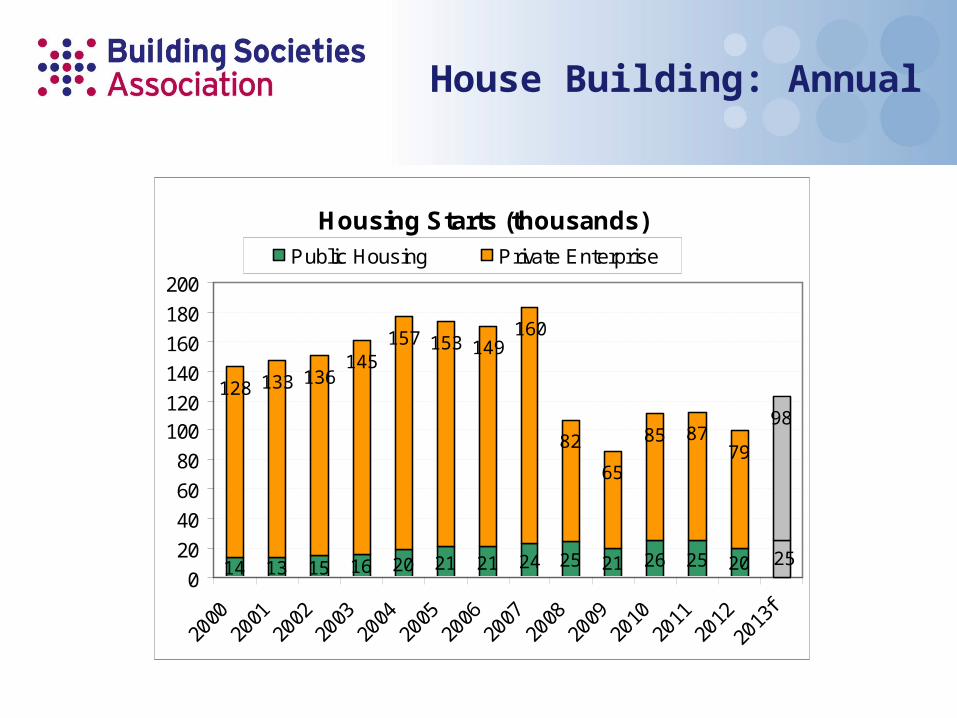
Housing Starts (thousands)
14 13 15 16 20 21 21 24 25 21 25 20
128 133 136145
157 153 149160
82
65
85 8779
98
25260
20
40
60
80
100120
140
160
180
200
2000
2001
2002
2003
2004
2005
2006
2007
2008
2009
2010
2011
2012
2013
f
Public Housing Private Enterprise
House Building: Annual

Housing Starts (thousands)
5 5 6 5 5 6
20 2022
1722
27
0
5
10
15
20
25
30
35
2012 Q1 Q2 Q3 Q4 2013 Q1 Q2
Public Housing Private Enterprise
House Building: Quarterly
The FPC View – 18 September 2013
"... the recovery in the housing market appeared to have
gained momentum and to be broadening. Mortgage approvals
in July were 30% higher than a year earlier and average
house prices in August were 5% higher than a year earlier and
had risen more in some parts of the country, particularly
London. Nevertheless, activity in the housing market and loan-
to-value ratios on new mortgage lending remained below their
historic averages. Households’ debt servicing costs were low
and the ratio of house prices to earnings was at its level of a
decade ago. In view of that, the Committee judged that it
should closely monitor developments in the housing market
and banks' underwriting standards….
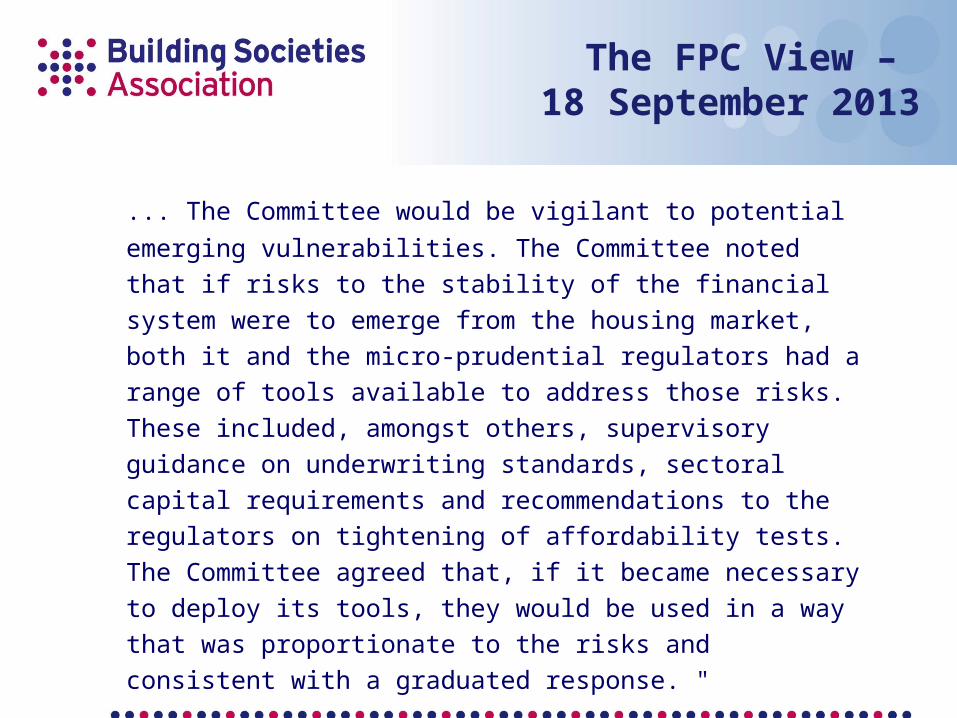
The FPC View – 18 September 2013
... The Committee would be vigilant to potential emerging
vulnerabilities. The Committee noted that if risks to the stability
of the financial system were to emerge from the housing
market, both it and the micro-prudential regulators had a
range of tools available to address those risks. These
included, amongst others, supervisory guidance on
underwriting standards, sectoral capital requirements and
recommendations to the regulators on tightening of
affordability tests. The Committee agreed that, if it became
necessary to deploy its tools, they would be used in a way that
was proportionate to the risks and consistent with a graduated
response. "
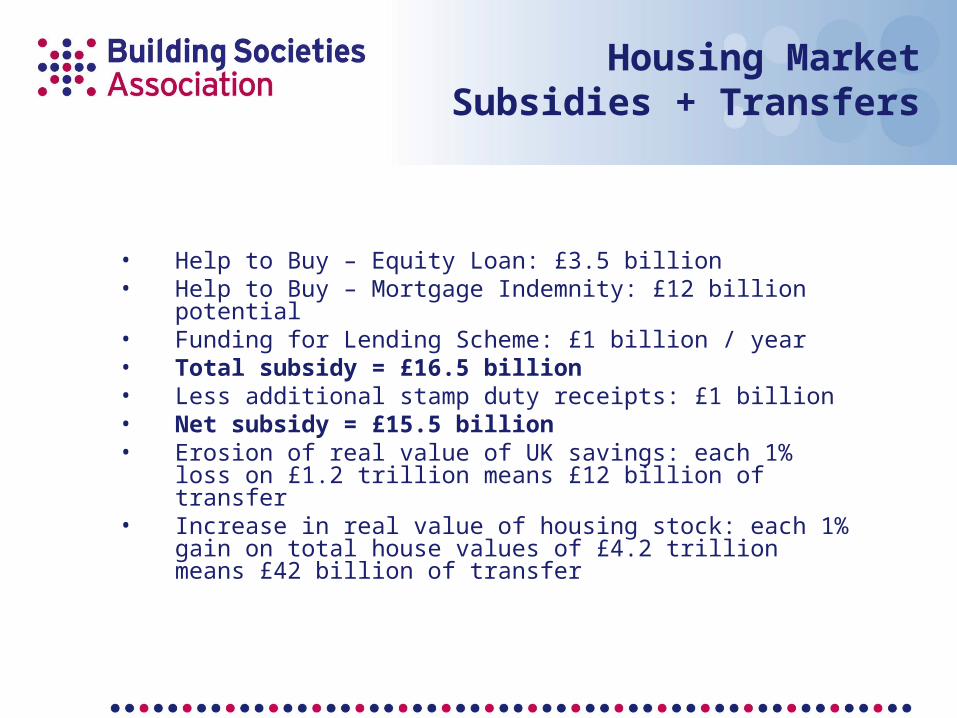
Housing Market Subsidies + Transfers
• Help to Buy – Equity Loan: £3.5 billion• Help to Buy – Mortgage Indemnity: £12 billion potential• Funding for Lending Scheme: £1 billion / year• Total subsidy = £16.5 billion• Less additional stamp duty receipts: £1 billion• Net subsidy = £15.5 billion• Erosion of real value of UK savings: each 1% loss on
£1.2 trillion means £12 billion of transfer• Increase in real value of housing stock: each 1% gain on
total house values of £4.2 trillion means £42 billion of transfer

Housing market subsidies from….to….
• Savers to borrowers (old to young) – low interest rates.
• Home buyers to home sellers (young to old) – rising house prices
• To house builders – higher prices and activity• To lenders – wider margins and more loans• To transactional agents• Borrowers to tax-payer – or the reverse?• Overall beneficiaries are?

HOUSING SUMMIT 2013HOUSING SUMMIT 2013Thursday 17 October 2013Thursday 17 October 2013
The Mortgage and Housing MarketsThe Mortgage and Housing Markets
Adrian Coles
Director-General
The Building Societies Association


