
Driving Enterprise Decisions with ArcGIS Online
How to Become a Superstar
for Your Utility in 2 Weeks

Bill Meehan
Utility Solutions Director
Esri
Nathaniel Everett
GIS Technical Lead
Middle Tennessee EMC
Skye Perry
Founder & President
SSP Innovations


We All Use Maps


GIS is a “System of Record” Organizing and managing the geographic
context of your assets and resources

Is your authoritative knowledge
reaching everyone?


Modern platforms…
• Respect identity
• Work on any device
• Leverage external data
• Share data to other platforms
• Allow consumers to also be providers of
information
• Are always on
• Scale automatically
• Have security built-in
• Enable hybrid deployments to ease transition

The Nexus and GIS

Desktop Web Device
Server
Online Content
and Services
Portal

We All Use Maps

A New Way Forward – You can be the Superstar

Hero holding slide


Who is SSP
Focus on Electric, Gas, Water, & Fiber
Utilities
Telecom
GIS Services
Product Implementation
Customization
Systems Integration
Skye Perry
Founder & Principal Consultant
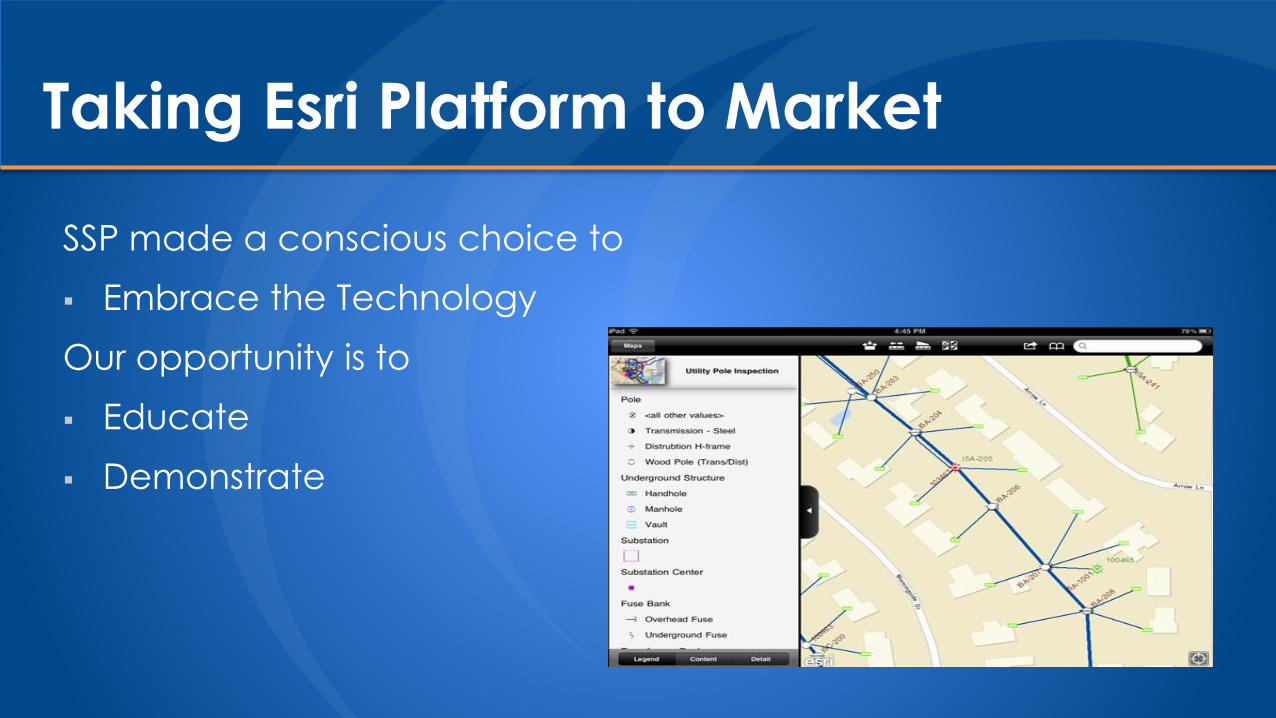
Taking Esri Platform to Market
SSP made a conscious choice to
Embrace the Technology
Our opportunity is to
Educate
Demonstrate

SSP Platform Value Drivers
ArcGIS Online / Portal Initial Operating Capacity
Use Cases
Organization
Configuration
Security
Solve Workflow & Business Challenges
Utilize Industry Knowledge
Enable Existing Offerings

Why a GIS Superstar?

Becoming a GIS Superstar Isn’t Hard
Portal is the key exposure point for the platform.
Lowercase “portal” implies ArcGIS Online
Uppercase “Portal” implies Portal for ArcGIS
The same result will enable traditional GIS in new, powerful ways
How can utilities take their first steps with portal?
Expose New Data to the utility
Collect New Data from the utility
Empower the utility thru Geoprocessing, Systems Integration, Workflow, & Reporting

Expose, Collect, Empower How?
Middle Tennessee Electric is here to tell us about their catalyst project…
Find Your Pattern and Use it as a Catalyst for Platform
Choose a single pattern that will add value
Use it to have all the infrastructure enabled
You will then have the power of platform at your fingertips
SSP has implemented patterns at utilities/telcos across the country
We’ll provide several ideas at the end of the presentation

Introductions
Nathaniel Everett | Middle Tennessee EMC
• GIS Technical Lead
• Covers ArcGIS / ArcFM / Designer
• Information Services Department

Business Drivers
Transformer Failures Occur Regularly
Troubleshooter assesses transformer in the field
Transformers are replaced
Often up-sized to handle an overloaded scenario
(25 kVA to 37.5 kVA)
Data is not available to see consumption / loading information
Result
Inefficiencies in Network
Cost Impact

Business Drivers
Engineering Asked For Help
Desire to utilize consumption data to determine transformer sizing
Provided an Example Report that would help
Provided all Engineering Calculations

Business Challenges
No DB relationship between Service Location & Transformer
Network Traceable Relationship in GIS
SAP CIS Consumption Data Not Available in GIS
Current Monthly Reads, Use with AMI in the Future
How Best to Expose Reports & Map to users

Current Data ModelApril 24, 2014
Page 1
Service Point
Service Location
Device Location
Meter
Service Point
Service Location
Device Location
Meter
Service Point
Service Location
Device Location
Meter
Transformer
Standard 3 House Scenario
Live Example Data
Live Example Data
Live Example Data
Single House
House
Service Location
Device Location
Meter
Solar Panels (GenPart)
Service Location
Device Location
Meter
Barn
SAP Data Table

The Solution
Engaged with SSP Innovations to Design and Develop
SSP is the in house Esri / Schneider Electric support vendor
SSP & MTEMC Broke the Effort into Three Phases:
1. Establish Maintainable Relationships from Xfr to Service
2. CIS Consumption Load & Aggregation
3. Reporting & Visualization

Phase 1 – Xfr to Service
Schema changes on Service Point
Track Xfr Company Number By Phase
Initial script to establish relationships
Trace via Electric Network
SQL Script to Not Impact Versioning Performance
AutoUpdaters to maintain relationship
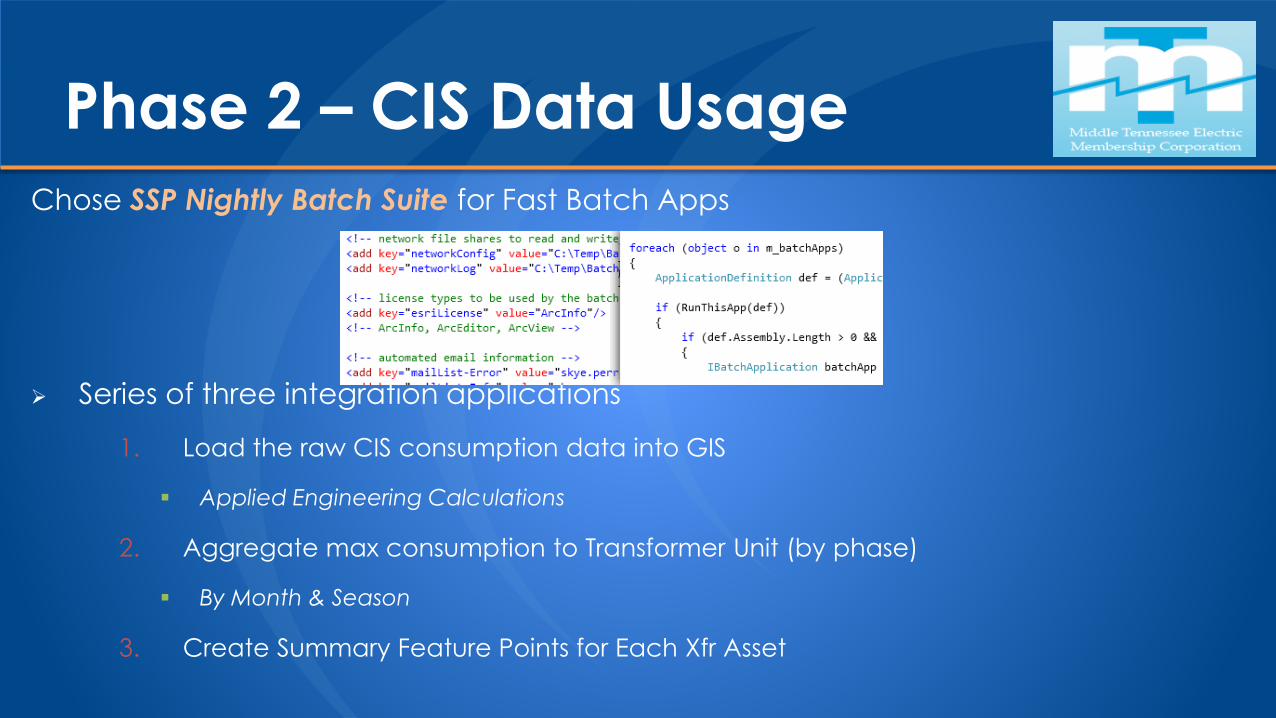
Phase 2 – CIS Data Usage
Chose SSP Nightly Batch Suite for Fast Batch Apps
Series of three integration applications
1. Load the raw CIS consumption data into GIS
Applied Engineering Calculations
2. Aggregate max consumption to Transformer Unit (by phase)
By Month & Season
3. Create Summary Feature Points for Each Xfr Asset

Phase 2 – CIS Aggregation
Three Phase Aggregation

Phase 3 – Reporting
Utilized SQL Server Reporting Services
Out of the Box Web Reports
Provided Query Screen to Engineers:

Phase 3 – Reporting
Three Level Report – Level 1 Shows Transformer Unit

Phase 3 – Reporting
Three Level Report –
Level 2 Shows Adjusted Meter Consumption

Phase 3 – Visualization
Utilized ArcGIS Online –
Created Thematic Map Showing Xfr Load vs. Capacity

Phase 3 – Visualization
Exposed via ArcGIS Online as a WebMap
Troubleshooter uses their phone or tablet
when they arrive on scene
Zoom via GPS in the device
View transformer loading data by color
Click any transformer to view details
Demo…


Business Benefits
Operations
Empowered Engineers & Troubleshooters with New Data
Provided Real Time Data Access in field from ANY Device
Allows for educated decision making
Engineering Can Review Existing Xfr Installs Against Usage
May reallocate network
Net Result is Cost Savings, Better Efficiency,
& System Awareness

Business Benefits
IT / GIS
Demonstrated capabilities of ArcGIS Online
Have fully functioning DMZ / internal ArcGIS Server architecture
Ready for additional data publishing, editing, and collection via
ArcGIS Online
Includes Active Directory Authentication and SSL (https)
Will Allow for Other Patterns to be Implemented
Quickly & Easily

SSP Client Success Stories
MLGWMeter Data Collection
Hart EMCField Asset Inspection
Energy UnitedWeb Viewer Replacement
Automatically Targeted
Field Inspections
App for collecting Pole, Xfr, Meter, SW Inspections
Workflow for generating
follow up WO’s for failures
Field App for GPS, Data,
Image Capture
Data feeds to ArcFM GIS and CIS
Reporting/Tracking for
Management
Was utilizing an outdated
custom ArcIMS app
Web AppBuilder to create new web viewing apps
Basic data collection for
field redlines

SSP Client Success Stories
NsightTelecom Data Collection
Large City TelecomConduit Tracking App
Burbank Water & PowerWeb Outage Map
New enterprise GIS
installation
ArcGIS Server and Portal expose the data
Allows new internal app
development
No previous GIS in place,
manual as-builts used
New telecom data captured in ArcGIS Online
Data loaded from addt’l
purchased telcos
Expose power outage
areas via web
Utilize existing Responder outage data
Provide easy ETR
messaging for the public

Expose, Collect, Empower GIS Superstar
Find Your Pattern and Use it as a Catalyst for Platform
Implement the platform infrastructure
Use best practices for exposing existing data
Implement recommended security patterns
Do it right the first time
Two weeks on average
Use Esri Platform to Allow GIS to become a System of Engagement!

Questions?
Skye Perry
Principal Consultant
SSP Innovations
Nathaniel Everett
GIS Technical Lead
Middle Tennessee EMC
Bill Meehan
Utility Solutions Director
Esri


