
HUD Median Income for Fiscal Year 2013
Virginia State Median Income: $76,900.00 Effective Date: 12/4/2012 *30%: Extremely Low-Income | 50%: Very Low-Income | 80%: Low-Income
Accomack County
MSA: NonMetro Median Income: $52,900.00
Click on a column header for sorting.
Percentage One Two Three Four Five Six Seven Eight
30% $11,100.00 $12,700.00 $14,300.00 $15,850.00 $17,150.00 $18,400.00 $19,700.00 $20,950.00
40% $14,840.00 $16,960.00 $19,080.00 $21,160.00 $22,880.00 $24,560.00 $26,240.00 $27,960.00
50% $18,550.00 $21,200.00 $23,850.00 $26,450.00 $28,600.00 $30,700.00 $32,800.00 $34,950.00
60% $22,260.00 $25,440.00 $28,620.00 $31,740.00 $34,320.00 $36,840.00 $39,360.00 $41,940.00
80% $29,650.00 $33,850.00 $38,100.00 $42,300.00 $45,700.00 $49,100.00 $52,500.00 $55,850.00
Non-Adjusted Income Limits for Accomack County
Percentage: 50% 80% 100% 150%
Income: $26,450.00 $42,320.00 $52,900.00 $79,350.00
Albemarle County
MSA: Charlottesville Median Income: $77,500.00
Click on a column header for sorting.
Percentage One Two Three Four Five Six Seven Eight
30% $16,300.00 $18,600.00 $20,950.00 $23,250.00 $25,150.00 $27,000.00 $28,850.00 $30,700.00

40% $21,720.00 $24,800.00 $27,920.00 $31,000.00 $33,480.00 $35,960.00 $38,440.00 $40,920.00
50% $27,150.00 $31,000.00 $34,900.00 $38,750.00 $41,850.00 $44,950.00 $48,050.00 $51,150.00
60% $32,580.00 $37,200.00 $41,880.00 $46,500.00 $50,220.00 $53,940.00 $57,660.00 $61,380.00
80% $43,400.00 $49,600.00 $55,800.00 $62,000.00 $67,000.00 $71,950.00 $76,900.00 $81,850.00
Non-Adjusted Income Limits for Albemarle County
Percentage: 50% 80% 100% 150%
Income: $38,750.00 $62,000.00 $77,500.00 $116,250.00
Alexandria City
MSA: Northern Virginia Median Income: $107,300.00
Click on a column header for sorting.
Percentage One Two Three Four Five Six Seven Eight
30% $22,550.00 $25,800.00 $29,000.00 $32,200.00 $34,800.00 $37,400.00 $39,950.00 $42,550.00
40% $30,080.00 $34,360.00 $38,640.00 $42,920.00 $46,360.00 $49,800.00 $53,240.00 $56,680.00
50% $37,600.00 $42,950.00 $48,300.00 $53,650.00 $57,950.00 $62,250.00 $66,550.00 $70,850.00
60% $45,120.00 $51,540.00 $57,960.00 $64,380.00 $69,540.00 $74,700.00 $79,860.00 $85,020.00
80% $46,750.00 $53,400.00 $60,100.00 $66,750.00 $72,100.00 $77,450.00 $82,800.00 $88,150.00
Non-Adjusted Income Limits for Alexandria City
Percentage: 50% 80% 100% 150%
Income: $53,650.00 $85,840.00 $107,300.00 $160,950.00

Alleghany County
MSA: Non-Metropolitan Median Income: $54,800.00
Click on a column header for sorting.
Percentage One Two Three Four Five Six Seven Eight
30% $11,550.00 $13,200.00 $14,850.00 $16,450.00 $17,800.00 $19,100.00 $20,400.00 $21,750.00
40% $15,360.00 $17,560.00 $19,760.00 $21,920.00 $23,680.00 $25,440.00 $27,200.00 $28,960.00
50% $19,200.00 $21,950.00 $24,700.00 $27,400.00 $29,600.00 $31,800.00 $34,000.00 $36,200.00
60% $23,040.00 $26,340.00 $29,640.00 $32,880.00 $35,520.00 $38,160.00 $40,800.00 $43,440.00
80% $30,700.00 $35,100.00 $39,500.00 $43,850.00 $47,400.00 $50,900.00 $54,400.00 $57,900.00
Non-Adjusted Income Limits for Alleghany County
Percentage: 50% 80% 100% 150%
Income: $27,400.00 $43,840.00 $54,800.00 $82,200.00
Amelia County
MSA: Richmond Median Income: $73,900.00
Click on a column header for sorting.
Percentage One Two Three Four Five Six Seven Eight
30% $15,550.00 $17,750.00 $19,950.00 $22,150.00 $23,950.00 $25,700.00 $27,500.00 $29,250.00
40% $20,720.00 $23,680.00 $26,640.00 $29,560.00 $31,960.00 $34,320.00 $36,680.00 $39,040.00
50% $25,900.00 $29,600.00 $33,300.00 $36,950.00 $39,950.00 $42,900.00 $45,850.00 $48,800.00
60% $31,080.00 $35,520.00 $39,960.00 $44,340.00 $47,940.00 $51,480.00 $55,020.00 $58,560.00
80% $41,400.00 $47,300.00 $53,200.00 $59,100.00 $63,850.00 $68,600.00 $73,300.00 $78,050.00
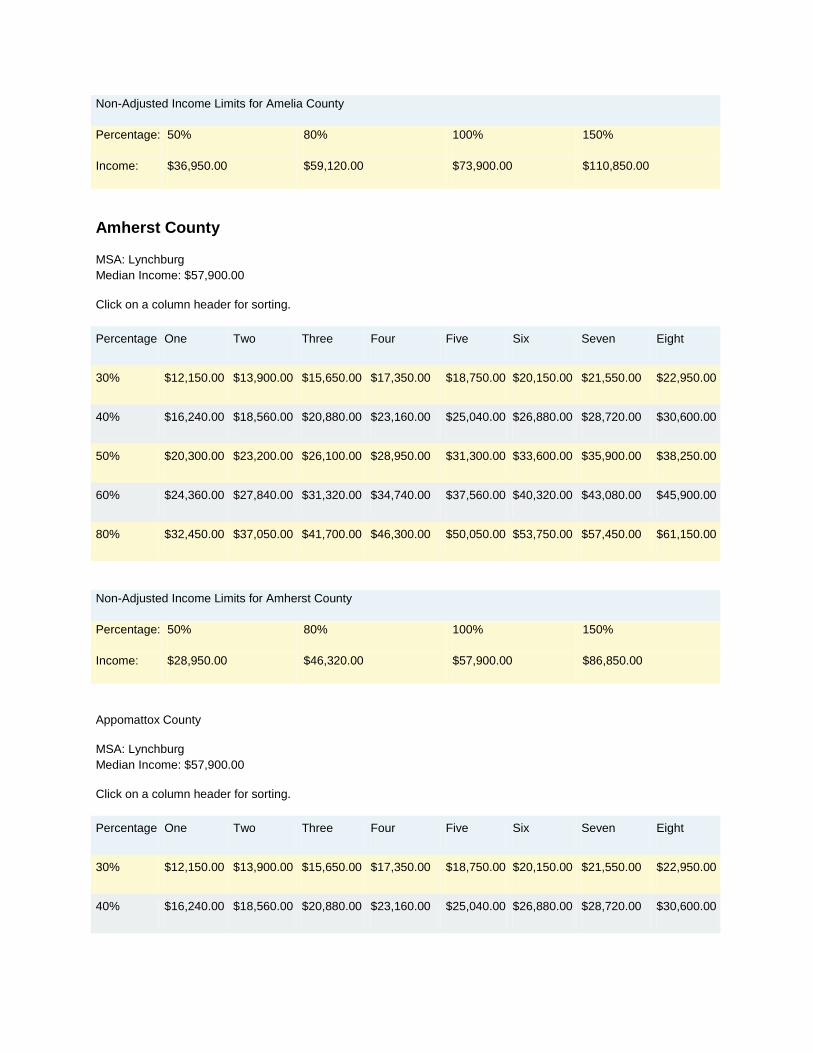
Non-Adjusted Income Limits for Amelia County
Percentage: 50% 80% 100% 150%
Income: $36,950.00 $59,120.00 $73,900.00 $110,850.00
Amherst County
MSA: Lynchburg Median Income: $57,900.00
Click on a column header for sorting.
Percentage One Two Three Four Five Six Seven Eight
30% $12,150.00 $13,900.00 $15,650.00 $17,350.00 $18,750.00 $20,150.00 $21,550.00 $22,950.00
40% $16,240.00 $18,560.00 $20,880.00 $23,160.00 $25,040.00 $26,880.00 $28,720.00 $30,600.00
50% $20,300.00 $23,200.00 $26,100.00 $28,950.00 $31,300.00 $33,600.00 $35,900.00 $38,250.00
60% $24,360.00 $27,840.00 $31,320.00 $34,740.00 $37,560.00 $40,320.00 $43,080.00 $45,900.00
80% $32,450.00 $37,050.00 $41,700.00 $46,300.00 $50,050.00 $53,750.00 $57,450.00 $61,150.00
Non-Adjusted Income Limits for Amherst County
Percentage: 50% 80% 100% 150%
Income: $28,950.00 $46,320.00 $57,900.00 $86,850.00
Appomattox County
MSA: Lynchburg Median Income: $57,900.00
Click on a column header for sorting.
Percentage One Two Three Four Five Six Seven Eight
30% $12,150.00 $13,900.00 $15,650.00 $17,350.00 $18,750.00 $20,150.00 $21,550.00 $22,950.00
40% $16,240.00 $18,560.00 $20,880.00 $23,160.00 $25,040.00 $26,880.00 $28,720.00 $30,600.00

50% $20,300.00 $23,200.00 $26,100.00 $28,950.00 $31,300.00 $33,600.00 $35,900.00 $38,250.00
60% $24,360.00 $27,840.00 $31,320.00 $34,740.00 $37,560.00 $40,320.00 $43,080.00 $45,900.00
80% $32,450.00 $37,050.00 $41,700.00 $46,300.00 $50,050.00 $53,750.00 $57,450.00 $61,150.00
Non-Adjusted Income Limits for Appomattox County
Percentage: 50% 80% 100% 150%
Income: $28,950.00 $46,320.00 $57,900.00 $86,850.00
Arlington County
MSA: Northern Virginia Median Income: $107,300.00
Click on a column header for sorting.
Percentage One Two Three Four Five Six Seven Eight
30% $22,550.00 $25,800.00 $29,000.00 $32,200.00 $34,800.00 $37,400.00 $39,950.00 $42,550.00
40% $30,080.00 $34,360.00 $38,640.00 $42,920.00 $46,360.00 $49,800.00 $53,240.00 $56,680.00
50% $37,600.00 $42,950.00 $48,300.00 $53,650.00 $57,950.00 $62,250.00 $66,550.00 $70,850.00
60% $45,120.00 $51,540.00 $57,960.00 $64,380.00 $69,540.00 $74,700.00 $79,860.00 $85,020.00
80% $46,750.00 $53,400.00 $60,100.00 $66,750.00 $72,100.00 $77,450.00 $82,800.00 $88,150.00
Non-Adjusted Income Limits for Arlington County
Percentage: 50% 80% 100% 150%
Income: $53,650.00 $85,840.00 $107,300.00 $160,950.00
Augusta County
MSA: Non-Metropolitan Median Income: $62,700.00
Click on a column header for sorting.

Percentage One Two Three Four Five Six Seven Eight
30% $13,200.00 $15,050.00 $16,950.00 $18,800.00 $20,350.00 $21,850.00 $23,350.00 $24,850.00
40% $17,560.00 $20,080.00 $22,600.00 $25,080.00 $27,120.00 $29,120.00 $31,120.00 $33,120.00
50% $21,950.00 $25,100.00 $28,250.00 $31,350.00 $33,900.00 $36,400.00 $38,900.00 $41,400.00
60% $26,340.00 $30,120.00 $33,900.00 $37,620.00 $40,680.00 $43,680.00 $46,680.00 $49,680.00
80% $35,150.00 $40,150.00 $45,150.00 $50,150.00 $54,200.00 $58,200.00 $62,200.00 $66,200.00
Non-Adjusted Income Limits for Augusta County
Percentage: 50% 80% 100% 150%
Income: $31,350.00 $50,160.00 $62,700.00 $94,050.00
Bath County
MSA: Non-Metropolitan Median Income: $54,200.00
Click on a column header for sorting.
Percentage One Two Three Four Five Six Seven Eight
30% $11,400.00 $13,000.00 $14,650.00 $16,250.00 $17,550.00 $18,850.00 $20,150.00 $21,450.00
40% $15,200.00 $17,360.00 $19,520.00 $21,680.00 $23,440.00 $25,160.00 $26,920.00 $28,640.00
50% $19,000.00 $21,700.00 $24,400.00 $27,100.00 $29,300.00 $31,450.00 $33,650.00 $35,800.00
60% $22,800.00 $26,040.00 $29,280.00 $32,520.00 $35,160.00 $37,740.00 $40,380.00 $42,960.00
80% $30,350.00 $34,700.00 $39,050.00 $43,350.00 $46,850.00 $50,300.00 $53,800.00 $57,250.00
Non-Adjusted Income Limits for Bath County
Percentage: 50% 80% 100% 150%
Income: $27,100.00 $43,360.00 $54,200.00 $81,300.00

Bedford City
MSA: Lynchburg Median Income: $57,900.00
Click on a column header for sorting.
Percentage One Two Three Four Five Six Seven Eight
30% $12,150.00 $13,900.00 $15,650.00 $17,350.00 $18,750.00 $20,150.00 $21,550.00 $22,950.00
40% $16,240.00 $18,560.00 $20,880.00 $23,160.00 $25,040.00 $26,880.00 $28,720.00 $30,600.00
50% $20,300.00 $23,200.00 $26,100.00 $28,950.00 $31,300.00 $33,600.00 $35,900.00 $38,250.00
60% $24,360.00 $27,840.00 $31,320.00 $34,740.00 $37,560.00 $40,320.00 $43,080.00 $45,900.00
80% $32,450.00 $37,050.00 $41,700.00 $46,300.00 $50,050.00 $53,750.00 $57,450.00 $61,150.00
Non-Adjusted Income Limits for Bedford City
Percentage: 50% 80% 100% 150%
Income: $28,950.00 $46,320.00 $57,900.00 $86,850.00
Bedford County
MSA: Lynchburg Median Income: $57,900.00
Click on a column header for sorting.
Percentage One Two Three Four Five Six Seven Eight
30% $12,150.00 $13,900.00 $15,650.00 $17,350.00 $18,750.00 $20,150.00 $21,550.00 $22,950.00
40% $16,240.00 $18,560.00 $20,880.00 $23,160.00 $25,040.00 $26,880.00 $28,720.00 $30,600.00
50% $20,300.00 $23,200.00 $26,100.00 $28,950.00 $31,300.00 $33,600.00 $35,900.00 $38,250.00
60% $24,360.00 $27,840.00 $31,320.00 $34,740.00 $37,560.00 $40,320.00 $43,080.00 $45,900.00
80% $32,450.00 $37,050.00 $41,700.00 $46,300.00 $50,050.00 $53,750.00 $57,450.00 $61,150.00

Non-Adjusted Income Limits for Bedford County
Percentage: 50% 80% 100% 150%
Income: $28,950.00 $46,320.00 $57,900.00 $86,850.00
Blacksburg City
MSA: Blacksburg Median Income: $68,800.00
Click on a column header for sorting.
Percentage One Two Three Four Five Six Seven Eight
Non-Adjusted Income Limits for Blacksburg City
Percentage: 50% 80% 100% 150%
Income: $34,400.00 $55,040.00 $68,800.00 $103,200.00
Bland County
MSA: Non-Metropolitan Median Income: $48,400.00
Click on a column header for sorting.
Percentage One Two Three Four Five Six Seven Eight
30% $10,850.00 $12,400.00 $13,950.00 $15,500.00 $16,750.00 $18,000.00 $19,250.00 $20,500.00
40% $14,480.00 $16,520.00 $18,600.00 $20,640.00 $22,320.00 $23,960.00 $25,600.00 $27,280.00
50% $18,100.00 $20,650.00 $23,250.00 $25,800.00 $27,900.00 $29,950.00 $32,000.00 $34,100.00
60% $21,720.00 $24,780.00 $27,900.00 $30,960.00 $33,480.00 $35,940.00 $38,400.00 $40,920.00
80% $28,950.00 $33,050.00 $37,200.00 $41,300.00 $44,650.00 $47,950.00 $51,250.00 $54,550.00
Non-Adjusted Income Limits for Bland County
Percentage: 50% 80% 100% 150%

Income: $24,200.00 $38,720.00 $48,400.00 $72,600.00
Botetourt County
MSA: Roanoke Median Income: $63,600.00
Click on a column header for sorting.
Percentage One Two Three Four Five Six Seven Eight
30% $13,400.00 $15,300.00 $17,200.00 $19,100.00 $20,650.00 $22,200.00 $23,700.00 $25,250.00
40% $17,840.00 $20,360.00 $22,920.00 $25,440.00 $27,480.00 $29,520.00 $31,560.00 $33,600.00
50% $22,300.00 $25,450.00 $28,650.00 $31,800.00 $34,350.00 $36,900.00 $39,450.00 $42,000.00
60% $26,760.00 $30,540.00 $34,380.00 $38,160.00 $41,220.00 $44,280.00 $47,340.00 $50,400.00
80% $35,650.00 $40,750.00 $45,850.00 $50,900.00 $55,000.00 $59,050.00 $63,150.00 $67,200.00
Non-Adjusted Income Limits for Botetourt County
Percentage: 50% 80% 100% 150%
Income: $31,800.00 $50,880.00 $63,600.00 $95,400.00
Bristol City
MSA: Bristol Median Income: $48,700.00
Click on a column header for sorting.
Percentage One Two Three Four Five Six Seven Eight
30% $10,250.00 $11,700.00 $13,150.00 $14,600.00 $15,800.00 $16,950.00 $18,150.00 $19,300.00
40% $13,640.00 $15,600.00 $17,560.00 $19,480.00 $21,040.00 $22,600.00 $24,160.00 $25,720.00
50% $17,050.00 $19,500.00 $21,950.00 $24,350.00 $26,300.00 $28,250.00 $30,200.00 $32,150.00
60% $20,460.00 $23,400.00 $26,340.00 $29,220.00 $31,560.00 $33,900.00 $36,240.00 $38,580.00

80% $27,300.00 $31,200.00 $35,100.00 $38,950.00 $42,100.00 $45,200.00 $48,300.00 $52,300.00
Non-Adjusted Income Limits for Bristol City
Percentage: 50% 80% 100% 150%
Income: $24,350.00 $38,960.00 $48,700.00 $73,050.00
Brunswick County
MSA: Non-Metropolitan Median Income: $45,700.00
Click on a column header for sorting.
Percentage One Two Three Four Five Six Seven Eight
30% $10,850.00 $12,400.00 $13,950.00 $15,500.00 $16,750.00 $18,000.00 $19,250.00 $20,500.00
40% $14,480.00 $16,520.00 $18,600.00 $20,640.00 $22,320.00 $23,960.00 $25,600.00 $27,280.00
50% $18,100.00 $20,650.00 $23,250.00 $25,800.00 $27,900.00 $29,950.00 $32,000.00 $34,100.00
60% $21,720.00 $24,780.00 $27,900.00 $30,960.00 $33,480.00 $35,940.00 $38,400.00 $40,920.00
80% $28,950.00 $33,050.00 $37,200.00 $41,300.00 $44,650.00 $47,950.00 $51,250.00 $54,550.00
Non-Adjusted Income Limits for Brunswick County
Percentage: 50% 80% 100% 150%
Income: $22,850.00 $36,560.00 $45,700.00 $68,550.00
Buchanan County
MSA: Non-Metropolitan Median Income: $39,100.00
Click on a column header for sorting.
Percentage One Two Three Four Five Six Seven Eight
30% $10,850.00 $12,400.00 $13,950.00 $15,500.00 $16,750.00 $18,000.00 $19,250.00 $20,500.00

40% $14,480.00 $16,520.00 $18,600.00 $20,640.00 $22,320.00 $23,960.00 $25,600.00 $27,280.00
50% $18,100.00 $20,650.00 $23,250.00 $25,800.00 $27,900.00 $29,950.00 $32,000.00 $34,100.00
60% $21,720.00 $24,780.00 $27,900.00 $30,960.00 $33,480.00 $35,940.00 $38,400.00 $40,920.00
80% $28,950.00 $33,050.00 $37,200.00 $41,300.00 $44,650.00 $47,950.00 $51,250.00 $54,550.00
Non-Adjusted Income Limits for Buchanan County
Percentage: 50% 80% 100% 150%
Income: $19,550.00 $31,280.00 $39,100.00 $58,650.00
Buckingham County
MSA: Non-Metropolitan Median Income: $46,300.00
Click on a column header for sorting.
Percentage One Two Three Four Five Six Seven Eight
30% $10,850.00 $12,400.00 $13,950.00 $15,500.00 $16,750.00 $18,000.00 $19,250.00 $20,500.00
40% $14,480.00 $16,520.00 $18,600.00 $20,640.00 $22,320.00 $23,960.00 $25,600.00 $27,280.00
50% $18,100.00 $20,650.00 $23,250.00 $25,800.00 $27,900.00 $29,950.00 $32,000.00 $34,100.00
60% $21,720.00 $24,780.00 $27,900.00 $30,960.00 $33,480.00 $35,940.00 $38,400.00 $40,920.00
80% $28,950.00 $33,050.00 $37,200.00 $41,300.00 $44,650.00 $47,950.00 $51,250.00 $54,550.00
Non-Adjusted Income Limits for Buckingham County
Percentage: 50% 80% 100% 150%
Income: $23,150.00 $37,040.00 $46,300.00 $69,450.00
Buena Vista City
MSA: Non-Metropolitan Median Income: $55,300.00

Click on a column header for sorting.
Percentage One Two Three Four Five Six Seven Eight
30% $11,650.00 $13,300.00 $14,950.00 $16,600.00 $17,950.00 $19,300.00 $20,600.00 $21,950.00
40% $15,520.00 $17,720.00 $19,920.00 $22,120.00 $23,920.00 $25,680.00 $27,440.00 $29,200.00
50% $19,400.00 $22,150.00 $24,900.00 $27,650.00 $29,900.00 $32,100.00 $34,300.00 $36,500.00
60% $23,280.00 $26,580.00 $29,880.00 $33,180.00 $35,880.00 $38,520.00 $41,160.00 $43,800.00
80% $31,000.00 $35,400.00 $39,850.00 $44,250.00 $47,800.00 $51,350.00 $54,900.00 $58,450.00
Non-Adjusted Income Limits for Buena Vista City
Percentage: 50% 80% 100% 150%
Income: $27,650.00 $44,240.00 $55,300.00 $82,950.00
Campbell County
MSA: Lynchburg Median Income: $57,900.00
Click on a column header for sorting.
Percentage One Two Three Four Five Six Seven Eight
30% $12,150.00 $13,900.00 $15,650.00 $17,350.00 $18,750.00 $20,150.00 $21,550.00 $22,950.00
40% $16,240.00 $18,560.00 $20,880.00 $23,160.00 $25,040.00 $26,880.00 $28,720.00 $30,600.00
50% $20,300.00 $23,200.00 $26,100.00 $28,950.00 $31,300.00 $33,600.00 $35,900.00 $38,250.00
60% $24,360.00 $27,840.00 $31,320.00 $34,740.00 $37,560.00 $40,320.00 $43,080.00 $45,900.00
80% $32,450.00 $37,050.00 $41,700.00 $46,300.00 $50,050.00 $53,750.00 $57,450.00 $61,150.00
Non-Adjusted Income Limits for Campbell County
Percentage: 50% 80% 100% 150%
Income: $28,950.00 $46,320.00 $57,900.00 $86,850.00
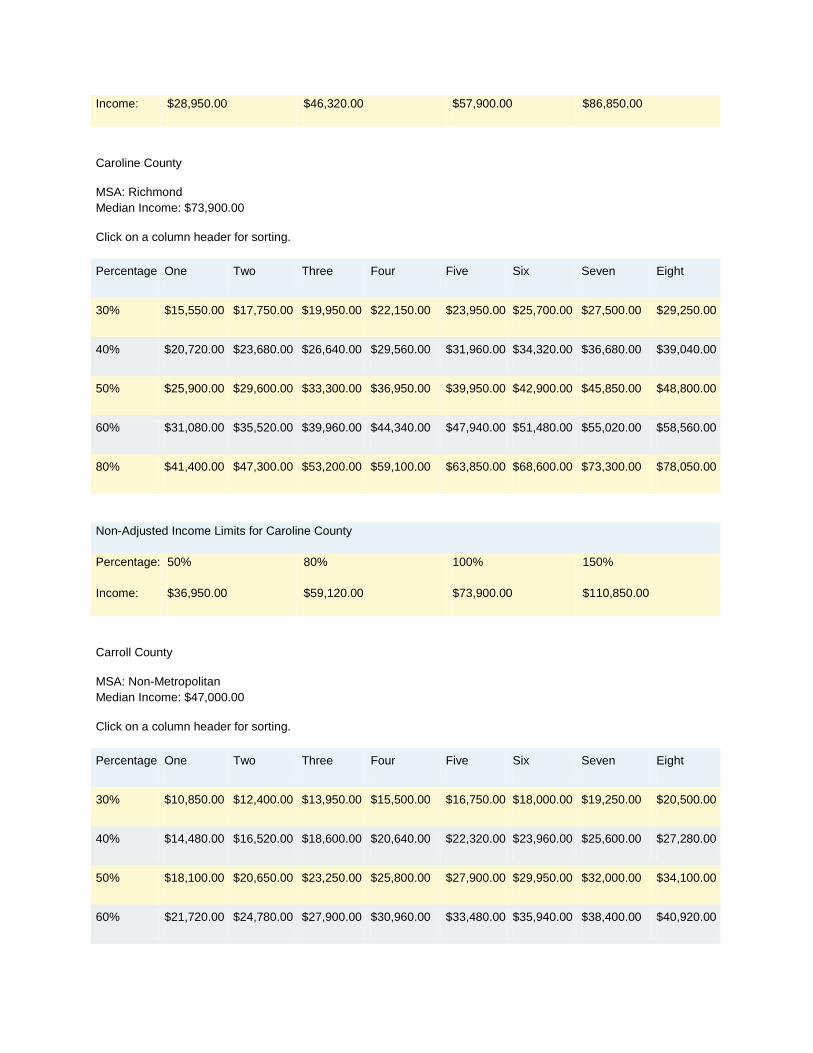
Caroline County
MSA: Richmond Median Income: $73,900.00
Click on a column header for sorting.
Percentage One Two Three Four Five Six Seven Eight
30% $15,550.00 $17,750.00 $19,950.00 $22,150.00 $23,950.00 $25,700.00 $27,500.00 $29,250.00
40% $20,720.00 $23,680.00 $26,640.00 $29,560.00 $31,960.00 $34,320.00 $36,680.00 $39,040.00
50% $25,900.00 $29,600.00 $33,300.00 $36,950.00 $39,950.00 $42,900.00 $45,850.00 $48,800.00
60% $31,080.00 $35,520.00 $39,960.00 $44,340.00 $47,940.00 $51,480.00 $55,020.00 $58,560.00
80% $41,400.00 $47,300.00 $53,200.00 $59,100.00 $63,850.00 $68,600.00 $73,300.00 $78,050.00
Non-Adjusted Income Limits for Caroline County
Percentage: 50% 80% 100% 150%
Income: $36,950.00 $59,120.00 $73,900.00 $110,850.00
Carroll County
MSA: Non-Metropolitan Median Income: $47,000.00
Click on a column header for sorting.
Percentage One Two Three Four Five Six Seven Eight
30% $10,850.00 $12,400.00 $13,950.00 $15,500.00 $16,750.00 $18,000.00 $19,250.00 $20,500.00
40% $14,480.00 $16,520.00 $18,600.00 $20,640.00 $22,320.00 $23,960.00 $25,600.00 $27,280.00
50% $18,100.00 $20,650.00 $23,250.00 $25,800.00 $27,900.00 $29,950.00 $32,000.00 $34,100.00
60% $21,720.00 $24,780.00 $27,900.00 $30,960.00 $33,480.00 $35,940.00 $38,400.00 $40,920.00

80% $28,950.00 $33,050.00 $37,200.00 $41,300.00 $44,650.00 $47,950.00 $51,250.00 $54,550.00
Non-Adjusted Income Limits for Carroll County
Percentage: 50% 80% 100% 150%
Income: $23,500.00 $37,600.00 $47,000.00 $70,500.00
Charles City County
MSA: Richmond Median Income: $73,900.00
Click on a column header for sorting.
Percentage One Two Three Four Five Six Seven Eight
30% $15,550.00 $17,750.00 $19,950.00 $22,150.00 $23,950.00 $25,700.00 $27,500.00 $29,250.00
40% $20,720.00 $23,680.00 $26,640.00 $29,560.00 $31,960.00 $34,320.00 $36,680.00 $39,040.00
50% $25,900.00 $29,600.00 $33,300.00 $36,950.00 $39,950.00 $42,900.00 $45,850.00 $48,800.00
60% $31,080.00 $35,520.00 $39,960.00 $44,340.00 $47,940.00 $51,480.00 $55,020.00 $58,560.00
80% $41,400.00 $47,300.00 $53,200.00 $59,100.00 $63,850.00 $68,600.00 $73,300.00 $78,050.00
Non-Adjusted Income Limits for Charles City County
Percentage: 50% 80% 100% 150%
Income: $36,950.00 $59,120.00 $73,900.00 $110,850.00
Charlotte County
MSA: Non-Metropolitan Median Income: $51,300.00
Click on a column header for sorting.
Percentage One Two Three Four Five Six Seven Eight
30% $10,850.00 $12,400.00 $13,950.00 $15,500.00 $16,750.00 $18,000.00 $19,250.00 $20,500.00
40% $14,480.00 $16,520.00 $18,600.00 $20,640.00 $22,320.00 $23,960.00 $25,600.00 $27,280.00
50% $18,100.00 $20,650.00 $23,250.00 $25,800.00 $27,900.00 $29,950.00 $32,000.00 $34,100.00
60% $21,720.00 $24,780.00 $27,900.00 $30,960.00 $33,480.00 $35,940.00 $38,400.00 $40,920.00
80% $28,950.00 $33,050.00 $37,200.00 $41,300.00 $44,650.00 $47,950.00 $51,250.00 $54,550.00
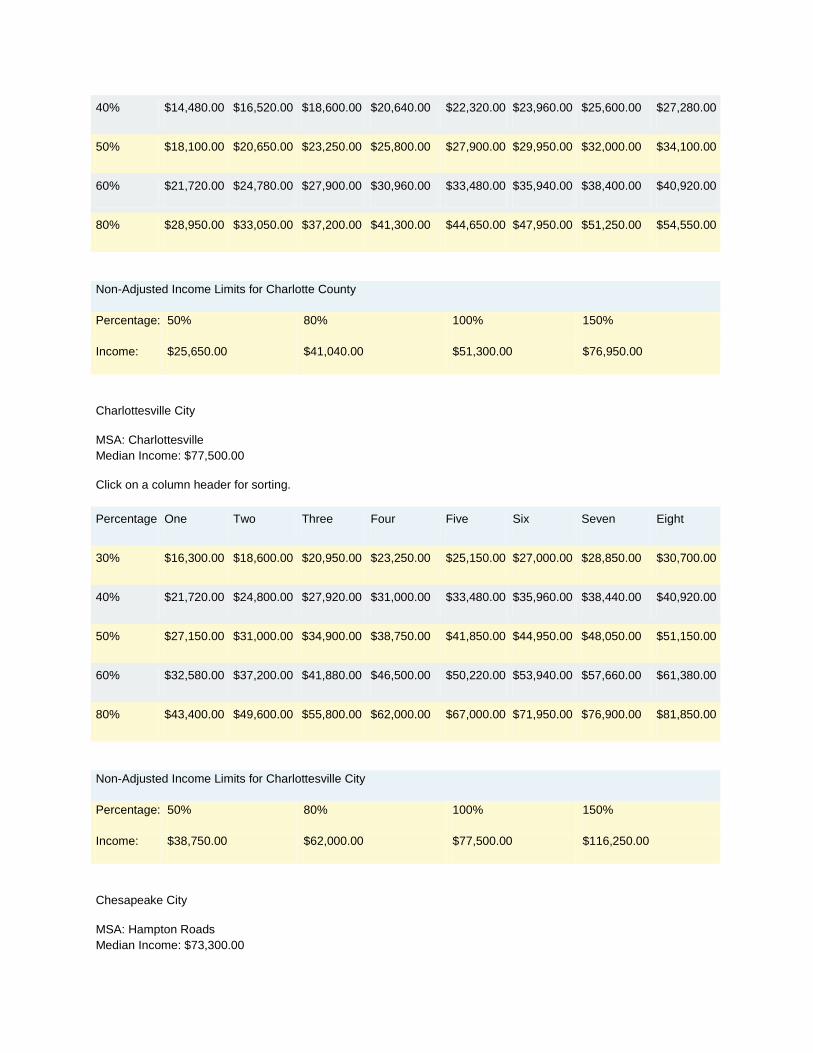
Non-Adjusted Income Limits for Charlotte County
Percentage: 50% 80% 100% 150%
Income: $25,650.00 $41,040.00 $51,300.00 $76,950.00
Charlottesville City
MSA: Charlottesville Median Income: $77,500.00
Click on a column header for sorting.
Percentage One Two Three Four Five Six Seven Eight
30% $16,300.00 $18,600.00 $20,950.00 $23,250.00 $25,150.00 $27,000.00 $28,850.00 $30,700.00
40% $21,720.00 $24,800.00 $27,920.00 $31,000.00 $33,480.00 $35,960.00 $38,440.00 $40,920.00
50% $27,150.00 $31,000.00 $34,900.00 $38,750.00 $41,850.00 $44,950.00 $48,050.00 $51,150.00
60% $32,580.00 $37,200.00 $41,880.00 $46,500.00 $50,220.00 $53,940.00 $57,660.00 $61,380.00
80% $43,400.00 $49,600.00 $55,800.00 $62,000.00 $67,000.00 $71,950.00 $76,900.00 $81,850.00
Non-Adjusted Income Limits for Charlottesville City
Percentage: 50% 80% 100% 150%
Income: $38,750.00 $62,000.00 $77,500.00 $116,250.00
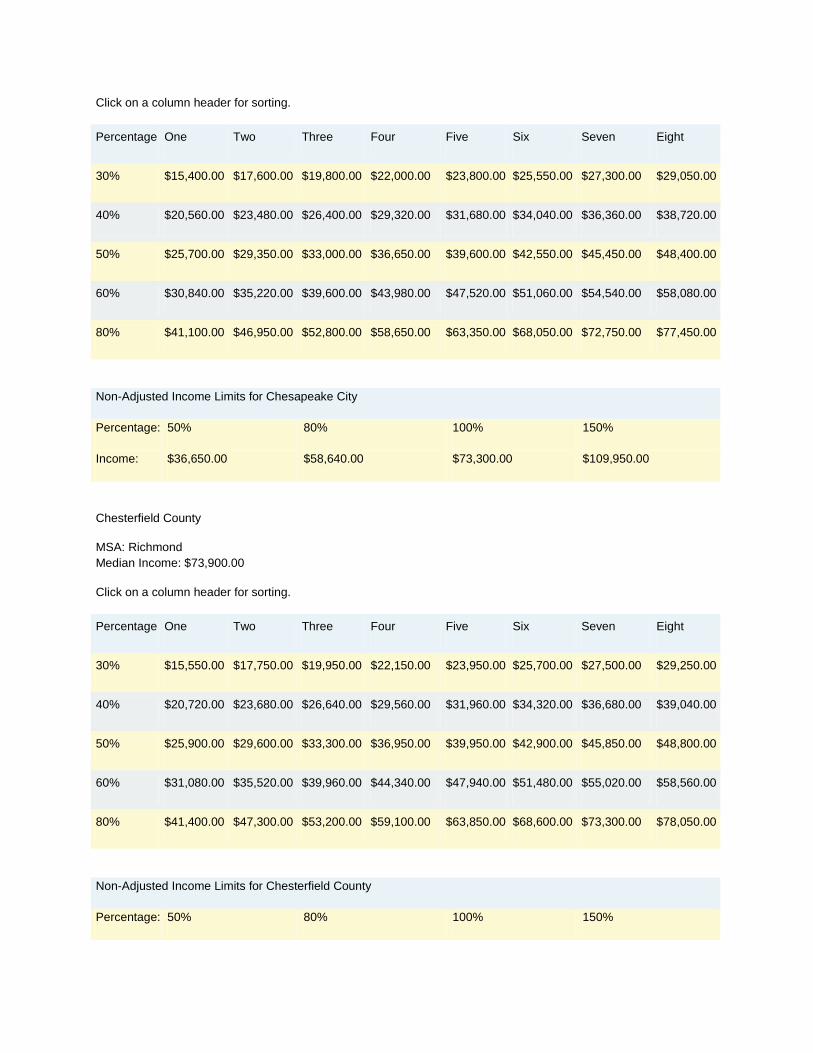
Chesapeake City
MSA: Hampton Roads Median Income: $73,300.00
Click on a column header for sorting.
Percentage One Two Three Four Five Six Seven Eight
30% $15,400.00 $17,600.00 $19,800.00 $22,000.00 $23,800.00 $25,550.00 $27,300.00 $29,050.00
40% $20,560.00 $23,480.00 $26,400.00 $29,320.00 $31,680.00 $34,040.00 $36,360.00 $38,720.00
50% $25,700.00 $29,350.00 $33,000.00 $36,650.00 $39,600.00 $42,550.00 $45,450.00 $48,400.00
60% $30,840.00 $35,220.00 $39,600.00 $43,980.00 $47,520.00 $51,060.00 $54,540.00 $58,080.00
80% $41,100.00 $46,950.00 $52,800.00 $58,650.00 $63,350.00 $68,050.00 $72,750.00 $77,450.00
Non-Adjusted Income Limits for Chesapeake City
Percentage: 50% 80% 100% 150%
Income: $36,650.00 $58,640.00 $73,300.00 $109,950.00
Chesterfield County
MSA: Richmond Median Income: $73,900.00
Click on a column header for sorting.
Percentage One Two Three Four Five Six Seven Eight
30% $15,550.00 $17,750.00 $19,950.00 $22,150.00 $23,950.00 $25,700.00 $27,500.00 $29,250.00
40% $20,720.00 $23,680.00 $26,640.00 $29,560.00 $31,960.00 $34,320.00 $36,680.00 $39,040.00
50% $25,900.00 $29,600.00 $33,300.00 $36,950.00 $39,950.00 $42,900.00 $45,850.00 $48,800.00
60% $31,080.00 $35,520.00 $39,960.00 $44,340.00 $47,940.00 $51,480.00 $55,020.00 $58,560.00
80% $41,400.00 $47,300.00 $53,200.00 $59,100.00 $63,850.00 $68,600.00 $73,300.00 $78,050.00
Non-Adjusted Income Limits for Chesterfield County
Percentage: 50% 80% 100% 150%

Income: $36,950.00 $59,120.00 $73,900.00 $110,850.00
Christiansburg City
MSA: Blacksburg Median Income: $68,800.00
Click on a column header for sorting.
Percentage One Two Three Four Five Six Seven Eight
Non-Adjusted Income Limits for Christiansburg City
Percentage: 50% 80% 100% 150%
Income: $34,400.00 $55,040.00 $68,800.00 $103,200.00
Clarke County
MSA: Northern Virginia Median Income: $107,300.00
Click on a column header for sorting.
Percentage One Two Three Four Five Six Seven Eight
30% $22,550.00 $25,800.00 $29,000.00 $32,200.00 $34,800.00 $37,400.00 $39,950.00 $42,550.00
40% $30,080.00 $34,360.00 $38,640.00 $42,920.00 $46,360.00 $49,800.00 $53,240.00 $56,680.00
50% $37,600.00 $42,950.00 $48,300.00 $53,650.00 $57,950.00 $62,250.00 $66,550.00 $70,850.00
60% $45,120.00 $51,540.00 $57,960.00 $64,380.00 $69,540.00 $74,700.00 $79,860.00 $85,020.00
80% $46,750.00 $53,400.00 $60,100.00 $66,750.00 $72,100.00 $77,450.00 $82,800.00 $88,150.00
Non-Adjusted Income Limits for Clarke County
Percentage: 50% 80% 100% 150%
Income: $53,650.00 $85,840.00 $107,300.00 $160,950.00
Clifton Forge City

MSA: Non-Metropolitan Median Income: $54,800.00
Click on a column header for sorting.
Percentage One Two Three Four Five Six Seven Eight
30% $11,550.00 $13,200.00 $14,850.00 $16,450.00 $17,800.00 $19,100.00 $20,400.00 $21,750.00
40% $15,360.00 $17,560.00 $19,760.00 $21,920.00 $23,680.00 $25,440.00 $27,200.00 $28,960.00
50% $19,200.00 $21,950.00 $24,700.00 $27,400.00 $29,600.00 $31,800.00 $34,000.00 $36,200.00
60% $23,040.00 $26,340.00 $29,640.00 $32,880.00 $35,520.00 $38,160.00 $40,800.00 $43,440.00
80% $30,700.00 $35,100.00 $39,500.00 $43,850.00 $47,400.00 $50,900.00 $54,400.00 $57,900.00
Non-Adjusted Income Limits for Clifton Forge City
Percentage: 50% 80% 100% 150%
Income: $27,400.00 $43,840.00 $54,800.00 $82,200.00
Colonial Heights City
MSA: Richmond Median Income: $73,900.00
Click on a column header for sorting.
Percentage One Two Three Four Five Six Seven Eight
30% $15,550.00 $17,750.00 $19,950.00 $22,150.00 $23,950.00 $25,700.00 $27,500.00 $29,250.00
40% $20,720.00 $23,680.00 $26,640.00 $29,560.00 $31,960.00 $34,320.00 $36,680.00 $39,040.00
50% $25,900.00 $29,600.00 $33,300.00 $36,950.00 $39,950.00 $42,900.00 $45,850.00 $48,800.00
60% $31,080.00 $35,520.00 $39,960.00 $44,340.00 $47,940.00 $51,480.00 $55,020.00 $58,560.00
80% $41,400.00 $47,300.00 $53,200.00 $59,100.00 $63,850.00 $68,600.00 $73,300.00 $78,050.00
Non-Adjusted Income Limits for Colonial Heights City

Percentage: 50% 80% 100% 150%
Income: $36,950.00 $59,120.00 $73,900.00 $110,850.00
Covington City
MSA: Non-Metropolitan Median Income: $54,800.00
Click on a column header for sorting.
Percentage One Two Three Four Five Six Seven Eight
30% $11,550.00 $13,200.00 $14,850.00 $16,450.00 $17,800.00 $19,100.00 $20,400.00 $21,750.00
40% $15,360.00 $17,560.00 $19,760.00 $21,920.00 $23,680.00 $25,440.00 $27,200.00 $28,960.00
50% $19,200.00 $21,950.00 $24,700.00 $27,400.00 $29,600.00 $31,800.00 $34,000.00 $36,200.00
60% $23,040.00 $26,340.00 $29,640.00 $32,880.00 $35,520.00 $38,160.00 $40,800.00 $43,440.00
80% $30,700.00 $35,100.00 $39,500.00 $43,850.00 $47,400.00 $50,900.00 $54,400.00 $55,450.00
Non-Adjusted Income Limits for Covington City
Percentage: 50% 80% 100% 150%
Income: $27,400.00 $43,840.00 $54,800.00 $82,200.00
Craig County
MSA: Roanoke Median Income: $63,600.00
Click on a column header for sorting.
Percentage One Two Three Four Five Six Seven Eight
30% $13,400.00 $15,300.00 $17,200.00 $19,100.00 $20,650.00 $22,200.00 $23,700.00 $25,250.00
40% $17,840.00 $20,360.00 $22,920.00 $25,440.00 $27,480.00 $29,520.00 $31,560.00 $33,600.00
50% $22,300.00 $25,450.00 $28,650.00 $31,800.00 $34,350.00 $36,900.00 $39,450.00 $42,000.00

60% $26,760.00 $30,540.00 $34,380.00 $38,160.00 $41,220.00 $44,280.00 $47,340.00 $50,400.00
80% $35,650.00 $40,750.00 $45,850.00 $50,900.00 $55,000.00 $59,050.00 $63,150.00 $65,900.00
Non-Adjusted Income Limits for Craig County
Percentage: 50% 80% 100% 150%
Income: $31,800.00 $50,880.00 $63,600.00 $95,400.00
Culpeper County
MSA: Non-Metropolitan Median Income: $80,200.00
Click on a column header for sorting.
Percentage One Two Three Four Five Six Seven Eight
30% $16,850.00 $19,250.00 $21,650.00 $24,050.00 $26,000.00 $27,900.00 $29,850.00 $31,750.00
40% $22,480.00 $25,680.00 $28,880.00 $32,080.00 $34,680.00 $37,240.00 $39,800.00 $42,360.00
50% $28,100.00 $32,100.00 $36,100.00 $40,100.00 $43,350.00 $46,550.00 $49,750.00 $52,950.00
60% $33,720.00 $38,520.00 $43,320.00 $48,120.00 $52,020.00 $55,860.00 $59,700.00 $63,540.00
80% $44,950.00 $51,350.00 $57,750.00 $64,150.00 $69,300.00 $74,450.00 $79,550.00 $84,700.00
Non-Adjusted Income Limits for Culpeper County
Percentage: 50% 80% 100% 150%
Income: $40,100.00 $64,160.00 $80,200.00 $120,300.00
Cumberland County
MSA: Richmond Median Income: $73,900.00
Click on a column header for sorting.
Percentage One Two Three Four Five Six Seven Eight

30% $15,550.00 $17,750.00 $19,950.00 $22,150.00 $23,950.00 $25,700.00 $27,500.00 $29,250.00
40% $20,720.00 $23,680.00 $26,640.00 $29,560.00 $31,960.00 $34,320.00 $36,680.00 $39,040.00
50% $25,900.00 $29,600.00 $33,300.00 $36,950.00 $39,950.00 $42,900.00 $45,850.00 $48,800.00
60% $31,080.00 $35,520.00 $39,960.00 $44,340.00 $47,940.00 $51,480.00 $55,020.00 $58,560.00
80% $41,400.00 $47,300.00 $53,200.00 $59,100.00 $63,850.00 $68,600.00 $73,300.00 $78,050.00
Non-Adjusted Income Limits for Cumberland County
Percentage: 50% 80% 100% 150%
Income: $36,950.00 $59,120.00 $73,900.00 $110,850.00
Danville City
MSA: Danville Median Income: $45,300.00
Click on a column header for sorting.
Percentage One Two Three Four Five Six Seven Eight
30% $10,850.00 $12,400.00 $13,950.00 $15,500.00 $16,750.00 $18,000.00 $19,250.00 $20,500.00
40% $14,480.00 $16,520.00 $18,600.00 $20,640.00 $22,320.00 $23,960.00 $25,600.00 $27,280.00
50% $18,100.00 $20,650.00 $23,250.00 $25,800.00 $27,900.00 $29,950.00 $32,000.00 $34,100.00
60% $21,720.00 $24,780.00 $27,900.00 $30,960.00 $33,480.00 $35,940.00 $38,400.00 $40,920.00
80% $28,950.00 $33,050.00 $37,200.00 $41,300.00 $44,650.00 $47,950.00 $51,250.00 $54,550.00
Non-Adjusted Income Limits for Danville City
Percentage: 50% 80% 100% 150%
Income: $22,650.00 $36,240.00 $45,300.00 $67,950.00
Dickenson County

MSA: Non-Metropolitan Median Income: $36,200.00
Click on a column header for sorting.
Percentage One Two Three Four Five Six Seven Eight
30% $10,850.00 $12,400.00 $13,950.00 $15,500.00 $16,750.00 $18,000.00 $19,250.00 $20,500.00
40% $14,480.00 $16,520.00 $18,600.00 $20,640.00 $22,320.00 $23,960.00 $25,600.00 $27,280.00
50% $18,100.00 $20,650.00 $23,250.00 $25,800.00 $27,900.00 $29,950.00 $32,000.00 $34,100.00
60% $21,720.00 $24,780.00 $27,900.00 $30,960.00 $33,480.00 $35,940.00 $38,400.00 $40,920.00
80% $28,950.00 $33,050.00 $37,200.00 $41,300.00 $44,650.00 $47,950.00 $51,250.00 $54,550.00
Non-Adjusted Income Limits for Dickenson County
Percentage: 50% 80% 100% 150%
Income: $18,100.00 $28,960.00 $36,200.00 $54,300.00
Dinwiddie County
MSA: Richmond Median Income: $73,900.00
Click on a column header for sorting.
Percentage One Two Three Four Five Six Seven Eight
30% $15,550.00 $17,750.00 $19,950.00 $22,150.00 $23,950.00 $25,700.00 $27,500.00 $29,250.00
40% $20,720.00 $23,680.00 $26,640.00 $29,560.00 $31,960.00 $34,320.00 $36,680.00 $39,040.00
50% $25,900.00 $29,600.00 $33,300.00 $36,950.00 $39,950.00 $42,900.00 $45,850.00 $48,800.00
60% $31,080.00 $35,520.00 $39,960.00 $44,340.00 $47,940.00 $51,480.00 $55,020.00 $58,560.00
80% $41,400.00 $47,300.00 $53,200.00 $59,100.00 $63,850.00 $68,600.00 $73,300.00 $78,050.00
Non-Adjusted Income Limits for Dinwiddie County

Percentage: 50% 80% 100% 150%
Income: $36,950.00 $59,120.00 $73,900.00 $110,850.00
Emporia City
MSA: Non-Metropolitan Median Income: $47,400.00
Click on a column header for sorting.
Percentage One Two Three Four Five Six Seven Eight
30% $10,850.00 $12,400.00 $13,950.00 $15,500.00 $16,750.00 $18,000.00 $19,250.00 $20,500.00
40% $14,480.00 $16,520.00 $18,600.00 $20,640.00 $22,320.00 $23,960.00 $25,600.00 $27,280.00
50% $18,100.00 $20,650.00 $23,250.00 $25,800.00 $27,900.00 $29,950.00 $32,000.00 $34,100.00
60% $21,720.00 $24,780.00 $27,900.00 $30,960.00 $33,480.00 $35,940.00 $38,400.00 $40,920.00
80% $28,950.00 $33,050.00 $37,200.00 $41,300.00 $44,650.00 $47,950.00 $51,250.00 $54,550.00
Non-Adjusted Income Limits for Emporia City
Percentage: 50% 80% 100% 150%
Income: $23,700.00 $37,920.00 $47,400.00 $71,100.00
Essex County
MSA: Non-Metropolitan Median Income: $56,100.00
Click on a column header for sorting.
Percentage One Two Three Four Five Six Seven Eight
30% $11,800.00 $13,500.00 $15,200.00 $16,850.00 $18,200.00 $19,550.00 $20,900.00 $22,250.00
40% $15,720.00 $17,960.00 $20,200.00 $22,440.00 $24,240.00 $26,040.00 $27,840.00 $29,640.00
50% $19,650.00 $22,450.00 $25,250.00 $28,050.00 $30,300.00 $32,550.00 $34,800.00 $37,050.00

60% $23,580.00 $26,940.00 $30,300.00 $33,660.00 $36,360.00 $39,060.00 $41,760.00 $44,460.00
80% $31,450.00 $35,950.00 $40,450.00 $44,900.00 $48,500.00 $52,100.00 $55,700.00 $59,900.00
Non-Adjusted Income Limits for Essex County
Percentage: 50% 80% 100% 150%
Income: $28,050.00 $44,880.00 $56,100.00 $84,150.00
Fairfax City
MSA: Northern Virginia Median Income: $107,300.00
Click on a column header for sorting.
Percentage One Two Three Four Five Six Seven Eight
30% $22,550.00 $25,800.00 $29,000.00 $32,200.00 $34,800.00 $37,400.00 $39,950.00 $42,550.00
40% $30,080.00 $34,360.00 $38,640.00 $42,920.00 $46,360.00 $49,800.00 $53,240.00 $56,680.00
50% $37,600.00 $42,950.00 $48,300.00 $53,650.00 $57,950.00 $62,250.00 $66,550.00 $70,850.00
60% $45,120.00 $51,540.00 $57,960.00 $64,380.00 $69,540.00 $74,700.00 $79,860.00 $85,020.00
80% $46,750.00 $53,400.00 $60,100.00 $66,750.00 $72,100.00 $77,450.00 $82,800.00 $88,150.00
Non-Adjusted Income Limits for Fairfax City
Percentage: 50% 80% 100% 150%
Income: $53,650.00 $85,840.00 $107,300.00 $160,950.00
Fairfax County
MSA: Northern Virginia Median Income: $107,300.00
Click on a column header for sorting.
Percentage One Two Three Four Five Six Seven Eight

30% $22,550.00 $25,800.00 $29,000.00 $32,200.00 $34,800.00 $37,400.00 $39,950.00 $42,550.00
40% $30,080.00 $34,360.00 $38,640.00 $42,920.00 $46,360.00 $49,800.00 $53,240.00 $56,680.00
50% $37,600.00 $42,950.00 $48,300.00 $53,650.00 $57,950.00 $62,250.00 $66,550.00 $70,850.00
60% $45,120.00 $51,540.00 $57,960.00 $64,380.00 $69,540.00 $74,700.00 $79,860.00 $85,020.00
80% $46,750.00 $53,400.00 $60,100.00 $66,750.00 $72,100.00 $77,450.00 $82,800.00 $88,150.00
Non-Adjusted Income Limits for Fairfax County
Percentage: 50% 80% 100% 150%
Income: $53,650.00 $85,840.00 $107,300.00 $160,950.00
Falls Church City
MSA: Northern Virginia Median Income: $107,300.00
Click on a column header for sorting.
Percentage One Two Three Four Five Six Seven Eight
30% $22,550.00 $25,800.00 $29,000.00 $32,200.00 $34,800.00 $37,400.00 $39,950.00 $42,550.00
40% $30,080.00 $34,360.00 $38,640.00 $42,920.00 $46,360.00 $49,800.00 $53,240.00 $56,680.00
50% $37,600.00 $42,950.00 $48,300.00 $53,650.00 $57,950.00 $62,250.00 $66,550.00 $70,850.00
60% $45,120.00 $51,540.00 $57,960.00 $64,380.00 $69,540.00 $74,700.00 $79,860.00 $85,020.00
80% $46,750.00 $53,400.00 $60,100.00 $66,750.00 $72,100.00 $77,450.00 $82,800.00 $88,150.00
Non-Adjusted Income Limits for Falls Church City
Percentage: 50% 80% 100% 150%
Income: $53,650.00 $85,840.00 $107,300.00 $160,950.00
Fauquier County

MSA: Northern Virginia Median Income: $107,300.00
Click on a column header for sorting.
Percentage One Two Three Four Five Six Seven Eight
30% $22,550.00 $25,800.00 $29,000.00 $32,200.00 $34,800.00 $37,400.00 $39,950.00 $42,550.00
40% $30,080.00 $34,360.00 $38,640.00 $42,920.00 $46,360.00 $49,800.00 $53,240.00 $56,680.00
50% $37,600.00 $42,950.00 $48,300.00 $53,650.00 $57,950.00 $62,250.00 $66,550.00 $70,850.00
60% $45,120.00 $51,540.00 $57,960.00 $64,380.00 $69,540.00 $74,700.00 $79,860.00 $85,020.00
80% $46,750.00 $53,400.00 $60,100.00 $66,750.00 $72,100.00 $77,450.00 $82,800.00 $88,150.00
Non-Adjusted Income Limits for Fauquier County
Percentage: 50% 80% 100% 150%
Income: $53,650.00 $85,840.00 $107,300.00 $160,950.00
Floyd County
MSA: Non-Metropolitan Median Income: $53,900.00
Click on a column header for sorting.
Percentage One Two Three Four Five Six Seven Eight
30% $11,350.00 $12,950.00 $14,550.00 $16,150.00 $17,450.00 $18,750.00 $20,050.00 $21,350.00
40% $15,120.00 $17,280.00 $19,440.00 $21,560.00 $23,320.00 $25,040.00 $26,760.00 $28,480.00
50% $18,900.00 $21,600.00 $24,300.00 $26,950.00 $29,150.00 $31,300.00 $33,450.00 $35,600.00
60% $22,680.00 $25,920.00 $29,160.00 $32,340.00 $34,980.00 $37,560.00 $40,140.00 $42,720.00
80% $30,200.00 $34,500.00 $38,800.00 $43,100.00 $46,550.00 $50,000.00 $53,450.00 $56,900.00
Non-Adjusted Income Limits for Floyd County
Percentage: 50% 80% 100% 150%
Income: $26,950.00 $43,120.00 $53,900.00 $80,850.00
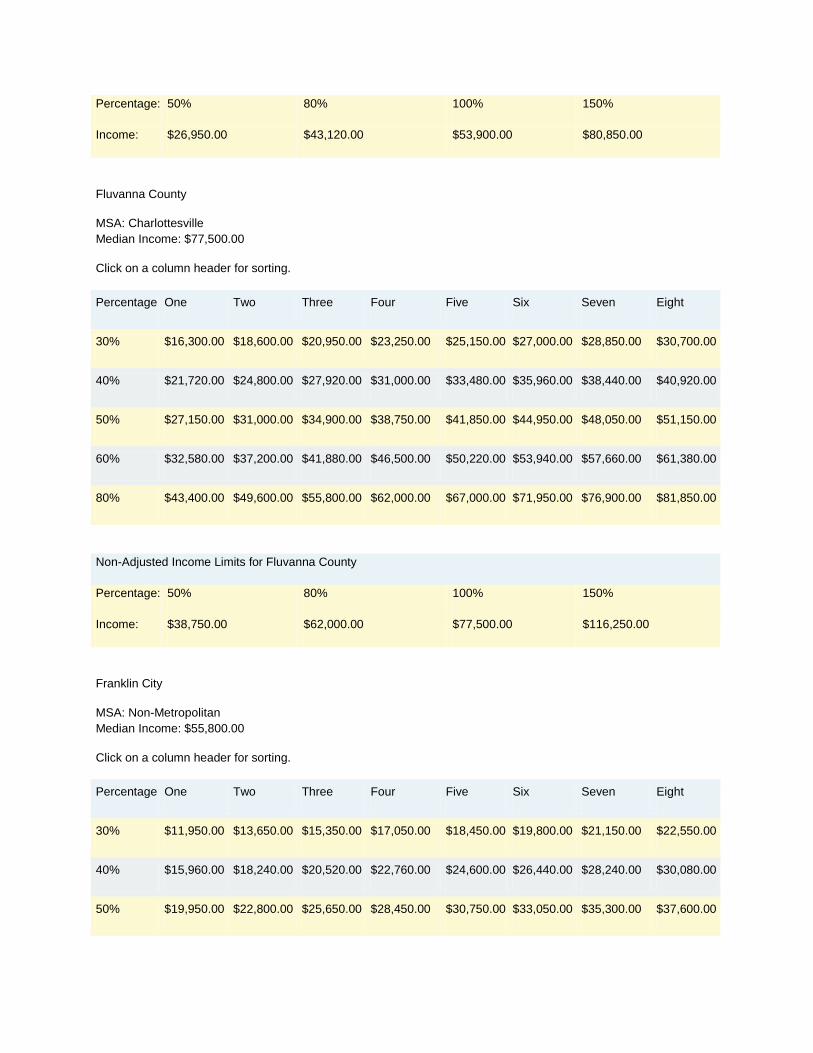
Fluvanna County
MSA: Charlottesville Median Income: $77,500.00
Click on a column header for sorting.
Percentage One Two Three Four Five Six Seven Eight
30% $16,300.00 $18,600.00 $20,950.00 $23,250.00 $25,150.00 $27,000.00 $28,850.00 $30,700.00
40% $21,720.00 $24,800.00 $27,920.00 $31,000.00 $33,480.00 $35,960.00 $38,440.00 $40,920.00
50% $27,150.00 $31,000.00 $34,900.00 $38,750.00 $41,850.00 $44,950.00 $48,050.00 $51,150.00
60% $32,580.00 $37,200.00 $41,880.00 $46,500.00 $50,220.00 $53,940.00 $57,660.00 $61,380.00
80% $43,400.00 $49,600.00 $55,800.00 $62,000.00 $67,000.00 $71,950.00 $76,900.00 $81,850.00
Non-Adjusted Income Limits for Fluvanna County
Percentage: 50% 80% 100% 150%
Income: $38,750.00 $62,000.00 $77,500.00 $116,250.00
Franklin City
MSA: Non-Metropolitan Median Income: $55,800.00
Click on a column header for sorting.
Percentage One Two Three Four Five Six Seven Eight
30% $11,950.00 $13,650.00 $15,350.00 $17,050.00 $18,450.00 $19,800.00 $21,150.00 $22,550.00
40% $15,960.00 $18,240.00 $20,520.00 $22,760.00 $24,600.00 $26,440.00 $28,240.00 $30,080.00
50% $19,950.00 $22,800.00 $25,650.00 $28,450.00 $30,750.00 $33,050.00 $35,300.00 $37,600.00

60% $23,940.00 $27,360.00 $30,780.00 $34,140.00 $36,900.00 $39,660.00 $42,360.00 $45,120.00
80% $31,850.00 $36,400.00 $40,950.00 $45,500.00 $49,150.00 $52,800.00 $56,450.00 $60,100.00
Non-Adjusted Income Limits for Franklin City
Percentage: 50% 80% 100% 150%
Income: $27,900.00 $44,640.00 $55,800.00 $83,700.00
Franklin County
MSA: Franklin County Median Income: $56,400.00
Click on a column header for sorting.
Percentage One Two Three Four Five Six Seven Eight
30% $11,850.00 $13,550.00 $15,250.00 $16,900.00 $18,300.00 $19,650.00 $21,000.00 $22,350.00
40% $15,800.00 $18,080.00 $20,320.00 $22,560.00 $24,400.00 $26,200.00 $28,000.00 $29,800.00
50% $19,750.00 $22,600.00 $25,400.00 $28,200.00 $30,500.00 $32,750.00 $35,000.00 $37,250.00
60% $23,700.00 $27,120.00 $30,480.00 $33,840.00 $36,600.00 $39,300.00 $42,000.00 $44,700.00
80% $31,600.00 $36,100.00 $40,600.00 $45,100.00 $48,750.00 $52,350.00 $55,950.00 $59,550.00
Non-Adjusted Income Limits for Franklin County
Percentage: 50% 80% 100% 150%
Income: $28,200.00 $45,120.00 $56,400.00 $84,600.00
Frederick County
MSA: Winchester, VA-WV MSA Median Income: $65,700.00
Click on a column header for sorting.
Percentage One Two Three Four Five Six Seven Eight

30% $13,800.00 $15,800.00 $17,750.00 $19,700.00 $21,300.00 $22,900.00 $24,450.00 $26,050.00
40% $18,400.00 $21,040.00 $23,680.00 $26,280.00 $28,400.00 $30,520.00 $32,600.00 $34,720.00
50% $23,000.00 $26,300.00 $29,600.00 $32,850.00 $35,500.00 $38,150.00 $40,750.00 $43,400.00
60% $27,600.00 $31,560.00 $35,520.00 $39,420.00 $42,600.00 $45,780.00 $48,900.00 $52,080.00
80% $36,800.00 $42,050.00 $47,300.00 $52,550.00 $56,800.00 $61,000.00 $65,200.00 $69,400.00
Non-Adjusted Income Limits for Frederick County
Percentage: 50% 80% 100% 150%
Income: $32,850.00 $52,560.00 $65,700.00 $98,550.00
Fredericksburg City
MSA: Northern Virginia Median Income: $107,300.00
Click on a column header for sorting.
Percentage One Two Three Four Five Six Seven Eight
30% $22,550.00 $25,800.00 $29,000.00 $32,200.00 $34,800.00 $37,400.00 $39,950.00 $42,550.00
40% $30,080.00 $34,360.00 $38,640.00 $42,920.00 $46,360.00 $49,800.00 $53,240.00 $56,680.00
50% $37,600.00 $42,950.00 $48,300.00 $53,650.00 $57,950.00 $62,250.00 $66,550.00 $70,850.00
60% $45,120.00 $51,540.00 $57,960.00 $64,380.00 $69,540.00 $74,700.00 $79,860.00 $85,020.00
80% $46,750.00 $53,400.00 $60,100.00 $66,750.00 $72,100.00 $77,450.00 $82,800.00 $88,150.00
Non-Adjusted Income Limits for Fredericksburg City
Percentage: 50% 80% 100% 150%
Income: $53,650.00 $85,840.00 $107,300.00 $160,950.00
Galax City

MSA: Non-Metropolitan Median Income: $47,000.00
Click on a column header for sorting.
Percentage One Two Three Four Five Six Seven Eight
30% $10,850.00 $12,400.00 $13,950.00 $15,500.00 $16,750.00 $18,000.00 $19,250.00 $20,500.00
40% $14,480.00 $16,520.00 $18,600.00 $20,640.00 $22,320.00 $23,960.00 $25,600.00 $27,280.00
50% $18,100.00 $20,650.00 $23,250.00 $25,800.00 $27,900.00 $29,950.00 $32,000.00 $34,100.00
60% $21,720.00 $24,780.00 $27,900.00 $30,960.00 $33,480.00 $35,940.00 $38,400.00 $40,920.00
80% $28,950.00 $33,050.00 $37,200.00 $41,300.00 $44,650.00 $47,950.00 $51,250.00 $54,550.00
Non-Adjusted Income Limits for Galax City
Percentage: 50% 80% 100% 150%
Income: $23,500.00 $37,600.00 $47,000.00 $70,500.00
Giles County
MSA: Giles County Median Income: $52,000.00
Click on a column header for sorting.
Percentage One Two Three Four Five Six Seven Eight
30% $10,950.00 $12,500.00 $14,050.00 $15,600.00 $16,850.00 $18,100.00 $19,350.00 $20,600.00
40% $14,560.00 $16,640.00 $18,720.00 $20,800.00 $22,480.00 $24,160.00 $25,800.00 $27,480.00
50% $18,200.00 $20,800.00 $23,400.00 $26,000.00 $28,100.00 $30,200.00 $32,250.00 $34,350.00
60% $21,840.00 $24,960.00 $28,080.00 $31,200.00 $33,720.00 $36,240.00 $38,700.00 $41,220.00
80% $29,150.00 $33,300.00 $37,450.00 $41,600.00 $44,950.00 $48,300.00 $51,600.00 $57,900.00
Non-Adjusted Income Limits for Giles County

Percentage: 50% 80% 100% 150%
Income: $26,000.00 $41,600.00 $52,000.00 $78,000.00
Gloucester County
MSA: Hampton Roads Median Income: $73,300.00
Click on a column header for sorting.
Percentage One Two Three Four Five Six Seven Eight
30% $15,400.00 $17,600.00 $19,800.00 $22,000.00 $23,800.00 $25,550.00 $27,300.00 $29,050.00
40% $20,560.00 $23,480.00 $26,400.00 $29,320.00 $31,680.00 $34,040.00 $36,360.00 $38,720.00
50% $25,700.00 $29,350.00 $33,000.00 $36,650.00 $39,600.00 $42,550.00 $45,450.00 $48,400.00
60% $30,840.00 $35,220.00 $39,600.00 $43,980.00 $47,520.00 $51,060.00 $54,540.00 $58,080.00
80% $41,100.00 $46,950.00 $52,800.00 $58,650.00 $63,350.00 $68,050.00 $72,750.00 $77,450.00
Non-Adjusted Income Limits for Gloucester County
Percentage: 50% 80% 100% 150%
Income: $36,650.00 $58,640.00 $73,300.00 $109,950.00
Goochland County
MSA: Richmond Median Income: $73,900.00
Click on a column header for sorting.
Percentage One Two Three Four Five Six Seven Eight
30% $15,550.00 $17,750.00 $19,950.00 $22,150.00 $23,950.00 $25,700.00 $27,500.00 $29,250.00
40% $16,576.00 $18,944.00 $21,312.00 $23,648.00 $25,568.00 $27,456.00 $29,344.00 $31,232.00
50% $20,720.00 $23,680.00 $26,640.00 $29,560.00 $31,960.00 $34,320.00 $36,680.00 $39,040.00

60% $31,080.00 $35,520.00 $39,960.00 $44,340.00 $47,940.00 $51,480.00 $55,020.00 $58,560.00
80% $41,400.00 $47,300.00 $53,200.00 $59,100.00 $63,850.00 $68,600.00 $73,300.00 $78,850.00
Non-Adjusted Income Limits for Goochland County
Percentage: 50% 80% 100% 150%
Income: $36,950.00 $59,120.00 $73,900.00 $110,850.00
Grayson County
MSA: Non-Metropolitan Median Income: $42,700.00
Click on a column header for sorting.
Percentage One Two Three Four Five Six Seven Eight
30% $10,850.00 $12,400.00 $13,950.00 $15,500.00 $16,750.00 $18,000.00 $19,250.00 $20,500.00
40% $14,480.00 $16,520.00 $18,600.00 $20,640.00 $22,320.00 $23,960.00 $25,600.00 $27,280.00
50% $18,100.00 $20,650.00 $23,250.00 $25,800.00 $27,900.00 $29,950.00 $32,000.00 $34,100.00
60% $21,720.00 $24,780.00 $27,900.00 $30,960.00 $33,480.00 $35,940.00 $38,400.00 $40,920.00
80% $28,950.00 $33,050.00 $37,200.00 $41,300.00 $44,650.00 $47,950.00 $51,250.00 $54,550.00
Non-Adjusted Income Limits for Grayson County
Percentage: 50% 80% 100% 150%
Income: $21,350.00 $34,160.00 $42,700.00 $64,050.00
Greene County
MSA: Charlottesville Median Income: $77,500.00
Click on a column header for sorting.
Percentage One Two Three Four Five Six Seven Eight

30% $16,300.00 $18,600.00 $20,950.00 $23,250.00 $25,150.00 $27,000.00 $28,850.00 $30,700.00
40% $21,720.00 $24,800.00 $27,920.00 $31,000.00 $33,480.00 $35,960.00 $38,440.00 $40,920.00
50% $27,150.00 $31,000.00 $34,900.00 $38,750.00 $41,850.00 $44,950.00 $48,050.00 $51,150.00
60% $32,580.00 $37,200.00 $41,880.00 $46,500.00 $50,220.00 $53,940.00 $57,660.00 $61,380.00
80% $43,400.00 $49,600.00 $55,800.00 $62,000.00 $67,000.00 $71,950.00 $76,900.00 $81,850.00
Non-Adjusted Income Limits for Greene County
Percentage: 50% 80% 100% 150%
Income: $38,750.00 $62,000.00 $77,500.00 $116,250.00
Greensville County
MSA: Non-Metropolitan Median Income: $47,400.00
Click on a column header for sorting.
Percentage One Two Three Four Five Six Seven Eight
30% $10,850.00 $12,400.00 $13,950.00 $15,500.00 $16,750.00 $18,000.00 $19,250.00 $20,500.00
40% $14,480.00 $16,520.00 $18,600.00 $20,640.00 $22,320.00 $23,960.00 $25,600.00 $27,280.00
50% $18,100.00 $20,650.00 $23,250.00 $25,800.00 $27,900.00 $29,950.00 $32,000.00 $34,100.00
60% $21,720.00 $24,780.00 $27,900.00 $30,960.00 $33,480.00 $35,940.00 $38,400.00 $40,920.00
80% $28,950.00 $33,050.00 $37,200.00 $41,300.00 $44,650.00 $47,950.00 $51,250.00 $54,550.00
Non-Adjusted Income Limits for Greensville County
Percentage: 50% 80% 100% 150%
Income: $23,700.00 $37,920.00 $47,400.00 $71,100.00
Halifax County

MSA: Non-Metropolitan Median Income: $47,300.00
Click on a column header for sorting.
Percentage One Two Three Four Five Six Seven Eight
30% $10,850.00 $12,400.00 $13,950.00 $15,500.00 $16,750.00 $18,000.00 $19,250.00 $20,500.00
40% $14,480.00 $16,520.00 $18,600.00 $20,640.00 $22,320.00 $23,960.00 $25,600.00 $27,280.00
50% $18,100.00 $20,650.00 $23,250.00 $25,800.00 $27,900.00 $29,950.00 $32,000.00 $34,100.00
60% $21,720.00 $24,780.00 $27,900.00 $30,960.00 $33,480.00 $35,940.00 $38,400.00 $40,920.00
80% $28,950.00 $33,050.00 $37,200.00 $41,300.00 $44,650.00 $47,950.00 $51,250.00 $54,550.00
Non-Adjusted Income Limits for Halifax County
Percentage: 50% 80% 100% 150%
Income: $23,650.00 $37,840.00 $47,300.00 $70,950.00
Hampton City
MSA: Hampton Roads Median Income: $73,300.00
Click on a column header for sorting.
Percentage One Two Three Four Five Six Seven Eight
30% $15,400.00 $17,600.00 $19,800.00 $22,000.00 $23,800.00 $25,550.00 $27,300.00 $29,050.00
40% $20,560.00 $23,480.00 $26,400.00 $29,320.00 $31,680.00 $34,040.00 $36,360.00 $38,720.00
50% $25,700.00 $29,350.00 $33,000.00 $36,650.00 $39,600.00 $42,550.00 $45,450.00 $48,400.00
60% $30,840.00 $35,220.00 $39,600.00 $43,980.00 $47,520.00 $51,060.00 $54,540.00 $58,080.00
80% $41,100.00 $46,950.00 $52,800.00 $58,650.00 $63,350.00 $68,050.00 $72,750.00 $77,450.00
Non-Adjusted Income Limits for Hampton City

Percentage: 50% 80% 100% 150%
Income: $36,650.00 $58,640.00 $73,300.00 $109,950.00
Hanover County
MSA: Richmond Median Income: $73,900.00
Click on a column header for sorting.
Percentage One Two Three Four Five Six Seven Eight
30% $15,550.00 $17,750.00 $19,950.00 $22,150.00 $23,950.00 $25,700.00 $27,500.00 $29,250.00
40% $20,720.00 $23,680.00 $26,640.00 $29,560.00 $31,960.00 $34,320.00 $36,680.00 $39,040.00
50% $25,900.00 $29,600.00 $33,300.00 $36,950.00 $39,950.00 $42,900.00 $45,850.00 $48,800.00
60% $31,080.00 $35,520.00 $39,960.00 $44,340.00 $47,940.00 $51,480.00 $55,020.00 $58,560.00
80% $41,400.00 $47,300.00 $53,200.00 $59,100.00 $63,850.00 $68,600.00 $73,300.00 $78,050.00
Non-Adjusted Income Limits for Hanover County
Percentage: 50% 80% 100% 150%
Income: $36,950.00 $59,120.00 $73,900.00 $110,850.00
Harrisonburg City
MSA: Harrisonburg Median Income: $59,400.00
Click on a column header for sorting.
Percentage One Two Three Four Five Six Seven Eight
30% $12,500.00 $14,250.00 $16,050.00 $17,800.00 $19,250.00 $20,650.00 $22,100.00 $23,500.00
40% $19,040.00 $21,400.00 $23,760.00 $25,680.00 $27,600.00 $29,480.00 $31,400.00 $31,640.00
50% $23,800.00 $26,750.00 $29,700.00 $32,100.00 $34,500.00 $36,850.00 $39,250.00 $39,550.00

60% $24,960.00 $28,560.00 $32,100.00 $35,640.00 $38,520.00 $41,400.00 $44,220.00 $47,100.00
80% $33,250.00 $38,000.00 $42,750.00 $47,500.00 $51,300.00 $55,100.00 $58,900.00 $62,700.00
Non-Adjusted Income Limits for Harrisonburg City
Percentage: 50% 80% 100% 150%
Income: $29,700.00 $47,520.00 $59,400.00 $89,100.00
Henrico County
MSA: Richmond Median Income: $73,900.00
Click on a column header for sorting.
Percentage One Two Three Four Five Six Seven Eight
30% $15,550.00 $17,750.00 $19,950.00 $22,150.00 $23,950.00 $25,700.00 $27,500.00 $29,250.00
40% $20,720.00 $23,680.00 $26,640.00 $29,560.00 $31,960.00 $34,320.00 $36,680.00 $39,040.00
50% $25,900.00 $29,600.00 $33,300.00 $36,950.00 $39,950.00 $42,900.00 $45,850.00 $48,800.00
60% $31,080.00 $35,520.00 $39,960.00 $44,340.00 $47,940.00 $51,480.00 $55,020.00 $58,560.00
80% $41,400.00 $47,300.00 $53,200.00 $59,100.00 $63,850.00 $68,600.00 $73,300.00 $78,050.00
Non-Adjusted Income Limits for Henrico County
Percentage: 50% 80% 100% 150%
Income: $36,950.00 $59,120.00 $73,900.00 $110,850.00
Henry County
MSA: Non-Metropolitan Median Income: $40,900.00
Click on a column header for sorting.
Percentage One Two Three Four Five Six Seven Eight

30% $10,850.00 $12,400.00 $13,950.00 $15,500.00 $16,750.00 $18,000.00 $19,250.00 $20,500.00
40% $14,480.00 $16,520.00 $18,600.00 $20,640.00 $22,320.00 $23,960.00 $25,600.00 $27,280.00
50% $18,100.00 $20,650.00 $23,250.00 $25,800.00 $27,900.00 $29,950.00 $32,000.00 $34,100.00
60% $21,720.00 $24,780.00 $27,900.00 $30,960.00 $33,480.00 $35,940.00 $38,400.00 $40,920.00
80% $28,950.00 $33,050.00 $37,200.00 $41,300.00 $44,650.00 $47,950.00 $51,250.00 $54,550.00
Non-Adjusted Income Limits for Henry County
Percentage: 50% 80% 100% 150%
Income: $20,450.00 $32,720.00 $40,900.00 $61,350.00
Highland County
MSA: Non-Metropolitan Median Income: $54,600.00
Click on a column header for sorting.
Percentage One Two Three Four Five Six Seven Eight
30% $11,500.00 $13,150.00 $14,800.00 $16,400.00 $17,750.00 $19,050.00 $20,350.00 $21,650.00
40% $15,320.00 $17,480.00 $19,680.00 $21,840.00 $23,600.00 $25,360.00 $27,120.00 $28,840.00
50% $19,150.00 $21,850.00 $24,600.00 $27,300.00 $29,500.00 $31,700.00 $33,900.00 $36,050.00
60% $22,980.00 $26,220.00 $29,520.00 $32,760.00 $35,400.00 $38,040.00 $40,680.00 $43,260.00
80% $30,600.00 $35,000.00 $39,350.00 $43,700.00 $47,200.00 $50,700.00 $54,200.00 $57,700.00
Non-Adjusted Income Limits for Highland County
Percentage: 50% 80% 100% 150%
Income: $27,300.00 $43,680.00 $54,600.00 $81,900.00
Hopewell City

MSA: Richmond Median Income: $73,900.00
Click on a column header for sorting.
Percentage One Two Three Four Five Six Seven Eight
30% $15,550.00 $17,750.00 $19,950.00 $22,150.00 $23,950.00 $25,700.00 $27,500.00 $29,250.00
40% $20,720.00 $23,680.00 $26,640.00 $29,560.00 $31,960.00 $34,320.00 $36,680.00 $39,040.00
50% $25,900.00 $29,600.00 $33,300.00 $36,950.00 $39,950.00 $42,900.00 $45,850.00 $48,800.00
60% $31,080.00 $35,520.00 $39,960.00 $44,340.00 $47,940.00 $51,480.00 $55,020.00 $58,560.00
80% $41,400.00 $47,300.00 $53,200.00 $59,100.00 $63,850.00 $68,600.00 $73,300.00 $78,050.00
Non-Adjusted Income Limits for Hopewell City
Percentage: 50% 80% 100% 150%
Income: $36,950.00 $59,120.00 $73,900.00 $110,850.00
Isle of Wight County
MSA: Hampton Roads Median Income: $73,300.00
Click on a column header for sorting.
Percentage One Two Three Four Five Six Seven Eight
30% $15,400.00 $17,600.00 $19,800.00 $22,000.00 $23,800.00 $25,550.00 $27,300.00 $29,050.00
40% $20,560.00 $23,480.00 $26,400.00 $29,320.00 $31,680.00 $34,040.00 $36,360.00 $38,720.00
50% $25,700.00 $29,350.00 $33,000.00 $36,650.00 $39,600.00 $42,550.00 $45,450.00 $48,400.00
60% $30,840.00 $35,220.00 $39,600.00 $43,980.00 $47,520.00 $51,060.00 $54,540.00 $58,080.00
80% $41,100.00 $46,950.00 $52,800.00 $58,650.00 $63,350.00 $68,050.00 $72,750.00 $77,450.00
Non-Adjusted Income Limits for Isle of Wight County

Percentage: 50% 80% 100% 150%
Income: $36,650.00 $58,640.00 $73,300.00 $109,950.00
James City County
MSA: Hampton Roads Median Income: $73,300.00
Click on a column header for sorting.
Percentage One Two Three Four Five Six Seven Eight
30% $15,400.00 $17,600.00 $19,800.00 $22,000.00 $23,800.00 $25,550.00 $27,300.00 $29,050.00
40% $20,560.00 $23,480.00 $26,400.00 $29,320.00 $31,680.00 $34,040.00 $36,360.00 $38,720.00
50% $25,700.00 $29,350.00 $33,000.00 $36,650.00 $39,600.00 $42,550.00 $45,450.00 $48,400.00
60% $30,840.00 $35,220.00 $39,600.00 $43,980.00 $47,520.00 $51,060.00 $54,540.00 $58,080.00
80% $41,100.00 $46,950.00 $52,800.00 $58,650.00 $63,350.00 $68,050.00 $72,750.00 $77,450.00
Non-Adjusted Income Limits for James City County
Percentage: 50% 80% 100% 150%
Income: $36,650.00 $58,640.00 $73,300.00 $109,950.00
King and Queen County
MSA: Richmond Median Income: $73,900.00
Click on a column header for sorting.
Percentage One Two Three Four Five Six Seven Eight
30% $15,550.00 $17,750.00 $19,950.00 $22,150.00 $23,950.00 $25,700.00 $27,500.00 $29,250.00
40% $20,720.00 $23,680.00 $26,640.00 $29,560.00 $31,960.00 $34,320.00 $36,680.00 $39,040.00
50% $25,900.00 $29,600.00 $33,300.00 $36,950.00 $39,950.00 $42,900.00 $45,850.00 $48,800.00

60% $31,080.00 $35,520.00 $39,960.00 $44,340.00 $47,940.00 $51,480.00 $55,020.00 $58,560.00
80% $41,400.00 $47,300.00 $53,200.00 $59,100.00 $63,850.00 $68,600.00 $73,300.00 $78,050.00
Non-Adjusted Income Limits for King and Queen County
Percentage: 50% 80% 100% 150%
Income: $36,950.00 $59,120.00 $73,900.00 $110,850.00
King George County
MSA: Non-Metropolitan Median Income: $92,600.00
Click on a column header for sorting.
Percentage One Two Three Four Five Six Seven Eight
30% $19,200.00 $21,950.00 $24,700.00 $27,400.00 $29,600.00 $31,800.00 $34,000.00 $36,200.00
40% $25,600.00 $29,240.00 $32,880.00 $36,520.00 $39,480.00 $42,400.00 $45,320.00 $48,240.00
50% $32,000.00 $36,550.00 $41,100.00 $45,650.00 $49,350.00 $53,000.00 $56,650.00 $60,300.00
60% $38,400.00 $43,860.00 $49,320.00 $54,780.00 $59,220.00 $63,600.00 $67,980.00 $72,360.00
80% $45,100.00 $51,550.00 $58,000.00 $64,400.00 $69,600.00 $74,750.00 $79,900.00 $85,050.00
Non-Adjusted Income Limits for King George County
Percentage: 50% 80% 100% 150%
Income: $46,300.00 $74,080.00 $92,600.00 $138,900.00
King William County
MSA: Richmond Median Income: $73,900.00
Click on a column header for sorting.
Percentage One Two Three Four Five Six Seven Eight

30% $15,550.00 $17,750.00 $19,950.00 $22,150.00 $23,950.00 $25,700.00 $27,500.00 $29,250.00
40% $20,720.00 $23,680.00 $26,640.00 $29,560.00 $31,960.00 $34,320.00 $36,680.00 $39,040.00
50% $25,900.00 $29,600.00 $33,300.00 $36,950.00 $39,950.00 $42,900.00 $45,850.00 $48,800.00
60% $31,080.00 $35,520.00 $39,960.00 $44,340.00 $47,940.00 $51,480.00 $55,020.00 $58,560.00
80% $41,400.00 $47,300.00 $53,200.00 $59,100.00 $63,850.00 $68,600.00 $73,300.00 $78,050.00
Non-Adjusted Income Limits for King William County
Percentage: 50% 80% 100% 150%
Income: $36,950.00 $59,120.00 $73,900.00 $110,850.00
Lancaster County
MSA: Non-Metropolitan Median Income: $58,500.00
Click on a column header for sorting.
Percentage One Two Three Four Five Six Seven Eight
30% $12,300.00 $14,050.00 $15,800.00 $17,550.00 $19,000.00 $20,400.00 $21,800.00 $23,200.00
40% $16,400.00 $18,720.00 $21,080.00 $23,400.00 $25,280.00 $27,160.00 $29,040.00 $30,920.00
50% $20,500.00 $23,400.00 $26,350.00 $29,250.00 $31,600.00 $33,950.00 $36,300.00 $38,650.00
60% $24,600.00 $28,080.00 $31,620.00 $35,100.00 $37,920.00 $40,740.00 $43,560.00 $46,380.00
80% $32,800.00 $37,450.00 $42,150.00 $46,800.00 $50,550.00 $54,300.00 $58,050.00 $61,800.00
Non-Adjusted Income Limits for Lancaster County
Percentage: 50% 80% 100% 150%
Income: $29,250.00 $46,800.00 $58,500.00 $87,750.00
Lee County

MSA: Non-Metropolitan Median Income: $43,800.00
Click on a column header for sorting.
Percentage One Two Three Four Five Six Seven Eight
30% $10,850.00 $12,400.00 $13,950.00 $15,500.00 $16,750.00 $18,000.00 $19,250.00 $20,500.00
40% $14,480.00 $16,520.00 $18,600.00 $20,640.00 $22,320.00 $23,960.00 $25,600.00 $27,280.00
50% $18,100.00 $20,650.00 $23,250.00 $25,800.00 $27,900.00 $29,950.00 $32,000.00 $34,100.00
60% $21,720.00 $24,780.00 $27,900.00 $30,960.00 $33,480.00 $35,940.00 $38,400.00 $40,920.00
80% $28,950.00 $33,050.00 $37,200.00 $41,300.00 $44,650.00 $47,950.00 $51,250.00 $54,550.00
Non-Adjusted Income Limits for Lee County
Percentage: 50% 80% 100% 150%
Income: $21,900.00 $35,040.00 $43,800.00 $65,700.00
Lexington City
MSA: Non-Metropolitan Median Income: $55,300.00
Click on a column header for sorting.
Percentage One Two Three Four Five Six Seven Eight
30% $11,650.00 $13,300.00 $14,950.00 $16,600.00 $17,950.00 $19,300.00 $20,600.00 $21,950.00
40% $15,520.00 $17,720.00 $19,920.00 $22,120.00 $23,920.00 $25,680.00 $27,440.00 $29,200.00
50% $19,400.00 $22,150.00 $24,900.00 $27,650.00 $29,900.00 $32,100.00 $34,300.00 $36,500.00
60% $23,280.00 $26,580.00 $29,880.00 $33,180.00 $35,880.00 $38,520.00 $41,160.00 $43,800.00
80% $41,100.00 $46,950.00 $52,800.00 $58,650.00 $63,350.00 $68,050.00 $72,750.00 $77,450.00
Non-Adjusted Income Limits for Lexington City
Percentage: 50% 80% 100% 150%
Income: $27,650.00 $44,240.00 $55,300.00 $82,950.00
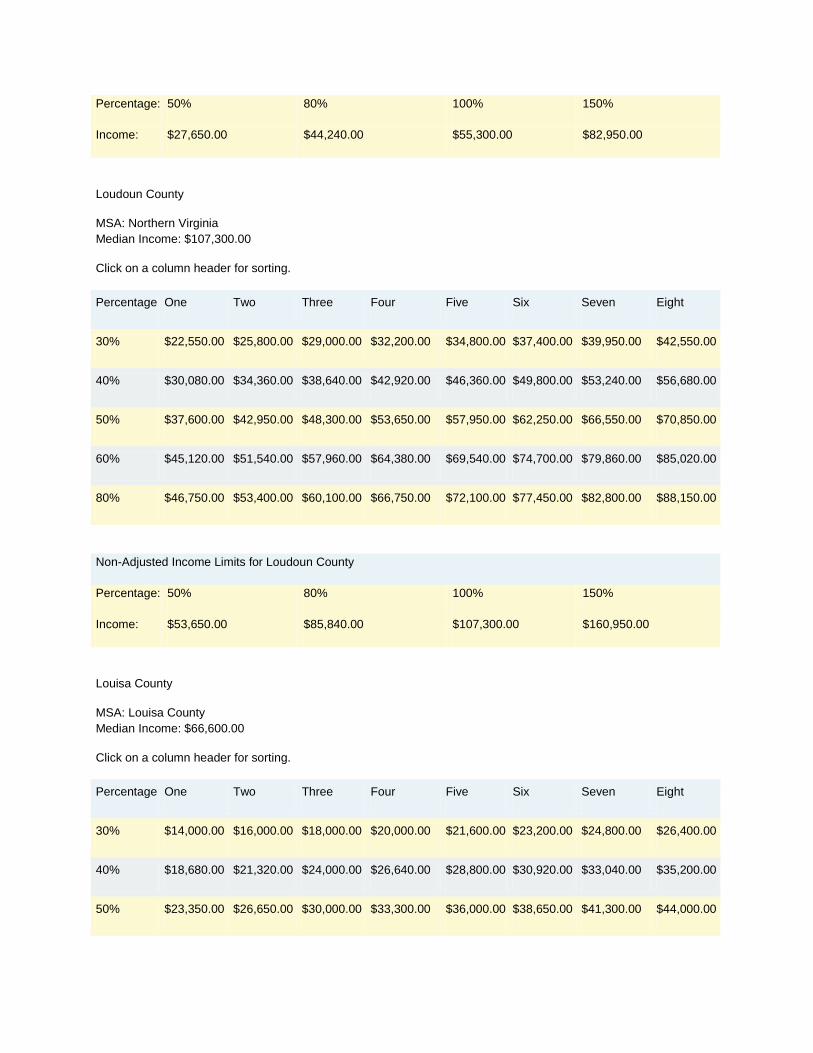
Loudoun County
MSA: Northern Virginia Median Income: $107,300.00
Click on a column header for sorting.
Percentage One Two Three Four Five Six Seven Eight
30% $22,550.00 $25,800.00 $29,000.00 $32,200.00 $34,800.00 $37,400.00 $39,950.00 $42,550.00
40% $30,080.00 $34,360.00 $38,640.00 $42,920.00 $46,360.00 $49,800.00 $53,240.00 $56,680.00
50% $37,600.00 $42,950.00 $48,300.00 $53,650.00 $57,950.00 $62,250.00 $66,550.00 $70,850.00
60% $45,120.00 $51,540.00 $57,960.00 $64,380.00 $69,540.00 $74,700.00 $79,860.00 $85,020.00
80% $46,750.00 $53,400.00 $60,100.00 $66,750.00 $72,100.00 $77,450.00 $82,800.00 $88,150.00
Non-Adjusted Income Limits for Loudoun County
Percentage: 50% 80% 100% 150%
Income: $53,650.00 $85,840.00 $107,300.00 $160,950.00
Louisa County
MSA: Louisa County Median Income: $66,600.00
Click on a column header for sorting.
Percentage One Two Three Four Five Six Seven Eight
30% $14,000.00 $16,000.00 $18,000.00 $20,000.00 $21,600.00 $23,200.00 $24,800.00 $26,400.00
40% $18,680.00 $21,320.00 $24,000.00 $26,640.00 $28,800.00 $30,920.00 $33,040.00 $35,200.00
50% $23,350.00 $26,650.00 $30,000.00 $33,300.00 $36,000.00 $38,650.00 $41,300.00 $44,000.00

60% $28,020.00 $31,980.00 $36,000.00 $39,960.00 $43,200.00 $46,380.00 $49,560.00 $52,800.00
80% $37,350.00 $42,650.00 $48,000.00 $53,300.00 $57,600.00 $61,850.00 $66,100.00 $70,400.00
Non-Adjusted Income Limits for Louisa County
Percentage: 50% 80% 100% 150%
Income: $33,300.00 $53,280.00 $66,600.00 $99,900.00
Lunenburg County
MSA: Non-Metropolitan Median Income: $44,600.00
Click on a column header for sorting.
Percentage One Two Three Four Five Six Seven Eight
30% $10,850.00 $12,400.00 $13,950.00 $15,500.00 $16,750.00 $18,000.00 $19,250.00 $20,500.00
40% $14,480.00 $16,520.00 $18,600.00 $20,640.00 $22,320.00 $23,960.00 $25,600.00 $27,280.00
50% $18,100.00 $20,650.00 $23,250.00 $25,800.00 $27,900.00 $29,950.00 $32,000.00 $34,100.00
60% $21,720.00 $24,780.00 $27,900.00 $30,960.00 $33,480.00 $35,940.00 $38,400.00 $40,920.00
80% $28,950.00 $33,050.00 $37,200.00 $41,300.00 $44,650.00 $47,950.00 $51,250.00 $54,550.00
Non-Adjusted Income Limits for Lunenburg County
Percentage: 50% 80% 100% 150%
Income: $22,300.00 $35,680.00 $44,600.00 $66,900.00
Lynchburg City
MSA: Lynchburg Median Income: $57,900.00
Click on a column header for sorting.
Percentage One Two Three Four Five Six Seven Eight

30% $12,150.00 $13,900.00 $15,650.00 $17,350.00 $18,750.00 $20,150.00 $21,550.00 $22,950.00
40% $16,240.00 $18,560.00 $20,880.00 $23,160.00 $25,040.00 $26,880.00 $28,720.00 $30,600.00
50% $20,300.00 $23,200.00 $26,100.00 $28,950.00 $31,300.00 $33,600.00 $35,900.00 $38,250.00
60% $24,360.00 $27,840.00 $31,320.00 $34,740.00 $37,560.00 $40,320.00 $43,080.00 $45,900.00
80% $32,450.00 $37,050.00 $41,700.00 $46,300.00 $50,050.00 $53,750.00 $57,450.00 $61,150.00
Non-Adjusted Income Limits for Lynchburg City
Percentage: 50% 80% 100% 150%
Income: $28,950.00 $46,320.00 $57,900.00 $86,850.00
Madison County
MSA: Non-Metropolitan Median Income: $69,300.00
Click on a column header for sorting.
Percentage One Two Three Four Five Six Seven Eight
30% $14,600.00 $16,650.00 $18,750.00 $20,800.00 $22,500.00 $24,150.00 $25,800.00 $27,500.00
40% $19,440.00 $22,200.00 $24,960.00 $27,720.00 $29,960.00 $32,160.00 $34,400.00 $36,600.00
50% $24,300.00 $27,750.00 $31,200.00 $34,650.00 $37,450.00 $40,200.00 $43,000.00 $45,750.00
60% $29,160.00 $33,300.00 $37,440.00 $41,580.00 $44,940.00 $48,240.00 $51,600.00 $54,900.00
80% $38,800.00 $44,350.00 $49,900.00 $55,400.00 $59,850.00 $64,300.00 $68,700.00 $73,150.00
Non-Adjusted Income Limits for Madison County
Percentage: 50% 80% 100% 150%
Income: $34,650.00 $55,440.00 $69,300.00 $103,950.00
Manassas City

MSA: Northern Virginia Median Income: $107,300.00
Click on a column header for sorting.
Percentage One Two Three Four Five Six Seven Eight
30% $22,550.00 $25,800.00 $29,000.00 $32,200.00 $34,800.00 $37,400.00 $39,950.00 $42,550.00
40% $30,080.00 $34,360.00 $38,640.00 $42,920.00 $46,360.00 $49,800.00 $53,240.00 $56,680.00
50% $37,600.00 $42,950.00 $48,300.00 $53,650.00 $57,950.00 $62,250.00 $66,550.00 $70,850.00
60% $45,120.00 $51,540.00 $57,960.00 $64,380.00 $69,540.00 $74,700.00 $79,860.00 $85,020.00
80% $46,750.00 $53,400.00 $60,100.00 $66,750.00 $72,100.00 $77,450.00 $82,800.00 $88,150.00
Non-Adjusted Income Limits for Manassas City
Percentage: 50% 80% 100% 150%
Income: $53,650.00 $85,840.00 $107,300.00 $160,950.00
Manassas Park City
MSA: Northern Virginia Median Income: $107,300.00
Click on a column header for sorting.
Percentage One Two Three Four Five Six Seven Eight
30% $22,550.00 $25,800.00 $29,000.00 $32,200.00 $34,800.00 $37,400.00 $39,950.00 $42,550.00
40% $30,080.00 $34,360.00 $38,640.00 $42,920.00 $46,360.00 $49,800.00 $53,240.00 $56,680.00
50% $37,600.00 $42,950.00 $48,300.00 $53,650.00 $57,950.00 $62,250.00 $66,550.00 $70,850.00
60% $45,120.00 $51,540.00 $57,960.00 $64,380.00 $69,540.00 $74,700.00 $79,860.00 $85,020.00
80% $46,750.00 $53,400.00 $60,100.00 $66,750.00 $72,100.00 $77,450.00 $82,800.00 $88,150.00
Non-Adjusted Income Limits for Manassas Park City

Percentage: 50% 80% 100% 150%
Income: $53,650.00 $85,840.00 $107,300.00 $160,950.00
Martinsville City
MSA: Non-Metropolitan Median Income: $40,900.00
Click on a column header for sorting.
Percentage One Two Three Four Five Six Seven Eight
30% $10,850.00 $12,400.00 $13,950.00 $15,500.00 $16,750.00 $18,000.00 $19,250.00 $20,500.00
40% $14,480.00 $16,520.00 $18,600.00 $20,640.00 $22,320.00 $23,960.00 $25,600.00 $27,280.00
50% $18,100.00 $20,650.00 $23,250.00 $25,800.00 $27,900.00 $29,950.00 $32,000.00 $34,100.00
60% $21,720.00 $24,780.00 $27,900.00 $30,960.00 $33,480.00 $35,940.00 $38,400.00 $40,920.00
80% $28,950.00 $33,050.00 $37,200.00 $41,300.00 $44,650.00 $47,950.00 $51,250.00 $54,550.00
Non-Adjusted Income Limits for Martinsville City
Percentage: 50% 80% 100% 150%
Income: $20,450.00 $32,720.00 $40,900.00 $61,350.00
Mathews County
MSA: Hampton Roads Median Income: $73,300.00
Click on a column header for sorting.
Percentage One Two Three Four Five Six Seven Eight
30% $15,400.00 $17,600.00 $19,800.00 $22,000.00 $23,800.00 $25,550.00 $27,300.00 $29,050.00
40% $20,560.00 $23,480.00 $26,400.00 $29,320.00 $31,680.00 $34,040.00 $36,360.00 $38,720.00
50% $25,700.00 $29,350.00 $33,000.00 $36,650.00 $39,600.00 $42,550.00 $45,450.00 $48,400.00
60% $30,840.00 $35,220.00 $39,600.00 $43,980.00 $47,520.00 $51,060.00 $54,540.00 $58,080.00
80% $41,100.00 $46,950.00 $52,800.00 $58,650.00 $63,350.00 $68,050.00 $72,750.00 $77,450.00
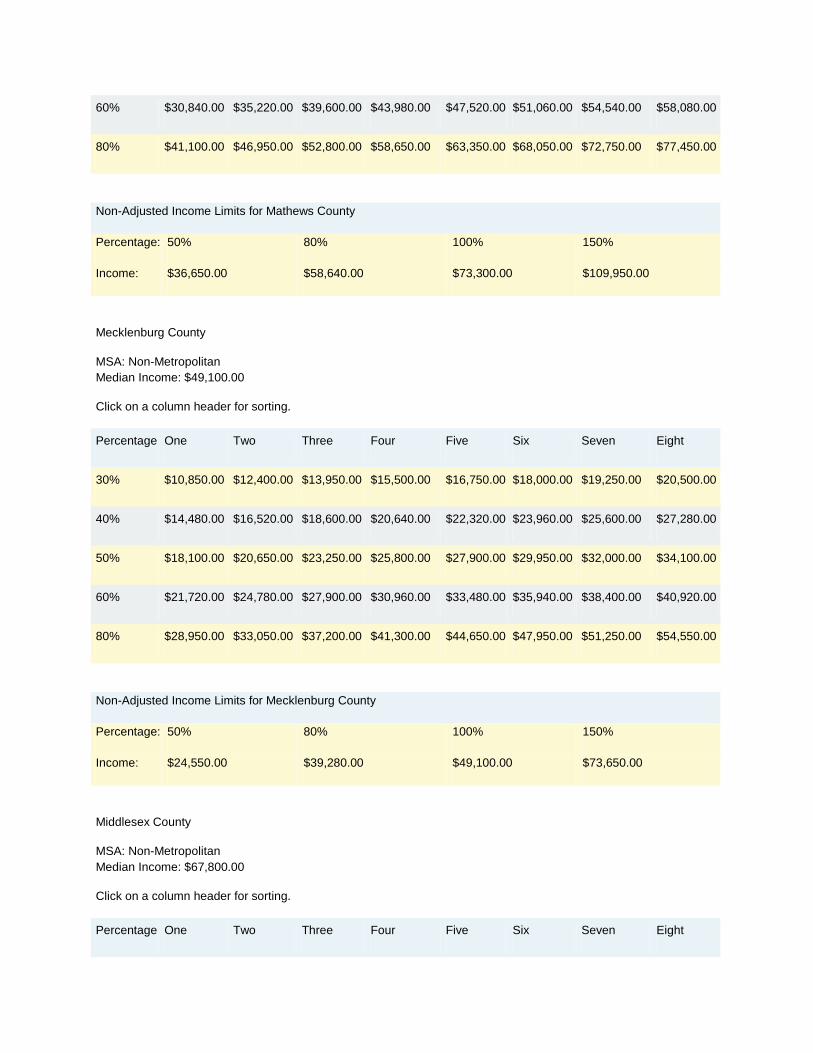
Non-Adjusted Income Limits for Mathews County
Percentage: 50% 80% 100% 150%
Income: $36,650.00 $58,640.00 $73,300.00 $109,950.00
Mecklenburg County
MSA: Non-Metropolitan Median Income: $49,100.00
Click on a column header for sorting.
Percentage One Two Three Four Five Six Seven Eight
30% $10,850.00 $12,400.00 $13,950.00 $15,500.00 $16,750.00 $18,000.00 $19,250.00 $20,500.00
40% $14,480.00 $16,520.00 $18,600.00 $20,640.00 $22,320.00 $23,960.00 $25,600.00 $27,280.00
50% $18,100.00 $20,650.00 $23,250.00 $25,800.00 $27,900.00 $29,950.00 $32,000.00 $34,100.00
60% $21,720.00 $24,780.00 $27,900.00 $30,960.00 $33,480.00 $35,940.00 $38,400.00 $40,920.00
80% $28,950.00 $33,050.00 $37,200.00 $41,300.00 $44,650.00 $47,950.00 $51,250.00 $54,550.00
Non-Adjusted Income Limits for Mecklenburg County
Percentage: 50% 80% 100% 150%
Income: $24,550.00 $39,280.00 $49,100.00 $73,650.00
Middlesex County
MSA: Non-Metropolitan Median Income: $67,800.00
Click on a column header for sorting.
Percentage One Two Three Four Five Six Seven Eight

30% $14,200.00 $16,200.00 $18,250.00 $20,250.00 $21,900.00 $23,500.00 $25,150.00 $26,750.00
40% $18,920.00 $21,600.00 $24,320.00 $27,000.00 $29,160.00 $31,320.00 $33,480.00 $35,640.00
50% $23,650.00 $27,000.00 $30,400.00 $33,750.00 $36,450.00 $39,150.00 $41,850.00 $44,550.00
60% $28,380.00 $32,400.00 $36,480.00 $40,500.00 $43,740.00 $46,980.00 $50,220.00 $53,460.00
80% $37,800.00 $43,200.00 $48,600.00 $54,000.00 $58,350.00 $62,650.00 $67,000.00 $71,300.00
Non-Adjusted Income Limits for Middlesex County
Percentage: 50% 80% 100% 150%
Income: $33,900.00 $54,240.00 $67,800.00 $101,700.00
Montgomery County
MSA: Non-Metropolitan Median Income: $68,800.00
Click on a column header for sorting.
Percentage One Two Three Four Five Six Seven Eight
30% $14,500.00 $16,550.00 $18,600.00 $20,650.00 $22,350.00 $24,000.00 $25,650.00 $27,300.00
40% $19,280.00 $22,040.00 $24,800.00 $27,520.00 $29,760.00 $31,960.00 $34,160.00 $36,360.00
50% $24,100.00 $27,550.00 $31,000.00 $34,400.00 $37,200.00 $39,950.00 $42,700.00 $45,450.00
60% $28,920.00 $33,060.00 $37,200.00 $41,280.00 $44,640.00 $47,940.00 $51,240.00 $54,540.00
80% $38,550.00 $44,050.00 $49,550.00 $55,050.00 $59,500.00 $63,900.00 $68,300.00 $72,700.00
Non-Adjusted Income Limits for Montgomery County
Percentage: 50% 80% 100% 150%
Income: $34,400.00 $55,040.00 $68,800.00 $103,200.00
Nelson County

MSA: Charlottesville Median Income: $77,500.00
Click on a column header for sorting.
Percentage One Two Three Four Five Six Seven Eight
30% $16,300.00 $18,600.00 $20,950.00 $23,250.00 $25,150.00 $27,000.00 $28,850.00 $30,700.00
40% $21,720.00 $24,800.00 $27,920.00 $31,000.00 $33,480.00 $35,960.00 $38,440.00 $40,920.00
50% $27,150.00 $31,000.00 $34,900.00 $38,750.00 $41,850.00 $44,950.00 $48,050.00 $51,150.00
60% $32,580.00 $37,200.00 $41,880.00 $46,500.00 $50,220.00 $53,940.00 $57,660.00 $61,380.00
80% $43,400.00 $49,600.00 $55,800.00 $62,000.00 $67,000.00 $71,950.00 $76,900.00 $81,850.00
Non-Adjusted Income Limits for Nelson County
Percentage: 50% 80% 100% 150%
Income: $38,750.00 $62,000.00 $77,500.00 $116,250.00
New Kent County
MSA: Richmond Median Income: $73,900.00
Click on a column header for sorting.
Percentage One Two Three Four Five Six Seven Eight
30% $15,550.00 $17,750.00 $19,950.00 $22,150.00 $23,950.00 $25,700.00 $27,500.00 $29,250.00
40% $20,720.00 $23,680.00 $26,640.00 $29,560.00 $31,960.00 $34,320.00 $36,680.00 $39,040.00
50% $25,900.00 $29,600.00 $33,300.00 $36,950.00 $39,950.00 $42,900.00 $45,850.00 $48,800.00
60% $31,080.00 $35,520.00 $39,960.00 $44,340.00 $47,940.00 $51,480.00 $55,020.00 $58,560.00
80% $41,400.00 $47,300.00 $53,200.00 $59,100.00 $63,850.00 $68,600.00 $73,300.00 $78,050.00
Non-Adjusted Income Limits for New Kent County

Percentage: 50% 80% 100% 150%
Income: $36,950.00 $59,120.00 $73,900.00 $110,850.00
Newport News City
MSA: Hampton Roads Median Income: $73,300.00
Click on a column header for sorting.
Percentage One Two Three Four Five Six Seven Eight
30% $15,400.00 $17,600.00 $19,800.00 $22,000.00 $23,800.00 $25,550.00 $27,300.00 $29,050.00
40% $20,560.00 $23,480.00 $26,400.00 $29,320.00 $31,680.00 $34,040.00 $36,360.00 $38,720.00
50% $25,700.00 $29,350.00 $33,000.00 $36,650.00 $39,600.00 $42,550.00 $45,450.00 $48,400.00
60% $30,840.00 $35,220.00 $39,600.00 $43,980.00 $47,520.00 $51,060.00 $54,540.00 $58,080.00
80% $41,100.00 $46,950.00 $52,800.00 $58,650.00 $63,350.00 $68,050.00 $72,750.00 $77,450.00
Non-Adjusted Income Limits for Newport News City
Percentage: 50% 80% 100% 150%
Income: $36,650.00 $58,640.00 $73,300.00 $109,950.00
Norfolk City
MSA: Hampton Roads Median Income: $73,300.00
Click on a column header for sorting.
Percentage One Two Three Four Five Six Seven Eight
30% $15,400.00 $17,600.00 $19,800.00 $22,000.00 $23,800.00 $25,550.00 $27,300.00 $29,050.00
40% $20,560.00 $23,480.00 $26,400.00 $29,320.00 $31,680.00 $34,040.00 $36,360.00 $38,720.00
50% $25,700.00 $29,350.00 $33,000.00 $36,650.00 $39,600.00 $42,550.00 $45,450.00 $48,400.00

60% $30,840.00 $35,220.00 $39,600.00 $43,980.00 $47,520.00 $51,060.00 $54,540.00 $58,080.00
80% $41,100.00 $46,950.00 $52,800.00 $58,650.00 $63,350.00 $68,050.00 $72,750.00 $77,450.00
Non-Adjusted Income Limits for Norfolk City
Percentage: 50% 80% 100% 150%
Income: $36,650.00 $58,640.00 $73,300.00 $109,950.00
Northampton County
MSA: Non-Metropolitan Median Income: $51,000.00
Click on a column header for sorting.
Percentage One Two Three Four Five Six Seven Eight
30% $10,850.00 $12,400.00 $13,950.00 $15,500.00 $16,750.00 $18,000.00 $19,250.00 $20,500.00
40% $14,480.00 $16,520.00 $18,600.00 $20,640.00 $22,320.00 $23,960.00 $25,600.00 $27,280.00
50% $18,100.00 $20,650.00 $23,250.00 $25,800.00 $27,900.00 $29,950.00 $32,000.00 $34,100.00
60% $21,720.00 $24,780.00 $27,900.00 $30,960.00 $33,480.00 $35,940.00 $38,400.00 $40,920.00
80% $28,950.00 $33,050.00 $37,200.00 $41,300.00 $44,650.00 $47,950.00 $51,250.00 $54,550.00
Non-Adjusted Income Limits for Northampton County
Percentage: 50% 80% 100% 150%
Income: $25,500.00 $40,800.00 $51,000.00 $76,500.00
Northumberland County
MSA: Non-Metropolitan Median Income: $64,700.00
Click on a column header for sorting.
Percentage One Two Three Four Five Six Seven Eight

30% $13,600.00 $15,550.00 $17,500.00 $19,400.00 $21,000.00 $22,550.00 $24,100.00 $25,650.00
40% $18,120.00 $20,720.00 $23,320.00 $25,880.00 $27,960.00 $30,040.00 $32,120.00 $34,200.00
50% $22,650.00 $25,900.00 $29,150.00 $32,350.00 $34,950.00 $37,550.00 $40,150.00 $42,750.00
60% $27,180.00 $31,080.00 $34,980.00 $38,820.00 $41,940.00 $45,060.00 $48,180.00 $51,300.00
80% $36,250.00 $41,400.00 $46,600.00 $51,750.00 $55,900.00 $60,050.00 $64,200.00 $68,350.00
Non-Adjusted Income Limits for Northumberland County
Percentage: 50% 80% 100% 150%
Income: $32,350.00 $51,760.00 $64,700.00 $97,050.00
Norton City
MSA: Non-Metropolitan Median Income: $45,100.00
Click on a column header for sorting.
Percentage One Two Three Four Five Six Seven Eight
30% $10,850.00 $12,400.00 $13,950.00 $15,500.00 $16,750.00 $18,000.00 $19,250.00 $20,500.00
40% $14,480.00 $16,520.00 $18,600.00 $20,640.00 $22,320.00 $23,960.00 $25,600.00 $27,280.00
50% $18,100.00 $20,650.00 $23,250.00 $25,800.00 $27,900.00 $29,950.00 $32,000.00 $34,100.00
60% $21,720.00 $24,780.00 $27,900.00 $30,960.00 $33,480.00 $35,940.00 $38,400.00 $40,920.00
80% $28,950.00 $33,050.00 $37,200.00 $41,300.00 $44,650.00 $47,950.00 $51,250.00 $54,550.00
Non-Adjusted Income Limits for Norton City
Percentage: 50% 80% 100% 150%
Income: $22,550.00 $36,080.00 $45,100.00 $67,650.00
Nottoway County

MSA: Non-Metropolitan Median Income: $47,400.00
Click on a column header for sorting.
Percentage One Two Three Four Five Six Seven Eight
30% $10,850.00 $12,400.00 $13,950.00 $15,500.00 $16,750.00 $18,000.00 $19,250.00 $20,500.00
40% $14,480.00 $16,520.00 $18,600.00 $20,640.00 $22,320.00 $23,960.00 $25,600.00 $27,280.00
50% $18,100.00 $20,650.00 $23,250.00 $25,800.00 $27,900.00 $29,950.00 $32,000.00 $34,100.00
60% $21,720.00 $24,780.00 $27,900.00 $30,960.00 $33,480.00 $35,940.00 $38,400.00 $40,920.00
80% $28,950.00 $33,050.00 $37,200.00 $41,300.00 $44,650.00 $47,950.00 $51,250.00 $54,550.00
Non-Adjusted Income Limits for Nottoway County
Percentage: 50% 80% 100% 150%
Income: $23,700.00 $37,920.00 $47,400.00 $71,100.00
Orange County
MSA: Non-Metropolitan Median Income: $67,900.00
Click on a column header for sorting.
Percentage One Two Three Four Five Six Seven Eight
30% $14,250.00 $16,300.00 $18,350.00 $20,350.00 $22,000.00 $23,650.00 $25,250.00 $26,900.00
40% $19,040.00 $21,760.00 $24,480.00 $27,160.00 $29,360.00 $31,520.00 $33,680.00 $35,880.00
50% $23,800.00 $27,200.00 $30,600.00 $33,950.00 $36,700.00 $39,400.00 $42,100.00 $44,850.00
60% $28,560.00 $32,640.00 $36,720.00 $40,740.00 $44,040.00 $47,280.00 $50,520.00 $53,820.00
80% $38,050.00 $43,450.00 $48,900.00 $54,300.00 $58,650.00 $63,000.00 $67,350.00 $71,700.00
Non-Adjusted Income Limits for Orange County

Percentage: 50% 80% 100% 150%
Income: $33,950.00 $54,320.00 $67,900.00 $101,850.00
Page County
MSA: Non-Metropolitan Median Income: $54,800.00
Click on a column header for sorting.
Percentage One Two Three Four Five Six Seven Eight
30% $11,550.00 $13,200.00 $14,850.00 $16,450.00 $17,800.00 $19,100.00 $20,400.00 $21,750.00
40% $15,360.00 $17,560.00 $19,760.00 $21,920.00 $23,680.00 $25,440.00 $27,200.00 $28,960.00
50% $19,200.00 $21,950.00 $24,700.00 $27,400.00 $29,600.00 $31,800.00 $34,000.00 $36,200.00
60% $23,040.00 $26,340.00 $29,640.00 $32,880.00 $35,520.00 $38,160.00 $40,800.00 $43,440.00
80% $30,700.00 $35,100.00 $39,500.00 $43,850.00 $47,400.00 $50,900.00 $54,400.00 $57,900.00
Non-Adjusted Income Limits for Page County
Percentage: 50% 80% 100% 150%
Income: $27,400.00 $43,840.00 $54,800.00 $82,200.00
Patrick County
MSA: Non-Metropolitan Median Income: $43,700.00
Click on a column header for sorting.
Percentage One Two Three Four Five Six Seven Eight
30% $10,850.00 $12,400.00 $13,950.00 $15,500.00 $16,750.00 $18,000.00 $19,250.00 $20,500.00
40% $14,480.00 $16,520.00 $18,600.00 $20,640.00 $22,320.00 $23,960.00 $25,600.00 $27,280.00
50% $18,100.00 $20,650.00 $23,250.00 $25,800.00 $27,900.00 $29,950.00 $32,000.00 $34,100.00

60% $21,720.00 $24,780.00 $27,900.00 $30,960.00 $33,480.00 $35,940.00 $38,400.00 $40,920.00
80% $28,950.00 $33,050.00 $37,200.00 $41,300.00 $44,650.00 $47,950.00 $51,250.00 $54,550.00
Non-Adjusted Income Limits for Patrick County
Percentage: 50% 80% 100% 150%
Income: $21,850.00 $34,960.00 $43,700.00 $65,550.00
Petersburg City
MSA: Richmond Median Income: $73,900.00
Click on a column header for sorting.
Percentage One Two Three Four Five Six Seven Eight
30% $15,550.00 $17,750.00 $19,950.00 $22,150.00 $23,950.00 $25,700.00 $27,500.00 $29,250.00
40% $20,720.00 $23,680.00 $26,640.00 $29,560.00 $31,960.00 $34,320.00 $36,680.00 $39,040.00
50% $25,900.00 $29,600.00 $33,300.00 $36,950.00 $39,950.00 $42,900.00 $45,850.00 $48,800.00
60% $31,080.00 $35,520.00 $39,960.00 $44,340.00 $47,940.00 $51,480.00 $55,020.00 $58,560.00
80% $41,400.00 $47,300.00 $53,200.00 $59,100.00 $63,850.00 $68,600.00 $73,300.00 $78,050.00
Non-Adjusted Income Limits for Petersburg City
Percentage: 50% 80% 100% 150%
Income: $36,950.00 $59,120.00 $73,900.00 $110,850.00
Pittsylvania County
MSA: Danville Median Income: $45,300.00
Click on a column header for sorting.
Percentage One Two Three Four Five Six Seven Eight

30% $10,850.00 $12,400.00 $13,950.00 $15,500.00 $16,750.00 $18,000.00 $19,250.00 $20,500.00
40% $14,480.00 $16,520.00 $18,600.00 $20,640.00 $22,320.00 $23,960.00 $25,600.00 $27,280.00
50% $18,100.00 $20,650.00 $23,250.00 $25,800.00 $27,900.00 $29,950.00 $32,000.00 $34,100.00
60% $21,720.00 $24,780.00 $27,900.00 $30,960.00 $33,480.00 $35,940.00 $38,400.00 $40,920.00
80% $28,950.00 $33,050.00 $37,200.00 $41,300.00 $44,650.00 $47,950.00 $51,250.00 $54,550.00
Non-Adjusted Income Limits for Pittsylvania County
Percentage: 50% 80% 100% 150%
Income: $22,650.00 $36,240.00 $45,300.00 $67,950.00
Poquoson City
MSA: Hampton Roads Median Income: $73,300.00
Click on a column header for sorting.
Percentage One Two Three Four Five Six Seven Eight
30% $15,400.00 $17,600.00 $19,800.00 $22,000.00 $23,800.00 $25,550.00 $27,300.00 $29,050.00
40% $20,560.00 $23,480.00 $26,400.00 $29,320.00 $31,680.00 $34,040.00 $36,360.00 $38,720.00
50% $25,700.00 $29,350.00 $33,000.00 $36,650.00 $39,600.00 $42,550.00 $45,450.00 $48,400.00
60% $30,840.00 $35,220.00 $39,600.00 $43,980.00 $47,520.00 $51,060.00 $54,540.00 $58,080.00
80% $41,100.00 $46,950.00 $52,800.00 $58,650.00 $63,350.00 $68,050.00 $72,750.00 $77,450.00
Non-Adjusted Income Limits for Poquoson City
Percentage: 50% 80% 100% 150%
Income: $36,650.00 $58,640.00 $73,300.00 $109,950.00
Portsmouth City
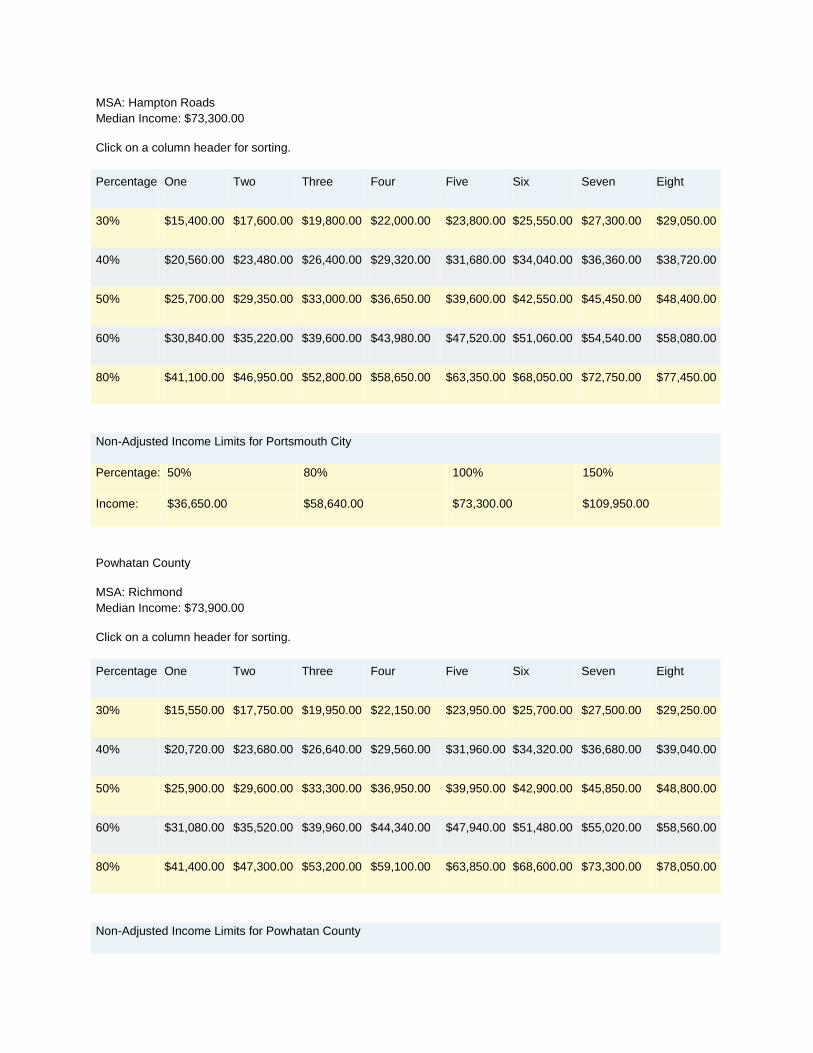
MSA: Hampton Roads Median Income: $73,300.00
Click on a column header for sorting.
Percentage One Two Three Four Five Six Seven Eight
30% $15,400.00 $17,600.00 $19,800.00 $22,000.00 $23,800.00 $25,550.00 $27,300.00 $29,050.00
40% $20,560.00 $23,480.00 $26,400.00 $29,320.00 $31,680.00 $34,040.00 $36,360.00 $38,720.00
50% $25,700.00 $29,350.00 $33,000.00 $36,650.00 $39,600.00 $42,550.00 $45,450.00 $48,400.00
60% $30,840.00 $35,220.00 $39,600.00 $43,980.00 $47,520.00 $51,060.00 $54,540.00 $58,080.00
80% $41,100.00 $46,950.00 $52,800.00 $58,650.00 $63,350.00 $68,050.00 $72,750.00 $77,450.00
Non-Adjusted Income Limits for Portsmouth City
Percentage: 50% 80% 100% 150%
Income: $36,650.00 $58,640.00 $73,300.00 $109,950.00
Powhatan County
MSA: Richmond Median Income: $73,900.00
Click on a column header for sorting.
Percentage One Two Three Four Five Six Seven Eight
30% $15,550.00 $17,750.00 $19,950.00 $22,150.00 $23,950.00 $25,700.00 $27,500.00 $29,250.00
40% $20,720.00 $23,680.00 $26,640.00 $29,560.00 $31,960.00 $34,320.00 $36,680.00 $39,040.00
50% $25,900.00 $29,600.00 $33,300.00 $36,950.00 $39,950.00 $42,900.00 $45,850.00 $48,800.00
60% $31,080.00 $35,520.00 $39,960.00 $44,340.00 $47,940.00 $51,480.00 $55,020.00 $58,560.00
80% $41,400.00 $47,300.00 $53,200.00 $59,100.00 $63,850.00 $68,600.00 $73,300.00 $78,050.00
Non-Adjusted Income Limits for Powhatan County

Percentage: 50% 80% 100% 150%
Income: $36,950.00 $59,120.00 $73,900.00 $110,850.00
Prince Edward County
MSA: Non-Metropolitan Median Income: $53,000.00
Click on a column header for sorting.
Percentage One Two Three Four Five Six Seven Eight
30% $11,150.00 $12,750.00 $14,350.00 $15,900.00 $17,200.00 $18,450.00 $19,750.00 $21,000.00
40% $14,840.00 $16,960.00 $19,080.00 $21,200.00 $22,920.00 $24,600.00 $26,320.00 $28,000.00
50% $18,550.00 $21,200.00 $23,850.00 $26,500.00 $28,650.00 $30,750.00 $32,900.00 $35,000.00
60% $22,260.00 $25,440.00 $28,620.00 $31,800.00 $34,380.00 $36,900.00 $39,480.00 $42,000.00
80% $29,700.00 $33,950.00 $38,200.00 $42,400.00 $45,800.00 $49,200.00 $52,600.00 $56,000.00
Non-Adjusted Income Limits for Prince Edward County
Percentage: 50% 80% 100% 150%
Income: $26,500.00 $42,400.00 $53,000.00 $79,500.00
Prince George County
MSA: Richmond Median Income: $73,900.00
Click on a column header for sorting.
Percentage One Two Three Four Five Six Seven Eight
30% $15,550.00 $17,750.00 $19,950.00 $22,150.00 $23,950.00 $25,700.00 $27,500.00 $29,250.00
40% $20,720.00 $23,680.00 $26,640.00 $29,560.00 $31,960.00 $34,320.00 $36,680.00 $39,040.00
50% $25,900.00 $29,600.00 $33,300.00 $36,950.00 $39,950.00 $42,900.00 $45,850.00 $48,800.00

60% $31,080.00 $35,520.00 $39,960.00 $44,340.00 $47,940.00 $51,480.00 $55,020.00 $58,560.00
80% $41,400.00 $47,300.00 $53,200.00 $59,100.00 $63,850.00 $68,600.00 $73,300.00 $78,050.00
Non-Adjusted Income Limits for Prince George County
Percentage: 50% 80% 100% 150%
Income: $36,950.00 $59,120.00 $73,900.00 $110,850.00
Prince William County
MSA: Northern Virginia Median Income: $107,300.00
Click on a column header for sorting.
Percentage One Two Three Four Five Six Seven Eight
30% $22,550.00 $25,800.00 $29,000.00 $32,200.00 $34,800.00 $37,400.00 $39,950.00 $42,550.00
40% $30,080.00 $34,360.00 $38,640.00 $42,920.00 $46,360.00 $49,800.00 $53,240.00 $56,680.00
50% $37,600.00 $42,950.00 $48,300.00 $53,650.00 $57,950.00 $62,250.00 $66,550.00 $70,850.00
60% $45,120.00 $51,540.00 $57,960.00 $64,380.00 $69,540.00 $74,700.00 $79,860.00 $85,020.00
80% $46,750.00 $53,400.00 $60,100.00 $66,750.00 $72,100.00 $77,450.00 $82,800.00 $88,150.00
Non-Adjusted Income Limits for Prince William County
Percentage: 50% 80% 100% 150%
Income: $53,650.00 $85,840.00 $107,300.00 $160,950.00
Pulaski County
MSA: Pulaski County Median Income: $52,000.00
Click on a column header for sorting.
Percentage One Two Three Four Five Six Seven Eight

30% $10,950.00 $12,500.00 $14,050.00 $15,600.00 $16,850.00 $18,100.00 $19,350.00 $20,600.00
40% $14,560.00 $16,640.00 $18,720.00 $20,800.00 $22,480.00 $24,160.00 $25,800.00 $27,480.00
50% $18,200.00 $20,800.00 $23,400.00 $26,000.00 $28,100.00 $30,200.00 $32,250.00 $34,350.00
60% $21,840.00 $24,960.00 $28,080.00 $31,200.00 $33,720.00 $36,240.00 $38,700.00 $41,220.00
80% $29,150.00 $33,300.00 $37,450.00 $41,600.00 $44,950.00 $48,300.00 $51,600.00 $54,950.00
Non-Adjusted Income Limits for Pulaski County
Percentage: 50% 80% 100% 150%
Income: $26,000.00 $41,600.00 $52,000.00 $78,000.00
Radford City
MSA: Radford Median Income: $68,800.00
Click on a column header for sorting.
Percentage One Two Three Four Five Six Seven Eight
30% $14,500.00 $16,550.00 $18,600.00 $20,650.00 $22,350.00 $24,000.00 $25,650.00 $27,300.00
40% $19,280.00 $22,040.00 $24,800.00 $27,520.00 $29,760.00 $31,960.00 $34,160.00 $36,360.00
50% $24,100.00 $27,550.00 $31,000.00 $34,400.00 $37,200.00 $39,950.00 $42,700.00 $45,450.00
60% $28,920.00 $33,060.00 $37,200.00 $41,280.00 $44,640.00 $47,940.00 $51,240.00 $54,540.00
80% $38,550.00 $44,050.00 $49,550.00 $55,050.00 $59,500.00 $63,900.00 $68,300.00 $72,700.00
Non-Adjusted Income Limits for Radford City
Percentage: 50% 80% 100% 150%
Income: $34,400.00 $55,040.00 $68,800.00 $103,200.00
Rappahannock County
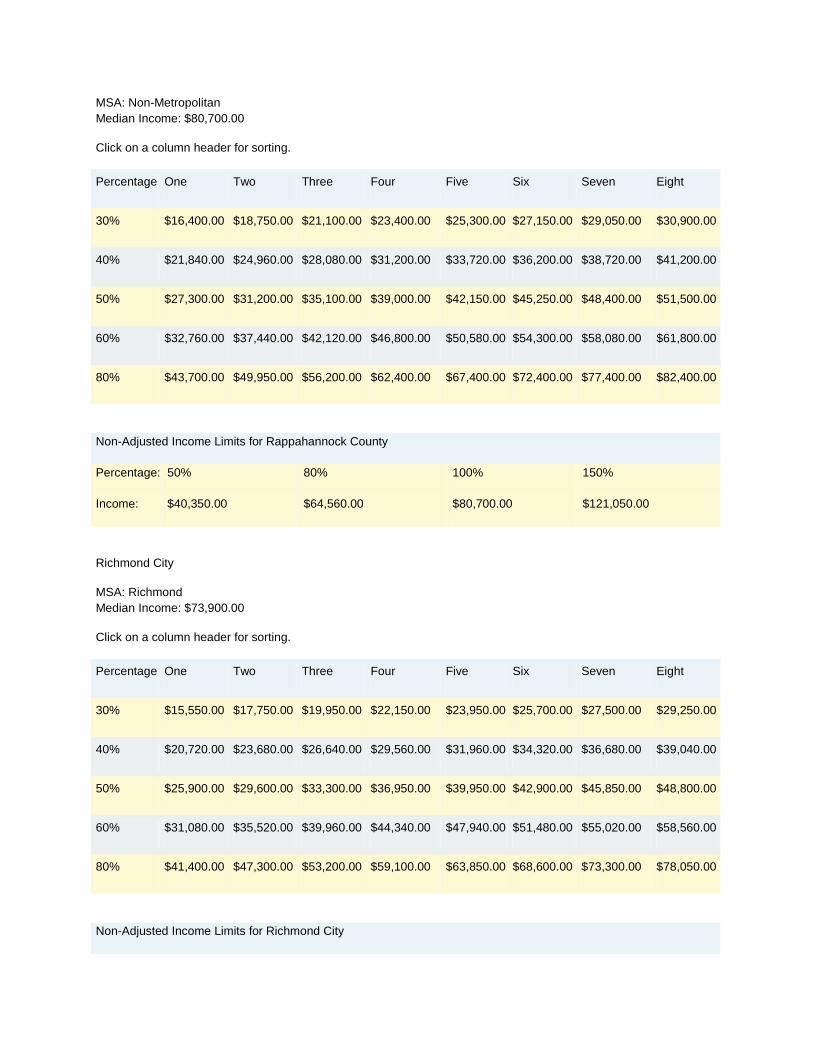
MSA: Non-Metropolitan Median Income: $80,700.00
Click on a column header for sorting.
Percentage One Two Three Four Five Six Seven Eight
30% $16,400.00 $18,750.00 $21,100.00 $23,400.00 $25,300.00 $27,150.00 $29,050.00 $30,900.00
40% $21,840.00 $24,960.00 $28,080.00 $31,200.00 $33,720.00 $36,200.00 $38,720.00 $41,200.00
50% $27,300.00 $31,200.00 $35,100.00 $39,000.00 $42,150.00 $45,250.00 $48,400.00 $51,500.00
60% $32,760.00 $37,440.00 $42,120.00 $46,800.00 $50,580.00 $54,300.00 $58,080.00 $61,800.00
80% $43,700.00 $49,950.00 $56,200.00 $62,400.00 $67,400.00 $72,400.00 $77,400.00 $82,400.00
Non-Adjusted Income Limits for Rappahannock County
Percentage: 50% 80% 100% 150%
Income: $40,350.00 $64,560.00 $80,700.00 $121,050.00
Richmond City
MSA: Richmond Median Income: $73,900.00
Click on a column header for sorting.
Percentage One Two Three Four Five Six Seven Eight
30% $15,550.00 $17,750.00 $19,950.00 $22,150.00 $23,950.00 $25,700.00 $27,500.00 $29,250.00
40% $20,720.00 $23,680.00 $26,640.00 $29,560.00 $31,960.00 $34,320.00 $36,680.00 $39,040.00
50% $25,900.00 $29,600.00 $33,300.00 $36,950.00 $39,950.00 $42,900.00 $45,850.00 $48,800.00
60% $31,080.00 $35,520.00 $39,960.00 $44,340.00 $47,940.00 $51,480.00 $55,020.00 $58,560.00
80% $41,400.00 $47,300.00 $53,200.00 $59,100.00 $63,850.00 $68,600.00 $73,300.00 $78,050.00
Non-Adjusted Income Limits for Richmond City

Percentage: 50% 80% 100% 150%
Income: $36,950.00 $59,120.00 $73,900.00 $110,850.00
Richmond County
MSA: Non-Metropolitan Median Income: $64,000.00
Click on a column header for sorting.
Percentage One Two Three Four Five Six Seven Eight
30% $13,000.00 $14,850.00 $16,700.00 $18,550.00 $20,050.00 $21,550.00 $23,050.00 $24,500.00
40% $17,320.00 $19,800.00 $22,280.00 $24,720.00 $26,720.00 $28,680.00 $30,680.00 $32,640.00
50% $21,650.00 $24,750.00 $27,850.00 $30,900.00 $33,400.00 $35,850.00 $38,350.00 $40,800.00
60% $25,980.00 $29,700.00 $33,420.00 $37,080.00 $40,080.00 $43,020.00 $46,020.00 $48,960.00
80% $34,650.00 $39,600.00 $44,550.00 $49,450.00 $53,450.00 $57,400.00 $61,350.00 $65,300.00
Non-Adjusted Income Limits for Richmond County
Percentage: 50% 80% 100% 150%
Income: $32,000.00 $51,200.00 $64,000.00 $96,000.00
Roanoke City
MSA: Roanoke Median Income: $63,600.00
Click on a column header for sorting.
Percentage One Two Three Four Five Six Seven Eight
30% $13,400.00 $15,300.00 $17,200.00 $19,100.00 $20,650.00 $22,200.00 $23,700.00 $25,250.00
40% $17,840.00 $20,360.00 $22,920.00 $25,440.00 $27,480.00 $29,520.00 $31,560.00 $33,600.00
50% $22,300.00 $25,450.00 $28,650.00 $31,800.00 $34,350.00 $36,900.00 $39,450.00 $42,000.00

60% $26,760.00 $30,540.00 $34,380.00 $38,160.00 $41,220.00 $44,280.00 $47,340.00 $50,400.00
80% $35,650.00 $40,750.00 $45,850.00 $50,900.00 $55,000.00 $59,050.00 $63,150.00 $67,200.00
Non-Adjusted Income Limits for Roanoke City
Percentage: 50% 80% 100% 150%
Income: $31,800.00 $50,880.00 $63,600.00 $95,400.00
Roanoke County
MSA: Roanoke Median Income: $63,600.00
Click on a column header for sorting.
Percentage One Two Three Four Five Six Seven Eight
30% $13,400.00 $15,300.00 $17,200.00 $19,100.00 $20,650.00 $22,200.00 $23,700.00 $25,250.00
40% $17,840.00 $20,360.00 $22,920.00 $25,440.00 $27,480.00 $29,520.00 $31,560.00 $33,600.00
50% $22,300.00 $25,450.00 $28,650.00 $31,800.00 $34,350.00 $36,900.00 $39,450.00 $42,000.00
60% $26,760.00 $30,540.00 $34,380.00 $38,160.00 $41,220.00 $44,280.00 $47,340.00 $50,400.00
80% $35,650.00 $40,750.00 $45,850.00 $50,900.00 $55,000.00 $59,050.00 $63,150.00 $67,200.00
Non-Adjusted Income Limits for Roanoke County
Percentage: 50% 80% 100% 150%
Income: $31,800.00 $50,880.00 $63,600.00 $95,400.00
Rockbridge County
MSA: Non-Metropolitan Median Income: $55,300.00
Click on a column header for sorting.
Percentage One Two Three Four Five Six Seven Eight

30% $11,650.00 $13,300.00 $14,950.00 $16,600.00 $17,950.00 $19,300.00 $20,600.00 $21,950.00
40% $15,520.00 $17,720.00 $19,920.00 $22,120.00 $23,920.00 $25,680.00 $27,440.00 $29,200.00
50% $19,400.00 $22,150.00 $24,900.00 $27,650.00 $29,900.00 $32,100.00 $34,300.00 $36,500.00
60% $23,280.00 $26,580.00 $29,880.00 $33,180.00 $35,880.00 $38,520.00 $41,160.00 $43,800.00
80% $31,000.00 $35,400.00 $39,850.00 $44,250.00 $47,800.00 $51,350.00 $54,900.00 $58,450.00
Non-Adjusted Income Limits for Rockbridge County
Percentage: 50% 80% 100% 150%
Income: $27,650.00 $44,240.00 $55,300.00 $82,950.00
Rockingham County
MSA: Harrisonburg Median Income: $59,400.00
Click on a column header for sorting.
Percentage One Two Three Four Five Six Seven Eight
30% $12,500.00 $14,250.00 $16,050.00 $17,800.00 $19,250.00 $20,650.00 $22,100.00 $23,500.00
40% $16,640.00 $19,040.00 $21,400.00 $23,760.00 $25,680.00 $27,600.00 $29,480.00 $31,400.00
50% $20,800.00 $23,800.00 $26,750.00 $29,700.00 $32,100.00 $34,500.00 $36,850.00 $39,250.00
60% $24,960.00 $28,560.00 $32,100.00 $35,640.00 $38,520.00 $41,400.00 $44,220.00 $47,100.00
80% $33,250.00 $38,000.00 $42,750.00 $47,500.00 $51,300.00 $55,100.00 $58,900.00 $62,700.00
Non-Adjusted Income Limits for Rockingham County
Percentage: 50% 80% 100% 150%
Income: $29,700.00 $47,520.00 $59,400.00 $89,100.00
Russell County

MSA: Non-Metropolitan Median Income: $45,300.00
Click on a column header for sorting.
Percentage One Two Three Four Five Six Seven Eight
30% $10,850.00 $12,400.00 $13,950.00 $15,500.00 $16,750.00 $18,000.00 $19,250.00 $20,500.00
40% $14,480.00 $16,520.00 $18,600.00 $20,640.00 $22,320.00 $23,960.00 $25,600.00 $27,280.00
50% $18,100.00 $20,650.00 $23,250.00 $25,800.00 $27,900.00 $29,950.00 $32,000.00 $34,100.00
60% $21,720.00 $24,780.00 $27,900.00 $30,960.00 $33,480.00 $35,940.00 $38,400.00 $40,920.00
80% $28,950.00 $33,050.00 $37,200.00 $41,300.00 $44,650.00 $47,950.00 $51,250.00 $54,550.00
Non-Adjusted Income Limits for Russell County
Percentage: 50% 80% 100% 150%
Income: $22,650.00 $36,240.00 $45,300.00 $67,950.00
Salem City
MSA: Roanoke Median Income: $63,600.00
Click on a column header for sorting.
Percentage One Two Three Four Five Six Seven Eight
30% $13,400.00 $15,300.00 $17,200.00 $19,100.00 $20,650.00 $22,200.00 $23,700.00 $25,250.00
40% $17,840.00 $20,360.00 $22,920.00 $25,440.00 $27,480.00 $29,520.00 $31,560.00 $33,600.00
50% $22,300.00 $25,450.00 $28,650.00 $31,800.00 $34,350.00 $36,900.00 $39,450.00 $42,000.00
60% $26,760.00 $30,540.00 $34,380.00 $38,160.00 $41,220.00 $44,280.00 $47,340.00 $50,400.00
80% $35,650.00 $40,750.00 $45,850.00 $50,900.00 $55,000.00 $59,050.00 $63,150.00 $67,200.00
Non-Adjusted Income Limits for Salem City

Percentage: 50% 80% 100% 150%
Income: $31,800.00 $50,880.00 $63,600.00 $95,400.00
Scott County
MSA: Bristol Median Income: $48,700.00
Click on a column header for sorting.
Percentage One Two Three Four Five Six Seven Eight
30% $10,250.00 $11,700.00 $13,150.00 $14,600.00 $15,800.00 $16,950.00 $18,150.00 $19,300.00
40% $13,640.00 $15,600.00 $17,560.00 $19,480.00 $21,040.00 $22,600.00 $24,160.00 $25,720.00
50% $17,050.00 $19,500.00 $21,950.00 $24,350.00 $26,300.00 $28,250.00 $30,200.00 $32,150.00
60% $20,460.00 $23,400.00 $26,340.00 $29,220.00 $31,560.00 $33,900.00 $36,240.00 $38,580.00
80% $27,300.00 $31,200.00 $35,100.00 $38,950.00 $42,100.00 $45,200.00 $48,300.00 $51,450.00
Non-Adjusted Income Limits for Scott County
Percentage: 50% 80% 100% 150%
Income: $24,350.00 $38,960.00 $48,700.00 $73,050.00
Shenandoah County
MSA: Non-Metropolitan Median Income: $65,200.00
Click on a column header for sorting.
Percentage One Two Three Four Five Six Seven Eight
30% $13,700.00 $15,650.00 $17,600.00 $19,550.00 $21,150.00 $22,700.00 $24,250.00 $25,850.00
40% $18,280.00 $20,880.00 $23,480.00 $26,080.00 $28,200.00 $30,280.00 $32,360.00 $34,440.00
50% $22,850.00 $26,100.00 $29,350.00 $32,600.00 $35,250.00 $37,850.00 $40,450.00 $43,050.00

60% $27,420.00 $31,320.00 $35,220.00 $39,120.00 $42,300.00 $45,420.00 $48,540.00 $51,660.00
80% $36,550.00 $41,750.00 $46,950.00 $52,150.00 $56,350.00 $60,500.00 $64,700.00 $68,850.00
Non-Adjusted Income Limits for Shenandoah County
Percentage: 50% 80% 100% 150%
Income: $32,600.00 $52,160.00 $65,200.00 $97,800.00
Smyth County
MSA: Non-Metropolitan Median Income: $46,500.00
Click on a column header for sorting.
Percentage One Two Three Four Five Six Seven Eight
30% $10,850.00 $12,400.00 $13,950.00 $15,500.00 $16,750.00 $18,000.00 $19,250.00 $20,500.00
40% $14,480.00 $16,520.00 $18,600.00 $20,640.00 $22,320.00 $23,960.00 $25,600.00 $27,280.00
50% $18,100.00 $20,650.00 $23,250.00 $25,800.00 $27,900.00 $29,950.00 $32,000.00 $34,100.00
60% $21,720.00 $24,780.00 $27,900.00 $30,960.00 $33,480.00 $35,940.00 $38,400.00 $40,920.00
80% $28,950.00 $33,050.00 $37,200.00 $41,300.00 $44,650.00 $47,950.00 $51,250.00 $54,550.00
Non-Adjusted Income Limits for Smyth County
Percentage: 50% 80% 100% 150%
Income: $23,250.00 $37,200.00 $46,500.00 $69,750.00
Southampton County
MSA: Non-Metropolitan Median Income: $55,800.00
Click on a column header for sorting.
Percentage One Two Three Four Five Six Seven Eight
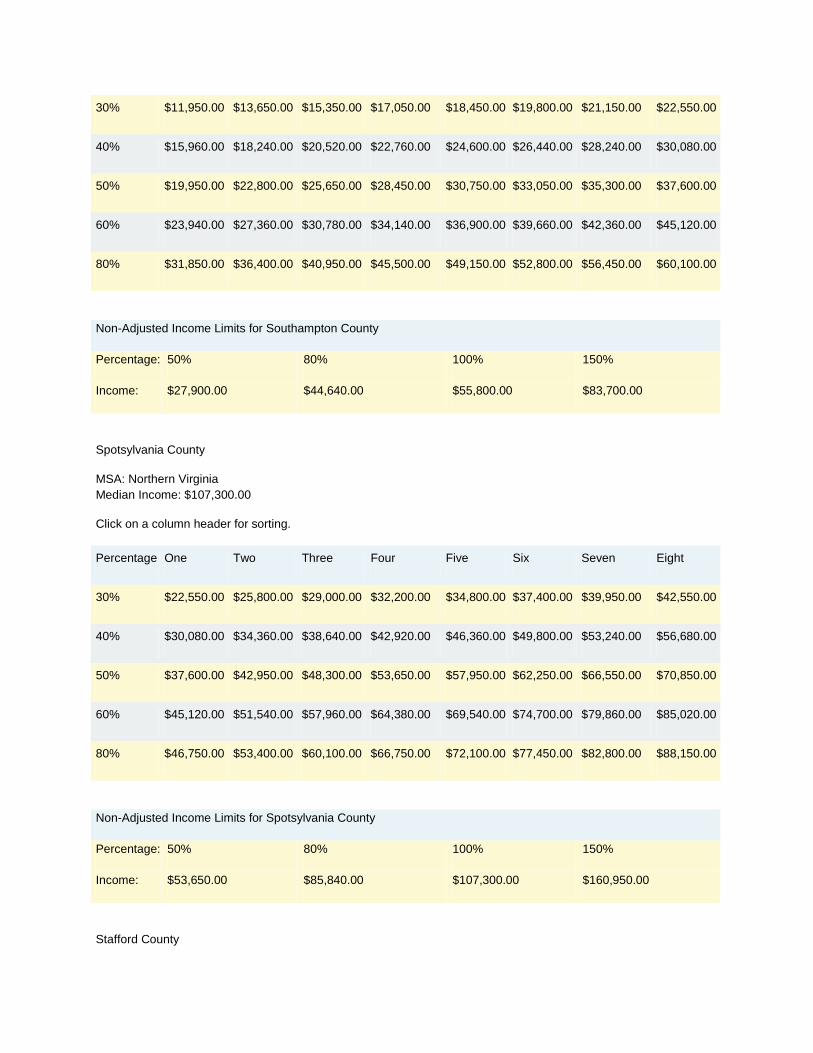
30% $11,950.00 $13,650.00 $15,350.00 $17,050.00 $18,450.00 $19,800.00 $21,150.00 $22,550.00
40% $15,960.00 $18,240.00 $20,520.00 $22,760.00 $24,600.00 $26,440.00 $28,240.00 $30,080.00
50% $19,950.00 $22,800.00 $25,650.00 $28,450.00 $30,750.00 $33,050.00 $35,300.00 $37,600.00
60% $23,940.00 $27,360.00 $30,780.00 $34,140.00 $36,900.00 $39,660.00 $42,360.00 $45,120.00
80% $31,850.00 $36,400.00 $40,950.00 $45,500.00 $49,150.00 $52,800.00 $56,450.00 $60,100.00
Non-Adjusted Income Limits for Southampton County
Percentage: 50% 80% 100% 150%
Income: $27,900.00 $44,640.00 $55,800.00 $83,700.00
Spotsylvania County
MSA: Northern Virginia Median Income: $107,300.00
Click on a column header for sorting.
Percentage One Two Three Four Five Six Seven Eight
30% $22,550.00 $25,800.00 $29,000.00 $32,200.00 $34,800.00 $37,400.00 $39,950.00 $42,550.00
40% $30,080.00 $34,360.00 $38,640.00 $42,920.00 $46,360.00 $49,800.00 $53,240.00 $56,680.00
50% $37,600.00 $42,950.00 $48,300.00 $53,650.00 $57,950.00 $62,250.00 $66,550.00 $70,850.00
60% $45,120.00 $51,540.00 $57,960.00 $64,380.00 $69,540.00 $74,700.00 $79,860.00 $85,020.00
80% $46,750.00 $53,400.00 $60,100.00 $66,750.00 $72,100.00 $77,450.00 $82,800.00 $88,150.00
Non-Adjusted Income Limits for Spotsylvania County
Percentage: 50% 80% 100% 150%
Income: $53,650.00 $85,840.00 $107,300.00 $160,950.00
Stafford County

MSA: Northern Virginia Median Income: $107,300.00
Click on a column header for sorting.
Percentage One Two Three Four Five Six Seven Eight
30% $22,550.00 $25,800.00 $29,000.00 $32,200.00 $34,800.00 $37,400.00 $39,950.00 $42,550.00
40% $30,080.00 $34,360.00 $38,640.00 $42,920.00 $46,360.00 $49,800.00 $53,240.00 $56,680.00
50% $37,600.00 $42,950.00 $48,300.00 $53,650.00 $57,950.00 $62,250.00 $66,550.00 $70,850.00
60% $45,120.00 $51,540.00 $57,960.00 $64,380.00 $69,540.00 $74,700.00 $79,860.00 $85,020.00
80% $46,750.00 $53,400.00 $60,100.00 $66,750.00 $72,100.00 $77,450.00 $82,800.00 $88,150.00
Non-Adjusted Income Limits for Stafford County
Percentage: 50% 80% 100% 150%
Income: $53,650.00 $85,840.00 $107,300.00 $160,950.00
Staunton City
MSA: Non-Metropolitan Median Income: $62,700.00
Click on a column header for sorting.
Percentage One Two Three Four Five Six Seven Eight
30% $13,200.00 $15,050.00 $16,950.00 $18,800.00 $20,350.00 $21,850.00 $23,350.00 $24,850.00
40% $17,560.00 $20,080.00 $22,600.00 $25,080.00 $27,120.00 $29,120.00 $31,120.00 $33,120.00
50% $21,950.00 $25,100.00 $28,250.00 $31,350.00 $33,900.00 $36,400.00 $38,900.00 $41,400.00
60% $26,340.00 $30,120.00 $33,900.00 $37,620.00 $40,680.00 $43,680.00 $46,680.00 $49,680.00
80% $35,150.00 $40,150.00 $45,150.00 $50,150.00 $54,200.00 $58,200.00 $62,200.00 $66,200.00
Non-Adjusted Income Limits for Staunton City

Percentage: 50% 80% 100% 150%
Income: $31,350.00 $50,160.00 $62,700.00 $94,050.00
Suffolk City
MSA: Hampton Roads Median Income: $73,300.00
Click on a column header for sorting.
Percentage One Two Three Four Five Six Seven Eight
30% $15,400.00 $17,600.00 $19,800.00 $22,000.00 $23,800.00 $25,550.00 $27,300.00 $29,050.00
40% $20,560.00 $23,480.00 $26,400.00 $29,320.00 $31,680.00 $34,040.00 $36,360.00 $38,720.00
50% $25,700.00 $29,350.00 $33,000.00 $36,650.00 $39,600.00 $42,550.00 $45,450.00 $48,400.00
60% $30,840.00 $35,220.00 $39,600.00 $43,980.00 $47,520.00 $51,060.00 $54,540.00 $58,080.00
80% $41,100.00 $46,950.00 $52,800.00 $58,650.00 $63,350.00 $68,050.00 $72,750.00 $77,450.00
Non-Adjusted Income Limits for Suffolk City
Percentage: 50% 80% 100% 150%
Income: $36,650.00 $58,640.00 $73,300.00 $109,950.00
Surry County
MSA: Hampton Roads Median Income: $73,300.00
Click on a column header for sorting.
Percentage One Two Three Four Five Six Seven Eight
30% $15,400.00 $17,600.00 $19,800.00 $22,000.00 $23,800.00 $25,550.00 $27,300.00 $29,050.00
40% $20,560.00 $23,480.00 $26,400.00 $29,320.00 $31,680.00 $34,040.00 $36,360.00 $38,720.00
50% $25,700.00 $29,350.00 $33,000.00 $36,650.00 $39,600.00 $42,550.00 $45,450.00 $48,400.00

60% $30,840.00 $35,220.00 $39,600.00 $43,980.00 $47,520.00 $51,060.00 $54,540.00 $58,080.00
80% $41,100.00 $46,950.00 $52,800.00 $58,650.00 $63,350.00 $68,050.00 $72,750.00 $77,450.00
Non-Adjusted Income Limits for Surry County
Percentage: 50% 80% 100% 150%
Income: $36,650.00 $58,640.00 $73,300.00 $109,950.00
Sussex County
MSA: Richmond Median Income: $73,900.00
Click on a column header for sorting.
Percentage One Two Three Four Five Six Seven Eight
30% $15,550.00 $17,750.00 $19,950.00 $22,150.00 $23,950.00 $25,700.00 $27,500.00 $29,250.00
40% $20,720.00 $23,680.00 $26,640.00 $29,560.00 $31,960.00 $34,320.00 $36,680.00 $39,040.00
50% $25,900.00 $29,600.00 $33,300.00 $36,950.00 $39,950.00 $42,900.00 $45,850.00 $48,800.00
60% $31,080.00 $35,520.00 $39,960.00 $44,340.00 $47,940.00 $51,480.00 $55,020.00 $58,560.00
80% $41,400.00 $47,300.00 $53,200.00 $59,100.00 $63,850.00 $68,600.00 $73,300.00 $78,050.00
Non-Adjusted Income Limits for Sussex County
Percentage: 50% 80% 100% 150%
Income: $36,950.00 $59,120.00 $73,900.00 $110,850.00
Tazewell County
MSA: Non-Metropolitan Median Income: $46,200.00
Click on a column header for sorting.
Percentage One Two Three Four Five Six Seven Eight

30% $10,850.00 $12,400.00 $13,950.00 $15,500.00 $16,750.00 $18,000.00 $19,250.00 $20,500.00
40% $14,480.00 $16,520.00 $18,600.00 $20,640.00 $22,320.00 $23,960.00 $25,600.00 $27,280.00
50% $18,100.00 $20,650.00 $23,250.00 $25,800.00 $27,900.00 $29,950.00 $32,000.00 $34,100.00
60% $21,720.00 $24,780.00 $27,900.00 $30,960.00 $33,480.00 $35,940.00 $38,400.00 $40,920.00
80% $28,950.00 $33,050.00 $37,200.00 $41,300.00 $44,650.00 $47,950.00 $51,250.00 $54,550.00
Non-Adjusted Income Limits for Tazewell County
Percentage: 50% 80% 100% 150%
Income: $23,100.00 $36,960.00 $46,200.00 $69,300.00
Virginia Beach City
MSA: Hampton Roads Median Income: $73,300.00
Click on a column header for sorting.
Percentage One Two Three Four Five Six Seven Eight
30% $15,400.00 $17,600.00 $19,800.00 $22,000.00 $23,800.00 $25,550.00 $27,300.00 $29,050.00
40% $20,560.00 $23,480.00 $26,400.00 $29,320.00 $31,680.00 $34,040.00 $36,360.00 $38,720.00
50% $25,700.00 $29,350.00 $33,000.00 $36,650.00 $39,600.00 $42,550.00 $45,450.00 $48,400.00
60% $30,840.00 $35,220.00 $39,600.00 $43,980.00 $47,520.00 $51,060.00 $54,540.00 $58,080.00
80% $41,100.00 $46,950.00 $52,800.00 $58,650.00 $63,350.00 $68,050.00 $72,750.00 $77,450.00
Non-Adjusted Income Limits for Virginia Beach City
Percentage: 50% 80% 100% 150%
Income: $36,650.00 $58,640.00 $73,300.00 $109,950.00
Warren County

MSA: Warren County Median Income: $76,900.00
Click on a column header for sorting.
Percentage One Two Three Four Five Six Seven Eight
30% $16,150.00 $18,450.00 $20,750.00 $23,050.00 $24,900.00 $26,750.00 $28,600.00 $30,450.00
40% $21,560.00 $24,640.00 $27,720.00 $30,760.00 $33,240.00 $35,720.00 $38,160.00 $40,640.00
50% $26,950.00 $30,800.00 $34,650.00 $38,450.00 $41,550.00 $44,650.00 $47,700.00 $50,800.00
60% $32,340.00 $36,960.00 $41,580.00 $46,140.00 $49,860.00 $53,580.00 $57,240.00 $60,960.00
80% $43,050.00 $49,200.00 $55,350.00 $61,500.00 $66,450.00 $71,350.00 $76,300.00 $81,200.00
Non-Adjusted Income Limits for Warren County
Percentage: 50% 80% 100% 150%
Income: $38,450.00 $61,520.00 $76,900.00 $115,350.00
Washington County
MSA: Bristol Median Income: $48,700.00
Click on a column header for sorting.
Percentage One Two Three Four Five Six Seven Eight
30% $10,250.00 $11,700.00 $13,150.00 $14,600.00 $15,800.00 $16,950.00 $18,150.00 $19,300.00
40% $13,640.00 $15,600.00 $17,560.00 $19,480.00 $21,040.00 $22,600.00 $24,160.00 $25,720.00
50% $17,050.00 $19,500.00 $21,950.00 $24,350.00 $26,300.00 $28,250.00 $30,200.00 $32,150.00
60% $20,460.00 $23,400.00 $26,340.00 $29,220.00 $31,560.00 $33,900.00 $36,240.00 $38,580.00
80% $27,300.00 $31,200.00 $35,100.00 $38,950.00 $42,100.00 $45,200.00 $48,300.00 $51,450.00
Non-Adjusted Income Limits for Washington County

Percentage: 50% 80% 100% 150%
Income: $24,350.00 $38,960.00 $48,700.00 $73,050.00
Waynesboro City
MSA: Non-Metropolitan Median Income: $62,700.00
Click on a column header for sorting.
Percentage One Two Three Four Five Six Seven Eight
30% $13,200.00 $15,050.00 $16,950.00 $18,800.00 $20,350.00 $21,850.00 $23,350.00 $24,850.00
40% $17,560.00 $20,080.00 $22,600.00 $25,080.00 $27,120.00 $29,120.00 $31,120.00 $33,120.00
50% $21,950.00 $25,100.00 $28,250.00 $31,350.00 $33,900.00 $36,400.00 $38,900.00 $41,400.00
60% $26,340.00 $30,120.00 $33,900.00 $37,620.00 $40,680.00 $43,680.00 $46,680.00 $49,680.00
80% $35,150.00 $40,150.00 $45,150.00 $50,150.00 $54,200.00 $58,200.00 $62,200.00 $66,200.00
Non-Adjusted Income Limits for Waynesboro City
Percentage: 50% 80% 100% 150%
Income: $31,350.00 $50,160.00 $62,700.00 $94,050.00
Westmoreland County
MSA: Non-Metropolitan Median Income: $63,400.00
Click on a column header for sorting.
Percentage One Two Three Four Five Six Seven Eight
30% $13,300.00 $15,200.00 $17,100.00 $19,000.00 $20,550.00 $22,050.00 $23,600.00 $25,100.00
40% $17,760.00 $20,320.00 $22,840.00 $25,360.00 $27,400.00 $29,440.00 $31,480.00 $33,480.00
50% $22,200.00 $25,400.00 $28,550.00 $31,700.00 $34,250.00 $36,800.00 $39,350.00 $41,850.00

60% $26,640.00 $30,480.00 $34,260.00 $38,040.00 $41,100.00 $44,160.00 $47,220.00 $50,220.00
80% $35,500.00 $40,600.00 $45,650.00 $50,700.00 $54,800.00 $58,850.00 $62,900.00 $66,950.00
Non-Adjusted Income Limits for Westmoreland County
Percentage: 50% 80% 100% 150%
Income: $31,700.00 $50,720.00 $63,400.00 $95,100.00
Williamsburg City
MSA: Hampton Roads Median Income: $73,300.00
Click on a column header for sorting.
Percentage One Two Three Four Five Six Seven Eight
30% $15,400.00 $17,600.00 $19,800.00 $22,000.00 $23,800.00 $25,550.00 $27,300.00 $29,050.00
40% $20,560.00 $23,480.00 $26,400.00 $29,320.00 $31,680.00 $34,040.00 $36,360.00 $38,720.00
50% $25,700.00 $29,350.00 $33,000.00 $36,650.00 $39,600.00 $42,550.00 $45,450.00 $48,400.00
60% $30,840.00 $35,220.00 $39,600.00 $43,980.00 $47,520.00 $51,060.00 $54,540.00 $58,080.00
80% $41,100.00 $46,950.00 $52,800.00 $58,650.00 $63,350.00 $68,050.00 $72,750.00 $77,450.00
Non-Adjusted Income Limits for Williamsburg City
Percentage: 50% 80% 100% 150%
Income: $36,650.00 $58,640.00 $73,300.00 $109,950.00
Winchester City
MSA: Winchester, VA-WV MSA Median Income: $65,700.00
Click on a column header for sorting.
Percentage One Two Three Four Five Six Seven Eight

30% $13,800.00 $15,800.00 $17,750.00 $19,700.00 $21,300.00 $22,900.00 $24,450.00 $26,050.00
40% $18,400.00 $21,040.00 $23,680.00 $26,280.00 $28,400.00 $30,520.00 $32,600.00 $34,720.00
50% $23,000.00 $26,300.00 $29,600.00 $32,850.00 $35,500.00 $38,150.00 $40,750.00 $43,400.00
60% $27,600.00 $31,560.00 $35,520.00 $39,420.00 $42,600.00 $45,780.00 $48,900.00 $52,080.00
80% $36,800.00 $42,050.00 $47,300.00 $52,550.00 $56,800.00 $61,000.00 $65,200.00 $69,400.00
Non-Adjusted Income Limits for Winchester City
Percentage: 50% 80% 100% 150%
Income: $32,850.00 $52,560.00 $65,700.00 $98,550.00
Wise County
MSA: Non-Metropolitan Median Income: $45,100.00
Click on a column header for sorting.
Percentage One Two Three Four Five Six Seven Eight
30% $10,850.00 $12,400.00 $13,950.00 $15,500.00 $16,750.00 $18,000.00 $19,250.00 $20,500.00
40% $14,480.00 $16,520.00 $18,600.00 $20,640.00 $22,320.00 $23,960.00 $25,600.00 $27,280.00
50% $18,100.00 $20,650.00 $23,250.00 $25,800.00 $27,900.00 $29,950.00 $32,000.00 $34,100.00
60% $21,720.00 $24,780.00 $27,900.00 $30,960.00 $33,480.00 $35,940.00 $38,400.00 $40,920.00
80% $28,950.00 $33,050.00 $37,200.00 $41,300.00 $44,650.00 $47,950.00 $51,250.00 $54,550.00
Non-Adjusted Income Limits for Wise County
Percentage: 50% 80% 100% 150%
Income: $22,550.00 $36,080.00 $45,100.00 $67,650.00
Wythe County

MSA: Non-Metropolitan Median Income: $50,100.00
Click on a column header for sorting.
Percentage One Two Three Four Five Six Seven Eight
30% $10,850.00 $12,400.00 $13,950.00 $15,500.00 $16,750.00 $18,000.00 $19,250.00 $20,500.00
40% $14,480.00 $16,520.00 $18,600.00 $20,640.00 $22,320.00 $23,960.00 $25,600.00 $27,280.00
50% $18,100.00 $20,650.00 $23,250.00 $25,800.00 $27,900.00 $29,950.00 $32,000.00 $34,100.00
60% $21,720.00 $24,780.00 $27,900.00 $30,960.00 $33,480.00 $35,940.00 $38,400.00 $40,920.00
80% $28,950.00 $33,050.00 $37,200.00 $41,300.00 $44,650.00 $47,950.00 $51,250.00 $54,550.00
Non-Adjusted Income Limits for Wythe County
Percentage: 50% 80% 100% 150%
Income: $25,050.00 $40,080.00 $50,100.00 $75,150.00
York County
MSA: Hampton Roads Median Income: $73,300.00
Click on a column header for sorting.
Percentage One Two Three Four Five Six Seven Eight
30% $15,400.00 $17,600.00 $19,800.00 $22,000.00 $23,800.00 $25,550.00 $27,300.00 $29,050.00
40% $20,560.00 $23,480.00 $26,400.00 $29,320.00 $31,680.00 $34,040.00 $36,360.00 $38,720.00
50% $25,700.00 $29,350.00 $33,000.00 $36,650.00 $39,600.00 $42,550.00 $45,450.00 $48,400.00
60% $30,840.00 $35,220.00 $39,600.00 $43,980.00 $47,520.00 $51,060.00 $54,540.00 $58,080.00
80% $41,100.00 $46,950.00 $52,800.00 $58,650.00 $63,350.00 $68,050.00 $72,750.00 $77,450.00
Non-Adjusted Income Limits for York County

Percentage: 50% 80% 100% 150%
Income: $36,650.00 $58,640.00 $73,300.00 $109,950.00
![Market Profile -- Armour Square [34] · Population Density in 2009 14,323 Square Mileage 0.99 Median Household Income 2009 $32,039 Median Household Income 2000 $26,965 Average Household](https://cdn.vdocuments.net/doc/165x107/5f7c2e99da23b15fb70a4fc2/market-profile-armour-square-34-population-density-in-2009-14323-square-mileage.jpg)


