The world HY1 2015 – ROADSHOW PRESENTATION
of Vopak

General
introduction
Market
trends
Strategy
execution Business
performance
Looking
ahead
Forward-looking Statement
2
This presentation contains ‘forward-looking statements’, based on currently available plans
and forecasts. By their nature, forward-looking statements involve risks and uncertainties
because they relate to events and depend on circumstances that may or may not occur in the
future, and Vopak cannot guarantee the accuracy and completeness of forward-looking
statements.
These risks and uncertainties include, but are not limited to, factors affecting the realization of ambitions and financial
expectations, developments regarding the potential capital raising, exceptional income and expense items, operational
developments and trading conditions, economic, political and foreign exchange developments and changes to IFRS reporting
rules.
Vopak’s EBITDA outlook does not represent a forecast or any expectation of future results or financial performance.
Statements of a forward-looking nature issued by the company must always be assessed in the context of the events, risks and
uncertainties of the markets and environments in which Vopak operates. These factors could lead to actual results being materially
different from those expected, and Vopak does not undertake to publicly update or revise any of these forward-looking statements.
HY1 2015 Roadshow presentation

General
introduction
Market
trends
Strategy
execution Business
performance
Looking
ahead
introduction General

General
introduction
Market
trends
Strategy
execution Business
performance
Looking
ahead
Vopak at a glance
Building on an impressive
history of almost 400 years
Track record developing
new terminals in new
markets
Listed at the Euronext AEX
Market cap of EUR 4.9 billion*
Share price from EUR 7.8 in
2004 to EUR 38.00 in 2015*
Thorough analysis of future
flows and imbalances
World’s largest independent
tank terminal operator:
72 terminals in 26 countries
Market leader in independent storage of oil, chemicals and gas
with a capacity of 32.5* million cbm
* As per 21 August 2015
HY1 2015 Roadshow presentation 4

General
introduction
Market
trends
Strategy
execution Business
performance
Looking
ahead
763753768636598
513429370314
2014 2013
2012 2011 2010 2009 2008 2007 2006
EBITDA development In EUR million
2014
0.90
2013
0.90
2012
0.88
2011
0.80
2010
0.70
2009
0.63
2008
0.55
2007
0.48
2006
0.38
Dividend In EUR
Cash flow from operating activities (gross) In EUR million
751713659
496455454387335286
2014 2013 2012 2011 2010 2009 2008 2007 2006
Occupancy rate In percent
94 96 95 94 93 93 91 88 88
2010 2009 2014 2012 2013 2011 2008 2007 2006
Financial development
5 Roadshow presentation HY1 2015

General
introduction
Market
trends
Strategy
execution Business
performance
Looking
ahead
Diversified portfolio with presence at prime locations
6
Increasing global flows require storage infrastructure
Stable margins and long-term take-or-pay contracts
Unique combination of robust cash flow,
consistent dividend and growth opportunities
Strong capital structure with balanced leverage
Focus on cash flow generation
Disciplined capital allocation with strict investment criteria
HY1 2015 Roadshow presentation
Investment thesis

General
introduction
Market
trends
Strategy
execution Business
performance
Looking
ahead
7
Solid leadership position in the global independent tank storage market
Safety and
service
Our
values
Strong link
supply
chain
Presence
at prime
locations
Value
creation
Vopak’s ambition
Q2 2015 Roadshow presentation

General
introduction
Market
trends
Strategy
execution Business
performance
Looking
ahead
HY1 215 Roadshow presentation 8
Our Sustainability Foundation
Excellent People I Environmental Care I Health and Safety I Responsible Partner
Growth leadership
Operational leadership
Customer leadership
Strategic Framework

General
introduction
Market
trends
Strategy
execution Business
performance
Looking
ahead
9
* Up to and including 2016
HY1 2015 Roadshow presentation
Divestment Program
15 terminals
Strategic
Growth
4 categories
Reduce * Cost base
30 EUR million
Reduce * Capex
100 EUR million
Business review

General
introduction
Market
trends
Strategy
execution Business
performance
Looking
ahead
10
Debt servicing EUR 2.3 billion, remaining maturity 8 years, average interest 4.2%
Dividend EUR 0.8b paid to shareholders in the last 10 years
Disciplined growth Network expanded from 20 to 32.5 million cbm*
Capital optimization Create further flexibility for growth
1
2
3
4 * As per 21 August with 5.8 million cbm under construction up to and including 2019
Priorities for cash
HY1 2015 Roadshow presentation

General
introduction
Market
trends
Strategy
execution Business
performance
Looking
ahead
11
Strategic Operational
Compliance
Competitive environment
Changing flows
Financial
Geopolitics
Legislation
People with the right skills
Expansion projects
Capital constraints
Reputation
HY1 2015 Roadshow presentation
Business challenges

General
introduction
Market
trends
Strategy
execution Business
performance
Looking
ahead
12
Market dynamics
• Asia market dynamics
Projects
• Overcapacity and pricing
• Impact contango
• Projects under development
• Ramp-up of new capacity
Governance
• Governing Joint Ventures
Network alignment
• Divestment program
HY1 2015 Roadshow presentation
Discussions with investors

General
introduction
Market
trends
Strategy
execution Business
performance
Looking
ahead
trends Market

General
introduction
Market
trends
Strategy
execution Business
performance
Looking
ahead
70-170%
GDP
15-55%
Energy demand
15-35%
Population
Source: UN (2015); World bank (2013); IMF (2013); IEA (2014); Shell (2014) and various other sources.
LNG as
transport fuel Shale gas in
China
European refining
& petrochemical
Biofuel
scenarios
Energy role of
Africa
US oil and gas
export scenarios
Trends driving storage demand
14 HY1 2015 Roadshow presentation
General
introduction
Market
trends
Strategy
execution Business
performance
Looking
ahead
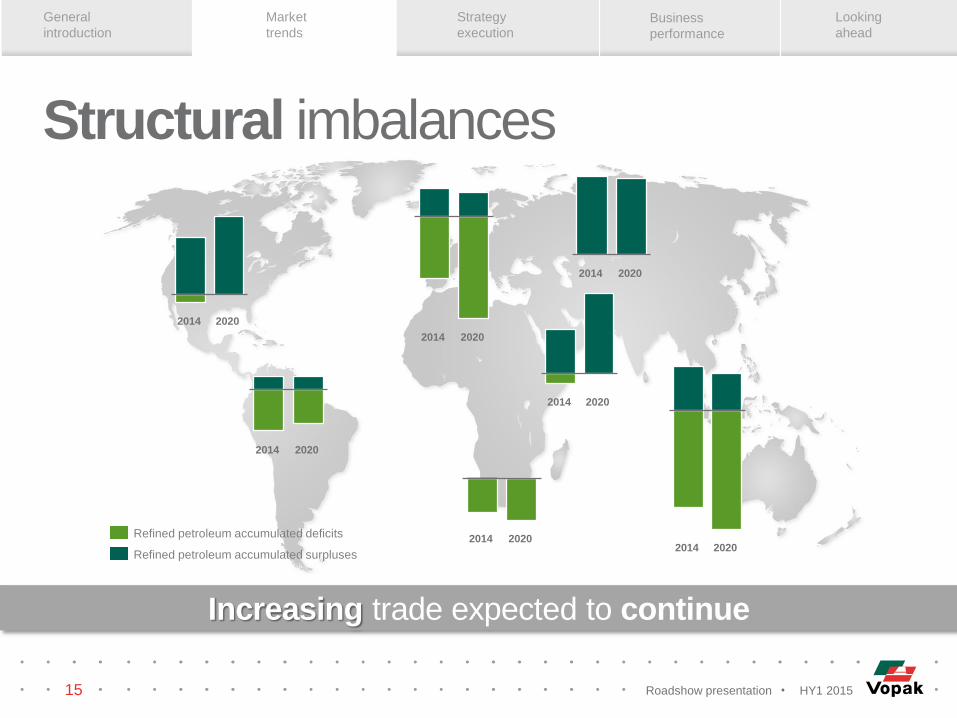
Increasing trade expected to continue
2020 2014
2014 2020
2014 2020
2020 2014
2020 2014
2014 2020 2014 2020
Refined petroleum accumulated surpluses
Refined petroleum accumulated deficits
Structural imbalances
15 HY1 2015 Roadshow presentation

General
introduction
Market
trends
Strategy
execution Business
performance
Looking
ahead
Source: ATEC / ICIS database and Vopak intelligence
Imbalances continue to develop
US and Middle East export, Asia and Europe import
16 HY1 2015 Roadshow presentation

General
introduction
Market
trends
Strategy
execution Business
performance
Looking
ahead
Chemicals A encouraging chemicals
industry, with feedstock
flexibility playing a major
role in market sentiment.
Overall healthy demand
for chemicals driven by
growth, impacted by the
economic slowdown in
Asia and China.
Oil Structural imbalances,
product price volatility and
the current contango
market supported an
attractive trading
environment.
This development resulted
in a robust demand for
storage capacity at hubs
and deficit markets on a
global level.
Biofuels Biofuels demand coming
purely from mandates as
low crude oil prices
removed incentive for
discretionary blending.
Vegoils Growth in the vegoils
market slowed down due
to lower supply growth in
palm oil and rapeseed /
sunflower oil.
LNG Increase in supply
capacity put pressure on
LNG prices in both the
Atlantic and Pacific.
Significant increase in
global LNG production
capacity is under
construction and about to
come online in the next
5 to 7 years.
Product developments
17 HY1 2015 Roadshow presentation

General
introduction
Market
trends
Strategy
execution Business
performance
Looking
ahead
18
Growth leadership Strategy execution
General
introduction
Market
trends
Strategy
execution Business
performance
Looking
ahead
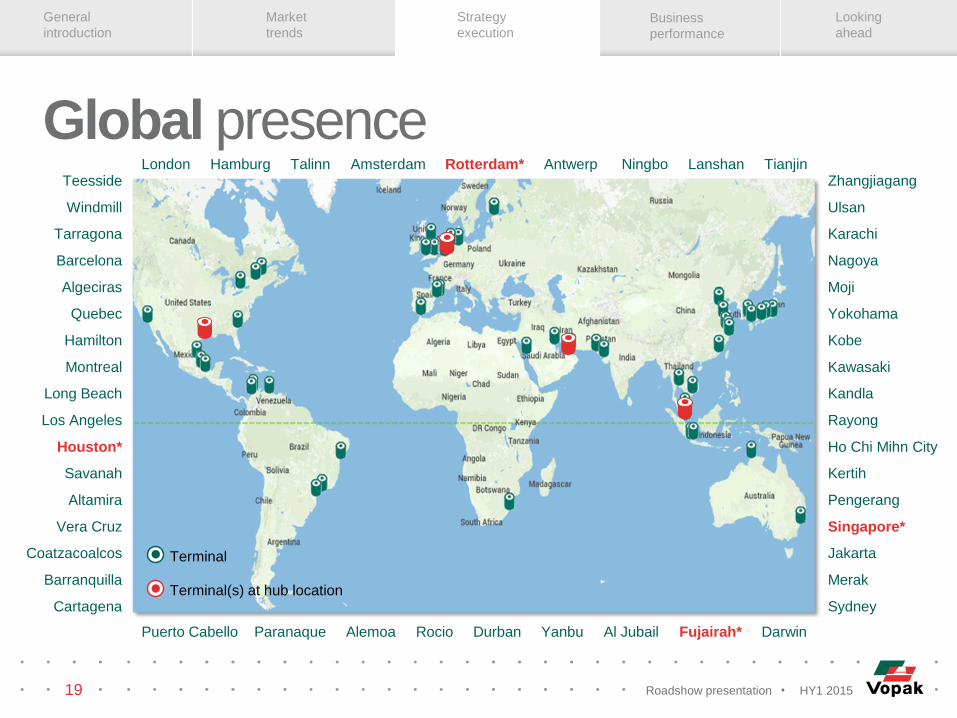
Teesside
Windmill
Tarragona
Barcelona
Algeciras
Quebec
Hamilton
Montreal
Long Beach
Los Angeles
Houston*
Savanah
Altamira
Vera Cruz
Coatzacoalcos
Barranquilla
Cartagena
Puerto Cabello Paranaque Alemoa Rocio Durban Yanbu Al Jubail Fujairah* Darwin
Zhangjiagang Ulsan Karachi Nagoya Moji Yokohama Kobe Kawasaki Kandla Rayong Ho Chi Mihn City Kertih Pengerang Singapore* Jakarta Merak Sydney
London Hamburg Talinn Amsterdam Rotterdam* Antwerp Ningbo Lanshan Tianjin
Terminal
Terminal(s) at hub location
Global presence
19 HY1 2015 Roadshow presentation

General
introduction
Market
trends
Strategy
execution Business
performance
Looking
ahead
Footprint in emerging markets
Mitigating downward risks
Optimization growth opportunities
Commercial coverage on projects Local WACC
Contribution from key accounts
IV
III
I
V
VI
II First-mover
advantage Option
value
Growth along
with key accounts
Strategic
alliances
Pay-back period
Project NPV / IRR
Equity IRR
Contracted infrastructure
Launching Customers
MoUs/LoIs
Return requirements for investments
20 HY1 2015 Roadshow presentation

General
introduction
Market
trends
Strategy
execution Business
performance
Looking
ahead
Oil Chemicals Industrial Divestments Gasses
Galena park
terminal
Wilmington
terminals
(170,000 cbm)
(130,700 cbm) 36,800 cbm
413,000 cbm
(1,261,000 cbm)
Sweden
terminals
Vlissingen
terminal
Finland
terminals
(175,400 cbm)
Pengerang
(Phase 1C)
Note: This is only a selection of projects.
Investments and divestments
21 HY1 2015 Roadshow presentation

General
introduction
Market
trends
Strategy
execution Business
performance
Looking
ahead
Storage capacity developments In million cbm; commissioned and under development
+5.6
-1.1
1.6
Gre
en
field
Gre
en
field
Bro
wn
field
1.0
0.2
HY1 2015
Div
estm
en
ts
38.3*
32.7
2019
Div
estm
en
ts
4.8
0.4
Bro
wn
field
0.1
Year end
2014
33.8
Note: Including only projects under development estimated to be commissioned in the period up to and including 2019. * Includes the announced divestment.
Storage capacity developments
22 HY1 2015 Roadshow presentation

General
introduction
Market
trends
Strategy
execution Business
performance
Looking
ahead
Note: Including only announced projects under development estimated to be commissioned for the period HY1 2015 – 2019 and the announced divestment.
Storage capacity In million cbm
Subsidiaries Joint ventures and associates Only acting as operator
+5.6 +12.8
2019
38.3
3.3
14.7
20.3
2018
36.2
3.3
12.6
20.3
2017
36.2
3.3
12.6
20.3
2016
35.1
2.3
12.6
20.2
FY
2015
34.3
2.3
11.9
20.1
HY1 2015
32.7
2.3
10.3
20.1
2014
33.8
2.2
9.9
21.7
2013
30.5
1.6
8.1
20.8
2003
19.9
1.1
3.7
15.1
Galena park
terminal
Wilmington
terminals
(170,000 cbm)
(130,700 cbm)
(1,260,700 cbm)
(175,400 cbm)
Divestments
Sweden
terminals
Finland
terminals
Selective growth opportunities
23 HY1 2015 Roadshow presentation

General
introduction
Market
trends
Strategy
execution Business
performance
Looking
ahead
* Up to and including 2016 Note: including the divestment of Finland as per July 2015. *Excluding cash outflows for tax
Number of
plots of land
2
Number of
terminals
9
Storage
capacity
1.8 million cbm
Total net cash
proceeds
299 EUR million
*
Realized divestments 2015
24 HY1 2015 Roadshow presentation

General
introduction
Market
trends
Strategy
execution Business
performance
Looking
ahead
Storage capacity under development
25 HY1 2015 Roadshow presentation

General
introduction
Market
trends
Strategy
execution Business
performance
Looking
ahead
Storage capacity under development
26 HY1 2015 Roadshow presentation

General
introduction
Market
trends
Strategy
execution Business
performance
Looking
ahead
Total investments 2005-2019 In EUR million
Note: Total approved expansion capex related to 5.8 million cbm under development is ~EUR 3,300 million; * Forecasted Sustaining and Improvement Capex up to and including 2016 ** Total approved expansion capex related to 5.8 million cbm under development in the period HY1 2015 up to and including 2019.
100
2017-2019
~≤700
2,235
2010-2014
400
300
HY1
2015-2016
3,284
2005-2009
Other capex*
Expansion
capex**
~400
Expansion capex** In EUR million; 100% = EUR 3,300 million
Remaining
Vopak share
in capex
(Group
capex and
equity share
in JV’s)
Group capex spent
Contributed Vopak equity share in JV’s
Total partner’s equity share in JV’s
Total non recourse finance in JV’s
~2,900
Forecasted capex
TBD
Selective capital disciplined growth
27 HY1 2015 Roadshow presentation

General
introduction
Market
trends
Strategy
execution Business
performance
Looking
ahead
Senior net debt : EBITDA ratio
Note: For certain projects in joint ventures, additional limited guarantees have been provided, affecting the Senior net debt : EBITDA; * Based on Dutch GAAP.
Maximum ratio under
current US PP programs
Maximum ratio under other
PP programs and syndicated
revolving credit facility
0
1
2
3
4
5
HY1
2015
2.81
2014
2.83
2013
2.53
2012
2.38
2011
2.65
2010
2.63
2009
2.23
2008
2.54
2007
1.71
2006
1.61
2005
1.76
2004
2.20
2003*
2.42
2.75
3.0
3.75
Selective capital disciplined growth
28 HY1 2015 Roadshow presentation

General
introduction
Market
trends
Strategy
execution Business
performance
Looking
ahead
Ordinary shares
Subordinated loans
Subordinated USPP
loans: USD 102.9
million
Preference shares
Cancelled as per
January 2015
(EUR 44 million)
USD: 2.0 billion
SGD: 225 million and
JPY: 20 billion
Average remaining
duration ~ 8 years
EUR 1.0 billion
15 banks participating
duration until
February 2018
EUR 150 million drawn
Private placement
program*
Syndicated
revolving
credit facility*
Equity(-like)*
Listed on Euronext
Market capitalization:
EUR 4.9 billion as per
21 August, 2015.
Capital structure
29 HY1 2015 Roadshow presentation

General
introduction
Market
trends
Strategy
execution Business
performance
Looking
ahead
Debt repayment schedule In EUR million
0
600
1,200
1,000
200
400
2027 2026 2025 2024 2023 2022 2021 2020 2019 2018 2017 2016 2015 2029 2040 2028
Other
Asian PP
US PP
Subordinated US PP
RCF drawn
RCF flexibility
Debt repayment schedule
30 HY1 2015 Roadshow presentation

General
introduction
Market
trends
Strategy
execution Business
performance
Looking
ahead
Net finance costs HY1 2014 In EUR million
Net finance costs -47.5
Finance costs -50.6
Interest and
dividend income 3.1
-47.6
-53.7
6.1
2013 2014 2012
4.0% 4.5% 4.2%
HY1
2015
6.3%
2006
7.0%
4.4%
2011
4.7%
2010
5.2%
2009
5.4%
2008
5.4%
2007
Average interest rate In percent
997562426
2008
1,018
2007 2006
2,266
2013 2014
1,825
2012
1,748
2011
1,606
2010
1,431
2009 HY1
2015
2,352
Net interest bearing debt In EUR million
Net finance costs HY1 2015 In EUR million
Net finance costs
31 HY1 2015 Roadshow presentation

General
introduction
Market
trends
Strategy
execution Business
performance
Looking
ahead
Total equity and liabilities In EUR million
* Cash and cash equivalents are subtracted from Liabilities; Note: Due to the retrospective application of the Revised IAS 19, Equity and Liabilities for 2012 have been restated.
2012 (restated)
4,386
40%
60%
2011
4,152
44%
56%
2010
3,649
42%
58%
2009
2,947
45%
55%
2008
2,585
39%
61%
2007
1,997
44%
56%
2006
1,703
43%
57%
HY1
2015
5,336
38%
62%
36%
2014
5,226
64%
2013
4,644
42%
58%
Equity
Net
Liabilities*
Solvency ratio
32 HY1 2015 Roadshow presentation

General
introduction
Market
trends
Strategy
execution Business
performance
Looking
ahead
Dividend and EPS 2006-2014** In EUR
Excluding exceptional items; historical figures adjusted for 1:2 share split effectuated 17 May 2010.
Dividend policy:
Barring exceptional
circumstances, the
intention is to pay
an annual cash
dividend of 25-50%
of the net profit
2006
0.98
0.38
2014 2008
1.62
0.55
2007
1.31
0.48
2.45
2013
0.90
2012
2.73
0.88
2011
2.16
0.80 0.90
2.31
2010
2.08
0.70
2009
1.92
0.63
Pay-out ratio 39%
Dividend growth
33 HY1 2015 Roadshow presentation

General
introduction
Market
trends
Strategy
execution Business
performance
Looking
ahead
Operational leadership Strategy execution

General
introduction
Market
trends
Strategy
execution Business
performance
Looking
ahead
Safety Committed to improving our
personal and process safety
Efficiency Continuous focus on cost
management and capital
efficiency
Service improvement Always working on service
improvements for our
customers
Operational excellence is core to Vopak’s customer service offering
Execution of the business
35 HY1 2015 Roadshow presentation

General
introduction
Market
trends
Strategy
execution Business
performance
Looking
ahead
Have the right people
and create an agile
and solution driven
culture
Provide a healthy
and safe workplace
for our employees
and contractors
Be a responsible
partner for our
stakeholders
Excellent people
Safety and Health Environmental care
Responsible partner
Be energy and water
efficient and reduce
emissions and waste
Sustainability
36 HY1 2015 Roadshow presentation

General
introduction
Market
trends
Strategy
execution Business
performance
Looking
ahead
Total injury rate (TIR) Total injuries per 200,000 hours worked by own
employees and contractors
HY1
2014
0.31
2013
0.36
2012
0.41
2011
0.59
2010
0.63
HY1
2015
0.37
2014
0.39
Process incidents # incidents
88 66 53 47 59
HY1 2014 HY1 2013 HY1 2012 HY1 2011 HY1 2015
Lost time injury rate (LTIR) Total injuries leading to lost time per 200,000 hours
worked by own employees and contractors
2014
0.13
HY1
2014
0.11
2013
0.12
2012
0.14
2011
0.22
2010
0.23
HY1
2015
0.12
Process safety event rate (PSER) Tier 1 and Tier 2 incidents per 200,000 hours worked by own
employees and contractors (excluding greenfield projects)
HY1 2015
0.18
HY1 2014
0.24
HY1 2013
0.40
Safety performance
37 HY1 2015 Roadshow presentation

General
introduction
Market
trends
Strategy
execution Business
performance
Looking
ahead
Customer leadership Strategy execution

General
introduction
Market
trends
Strategy
execution Business
performance
Looking
ahead
Tank storage
Blending nitrogen
Adding / cooling
Heating / unloading of ships / railcars / trucks
Loading
Excess througput fees
Monthly invoicing in arrears
Fixed rental fees for capacity
Fixed number of throughputs per year
V opak does not own the product
Monthly invoicing in advance
Note: general overview of business model. Can vary per terminal.
Sh
are
of re
ve
nu
es
Services
Business model
39 HY1 2015 Roadshow presentation

General
introduction
Market
trends
Strategy
execution Business
performance
Looking
ahead
Global clients Regional clients Local clients
Active at multiple Vopak
locations around the world.
Current turnover and future
potential define Vopak’s
global network account
approach.
Active in more than one Vopak
location on a regional level.
Can be the largest clients at a
division.
Regional marketing
Active in one Vopak location.
Can be largest clients at a
specific Vopak location
Local sales approach.
Global, regional and local clients
40 HY1 2015 Roadshow presentation

General
introduction
Market
trends
Strategy
execution Business
performance
Looking
ahead
Market share according to definition
41 HY1 2015 Roadshow presentation
Vopak share
As a % of world market
As a % of primary
storage market**
Total
Vopak
Secondary competition
Primary competition
* Non-oil includes chemicals, vegoils, biofuels and gasses; ** Defined as the primary competition plus Vopak’s Storage Capacity. Note: In million cbm per
August 2015; excluding storage market for LNG. Source: Vopak own research.
Oil storage market In million cbm
8%
12%
137.8
90.0
19.4
247.2
Non oil storage market* In million cbm
21%
26%
36.2
10.8
12.5
59.5
Total storage market In million cbm
10%
16%
174.0
100.8
31.9
306.7

General
introduction
Market
trends
Strategy
execution Business
performance
Looking
ahead
EBIT(DA) margin In percent
Note: Excluding exceptional items; excluding net result from joint ventures and associates.
Focus on creating more value from our core assets
0
10
20
30
40
50
HY1
2015
2012 2014 2013 2009 2008 2010 2007 2011
31.8%
49.6%
2004 2005 2006
EBIT margin
EBITDA margin
EBIT(DA) margin development
42 HY1 2015 Roadshow presentation

General
introduction
Market
trends
Strategy
execution Business
performance
Looking
ahead
Contract position 2013 In percent of revenues
Contract position 2014 In percent of revenues
20%
52%
28% 26%
53%
21%
> 3 year < 1-3 year
Note: Based on original contract duration; Subsidiaries only.
Contract position 2012 In percent of revenues
18%
52%
30%
1 year
Balanced contract portfolio
Contract duration
43 HY1 2015 Roadshow presentation

Analyst presentation HY1 2015 21 August 2015
Highlights
HY1 2015
Strategy
execution
Business
performance
Looking
ahead
Question &
answers
Appendix
divisional results Selective
growth
performance Business

General
introduction
Market
trends
Strategy
execution Business
performance
Looking
ahead
* Terminal network is defined as the total available storage capacity (jointly) operated by the Group at the end of the reporting period, being storage capacity for subsidiaries, joint ventures, associates (with the exception of Maasvlakte Olie Terminal in the Netherlands which is based on the attributable capacity, being 1,085,786 cbm), and other (equity) interests, and including currently out of service capacity due to maintenance and inspection programs”; ** Subsidiaries only; *** EBITDA (Earnings Before Interest Depreciation and Amortization) excludes exceptionals and includes net result of joint ventures and associates. **** Cash flow from operating activities on a gross basis
Terminal Network *
32.7 In million cbm
Occupancy Rate **
91% Average
EBITDA
408 In EUR million
Cash flows Operating ****
363 In EUR million
***
Results HY1 2015
45 HY1 2015 Roadshow presentation

General
introduction
Market
trends
Strategy
execution Business
performance
Looking
ahead
Currency effects
Geographical differences
Topics influencing HY1 2015 results
46 HY1 2015 Roadshow presentation

General
introduction
Market
trends
Strategy
execution Business
performance
Looking
ahead
Net profit** In EUR million
* Excluding exceptional items; including net result from joint ventures and associates; ** Net profit attributable to holders of ordinary shares -excluding exceptional items- ; *** Subsidiaries only.
Occupancy rate*** In percent
162138
163
-15% +17%
HY1 2015 HY1 2014 HY1 2013
0pp +3pp
HY1 2015
91%
HY1 2014
88%
HY1 2013
88%
EBITDA* In EUR million
408367385
-5% +11%
HY1 2015 HY1 2014 HY1 2013
701647649
0% +8%
HY1 2015 HY1 2014 HY1 2013
Revenues In EUR million
HY1 2015 summary
47 HY1 2015 Roadshow presentation

General
introduction
Market
trends
Strategy
execution Business
performance
Looking
ahead
EBITDA development In EUR million
Q2 Q1
206
Q4
194
Q3
202
Q2 Q3
180
187
Q4
183
202
Q1
185
Q2
196
Q1
189
2013
Note: EBITDA in EUR million excluding exceptional items and including joint ventures and associates
2014 2015
EBITDA development
48 HY1 2015 Roadshow presentation

General
introduction
Market
trends
Strategy
execution Business
performance
Looking
ahead
Netherlands EMEA
Asia Americas
+4% +11%
HY1 2015
137.2
HY1 2014
123.7
HY1 2013
119.4
+9% -5%
HY1 2015
148.7
HY1 2014
136.4
HY1 2013
143.9
+21% -5%
HY1 2015
59.4
HY1 2014
49.2
HY1 2013
52.0
HY1 2014
+14%
65.1
HY1 2015
-17%
57.0
HY1 2013
68.4
EBITDA*
Non-allocated
HY1 2013 HY1 2014 HY1 2015
0.8 0.2
-2.0
Note: EBITDA in EUR million excluding exceptional items and including joint ventures and associates
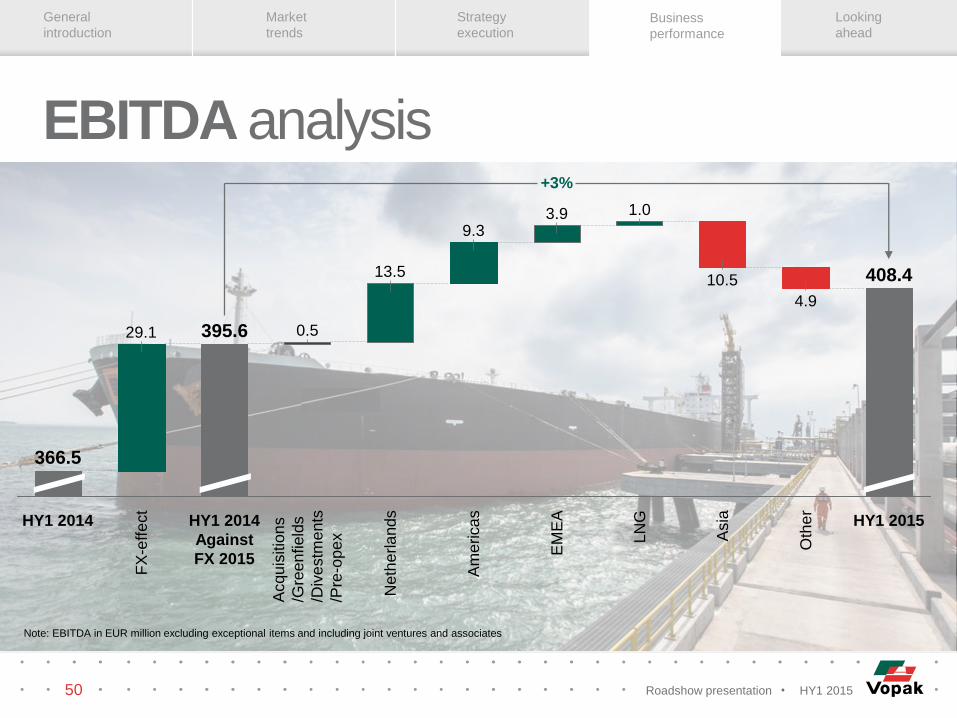
408.4
HY1 2015
+11% -5%
HY1 2013
366.5 384.5
HY1 2014
EBITDA per division
49 HY1 2015 Roadshow presentation
General
introduction
Market
trends
Strategy
execution Business
performance
Looking
ahead
HY1 2014
Against
FX 2015
395.6
FX
-eff
ect
29.1
HY1 2014
366.5
+3%
9.3
Neth
erla
nds
13.5 A
cqu
isitio
ns
/Gre
en
field
s
/Div
estm
en
ts
/Pre
-op
ex
0.5
HY1 2015
408.4
Oth
er
4.9
Asia
10.5
LN
G
1.0
EM
EA
3.9
Am
erica
s
Note: EBITDA in EUR million excluding exceptional items and including joint ventures and associates
EBITDA analysis
50 HY1 2015 Roadshow presentation

General
introduction
Market
trends
Strategy
execution Business
performance
Looking
ahead
Netherlands EMEA
Asia Americas
-8% +8%
HY1 2015
1.3
HY1 2014
1.2
HY1 2013
1.3
+49%
-11%
HY1 2015
25.7
HY1 2014
17.3
HY1 2013
19.4 -50%
-67%
HY1 2015
0.1
HY1 2014
0.2
HY1 2013
0.6
HY1 2015
+18% -52%
11.3
HY1 2014
9.6
HY1 2013
20.2
EBITDA*
Global LNG
-8%
16.9
HY1 2014
+21%
HY1 2015
14.0
HY1 2013
15.2
Note: Amounts in EUR million; based on IFRS equity accounting *Excluding exceptional items
HY1 2014
56.9
HY1 2015
55.4
42.4
+31%
HY1 2013
-25%
HY1 2015 net result of joint ventures
51 HY1 2015 Roadshow presentation

General
introduction
Market
trends
Strategy
execution Business
performance
Looking
ahead
HY1 2014 In EUR million
251.3
-15.3
236.0
42.4
193.6
HY1 2015 In EUR million
284.7
EBIT excl. exceptional items
Exceptional gain/loss 3.1
281.6
EBIT incl. exceptional items
Net result joint ventures
Incl. exceptional items 55.4
Group operating profit 229.3
Delta In EUR million
+ 35.7 (18%)
+ 13.0 (31%)
+ 48.7 (21%)
+ 30.3 (12%)
Earnings per share
excl. exceptional items 1.27 1.08 + 0.19 (18%)
* Net profit attributable to holders of ordinary shares.
162.4 Net profit excl. exceptional items* 138.3
HY1 2015 EBIT
52 HY1 2015 Roadshow presentation

General
introduction
Market
trends
Strategy
execution Business
performance
Looking
ahead
Overall healthy demand for our services
Occupancy rate In percent
2013 2014
90-95%
85-90%
Q2
91
Q1
91
Q4
88
Q3
89
Q2
88
Q1
88
Q4
87
Q3
87
Q2
88
Q1
89
HY1
2015
91
‘14
88
’13
88
’12
91
’11
93
’10
93
’09
94
’08
95
’07
96
’06
94
’05
92
’04
84
Note: Subsidiaries only.
Full potential playing field
2015
Occupancy rate developments
53 HY1 2015 Roadshow presentation
General
introduction
Market
trends
Strategy
execution Business
performance
Looking
ahead
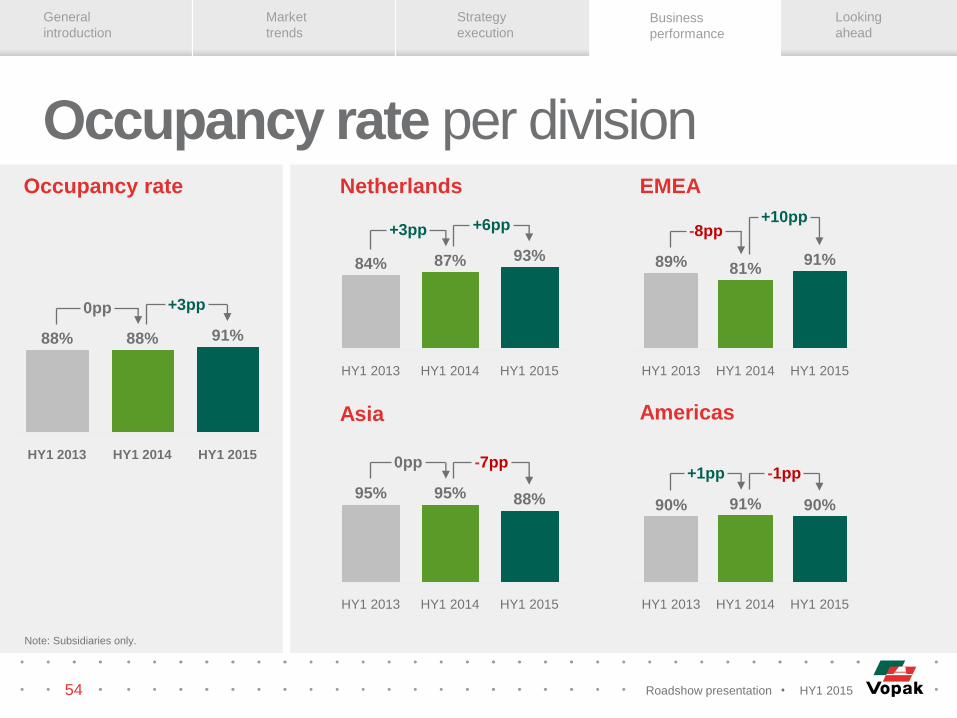
Netherlands
Note: Subsidiaries only.
EMEA
Asia Americas
+3pp +6pp
HY1 2015
93%
HY1 2014
87%
HY1 2013
84%
0pp -7pp
HY1 2015
88%
HY1 2014
95%
HY1 2013
95%
-1pp +1pp
HY1 2015
90%
HY1 2014
91%
HY1 2013
90%
-8pp +10pp
HY1 2015
91%
HY1 2014
81%
HY1 2013
89%
Occupancy rate
HY1 2013
88%
HY1 2015
+3pp
91%
HY1 2014
88%
0pp
Occupancy rate per division
54 HY1 2015 Roadshow presentation

General
introduction
Market
trends
Strategy
execution Business
performance
Looking
ahead
367 363
2013
713
361
2012
659
2011
496
2010
455
2009
451
2008
387
2007
335
2006
286 -1%
2014 HY1
2015
751
Cash flow from operating activities (gross) In EUR million
Undiminished focus on free cash flow generation
Cash flow developments
55 HY1 2015 Roadshow presentation

General
introduction
Market
trends
Strategy
execution Business
performance
Looking
ahead
ROCE** In %
HY1 2015
17.1%
HY1 2014
15.2%
HY1 2013
19.5%
HY1 2015
13.8%
HY1 2014
14.6%
HY1 2013
17.3%
HY1 2015
10.5%
HY1 2014
11.0%
HY1 2013
12.0%
ROE*** In %
* CFROGA is defined as the EBITDA -excl. exceptional items- minus the statutory income tax charge on EBIT divided by the average historical investment (gross assets). ** ROCE is defined as EBIT excluding exceptionals as percentage of the capital employed . *** ROE is defined as Net Profit excluding exceptionals as percentage of the Equity excluding financing preference shares and Non-controlling Interest .
CFROGA* In %
Financial ratio’s HY1 2015
56 HY1 2015 Roadshow presentation

General
introduction
Market
trends
Strategy
execution Business
performance
Looking
ahead
Proportionate EBITDA In EUR million
Cash Flow Return on Gross Assets In %
Occupancy rate subsidiaries and joint ventures In %
396414
836
660617
452
428403
+14%
HY1 2015 2014
824
2013
817
2012 2011 2010
HY1 2015
90%
HY1 2014
88%
2013
88%
2012
90%
2011
92%
2010
92%
10.9%
2013
10.3% 10.3%
2014 HY1 2015 2012
11.8%
2011
11.6%
2010
12.2%
* EBITDA in EUR million excluding exceptional items
Non-IFRS proportional information
57 HY1 2015 Roadshow presentation

General
introduction
Market
trends
Strategy
execution Business
performance
Looking
ahead
results Divisional

General
introduction
Market
trends
Strategy
execution Business
performance
Looking
ahead
HY2015
9.9
HY1 2014
9.5
HY1 2013
9.4
Q2
2015
69.0
Q1
2015
68.2
Q4
2014
61.0
Q3
2014
68.0
Q2
2014
62.8
Q1
2014
60.9 62.0
Q3
2013
Q4
2013
61.3
Q2
2013
59.5
Q1
2013
59.8
Q2
2014
86%
Q1
2014
88%
Q4
2013
83%
Q3
2013
82%
Q2
2013
84%
Q1
2013
85%
Q1
2015
Q2
2015
95% 92%
Q4
2014
85%
Q3
2014
88%
EBITDA* In EUR million
Occupancy rate** In percent
* Including net result from joint ventures and associates; excluding exceptional items; ** Subsidiaries only.
Storage capacity In million cbm
Netherlands
59 HY1 2015 Roadshow presentation

General
introduction
Market
trends
Strategy
execution Business
performance
Looking
ahead
Q2
2015
31.1
Q1
2015
34.0
Q4
2014
30.9
Q3
2014
30.4
Q2
2014
28.1
Q1
2014
28.9
Q4
2013
34.2
Q3
2013
33.1
Q2
2013
33.6
Q1
2013
34.7
HY1 2015
8.5
HY1 2014
9.6
HY1 2013
9.5 91% 91%
Q4
2014
89%
Q3
2014
85%
Q2
2014
83%
Q1
2014
80%
Q4
2013
Q2
2015
Q1
2015
85%
Q3
2013
88%
Q2
2013
90%
Q1
2013
89%
EBITDA* In EUR million
Occupancy rate** In percent
* Including net result from joint ventures and associates; excluding exceptional items; ** Subsidiaries only.
Storage capacity In million cbm
EMEA
60 HY1 2015 Roadshow presentation

General
introduction
Market
trends
Strategy
execution Business
performance
Looking
ahead
Q2
2015
73.3
Q1
2015
75.4
Q4
2014
77.9
Q3
2014
76.9
Q2
2014
70.0
Q1
2014
66.4
Q4
2013
68.0
Q3
2013
70.6
Q2
2013
73.2
Q1
2013
70.7
HY1 2015
10.2
HY1 2014
8.5
HY1 2013
7.4
Q1
2015
Q2
2015
85% 90%
Q4
2014
93%
Q3
2014
95%
Q2
2014
95%
Q1
2014
95%
Q4
2013
94%
Q3
2013
94%
Q2
2013
95%
Q1
2013
95%
EBITDA* In EUR million
Occupancy rate** In percent
* Including net result from joint ventures and associates; excluding exceptional items; ** Subsidiaries only.
Storage capacity In million cbm
Asia
61 HY1 2015 Roadshow presentation

General
introduction
Market
trends
Strategy
execution Business
performance
Looking
ahead
Q2
2015
30.0
Q1
2015
29.4
Q4
2014
29.6
Q3
2014
26.3
Q2
2014
25.9
Q1
2014
23.3
Q4
2013
21.2
Q3
2013
22.1
Q2
2013
28.0
Q1
2013
24.0
HY1 2015
3.3
HY1 2014
3.7
HY1 2013
3.3
Q1
2015
Q4
2014
89% 89%
Q3
2014
89%
Q2
2014
90%
Q1
2014
91%
Q4
2013
89%
Q3
2013
89%
Q2
2013
89%
Q1
2013
91%
Q2
2015
91%
EBITDA* In EUR million
Occupancy rate** In percent
* Including net result from joint ventures and associates; excluding exceptional items; ** Subsidiaries only.
Storage capacity In million cbm
Americas
62 HY1 2015 Roadshow presentation

Analyst presentation HY1 2015 21 August 2015
Highlights
HY1 2015
Strategy
execution
Business
performance
Looking
ahead
Question &
answers
Appendix Selective
growth
ahead Looking

General
introduction
Market
trends
Strategy
execution Business
performance
Looking
ahead
Asian
market
Commissioning
new capacity
Impact
divestments
Topics influencing HY2 2015
64 HY1 2015 Roadshow presentation

General
introduction
Market
trends
Strategy
execution Business
performance
Looking
ahead
~x% Share of EBITDA*
Note: Width of the boxes does not represent actual percentages; company estimates; * Excluding exceptional items, including net result from joint ventures and associates.
Oil products Chemicals
Solid
Mixed
Solid
Mixed
Different demand
drivers
Steady
Steady Solid
Solid
Major Hubs supporting intercontinental product flows
Import/distr. in major markets with structural deficits
Other infra
45-50% 20-25% 20-25% 2.5% - 5% 5-7.5%
~0 - 5 years ~1 - 5 years ~5 - 15 years ~0 - 3 years ~10 - 20 years
Different demand
drivers
Industrial terminals
& other pipeline
connected infra
Biofuels &
vegoils LNG
2015
2014
Contract
duration
Outlook assumptions
65 HY1 2015 Roadshow presentation

General
introduction
Market
trends
Strategy
execution Business
performance
Looking
ahead
2014 Productivity and
organisations
efficiency
enhancements
Fx and
pension costs
Divestments Expansions
and
acquisitions
2015 Uncertainties incl.
phased build-up
new capacity
Vopak reconfirms its outlook for 2015 to realize an EBITDA -excluding exceptional items- that exceeds
the full year 2014 result (EUR 763 million), whereby we currently expect that the EBITDA -excluding
exceptional items- of the second half of the year will not be higher than the EBITDA of the first six months
of 2015 due to the impact of divestments and the more challenging business circumstances in Asia.
Outlook elements
66 HY1 2015 Roadshow presentation

Analyst presentation HY1 2015 21 August 2015
Highlights
HY1 2015
Strategy
execution
Business
performance
Looking
ahead
Question &
answers
Appendix Selective
growth
topics Other

General
introduction
Market
trends
Strategy
execution Business
performance
Looking
ahead
HY1 2015 EBITDA transactional currencies In percent
15%
24%
38%
23%
SGD
USD
Other
EUR
FX translation-effect on HY1 2015 EBITDA In EUR million
29.1 Total
3.8
Americas
Non-allocated
Asia
Netherlands
EMEA
21.5
0.4
3.4
FX translation effects
68 HY1 2015 Roadshow presentation

General
introduction
Market
trends
Strategy
execution Business
performance
Looking
ahead
Effective tax rate* In percent
18.0
2012 2013
17.1
2014
20.9
* Excluding exceptional items.
Pension cover ratio In percent
118118112
2012 2014 2013
Other topics
69 HY1 2015 Roadshow presentation

Highlights
HY1 2015
Strategy
execution
Business
performance
Selective
growth
Looking
ahead
Question &
answers
Analyst presentation HY1 2015 21 August 2015
Appendix
• • • • • • • • • • • • • • • • • • • • • • • • • • • • • • • • • •
• • • • • • • • • • • • • • • • • • • • • • • • • • • • • • • • • •
• • • • • • • • • • • • • • • • • • • • • • • • • • • • • • • • • •
• • • • • • • • • • • • • • • • • • • • • • • • • • • • • • • • • •
• • • • • • • • • • • • • • • • • • • • • • • • • • • • • • • • • •
• • • • • •
• • • • • • • • • • • • • • • • • • • • • • • • • • • • • • • • • •
• • • • • • • • • • • • • • • • • • • • • • • • • • • • • • • • • •
Royal Vopak I Westerlaan 10 I 3016 CK Rotterdam I The Netherlands I Tel: +31 10 400 2911 I Fax: +31 10 413 9829 I www.vopak.com
We have built
our company
over 400 years on
trust and reliability


