
1
Hydrothermal Carbonization and Investigation of Hydrochar Using IR Spectroscopy
Genzeb Belsie Nge
Instituto Superior Tecnico, Lisbon, Portugal
Abstract
Hydrothermal carbonization (HTC) is a thermal conversion of biomass to carbonaceous material called
hydrochar, applicable in various sectors. Nevertheless, biomass 's components highly affect the
hydrochar yield and carbon content. IR spectroscopy techniques are essential for the study of hydrochar
structures and the involved functional groups. A platform called library of spectra is essential to identify
the associated functional groups and components.
In this study, the effect of HTC on biomass components and the effect of ammonium chloride (NH4Cl),
amino acids and KCl on solid yield, total carbon recovery and nitrogen contribution to the solid product
were tested by adding these salts and amino acids on HTC of glucose solution. The investigation of
hydrochar with IR spectroscopy was performed and a library of spectra was generated
HTC char mass increased when KCl was added whereas, NH4Cl showed a slight decrease on mass and
carbon recovery. On the other hand amino acid addition brought insignificant mass change however, a
slight fluctuation on total carbon recovery was observed with temperature variation. The IR spectroscopy
studies indicates that the hydrochar formed consists of a small cluster of complex structure which
contains hydroxyl, carboxyl, carbonyl, aldehyde and ketone functional groups.
A maximum total carbon recovery of 90% can be achieved by adjusting the temperature, concentration
of salts, amino acids and reaction time. The generated library of spectra can be applied in identification
of the associated functional groups for further studies of substances .
.Keywords:
HTC, Hydrochar, Functional group, Library of spectra, IR spectroscopy
1 Introduction
Hydrothermal carbonization (HTC) of wet biomass in a range of 180°C - 300°C produces carbon rich
stable material called hydrochar (HTC char) which have various application in energy and environmental
sectors. However, HTC char yields, carbon efficiency and other properties of products depend on the
types of feedstocks used, their components, temperatures and reaction time. A high carbon efficient solid
might be produced by adjusting the feedstocks, for example by blending various kinds of feedstocks
together for HTC process. To accomplish this task, suitable concentrations of each component of
biomass required should be determined by conducting a study on the effects caused by individual
2
component on the properties and value of HTC char produced. In this thesis the effects of biomass
components on THC product were studied. Biomass, particularly glucose (hydrolysis product of cellulose)
solution was carbonized without and with some inorganic salt such as ammonium chloride (NH4Cl),
potassium chloride (KCl) and organic compounds like amino acids (AA) added to examine their effect on
the yield of HTC process.
The properties of HTC char needs to be investigated by identifying the functional group linked to the
molecules. IR spectroscopy technique is one of the most important tools to identify substances and very
often employed in the analysis to compare samples suspected of being identical. There are some studies
already done on the investigation of biochar using their spectra. However, there is no platform or a
reference developed for comparing the biochar products for further works. Therefore, a reference called
library of spectra, which will be used in structural analysis and substance identification needs to be
generated and applied for further studies.
2 Materials and methods
D+ glucose monohydrate (C6H12O6, molecular weight 180.17g/mol), supplied by Merck, KGaA,
www.merck.de, was used as biomass component. AC (NH4Cl) and KCl, three AA (phenylalanine,
C9H11NO2, with molecular weight 165g/mol, Glutamic acid, C5H9NO4, with molecular weight 147g/mol,
glycine, C2H5NO2, with molecular weight of 75g/mol) all produced by ''merck'' were used as additives to
test their effect on HTC products.
Glucose - water solution with same total organic carbon (TOC) as a 15% by mass solid components of
biogas residues from a mesophilic digestion (input material: 40% maize silage, 30% grass silage, 30%
cattle manure) was prepared. Because it only provides the organic carbon, carbon from glucose was
considered in TOC determination, and also glucose monohydrate contains one mole of water per mol of
glucose so, 1% from glucose used should considered as water.
First, HTC was carried out on a 29% by mass, with 10.77% TOC, glucose solution. Secondly, the effect of
AC, KCl and a mixture of three AA were tested by adding each compounds in HTC process of glucose
solution. Each experiment was carried out from two to three times under suitably controlled conditions.
Then HTC is conducted in10ml stainless steel tubular autoclaves loaded up to 70%. After the solution is
loaded the autoclave is purged for one minute with argon or helium to remove oxygen, and the reaction
was allowed to take place at 180°C, 200°C, 220°C, 240°C, 260°C and 300°C for three hours including the
heating time. Three hour reaction time was taken because at three and above three hours reaction time,
the heating time can be avoided. After that. the autoclave was allowed to cool down to 40°C before
opening. After the gas is removed, the liquid portion and the wet solid were separated by either vacuum
filtration (using 25mm nylon membrane filter with a sieve diameter of 0.45μm) or with a micro tube
centrifugal separator. But the later was noted to have more loss compared to vacuum filtration, thus
vacuum filter was used to separate the liquid products from solid. The solid is measured after drying at
3
40°C at constant weight for 24 hours and then, washed either with a 0.0125% by mole or with distilled
water in a ratio 5ml to 0.5g for 1 hour. However, the difference is not significant, thus in this work water
was used for washing. The solid yield and total carbon recovery was computed based on the mass of
glucose and carbon initially present in the feed using the result from elemental analysis.
Total solid recovery (TSR) = {mass of dried char (m)}/ {mass of dry glucose in feed (mg)} ...........1
Carbon recovery in solid (CRS) = {Mass of carbon in char}/ {mass of carbon in feed}................... 2
After drying the solid at constant weight, a manual size reduction was carried out to the extent it is
acceptable for elemental analysis and IR spectrum measurement.
The IR spectra of liquid, dried solid and washing water were measured by using IR spectrometer. The
measured spectrum is modified and evaluated with various OPUS software evaluation techniques before
assigning the functional group associated with a particular observed absorpt ion bands. The bands
assignment is after closer examining of the bands and comparing these values with ''Demo library'' and
own built library as well as with the help of previously studied correlation tables which show functional
groups and their ranges of corresponding frequency of absorption in wavenumber. The surface
morphology and structure of the char were studied using scanning electron microscope (SEM) with
respect to chemical structure.
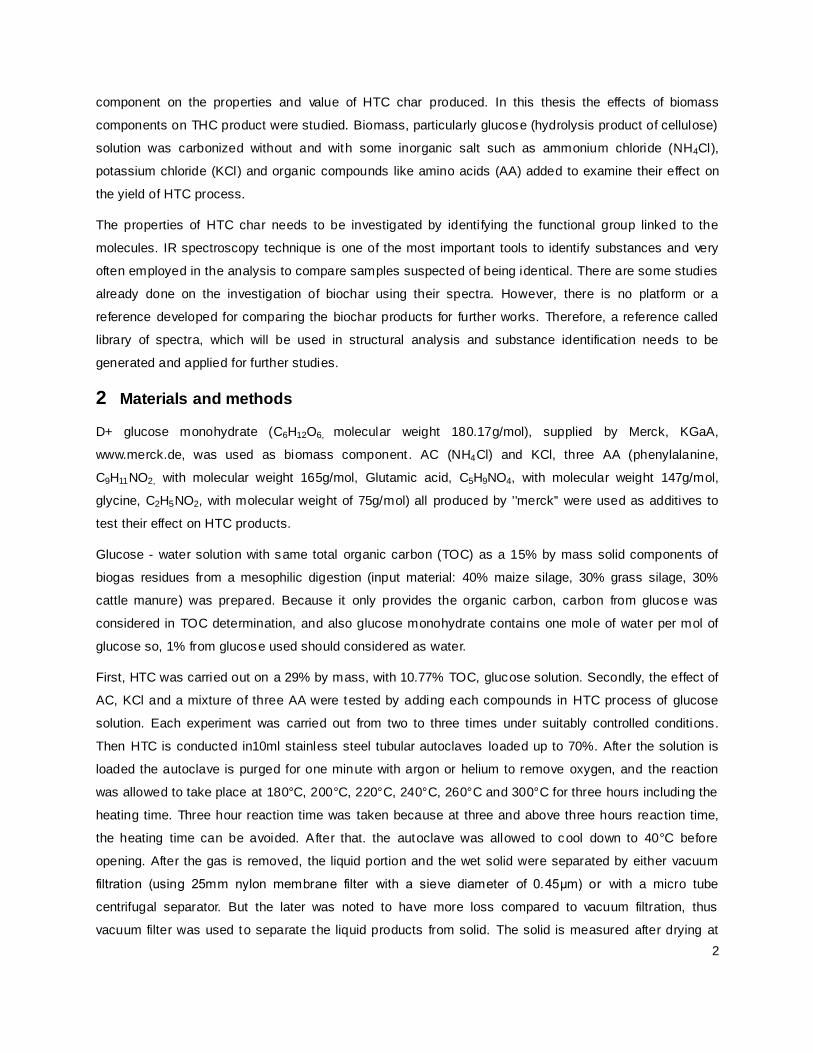
TOC : total organic carbon
Figure 1. Schematic flow diagram of experimental procedure.

4
3 Results and discussion
HTC of pure glucose solution (GS) produces products in three phases, like hydrothermal carbonization of
any other biomass. The solid mass yields by mass (m/m) range in 40 - 50% in between 200 - 300°C as
indicated by Figure 2. Total solid recovery (TSR) and carbon recovery with solid (CRS) from HTC process
with and without organic and inorganic compound added. The losses can be plausibly explained as
wetting and spill or droplet losses and account for 1 - 5% in total mass balance. Substantial liquid
products can only be produced and separated from solid at a temperature of 180, 200 and 210°C
otherwise, liquid products were absorbed at the solid's surface and make the solid more moisten.
It was found from previous studies that some salts such as calcium propionate, calcium chloride and
calcium formate addition to HTC of hemicelluloses shows a slight increase in mass yields while others,
like magnesium acetate, calcium lactate and lithium chloride show mass yield lower than the no salt
added control due to the removal of high fraction of hemicelluloses and cellulose during the reaction
[Joan G. Lynam, M. Toufiq Reza, Victor R. Vasquez, Charles J. Coronella]. Similarly, adding potassium
chloride salt on HTC of GS shows an increase in solid mass yield while adding AC was found to have
lower mass compared to the no salt added carbonization of glucose solution. A 5% increase in mass yield
was obtained in the HTC of GS with KCl added. The maximum solid recovery (53%) occurs at 220°C
while in case of HTC of pure glucose solution maximum solid recovery of 50% (m/m) occurs at 240°C.
However, there is a small fluctuation of solid recovery above 220°C when KCl is added in HTC of pure
glucose solution. But at all temperatures the mass yield was higher when KCl is added. The added salt
might catalyzed the condensation reactions which cause the formation of products that can precipitate in
HTC char, cause the mass yield to increase. By adding AC on HTC of GS, a maximum of 45% solid at
220°C was obtained. The total carbon recovery in solid (CRS) is slightly less compared to the CRS from
HTC of GS as indicated by Figure 2 (right) due to AC increase degradation of glucose and comparatively
more carbons with gas and carboxylic compounds with liquid products are released. The maximum solid
mass yield was also found to be at lower temperature. This is due to the acidic nature of AC in solution
increase its catalytic effect. But the solid has nearly similar carbon efficiency (CES) with increasing trend
with temperature like in the CES of solid produced from HTC of GS. On the other hand, adding AA in
HTC of GS shows insignificant change in solid recovery and a slight fluctuation of carbon efficiency and
total carbon recovery with temperature. This is due to the effects of acids on HTC process highly depend
on temperature and concentration of acids. A 53% of solid was recovered at 200°C from HTC of GS
solution with AA added. However, for all experiments with AC, KCl and AA added the volume of gas,
predominantly CO2 with trace amount of CO, is higher compared to the gas produced in the no salt added
process thus, the fraction of carbon explored with gas is to some extent increased (6%). Nevertheless,
the carbon content of the liquid phase decreased with increasing temperature and the majority of carbon
remains still in the solid phase as well as more degradation is carried out at lower temperature when
these additives are used compared to the no additive case.
5
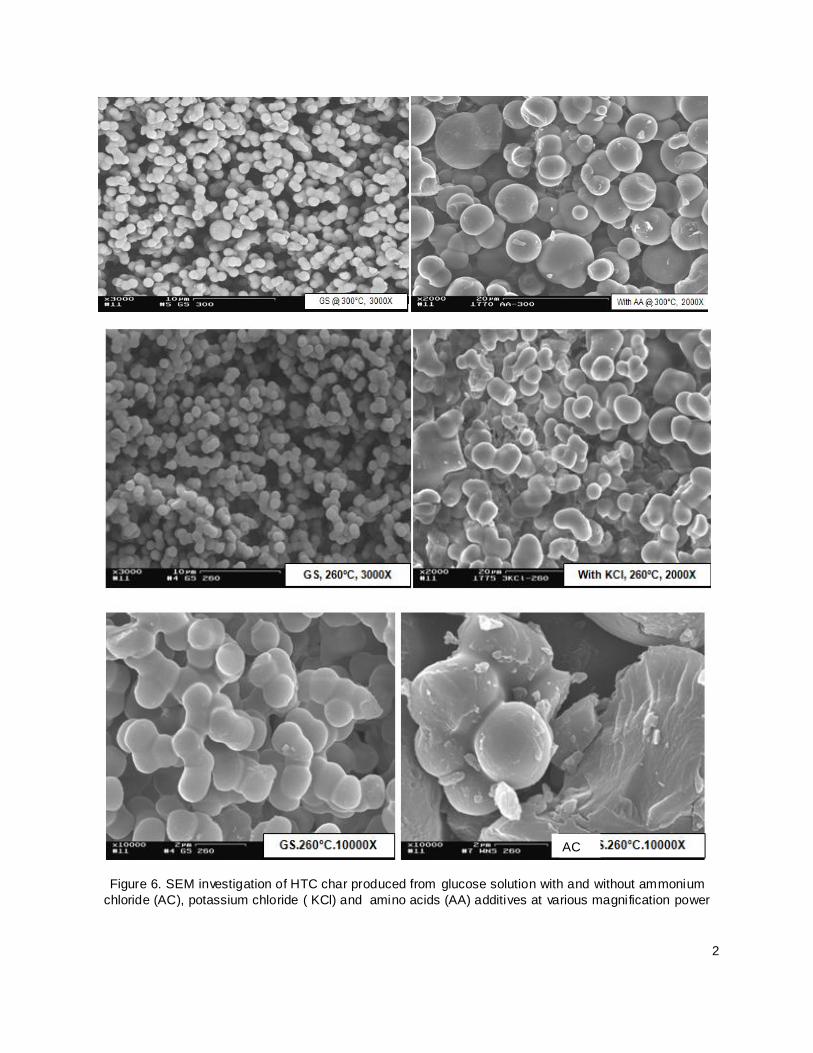
It was also indicated by SEM study that the micropores and external porous structures as well as
microspheres constituting the surface of HTC char with AA, AC and KCl added are comparatively larger
and the microspheres have different size compared to HTC char produced from GS at the same
magnification power. Different structures with deformed shape are observed when these additives are
used in HTC process indicating the contribution of these compounds on the degradation of glucose
Figure 6.
3.1 Investigation of Hydrochar with IR spectroscopy
By applying modification and evaluation techniques, from OPUS software package, on raw spectra of
HTC char produced from GS and with AC, mixture of three AA and KCl added, the functional group
associated were identified. The average spectrum (AS) of HTC char produced from pure GS at all
temperatures was computed and used as reference at a threshold of 97.5. Each spectrum produced at
individual temperatures was first compared with AS. The comparison showed a little to no change as
indicated by the correlation coefficient (CR) >99% Error! Reference source not found.. Only small
variation for the char produced at 180°C is observed near 3600 - 3000cm-1
, where the OH functional
group is found to exist. Another variation might exist in the finger print region due to the difference in
number of carbon atoms single and double bonds as well as different in isomeric structure. Performing a
spectrum search shows substance having known functional groups and similar structure with the HTC
char. Closer looking the spectra and the structural bonds of both the sample and reference spectrum from
the library, HTC char found to have good hit quality with some substance from the library and suggested
having aromatic ring with complex molecules like for example phenazine and 4 - hydroxy- 4 - methyl - 2 -
pentanone. A small variation on the correlation coefficient is observed when HTC char produced with AC,
AA and KCl added were compared with AS indicating the presence of amine and chloride functional
groups.
3.2 Identification of functional groups of hydrochar
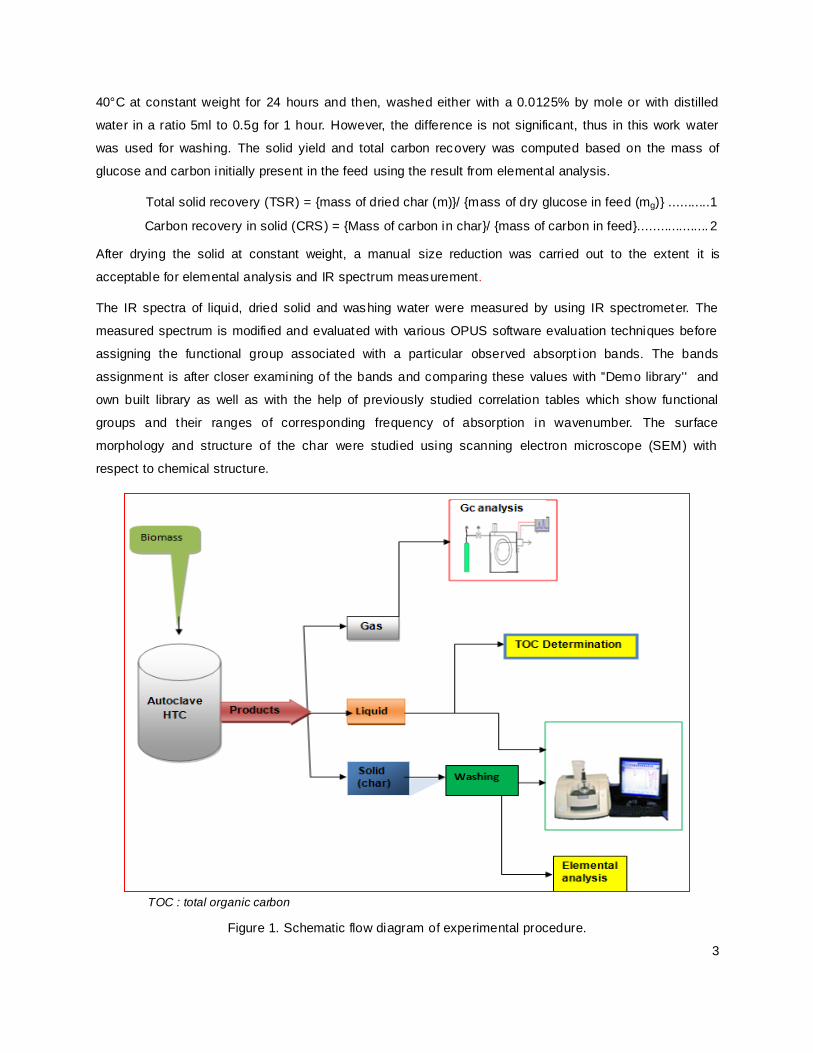
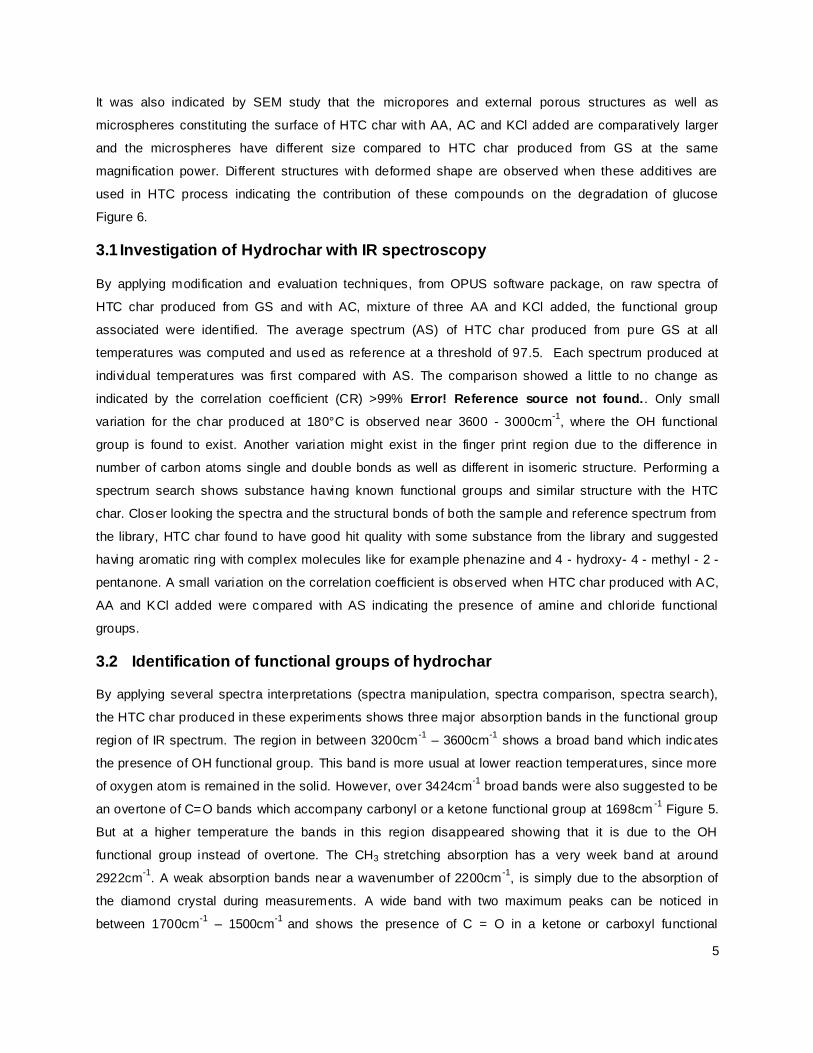
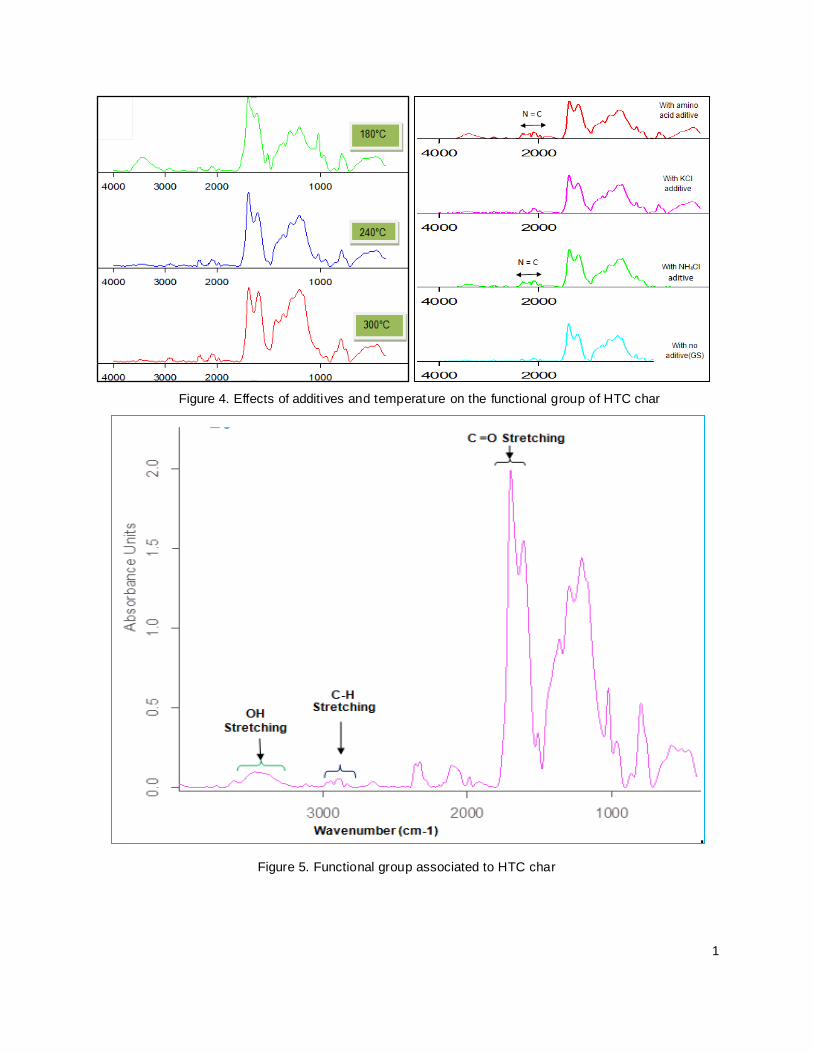
By applying several spectra interpretations (spectra manipulation, spectra comparison, spectra search),
the HTC char produced in these experiments shows three major absorption bands in the functional group
region of IR spectrum. The region in between 3200cm-1
– 3600cm-1
shows a broad band which indicates
the presence of OH functional group. This band is more usual at lower reaction temperatures, since more
of oxygen atom is remained in the solid. However, over 3424cm-1
broad bands were also suggested to be
an overtone of C=O bands which accompany carbonyl or a ketone functional group at 1698cm-1
Figure 5.
But at a higher temperature the bands in this region disappeared showing that it is due to the OH
functional group instead of overtone. The CH3 stretching absorption has a very week band at around
2922cm-1
. A weak absorption bands near a wavenumber of 2200cm-1
, is simply due to the absorption of
the diamond crystal during measurements. A wide band with two maximum peaks can be noticed in
between 1700cm-1
– 1500cm-1
and shows the presence of C = O in a ketone or carboxyl functional

6
groups. Absorption bands below 1600cm-1
to 400cm-1 contains vibration of mixed origin and termed as a
figure print of the molecule; contains many overtone and combination bands that are distinct for individual
compounds. In the infrared spectrum of certain substances, there are weak but characteristic bands that
are known to be due to overtone or combination bands. So, the weak peak band near 2927cm-1
is
probably of the overtone of the peak near 1463cm-1
, which is the asymmetric bending of CH3. In
conclusion, IR spectroscopy study indicates that the char has complex aromatic structure mainly consists
of carbon, thus found to have hydroxyl, carbonyl, carboxyl and aldehyde functional groups. Addition of
nitrogen containing inorganic salts, such as AC, and organic compounds such as AA shows a small wave
near the 2200cm-1
wavenumber region of IR spectra of hydrochar.
3.3 Effects of temperature variation and additives on the IR spectrum of the char
The spectrum variation is also observed for the char which are produced at highly different ranges of
temperatures and the variation helps to estimate the functional groups. As indicated in the wavenumber
range of 3600cm-1
– 3200cm-1
Error! Reference source not found. a broad band caused by the
presence of hydroxyl functional group is observed at lower temperature. Moreover, the double peaks near
1745 – 1545 cm-1
is found to be more intense and become equal as temperature of HTC reaction is
increase indicating the C=O functional groups in this region. Adding nitrogen containing organic and
inorganic compounds on HTC of glucose solution slightly alter the IR spectra of the char produced by
indentifying amine functional groups as illustrated by correlation coefficient Error! Reference source not
found.. The products with AC and AA added indicates a small wave near 2250cm-1
due to asymmetric
stretching of N=C bonds, which is not observed in the case of no additive and KCl additives char spectra.
However the absorption band in this region might be also due to the absorption from the diamond crystal.
Amine functional groups are also fundamentally noticed in the wave number range below 1500cm-1
.
Nevertheless, identifying the exact absorption bands in this region is doubt ful, since it involves several
complex absorption bands.
3.4 Library of spectra
A Library of spectra is a collection of spectra of different known substances involving their chemical
formula, spectra, Lewis structure and physical properties. This library used to relate some of the
properties such as structure, spectra shapes of known substances with unknown substances to identify
what chemical bond and functional group are found within unknown substances. From the measured
spectra of HTC char produced in the experiments above, the spectra of some of the feeds, as well as the
chars from different feedstock, carbonized at different condition, spectra of library called ‘’OPUS HTC
CHAR LIBRARY 2014’’ was generated. The spectrum search is tested from this library for different
products. However, there are still some information which should be added in the library such as
molecular formula, at least one from the possible chemical structure (Lewis structure) and physical
properties if possible and molecular mass.

7
TRS GS*: total solid recovery fro HTC of GS. TSR GS AA*: total solid recovery from HTC of GS with amino acid
added. TSR GSAC *: total solid recovery from HTC of glucose with AC added. TSR GSKCl total solid recovery from
GS with KCl added. CRS* : carbon recovery in soild
Figure 2. Total solid recovery (TSR) and carbon recovery with solid (CRS) from HTC process with and
without organic and inorganic compound added.
Figure 3. Spectrum comparison from library of spectra for identification of functional groups
35
45
55
180 220 260 300
TS
R [
%]
T [°C]
TSR GS * TSR GS AC* added
TSR GS AA* added TSR* GS KCl added
60
75
90
180 220 260 300
CR
S [
%]
T [°C]
CRS* GS CRS AC* added
CRS AA CRS KCl added
1
Figure 4. Effects of additives and temperature on the functional group of HTC char
Figure 5. Functional group associated to HTC char
2
Figure 6. SEM investigation of HTC char produced from glucose solution with and without ammonium
chloride (AC), potassium chloride ( KCl) and amino acids (AA) additives at various magnification power
AC
3
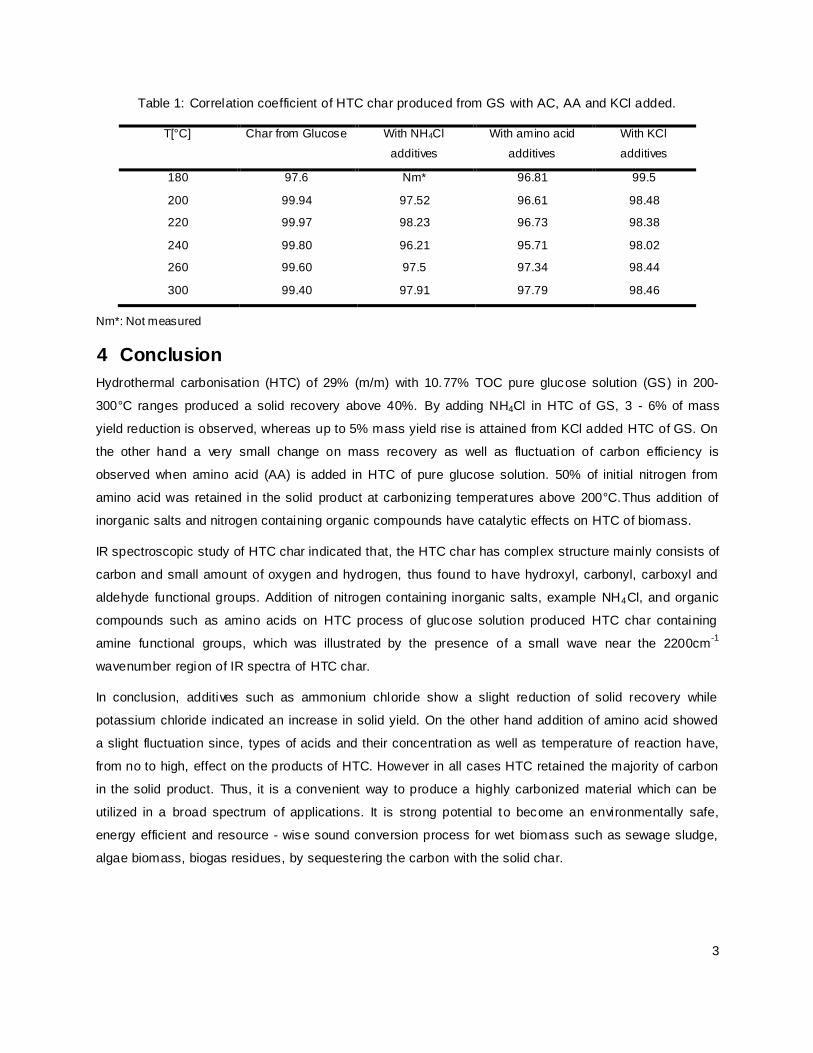
Table 1: Correlation coefficient of HTC char produced from GS with AC, AA and KCl added.
T[°C]
Char from Glucose With NH4Cl
additives
With amino acid
additives
With KCl
additives
180 97.6 Nm* 96.81 99.5
200 99.94 97.52 96.61 98.48
220 99.97 98.23 96.73 98.38
240 99.80 96.21 95.71 98.02
260 99.60 97.5 97.34 98.44
300 99.40 97.91 97.79 98.46
Nm*: Not measured
4 Conclusion
Hydrothermal carbonisation (HTC) of 29% (m/m) with 10.77% TOC pure glucose solution (GS) in 200-
300°C ranges produced a solid recovery above 40%. By adding NH4Cl in HTC of GS, 3 - 6% of mass
yield reduction is observed, whereas up to 5% mass yield rise is attained from KCl added HTC of GS. On
the other hand a very small change on mass recovery as well as fluctuation of carbon efficiency is
observed when amino acid (AA) is added in HTC of pure glucose solution. 50% of initial nitrogen from
amino acid was retained in the solid product at carbonizing temperatures above 200°C.Thus addition of
inorganic salts and nitrogen containing organic compounds have catalytic effects on HTC of biomass.
IR spectroscopic study of HTC char indicated that, the HTC char has complex structure mainly consists of
carbon and small amount of oxygen and hydrogen, thus found to have hydroxyl, carbonyl, carboxyl and
aldehyde functional groups. Addition of nitrogen containing inorganic salts, example NH4Cl, and organic
compounds such as amino acids on HTC process of glucose solution produced HTC char containing
amine functional groups, which was illustrated by the presence of a small wave near the 2200cm-1
wavenumber region of IR spectra of HTC char.
In conclusion, additives such as ammonium chloride show a slight reduction of solid recovery while
potassium chloride indicated an increase in solid yield. On the other hand addition of amino acid showed
a slight fluctuation since, types of acids and their concentration as well as temperature of reaction have,
from no to high, effect on the products of HTC. However in all cases HTC retained the majority of carbon
in the solid product. Thus, it is a convenient way to produce a highly carbonized material which can be
utilized in a broad spectrum of applications. It is strong potential to become an environmentally safe,
energy efficient and resource - wise sound conversion process for wet biomass such as sewage sludge,
algae biomass, biogas residues, by sequestering the carbon with the solid char.
4
5 Reference
[1] H. Ramke, D. Blöhse, H. Lehmann, and J. Fettig, “Hydrothermal Carbonization of Organic Waste,”
12th
International Waste Management and Landfill Symposium Sardinia, 2009.
[2] Dharmaraj C.H, AdishKumar S, Economical hydrogen production by electrolysis using nano pulsed
DC, [email protected], “International Journal of nergy and Environment.”, Volume 3,
Issue 1, 2012
[3] W. . B. Penner, S.S, S.B Albert, V Bendanillo, S.W Benson, “New source of Oil and Gas (Gas from
coal, liquid fuel from coal.”
[4] M. Magdalena Titirici and M. Antonietti, “Chemistery and material options of sustanable carbon
material made by hydrothermal carbonization, 2009.”
''http://pubs.rsc.org/en/content/articlehtml/2010/cs/b819318p''
[5] Subhashree Pradhanp, “Production and characterization of Activated Carbon produced from a
suitable Industrial sludge.” A Report Submitted in Partial Fulfillment of the Requirements for the
Degree of Bachelor of Technology in Chemical Engineering, National Institute of Technology
Rourkela, India, 2011
[6] A. Broch, S. K. Hoekman, and C. R. Desert, “Renewable Solid Fuels via Hydrothermal
Carbonization ( HTC ) of Cellulosic Biomass” , Pacific West Biomass Conference, San Francisco,
CA, January 16-18, 2012.
[7] L. Fiori, D. Bassoa, D. Castelloa, Ma. Baratierib, ''Hydrothermal Carbonization of Biomass: Design
of a Batch Reactor and Preliminary Experimental Results'', ''chemiical Engiineeriing
Transactiions'', The Italian Association of Chemical Engineering, university of trento, Italy, voL. 37,
2014.
[8] J. G. Lynama, Charles J. Coronellaa, Mohammad T. Rezaa, and Victor R. Vasqueza, “Effect of
salt addition on hydrothermal carbonization of lignocellulosic biomass,” Fuel, vol. 99, pp. 271–273,
Sep. 2012.
[9] Nan Jiang, Renliang Hung, Wei Qi, Rongxin Su, Zhimin He, ''Effect of Formic Acid on Conversion
of Fructose to 5 Hydroxymethylfurfural in Aqueous / Butanol Media. BioEnergy Research, June
2012, Volume 5,issue 2, pp 380-386
[10] A. Funke and F. Ziegler, “Hydrothermal carbonization of biomass: A summary and discussion of
chemical mechanisms for process engineering,” Biofuels, Bioprod. Biorefining, vol. 4, no. 2, pp.
160–177, Mar. 2010.
[11] Brucker, Optics, OPUS Basics Parent Directery
''http://files.nocnt.ru/hardware/science/senterra/opus65-doc-en/supplement_6.5.pdf''

5
[12] M. Sevilla and a. B. Fuertes, “The production of carbon materials by hydrothermal carbonization of
cellulose”, Carbon N. Y., vol. 47, no. 9, pp. 2281–2289, Aug. 2009.
[13]. Dipl.-Ing. Ariane Krause, email: [email protected], ''Hydrothermal
carbonization as innovative technology in sustainable sanitation, in Tanzania, Project
”Carbonization as Sanitation” - CaSa, Technical University Berlin / Engineers Without Borders
Berlin/Germany,
[14] European Commission, ''Renewable Energy: Energy for the Future, White Paper Laying Down a
Community Strategy 1997.
(http://europa.eu/documents/comm/white_papers/pdf/com97_599_en.pdf)
[15] In-Hee Hwang, H. Aoyama, T. Matsuto, T. Nakagishi, T. Matsuo, ''Recovery of solid fuel from
municiüpal solid wastes by hadrothermal carbonization treatment using subcritical water'', Waste
Management 32 (2012) 410–416
[16] Joan G. Lynam, Charles J. Coronella, ''Acetic acid and lithium chloride effects on hydrothermal
carbonization of lignocellulose biomass'' 2011
[17] D. Kalders, M.S Kotti, A. Mendez,and G. Gasco, ''Characterization of hydrochars produced by
hydrothermal carbonization of rice husk'', Solid Earth, 5, 477–483, 2014
[18] D. Schneider, M. Escala, K. Supawittayayothin, N. Tippayawong, ''Characterization of biochar from
hydrothermal carbonization of bamboo'', International journal of energy and environment, Volume
2, Issue 4, 2011 pp.647-652
[19] (IJEEFoundation.org, kein Datum, Characterization of biochar from hydrothermal carbonization of
bamboo, International journal of energy and environment.( www. IJEEFoundation.org).)
[20] Günter Gauglitz and Tuan Vo- Dinh: Hand book of spectroscopy, Edited by Günter Gauglitz and
Tuan Vo-Dinh, 2003 WILEY-VCH Verlag GmbH & Co. KGaA, Weinheim ISBN 3-527-29782-0
[21] P. Crews, J. Rodriguez, M. Jaspars, ''Organic structure Analysis'', University of California, Santa
Cruz, New York Oxford,1998
[22] Multivariate Calibration, A practical Guide For The method Development in Analytical Chemistry,
1st
English edition, translated from the 3rd
German edition, 2003 Bruker Optik GmbH
[23] M. Toufiqur Reza. Hydrothermal Carbonization of Lignocellulosic Biomass, University of Nevada,
Reno, 2011

6
[24] A. Broch, U. Jen, S. Kent Hoekman and J. Langford, ''Analysis of Solid and Aqueous Phase
Products from Hydrothermal Carbonization of Whole and Lipid - Extracted Algae'', Desert Research
Institute, 2215 Raggio Parkway, Reno, NV 89512,USA, 2013.
[25] A. Funke and Felix Ziegler, '' Hydrothermal carbonization of biomass: A summary and discussion of
chemical mechanisms for process engineering, Biofuels'', Technical University of Berlin, Germany,
2010
[26] K. ER-KISS, Z. KISS, E. WIEN'ER and G. SZAKALAS, '' Investigation of the change in chemical
composition of the tobacco plant during ripening'', Department of General and Analytical Chemistry,
Technical University, H-1521, Budapest, 1990


