
I - 1
PROGRESS ASSESSMENT OF PMS1967-1987 THE EARLY BIRTH YEARS1987-2007 PREDICTION VS REALITY
2007-2027 THE VISION
SUCCESS IS UP TO YOU
Ronald Hudson and Ralph Haas

I - 2
PRESENTATIONPRESENTATION
Motivation behind the birth of PMS Motivation behind the birth of PMS and key componentsand key components
Project and network levels of PMSProject and network levels of PMS
Key things learned from first 20 years Key things learned from first 20 years of PMSof PMS
Looking ahead in 1987Looking ahead in 1987
PMS development, progress, and PMS development, progress, and issues 1987-2010 issues 1987-2010
PMS now basis for growing AMSPMS now basis for growing AMS
Closing thoughtsClosing thoughts I - 2

I - 3
Pav
emen
t T
hic
knes
sSubgrade Strength
2 KIPS
10 KIPS
18 KIPS
CBR DESIGN CHART
Load
I - 4
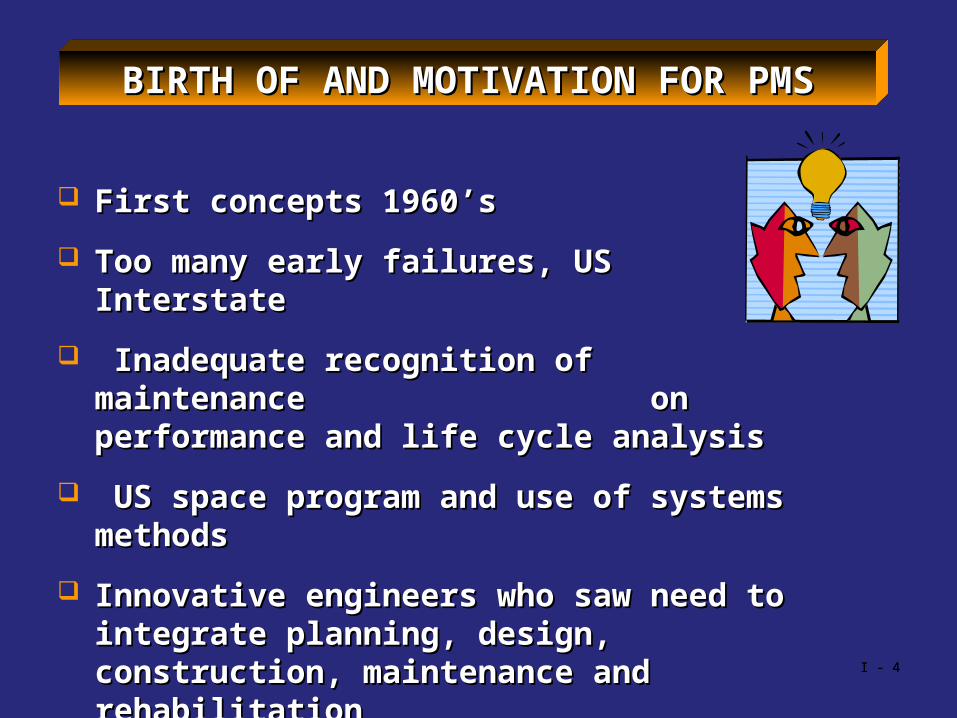
BIRTH OF AND MOTIVATION FOR PMSBIRTH OF AND MOTIVATION FOR PMS
First concepts 1960’sFirst concepts 1960’s
Too many early failures, US InterstateToo many early failures, US Interstate
Inadequate recognition of maintenance Inadequate recognition of maintenance on performance and life cycle analysis on performance and life cycle analysis
US space program and use of systems US space program and use of systems methodsmethods
Innovative engineers who saw need to Innovative engineers who saw need to integrate planning, design, construction, integrate planning, design, construction, maintenance and rehabilitationmaintenance and rehabilitation
I - 4

I - 5
Is a coordinated systematic process for carrying out all activities related to providing pavements
Pavement Management
I - 6
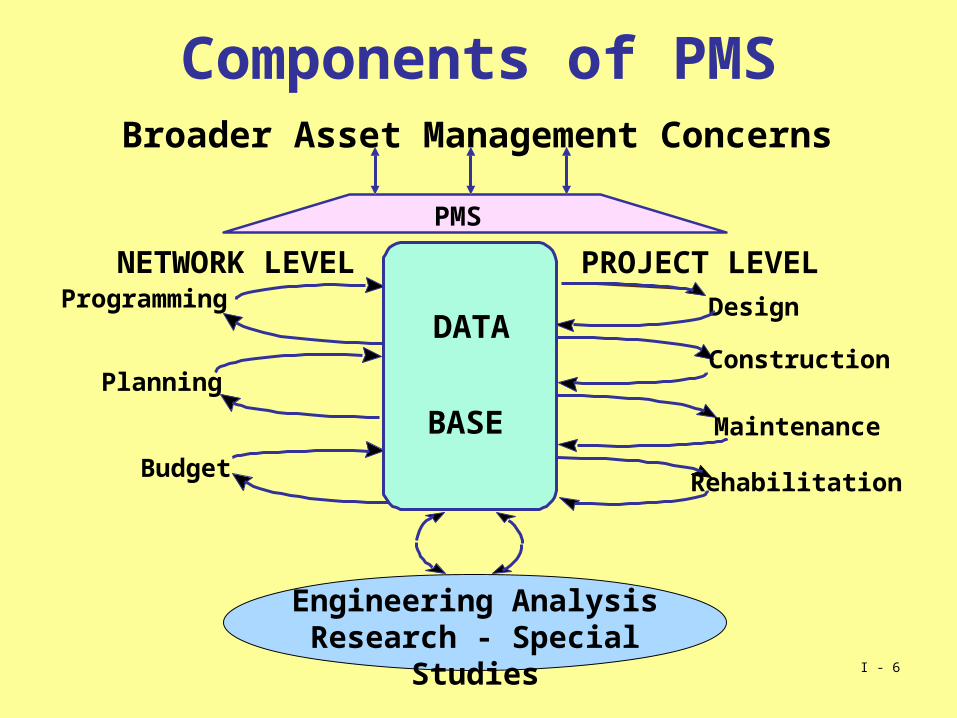
Broader Asset Management Concerns
Engineering AnalysisResearch - Special Studies
PMS
DesignDATA
BASE
NETWORK LEVEL
Rehabilitation
ProgrammingPROJECT LEVEL
Planning
Budget
Construction
Maintenance
Components of PMS
I - 7
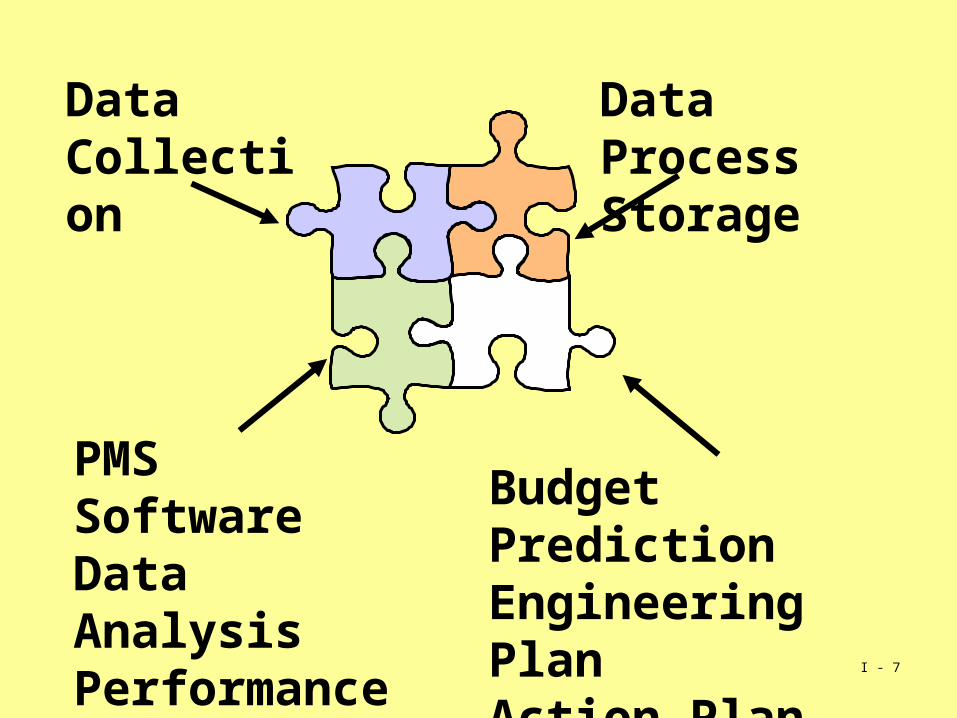
Data Collection
Data ProcessStorage
Budget Prediction Engineering PlanAction Plan
PMS SoftwareData AnalysisPerformance Prediction

I - 8
Performance
Inputs Models Behavior Distress
Friction
Traffic
Costs
Decision Criteria
Ordered Set ofChoices
Implementation
Major Components of a PMS
I - 9
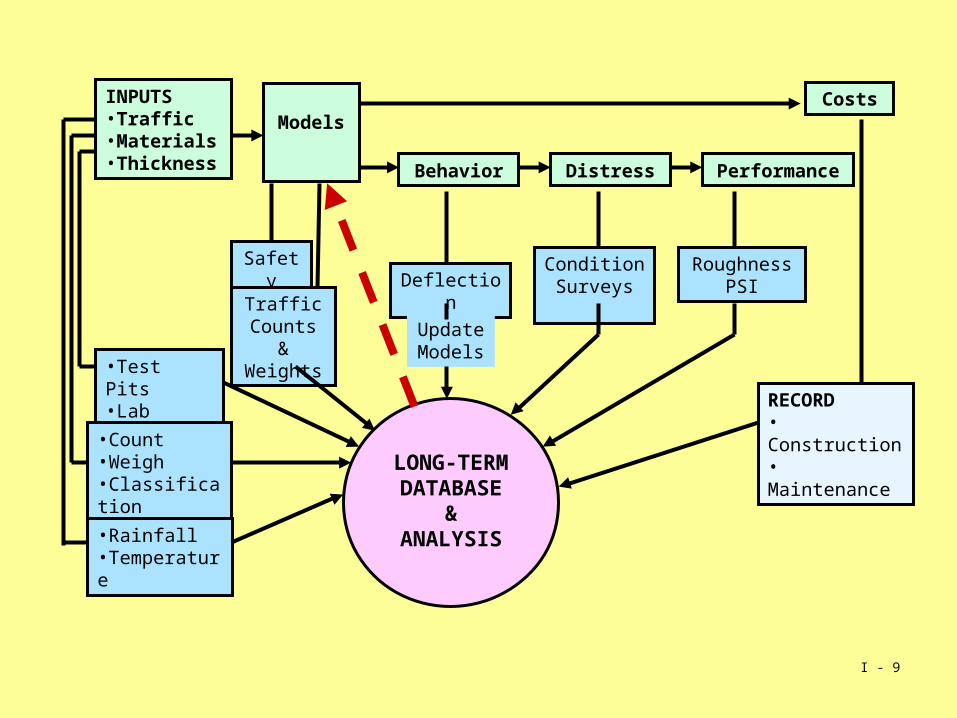
INPUTS• Traffic• Materials• Thickness
Models
Behavior Distress Performance
Costs
Safety
Traffic Counts & Weights
DeflectionCondition Surveys
RoughnessPSI
Update Models
•Test Pits•Lab Tests
•Count•Weigh•Classification
•Rainfall•Temperature
RECORD• Construction• Maintenance
LONG-TERMDATABASE
&ANALYSIS
I - 10
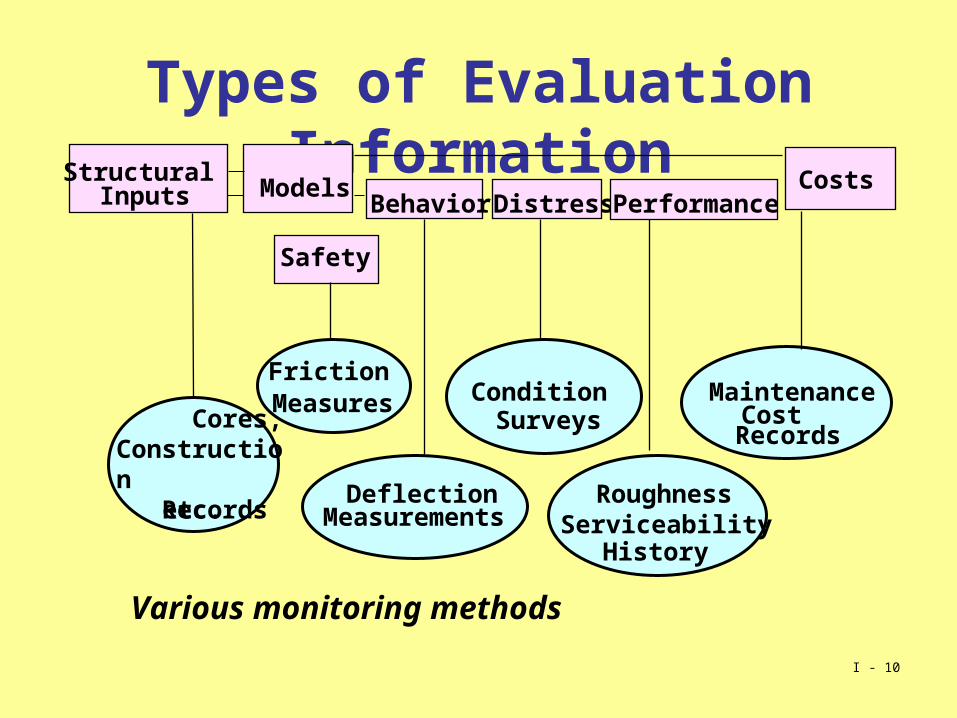
Types of Evaluation InformationStructural
Inputs Models Behavior Distress Performance
Costs
Cores, Construction Records
etc.
Safety
FrictionMeasures
DeflectionMeasurements
Condition Surveys
RoughnessServiceability
History
MaintenanceCost
Records
Various monitoring methods

I - 11
INPUTS MEASURE OUTPUTS
PredictionModels
BEHAVIOR
StressStrain
DEFLECTION
Estimate StructuralStrength
Time/HistoryΣ of Distress
(Predicted and/or Measured)
DISTRESSCracking
DeformationDisintegration
Σ Loads
Calculated Condition IndexPredicted Roughness
Predicted Maintenance
PERFORMANCE(Predicted/MeasuredAnnual RoughnessAnalysis/PredictionHistorical Trends
(Service Level)
Load
Σ LoadHistory
Optimizationand
Decisions

I - 12
SUMMARY: EARLY WORKSHOPS, SUMMARY: EARLY WORKSHOPS, CONFERENCES, BOOKSCONFERENCES, BOOKS
Workshops in Austin, Phoenix Workshops in Austin, Phoenix and Charlotte (1970’s)and Charlotte (1970’s)
““A Management System for A Management System for Highway Pavements” (ARRB Highway Pavements” (ARRB 1970)1970)
First text books (1977 and 1978)First text books (1977 and 1978)
First ICMPA Conferences (1985 First ICMPA Conferences (1985 and 1987)and 1987)
1985 1987
Proceedings ARRB Canberra
1970
I - 12

I - 13
Major Concern – 1987-2007 High-Quality Data Collection ProcessesData Collection Phase Data Collection Element
Prior to start of data collection
• Guidelines, standards, & protocols
• Operator training & accreditation
• Equipment calibration & checks
During data collection • Ambient conditions
• Data collection & field review activities
After completion of data collection
• QC/QA checks
• Time series & data studies
• Formal feedback mechanisms

I - 14
DRIVING FORCES FOR EARLY NETWORKDRIVING FORCES FOR EARLY NETWORKLEVEL PMS (circa 1970’s)LEVEL PMS (circa 1970’s)
Early failure of 1,000’s km of pavementsEarly failure of 1,000’s km of pavements
Primary interest of Chief EngineersPrimary interest of Chief Engineers
AASHTO, FHWA, Can. Austin & other initiativesAASHTO, FHWA, Can. Austin & other initiatives
Workshops and ConferencesWorkshops and Conferences
Where?
The Network

I - 15
Broader Asset Management Concerns
Engineering AnalysisResearch - Special Studies
PMS
DesignDATA
BASE
NETWORK LEVEL
Rehabilitation
ProgrammingPROJECT LEVEL
Planning
Budget
Construction
Maintenance
Components of PMS

I - 16
NETWORK LEVEL
ProgrammingPlanning
Budgeting
DATABASE
ProjectLevel
Engineering Analysis
Size of boxes shows relative useas of 2011.
PMS

I - 17
SOFTWARE REQUIREMENTSSOFTWARE REQUIREMENTSAs seen 1970-1987As seen 1970-1987
1.1. Skills needed Pavement, Software Skills needed Pavement, Software Development, Optimization, Development, Optimization, Database Handler ?Database Handler ?
2.2. In-house development ?In-house development ?
3.3. Use of Outside Professionals ?Use of Outside Professionals ?
4.4. Specialized Software Providers ?Specialized Software Providers ?
I - 17

I - 18
Key Things Learned from 20 Years (1967-1987) of P.M.
• The component activities for P.M. can be described on a generic basis.
• Existing and new technology can be organized within PMS framework.
• PMS framework allows complete flexibility for different models, methods and procedures.
• P.M. operates at two basic levels: network and project.
• Sound technology is critical to PMS process and its effective use.
From P.M. Process Itself
II - 18

I - 19
Key Things Learned from 20 Years (1967-1987) of P.M. (continued)
• Development and implementation of a PMS must be staged.
• Staging promotes understanding and acceptance by various users.
• Options always exist; they should be evaluated on a life-cycle basis.
• We need models for predicting deterioration effect of rehabilitation and maintenance.
• P.M. can make efficient use of available funds but it will not “save” a network if funding is inadequate.
• Good, effective PMS data.
From Using the P.M. Process
II - 19

I - 20
Coordinated direction of resources and labourCoordinated direction of resources and labour
Serving different levels of users in the organizationServing different levels of users in the organization
Effective decision making for network level Effective decision making for network level programs and individual projects based on good programs and individual projects based on good datadata
Making good use of existing and new technologiesMaking good use of existing and new technologies
Having a structure / framework for activities and Having a structure / framework for activities and decisionsdecisions
BASIC REQUIREMENTS FOR AN EFFECTIVE AND COMPREHENSIVE PMS
(Circa ICMPA 1987 “Future Prospects for Pavement Management”)
II - 20

I - 21
PMS Structure for ACTIVITIES AND DECISIONS(Circa ICMPA 1987 “Future Prospects for Pavement Management”
Block Network Level Project Level Sectioning, data
acquisition (roughness, distress, etc.)
Data processing
Data
Min. serviceability, friction, etc.; max. user and maint. costs; max. program costs
Selection criteria
Criteria
Now and future needs, alternatives, econ. eval., priority analysis, etc.
Evaluation of alternative budget scenarios
Analyses
Structural, materials, traffic, climate, costs, etc.
Data analysis
Max. as-built roughness, max. project costs, traffic disruption, etc.
Selection criteria
Within-project alternatives, performance and distress predictions, etc.
Life-cycle economic analysis
II - 21
I - 22
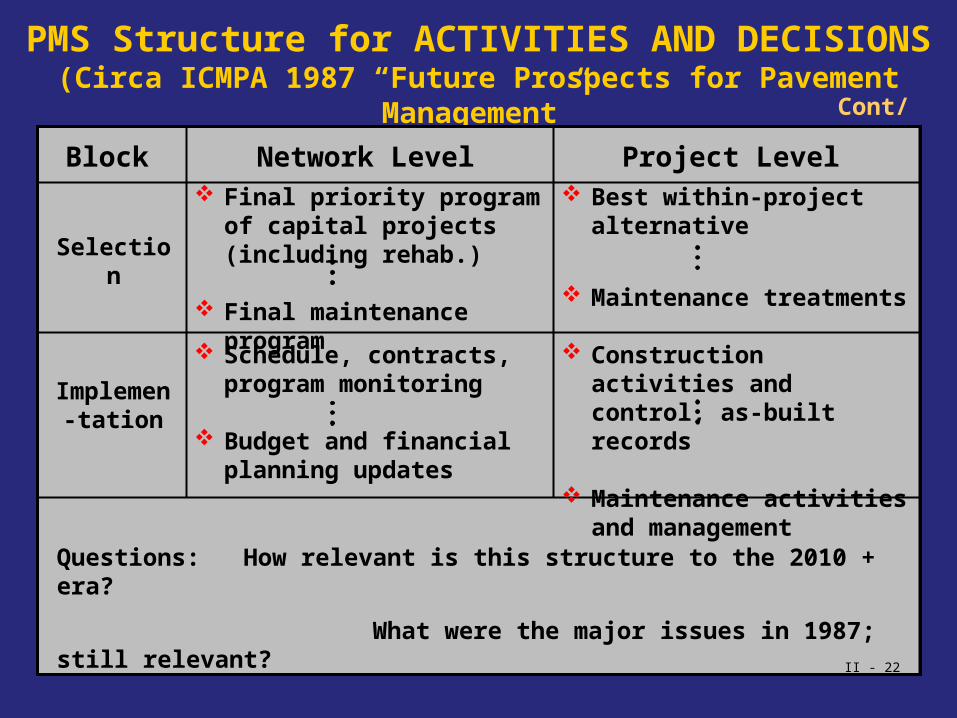
PMS Structure for ACTIVITIES AND DECISIONS(Circa ICMPA 1987 “Future Prospects for Pavement Management”
Cont/d.
Block Network Level Project Level Final priority program of
capital projects (including rehab.)
Final maintenance program
Selection
Schedule, contracts, program monitoring
Budget and financial planning updates
Implemen-tation
Questions: How relevant is this structure to the 2010 + era?
What were the major issues in 1987; still relevant?
Best within-project alternative
Maintenance treatments
Construction activities and control, as-built records
Maintenance activities and management
II - 22
I - 23
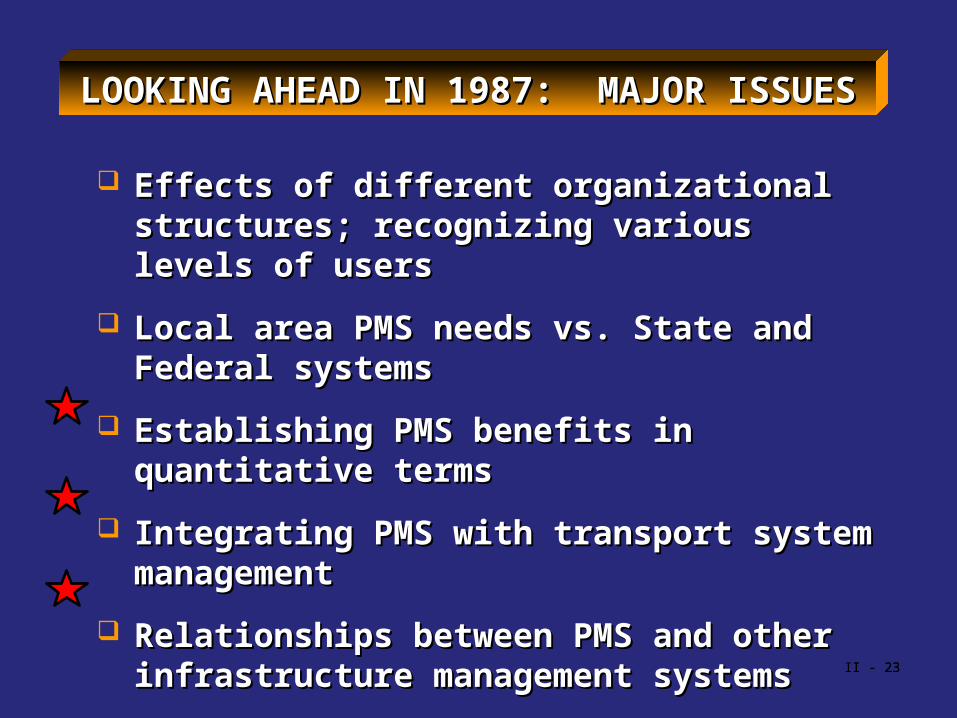
LOOKING AHEAD IN 1987: MAJOR ISSUESLOOKING AHEAD IN 1987: MAJOR ISSUES
Effects of different organizational structures; Effects of different organizational structures; recognizing various levels of usersrecognizing various levels of users
Local area PMS needs vs. State and Federal Local area PMS needs vs. State and Federal systemssystems
Establishing PMS benefits in quantitative Establishing PMS benefits in quantitative termsterms
Integrating PMS with transport system Integrating PMS with transport system managementmanagement
Relationships between PMS and other Relationships between PMS and other infrastructure management systemsinfrastructure management systems
II - 23
I - 24II - 24

I - 25
LOOKING AHEAD IN 1987: OPPORTUNITIESLOOKING AHEAD IN 1987: OPPORTUNITIES
Generic framework for (network and project) PMSGeneric framework for (network and project) PMS
Improved public and senior administrative awareness of PMS Improved public and senior administrative awareness of PMS valuevalue
Better incentive programs: contractors, researchers, etc.Better incentive programs: contractors, researchers, etc.
Identification of high payoff areas for technology Identification of high payoff areas for technology advancementsadvancements
Programs for improved technical capabilities: contractors, Programs for improved technical capabilities: contractors, practitioners, etc.practitioners, etc.
Better consistency between sophisticated analysis and basic Better consistency between sophisticated analysis and basic materials, traffic, environmental and other inputsmaterials, traffic, environmental and other inputs
Substantial funded program (similar to AASHTO Design Substantial funded program (similar to AASHTO Design Guide) to develop next major level of PMS Guide) to develop next major level of PMS II - 25

I - 26II - 26
I - 27
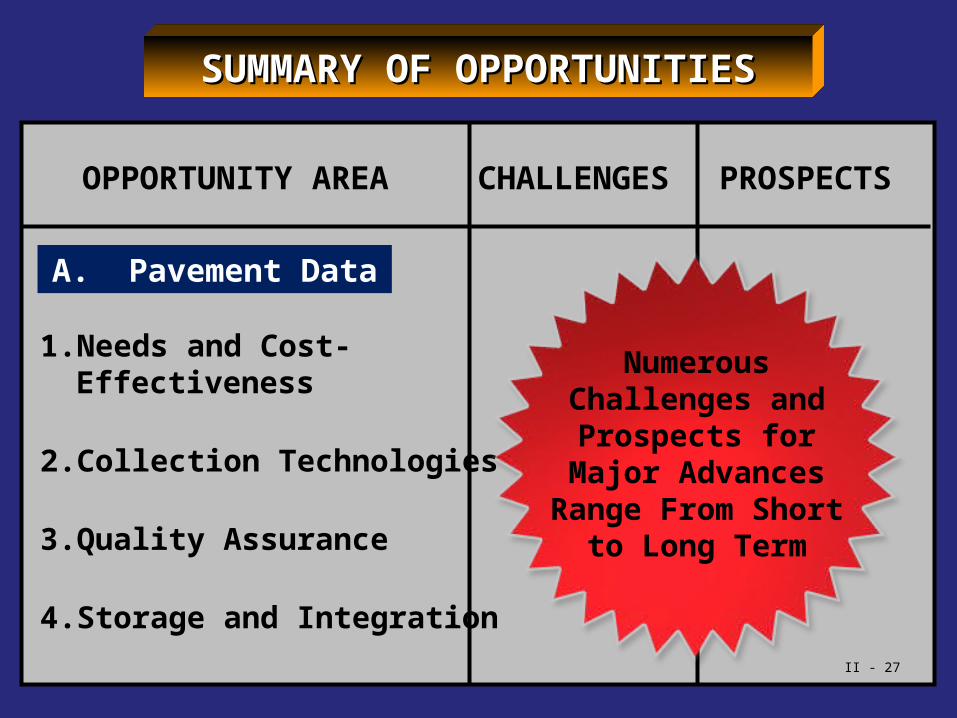
OPPORTUNITY AREA
1.Needs and Cost-Effectiveness
2.Collection Technologies
3.Quality Assurance
4.Storage and Integration
CHALLENGES PROSPECTS
A. Pavement Data
Numerous Challenges and Prospects for
Major Advances Range From
Short to Long Term
SUMMARY OF OPPORTUNITIESSUMMARY OF OPPORTUNITIES
II - 27

I - 28
OPPORTUNITY AREA
1.Structural Design and LCCA
2.Performance Modelling
3.Treatment Selection
4.Quantifying Benefits
5.Decision Support
CHALLENGES PROSPECTS
B. Pavement Management
Numerous Challenges and Prospects for
Major Advances Range From
Short to Long Term
SUMMARY OF OPPORTUNITIESSUMMARY OF OPPORTUNITIES
II - 28
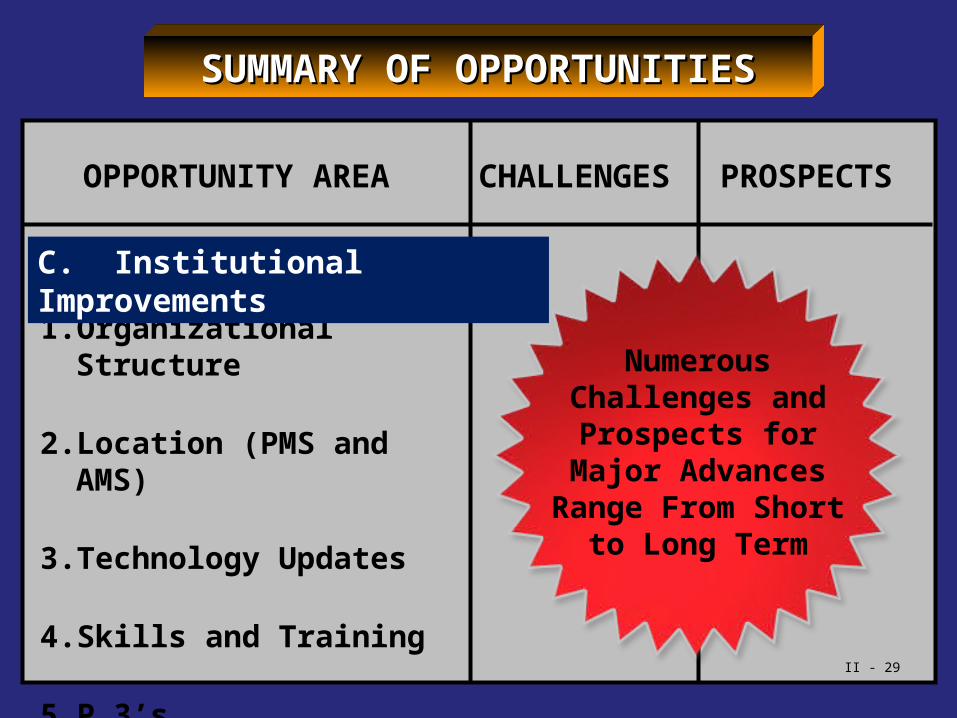
I - 29
OPPORTUNITY AREA
1.Organizational Structure
2.Location (PMS and AMS)
3.Technology Updates
4.Skills and Training
5.P 3’s
CHALLENGES PROSPECTS
C. Institutional Improvements
Numerous Challenges and Prospects for
Major Advances Range From
Short to Long Term
SUMMARY OF OPPORTUNITIESSUMMARY OF OPPORTUNITIES
II - 29
III - 30
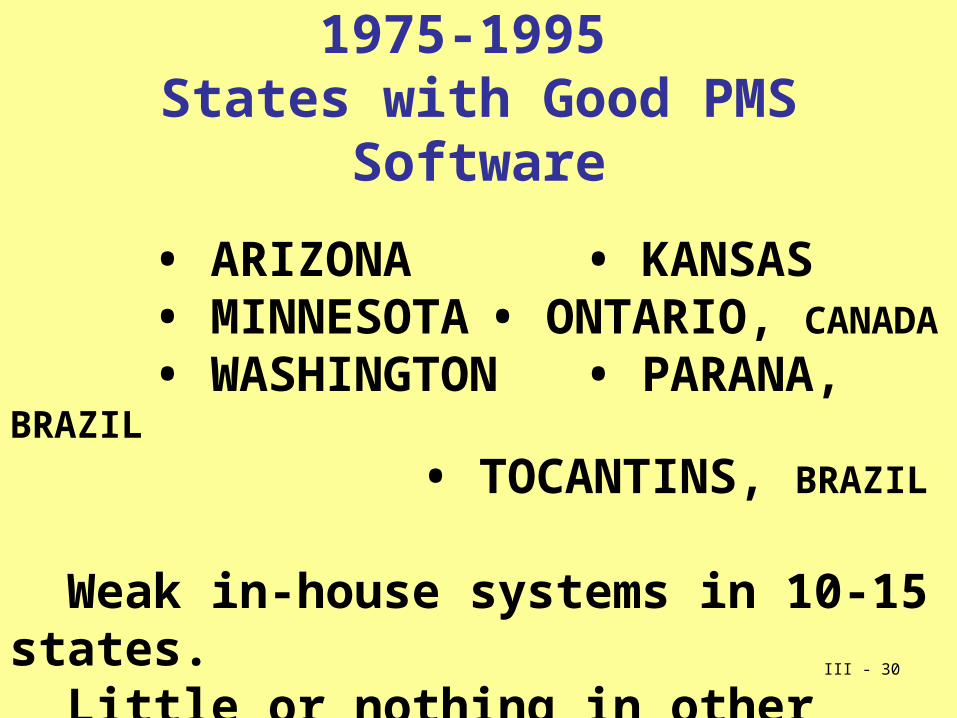
1975-1995 States with Good PMS Software
• ARIZONA • KANSAS • MINNESOTA • ONTARIO, CANADA
• WASHINGTON • PARANA, BRAZIL
• TOCANTINS, BRAZIL
Weak in-house systems in 10-15 states. Little or nothing in other states.

III - 31
Where Were We in 2000?North America has invested
US $2.3 trillion in highwaysSouth American has invested
US $1.6 trillion +/- in Highways
The World has invested US $10 trillion +

III - 32

III - 33
What Are The Issues, 2000-Now?
• Pavement Preservation– “Throughout the world, there has been a
shift from constructing new highways to preserving, maintaining, and maximizing the operation of what we have” [Madeleine Bloom, FHWA]
– “The right treatment on the right pavement at the right time” [Foundation for Pavement Preservation]
• More reasons that good “design” is not enough
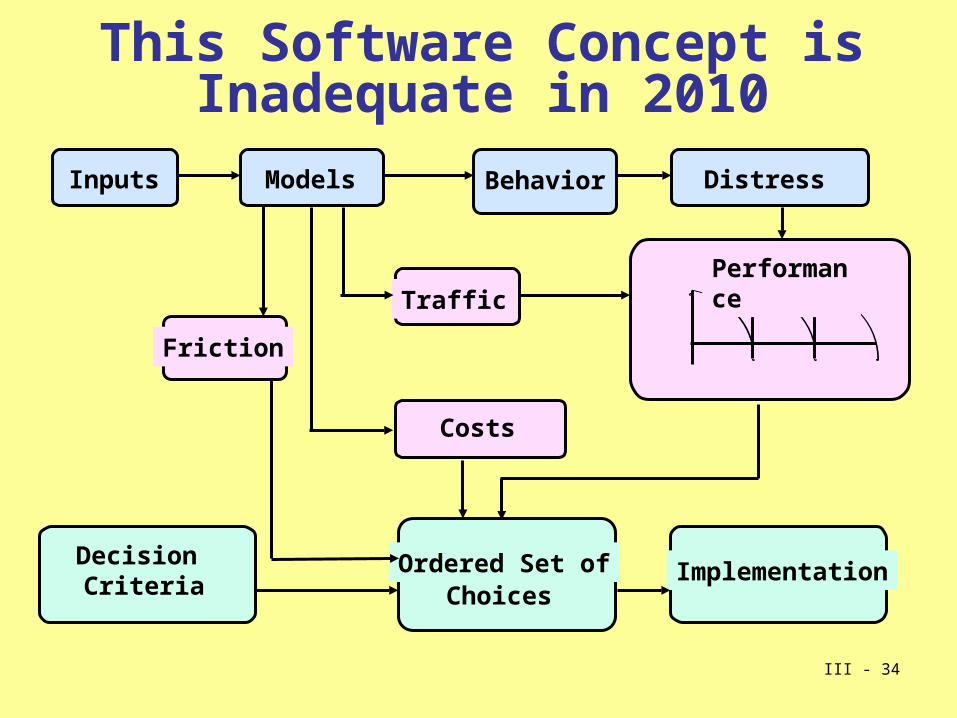
III - 34
Inputs Models Behavior Distress
Friction
Traffic
Costs
Decision Criteria
Ordered Set ofChoices
Implementation
This Software Concept is Inadequate in 2010
Performance
III - 35
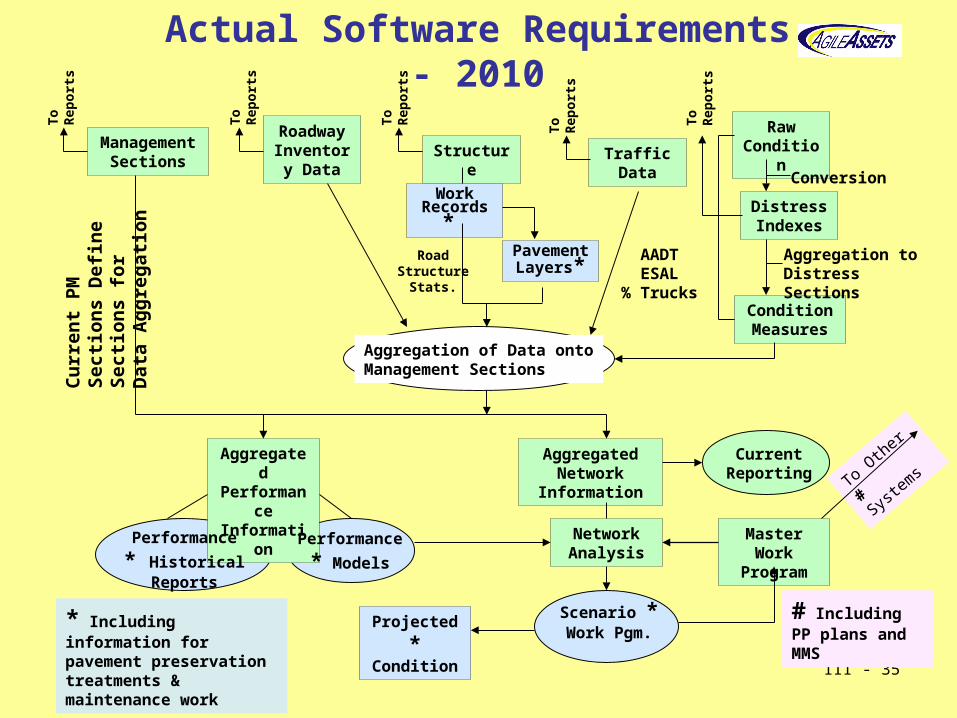
Aggregation of Data ontoManagement Sections
Current Reporting
Projected * Condition
Management Sections
Roadway Inventory
DataStructure Traffic
Data
Raw Condition
Distress Indexes
Condition Measures
Work Records*
Pavement Layers*
Conversion
Aggregation to Distress Sections
To
Rep
orts
To
Rep
orts
To
Rep
orts
To
Rep
orts
To
Rep
orts
AADTESAL
% Trucks
RoadStructure
Stats.
Aggregated Network
Information
Cu
rren
t P
M S
ecti
ons
Def
ine
Sec
tion
s fo
rD
ata
Agg
rega
tion
Aggregated Performance Information
Performance * Historical Reports
Performance * Models
Scenario * Work Pgm.
Network Analysis
Master Work Program
To Other
#
Systems
* Including information for pavement preservation treatments & maintenance work
# Including PP plans and MMS
Actual Software Requirements - 2010

III - 36
Optimization Analysis 2010
Condition Data
Condition Indexes
Predicted Condition
Decision Trees
Strategy Generation Engine
Section Strategies
Integer Solver
Multi-Constraint
Analysis
Multi-Year Analysis
Output Projected Conditions & Budgets
Models
Other Pavement Data
Work Plan

III - 37
Which Do You Use?
• Computer Operating System– Develop in-house or use Microsoft
• Database– In-house? or ORACLE/PeopleSoft
• Computer Map– In-house? or Google Earth
• Internet– In-house? or Commercial

III - 38
Good Commercial PMS Software is Available – 2000 to date
1. About 20 US States now use commercial
2. 50-60% of Agencies still use in-house PMS.
3. In-house delays development – inadequate, incomplete, slow Wastes $2-10 million per year of delay

III - 39
DOT Asset Management
90% of Assets and Budgets
PMSPavements
BMSBridges
MMSMaintenance
Other Buildings, Safety, etc.
10%

III - 40
Data Collection
Data ProcessStorage
Budget Prediction Engineering PlanAction Plan
PMS SoftwareData AnalysisPerformance Prediction

III - 41
Asset Management Modular Framework
BridgeManager
External Dataand Models
ExternalSystems(e.g., SAP. Advantage, PeopleSoft, etc)
Core AA Functions
Asset InventoryBase Linear ReferenceSecurityUser OrganizationTerminology
Common Data Model Data ManagementReportingGraphingCommunicationsSystem Utilities
GIS
ExecutiveDecisions
NetworkManager
PavementManager
MaintenanceManager
Safety Manager
(Fleet,Equipment,Materials,
Labor)
Mobile Apps
Zero-Footprint, Web-based System All Transportation Assets Agency-specific models
Integrated Asset & Maintenance Management
Input to Administrators
Integrated GIS Mapping Capabilities
Secure and scalable to thousands of users
Easy-to-use with Sophisticated Analysis
Powerful reporting tools
User Friendly

III - 42
– Processes are identified by Functional Area
• Resource Management (RM)– Labor Management– Equipment Management– Materials Management
• Linear Referencing Processes (LR)– LRS Management
• Asset Inventory Processes (AI)– Asset Acquisition– Asset Condition Assessment– Linear Construction History– Linear Attribute Data Management
• Planning Processes (PL)– Model Management– Analysis and Optimization– Planning
• Operations Management (OP)– Projects / Contracts / Repair Orders– Work Order Creation and Scheduling– Resource Usage and Accomplishment
Recording• Organizational Structure (OS)
– System– Security– Reporting
AgileAssets Core
OPOperations
Management
PLPlanning
Processes
AIAsset
Inventory Processes
RMResource
Management
LRLinear
ReferencingProcesses
OSOrg. Structure
System
Security
Reporting
Functional Areas

III - 43
Tradeoff =Utilit
y Combinations of
individual Performance
Measures
Driver Information
Roll Over Prevention
Skidding and Hydroplaning
No of lanes
LitterGrass Height
Pvt RuttingPvt Skid Resistance
Sign Visibility
Guardrail Condition
Low Shoulder
Sign Damage
Pvt Roughness
Pvt Macro-texture
Pvt Micro-texture
Pvt Cracking
Bridge Structural
Soundness
Road Sub-Network Utility
Safety Congestion Comfort Aesthetics
Tradeoff Objectives - 2010

III - 44
The Start of Asset Management in 5-7 States – 2008+
III - 44

III - 45
Where Are We in 2011?
1. 20± agencies use complete detailed PMS
2. Many others worldwide still need to upgrade their PMS
3. Data collection is adequate will continue to improve

III - 46
Where Are We in 2011? (cont.)
4. Maintenance and preservation still need models and add to PMS
5. PMS is acting as an anchor to develop full asset management 5+ state
6. Large Funding like SHRP and MEPDG is needed for large rapid improvement.
IV - 47
Initially, Management Systems Resisted by Engineers
• 1967 – Engineering Review Team vetoed PMS Concept
• 1980’s – Bridge designers would not use BMS concepts.
“Design covers all we need” Use safety factor of 2.0+
• 2000-2010 – (Still resist)– US has spent $15 million developing a mechanistic “design system” that requires 300 variables.

IV - 48
• All 3 groups ignore future variability in predicted traffic, environment, material properties.
• There has been little or no research on benefits of maintenance and preservation.
• More administrators, budget makers, planners, maintenance staff now support and demand PMS/BMS/MMS.
Initially, Management Systems Resisted by Engineers (cont.)

IV - 49
Historical and Current Limitations
1. Lack of Standard Nomenclature
2. Prioritize not True Optimization
3. Many use worst first funding
4. User Costs – Not used
5. Life-Cycle Cost – Partial use

IV - 50
Frontier – Leading Edge
• True optimization
• 10-15-20 year planning Horizon Tools
• Corridor Analysis PMS, BMS, SMS, etc.
• Active Asset Management – demonstrate to Admin. and Top Staff – true interaction
• Benefits, not loss of Authority for them
– Examples: North Carolina, Idaho, Virginia

IV - 51
Agency Needs• Good linear reference system• Proven software• Totally flexible segmentation• Full live-cycle analysis with user costs• Consistent accurate data• Web-based• Server-based – not central• Interface with maintenance management• Corridor analysis• Handles lane additions• Determine monitory benefits• Automatic annual asset valuation• Add other management systems, bridges, safety, etc.

IV - 52
What does the Future Hold?• Convince more administrators to use what is
already available.• Corridor analysis – optimum funding for
– Pavement – Bridges– Added Lane Capacity – Level of Service– Funds allotted among needs
• Long-term (20 years) optimization – Life-cycle analysis – Multi objectives – Use annual predictions – extend 20 years.
• Cities – Integrate PMS with utility plans, maintenance, etc.
IV - 53
Potential Topics for “Focused Conferences”
1. Practical interface of PMS with Asset Management.
2. How do we reach and educate administrators and show benefits of PMS (still a vital topic).
3. Calculate and demonstrate benefits of PMS in monetary terms.
4. Difference between network & project level PMS data.
IV - 54IV - 54
5. Examine the guts of the “black boxes” provided by PMS software vendors – case studies.
6. Educate a new generation of PMS managers.7. Factors now ignored in PMS, 1 or 2 at a
time, such as noise, societal effects, environmental effects, “green” pavements, asset valuation, and risk analysis
8. You (THE ATTENDEES) can add others with some creative thought.
Potential Topics for “Focused Conferences” (Cont.)

IV - 55
CLOSING THOUGHTSCLOSING THOUGHTS
Pavement management includes but is Pavement management includes but is not controlled by designnot controlled by design
Mechanistic methods alone will not solve Mechanistic methods alone will not solve the “pavement problem”the “pavement problem”
LTPP core concept not yet realizedLTPP core concept not yet realized
PMS needs a team approach of PMS needs a team approach of engineers, statisticians, programmers, engineers, statisticians, programmers, etc.etc.

IV - 56
CLOSING THOUGHTS (Cont.)CLOSING THOUGHTS (Cont.)
There are no perfect solutions for There are no perfect solutions for pavement; they have to be managedpavement; they have to be managed
PMS do not replace good design; rather, PMS do not replace good design; rather, actual variability must be balanced actual variability must be balanced among design, construction, among design, construction, maintenance, preservation and maintenance, preservation and rehabilitationrehabilitation
Good commercial PMS software is now Good commercial PMS software is now available – use it.available – use it.

II - 57
THANKS TO ICMPA8 AND THE INTERNATIONAL PAVEMENT COMMUNITY
IV - 57


