1
Carilion Clinic’s Journey with Population Health Management
and Health ITApril 16, 2014
Stephen A. Morgan, M.D.
Chief Medical Information Officer
Senior Vice President
Carilion Clinic

22
Greetings from Western Virginia

3

44
Carilion Clinic continues to be the premier healthcare delivery system in western Virginia
• Accountable medical group with approximately• 600 physicians, • 150 advanced care practitioners • 300 affiliated physicians.
• 850,000 primary care visits and 50,000 urgent care visits
• Full or partial interests in eight hospitals
• Full range of services and an active GME program
• 56 percent inpatient market share in total service area• More than twice that of nearest competitor (HCA)
• Health plan • Medicaid HMO
• The Market • 85% FFS• Dominant payor with 70% market share

5
Carilion Clinic
• Mission: Improve the Health of the Communities We Serve
• Vision 2017: We are committed to a Common Purpose of Better Patient Care, Better Community Health and Lower Cost
6
Building Blocks of our Success
• Physician leadership
• Technology• EHR – Epic • Data Analytics – Premier , IBM , Verisk
• Patient Engagement
• Partnerships• Payers – Aetna • Service Providers
• Provider Engagement

77
What Drove Us To Transform?
• Rising health care costs• External pressures – ACA, payment change• Unstable economy• Changes in consumer demand• Advances in technology • Generational differences in physician work/life
balance• Working “to license” – team based • Workforce shortages

8
Why Population Health?

9
Our National SpendAverage Healthcare Spending per Capita,1980–2009
Adjusted for differences in cost of living
Source: OECD Health Data 2011 (June 2011).
Dollars
THECOMMONWEALTH
FUND

10
•Life expectancy improved by 3 years•Years with disability increased •US fell from 14th to 26th compared to other nations. •Leading cause for premature deaths include
•CVD•Lung Cancer•CVA
•Leading cause of Disabilities •Back Pain •Musculoskeletal issues •Depression / Anxiety
Value?

11
Demographic Trends
• 1/3 US population – Baby Boomers• 10,000 people a day reach 65• 1 in 10 Baby Boomers is managing multiple
chronic illnesses; by 2030:• 1 in 4 have diabetes• 1 in 2 have arthritis• 1 in 2.5 will be obese
• Treatment of patients with co-morbities cost 7 x those without chronic illness
• 2/3 Medicare spending - 5 or more chronic conditions

12
Majority of Cost is from Chronic Conditions

1313
Challenges with Today’s Care
• Healthcare costs growing; burden to business
• Overuse; volume “treadmill”
• Inconsistent care; fragmentation
• Lack of coordination
• Payment model at odds with countering rising costs
• Data issues

1414
The Response Payment Reform
• To optimize the healthcare dollar and improve health
outcomes, both government and private payers are
(gradually) shifting from volume-based reimbursement to
value-based reimbursement• Fee For Service
• Shared Savings
• Global Risk
• P4P• Value Base Purchasing• Readmission Penalties• Bundled Payments• MSSP• ACO Arrangements

1515
Population Health 101
• In order to move from volume to value, and accept more risk, you must understand the patient population. • Define – Who am I responsible for? • Measure – standard metrics • Analyze – understand risk • Improve – what interventions • Control – Create accountability

1616
Key Considerations
• Able to manage risk
• Integration
• Engaged physician leadership
• Culture shift
• Effective HIT and data management
• Time to change – pace

17

1818
Our Strategic PathSince becoming a Clinic- 2006
• Developed a multi-specialty medical group• Physician leadership• Substantial quality, safety, and process improvements• Implemented EPIC enterprise-wide• Constructed Riverside campus• Opened a medical school in partnership with VT• Implemented medical homes in all primary care sites• Created MajestaCare, partnered with Aetna for
accountable care, MSSP (risk arrangements)• Built a culture of collaboration and team work

1919
Our Initial Areas of Focus
• Population Health• PCMH
• Care coordination for high-risk and high-frequency patients
• Wellness, prevention, Choosing Wisely• Transformation work
• Payment reform• Provider Engagement • Health IT / Data

20
PHM INITIATIVES

21
Carilion Clinic: PCMH TodayTotal Program Sites: 35
• Family Medicine - 29
• Internal Medicine - 4
• Pediatrics - 2
Recognition Status
• Level 3 Recognition – 27
Panel Size: 200,000
• 77% of Department Patients
Providers: 136
• Physicians - 106
• ACPs - 30
Care Coordinators
• Budgeted Positions: 22 FTEs

22
System PHM Initiatives
• Transformation Oversight Committee• Oversees work of committees in 3 areas:
• Care Integration• Informatics• Finances/Contracting
• Initial focus on COPD
• Led by Chief Strategy Officer

2323
What is PHM and It’s Purpose?• Definition: The coordination of care delivery across a population
to improve outcomes through disease management, care management, and demand management
• Goal: To improve outcomes and reduce utilization for patient populations with clinical and financial risk
• ‘Populations’ are identified through community need assessments, clinical risk registries

2424
System PHM Initiatives
24
Program Focus Areas Patient Risk Levels
Area 2: High Utilization Management
Area 1: Disease-Focused Ambulatory Case Management
Area 3: Ambulatory Quality / Pay for Performance (P4P)
Behavioral Health / Psycho-social
Sickest and/or highest-utilizing 5-10%
Rising-risk 40-50%
Low risk 45-55%
Advanced CHF, COPD, IHD, DM, asthma, cancer, psychosocial problems
Patients with less severe chronic illnesses or behaviors that significant elevate morbidity or mortality risks; HTN, DM, hyperlipidemia, tobacco use, obesity
Patients without medical problems; focus on prevention, wellness, and connectivity to health system
Patient engagement, Extensivists, palliative care, transitions of care protocols
Patient engagement, care coordination, Extensivists, transitions of care protocols
Cancer screening, BP, lipid, A1c, etc.; various patient engagement and contact components

25
System PHM InitiativesProgram Infrastructure Areas 1 and 2: Disease-Focused
Ambulatory Case Management
and High Utilization Management
Area 3: Ambulatory Quality / Pay
for Performance (P4P)
INFORMATION & GUIDES Data Analytics and Reporting Clinical Protocols and Pathways CULTURE CHANGE & ENGAGEMENT Patient Education and Engagement Organizational Change Management (Provider
and Staff Training and Engagement)
TOOLS & RESOURCES Point-of-Care Decision Support Centralized Patient Outreach EHR Care Plans Extensivist Team Palliative Care and Hospice Home Health

26
PAYMENT REFORM

2727
Accountable Care Activities • Payor Arrangements
• Managed Medicare and Medicaid• Owned – Medicaid HMO
• MajestaCare
• Contracted MAP• Humana, UHC
• Aetna ACO (Whole Health)• Doctors Connected
• ACO• MSSP
• Commercial• Anthem
• Enhanced Personal Health Care Initiative

28
PROVIDER ENGAGEMENT
29
Physician Compensation
• Moving from Volume to Value
• Major Components:• Personal RVUs (~ 85%)• ACP oversight (RVUs) (~ 5%)• Performance metrics (~ 10%)
• Panel size• Quality metrics• Expense management

3030
Care Integration
• Sub-Group of Transformation Oversight • Oversight of integrated projects
• Representatives from all departments • Education for first year
• Payment reform • Understanding our data / opportunities
• Process improvement • Transitions of care
• Employed providers

3131
Working with Community Providers
• Education
• Involvement of medical directors with LOS committee
• Data sharing and transparency
• Involvement in decision making
• EMR
• Joint leadership and affiliation

32
HEALTHCARE IT AND ACCOUNTABLE CARE

3333
“Health IT is essential not only to accountable care organizations (ACO) but also healthcare in general”
Kathleen Sebelius, MPA,
Secretary of the U.S. Department of Health & Human Services

3434
Population Health Management
• Fundamental to every major healthcare reform initiative today• Patient-Centered Medical Home
• Accountable Care Organization
• EHRs alone are not sufficient to manage populations effectively
• Provider groups and health systems that automate the spectrum of population health functions will be best positioned to succeed

35
Transitions of Care-Patient Engagement
Data
Claims Data
HIE
Visibility
Attributed Population
• Gaps in Care• Risk Stratification• Predictive Models• QM & Outcomes

3636
Healthcare IT and ACOsThe Critical List
• Population identification - attribution• Identification of care gaps – Decision Support • Risk Stratification• Cross Continuum Care management • Quality and Outcomes measurement• Patient engagement• Telemedicine • Mixing claims and clinical data • Predictive modeling • Clinical information exchange

37
PATIENT ENGAGEMENT

38

39
Bridging the gap between home, hospital , office and beyond…
Telemedicine
40
CARE COORDINATION

41
Chronic Disease Registries
4242
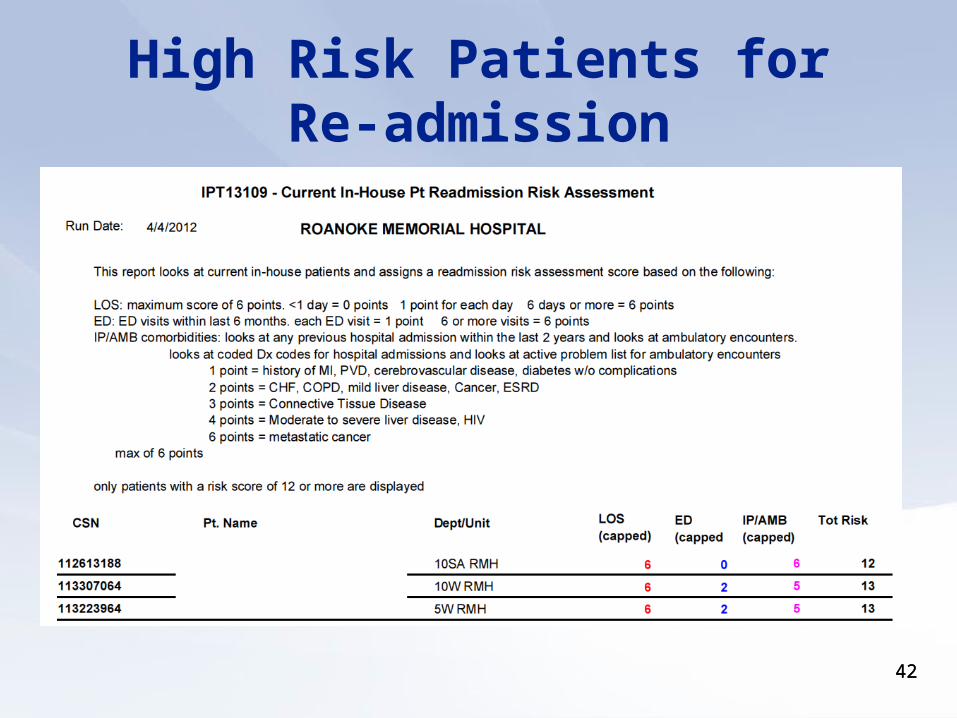
High Risk Patients for Re-admission
4343
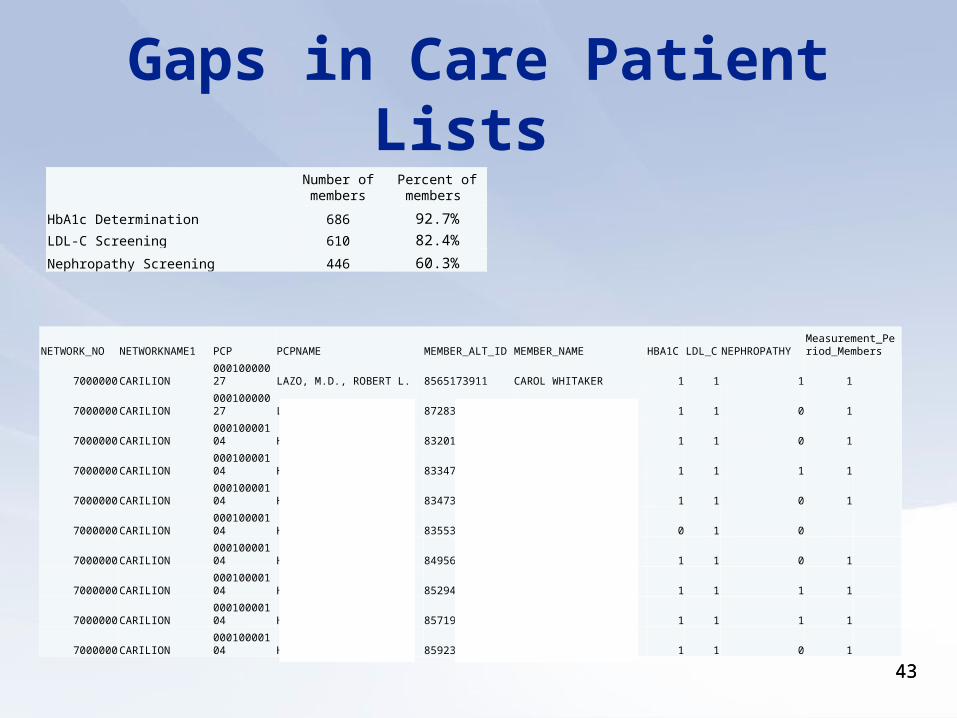
Gaps in Care Patient Lists
Number of members
Percent of members
HbA1c Determination 686 92.7%
LDL-C Screening 610 82.4%
Nephropathy Screening 446 60.3%
NETWORK_NO NETWORKNAME1 PCP PCPNAMEMEMBER_ALT_ID MEMBER_NAME HBA1C LDL_C NEPHROPATHY
Measurement_Period_Members
7000000 CARILION00010000027 LAZO, M.D., ROBERT L. 8565173911 CAROL WHITAKER 1 1 1 1
7000000 CARILION00010000027 LAZO, M.D., ROBERT L. 8728319211 NANCY STAMPER 1 1 0 1
7000000 CARILION00010000104 HORNEY, M.D., WAYNE D. 8320176601 DEXTER SLUSHER 1 1 0 1
7000000 CARILION00010000104 HORNEY, M.D., WAYNE D. 8334701741 HAWTHORNE STUART 1 1 1 1
7000000 CARILION00010000104 HORNEY, M.D., WAYNE D. 8347362421 INA MARTIN 1 1 0 1
7000000 CARILION00010000104 HORNEY, M.D., WAYNE D. 8355332541 DOROTHY BOLT 0 1 0
7000000 CARILION00010000104 HORNEY, M.D., WAYNE D. 8495612601 SIDNEY WEBB 1 1 0 1
7000000 CARILION00010000104 HORNEY, M.D., WAYNE D. 8529433351 SHIRLEY CONNER 1 1 1 1
7000000 CARILION00010000104 HORNEY, M.D., WAYNE D. 8571966511 CURTIS TURNER 1 1 1 1
7000000 CARILION00010000104 HORNEY, M.D., WAYNE D. 8592308431 CURTIS TURNER 1 1 0 1

4444
Care Plans Across the Continuum
• Developed a disease management section in the EMR navigator
• High risk patients flagged
• Using problem lists and linked episodes
• Viewed by IP, AMB, and ED.

45
TRANSPARENT DATA DELIVERY TO PROVIDERS

4747

48

49

505050

51
Primary Care Group Dashboard

52
PAYOR DATA
5353
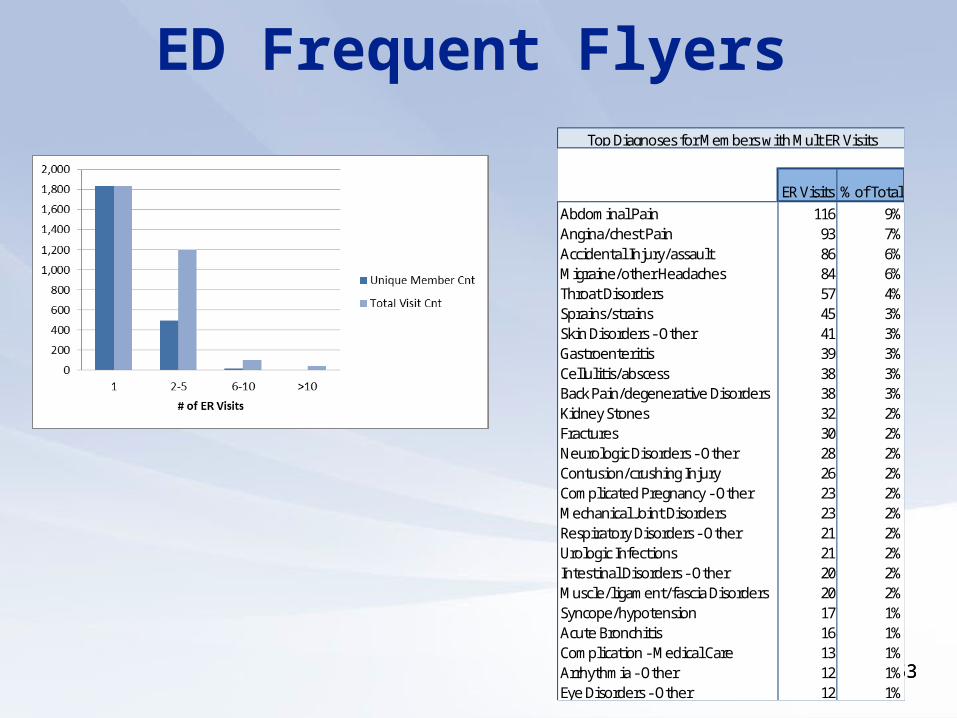
ED Frequent Flyers
ER Visits % of TotalAbdominal Pain 116 9%Angina/chest Pain 93 7%Accidental Injury/assault 86 6%Migraine/other Headaches 84 6%Throat Disorders 57 4%Sprains/strains 45 3%Skin Disorders - Other 41 3%Gastroenteritis 39 3%Cellulitis/abscess 38 3%Back Pain/degenerative Disorders 38 3%Kidney Stones 32 2%Fractures 30 2%Neurologic Disorders - Other 28 2%Contusion/crushing Injury 26 2%Complicated Pregnancy - Other 23 2%Mechanical Joint Disorders 23 2%Respiratory Disorders - Other 21 2%Urologic Infections 21 2%Intestinal Disorders - Other 20 2%Muscle/ligament/fascia Disorders 20 2%Syncope/hypotension 17 1%Acute Bronchitis 16 1%Complication - Medical Care 13 1%Arrhythmia - Other 12 1%Eye Disorders - Other 12 1%
Top Diagnoses for Members with Mult ER Visits
5454
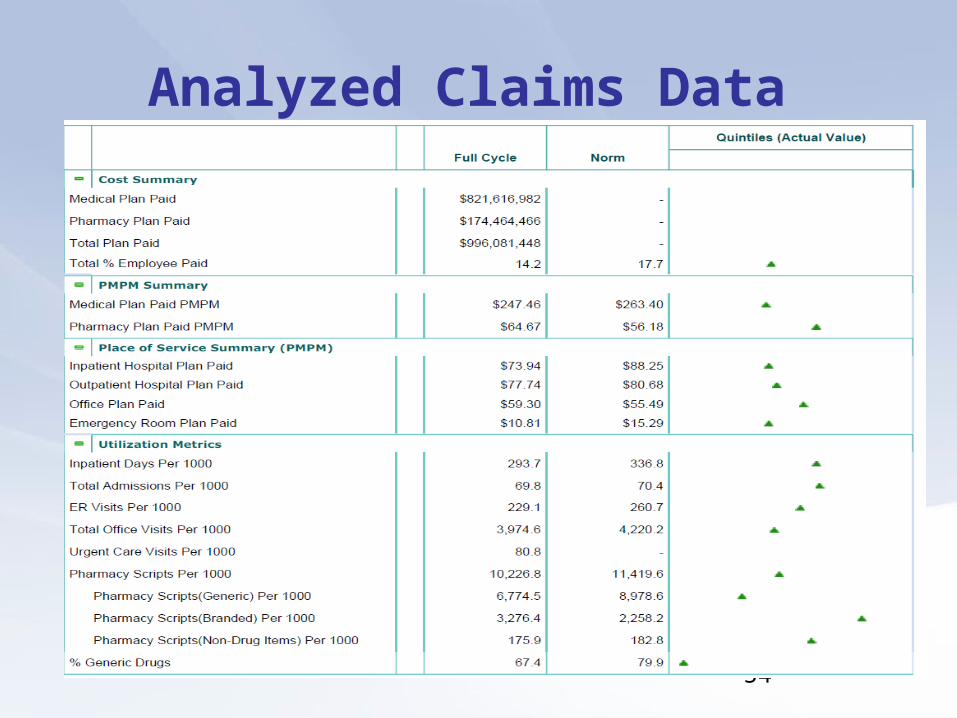
Analyzed Claims Data
55
ENTERPRISE DATA WAREHOUSE AND ADVANCED ANALYTICS
Putting it all together
5656
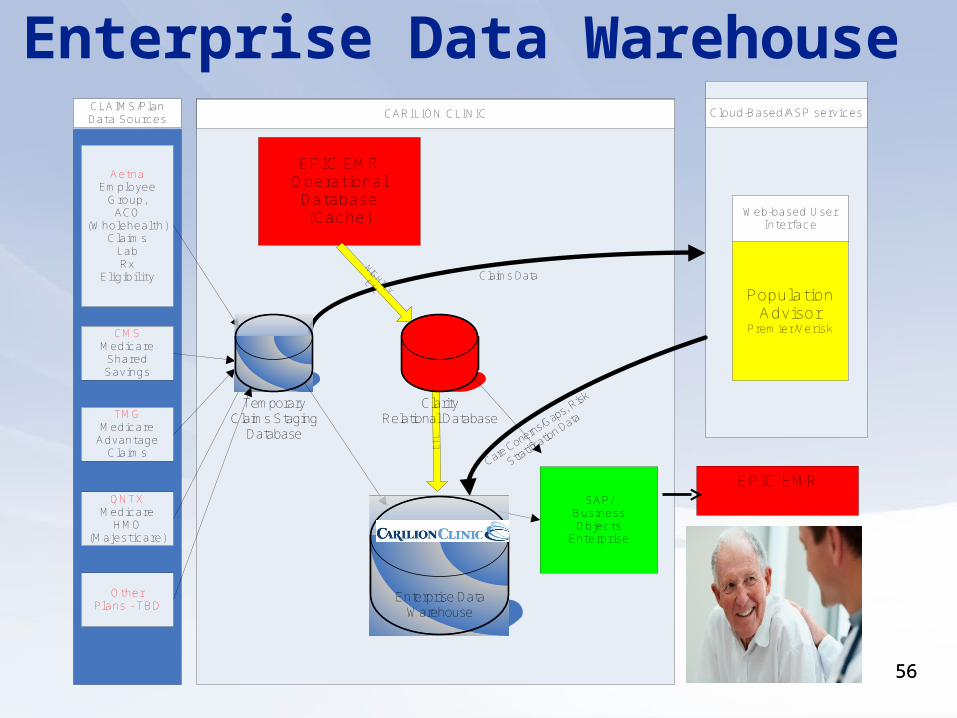
Enterprise Data Warehouse
Claims Data
AetnaEmployee
Group,ACO
(Wholehealth)Claims
LabRx
Eligibility
TMGMedicare
AdvantageClaims
CMSMedicare Shared Savings
SAP/BusinessObjects
Enterprise
EPIC EMROperationalDatabase(Cache)
QNTXMedicare
HMO (Majesticare)
OtherPlans - TBD
CLAIMS/PlanData Sources CARILION CLINIC
NIGHTLY
ETL
ET
L
Clarity Relational Database
Cloud-Based/ASP services
TemporaryClaims Staging
Database
Care Conerns/Gaps,
Risk
Stratific
ation Data
PopulationAdvisor
Premier/Verisk
Web-based User Interface
Enterprise Data Warehouse
EPIC EMR

5757
Future Direction
Advanced Analytics

58
EARLY OUTCOMES

5959
Aetna Whole Health ACO Outcomes
Baseline Current
(2011) (2012-2013)
Bed Days/1,000 125.7 118.3
Readmission Rate 5.6% 4.9%
Avoidable ER Visits/1,000 113.3 85.9
Hi-Tech imaging/1,000 69.2 62.8
6060
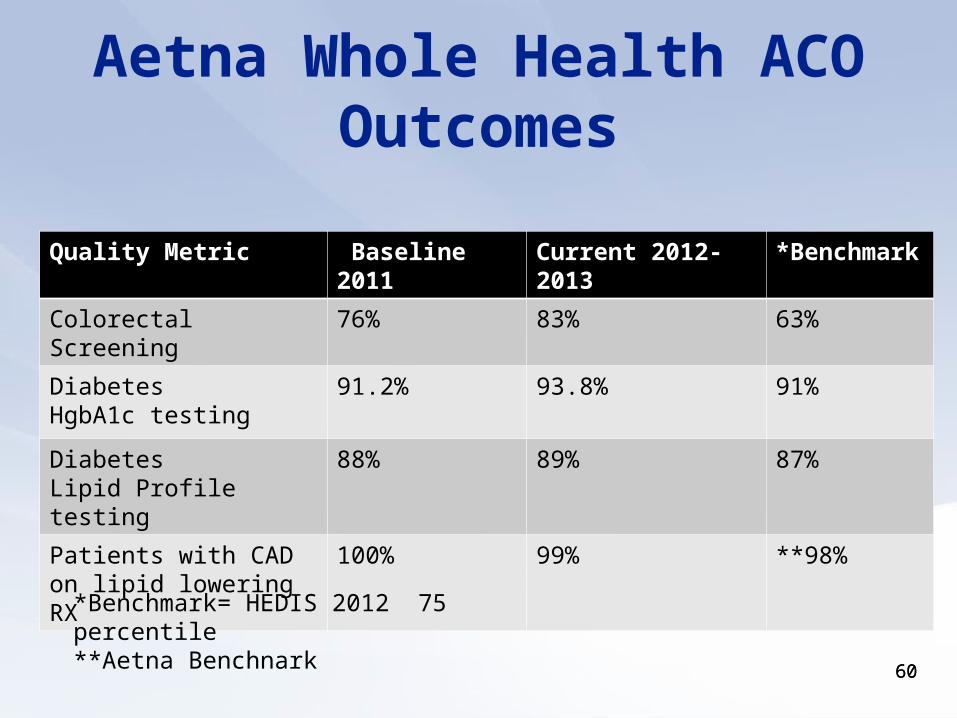
Aetna Whole Health ACO Outcomes
Quality Metric Baseline 2011 Current 2012-2013 *Benchmark
Colorectal Screening 76% 83% 63%
Diabetes HgbA1c testing
91.2% 93.8% 91%
Diabetes Lipid Profile testing
88% 89% 87%
Patients with CAD on lipid lowering RX
100% 99% **98%
*Benchmark= HEDIS 2012 75 percentile**Aetna Benchnark

6161
Carilion Patient Centered Medical Home Outcomes
Comparative Clinical Performance Measures: 2009-2012
Q-42009
Q-22012
PercentChange (%)
1. Body Mass Index (BMI) Measured for Patients <18 Years of Age 39.5% 92.9% 135.2%
2. Pneumococcal Vaccination for Patients >65 Years of Age 74.2% 79.0% 6.5%
3. Breast Screening for Female Patients 40-69 Years of Age 56.2% 66.8% 18.9%
5. A1c Testing for Diabetics 18-75 Years of Age 85.2% 91.9% 7.9%
6. Persistent Asthmatics with Controller Medications Prescribed 86.2% 93.1% 8.0%
7. Diabetics with Blood Pressure Controlled at <140 SBP / 90 DBP 68.4% 72.2% 5.6%
8. Hypertensive Patients with Blood Pressure Controlled at <140 SBP / 90 DBP 64.6% 67.6% 4.6%
Source: 70,000 patient study in 20 Carilion mature medical homes during the period 2009 – 2012; "The Impact of the Patient-Centered Medical Home on Hypertension."

6363
0
200
400
600
800
1000
1200
1400
3.8 4.4 4.75
5.3 5.6 5.9 6.2 6.5 6.8 7.1 7.4 7.78
8.3 8.6 8.9 9.2 9.5 9.8 10.1
10.4
10.7 11
11.3
11.6
11.9
12.2
12.5
12.8
13.1
13.4
13.7 14
14.3
14.6
14.9
15.2
15.5
15.8
16.1
16.4
17.1
17.6
18.3
Distribution of FCM & IM Patients' Last A1C ValueMarch 2012 - Feburary 2013
Median = 6.8
Average = 7.3
N = 23,473 patients with type 2 DM

64
SUMMARY

6565
Is it Easy?
• Costly
• HIT steep learning curve
• Disrupted relationships
• Staff felt disengaged
• Leadership turnover
• Staff felt disengaged
• Management in new territory
• Support systems not ready for change

66
Key IT Drivers
• Physician Leadership and engagement • A seat at the table
• CMO, CSO, CMIO, Department Chairs
• Culture matters a lot !!
• Information Technology• Develop your roadmap – First things first
• EMR integration
• Telemedicine
• Patient portals / patient engagement
• Build your ability to analyze and display data
• Data Warehouse (Buy or build?)

67
Tonight’s Topic
Health IT And
Population Health


