
© 2012 – 2015 Azima DLI – All rights reserved.
Part Number: 80004240
AZIMA DLI HEADQUARTERS: 300 Trade Center, Suite 4610 Woburn, MA 01801 USA +1 781.938.0707 | [email protected] | www.AzimaDLI.com
Impact Demodulation With ExpertALERT Software on TRIO, DC, DCA and Sprite Data Collectors
Steven Hudson, Senior Analyst, Azima DLI
Ken Piety, Vice President of Technology, Product Engineering, Azima DLI

2 | P a g e Application Note: Impact Demod
www.AzimaDLI.com
Contents 1 | Introduction ................................................................................................................................................ 4
2 | Recommended Analysis of Impact Demod data ........................................................................................ 5
A. Repetitive Pattern Signals .................................................................................................................... 5
B. Random Energy Signals ........................................................................................................................ 6
3 | Recommended Setup for Impact Demod Measurements ......................................................................... 7
A. Impact Demod Analysis Range and Resolution .................................................................................... 8
B. Vibration Units Desired ........................................................................................................................ 8
C. Number of Averages ............................................................................................................................ 9
D. Selection of High-Pass Filter ................................................................................................................. 9
E. Selection of Axes .................................................................................................................................. 9
Appendix A ..................................................................................................................................................... 10
Impact Demod Setup Steps in ExpertALERT 3.50 ...................................................................................... 10
1. Creating Impact Demod Data Collection Setups ............................................................................ 10
2. Enabling Impact Demod Desired Machine Locations .................................................................... 12
Appendix B ..................................................................................................................................................... 13
Impact Demod Example ............................................................................................................................. 13
Figures Figure 1: Sample of Repetitive Pattern Signal Type - Impact Demod Waveform ............................................ 5
Figure 2: Sample of Random Energy Type Signal - Impact Demod Waveform ................................................ 6
Figure 3: Impact Demod Waveform Showing Rolling Element Bearing High Level Impacts ......................... 13
Figure 4: Impact Demod Spectra Indicating Periodic Content of the Bearing Fault ...................................... 13
Figure 5: Photograph of Electrical Arc Indications Found on Bearing Inner Race ......................................... 14
Figure 6: Impact Demod Waveform After Bearing Repairs ........................................................................... 14

3 | P a g e Application Note: Impact Demod
www.AzimaDLI.com
Revision History
Revision Draft/Changes Date
Update February 2015

4 | P a g e Application Note: Impact Demod
www.AzimaDLI.com
1 | Introduction Recording high frequency impact events can improve rolling element bearing diagnostics
particularly in slow speed machines where it can be quite difficult to detect and uniformly gauge
severity of faults. Standard demodulation techniques do not always provide adequate sensitivity
for this task, particularly in low speed bearings. To address this, AzimaDLI has implemented a
signal processing technique in the latest version of ExpertALERT™ software and hardware (TRIO™,
DCX™, DCA™ and Sprite™). This feature is “Impact Demodulation or Impact Demod”.
The Impact Demod algorithm emphasizes impacting events in the waveform. Impact events may
be characterized by short duration (high frequency), high amplitude events in the unfiltered
waveform data. In the case of bearing or gear faults, short duration high amplitude events are
repeated over a long periodicity (low frequency) and are typically filtered out by standard anti-
aliasing measures.
Capturing and preserving these impact events is accomplished by sampling the acceleration signal
very rapidly (at the maximum sampling rate available with the data acquisition hardware),
regardless of the final analysis frequency chosen; then constructing parameters which emphasize
the extremes of the distribution of sampled values in the time interval of interest. These
parameters are scaled to approximate the span of the acceleration amplitudes measured in the
original waveform. The specific calculations utilized in the Impact Demod Algorithm are
considered proprietary Azima DLI technology. This approach provides much higher sensitivity to
impact events than traditional demodulation techniques.
Some important characteristics of Impact Demod:
The peak waveform value is a better indicator of severity than spectral amplitudes as impact events are not sinusoidal in character.
Peak waveform values should be trendable in most cases and are much less dependent on the speed of the machine being examined (i.e., more sensitive in low speed applications like paper rolls).
The impact frequency is sometimes more visually evident in the waveform.
The waveform is scaled to start from zero and have only positive values. Consequently this causes the waveform to look much like a spectrum, therefore care should be taken to not confuse the two.
NOTE: The Impact Demod waveform provides a better indication of fault severity than
impact demod spectra and should always be saved and analyzed first. The waveform will
provide a more obvious visual indication that a fault is present in most cases.

5 | P a g e Application Note: Impact Demod
www.AzimaDLI.com
2 | Recommended Analysis of Impact Demod Data
At this time there has been no special expert automated diagnostic system (EADS) rulebase
changes made to handle Impact Demod differently than legacy demodulation. However, with the
addition of demodulation waveforms, crest factor and clipping rules will be applied as EADS
makes no distinction between low range, high range, and demodulated waveform types. To date,
the most common Impact Demod alarm appears to be maximum crest factor giving a diagnosis of
“WAVEFORM EVENTS (CREST FACTOR)”. EADS identifies the highest crest factor it sees,
regardless of which waveform it came from, and if amplitudes exceed 5 it will create and alarm
and diagnoses. Note that EADS will not specify which waveform (low range, high range, or
demodulation) has caused the alarm.
Along with the new Impact Demod signal processing method there are new application and
analysis techniques that will be useful in interpreting this data. Although we lack historical data
for this feature we do have some suggested methods to use while experience is gained.
The following are some basic guidelines for review and alert criteria using Impact Demod. The
Impact Demod waveform will indicate two distinct pattern types:
A. Repetitive Pattern Signals
B. Random Energy Signals
A. Repetitive Pattern Signals
These signals usually indicate metal to metal contact and contain distinct repetitive patterns that
will often match known rotation rates or bearing defect frequencies. Keep in mind that this
signal is filtered to remove fundamental running speed and bearing fault frequencies, so these
peaks are a result of impact-induced high frequency activity.
Figure 1: Sample of Repetitive Pattern Signal Type - Impact Demod Waveform
Compare the Impact Demod peak waveform amplitude to Table 1 to determine severity.

6 | P a g e Application Note: Impact Demod
www.AzimaDLI.com
Table 1: Setup Parameters for Impact Demod
Shaft RPM Alert and Examine Value
0-70 0.5 g or less
71-500 1.5 g
501-1000 3.0 g
1001-3700 6.0 g
3701-5000 9.0 g
Above 5000 12.0 g
Some repetitive pattern signal guidelines to consider:
High frequencies attenuate rapidly with distance and when crossing material interfaces; thus inner race bearing problems will be more severe than outer race problems at the same Impact Demod peak value
The amplitude criteria should be combined with visual screening for distinct repetitive impact patterns even at lower amplitudes to achieve earliest possible detection
Best limits will be based on historical trends for each location on the machine since each machine can have its own distinctive character
B. Random Energy Signals These signals have a random character with no distinct patterns in the waveform or spectra.
Lubrication problems, cavitation/surging or other hydraulic/aerodynamic instabilities, friction
generated by slipping or rubbing between mating surfaces can generate very high peak
amplitudes (>50 gs) with this random character.
Figure 2: Sample of Random Energy Type Signal - Impact Demod Waveform
Some random energy guidelines to consider:
Friction-induced lubrication problems excite a wide range of high frequencies and will cause spectrum with elevated noise floor and little or no harmonic content.
Best limits will be based on historical trends for each location on the machine since each machine can have its own distinctive character.
In a pump, it can be very difficult to make a distinction between cavitation and lubrication issues so both have to be considered based on pump/bearing type.

7 | P a g e Application Note: Impact Demod
www.AzimaDLI.com
These type events cannot generally be sustained continuously for long periods without significant damage to the machine; if the event is intermittent such as a pump that cavitates only under certain operating conditions, then the situation may be tolerable but deserves investigation.
3 | Recommended Setup for Impact Demod Measurements The purpose of this section is to provide guidelines for using Impact Demod. When setting up
this measurement, the following settings must be considered in order to achieve an optimum
result.
A. Impact Demod Range (maximum analysis frequency-Fmax) and Resolution (number of lines in demod spectra)
B. Vibration Units Desired C. Number of Averages D. Selection of High-Pass Filter (Impact Demod) Settings E. Selection of Axes
The following table provides recommendations for the Impact Demod measurement setup
parameters and is intended as a “guide” when setting up database machine measurements;
however, the user might encounter unusual machinery or operating conditions that might
require setting up such measurements somewhat differently.
Table 2: Setup Parameters for Impact Demod
SHAFT RPM HIGH PASS FILTER
MAXIMUM
FREQUENCY RANGE
NUMBER OF
AVERAGES
MIN NUMBER
OF LINES
1-300 500 Hz 200 Hz (see notes) 1 800
300-600 500 Hz 40X RPM 1 800
601-1500 1000 Hz 40X RPM 1 800
1501-3000 2000 Hz 40X RPM 1 800
3001-4500 3000 Hz 40X RPM 1 1600
4501 AND UP 4000 Hz 50X RPM 1 1600
FOR GMF 5000 Hz >3X GMF 1 3200

8 | P a g e Application Note: Impact Demod
www.AzimaDLI.com
NOTE:
1. The chosen Frequency Range should not exceed the High-Pass Filter setting. 2. Special consideration for machines less than 300 RPM; High sampling rates combined with
limited data buffer size restricts the low frequency capture of the TRIO family (DP-1) to 153Hz @ 800 lines and the DCX family (AQ-204) to 50 Hz @ 800 lines. 200 Hz @ 800 lines is the lowest “common” Impact Demod setting available for these analyzers.
A. Impact Demod Analysis Range and Resolution Although Frequency Range and Resolution are set in completely different areas in ExpertALERT
3.50, they must initially be considered together. When setting the Impact Demod Range (Impact
Demod shares the Demod Range setting), we should first consider that the primary analysis
method. In this case, the waveform and its capture length should contain a minimum of 15 shaft
revolutions (10 revolutions is a minimum that should be obtained even for slow speed machines).
This will ensure adequate time to resolve impacts for bearing related faults. It is also desirable to
set the frequency range high enough to be able to view the desired fault frequencies in the
spectra and meet the normal requirements of the demodulation spectra expected by the
diagnostic expert software (i.e. be at least 2x Low Range setting). The following relationship of
frequency range to shaft revolutions contained in a time sample simplifies this concern.
For example, if the maximum frequency is set at 80 orders and the resolution is set to 800 lines,
then the number of revolutions captured is 800/80 or 10 rev which does not provide adequate
capture length. If a selection of 40 Orders is set and the number of FFT lines is 800 lines, then the
number of revolutions captured is 800/40 or 20 rev which does provide adequate capture length.
This indicates using a frequency range between 20-40xRPM with 800 lines of resolution will
usually give good balance between maintaining adequate number of revolutions in the time
record to detect faults while capturing enough range to identify fault frequencies in the spectra
(see Table-2). Using higher number of lines is always advisable if a higher frequency range is
desired (see section on Averaging).
B. Vibration Units Desired When using Impact Demod an accelerometer is recommended as the transducer of choice and it
is always recommended to collect and store waveform data in the native sensor units.
Number of Orders (Fmax) = Number of Spectral Lines
Number of Shaft Revolutions
9 | P a g e Application Note: Impact Demod
www.AzimaDLI.com
C. Number of Averages In most vibration measurements, it is desirable to use spectral averaging to improve the signal-to-
noise ratio of the spectrum. However, in the case of Impact Demod, averaging is not required.
A much better way to utilize any extra time normally required for averaging would to increase the
number of FFT lines during Impact Demod measurements which would also improve the signal-
to-noise ratio of the spectrum. Hence, only one average (disregard overlap) is recommended for
the Impact Demod setup.
D. Selection of High-Pass Filter The Impact Demod Algorithm method requires a High Pass Filter selection based on the
frequency range desired. The available selections for the corner frequency of the high pass filters
are:
1) 500 Hz 2) 1kHz 3) 2kHz 4) 3kHz 5) 4kHz 6) 5kHz
This filter should be set to a value that is equal or higher than the normal base-band frequencies
generated by the machine being tested or approximately 50xRPM. If you are unsure what high
pass filter to select then use Table 2.
NOTE: The chosen Frequency Range should not exceed the High-Pass Filter setting.
E. Selection of Axes It is recommended that this measurement be collected on the in-line axis of the triaxial sensor.
By convention this will be designated as the first channel/letter designation of the Transducer
Orientation setting. A new “Select In-Line Axes” tool has been added to the Demod setup tab to
assist in this function.
10 | P a g e Application Note: Impact Demod
www.AzimaDLI.com
Appendix A
Impact Demod Setup Steps in ExpertALERT 3.50 This appendix is intended to provide screen shot examples of creating/editing an Impact Demod
setup in the EA software. There are two major steps to setup and enable Impact Demod in EA:
1. Create one or more Impact Demod Data collection setups 2. Enable Impact Demod on each desired machine location
1. Creating Impact Demod Data Collection Setups
a. Select DATA COLLECTION SETUPS from the tree structure, and then do any of the following to open the New Setup dialog box.
a. Click the New setup button. b. Choose File>New Setup. c. Right-click and select New Setup from the shortcut menu.
b. Enter a name for the setup. Examples:
o Impact Demod 500Hz 800L Setup o Impact Demod 1000Hz 800L Setup o Impact Demod 2000Hz 800L Setup o Impact Demod 500Hz 1600L Setup
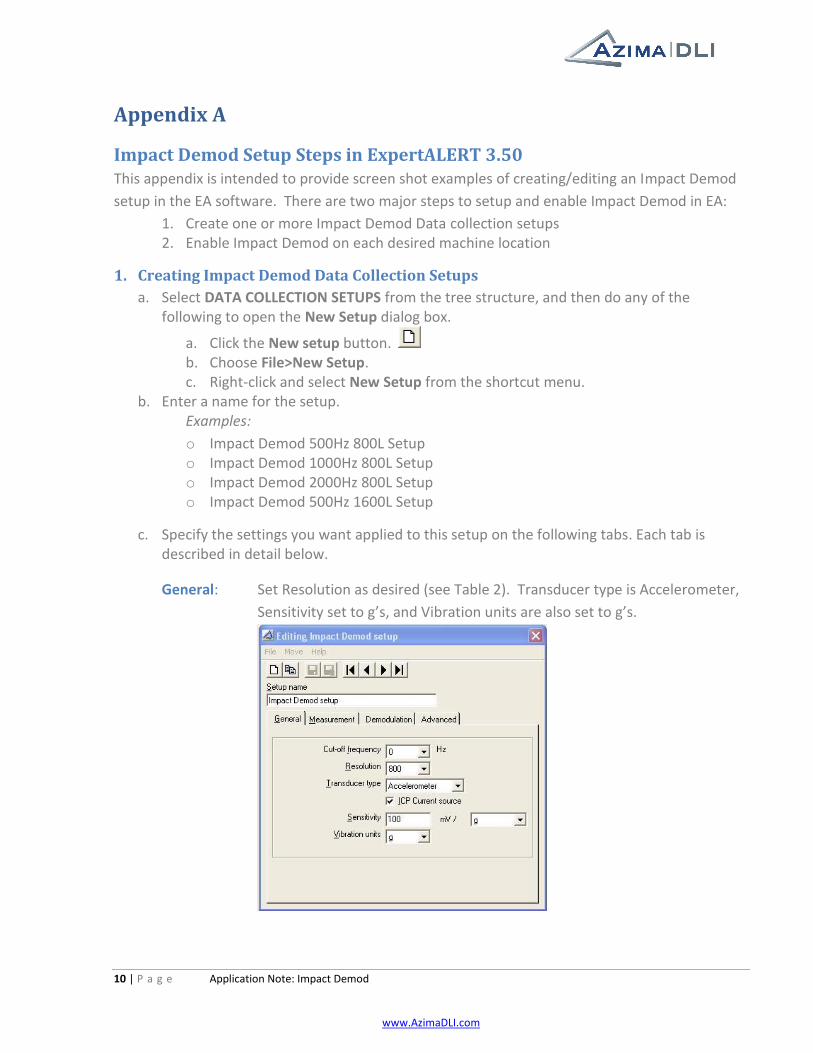
c. Specify the settings you want applied to this setup on the following tabs. Each tab is described in detail below.
General: Set Resolution as desired (see Table 2). Transducer type is Accelerometer,
Sensitivity set to g’s, and Vibration units are also set to g’s.

11 | P a g e Application Note: Impact Demod
www.AzimaDLI.com
Measurement: Ensure the Average type is Spectral, Number of Averages is 1, and
Window type is Hanning.
Demodulation: Check the box for Impact Demod and select an appropriate High Pass
Filter as desired for this setup (see Table 2).
Advanced: No action required on this tab

12 | P a g e Application Note: Impact Demod
www.AzimaDLI.com
d. Repeat this to create new setups for each Impact Demod filter/resolution setting
required.
2. Enabling Impact Demod Desired Machine Locations
a. Select the location you want to edit from the tree structure. b. Use any of the following methods to open the Editing <Location Name> dialog box.
Click the Open location button.
Choose File>Open location.
Right-click the location and select Open location from the shortcut menu. c. Make the changes you want on the following tabs. Each tab is described in detail below.
General: No changes required on this tab.
Vibration Readings:
1. Range Definition a. Demodulation; select an “Impact Demod” Setup name as desired for this
machine location (see Table 2). b. Demodulation; select a Range as desired (see Table 2). Range Calculator can be
used to simplify this selection. 2. Use “Select In-Line Axes” tool to select both Spectra and Waveform for the desired
axes in line with captive bolt.
d. Repeat this for each location desired for Impact Demod.
e. Setup is complete.

13 | P a g e Application Note: Impact Demod
www.AzimaDLI.com
Appendix B
Impact Demod Example As this is a new technology for our product line, there are few good case studies at this time. However, we
have one good documented example. In this example, a large vertical motor bearing had extreme fault
severity with a 52.4g maximum peak and apparent random energy in the time domain. However, in the
Demod Spectra, it does indicate some periodic content most significantly at 6.89xM. Post repair
inspection showed severe indications of electrical current damage.
Figure 3: Impact Demod Waveform Showing Rolling Element Bearing High Level Impacts
Figure 4: Impact Demod Spectra Indicating Periodic Content of the Bearing Fault

14 | P a g e Application Note: Impact Demod
www.AzimaDLI.com
Figure 5: Photograph of Electrical Arc Indications Found on Bearing Inner Race
Figure 6: Impact Demod Waveform After Bearing Repairs
Peak values are now similar to historical trends for this machine


