Impacts of Tax Exemptions: An Overview
Steve Lerch, Ph.D.
January 2004

Impacts of Tax Exemptions: An Overview
Steve Lerch, Ph.D.
January 2004
Washington State Institute for Public Policy 110 Fifth Avenue SE, Suite 214
Post Office Box 40999 Olympia, Washington 98504-0999
Telephone: (360) 586-2677 FAX: (360) 586-2793
URL: http://www.wsipp.wa.gov Document No. 04-01-4102

WASHINGTON STATE INSTITUTE FOR PUBLIC POLICY Mission The Washington Legislature created the Washington State Institute for Public Policy in 1983. A Board of Directors�representing the legislature, the governor, and public universities�governs the Institute, hires the director, and guides the development of all activities. The Institute�s mission is to carry out practical research, at legislative direction, on issues of importance to Washington State. The Institute conducts research activities using its own policy analysts, academic specialists from universities, and consultants. New activities grow out of requests from the Washington legislature and executive branch agencies, often directed through legislation. Institute staff work closely with legislators, as well as legislative, executive, and state agency staff to define and conduct research on appropriate state public policy topics. Current assignments include projects in welfare reform, criminal justice, education, youth violence, and social services. Board of Directors Senator Don Carlson Dennis Braddock, Department of Social and Health Services Senator Karen Fraser Marty Brown, Office of Financial Management Senator Linda Parlette Douglas Baker, Washington State University Senator Betti Sheldon Stephen Jordan, Eastern Washington University Representative Don Cox Thomas L. "Les" Purce, The Evergreen State College Representative Phyllis Kenney Ken Conte, House Office of Program Research Representative Cathy McMorris Stan Pynch, Senate Committee Services Representative Helen Sommers Staff Roxanne Lieb, Director Steve Aos, Associate Director
CONTENTS Executive Summary................................................................................................................ 1 I. Identifying and Measuring Tax Exemptions .................................................................... 3 II. Tax Exemptions in Washington State ............................................................................. 5 III. Economic Development Tax Exemptions........................................................................ 7
Statewide Studies............................................................................................................ 7
Hypothetical Firm Studies................................................................................................ 9
Specific Tax Incentive Evaluations................................................................................ 16
Firm-Specific Tax Incentive Packages .......................................................................... 18
Washington�s High Technology Tax Incentives............................................................. 19
Conclusions ................................................................................................................... 20 IV. All Other Tax Exemptions.............................................................................................. 23
Nonprofit Organizations................................................................................................. 23
Intangible Financial Assets............................................................................................ 25
Individuals...................................................................................................................... 25
Miscellaneous................................................................................................................ 26
Conclusion..................................................................................................................... 26 Members of the Tax Exemption Technical Advisory Group provided valuable suggestions on the study content and potential sources of information. This group consisted of representatives from the House of Representatives, the Senate, the Office of Financial Management, the Department of Revenue, and the Department of Community, Trade and Economic Development.

1
EXECUTIVE SUMMARY Tax Exemptions Identifying and measuring tax exemptions originated with the federal government in the 1960s. The idea was to provide cost estimates for tax subsidies and preferences that favored particular taxpayer groups in much the same way that budget documents displayed information on government spending. Besides the federal government, 33 states, including Washington, provide estimates of tax exemptions. Tax exemptions are measured relative to a �normal� level of taxation. Differing views on what constitutes a �normal� tax system lead to differing estimates of tax exemption costs. Tax Exemptions and Economic Development Policies that encourage businesses to increase employment and investment through tax subsidies, credits, or other preferential treatment constitute a major category of tax exemptions. A substantial quantity of research has investigated whether state taxes and tax incentives influence business location decisions and state economic activity. Summarizing the conclusions from three different analytic approaches to this issue suggests that taxes have a relatively small impact on economic activity and business location decisions.
• Statewide studies use state-level measures of economic activity (such as employment) to find a relationship between various state tax indicators and overall state economic activity. The weakness of this approach is that summary measures of state tax systems (such as average taxes per capita) rarely represent the tax impacts faced by individual businesses when deciding where (or whether) to expand operations.
• Hypothetical firm studies create hypothetical businesses and attempt to measure
the state taxes that would be paid by these �representative firms� in various states. Although more accurately representing the tax liabilities faced by individual businesses, hypothetical firm studies cannot provide an estimated relationship between taxation and economic activity.
• Specific tax exemption studies examine specific tax exemptions or incentive
packages and attempt to determine their impact on economic activity in a particular state or metropolitan area. Such studies directly address the effectiveness of economic development tax exemptions. It is difficult, however, to separate the economic impact of exemptions from other variables.
Findings. Each approach to measuring the impact of tax exemptions on economic activity has advantages and disadvantages. However, taken as a whole, the research suggests that state taxes and tax incentives can have an impact on economic activity. This impact may be weakened or strengthened by the design of tax incentive programs or a state�s
2
business tax burden relative to other states, but the economic impact of tax exemptions is likely to be small and less important than other factors, such as labor costs and productivity. Other Tax Exemptions In addition to economic development, tax exemptions are enacted to meet other policy goals, such as assisting nonprofit organizations or reducing the tax system�s administrative burdens. Because outcomes associated with these desired goals are often hard to measure, the data needed for analysis purposes are often lacking, and little research exists to guide policy in this area. Findings. In attempting to assess the value or usefulness of non-economic development exemptions, it is important to consider two points.
• As noted above, data to measure or analyze the desired goals of these exemptions are often difficult to obtain or, in some cases, completely unavailable. Therefore, any assessment of tax exemptions needs to consider all possible sources of information, both qualitative and quantitative.
• The potential unintended consequences of tax exemptions are important
considerations. For example, research suggests that the combination of tax exemptions for nonprofit organizations and high tax rates encourages nonprofits to engage in commercial activities. In turn, this provides nonprofits with a competitive advantage over for-profit businesses. The possible negative effects on existing firms should be considered, as well as the expected benefits to be provided, when analyzing tax exemptions for nonprofit organizations.
3
I. IDENTIFYING AND MEASURING TAX EXEMPTIONS The idea of identifying and measuring tax exemptions (also referred to as tax expenditures) is often attributed to Stanley Surrey, an Assistant Secretary of the U.S. Treasury in the 1960s. Surrey defined tax exemptions as tax subsidies, preferences, and incentives that �favor a particular industry, activity, or class of persons� and that �represent government spending for favored activities or groups, effected through the tax system rather than through direct grants, loans, or other forms of government assistance.�1 Information about tax exemptions is seen as adding valuable new data for managing the size and scope of government budgets and in efficiently allocating government resources.2 As Surrey�s definition suggests, tax exemptions are intended to benefit a subset of taxpayers and usually are enacted to support a particular policy goal. Examples include credits to small businesses, with the goal of encouraging the formation of new firms, and excluding non-profit organizations from the property tax to ease the financial burden of providing desirable services, such as food assistance or operating a museum. This report groups tax exemptions into two broad categories:
• Economic development exemptions intended to encourage economic activity; and
• All other exemptions, including those for non-profit organizations, intangible assets, and individuals.
Identifying an appropriate tax baseline is a major issue in the definition and measurement of tax exemptions. In other words, measuring the benefit received by a taxpayer requires identification of a �normal� level of taxes. Because of differing views on what constitutes a �normal� tax baseline, opinions on what constitutes a tax exemption also differ. For example, the President�s 2004 budget presented tax exemption estimates compared with both a comprehensive income tax and a consumption tax.3 Using the income tax as a baseline, allowing a deduction for home mortgage interest payments is a tax exemption. However, using a consumption tax baseline, where only purchases of goods and services are taxed, a deduction for home mortgage interest is not a tax exemption.
1 Stanley Surrey and Paul McDaniel, Tax Expenditures (Cambridge, MA: Harvard University Press, 1985), 3. 2 Jean Harris, �Tax Expenditure Control,� in Handbook of Public Budgeting, ed. Jack Rabin (New York, NY: Marcel Dekker, Inc., 1992), 301-332; John Mikesell, �Tax Expenditure Budgets, Budget Policy, and Tax Policy: Confusion in the States,� Public Budgeting and Finance 22, no. 4 (Winter 2002), 34-51; Leonard Burman, �Is the Tax Expenditure Concept Still Relevant?� National Tax Journal (September 2003), <http://www.urban.org/UploadedPDF/410813_NTA_Tax_Expenditure.pdf>, accessed December 16, 2003. 3 U.S. Office of Management and Budget, Analytical Perspectives, Budget of the United States Government, Fiscal Year 2004 (Washington, DC: Government Printing Office, 2003); see also the discussion of this issue in Burman, �Is the Tax Expenditure Concept Still Relevant?�
4
Besides the federal government, 33 states publish tax exemption reports. In examining these reports, one researcher identified three different concepts states use to define and calculate tax exemptions.4
• First, some states use a conceptual baseline. A conceptual baseline is a �normal� tax system that is much broader than current law and reflects an idealized view of both how much revenue should be raised and how tax payments should be distributed across various types of taxpayers. Tax exemptions are then defined as any deviation from this idealized tax policy.
• Second is the use of a reference law baseline that identifies tax exemptions as
specific statutes that alter or amend the �normal� tax system as defined by broad state tax law. Under this concept, some exclusions from a tax may be considered as part of the broader tax law and, therefore, not defined as tax exemptions. For example, exempting purchases of goods intended for resale from the sales tax might be considered an integral part of a state�s sales tax law and therefore not a tax exemption.
• Finally, tax exemptions can be defined as any provision that reduces state tax
revenue. This concept, referred to as a revenue reducer list, does not make any distinctions about what constitutes a �normal� tax system and implicitly assumes that the normal tax structure does not contain any provisions that would reduce state revenues.5
The next section will briefly discuss how tax exemptions are defined and measured in Washington State.
4 Mikesell, �Tax Expenditure Budgets.� 5 It has also been argued that tax exemptions are primarily intended to increase political support for elected officials rather than to encourage specific activities. Under this view, identifying the purposes, usefulness, or foregone revenues of tax exemptions is not particularly relevant. For more on this view, see Stanley Winer and Walter Hettich, �What Is Missed If We Leave Out Collective Choice in the Analysis of Taxation,� National Tax Journal 51, no. 2 (June 1998), 373-389.
5
II. TAX EXEMPTIONS IN WASHINGTON STATE Tax exemptions in Washington are defined statutorily as �an exemption, exclusion, or deduction from the base of a tax; a credit against a tax; a deferral of a tax; or a preferential tax rate.�6 This definition falls within the reference law baseline concept discussed in the previous section and is reflected in the tax exemption report produced by the Department of Revenue every four years.7 The most recent version of this report (2000) lists 431 tax exemptions. For each tax exemption, the Department of Revenue provides a description, purpose of the exemption, number of taxpayers benefiting from the exemption, if and how the exemption conflicts with other programs, and an estimate of tax savings associated with the exemption. It is important to note that tax savings are not necessarily equal to the revenue that would be raised if the exemption were repealed. To the extent that taxpayer behavior has been influenced by the exemption, repeal would lead to revenue increases that are less than the tax savings estimates in the Department of Revenue report. The Department of Revenue groups tax exemptions into ten broad categories. The categories designated as Economic or Agriculture generally include tax preferences intended to benefit particular businesses or industries and correspond to the economic development exemptions discussed in Section III. Tax exemptions classified as Nonprofit, Intangibles (financial assets such as stock, bonds, or bank accounts), Individuals, and Other correspond to the other exemptions discussed in Section IV. Several Department of Revenue categories are not considered in this review because they cover areas where future legislation is unlikely. The Tax Base category covers activities not intended to be included in the original tax base. Following the statutory definition of tax exemptions and the reference law baseline concept, these are not strictly tax exemptions. The Government and Commerce categories include activities for which taxation is prohibited by the U.S. Constitution (e.g., federal government activities, interstate commerce) or were not intended to be subject to taxation (e.g., state government property). The Services category contains exemptions of personal and professional services (e.g., legal and medical) from the sales tax. As the tax exemption report notes, this category is somewhat of a gray area. Initially, the Washington State sales tax was imposed only on goods, implying that services were not intended as part of the original tax base and, therefore, the exclusion of services is not a tax exemption. However, over time, some services (including repairs, construction, and physical fitness) have been added to the tax base, suggesting that sales tax exclusions in the Services category are economic development-type tax exemptions.8 The next section summarizes research on the impacts of economic development tax exemptions.
6 RCW 43.06.400 7 Don Taylor, Tax Exemptions - 2000 (Olympia: Washington State Department of Revenue, Research Division, January 2000). 8 Ibid.

7
III. ECONOMIC DEVELOPMENT TAX EXEMPTIONS Tax exemptions for economic development purposes include preferential tax treatment intended to expand or retain economic activity. Tax exemptions in this area generally benefit businesses and are aimed at increasing employment or business investment or improving a business�s ability to compete with out-of-state firms. For economic development tax exemptions to meet their intended goals, state taxes must influence business decisions. In other words, a change in state taxes must result in businesses taking actions, such as expanding employment, that would not have occurred in the absence of a tax change. The question of how state taxes affect employment and economic activity is addressed extensively in the research literature. This research can be grouped into three categories, based on the type of analysis:
• Statewide studies use state-level measures of economic activity (such as employment or investment) and attempt to find a relationship among various state tax indicators and overall state economic activity.
• Hypothetical firm studies create hypothetical businesses and attempt to measure
the state taxes that would be paid by these �representative firms� in various states. • Specific tax exemption studies examine specific tax exemptions or incentive
packages and attempt to determine their impact on economic activity in a particular state or metropolitan area.
Statewide Studies The rationale for economic development tax exemptions is that they affect business decisions: to open a new facility, to keep open an existing facility, to expand existing operations, to hire additional workers. For economic development tax exemptions to influence business decisions, individual business decisions must be sensitive to state taxes. This implies that overall state economic activity must also be affected by state taxes. One way to test this hypothesis is to examine the relationship between measures of economic activity, such as statewide employment, and various state characteristics, including taxes. Much of the research examining the impact of taxes on economic activity makes use of this type of state-level data. The conclusions reached from studies using state-level data have changed somewhat over time. Analyses conducted during the 1950s indicated that state and local taxes had little or
8
no impact on state economic activity.9 Researchers explained these results by the fact that state taxes constitute a very small share of total business costs. Therefore, in deciding where to locate or expand a business, differences across states in the cost of labor, transportation, and other business expenses would overwhelm any differences in taxes. These early studies had statistical and data problems that may have affected their ability to accurately estimate the impact of state taxes on economic activity. Surveys of the literature in 1991, 1995, and 1997 encompass more recent research that uses more sophisticated statistical techniques as well as new data sources.10 Despite these technical improvements, the relationship between state taxes and economic activity remains unclear. A substantial number of studies find a statistically significant and negative impact of state taxes on employment or other statewide measures of economic activity. This means that higher state taxes reduce employment, income, or new plant openings, and lower taxes have the opposite effect. On the other hand, recent research has also found that state taxes have no impact on economic activity. On the whole, researchers tend to conclude that taxes do have a negative impact on economic activity but estimate it as relatively small, with a 10 percent state tax reduction expected to lead to an eventual (long-term) increase of 2 to 3 percent in economic activity.11 However, this finding of a negative impact is frequently qualified by the following concerns:
• Instability of estimated tax-economic activity relationship. The �consensus� estimate of the impact of state taxes is a long-term increase of 2 to 3 percent in economic activity for every 10 percent reduction in state taxes. However, high-quality studies have estimated a range of impacts from zero to as much as 50 times larger than this consensus effect. This instability may be related to difficulties in measuring the taxes businesses actually pay as well as other relevant factors that affect economic activity, such as local wages.12 There also appears to be some sensitivity to the time period analyzed. The results of one study covering the 1970s that found a strong impact of state taxes could not be replicated when the same researchers used data from later time periods.13
9 John F. Due, �Studies of State-Local Tax Influences on Location of Industry,� National Tax Journal 14, no. 2 (June 1961), 163-173. 10 Timothy J. Bartik, Who Benefits From State and Local Economic Development Policies? (Kalamazoo, MI: W.E. Upjohn Institute for Employment Research, 1991); J.M. Phillips and E.P. Goss, �The Effect of State and Local Taxes on Economic Development: A Meta-Analysis,� Southern Economic Journal 62, no. 2 (October 1995), 320-333; Michael Wasylenko, �Taxation and Economic Development: The State of the Economic Literature,� New England Economic Review (March/April 1997), 37-52. 11 Ibid. 12 Local wage rates are clearly an important factor in locating, expanding, or moving a business. However, many studies use state average wages or state average manufacturing wages to help identify differences in labor costs that may explain differences in economic activity across states. To the extent that wages vary more within some states than others, or that fringe benefit costs are higher in some states relative to others, average wages may not truly reflect firms� labor costs. 13 Therese McGuire, �Review of Who Benefits From State and Local Economic Development Policies?� National Tax Journal 45, no. 4 (December 1992), 457-459; Wasylenko, �Taxation and Economic Development,� referring to research by McGuire, Wasylenko, and co-authors.
9
• Impact of state government services. Research indicates that certain state government services, such as transportation, education, or public safety have a positive impact on economic activity.14 This finding suggests that, to the extent a state with above-average taxes provides above-average levels of services desired by businesses, the negative impact of taxes on economic activity could be at least partially offset. Conversely, since most states (including Washington) are required to have a balanced budget, the economic benefits of a tax cut could be at least partially offset if accompanying budget reductions affected services valued by businesses.
• Long-term employment impacts and migration. One of the most frequent goals of
economic development tax exemptions is to increase employment and decrease unemployment in a state. Two different studies estimate that policies that increase employment in an area ultimately lead to filling 60 percent or more of all new jobs by in-migrants.15 If rising employment does lead to substantial in-migration, then tax exemptions that lead to increased economic activity may still have only a small impact on the local unemployment rate of current state residents.
• Long-term employment impacts and work experience. Even if a majority of new jobs
are filled by in-migrants in the long-term, policies that increase a state�s employment will lead to some new jobs for local residents at least in the near-term.16 These new jobs give local residents job experience and skills they would not otherwise receive, improving their long-term employment and earnings prospects. One researcher found evidence consistent with this view.17
Hypothetical Firm Studies The statewide studies discussed above generally use an indicator of average state tax burden to gauge the impact of taxes on economic activity. This may not adequately represent the true tax liability faced by a particular firm when deciding where (or whether) to expand operations. One way to provide a more firm-oriented measure of the impact of state taxes is to use data from actual business balance sheets, income statements, and tax returns to create hypothetical firms typical of businesses in a particular industry. It is then possible to develop models that calculate a hypothetical business� tax bill across various
14 Bartik, Who Benefits From State and Local Economic Development Policies?; Ronald C. Fisher, �The Effects of State and Local Public Services on Economic Development,� New England Economic Review (March/April 1997), 53-82. Both authors note that research on the impacts of state government services on economic activity suffers from some of the data measurement and statistical problems that affect the analyses in the literature on the impact of state taxes on economic activity. 15 Olivier Blanchard and Lawrence Katz, �Regional Evolutions,� Brookings Papers on Economic Activity Issue 1 (1992), 1-75; Timothy J. Bartik, �Who Benefits From Local Job Growth: Migrants or the Original Residents?� Regional Studies 27, no. 4 (1993), 297-311. 16 These new jobs could be the result of unemployed workers obtaining a job or of currently employed workers obtaining better-paying jobs. 17 Bartik, Who Benefits From State and Local Economic Development Policies? Bartik�s finding that increases in an area�s employment growth lead to long-term, positive impacts on the fraction of the labor force that is employed are consistent with the idea that local residents do benefit from actions that increase employment even if in-migrants receive most new jobs.
10
states.18 This method also provides an opportunity to examine how taxes may differ within the same state across different industries or firm sizes. In addition to calculating state taxes for a hypothetical firm, these models generally include local taxes (often by selecting one or two specific cities in each state analyzed) and incorporate the impact of businesses deducting state and local taxes from their federal income taxes. This last point is important because federal deductibility of state business taxes reduces the value of state tax exemptions. One study also incorporates the value of non-tax incentives, such as building roads or providing worker training, based on historical state and local incentive offers to new businesses. Despite some differences in how the tax models were constructed, studies using the hypothetical firm technique tend to reach a similar set of conclusions.
• The tax burden is very similar across many states. In comparing firms in 14 different industries across the six Great Lakes states, the average after-tax return on new investment ranged from 12 percent to 12.5 percent.19 A study comparing firms in 16 different industries across 112 cities found that the after-tax return on investment was very similar for most cities. However, a small number of cities had very high or very low after-tax returns.20
• At the same time, the difference in tax burdens between the highest and lowest
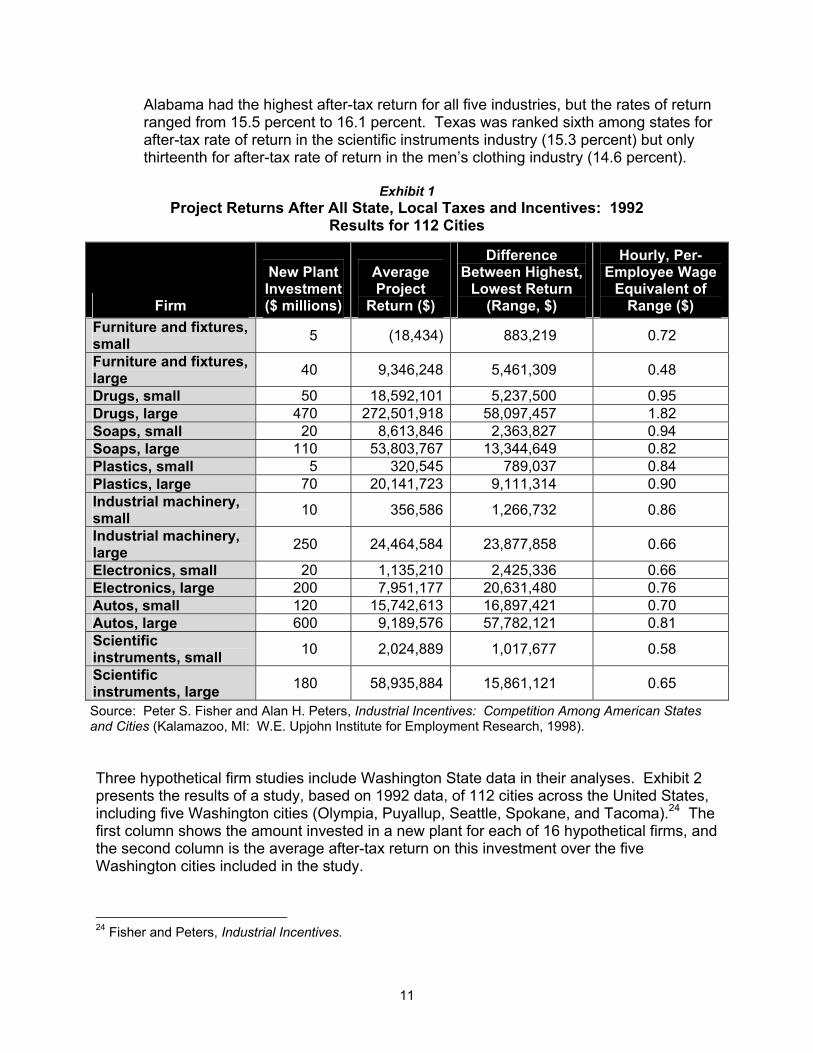
states is substantial. Exhibit 1 summarizes the results from one hypothetical firm study.21 For example, the average after-tax return, over 20 years,22 on a $20 million investment in a soap factory was $8.6 million, but the return in the highest-return city was $2.4 million above the amount in the lowest-return city. The final column in the table converts the difference in returns between the highest- and lowest-return cities into an hourly per-employee equivalent. In other words, the difference in after-tax return on investments across 16 different hypothetical firms was equal to a reduction in hourly wages for each employee of up to $1.82 when comparing the highest-return and lowest-return cities.
• Business tax burdens can vary across industries within the same state. With
hypothetical firms in five industries ranging from men�s clothing to computers, one study used 1991 data to compare the after-tax rate of return across 22 states.23
18 Examples of hypothetical firm studies include James A. Papke, �Where We Stand � 1996: Business Tax Competitiveness Among the Great Lakes States,� presented at the �Designing State-Local Fiscal Policy for Growth and Development� workshop, July 1996, Federal Reserve Bank of Chicago; Robert Tannenwald, �State Business Tax Climate: How Should It Be Measured and How Important Is It?� New England Economic Review (January/February 1996), 23-38; Peter S. Fisher and Alan H. Peters, Industrial Incentives: Competition Among American States and Cities (Kalamazoo, MI: W.E. Upjohn Institute for Employment Research, 1998). 19 Papke, �Where We Stand.� The six Great Lakes states are Illinois, Indiana, Michigan, Minnesota, Ohio, and Wisconsin. 20 Fisher and Peters, Industrial Incentives. 21 Ibid. 22 The 20-year after-tax investment returns are in present value terms. 23 Tannenwald, �State Business Tax Climate.�
11
Alabama had the highest after-tax return for all five industries, but the rates of return ranged from 15.5 percent to 16.1 percent. Texas was ranked sixth among states for after-tax rate of return in the scientific instruments industry (15.3 percent) but only thirteenth for after-tax rate of return in the men�s clothing industry (14.6 percent).
Exhibit 1
Project Returns After All State, Local Taxes and Incentives: 1992 Results for 112 Cities
Firm
New Plant Investment ($ millions)
Average Project
Return ($)
Difference Between Highest,
Lowest Return (Range, $)
Hourly, Per-Employee Wage
Equivalent of Range ($)
Furniture and fixtures, small 5 (18,434) 883,219 0.72
Furniture and fixtures, large 40 9,346,248 5,461,309 0.48
Drugs, small 50 18,592,101 5,237,500 0.95 Drugs, large 470 272,501,918 58,097,457 1.82 Soaps, small 20 8,613,846 2,363,827 0.94 Soaps, large 110 53,803,767 13,344,649 0.82 Plastics, small 5 320,545 789,037 0.84 Plastics, large 70 20,141,723 9,111,314 0.90 Industrial machinery, small 10 356,586 1,266,732 0.86
Industrial machinery, large 250 24,464,584 23,877,858 0.66
Electronics, small 20 1,135,210 2,425,336 0.66 Electronics, large 200 7,951,177 20,631,480 0.76 Autos, small 120 15,742,613 16,897,421 0.70 Autos, large 600 9,189,576 57,782,121 0.81 Scientific instruments, small 10 2,024,889 1,017,677 0.58
Scientific instruments, large 180 58,935,884 15,861,121 0.65
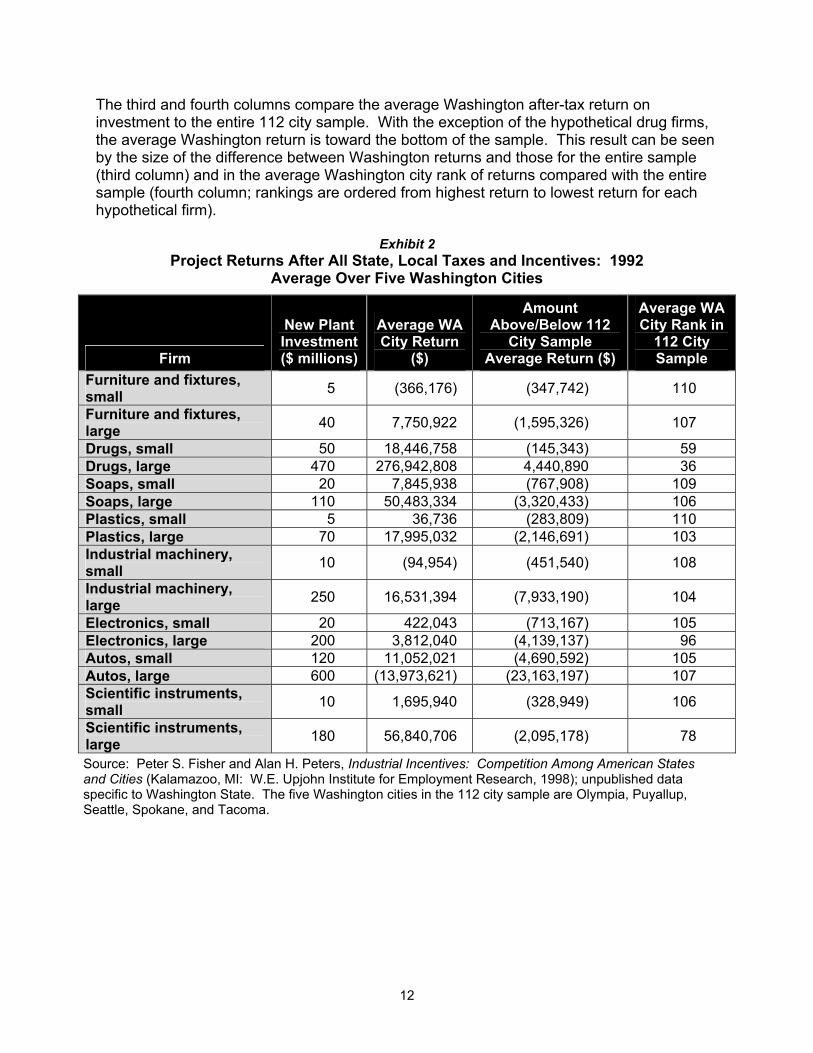
Source: Peter S. Fisher and Alan H. Peters, Industrial Incentives: Competition Among American States and Cities (Kalamazoo, MI: W.E. Upjohn Institute for Employment Research, 1998). Three hypothetical firm studies include Washington State data in their analyses. Exhibit 2 presents the results of a study, based on 1992 data, of 112 cities across the United States, including five Washington cities (Olympia, Puyallup, Seattle, Spokane, and Tacoma).24 The first column shows the amount invested in a new plant for each of 16 hypothetical firms, and the second column is the average after-tax return on this investment over the five Washington cities included in the study.
24 Fisher and Peters, Industrial Incentives.
12
The third and fourth columns compare the average Washington after-tax return on investment to the entire 112 city sample. With the exception of the hypothetical drug firms, the average Washington return is toward the bottom of the sample. This result can be seen by the size of the difference between Washington returns and those for the entire sample (third column) and in the average Washington city rank of returns compared with the entire sample (fourth column; rankings are ordered from highest return to lowest return for each hypothetical firm).
Exhibit 2 Project Returns After All State, Local Taxes and Incentives: 1992
Average Over Five Washington Cities
Firm
New Plant Investment ($ millions)
Average WA City Return
($)
Amount Above/Below 112
City Sample Average Return ($)
Average WA City Rank in
112 City Sample
Furniture and fixtures, small 5 (366,176) (347,742) 110
Furniture and fixtures, large 40 7,750,922 (1,595,326) 107
Drugs, small 50 18,446,758 (145,343) 59 Drugs, large 470 276,942,808 4,440,890 36 Soaps, small 20 7,845,938 (767,908) 109 Soaps, large 110 50,483,334 (3,320,433) 106 Plastics, small 5 36,736 (283,809) 110 Plastics, large 70 17,995,032 (2,146,691) 103 Industrial machinery, small 10 (94,954) (451,540) 108
Industrial machinery, large 250 16,531,394 (7,933,190) 104
Electronics, small 20 422,043 (713,167) 105 Electronics, large 200 3,812,040 (4,139,137) 96 Autos, small 120 11,052,021 (4,690,592) 105 Autos, large 600 (13,973,621) (23,163,197) 107 Scientific instruments, small 10 1,695,940 (328,949) 106
Scientific instruments, large 180 56,840,706 (2,095,178) 78
Source: Peter S. Fisher and Alan H. Peters, Industrial Incentives: Competition Among American States and Cities (Kalamazoo, MI: W.E. Upjohn Institute for Employment Research, 1998); unpublished data specific to Washington State. The five Washington cities in the 112 city sample are Olympia, Puyallup, Seattle, Spokane, and Tacoma.
13
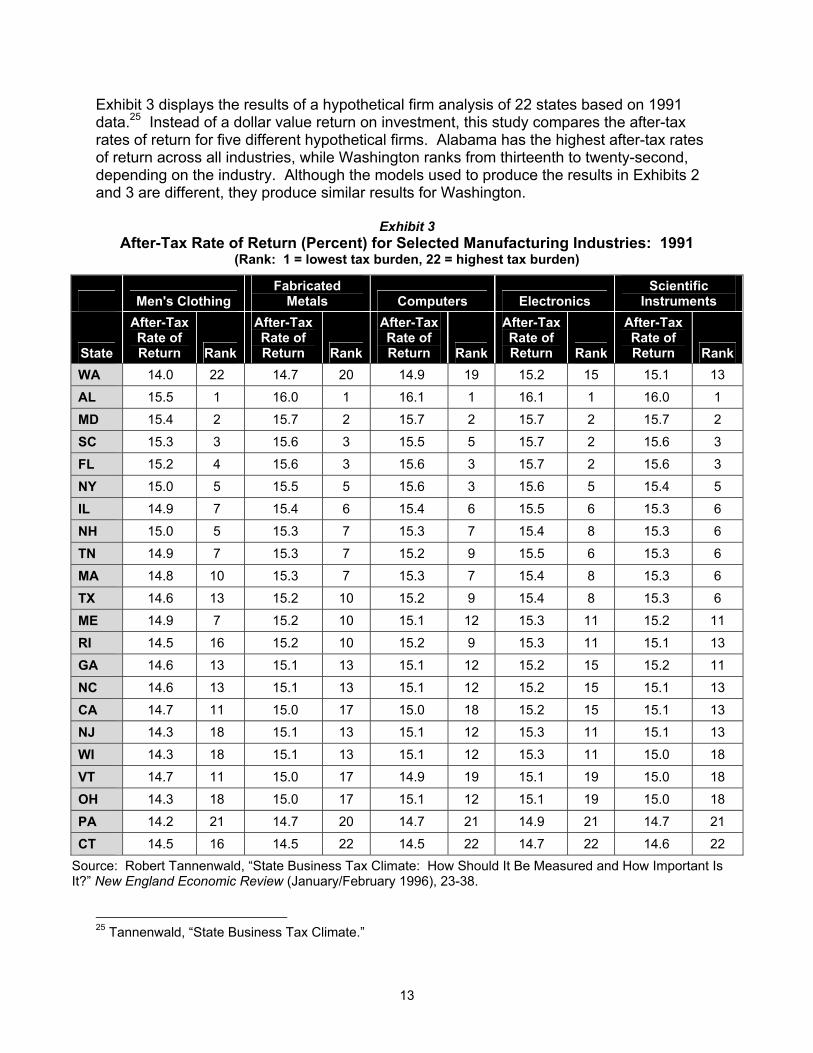
Exhibit 3 displays the results of a hypothetical firm analysis of 22 states based on 1991 data.25 Instead of a dollar value return on investment, this study compares the after-tax rates of return for five different hypothetical firms. Alabama has the highest after-tax rates of return across all industries, while Washington ranks from thirteenth to twenty-second, depending on the industry. Although the models used to produce the results in Exhibits 2 and 3 are different, they produce similar results for Washington.
Exhibit 3 After-Tax Rate of Return (Percent) for Selected Manufacturing Industries: 1991
(Rank: 1 = lowest tax burden, 22 = highest tax burden)
Men's Clothing Fabricated
Metals Computers Electronics Scientific
Instruments
State
After-Tax Rate of Return Rank
After-Tax Rate of Return Rank
After-Tax Rate of Return Rank
After-Tax Rate of Return Rank
After-Tax Rate of Return Rank
WA 14.0 22 14.7 20 14.9 19 15.2 15 15.1 13
AL 15.5 1 16.0 1 16.1 1 16.1 1 16.0 1
MD 15.4 2 15.7 2 15.7 2 15.7 2 15.7 2
SC 15.3 3 15.6 3 15.5 5 15.7 2 15.6 3
FL 15.2 4 15.6 3 15.6 3 15.7 2 15.6 3
NY 15.0 5 15.5 5 15.6 3 15.6 5 15.4 5
IL 14.9 7 15.4 6 15.4 6 15.5 6 15.3 6
NH 15.0 5 15.3 7 15.3 7 15.4 8 15.3 6
TN 14.9 7 15.3 7 15.2 9 15.5 6 15.3 6
MA 14.8 10 15.3 7 15.3 7 15.4 8 15.3 6
TX 14.6 13 15.2 10 15.2 9 15.4 8 15.3 6
ME 14.9 7 15.2 10 15.1 12 15.3 11 15.2 11
RI 14.5 16 15.2 10 15.2 9 15.3 11 15.1 13
GA 14.6 13 15.1 13 15.1 12 15.2 15 15.2 11
NC 14.6 13 15.1 13 15.1 12 15.2 15 15.1 13
CA 14.7 11 15.0 17 15.0 18 15.2 15 15.1 13
NJ 14.3 18 15.1 13 15.1 12 15.3 11 15.1 13
WI 14.3 18 15.1 13 15.1 12 15.3 11 15.0 18
VT 14.7 11 15.0 17 14.9 19 15.1 19 15.0 18
OH 14.3 18 15.0 17 15.1 12 15.1 19 15.0 18
PA 14.2 21 14.7 20 14.7 21 14.9 21 14.7 21
CT 14.5 16 14.5 22 14.5 22 14.7 22 14.6 22 Source: Robert Tannenwald, �State Business Tax Climate: How Should It Be Measured and How Important Is It?� New England Economic Review (January/February 1996), 23-38.
25 Tannenwald, �State Business Tax Climate.�
14
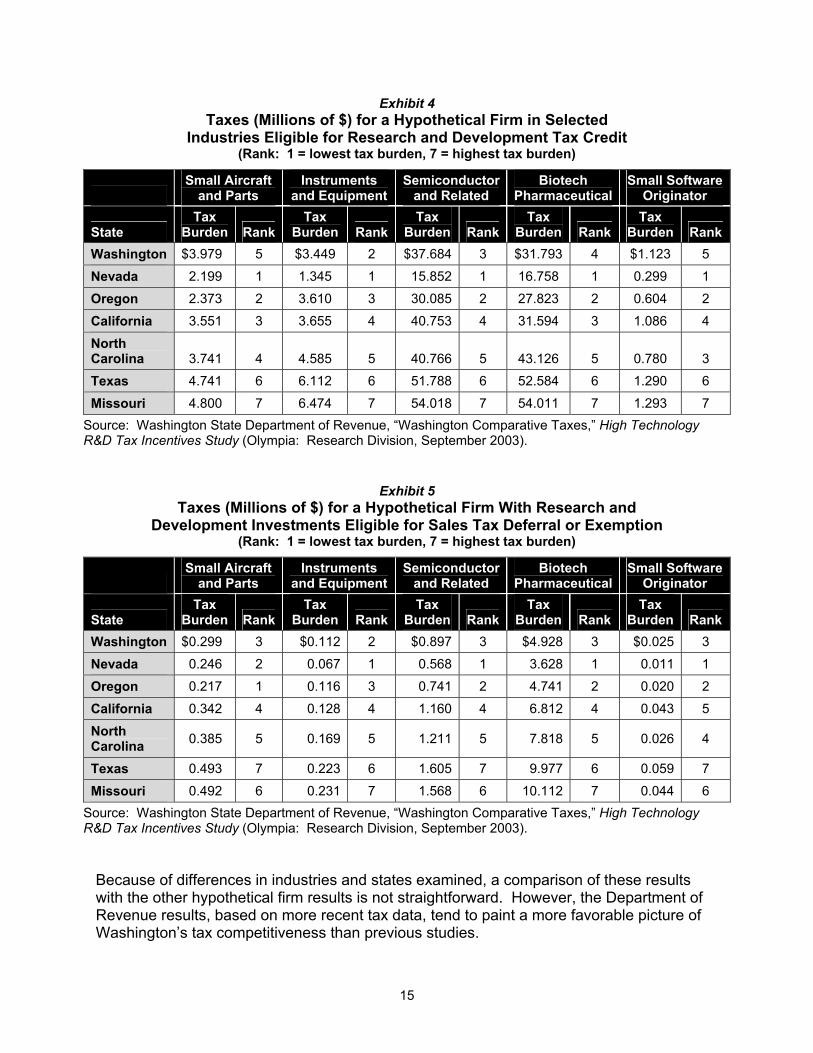
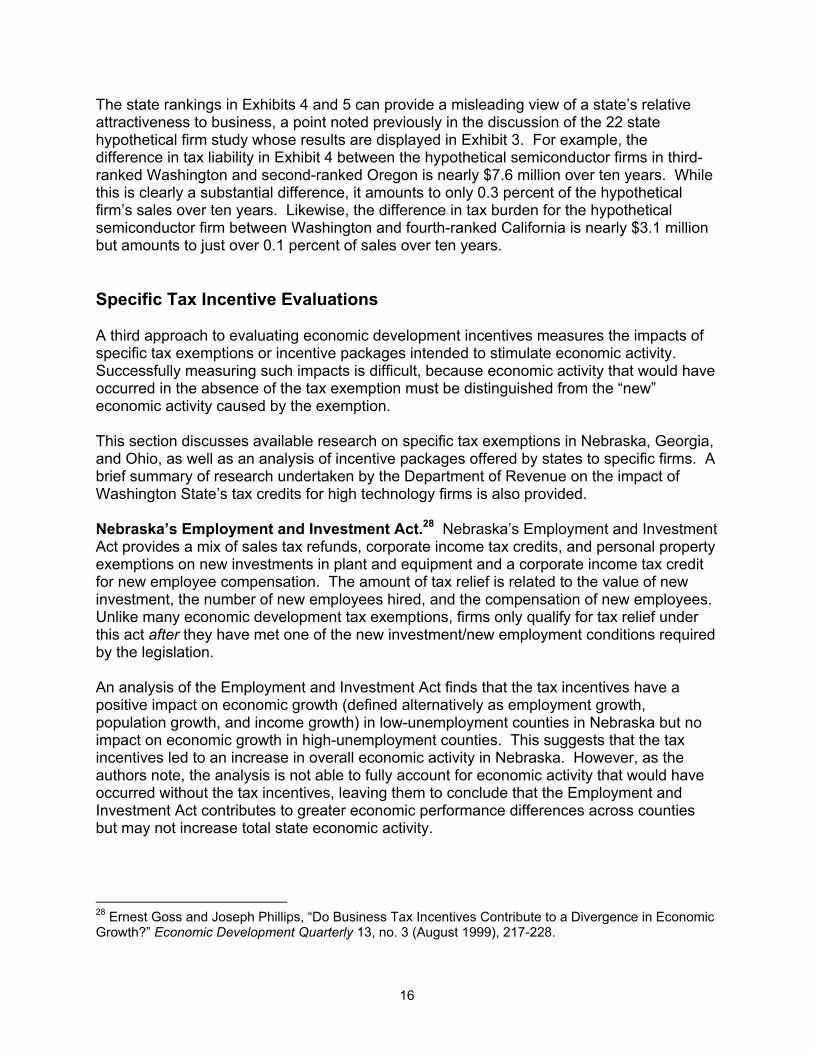
It is important to note that the use of after-tax investment rankings can provide a false sense of a state�s attractiveness to business. For example, the results in Exhibit 3 show that increasing the rate of return by only 0.2 percentage points would shift Washington�s ranking in scientific instruments from thirteenth to sixth, in electronics from fifteenth to eighth, and in computers from nineteenth to twelfth. As was indicated above, the hypothetical firm studies suggest that after-tax investment return may be fairly similar for many states. Because the data used in these studies are from the early 1990s, it is unclear whether the state rankings in Exhibits 2 and 3 remain valid. One researcher points out that the similar tax burdens of hypothetical firms found in an analysis of the Great Lakes states may reflect the fact that perceived competition for firms has caused them to maintain similar tax structures to neighboring states.26 To the extent this correctly describes state behavior, the rankings in Exhibits 2 and 3 may still have some value for comparing states. A more recent hypothetical firm analysis was conducted by the Washington State Department of Revenue based on tax laws in effect as of 2003.27 This study compares tax burdens (incentives based on grants, loans, and infrastructure improvements are not included) across seven states for several high technology industries. Two scenarios are considered in the Department of Revenue study. First, tax burdens for hypothetical firms eligible for Washington�s high technology research and development tax credit are compared for Washington, California, Missouri, Nevada, North Carolina, Oregon, and Texas. Exhibit 4 compares discounted tax burdens over ten years, including the impact of Washington�s high technology research and development tax credit. Washington�s ranking ranges from second in instruments and equipment (with first being the lowest tax burden and seventh the highest tax burden) to fifth for small software and small aircraft and parts firms. Second, tax burdens for hypothetical firms making research and development investments and eligible for Washington�s high technology sales tax deferral/exemption are compared across the seven states. Exhibit 5 compares discounted tax burdens over ten years, including the impact of Washington�s high technology research and development sales tax deferral/exemption. Washington�s ranking is second in instruments and equipment and third for the other hypothetical firms.
26 Papke, �Where We Stand,� 16-17. 27 Washington State Department of Revenue, �Washington Comparative Taxes,� High Technology R&D Tax Incentives Study (Olympia: Research Division, September 2003), 31-42.
15
Exhibit 4 Taxes (Millions of $) for a Hypothetical Firm in Selected
Industries Eligible for Research and Development Tax Credit (Rank: 1 = lowest tax burden, 7 = highest tax burden)
Small Aircraft
and Parts Instruments
and Equipment Semiconductor
and Related Biotech
Pharmaceutical Small Software
Originator
State Tax
Burden Rank Tax
Burden Rank Tax
Burden RankTax
Burden Rank Tax
Burden Rank Washington $3.979 5 $3.449 2 $37.684 3 $31.793 4 $1.123 5
Nevada 2.199 1 1.345 1 15.852 1 16.758 1 0.299 1
Oregon 2.373 2 3.610 3 30.085 2 27.823 2 0.604 2
California 3.551 3 3.655 4 40.753 4 31.594 3 1.086 4
North Carolina 3.741 4 4.585 5 40.766 5 43.126 5 0.780 3
Texas 4.741 6 6.112 6 51.788 6 52.584 6 1.290 6
Missouri 4.800 7 6.474 7 54.018 7 54.011 7 1.293 7 Source: Washington State Department of Revenue, �Washington Comparative Taxes,� High Technology R&D Tax Incentives Study (Olympia: Research Division, September 2003).
Exhibit 5 Taxes (Millions of $) for a Hypothetical Firm With Research and
Development Investments Eligible for Sales Tax Deferral or Exemption (Rank: 1 = lowest tax burden, 7 = highest tax burden)
Small Aircraft
and Parts Instruments
and Equipment Semiconductor
and Related Biotech
Pharmaceutical Small Software
Originator
State Tax
Burden Rank Tax
Burden Rank Tax
Burden RankTax
Burden Rank Tax
Burden Rank Washington $0.299 3 $0.112 2 $0.897 3 $4.928 3 $0.025 3
Nevada 0.246 2 0.067 1 0.568 1 3.628 1 0.011 1
Oregon 0.217 1 0.116 3 0.741 2 4.741 2 0.020 2
California 0.342 4 0.128 4 1.160 4 6.812 4 0.043 5
North Carolina 0.385 5 0.169 5 1.211 5 7.818 5 0.026 4
Texas 0.493 7 0.223 6 1.605 7 9.977 6 0.059 7
Missouri 0.492 6 0.231 7 1.568 6 10.112 7 0.044 6 Source: Washington State Department of Revenue, �Washington Comparative Taxes,� High Technology R&D Tax Incentives Study (Olympia: Research Division, September 2003).
Because of differences in industries and states examined, a comparison of these results with the other hypothetical firm results is not straightforward. However, the Department of Revenue results, based on more recent tax data, tend to paint a more favorable picture of Washington�s tax competitiveness than previous studies.
16
The state rankings in Exhibits 4 and 5 can provide a misleading view of a state�s relative attractiveness to business, a point noted previously in the discussion of the 22 state hypothetical firm study whose results are displayed in Exhibit 3. For example, the difference in tax liability in Exhibit 4 between the hypothetical semiconductor firms in third-ranked Washington and second-ranked Oregon is nearly $7.6 million over ten years. While this is clearly a substantial difference, it amounts to only 0.3 percent of the hypothetical firm�s sales over ten years. Likewise, the difference in tax burden for the hypothetical semiconductor firm between Washington and fourth-ranked California is nearly $3.1 million but amounts to just over 0.1 percent of sales over ten years. Specific Tax Incentive Evaluations A third approach to evaluating economic development incentives measures the impacts of specific tax exemptions or incentive packages intended to stimulate economic activity. Successfully measuring such impacts is difficult, because economic activity that would have occurred in the absence of the tax exemption must be distinguished from the �new� economic activity caused by the exemption. This section discusses available research on specific tax exemptions in Nebraska, Georgia, and Ohio, as well as an analysis of incentive packages offered by states to specific firms. A brief summary of research undertaken by the Department of Revenue on the impact of Washington State�s tax credits for high technology firms is also provided. Nebraska�s Employment and Investment Act.28 Nebraska�s Employment and Investment Act provides a mix of sales tax refunds, corporate income tax credits, and personal property exemptions on new investments in plant and equipment and a corporate income tax credit for new employee compensation. The amount of tax relief is related to the value of new investment, the number of new employees hired, and the compensation of new employees. Unlike many economic development tax exemptions, firms only qualify for tax relief under this act after they have met one of the new investment/new employment conditions required by the legislation. An analysis of the Employment and Investment Act finds that the tax incentives have a positive impact on economic growth (defined alternatively as employment growth, population growth, and income growth) in low-unemployment counties in Nebraska but no impact on economic growth in high-unemployment counties. This suggests that the tax incentives led to an increase in overall economic activity in Nebraska. However, as the authors note, the analysis is not able to fully account for economic activity that would have occurred without the tax incentives, leaving them to conclude that the Employment and Investment Act contributes to greater economic performance differences across counties but may not increase total state economic activity.
28 Ernest Goss and Joseph Phillips, �Do Business Tax Incentives Contribute to a Divergence in Economic Growth?� Economic Development Quarterly 13, no. 3 (August 1999), 217-228.
17
Georgia�s Job Tax Credit.29 The Job Tax Credit provides employers with a credit of up to 50 percent of their Georgia corporate income tax for the creation of new, full-time jobs. Employers must create and maintain a minimum number of jobs for two full years before receiving the credit. Firms in less economically developed counties require fewer new jobs to qualify for the credit than do businesses in faster-growing counties.30 The amount of the credit is also higher for qualifying firms in less-developed counties. An evaluation of the Job Tax Credit noted the relatively low participation rate in the program�only 19 percent of eligible firms applied. This low rate is partly explained by the fact that many Georgia firms have no state corporate income tax liability in any given year, so the credit has no value to them.31 In addition, many firms appear to be unaware of the tax credit program. The evaluation compared employment at firms that did receive the tax credit with employment at firms that were eligible but did not apply for the tax credit. By accounting for business decisions to participate or not participate in the Job Tax Credit program, it is possible to obtain an unbiased estimate of the new jobs created due to the tax credit. The evaluation results indicate that firms that received the credit created between 24 and 28 percent more jobs than did non-participating firms. In other words, for every 100 jobs created by firms receiving the tax credit, 24 to 28 are �new� and would not have been created in the absence of the Job Tax Credit, while 72 to 76 would have been created even in the absence of the credit. This result means that the majority of the tax credit was paid to businesses for jobs that would have been created even if the Job Tax Credit had never existed. By allocating the total value of the tax credits to the new jobs, the evaluation estimates a cost of $2,300 to $2,700 per new job created. Even with the cost of credits for �old� jobs, this is much lower than the per-job cost of incentive packages that have been used to encourage large employers to locate in a particular state. For example, Alabama offered Mercedes-Benz between $57,000 and nearly $170,000 in incentives for each of the 1,500 jobs associated with an auto assembly plant.32
29 Dagney Faulk, �Do State Economic Development Incentives Create Jobs? An Analysis of State Employment Tax Credits,� National Tax Journal 55, no. 2 (June 2002), 263-280; Keith Ihlanfeldt and David Sjoquist, �Conducting an Analysis of Georgia�s Economic Development Tax Incentive Program,� Economic Development Quarterly 15, no. 3 (August 2001), 217-228. 30 A county�s level of economic development is determined annually based on unemployment rate, average manufacturing wage, poverty rate, and per capita income. 31 See Ihlanfeldt and Sjoquist, �Conducting an Analysis.� In any given year, over 75 percent of Georgia firms have no corporate tax liability. Changes to the Job Tax Credit in 2001 addressed this issue by enabling firms with no corporate tax liability to benefit from the credit. 32 The range of per-job costs depends on how the value of the package is calculated. The $57,000 figure is based on the discounted value of the incentives as calculated by Fisher and Peters, and the nearly $170,000 figure is based on the value of the incentives as reported in the press; Fisher and Peters, Industrial Incentives, 208-209. However, as Faulk points out, the multiplier effects associated with a large plant are likely to be greater than those due to a broader employment tax credit, so the true per-job cost of the Mercedes plant is likely to be lower than the estimates mentioned here.
18
Ohio�s Economic Incentives Programs.33 Ohio has five economic development incentive programs ranging from corporate tax credits for hiring new workers to grant money for roadway improvements related to new projects that involve job creation or retention. To evaluate these programs, researchers looked at Ohio firms that announced some type of expansion (increased employment or investment) between 1993 and 1995. About 35 percent of these firms participated in one or more of the incentive programs. As with the Georgia study, the evaluation accounted for differences in businesses that did or did not participate in the incentives program to obtain an unbiased estimate of the relationship between incentives and employment growth. The evaluation found that the various incentives had a positive impact on the employment growth that was announced by businesses. Although all firms� announcements tended to overestimate employment expansions, regardless of participation in the incentives program, the gap between announced and actual employment expansions was larger for firms that received incentives. The study�s authors conclude that businesses appear to exaggerate announced employment expansions to increase the size of the incentives package they receive. However, in examining the actual change in employment, incentives had very little impact. In some cases, incentives were linked to declines in employment compared with the level of hiring that would have occurred in the absence of the incentive programs. The study�s authors suggest this unexpected result may be due to businesses directing additional resources toward gaining tax incentives and away from efforts necessary to expand. Firm-Specific Tax Incentive Packages The Nebraska, Georgia, and Ohio programs are aimed at increasing employment and investment in general. However, many states have used tax and infrastructure incentive packages to persuade a specific firm to site a large plant in a particular community. Recent Washington examples include two bills passed during the 2003 legislative session (HB 2294 and SB 5725) related to an aerospace and a semiconductor firm locating facilities in Washington. To examine the impact of firm-specific packages on regional economic activity, a 1998 study examined 24 firms that made site selection decisions during the 1980s.34 Rather than examining the incentive packages themselves, the analysis looked at how the siting of a large plant affected changes in employment and personal income. In other words, what impact did �winning� a new plant have on the regional economy?
33 Todd Gabe and David Kraybill, �The Effect of State Economic Development Incentives on Employment Growth of Establishments,� Journal of Regional Science 42, no. 4 (November 2002), 703-730. 34 William Fox and Matthew Murray, �Incentives, Firm Location Decisions and Regional Economic Performance,� in H.F. Ladd, Local Government Tax and Land Use Policies in the United States: Understanding the Links (Northampton, MA: Edward Elgar Publishing, 1998), 168-181; Helen Ladd, �Effects of Taxes on Economic Activity,� in H.F. Ladd, Local Government Tax and Land Use Policies in the United States: Understanding the Links (Northampton, MA: Edward Elgar Publishing, 1998), 82-101.
19
Ideally, the economic growth trends of cities selected for new plants would be compared with economic trends for similar cities that were considered for, but did not receive, a new facility. This research design would assure that any differences in, for example, employment growth rates, were due only to the siting of a new plant. Because the study authors do not know which communities were considered in the selection processes, this comparison was not possible. The study indicates that, in most instances, the opening of a new facility had no impact on long-term economic growth trends in the region. Higher levels of employment and personal income associated directly or indirectly with the new plant crowded out a roughly equal amount of economic activity that would have occurred otherwise, leaving long-term employment and income growth rates unchanged. Without being able to compare the growth trends of the cities selected for new plants with those of similar cities that were not selected, there is the possibility that the estimated impacts of new plants on economic growth are biased. This suggests that the study�s conclusions be accepted cautiously. Washington�s High Technology Tax Incentives Washington State provides tax incentives for high technology firms that make expenditures for research and development activities. A credit against the business and occupation tax is allowed for operating expenses, wages and benefits, supplies, and computer expenses for research and development if the expenditures equal at least 0.92 percent of taxable revenue. Sales taxes on structures, machinery, and equipment for research and development purposes are also deferred. For each year the structures or equipment are used for research and development, 12.5 percent of the deferred sales taxes are waived so that all sales tax is waived after eight years of use. A descriptive analysis of these high technology incentives was recently completed and provides mixed conclusions about their impact on economic activity.35 Washington�s share of national employment in 12 high technology sectors has remained essentially constant from 1991 (four years before the tax incentives became effective) through 2000. This could suggest that the tax incentives have not lead to new job creation. On the other hand, Washington�s share of national high technology research and development spending has increased from 0.8 percent in 1995 (the year the incentives were enacted) to 3.7 percent in 2001 and 2.3 percent in 2002. This increase in research
35 Washington State Department of Revenue, �Growth and Diversification,� High Technology R&D Tax Incentives Study, 20-30. A more technical analysis of the impact of the tax incentives on job creation is forthcoming.
20
and development spending could suggest that Washington�s high technology sector has expanded faster than would have been the case in the absence of the tax incentives. The study also uses a hypothetical firm analysis to examine the impact of Washington�s high technology tax incentives relative to six other states (discussed previously). Although the business and occupation tax credit has little impact on Washington�s tax ranking, the sales tax deferral/exemption does improve the state�s tax ranking for firms investing in research and development facilities and equipment. These results suggest that Washington has improved its competitive position among high technology firms planning to build or expand research and development facilities. Conclusions A substantial quantity of research has investigated whether state taxes and tax incentives have any impact on business location decisions and state economic activity. Summarizing the conclusions from three different analytic approaches to this issue suggests that taxes have a relatively small impact on economic activity and business location decisions. Using state-level measures of taxes and economic activity, researchers have generally found a small but statistically significant impact of taxes on economic activity. However, the estimates of this relationship are rather unstable, with some researchers finding impacts of taxes on economic growth both larger and smaller than the �consensus� estimate. There are also indications that, to the extent tax reductions result in employment growth, a substantial share of the long-term employment gains benefit in-migrants rather than existing state residents. The literature using state-level data has also been criticized as not accurately capturing the impact of a state�s tax system on the individual firms whose decisions lead to changes in economic activity. In response to this criticism, some researchers have developed models to examine the tax burden of hypothetical firms and compare them across cities and states. This research shows significant differences in a firm�s after-tax return on investment when looking at the highest-tax and lowest-tax locations. Although the differences between the �best� and �worst� locations are sufficiently large that they could influence decisions on business location or expansion, the combined impact of city and state taxes across most locations is very similar. In other words, most states would need to offer very large tax incentives to improve their �tax competitiveness� in a meaningful way. A third approach has been to evaluate the impact of specific state tax exemptions on economic activity. Although these specific evaluations seem most relevant to determining the likely impacts of a new tax exemption, they also require disentangling economic activity that would have occurred without a new exemption from economic activity caused by the new exemption. The studies summarized above provide a mixed picture, ranging from no impact of tax and other incentives on employment to a positive employment impact. Comparing evaluations of the Georgia and Ohio incentive programs suggests that providing tax reductions after a firm has met a specified employment or investment goal is more likely to increase employment than incentives given on the basis of intended expansions.

21
Taken as a whole, the research suggests that state taxes and tax incentives can have an impact on economic activity. This impact may be weakened or strengthened by the design of a tax incentive program or a state�s business tax burden relative to other states, but it is likely to �be both small and less important than other factors,�36 such as labor costs and productivity.
36 Stephen Mark, Therese McGuire, and Leslie Papke, �The Effect of Taxes on Economic Development,� in Taxing Simply, Taxing Fairly: Full Report of the District of Columbia Tax Revision Commission (Washington, D.C., September 1998).

23
IV. ALL OTHER TAX EXEMPTIONS Following the categories used by the Washington State Department of Revenue, this section considers tax exemptions in these areas:
• Nonprofit organizations: tax exemptions for nonprofit health, social welfare, charitable, religious, and arts and cultural organizations;37
• Intangible financial assets: tax exemptions for stocks, bonds, and other financial
instruments and for other intangible property such as trademarks or patents; • Individuals: tax exemptions for individuals and families; and • Miscellaneous: tax exemptions that do not fall into any of the above groups.
Nonprofit Organizations Two reasons are often cited to justify state tax exemptions for nonprofit entities. First, some nonprofits perform services viewed as relieving what would otherwise be a state or local government burden. Second, many nonprofit organizations provide services that confer a benefit on the community. In either case, the exemption is based on the notion that �the social value of the services performed is at least as great as the revenues foregone.�38 However, a history of property tax exemptions suggests that these reasons were not necessarily the basis of all exemptions in the United States.39 Many were simply extensions of European practices brought by early colonists, in some cases predating the existence of general property or income taxes. In some cases, exemptions for nonprofits reflect pragmatism as well as a notion of subsidizing worthwhile activities. For example, most states follow federal tax rules and definitions for their own income taxes as a way to minimize confusion and administrative costs. As a result, nonprofit organizations that meet federal definitions for income tax exemption are often exempt from state income taxes as well.
37 RCW 84.36.800 defines nonprofit as �an organization, association or corporation no part of the income of which is paid directly or indirectly to its members, stockholders, officers, directors or trustees except in the form of services rendered by the organization, association, or corporation in accordance with its purposes and bylaws and the salary or compensation paid to officers of such organization, association or corporation is for actual services rendered and compares to the salary or compensation of like positions within the public services of the state.� Many states reference the federal definition for nonprofit organizations in chapter 26, section 501(c) of the Internal Revenue Code. 38 Stephen Diamond, �Efficiency and Benevolence: Philanthropic Tax Exemptions in 19th-Century America,� in Property-Tax Exemption for Charities, ed. Evelyn Brody (Washington, D.C.: Urban Institute Press, 2002), 115-144. 39 Ibid.
24
Recent state and local revenue shortfalls have led to questions about the appropriateness of tax exemptions in general and tax exemptions for nonprofits in particular.40 However, the available data indicate that the value of property owned by nonprofits is generally a small fraction of total property value in an area and that this fraction has been fairly constant over time.41 This information suggests, at least as regards the property tax, that the tax exemption for nonprofits is neither large nor growing in most states. This statement would appear to hold for Washington, where nonprofit tax exemptions for all taxes accounted for 1 percent of total tax exemptions and 1.5 percent of property tax exemptions during the 1999�2001 biennium.42 A relatively small amount of research addresses policy issues related to tax exemptions for nonprofit organizations. In part, this limited body of work is attributable to data and measurement problems. For example, if an exemption is promoted on the basis of the social benefit of services provided by a charity, determining the actual value of those benefits can be difficult. However, it may be possible to determine whether a charity provides services primarily to in-state residents or to persons in other states or countries. The general location of persons served by a charity provides some indication as to the level of benefits to be received by state residents and whether the exemption can be justified based on those benefits. Analysis of the �relief of government burden� rationale for tax exemptions is also problematic. It may be difficult to determine, in the absence of a service provided by a nonprofit organization, the level at which state or local governments would provide the service or if they would provide it at all. Given these uncertainties, it is a challenge to set the value of a tax exemption compared with the value of the government burden that has been �relieved� by a nonprofit agency. One aspect of tax exemptions for nonprofit organizations that has received attention from researchers relates to the entry of nonprofits into various commercial activities. Two studies found that nonprofit firms account for a greater share of the market in areas where local property and corporate tax rates are highest.43 Local property and corporate tax rates have
40 Fred Stokeld, �Charities Face Exemption Challenges at All Levels, Panel Warns,� Exempt Organization Tax Review 11 (1995), 924-925; Evelyn Brody, �Introduction,� in Property-Tax Exemption for Charities; and Dick Netzer, �Local Government Finance and the Economics of Property-Tax Exemption,� in Property-Tax Exemption for Charities ed. Evelyn Brody (Washington, D.C.: Urban Institute Press, 2002). 41 It must be noted that assessors are unlikely to expend much effort to value exempt property and, therefore, the data used to support these conclusions may be subject to error. However, two different data sources suggest that nonprofit-owned property accounts for a small share of assessed value in most areas; see Netzer, �Local Government Finance.� 42 Calculations using data from �Special Analyses of Tax Programs,� (Washington State Department of Revenue, 2000), <http://dor.wa.gov/docs/reports/2000/Tax_Exemptions_2000/stats_contents.asp>, accessed December 18, 2003. 43 Henry Hansmann, �The Effect of Tax Exemption and Other Factors on the Market Share of Nonprofit versus For-Profit Firms,� National Tax Journal 40, no. 1 (1987), 71-82; David Gulley and Rexford Santerre, �The Effect of Tax Exemption on the Market Share of Nonprofit Hospitals,� National Tax Journal 46, no. 4 (December 1993), 477-486.
25
also been found to affect the mix of nonprofit funding sources, with higher tax rates associated with a greater share of nonprofit funding from commercial activities.44 The higher taxes are, the more valuable are nonprofit tax exemptions for property and corporate taxes. Therefore, the above findings suggest that tax exemptions give nonprofits an economic advantage over for-profit firms, particularly in higher-tax states. Intangible Financial Assets Intangible financial assets include wealth in such forms as stocks, bonds, bank deposits, and cash. They may also include assets such as trademarks, brand names, logos, and copyrights. In the nineteenth century, the property tax was often applied to all property, real as well as intangible. However, by the end of World War II, most states exempted intangibles and household goods from property taxes.45 One reason for the widespread exemption of intangibles is administrative: intangible assets can be difficult for local assessors to value. The ease of moving intangible assets (for example, by creating an out-of-state trust) suggests that compliance with intangibles taxes could be low.46 Economic arguments have also been used to justify tax exemptions for intangible assets. In arguing for repeal of Florida�s intangibles tax, one researcher claimed that the tax falls most heavily on retirees who tend to pay more in state taxes than the value of state services they use. To the extent that the intangibles tax discourages retirees from moving to Florida, it could slow the growth of state revenues.47 Recent research finds a weak negative impact of state personal income and estate taxes on elderly migration to a state but did not look specifically at intangibles taxes.48 Individuals Tax exemptions for individuals are often used to reduce the tax burden on low income persons, reduce the costs of necessities (e.g., food and prescription drugs), or encourage desirable activities such as home ownership. In some cases, individual tax exemptions are justified on grounds of administrative simplicity. For example, many states exempt �casual and isolated sales,� such as garage sales, from the retail sales tax because of the difficulties in registering casual sellers and collecting taxes from them.
44 Joseph Cordes and Burton Weisbrod, �Differential Taxation of Nonprofits and the Commercialization of Nonprofit Revenues,� Journal of Policy Analysis and Management 17, no. 2 (Spring 1998), 195-214. 45 Netzer, �Local Government Finance.� As of June 2003, only Alabama, Florida, Kentucky, Pennsylvania, and West Virginia had a property tax on intangibles; see Randall Holcombe, �Florida�s Intangibles Tax: The Case for Repeal,� Policy Report #40 (Tallahassee, FL: The James Madison Institute, June 2003). 46 See Netzer, �Local Government Finance,� and Holcombe, �Florida�s Intangibles Tax.� 47 Holcombe, �Florida�s Intangibles Tax.� 48 Karen Conway and Andrew Houtenville, �Elderly Migration and State Fiscal Policy: Evidence From the 1990 Census Migration Flows,� National Tax Journal 54, no. 1 (March 2001), 103-124.
26
In Washington State, some individual tax exemptions are the result of voter initiatives. One example is the �trade-in� exemption, which applies the sales tax to the price of an item after deducting the value of a similar item used as a trade-in. Given the many goals of individual tax exemptions, identifying desired outcomes and measuring their impacts is difficult. Some individual exemption goals are inconsistent. For example, a tax exemption for low-income persons may be viewed as making the tax system fairer but also requires an income verification process that is administratively complex. These goals may also be difficult to measure objectively: Does reducing taxes for one group make the tax system more fair or less fair? Is reducing administrative burdens for individuals or government more important? One outcome that has been examined relates to �vertical equity,� or a comparison of taxes paid across individuals of various income levels. For example, a study of Nevada�s tax structure examined whether certain tax exemptions made the overall tax system more or less regressive (i.e., did the percentage of income paid in taxes increase or decrease for low-income households in comparison with higher income households).49 More recently, a tax simulation model was developed for the Washington State Tax Structure Committee to examine vertical equity under a number of hypothetical tax scenarios.50 Miscellaneous This category, as the name implies, includes exemptions not easily classified elsewhere. In Washington, property tax exemptions for cemeteries and for fire departments built on private land are examples that fall into this group. Conclusion The goals of tax exemptions discussed in this section vary from reducing administrative burdens on taxpayers to encouraging activities that benefit the community. Because outcomes associated with these desired goals are often hard to measure, the data needed for analysis purposes are often lacking, and little research exists to guide policy in this area. In attempting to assess the value or usefulness of such exemptions, it is important to consider two points. First, as noted above, data to measure or analyze the desired goals of these exemptions are often difficult to obtain or, in some cases, completely unavailable. Therefore, any assessment of tax exemptions will need to consider all possible sources of information, both qualitative and quantitative, that may exist. Second, it is important to consider the potential unintended consequences of tax exemptions. For example, research suggests that the combination of tax exemptions for
49 Bradford Case and Robert Ebel, �Using State Consumer Tax Credits for Achieving Equity,� National Tax Journal 42, no. 3 (September 1989), 323-337. 50 Sim Tax Model, Washington State Tax Structure Study, available at <http://dor.wa.gov/content/WAtaxstudy/Tax_Design.htm>, accessed December 16, 2003.

27
nonprofit organizations and high tax rates encourages nonprofits to engage in commercial activities. In turn, this provides nonprofits with a competitive advantage over for-profit businesses.51 The possible negative effects on existing firms should be considered as well as the expected benefits to be provided when analyzing tax exemptions for nonprofit organizations.
51 Hansmann, �The Effect of Tax Exemption and Other Factors�; Gulley and Santerre, �The Effect of Tax Exemption on the Market Share of Nonprofit Hospitals�; Cordes and Weisbrod, �Differential Taxation of Nonprofits.�


