
Articleshttps://doi.org/10.1038/s41566-018-0112-9
Diboron compound-based organic light-emitting diodes with high efficiency and reduced efficiency roll-offTien-Lin Wu 1, Min-Jie Huang1, Chih-Chun Lin1, Pei-Yun Huang1, Tsu-Yu Chou2, Ren-Wu Chen-Cheng2, Hao-Wu Lin 2*, Rai-Shung Liu1* and Chien-Hong Cheng 1*
1Department of Chemistry, National Tsing Hua University, Hsinchu, Taiwan. 2Department of Materials Science and Engineering, National Tsing Hua University, Hsinchu, Taiwan. *e-mail: [email protected]; [email protected]; [email protected]
© 2018 Macmillan Publishers Limited, part of Springer Nature. All rights reserved.
SUPPLEMENTARY INFORMATION
In the format provided by the authors and unedited.
NaTuRe PHoToNiCS | www.nature.com/naturephotonics

S-1
Supplementary Information
Diboron compound-based organic light-emitting diodes with
high efficiency and reduced efficiency roll-off
Tien-Lin Wu1, Min-Jie Huang1, Chih-Chun Lin1, Pei-Yun Huang1, Tsu-Yu, Chou2,
Ren-Wu Chen-Cheng2, Hao-Wu Lin2*, Rai-Shung Liu1* and Chien-Hong Cheng1*
1Department of Chemistry, National Tsing Hua University, Hsinchu, Taiwan.
2Department of Materials Science and Engineering, National Tsing Hua University, Hsinchu,
Taiwan.
*e-mail: [email protected]; [email protected]; [email protected]

S-2
Table of Contents:
Page
A. Synthetic procedure, characterization and NMR spectra…………………S-3
B. Single-crystal X-ray diffraction……………………………………………S-8
C. Photophysical, electrochemical and thermal properties………………….…S-10
D. OLED and lifetime device performance………………………………S-17
E. Computational data…………………………………………………………S-20
F. References.……………………………………………………………...S-26

S-3
A. Synthetic procedure, characterization and NMR spectrum
Scheme 1. Synthesis of 9-(4-bromo-3,5-dimethylphenyl)-9H-carbazole.
Synthesis of 9-(4-bromo-3,5-dimethylphenyl)-9H-carbazole. To a stirred solution of 2-bromo-
5-iodo-1,3-dimethylbenzene (2.00 g, 6.43 mmol), carbazole (1.18 g, 7.07 mmol), Cu (1.25 g,
19.68 mmol), K2CO3 (2.72 g, 19.68 mmol) and N,N-dimethylformamide (16 mL) was added under
a nitrogen atmosphere. The system was evacuated and purged with nitrogen three times and the
mixture was heated and stirred at 130 °C for 24 h. The reaction mixture was filtered through Celite
and washed with dichloromethane (20 mL). Solvent was evaporated under reduced pressure and
then purified by column chromatography (hexane / dichloromethane (10:1)) to afford the product
as a white solid in 91% yield. 1H NMR (400 MHz, CDCl3): δ 8.11 (d, J = 7.6 Hz, 2H), 7.41-7.35
(m, 4H), 7.28-7.24 (m, 4H), 2.50 (s, 6H). 13C NMR (100 MHz, CDCl3): δ140.7, 140.1, 136.1,
126.6, 126.1, 125.9, 123.3, 120.3, 119.9, 109.7, 24.0. HRMS Calcd for C20H16BrN: 349.0466.
Found: 349.0463.
Figure 1. 1H NMR spectrum of 9-(4-bromo-3,5-dimethylphenyl)-9H-carbazole.

S-4
Figure 2. 13C NMR spectrum of 9-(4-bromo-3,5-dimethylphenyl)-9H-carbazole.
Scheme 2. Synthesis of 9-(4-bromo-3,5-dimethylphenyl)-3,6-di-tert-butyl-9H-carbazole.
Synthesis of 9-(4-bromo-3,5-dimethylphenyl)-3,6-di-tert-butyl-9H-carbazole. A procedure
similar to the synthesis of 9-(4-bromo-3,5-dimethylphenyl)-9H-carbazole was used for the
synthesis of 9-(4-bromo-3,5-dimethylphenyl)-3,6-di-tert-butyl-9H-carbazole using 2-bromo-5-
iodo-1,3-dimethylbenzene (2.00 g, 6.43 mmol), carbazole (1.98 g, 7.07 mmol), Cu (1.25 g, 19.7
mmol), K2CO3 (2.72 g, 19.68 mmol) and N,N-dimethylformamide (16 mL) in 92% yield. White
solid. 1H NMR (400 MHz, CDCl3): δ 8.10 (d, J = 1.2 Hz, 2H), 7.44 (dd, J = 1.2, 8.8 Hz, 2H), 7.30
(d, J = 8.8 Hz, 2H), 7.25 (s, 2H), 2.48 (s, 6H), 1.44 (s, 18H). 13C NMR (100 MHz, CDCl3): δ
142.9, 139.9, 139.1, 136.6, 126.2, 125.6, 123.6, 123.3, 116.2, 109.1, 34.7, 32.0, 24.0. HRMS
Calcd for C28H32BrN: 461.1718. Found: 461.1725.

S-5
Figure 3. 1H NMR spectrum of 9-(4-bromo-3,5-dimethylphenyl)-3,6-di-tert-butyl-9H-carbazole.
Figure 4. 13C NMR spectrum of 9-(4-bromo-3,5-dimethylphenyl)-3,6-di-tert-butyl-9H-carbazole.

S-6
Figure 5. 1H NMR spectrum of CzDBA.
Figure 6. 13C NMR spectrum of CzDBA.

S-7
Figure 7. 1H NMR spectrum of tBuCzDBA.
Figure 8. 13C NMR spectrum of tBuCzDBA.

S-8
B. Single-crystal X-ray diffraction
Figure 9. a) The x-ray structure of CzDBA. b) The crystal packing of CzDBA viewing from b
axis. c) A side view of two CzDBA molecules, showing a shifted π–π stacking.
Figure 9 displays a dihedral angle between the DBA core and the phenylene bridge of 78°, and a
dihedral angle between the carbazole plane and the phenylene bridge of 70°. CzDBA was packed
in a C2/c space group.

S-9
Table 1. Crystal data and structure refinement for CzDBA.
Empirical formula C52 H40 B2 N2
Formula weight 714.48
Temperature 200(2) K
Wavelength 0.71073 Å
Crystal system Monoclinic
Space group C 2/c
Unit cell dimensions a = 26.1224(8) Å = 90°
b = 8.3077(3) Å = 106.476(2)°
c = 18.9832(6) Å = 90°
Volume 3950.5(2) Å 3
Z 4
Density (calculated) 1.201 Mg/m3
Absorption coefficient 0.068 mm-1
F(000) 1504
Crystal size 0.42 x 0.26 x 0.09 mm3
Theta range for data collection 2.72 to 25.05°
Index ranges -30<=h<=30, -8<=k<=9, -22<=l<=21
Reflections collected 12578
Independent reflections 3422 [R(int) = 0.0340]
Completeness to theta = 25.05° 97.8%
Absorption correction multi-scan
Max. and min. transmission 0.9939 and 0.9718
Refinement method Full-matrix least-squares on F2
Data / restraints / parameters 3422 / 0 / 253
Goodness-of-fit on F2 1.018
Final R indices [I>2sigma(I)] R1 = 0.0558, wR2 = 0.1639
R indices (all data) R1 = 0.0782, wR2 = 0.1786
Largest diff. peak and hole 0.356 and -0.247 e. Å -3
The crystallographic data for CzDBA and tBuCzDBA deposited on CCDC 1515214 and 1570473, respectively.

S-10
C. Photophysical, electrochemical and thermal properties
Photophysical characterization
Figure 10. Absorption spectra of a) CzDBA and b) tBuCzDBA measured at room temperature in
various solvents, and fluorescence spectra of c) CzDBA and d) tBuCzDBA at room temperature
measured in various solvents.
Lippert–Mataga analysis for the solvatochromic effect. Both DBA derivatives show an
absorption band at ~350 nm, a π to π* transition and a shoulder band around 430 nm assigned as
the ICT from the donor groups to DBA moiety. They exhibit clear solvatochromic shift of the
fluorescence spectra from green emissions 532 and 553 nm in toluene to orange-red emissions
601 and 628 nm in dichloromethane. The dependence of the Stokes shift between the absorbance
and PL spectra in each polar solvent can be constructed by the Lippert–Mataga equation: [1]
Stokes shift(𝛎𝐚 − 𝛎𝐩) = [2 (μ
𝑒− μ
𝑔)
ℎ𝑐a3] 𝑓(𝛆, 𝐧) + 𝑐𝑜𝑛𝑠𝑡.
300 400 5000.0
0.5
1.0
No
rma
lize
d I
nte
nsity (
a.u
.)
Wavelength (nm)
Toluene
Ethyl ether
Ethyl Acetate
Tetrahydrofuran
Dichloromethane
a
CzDBA
500 600 700 8000.0
0.5
1.0
Norm
aliz
ed
In
ten
sity (
a.u
.)
Wavelength (nm)
Toluene
Ethyl ether
Ethyl Acetate
Tetrahydrofuran
Dichloromethane
c
CzDBA
300 400 5000.0
0.5
1.0
Norm
aliz
ed
In
ten
sity (
a.u
.)
Wavelength (nm)
Toluene
Ethyl ether
Ethyl Acetate
Tetrahydrofuran
Dichloromethane
b
tBuCzDBA
500 600 700 8000.0
0.5
1.0N
orm
aliz
ed
In
ten
sity (
a.u
.)
Wavelength (nm)
Toluene
Ethyl ether
Ethyl Acetate
Tetrahydrofuran
Dichloromethane
d
tBuCzDBA

S-11
In the Lippert-Mataga formalism, ε and n denote the dielectric constant and the refractive index
of solvent, respectively. h is Planck’s constant, c is the speed of light. a is Onsager cavity radius.
μg and μe are dipole moments in the ground state and the excited state, respectively. The
orientation polarizability f(ε,n) is defined as follows:
𝒇(𝛆, 𝐧) = [𝛆 − 𝟏
𝟐𝛆 + 𝟏] − [
𝐧𝟐 − 𝟏
𝟐𝐧𝟐 − 𝟏]
Table 2. The UV-vis, PL data and Stokes shift for DBA compounds in different solvents.
Solvent
[1.0×10⁻⁵ M]
εa) na) f(ε,n)a) Absmax
[nm]b)
PLmax
[nm]b)
νa - νp
[cm-1]b)
Absmax
[nm]c)
PLmax
[nm]c)
νa - νp
[cm-1]c)
Toluene 2.4 1.497 0.0150 342 532 10442 348 553 10652
Diethyl ether 4.3 1.352 0.1659 342 551 11091 348 577 11405
Ethyl acetate 6.0 1.357 0.1995 342 575 11848 348 606 12234
Tetrahydrofuran 7.6 1.407 0.2098 342 594 12405 348 617 12528
Dichloromethane 8.9 1.424 0.2169 344 601 12431 350 628 12648
a) The ε and n values are obtained from http://www.stenutz.eu/chem/solv23.php. b) Absorption maximum (Absmax),
fluorescence maximum (PLmax) and Stokes shift (νa - νp) of CzDBA in different solvents. c) Absorption maximum
(Absmax), fluorescence maximum (PLmax) and Stokes shift (νa - νp) of tBuCzDBA in different solvents.
Figure 11. Lippert-Mataga plots for a) CzDBA and b) tBuCzDBA.
Based on the Lippert-Mataga equation calculated and performed above, the ∆μ (μe - μg) was
estimated via the linear slope from the Lippert-Mataga plots. For CzDBA and tBuCzDBA, the
slopes are 9240.7 cm-1 and 9358.9 cm-1, respectively. Thus, the singlet excited state exhibits a
larger dipole moment than that of the ground state for both compounds due to the intramolecular
charge transfer character of the excited state.
0.0 0.1 0.2
4.0k
8.0k
12.0k
16.0k CzDBA
Sto
ke
s s
hift
(cm
-1)
f
y = 9240.7x + 10152
a
0.0 0.1 0.2
4.0k
8.0k
12.0k
16.0k
tBuCzDBA
Sto
ke
s s
hift
(cm
-1)
f
y = 9358.9x + 10383
b

S-12
Figure 12. Phosphorescence spectra of 50-nm-thick doped film (10% DBA compound in CBP)
measured at different delayed times (0.5, 1.0 and 6.25 ms) for a) CzDBA and b) tBuCzDBA at
77 K. The spectra are essentially identical confirming that they are from the T1 state emission.
Table 3. Energy levels of S1 and T1.
Calculation Experiment
S1
[eV]a)
T1
[eV]a)
EST
[eV]a)
S1
[eV]b)
T1
[eV]c)
EST
[eV]d)
CzDBA 2.770 2.731 0.039 2.629 2.596 0.033
tBuCzDBA 2.651 2.625 0.026 2.486 2.464 0.022
a) The energy levels of S1 and T1 and the energy gaps were calculated by TD-DFT at BMK/6-31G* level. b) The singlet
energy level was calculated from the onset of the fluorescence spectrum of the co-doped film (10% DBA compound:
90% CBP). c) The triplet energy level was calculated from the onset of the phosphorescence spectrum of co-doped
film (10% DBA compound: 90% CBP). d) The energy gap between S1 and T1.
Figure 13. Comparison of the emission of a) CzDBA and b) tBuCzDBA in the doped films (10%
DBA compound: 90% CBP) and neat films. The emission bands in the neat films were slightly
red-shifted (16 and 8 nm, respectively) compared with those in the doped films.
400 500 600 7000.0
0.5
1.0
Inte
nsity (
a.u
.)
Wavelength (nm)
0.5 ms
1 ms
6.25 ms
tBuCzDBA
b
400 500 600 7000.0
0.5
1.0In
ten
sity (
a.u
.)
Wavelength (nm)
0.5 ms
1 ms
6.25 ms
CzDBA
a
500 5500.0
0.5
1.0
16 nm Red-shift
Inte
nsity (
a.u
.)
Wavelength (nm)
doped film
neat film
CzDBA
a
500 550 6000.0
0.5
1.0
8 nm Red-shift
Inte
nsity (
a.u
.)
Wavelength (nm)
doped film
neat film
b
tBuCzDBA

S-13
Table 4. Photoluminescence quantum yields (PLQYs) of CzDBA and tBuCzDBA in toluene and
thin films.
QYoxygen-bubbling
[%]a)
QY
[%]b)
QY degassing
[%]c)
QYdoped film
[%]d)
QYneat film
[%]e)
CzDBA 2.6 8.7 14.0 100 90.6
tBuCzDBA 2.5 7.4 11.9 86.0 84.0
a) Quantum yield in toluene solution with oxygen bubbling, estimated using 9,10-diphenylanthracence as the standard.
b) Quantum yield in toluene solution without degassing. c) Quantum yield in toluene solution with degassing.
d) Absolute total PL quantum yield in a 50-nm-thick co-doped film (10% DBA compound: 90% CBP) using an
integrating sphere. e) Absolute total PL quantum yield in each 50-nm-thick neat film using an integrating sphere.
Figure 14. Fluorescence and phosphorescence spectra at 77 K of a) CzDBA and b) tBuCzDBA
in toluene (1×10⁻⁵ M). The onset energy of fluorescence and phosphorescence spectra were used
to determine the S1 and T1 energy level. The ΔEST measured in toluene were 22 and 11 meV,
respectively for CzDBA and tBuCzDBA.
Transient PL measurement
Figure 15. Expanded decay curves of a) 10% CzDBA and b) 10% tBuCzDBA in CBP. Displayed
in the insets are their prompt decay curves in nanosecond scale.
500 6000.0
0.5
1.0
No
rma
lize
d I
nte
nsity (
a.u
.)
Wavelength (nm)
Flou, 77 K
Phos, 77 K
tBuCzDBA
b
500 6000.0
0.5
1.0
No
rma
lize
d I
nte
nsity (
a.u
.)
Wavelength (nm)
Fluo, 77 K
Phos, 77 K
CzDBA
a
0.0 0.5 1.0 1.5 2.010
-3
10-2
10-1
100
No
rma
lize
d I
nte
nsity (
a.u
.)
77 K
100 K
150 K
200 K
250 K
300 K
Time (μ s)
tBuCzDBA
b
0.0 0.5 1.0 1.5 2.010
-3
10-2
10-1
100
No
rma
lize
d I
nte
nsity (
a.u
.)
77 K
100 K
150 K
200 K
250 K
300 K
Time (μ s)
CzDBA
a
0 40 8010
-2
10-1
100
Inte
nsity (
a.u
.)
Time (ns)
300 K
0 40 8010
-2
10-1
100
Inte
nsity (
a.u
.)
Time (ns)
300 K

S-14
Figure 16. a) PL decay curves of CzDBA neat film (τp: 34 ns, τd: 1.0 μs) and tBuCzDBA neat
film (τp: 36 ns, τd: 1.2 μs) at 300 K. The delayed lifetimes of the emitters suffer only small
reduction compared to the reported literature.[2] b) PL decay curves of CzDBA in 1×10⁻⁵ M toluene
(τp: 92 ns, τd: 3.7 μs) and tBuCzDBA in 1×10⁻⁵ M toluene (τp: 109 ns, τd: 2.7 μs) at 300 K.
Fitting method. The fitting results are given by following equation:
𝑅(t) = 𝐵1𝑒(−𝑡/𝜏1) + 𝐵2𝑒(−𝑡/𝜏2) + 𝐵3𝑒(−𝑡/𝜏3)
Table 5. Fitting results of CzDBA and tBuCzDBA.
Condition τ1 = τp B1 τ2 B2 τ3 B3
[ns]c) [value] [μs]d) [value] [μs] [value]
CzDBAa) Doped film 22 20942 0.17 2160 3.81 508
tBuCzDBAa) 10% in CBP 34 23318 0.29 2766 3.22 414
CzDBAa) Neat film
34 41782 0.23 6237 3.11 161
tBuCzDBAa) 36 43203 0.25 6410 3.90 155
CzDBAb) Solution 92 9769 3.66 137 - -
tBuCzDBAb) 1×10⁻⁵ M toluene 109 9703 2.68 76 - -
a) The prompt and delayed component is best-fitted by three-exponentials for 10% CzDBA and 10% tBuCzDBA in
CBP or neat film (30 nm). b) The prompt and delayed component is best-fitted by two-exponentials for CzDBA and
tBuCzDBA in toluene (10-5 M).
To calculate the average delayed lifetime, we adopted the following equation:
τ𝑎𝑣
=[∑ 𝐵𝑖τ𝑖
2]
[∑ 𝐵𝑖τ𝑖], where B1 and τ1 are not included.
0 5 10
10-3
10-2
10-1
100
No
rma
lize
d I
nte
nsity (
a.u
.) CzDBA-neat film
tBuCzDBA-neat film
Time (μ s)
a
0 5 10 1510
-3
10-2
10-1
100
No
rma
lize
d I
nte
nsity (
a.u
.)
Time (μ s)
CzDBA-solution
tBuCzDBA-solution
b

S-15
The RISC rate constants (kRISC) of CzDBA and tBuCzDBA were determined by using a reported
method,[3] and kRISC is expressed as the following formula:
𝑘𝑝 = 𝛷𝑝/𝜏𝑝
𝛷𝑝 + 𝛷𝑑 = 𝑘𝑝/(𝑘𝑝 + 𝑘𝐼𝐶)
𝛷𝑝 = 𝑘𝑝/(𝑘𝑝 + 𝑘𝐼𝐶 + 𝑘𝐼𝑆𝐶)
𝛷𝐼𝑆𝐶 = 𝑘𝐼𝑆𝐶/(𝑘𝑝 + 𝑘𝐼𝐶 + 𝑘𝐼𝑆𝐶)
𝑘𝑑 = 𝛷𝑑/(𝛷𝐼𝑆𝐶𝜏𝑑)
𝑘𝑅𝐼𝑆𝐶 =𝑘𝑝𝑘𝑑
𝑘𝐼𝑆𝐶
𝛷𝑑
𝛷𝑝
Table 6. Detailed photophysical data and rate constants of CzDBA and tBuCzDBA.
Φp Φd kp kd kIC kISC kRISC ΔEST
[%]c) [%]c) [106 s-1]d) [105 s-1]e) [106 s-1]f) [107 s-1]g) [105 s-1]h) [meV]i)
CzDBAa) 16.5 83.5 7.50 3.13 0 3.80 3.13 54
tBuCzDBAa) 23.3 62.7 6.85 4.10 1.12 2.14 3.52 44
CzDBAb) 9.0 5.0 0.98 0.38 6.01 0.39 0.053 56
tBuCzDBA b) 10.0 1.9 0.92 0.44 6.79 0.15 0.052 50
a) 10% DBA compounds measured in CBP film (30 nm) at 300 K. b) DBA compounds measured in toluene (1×10⁻⁵
M) at 300 K. c) The prompt fluorescent (Φp) component and the delayed fluorescent (Φd) component of PLQY. d) The
rate constant of prompt component (kp). e) The rate constant of delayed component (kd). f) The rate constant of internal
conversion (kIC). g) The rate constant of intersystem crossing (kISC). h) The rate constant of reverse intersystem crossing
(kRISC). i) Calculated using equation: kd = (1/3)[kp × exp(−ΔEST/RT)], reported by Adachi et al.[4]
Photoelectron spectroscopy
Figure 17. Photoelectron spectra (AC-2) of a) CzDBA and b) tBuCzDBA neat films.
5.0 5.5 6.0
0
20
40 tBuCzDBA
(Yie
ld[c
ps])
1/2
Incident photon energy (eV)
b
5.88 eV
5.0 5.5 6.0
0
10
20
5.93 eV
CzDBA
(Yie
ld[c
ps])
1/2
Incident photon energy (eV)
a

S-16
Cyclic voltammetry
Figure 18. Cyclic voltammograms of CzDBA and tBuCzDBA. The oxidation was measured in
dichloromethane, while the reduction was in tetrahydrofuran.
For CV measurement from CzDBA and tBuCzDBA, the bipolar properties of these two
compounds were observed by the oxidation/reduction potentials of cyclic voltammetry in solution.
the HOMO levels are -5.57 and -5.48 eV, determined from their oxidation potentials,[5] and the
LUMO levels are -3.14 and -3.11 eV, respectively, obtained from the reduction potentials. In
addition, the gap between the oxidation and reduction potential of each compound gives the
energy difference, which is comparable to the optical Eg values, 2.48 and 2.39 eV, respectively.
The HOMO level of tBuCzDBA bearing two tert-butyl substituents on each carbazole group is
higher than that of CzDBA, the trend is also closed to the photoelectron results. However, their
LUMO levels determined by cyclic voltammetry, are quite close likely due to the successful
separation of HOMO/LUMO distribution.
Thermal properties
Figure 19. a) Thermal gravimetric analysis and b) differential scanning calorimetry (DSC)
analysis of CzDBA (black) and tBuCzDBA (red).
200 400 600 8000
50
100
Norm
aliz
ed m
ass r
em
ain
ing (
%)
Temperature (oC)
CzDBA
tBuCzDBA
a
100 150
Endoth
erm
ic
CzDBA
tBuCzDBA
b
Temperature (oC)
CzDBA
-1.5 -1.0 -0.5 0.00.0 0.5 1.0 1.5
tBuCzDBA
Potential (V)
Curr
en
t (A
)

S-17
D. OLED and lifetime device performance
Figure 20. The molecular structures of materials used in the devices.
In the devices A and B, N,N'-bis(1-naphthyl)-N,N'-diphenyl-1,1'-biphenyl-4,4'-diamine (NPB) is
the hole transporter, tris(4-(9H-carbazol-9-yl)phenyl)amine (TCTA) acts as an electron/exciton
blocker to prevent exciton diffusion to the NPB layer, CBP is the host in which CzDBA and
tBuCzDBA were doped and 1,3,5-tri(m-pyrid-3-yl-phenyl)benzene (TmPyPB) is the electron
transporter. In the devices C, 1,4,5,8,9,11-hexaazatriphenylene hexacarbonitrile (HAT-CN) is
hole injection material and 9,9′-diphenyl-6-(9-phenyl-9H-carbazol-3-yl)-9H,9′H-3,3′-bicarbazole
(Tris-PCz) is the hole transporter. 3,3'-di(9H-carbazol-9-yl)-1,1'-biphenyl (mCBP) is the host in
which CzDBA was doped. 2,4,6-tris(biphenyl-3-yl)-1,3,5-triazine (T2T) acts as an hole/exciton
blocker to prevent exciton diffusion to the 2,7-di(2,2'-bipyridin-5-yl)triphenylene (BPy-TP2)
electron transporting layer.

S-18
Table 7. External quantum efficiency and current efficiency of representative devices A and B at
1000 cd m-2, 3000 cd m-2 and 5000 cd m-2 with the corresponding efficiency roll-off values.
Device EQEmax
[%]a)
EQE1000
[%]b)
EQE3000
[%]c)
EQE5000
[%]d)
CEmax
[cd A-1]a)
CE1000
[cd A-1]b)
CE3000
[cd A-1]c)
CE5000
[cd A-1]d)
A 38.0 37.9
(0.3%)
36.2
(4.7%)
34.1
(10.3%) 141.0
140.6
(0.3%)
134.4
(4.7%)
127.1
(10.3%)
B 31.8 30.9
(2.3%)
27.6
(13.2%)
25.5
(19.9%) 129.4
125.7
(2.3%)
112.32
(13.2%)
103.7
(19.9%)
a) EQEmax and CEmax: the maximum external quantum efficiency and current efficiency, respectively. The EQE and
efficiency roll-off value in the parenthesis were measured at b) 1000 cd m-2, c) 3000 cd m-2 and d) 5000 cd m-2.
Figure 21. Hole-only and electron-only devices of a) CzDBA and b) tBuCzDBA.
Table 8. Summary of the performance of device C used for lifetime measurement using CzDBA
as the emitter.
Devicea) Vd ηEQE ηCE ηPE λEL CIE LT50 LT50
[V]b) [%]c) [cd A-1]d) [lm W-1]e) [nm]f) [x,y]g) [h]h) [h]i)
C 3.1 30.5 115.0 91.9 527 (0.30, 0.61) 97 ca. 315
a) Device configuration: ITO/HAT-CN (10 nm)/Tris-PCz (30 nm)/mCBP: CzDBA (10%) (30 nm)/T2T (10 nm)/BPy-
TP2 (40 nm)/LiF (1 nm)/Al (100 nm). b) The operating voltage at a brightness of 1 cd m-2. c) EQE, maximum external
quantum efficiency. d) CE, maximum current efficiency. e) PE, maximum power efficiency. f) The EL emission
wavelength at maximum intensity. g) CIE 1931 coordinates. h) A nominal lifetime to 50% initial luminance (LT50)
was measured at initial luminance of 1000 cd m-2. i) The predicted lifetime at initial luminance of 500 cd m-2 was
calculated by using the formula: LT50(L1) = LT50(L0) × (L0/L1)1.7.
0 2 4 6 8 10 1210
-3
10-2
10-1
100
101
102
103
Curr
ent
De
nsity (
mA
cm
-2)
Voltage (V)
Hole-only
Electron-only
CzDBA
a
0 2 4 6 8 10 1210
-3
10-2
10-1
100
101
102
103
Curr
ent D
ensity (
mA
cm
-2)
Voltage (V)
Hole-only
Electron-only
tBuCzDBA
b
S-19
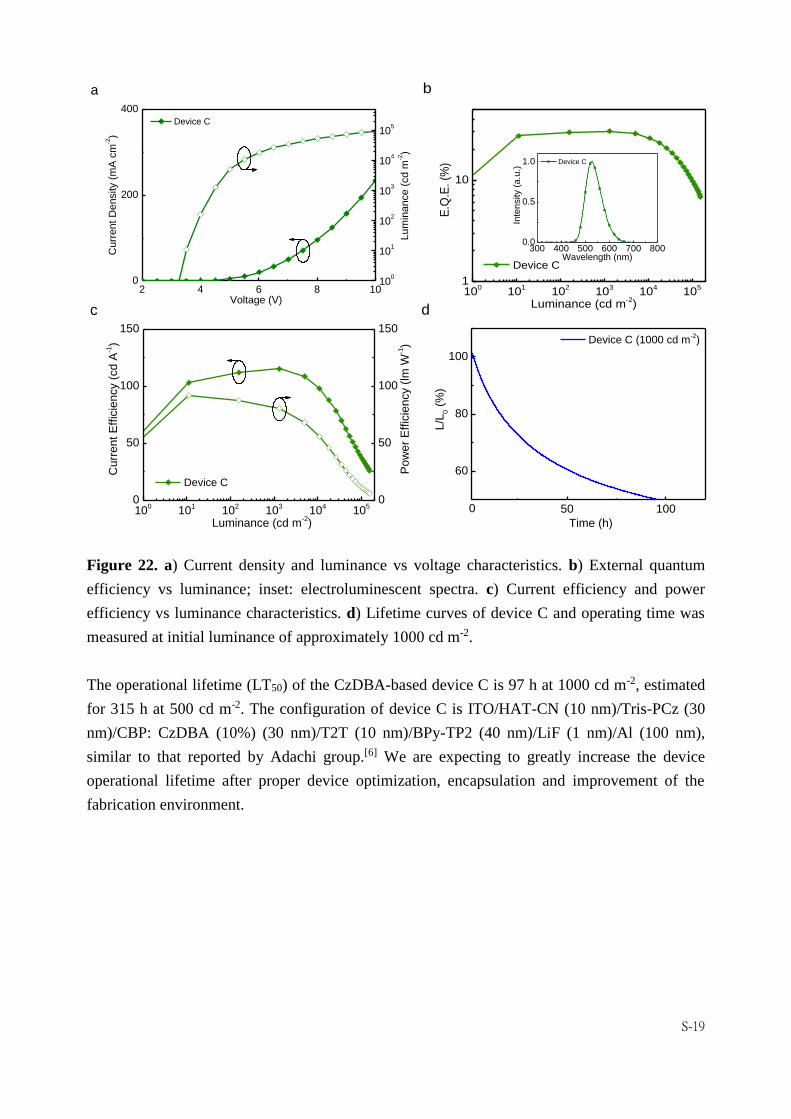
Figure 22. a) Current density and luminance vs voltage characteristics. b) External quantum
efficiency vs luminance; inset: electroluminescent spectra. c) Current efficiency and power
efficiency vs luminance characteristics. d) Lifetime curves of device C and operating time was
measured at initial luminance of approximately 1000 cd m-2.
The operational lifetime (LT50) of the CzDBA-based device C is 97 h at 1000 cd m-2, estimated
for 315 h at 500 cd m-2. The configuration of device C is ITO/HAT-CN (10 nm)/Tris-PCz (30
nm)/CBP: CzDBA (10%) (30 nm)/T2T (10 nm)/BPy-TP2 (40 nm)/LiF (1 nm)/Al (100 nm),
similar to that reported by Adachi group.[6] We are expecting to greatly increase the device
operational lifetime after proper device optimization, encapsulation and improvement of the
fabrication environment.
100
101
102
103
104
105
0
50
100
150
Curr
en
t E
ffic
ien
cy (
cd A
-1)
Device C
Luminance (cd m-2)
0
50
100
150
Pow
er
Effic
ien
cy (
lm W
-1)
c
100
101
102
103
104
105
1
10
E.Q
.E.
(%)
Luminance (cd m-2)
Device C
b
300 400 500 600 700 8000.0
0.5
1.0 Device C
Inte
nsity (
a.u
.)
Wavelength (nm)
2 4 6 8 100
200
400
Device C
Lum
inance (
cd m
-2)
Curr
ent
De
nsity (
mA
cm
-2)
Voltage (V)
a
100
101
102
103
104
105
50 100
60
80
100
L/L
0 (
%)
Device C (1000 cd m-2)
Time (h)
d
0

S-20
E. Computational data
Table 9. Cartesian of optimized CzDBA.
Element X Y Z
C -0.69833256 3.79541491 -0.00205186
C 0.6988333 3.79532019 0.00104406
C 1.39585319 2.57713177 0.00215527
C 0.71626277 1.34464833 0.00127484
C -0.71608143 1.34474565 -0.00202697
C -1.39551218 2.57731861 -0.00302638
B 1.50404394 -0.00013328 -0.00031276
C 0.71608041 -1.34480042 -0.00197265
C -0.71626383 -1.34470301 0.00134017
B -1.50404498 0.00007857 -0.00029546
C 1.39551147 -2.57737336 -0.00292233
C 0.69833184 -3.7954695 -0.0018882
C -0.69883409 -3.79537475 0.00121809
C -1.39585423 -2.57718655 0.00227971
C -3.07606522 0.00016177 -0.00022592
C 3.07606417 -0.00021426 -0.00022041
C -3.79691908 0.07429346 -1.21685978
C -5.19803992 0.08242279 -1.20880841
C -5.90175902 0.00020246 -0.00008323
C -5.19791869 -0.08201485 1.20857189
C -3.79679965 -0.07392818 1.21648106
C 3.79693412 -0.07440026 -1.21684099
C 5.19805484 -0.082514 -1.20877127
C 5.90175844 -0.00022211 -0.00004143
C 5.19790151 0.08203753 1.20860121
C 3.7967824 0.07393551 1.21649256
N -7.31855617 0.000184 -0.00000746
N 7.3185558 -0.00017104 0.00005227
C 3.04672282 -0.15556264 -2.53762417
C 3.0464006 0.15507904 2.53717989
C -3.04643764 -0.15501956 2.53718265
C -3.04669066 0.15538091 -2.53763803
C -8.13152092 0.85087718 0.74594962
C -9.49327511 0.54657341 0.47934165
C -9.49331692 -0.54661324 -0.47870246
C -8.13158574 -0.85067725 -0.74570648

S-21
C 8.13153076 -0.85081301 0.74605701
C 9.49328131 -0.5464889 0.47945411
C 9.49331099 0.54666018 -0.47863299
C 8.13157643 0.85068423 -0.7456648
C 7.77135907 -1.89369338 1.61328446
C 8.79984966 -2.61212763 2.2260778
C 10.15673268 -2.3105728 1.98446028
C 10.50799747 -1.2827605 1.1093797
C 10.50806801 1.28316563 -1.10821689
C 10.15686116 2.31091997 -1.98338975
C 8.79999063 2.61218071 -2.22543234
C 7.77145998 1.89350949 -1.61298271
C -10.50808129 -1.28311957 -1.10827358
C -10.15688423 -2.31091126 -1.98340623
C -8.80001672 -2.61220737 -2.22542434
C -7.77147866 -1.89353598 -1.61298705
C -7.7713361 1.89378546 1.61313826
C -8.79981765 2.61226937 2.22588868
C -10.15670442 2.31073582 1.98426602
C -10.50798201 1.28289501 1.10922358
H -1.24559573 4.73704119 -0.00341325
H 1.24622363 4.73687261 0.00230738
H 2.4856184 2.58388489 0.00397814
H -2.48527752 2.58420429 -0.00483281
H 2.48527677 -2.58425901 -0.00473938
H 1.24559493 -4.73709588 -0.00321306
H -1.2462242 -4.73692724 0.00252724
H -2.48561939 -2.58393982 0.00411192
H -5.75255427 0.16426647 -2.14226675
H -5.75234276 -0.16383705 2.14208607
H 5.75258073 -0.1643975 -2.14221899
H 5.75231312 0.16391258 2.14211816
H 2.42443255 0.73795848 -2.69193008
H 3.73515049 -0.23985553 -3.38670441
H 2.37521697 -1.02595148 -2.5546963
H 3.73470476 0.23971757 3.38632524
H 2.37463017 1.02526693 2.55402877
H 2.42436215 -0.73860627 2.69155469
H -3.73475729 -0.23956771 3.38632458

S-22
H -2.37470915 -1.02523869 2.55409994
H -2.42435874 0.73864629 2.69150556
H -2.4244312 -0.73816851 -2.69190532
H -3.73510614 0.23966786 -3.38672868
H -2.37515316 1.02574459 -2.55473406
H 6.72855296 -2.14008468 1.79535533
H 8.54512384 -3.42575477 2.9028736
H 10.93270846 -2.88938483 2.48089317
H 11.5544187 -1.05416693 0.91263043
H 11.55447495 1.05481301 -0.91111254
H 10.93286959 2.88991401 -2.47955892
H 8.54529995 3.42576877 -2.90228874
H 6.72866631 2.13969432 -1.79539068
H -11.55448622 -1.05473744 -0.91119252
H -10.93289896 -2.88990562 -2.47956541
H -8.5453352 -3.42582161 -2.90225253
H -6.728686 -2.13974262 -1.7953751
H -6.7285265 2.1401594 1.79521179
H -8.5450814 3.42591816 2.90265444
H -10.93267332 2.88958648 2.48066462
H -11.55440605 1.05431775 0.91247028
Table 10. Cartesian of optimized tBuCzDBA.
Element X Y Z
C -0.6985901 -3.79507182 0.00080279
C 0.6985598 -3.7950783 -0.00082442
C 1.39572278 -2.57693435 -0.00126685
C 0.71617122 -1.34444973 -0.00041431
C -0.71617941 -1.34444297 0.00042603
C -1.39574197 -2.57692146 0.0012629
B 1.50443328 0.00016933 0.00016785
C 0.71618231 1.34479583 0.00065646
C -0.71616876 1.34480257 -0.00043134
B -1.50443082 0.00018244 -0.00013569
C 1.39574462 2.57727437 0.00168012
C 0.69859266 3.79542461 0.00118447
C -0.69855696 3.79543117 -0.00067087
C -1.39572002 2.5772874 -0.00131193

S-23
C -3.07641331 0.00018362 -0.00009026
C 3.07641561 0.00016183 0.00014349
C -3.79795346 -0.00604502 1.21839417
C -5.19899266 -0.01551649 1.21100763
C -5.90408798 0.00012889 -0.00002222
C -5.19905063 0.01579443 -1.21108484
C -3.79801184 0.00638017 -1.21854062
C 3.79801074 0.00633926 1.21859534
C 5.19905014 0.01575337 1.21114336
C 5.90408862 0.00010895 0.00008053
C 5.1989963 -0.01549451 -1.21095087
C 3.79795765 -0.00602927 -1.21834024
N -7.31906238 0.00006211 -0.0000015
N 7.31906313 0.00005453 0.00004373
C 3.04989009 0.0187651 2.54306098
C 3.04977534 -0.01840692 -2.54277141
C -3.04989755 0.01883551 -2.5430096
C -3.0497723 -0.01850934 2.54282564
C -8.13460194 -0.86669203 -0.72649123
C -9.49562011 -0.55825186 -0.46704592
C -9.49568303 0.55809221 0.46708795
C -8.13469862 0.86672269 0.72649706
C 8.13466232 0.86675139 -0.72644857
C 9.49565927 0.55813995 -0.46709033
C 9.49564403 -0.55823936 0.46700113
C 8.13463851 -0.86671907 0.72647334
C 7.79337284 1.92998522 -1.56949814
C 8.8300751 2.6601083 -2.1602422
C 10.19627058 2.36887878 -1.93603876
C 10.51025689 1.305963 -1.07455276
C 10.51022096 -1.30617332 1.07436225
C 10.19620448 -2.36906823 1.935862
C 8.83000012 -2.66016334 2.1601846
C 7.79331855 -1.92993181 1.56953864
C -10.5103159 1.30587755 1.07453844
C -10.1963797 2.36877502 1.93606395
C -8.83019803 2.66002963 2.16031534
C -7.79346143 1.92994752 1.56958156
C -7.79323219 -1.92985201 -1.56960043

S-24
C -8.82988031 -2.66007609 -2.16031393
C -10.19609817 -2.36902097 -1.9360193
C -10.51016355 -1.30617463 -1.0744765
C 11.33610065 3.17881429 -2.58968639
C 10.80800408 4.29173459 -3.52179039
C 12.2299994 2.23060133 -3.4307326
C 12.19749669 3.84332941 -1.48423363
C 11.33601249 -3.17913467 2.58938251
C 10.80789433 -4.29176126 3.52182493
C 12.23032701 -2.23095721 3.43002591
C 12.19698763 -3.84404912 1.48384218
C -11.33624765 3.17867047 2.58969233
C -10.8082094 4.29139578 3.52206225
C -12.23032288 2.23036511 3.43044616
C -12.19744642 3.84343172 1.48423408
C -11.33586765 -3.17907499 -2.58962314
C -10.80769372 -4.29172041 -3.52201141
C -12.23009883 -2.23089338 -3.43035071
C -12.1969436 -3.84396411 -1.48414604
H -1.24592191 -4.73668088 0.00166695
H 1.24588299 -4.73669233 -0.00170066
H 2.48547643 -2.5836004 -0.00261178
H -2.48549578 -2.58357829 0.00260653
H 2.48549811 2.58393196 0.00321653
H 1.24592425 4.73703361 0.0022023
H -1.24587991 4.73704529 -0.00157933
H -2.48547338 2.58395439 -0.00285242
H -5.75223734 -0.04858767 2.14807889
H -5.75234545 0.04880766 -2.1481294
H 5.75234127 0.0487551 2.14818989
H 5.75224645 -0.04852816 -2.14802097
H 2.41051705 -0.87031002 2.64286602
H 3.74117744 0.03618095 3.39391494
H 2.39628112 0.89971675 2.61854297
H 3.74101724 -0.03619551 -3.39365439
H 2.39585769 -0.89914384 -2.61808056
H 2.41070348 0.87087304 -2.6426878
H -3.74119031 0.03623735 -3.39385941
H -2.3963142 0.89980638 -2.61849026

S-25
H -2.41049962 -0.87022046 -2.6428235
H -2.41032227 0.87051519 2.64258652
H -3.74102257 -0.0358535 3.39371114
H -2.39623289 -0.89951392 2.61829709
H 6.75472766 2.19075832 -1.75662337
H 8.55700033 3.48382143 -2.81349113
H 11.55043468 1.05576596 -0.86893172
H 11.55040621 -1.05608106 0.86865071
H 8.55690153 -3.48386946 2.81343271
H 6.75466537 -2.19061381 1.75674389
H -11.55048241 1.05566593 0.86887706
H -8.55716188 3.48374136 2.81358244
H -6.75483212 2.19075473 1.7567394
H -6.75456562 -2.19049576 -1.75678908
H -8.55674399 -3.48373927 -2.81360049
H -11.55035996 -1.05610949 -0.86878827
H 10.19700571 5.02205208 -2.97479592
H 11.65587881 4.83021775 -3.96556983
H 10.20522103 3.87896231 -4.34182118
H 12.67290615 1.44121118 -2.81058632
H 13.04937327 2.79556631 -3.89739747
H 11.64427226 1.74870367 -4.22480125
H 13.02069101 4.41548909 -1.9353492
H 11.59028501 4.52972105 -0.87904038
H 12.6340167 3.09440107 -0.81107158
H 10.19637356 -5.02189305 2.97516453
H 11.65575466 -4.83052626 3.96528992
H 10.20563019 -3.87867801 4.34207963
H 12.67321053 -1.44175643 2.80962082
H 13.04972136 -2.79600202 3.8965583
H 11.64491277 -1.74881265 4.22417543
H 13.02015231 -4.4163258 1.93486343
H 11.58946987 -4.53040242 0.87891265
H 12.63352679 -3.09534279 0.81044625
H -10.19693094 5.02166273 2.97531204
H -11.65610974 4.829979 3.96567128
H -10.20572433 3.87842871 4.34221351
H -12.67315851 1.44109027 2.81010152
H -13.04974988 2.79529052 3.89706589

S-26
H -11.64474545 1.7483179 4.22453453
H -13.02065842 4.41557798 1.93533448
H -11.59010329 4.5298786 0.87923557
H -12.63393304 3.09464788 0.81089
H -10.1962973 -5.02190225 -2.97527947
H -11.65552817 -4.83042249 -3.96560219
H -10.20528781 -3.87866276 -4.34217519
H -12.67303638 -1.4416874 -2.80999131
H -13.04945365 -2.79593477 -3.89695686
H -11.64460871 -1.74875564 -4.22444847
H -13.020084 -4.41622802 -1.93522803
H -11.58948712 -4.5303252 -0.87916391
H -12.63352181 -3.09524483 -0.8107895
F. References
[1] Lai, C.-C. et al. m-Indolocarbazole derivative as a universal host material for RGB and white
phosphorescent OLEDs. Adv. Funct. Mater. 25, 5548-5556 (2015).
[2] Guo, J. et al. Achieving high-performance nondoped OLEDs with extremely small efficiency
roll-off by combining aggregation-induced emission and thermally activated delayed
fluorescence. Adv. Funct. Mater. 27, 1606458 (2017).
[3] Goushi, K., Yoshida, K., Sato, K. & Adachi, C. Organic light-emitting diodes employing
efficient reverse intersystem crossing for triplet-to-singlet state conversion. Nat. Photon. 6,
253–258 (2012).
[4] Zhang, Q. S. et al. Anthraquinone-based intramolecular charge-transfer compounds:
computational molecular design, thermally activated delayed fluorescence, and highly
efficient red electroluminescence. J. Am. Chem. Soc. 136, 18070-18081 (2014).
[5] Wu, T.-L., Chou, H.-H., Huang, P.-Y., Cheng, C.-H. & Liu, R.-S. 3,6,9,12-tetrasubstituted
chrysenes: synthesis, photophysical properties, and application as blue fluorescent OLED. J.
Org. Chem. 79, 267-274 (2014).
[6] Tsang, D. P., Matsushima, T. & Adachi, C. Operational stability enhancement in organic
light-emitting diodes with ultrathin Liq interlayers. Sci. Rep. 6, 22463 (2016).


