
Income and Wealth Inequality:
Evidence and Policy Implications
Emmanuel Saez, UC Berkeley
Neubauer Collegium Lecture
University of Chicago
October 2014
1
MEASURING INEQUALITY
Inequality matters because the public cares about it
⇒ Need to provide transparent inequality measures
Goals: Understand drivers of inequality trends and the effects
of public policy on inequality
Two key economic concepts: Income and Wealth
Income is a flow = Labor income + Capital income
Capital income is the return on Wealth
Wealth is a stock accumulated from savings and inheritances
2
BASIC US ECONOMIC FACTS
In aggregate, labor income is about 70-75% of total income
Capital income is about 25-30% of total income
Total wealth is about 400% of total annual income
Annual rate of return on wealth = 6-7%
Wealth inequality is always much higher than income inequality
(bottom 50% families own about zero wealth)
Government taxes 1/3 of market incomes to fund transfers
and public goods: disposable income inequality lower than
market income inequality
3

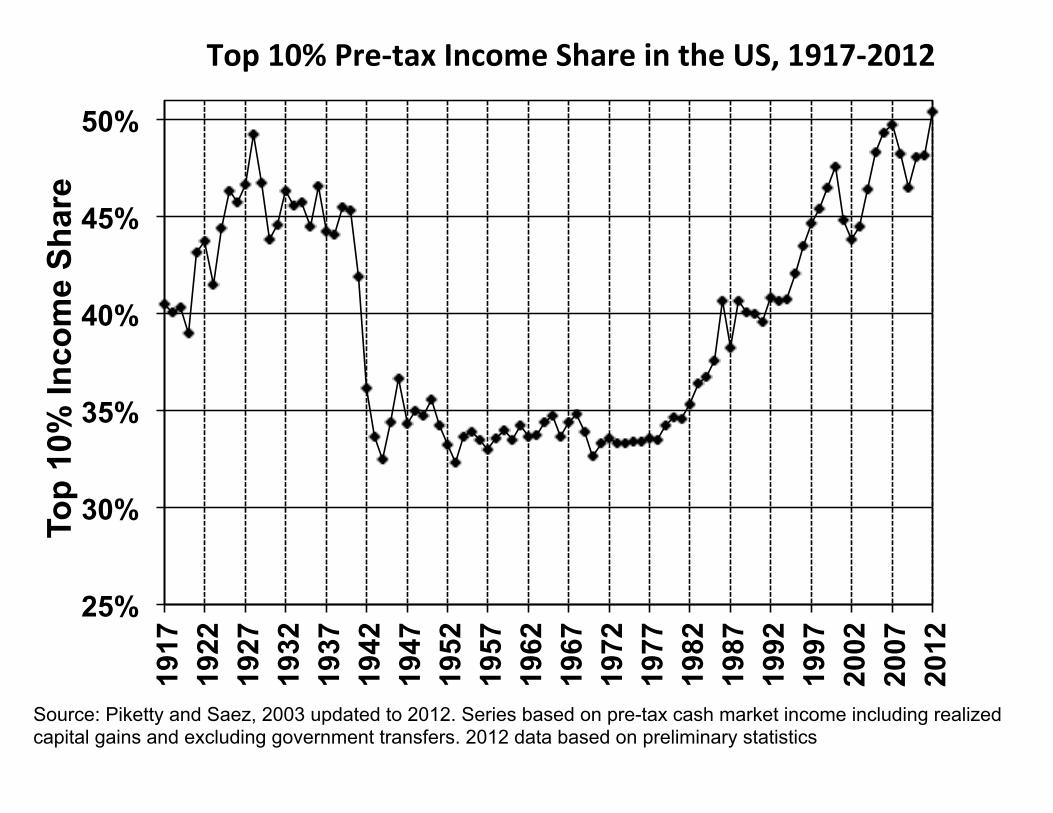
TOP INCOME SHARES
Simple way to measure inequality: what share of total pre-tax
market income goes to the top 10% families, top 1%, etc.
Individual income tax statistics are the only source
(a) covering long-time periods
(b) capturing well top incomes
25 countries have been analyzed in the on-going World Top
Incomes Database
Caveats: Income concept used is narrower than National In-
come and focus is solely on pre-tax, pre-transfer income
4
25%
30%
35%
40%
45%
50% 19
17
1922
19
27
1932
19
37
1942
19
47
1952
19
57
1962
19
67
1972
19
77
1982
19
87
1992
19
97
2002
20
07
2012
Top
10%
Inco
me
Shar
e Top 10% Pre-‐tax Income Share in the US, 1917-‐2012
Source: Piketty and Saez, 2003 updated to 2012. Series based on pre-tax cash market income including realized capital gains and excluding government transfers. 2012 data based on preliminary statistics
0%
5%
10%
15%
20%
25% 19
13
1918
19
23
1928
19
33
1938
19
43
1948
19
53
1958
19
63
1968
19
73
1978
19
83
1988
19
93
1998
20
03
2008
Shar
e of
tota
l inc
ome
for e
ach
grou
p
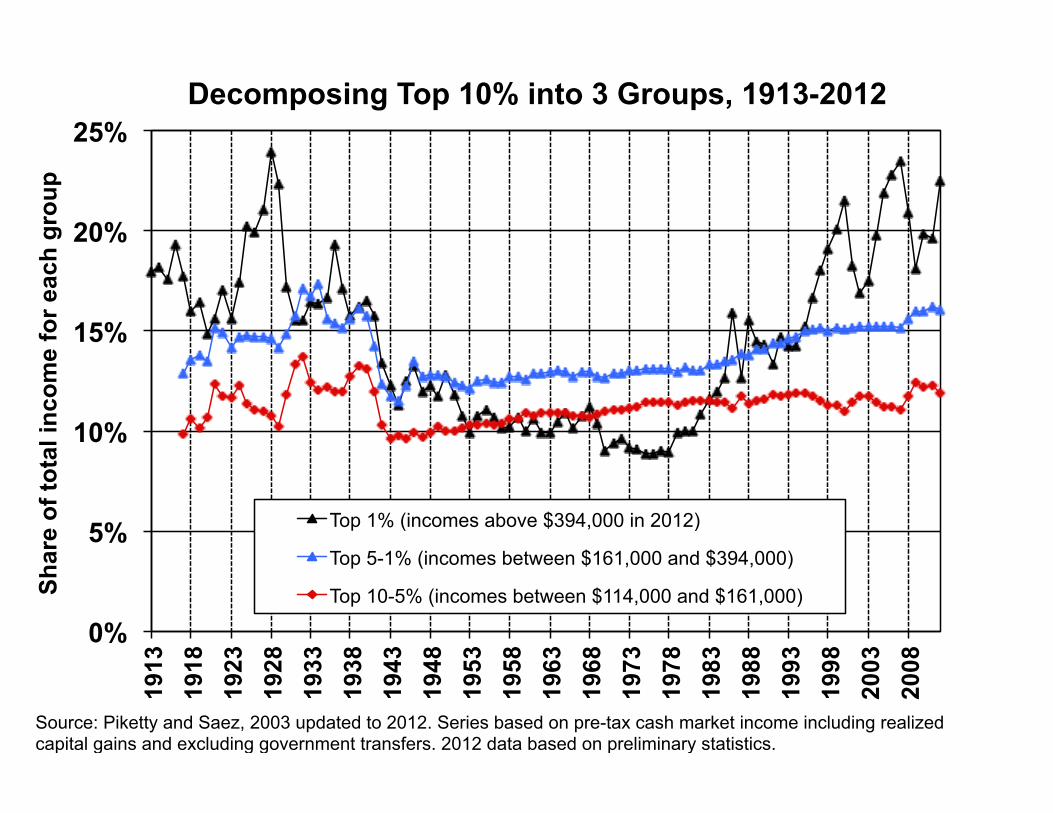
Decomposing Top 10% into 3 Groups, 1913-2012
Top 1% (incomes above $394,000 in 2012)
Top 5-1% (incomes between $161,000 and $394,000)
Top 10-5% (incomes between $114,000 and $161,000)
Source: Piketty and Saez, 2003 updated to 2012. Series based on pre-tax cash market income including realized capital gains and excluding government transfers. 2012 data based on preliminary statistics.
0%
2%
4%
6%
8%
10%
12% 19
13
1918
19
23
1928
19
33
1938
19
43
1948
19
53
1958
19
63
1968
19
73
1978
19
83
1988
19
93
1998
20
03
2008
Top
0.1%
Inco
me
Shar
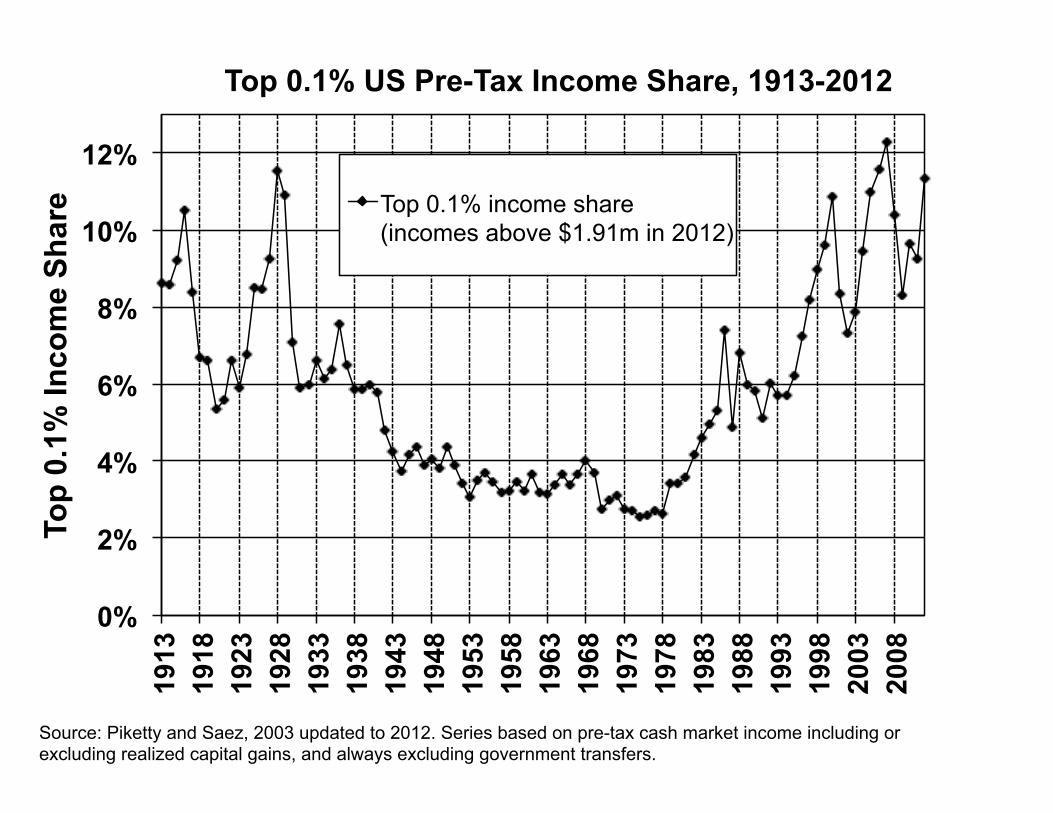
e Top 0.1% US Pre-Tax Income Share, 1913-2012
Top 0.1% income share (incomes above $1.91m in 2012)
Source: Piketty and Saez, 2003 updated to 2012. Series based on pre-tax cash market income including or excluding realized capital gains, and always excluding government transfers.
0%
2%
4%
6%
8%
10%
12% 19
16
1921
19
26
1931
19
36
1941
19
46
1951
19
56
1961
19
66
1971
19
76
1981
19
86
1991
19
96
2001
20
06
2011
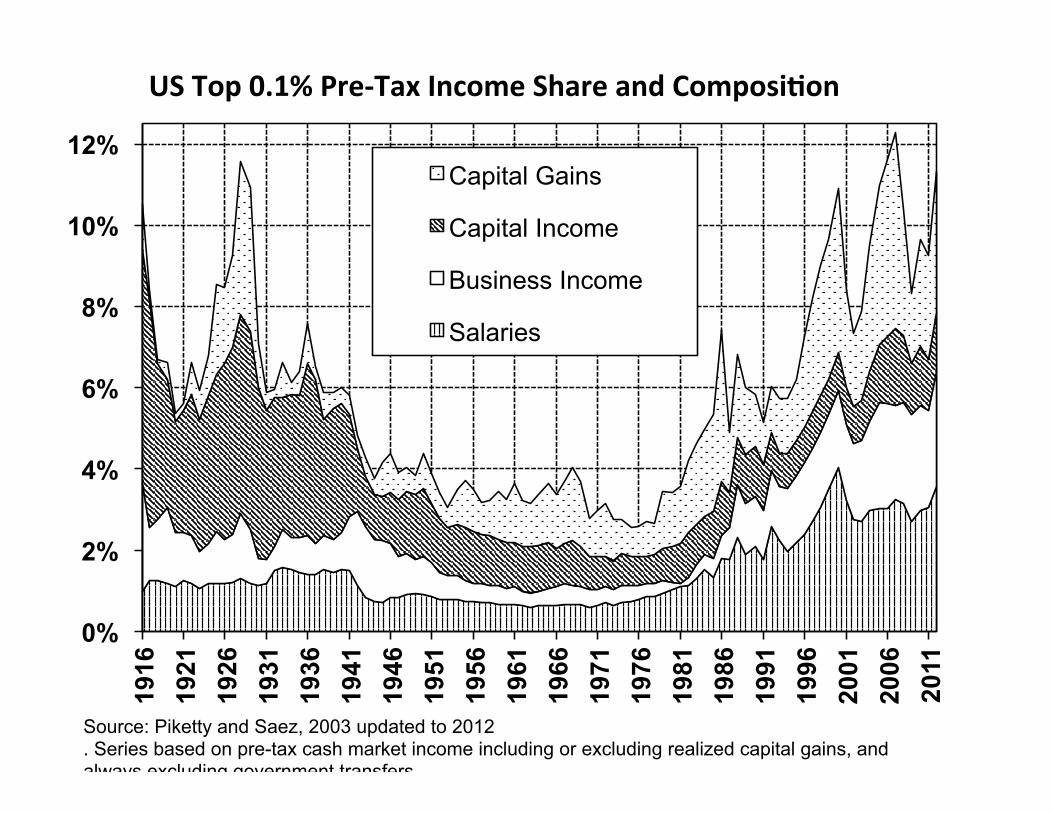
Capital Gains
Capital Income
Business Income
Salaries
Source: Piketty and Saez, 2003 updated to 2012 . Series based on pre-tax cash market income including or excluding realized capital gains, and always excluding government transfers.
US Top 0.1% Pre-‐Tax Income Share and Composi:on

Average Income Real Growth
Top 1% Incomes Real Growth
Bottom 99% Incomes Real
Growth
Fraction of total growth (or loss)
captured by top 1%
(1) (2) (3) (4)
Full period 1993-2012 17.9% 86.1% 6.6% 68%
Clinton Expansion 1993-2000 31.5% 98.7% 20.3% 45%
2001 Recession 2000-2002 -11.7% -30.8% -6.5% 57%
Bush Expansion 2002-2007 16.1% 61.8% 6.8% 65%
Great Recession 2007-2009 -17.4% -36.3% -11.6% 49%
Recovery 2009-2012 6.0% 31.4% 0.4% 95%
Computations based on family market income including realized capital gains (before individual taxes).Incomes exclude government transfers (such as unemployment insurance and social security) and non-taxable fringe benefits.Incomes are deflated using the Consumer Price Index.Column (4) reports the fraction of total real family income growth (or loss) captured by the top 1%.For example, from 2002 to 2007, average real family incomes grew by 16.1% but 65% of that growthaccrued to the top 1% while only 35% of that growth accrued to the bottom 99% of US families.Source: Piketty and Saez (2003), series updated to 2012 in August 2013 using IRS preliminary tax statistics for 2012.
Table 1. Real Income Growth by Groups
0%
5%
10%
15%
20%
25%
30%
35%
40%
1917
1922
1927
1932
1937
1942
1947
1952
1957
1962
1967
1972
1977
1982
1987
1992
1997
2002
2007
2012
% o
f tot
al h
ouse
hold
wea
lth
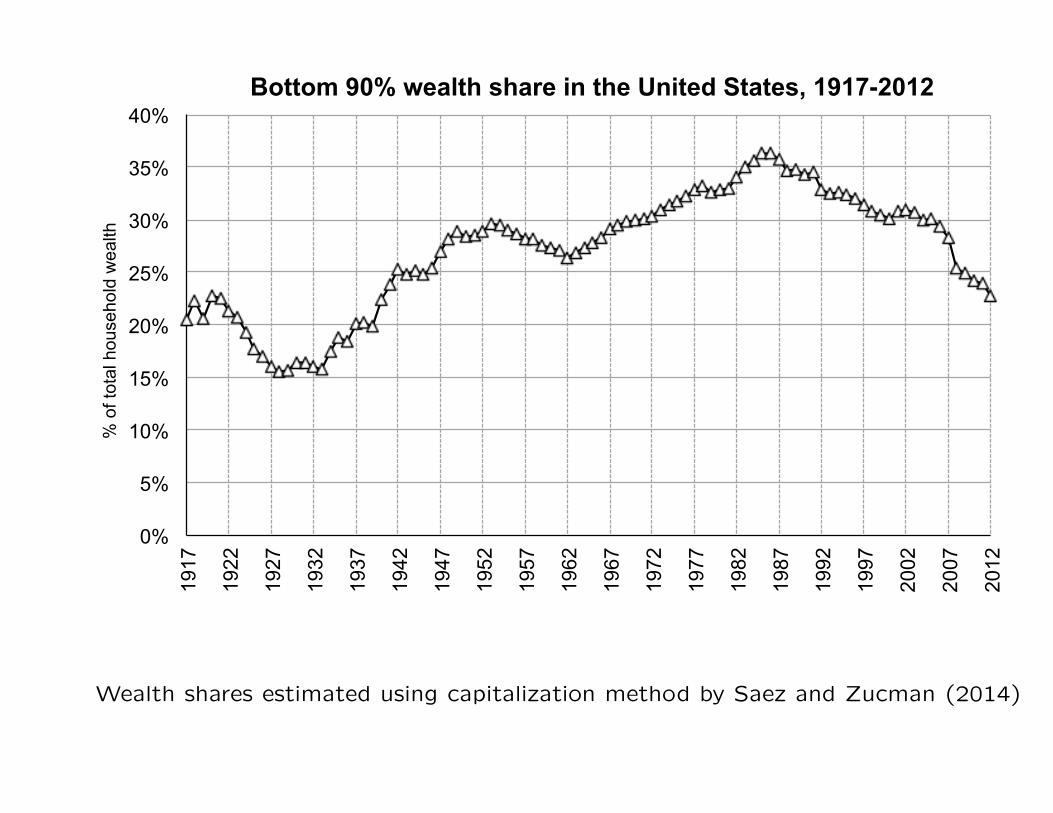
Bottom 90% wealth share in the United States, 1917-2012
Wealth shares estimated using capitalization method by Saez and Zucman (2014)
0%
5%
10%
15%
20%
25%
30%
35%
40% 19
17
1922
1927
1932
1937
1942
1947
1952
1957
1962
1967
1972
1977
1982
1987
1992
1997
2002
2007
2012
% o
f tot
al h
ouse
hold
wea
lth
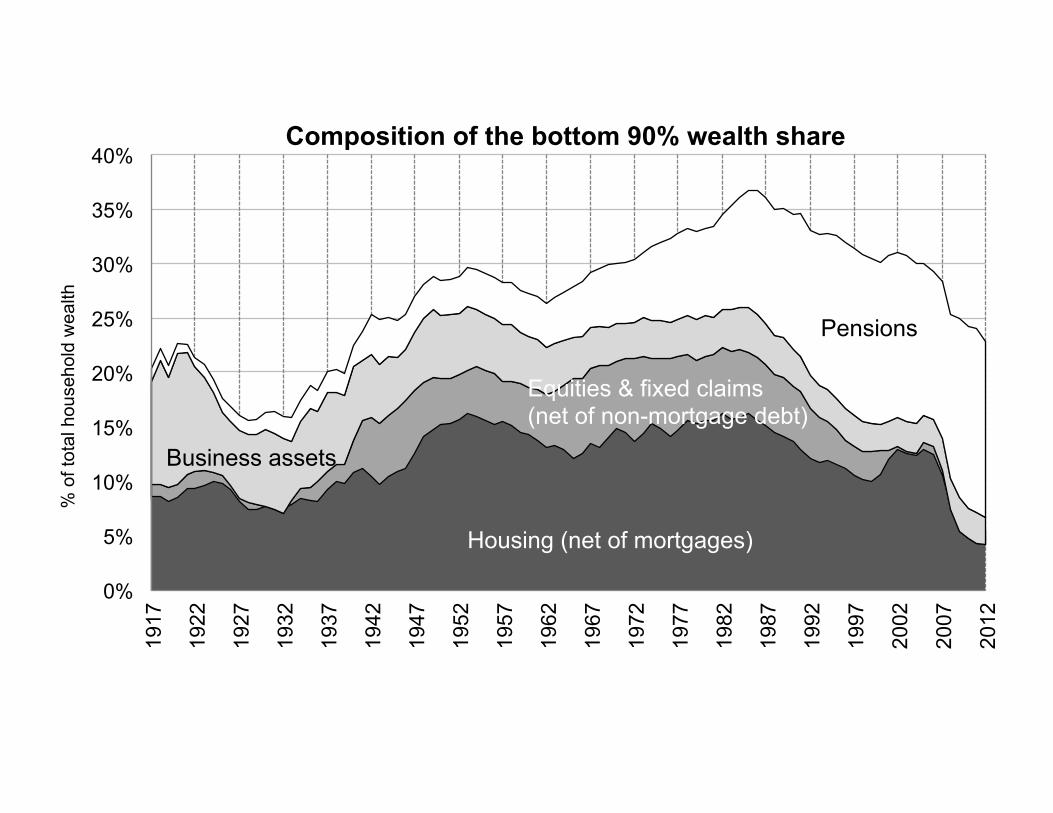
Composition of the bottom 90% wealth share
Pensions
Business assets
Housing (net of mortgages)
Equities & fixed claims (net of non-mortgage debt)
0%
10%
20%
30%
40%
50% 19
13
1918
1923
1928
1933
1938
1943
1948
1953
1958
1963
1968
1973
1978
1983
1988
1993
1998
2003
2008
2013
% o
f tot
al h
ouse
hold
wea
lth
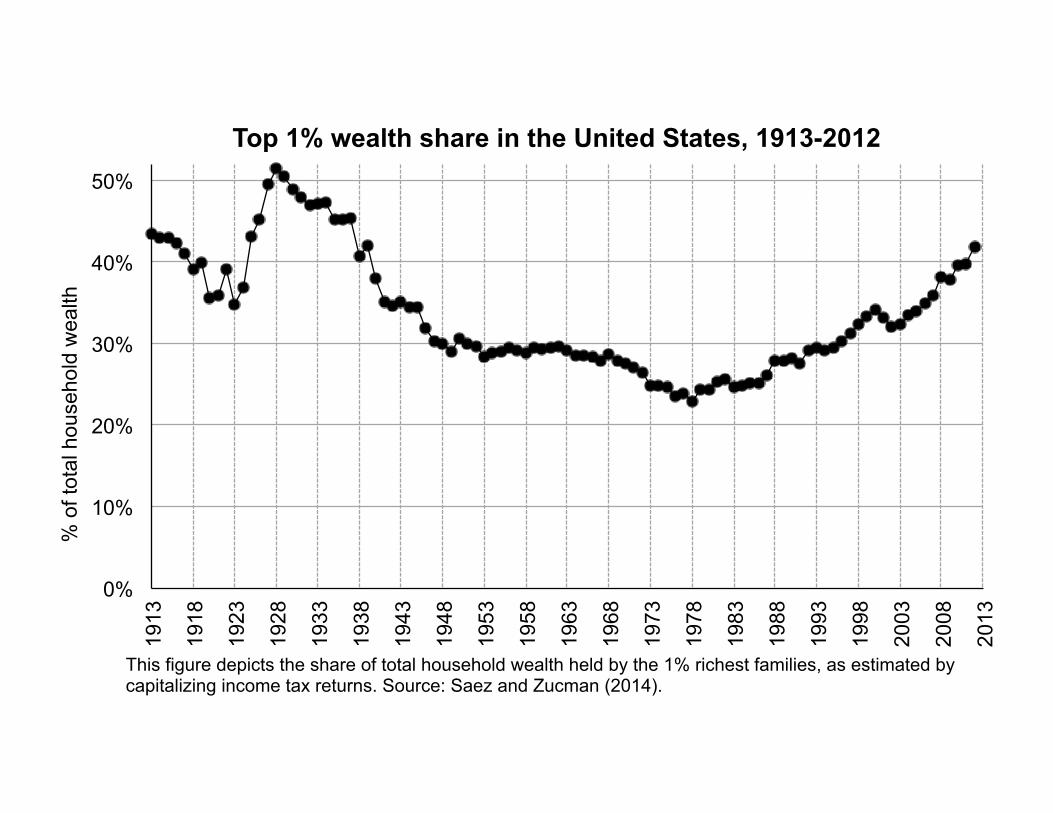
Top 1% wealth share in the United States, 1913-2012
This figure depicts the share of total household wealth held by the 1% richest families, as estimated by capitalizing income tax returns. Source: Saez and Zucman (2014).

0%
5%
10%
15%
20%
25%
30% 19
13
1918
1923
1928
1933
1938
1943
1948
1953
1958
1963
1968
1973
1978
1983
1988
1993
1998
2003
2008
2013
% o
f tot
al h
ouse
hold
wea
lth
Top 0.1% wealth share in the United States, 1913-2012

0
20,000
40,000
60,000
80,000
100,000
120,000
140,000
0
2,000,000
4,000,000
6,000,000
8,000,000
10,000,000
12,000,000
14,000,000 19
46
1950
1954
1958
1962
1966
1970
1974
1978
1982
1986
1990
1994
1998
2002
2006
2010
Bot
tom
90%
real
ave
rage
wea
lth
Top
1% re
al a
vera
ge w
elat
h
Real average wealth of bottom 90% and top 1% families
Top 1% (left y-axis)
Bottom 90% (right y-axis)
Real values are obtained by using the GDP deflator, 2010 dollars. Source: Appendix Tables B3.
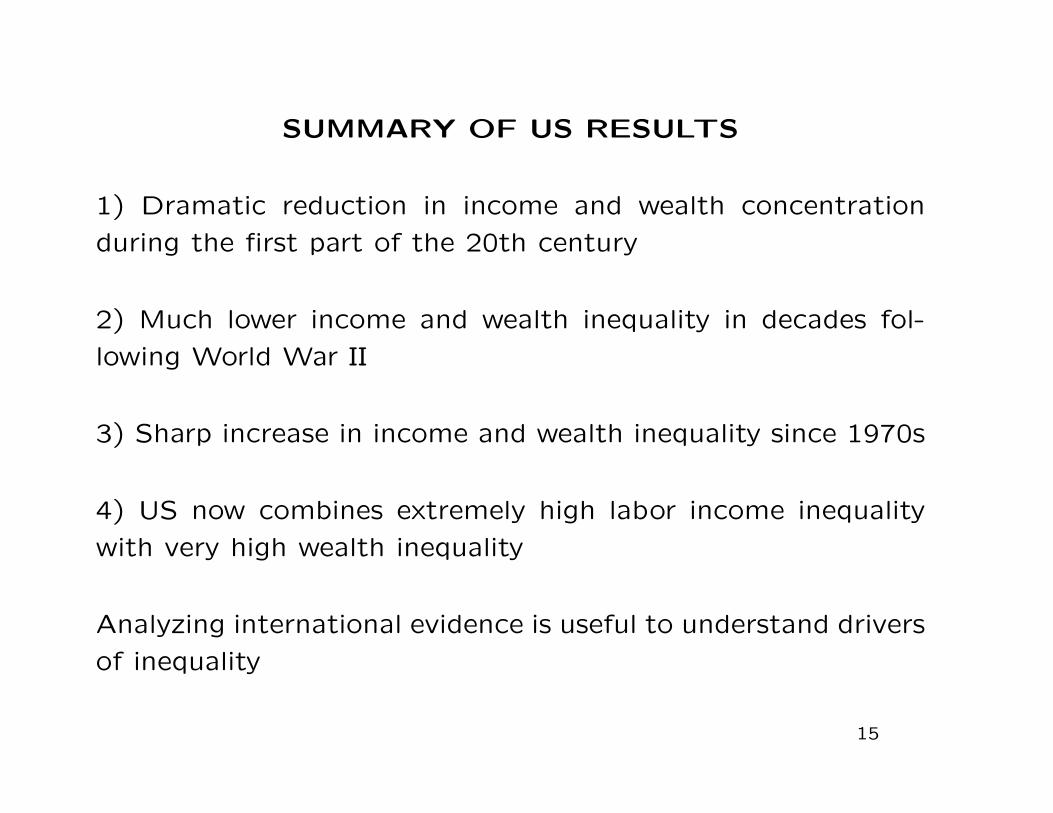
SUMMARY OF US RESULTS
1) Dramatic reduction in income and wealth concentration
during the first part of the 20th century
2) Much lower income and wealth inequality in decades fol-
lowing World War II
3) Sharp increase in income and wealth inequality since 1970s
4) US now combines extremely high labor income inequality
with very high wealth inequality
Analyzing international evidence is useful to understand drivers
of inequality
15
0
5
10
15
20
1910
19
15
1920
19
25
1930
19
35
1940
19
45
1950
19
55
1960
19
65
1970
19
75
1980
19
85
1990
19
95
2000
20
05
2010
Top
1% In
com
e Sh
are
(in %
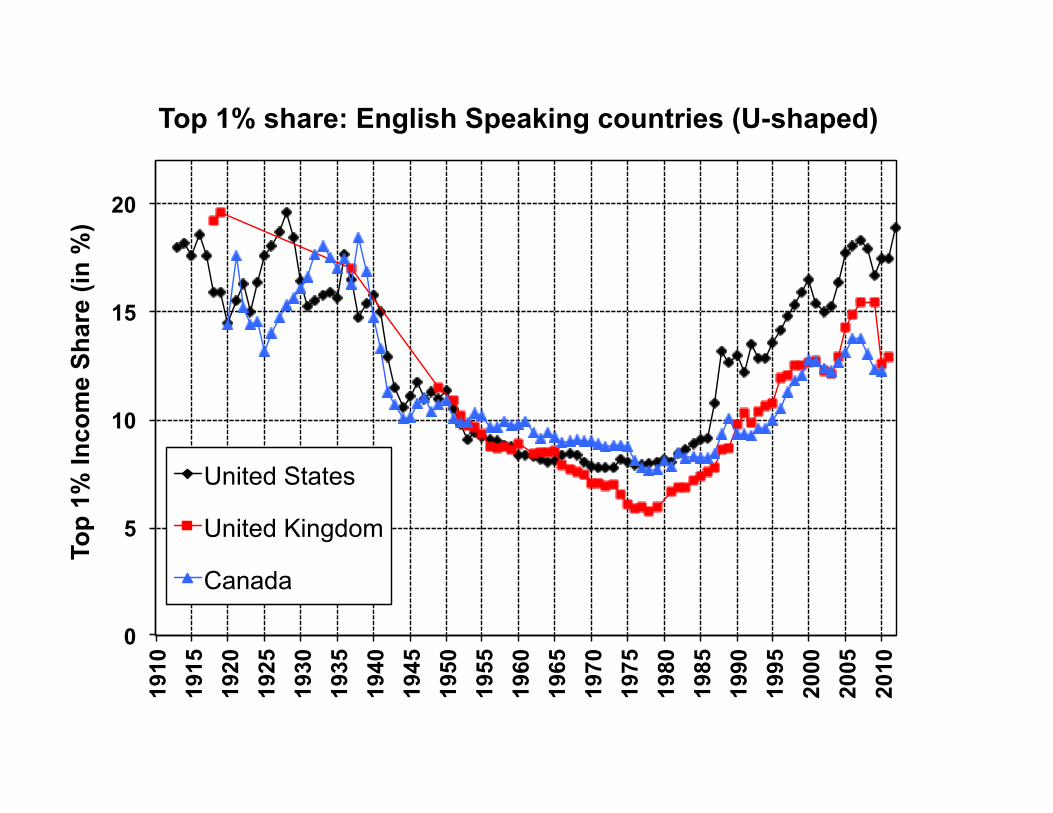
) Top 1% share: English Speaking countries (U-shaped)
United States
United Kingdom
Canada
0
5
10
15
20
1910
19
15
1920
19
25
1930
19
35
1940
19
45
1950
19
55
1960
19
65
1970
19
75
1980
19
85
1990
19
95
2000
20
05
2010
Top
1% In
com
e Sh
are
(in %
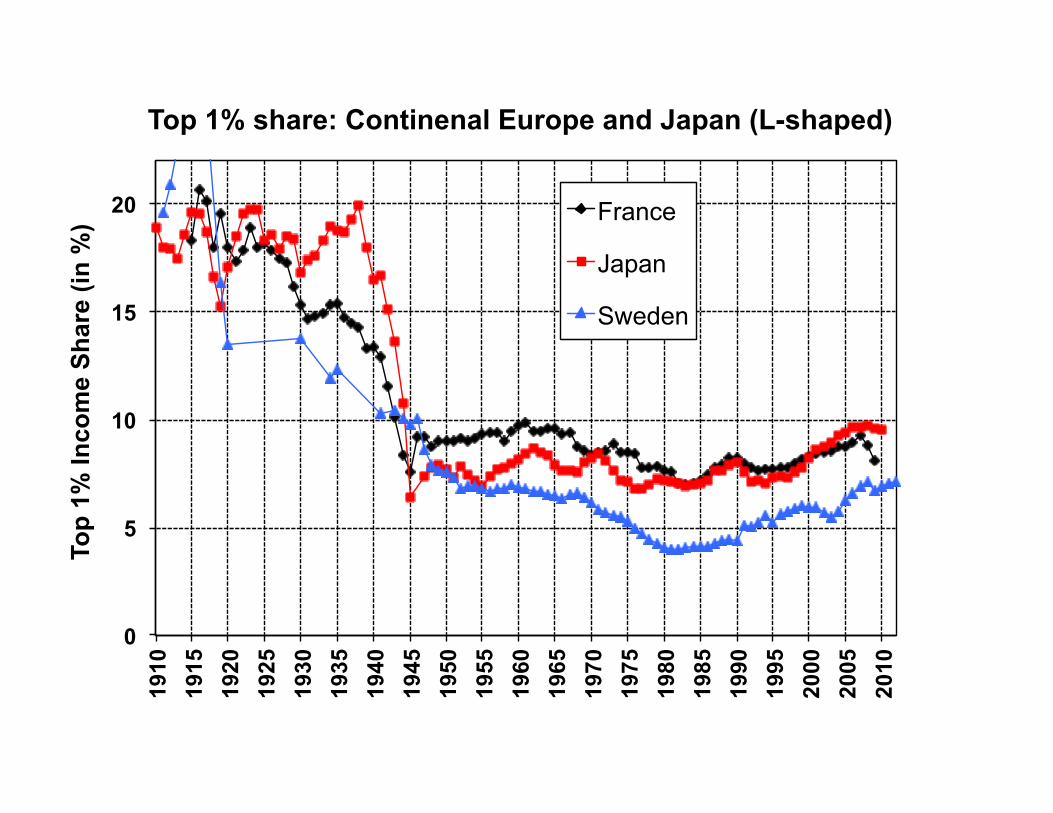
) Top 1% share: Continenal Europe and Japan (L-shaped)
France
Japan
Sweden

Result 1: Drop in Inequality in 1st Half of 20th Century
All advanced countries had very high income concentration
one century ago (explains pessimism of Piketty 2014)
All countries experience sharp reduction in income concentra-
tion during the first part of the 20th century
1) This is primarily a capital income phenomenon
2) War and depression shocks hit top capital earners (drop
follows each country specific history)
3) Government policy responses–regulations and progressive
income and inheritance taxation–make this drop permanent
18

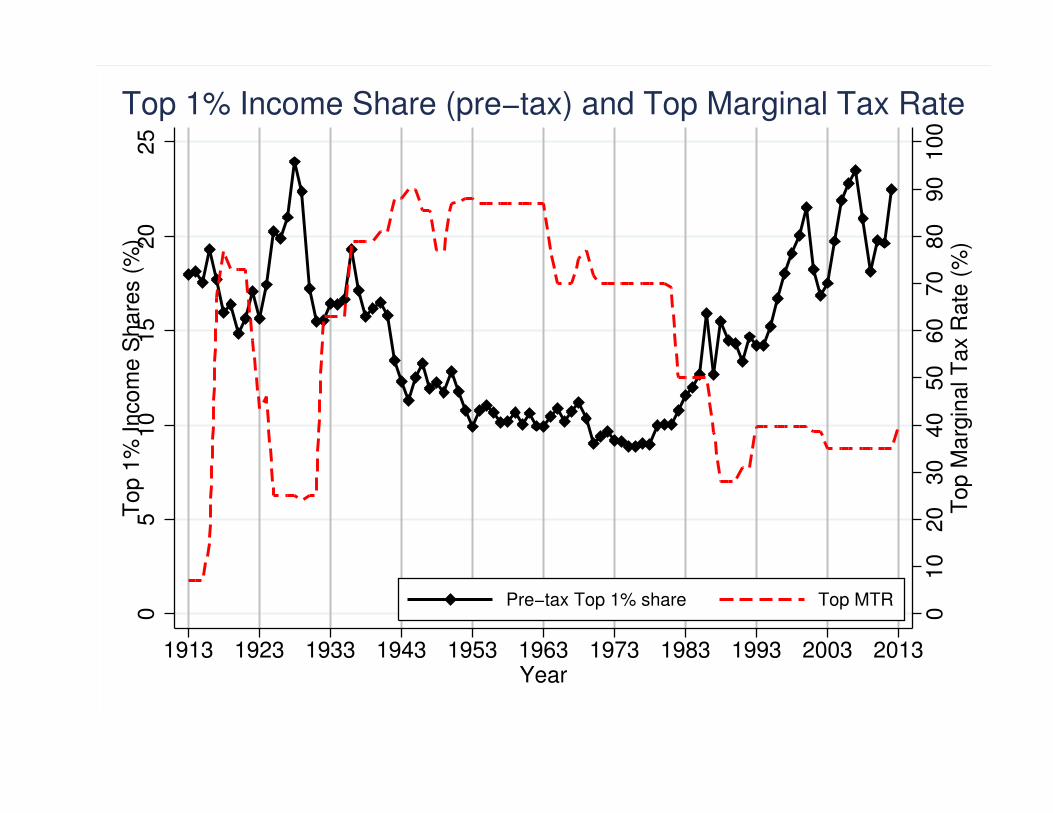
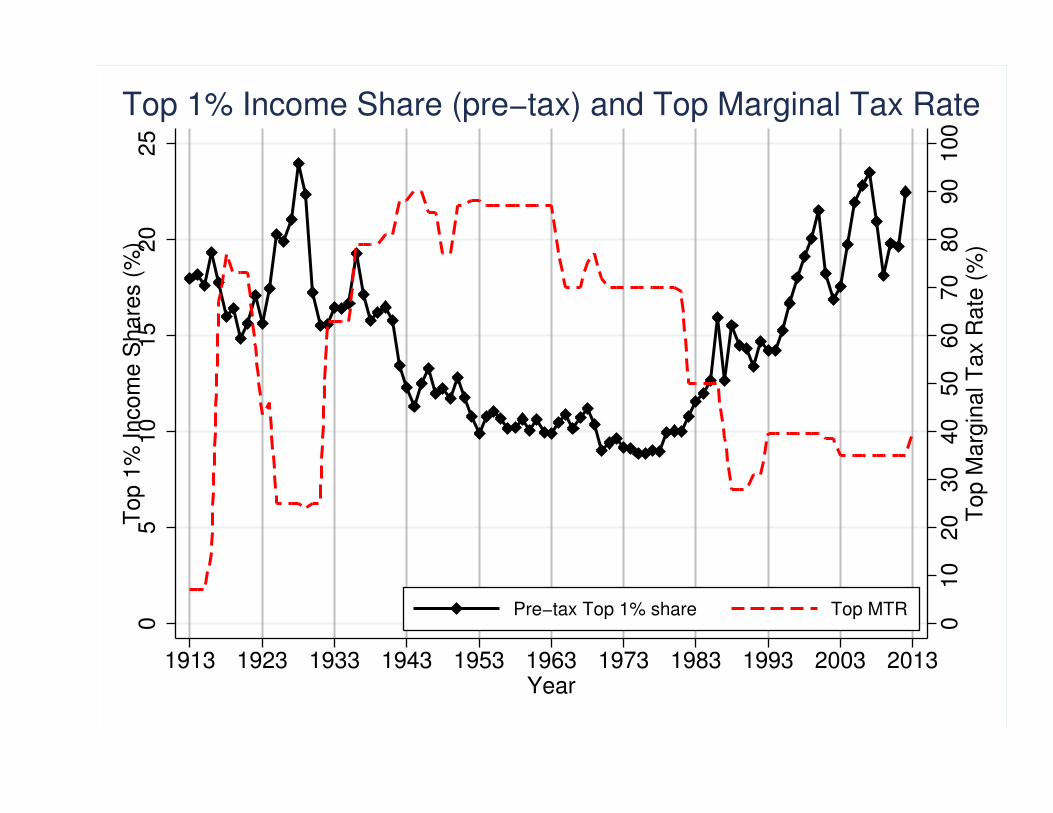
Result 2: Recent Surge in Inequality
1) Driven by surge in top labor incomes which then fuels
wealth inequality
2) Difference across countries rules out technical change/globalization
as the sole explanation
3) Policies play a key role in shaping inequality (tax and trans-
fer policies, regulations, education)
4) Key debate: do gains of the top 1% reflect productivity or
do they come at the expense of the 99%?
Looking at the role of top tax rates helps shed light on this
19
01
02
03
04
05
06
07
08
09
01
00
To
p M
arg
ina
l T
ax R
ate
(%
)
05
10
15
20
25
To
p 1
% I
nco
me
Sh
are
s (
%)
1913 1923 1933 1943 1953 1963 1973 1983 1993 2003 2013Year
Pre−tax Top 1% share Top MTR
Top 1% Income Share (pre−tax) and Top Marginal Tax Rate
AustraliaAustraliaAustraliaAustraliaAustraliaAustraliaAustraliaAustraliaAustraliaAustraliaAustraliaAustraliaAustraliaAustraliaAustraliaAustraliaAustraliaAustraliaAustraliaAustraliaAustraliaAustraliaAustraliaAustraliaAustraliaAustraliaAustraliaAustraliaAustraliaAustraliaAustraliaAustraliaAustraliaAustraliaAustraliaAustraliaAustraliaAustraliaAustraliaAustraliaAustraliaAustraliaAustraliaAustraliaAustraliaAustraliaAustraliaAustraliaAustralia
CanadaCanadaCanadaCanadaCanadaCanadaCanadaCanadaCanadaCanadaCanadaCanadaCanadaCanadaCanadaCanadaCanadaCanadaCanadaCanadaCanadaCanadaCanadaCanadaCanadaCanadaCanadaCanadaCanadaCanadaCanadaCanadaCanadaCanadaCanadaCanadaCanadaCanadaCanadaCanadaCanadaCanadaCanadaCanadaCanadaCanadaCanadaCanadaCanadaCanada
DenmarkDenmarkDenmarkDenmarkDenmarkDenmarkDenmarkDenmarkDenmarkDenmarkDenmarkDenmarkDenmarkDenmarkDenmarkDenmarkDenmarkDenmarkDenmarkDenmarkDenmarkDenmarkDenmarkDenmarkDenmarkDenmark
FinlandFinlandFinlandFinlandFinlandFinlandFinlandFinlandFinlandFinlandFinlandFinlandFinlandFinlandFinlandFinlandFinlandFinlandFinlandFinlandFinlandFinlandFinlandFinlandFinlandFinlandFinlandFinlandFinlandFinlandFinlandFinlandFinlandFinlandFinlandFinlandFinlandFinlandFinlandFinlandFinlandFinlandFinlandFinlandFinlandFinlandFinlandFinlandFinlandFinland FranceFranceFranceFranceFranceFranceFranceFranceFranceFranceFranceFranceFranceFranceFranceFranceFranceFranceFranceFranceFranceFranceFranceFranceFranceFranceFranceFranceFranceFranceFranceFranceFranceFranceFranceFranceFranceFranceFranceFranceFranceFranceFranceFranceFranceFranceFrance
GermanyGermanyGermanyGermanyGermanyGermanyGermanyGermanyGermanyGermanyGermanyGermanyGermanyGermanyGermanyGermanyGermanyGermanyGermanyGermanyGermanyGermanyGermanyGermanyGermanyGermanyGermanyGermanyGermanyGermanyGermanyGermanyGermanyGermanyGermanyGermanyGermanyGermanyGermanyGermanyGermanyGermanyGermanyGermanyGermanyGermanyGermanyGermany
IrelandIrelandIrelandIrelandIrelandIrelandIrelandIrelandIrelandIrelandIrelandIrelandIrelandIrelandIrelandIrelandIrelandIrelandIrelandIrelandIrelandIrelandIrelandIrelandIrelandIrelandIrelandIrelandIrelandIrelandIrelandIrelandIrelandIrelandIreland
ItalyItalyItalyItalyItalyItalyItalyItalyItalyItalyItalyItalyItalyItalyItalyItalyItalyItalyItalyItalyItalyItalyItalyItalyItalyItalyItalyItalyItalyItalyItalyItalyItalyItalyItalyItaly
JapanJapanJapanJapanJapanJapanJapanJapanJapanJapanJapanJapanJapanJapanJapanJapanJapanJapanJapanJapanJapanJapanJapanJapanJapanJapanJapanJapanJapanJapanJapanJapanJapanJapanJapanJapanJapanJapanJapanJapanJapanJapanJapanJapanJapanJapan
NetherlandsNetherlandsNetherlandsNetherlandsNetherlandsNetherlandsNetherlandsNetherlandsNetherlandsNetherlandsNetherlandsNetherlandsNetherlandsNetherlandsNetherlandsNetherlandsNetherlandsNetherlandsNetherlandsNetherlandsNetherlandsNetherlandsNetherlandsNetherlandsNetherlandsNetherlandsNetherlandsNetherlandsNetherlandsNetherlandsNetherlandsNetherlandsNetherlandsNetherlandsNetherlandsNetherlandsNetherlandsNetherlandsNetherlandsNetherlandsNetherlandsNetherlandsNetherlandsNetherlandsNetherlandsNetherlandsNetherlands
NZNZNZNZNZNZNZNZNZNZNZNZNZNZNZNZNZNZNZNZNZNZNZNZNZNZNZNZNZNZNZNZNZNZNZNZNZNZNZNZNZNZNZNZNZNZNZNZNZNZNorwayNorwayNorwayNorwayNorwayNorwayNorwayNorwayNorwayNorwayNorwayNorwayNorwayNorwayNorwayNorwayNorwayNorwayNorwayNorwayNorwayNorwayNorwayNorwayNorwayNorwayNorwayNorwayNorwayNorwayNorwayNorwayNorwayNorwayNorwayNorwayNorwayNorwayNorwayNorwayNorwayNorwayNorwayNorwayNorwayNorwayNorwayNorwayNorway
PortugalPortugalPortugalPortugalPortugalPortugalPortugalPortugalPortugalPortugalPortugalPortugalPortugalPortugalPortugalPortugalPortugalPortugalPortugalPortugalPortugalPortugalPortugalPortugal
SpainSpainSpainSpainSpainSpainSpainSpainSpainSpainSpainSpainSpainSpainSpainSpainSpainSpainSpainSpainSpainSpainSpainSpainSpainSpainSpainSpainSpain
SwedenSwedenSwedenSwedenSwedenSwedenSwedenSwedenSwedenSwedenSwedenSwedenSwedenSwedenSwedenSwedenSwedenSwedenSwedenSwedenSwedenSwedenSwedenSwedenSwedenSwedenSwedenSwedenSwedenSwedenSwedenSwedenSwedenSwedenSwedenSwedenSwedenSwedenSwedenSwedenSwedenSwedenSwedenSwedenSwedenSwedenSwedenSwedenSwedenSwedenSweden
SwitzerlandSwitzerlandSwitzerlandSwitzerlandSwitzerlandSwitzerlandSwitzerlandSwitzerlandSwitzerlandSwitzerlandSwitzerlandSwitzerlandSwitzerlandSwitzerlandSwitzerlandSwitzerlandSwitzerlandSwitzerlandSwitzerlandSwitzerlandSwitzerlandSwitzerlandSwitzerlandSwitzerlandSwitzerlandSwitzerlandSwitzerlandSwitzerlandSwitzerlandSwitzerlandSwitzerlandSwitzerlandSwitzerlandSwitzerlandSwitzerlandSwitzerland
UKUKUKUKUKUKUKUKUKUKUKUKUKUKUKUKUKUKUKUKUKUKUKUKUKUKUKUKUKUKUKUKUKUKUKUKUKUKUKUKUKUKUKUKUKUKUKUKUKUKUSUSUSUSUSUSUSUSUSUSUSUSUSUSUSUSUSUSUSUSUSUSUSUSUSUSUSUSUSUSUSUSUSUSUSUSUSUSUSUSUSUSUSUSUSUSUSUSUSUSUS
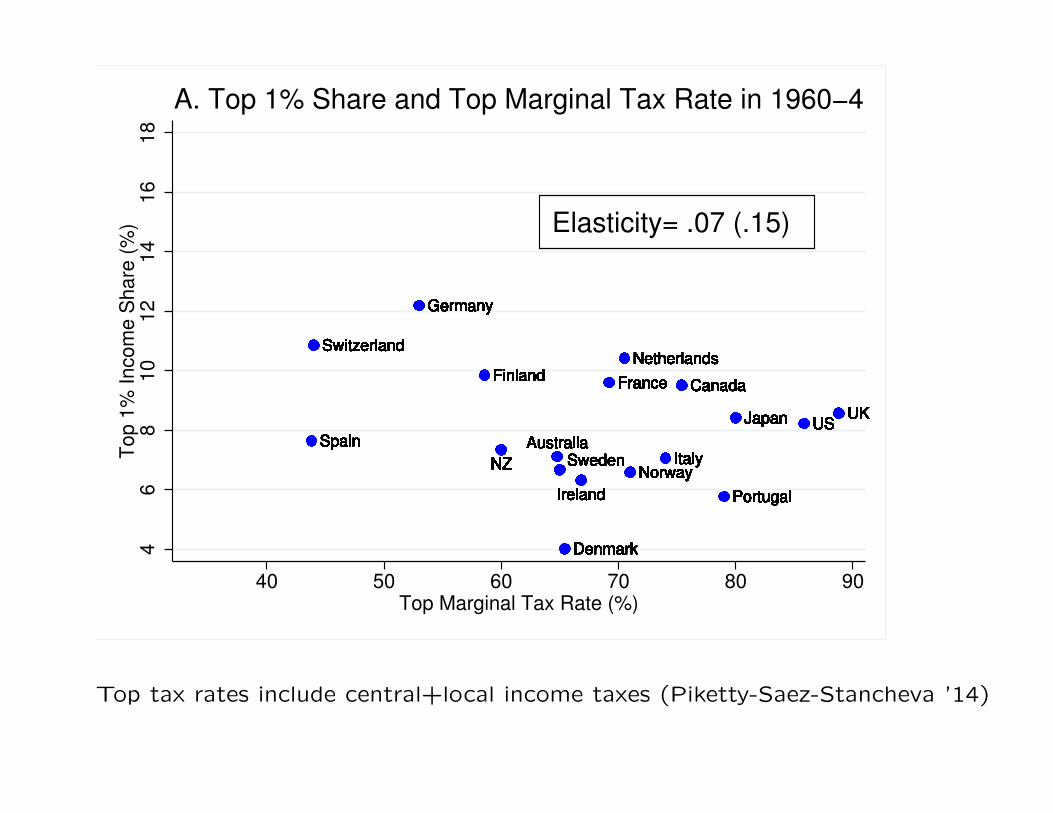
Elasticity= .07 (.15)
46
81
01
21
41
61
8T
op
1%
In
co
me
Sh
are
(%
)
40 50 60 70 80 90Top Marginal Tax Rate (%)
A. Top 1% Share and Top Marginal Tax Rate in 1960−4
Top tax rates include central+local income taxes (Piketty-Saez-Stancheva ’14)

AustraliaAustraliaAustraliaAustraliaAustraliaAustraliaAustraliaAustraliaAustraliaAustraliaAustraliaAustraliaAustraliaAustraliaAustraliaAustraliaAustraliaAustraliaAustraliaAustraliaAustraliaAustraliaAustraliaAustraliaAustraliaAustraliaAustraliaAustraliaAustraliaAustraliaAustraliaAustraliaAustraliaAustraliaAustraliaAustraliaAustraliaAustraliaAustraliaAustraliaAustraliaAustraliaAustraliaAustraliaAustraliaAustraliaAustraliaAustraliaAustralia
CanadaCanadaCanadaCanadaCanadaCanadaCanadaCanadaCanadaCanadaCanadaCanadaCanadaCanadaCanadaCanadaCanadaCanadaCanadaCanadaCanadaCanadaCanadaCanadaCanadaCanadaCanadaCanadaCanadaCanadaCanadaCanadaCanadaCanadaCanadaCanadaCanadaCanadaCanadaCanadaCanadaCanadaCanadaCanadaCanadaCanadaCanadaCanadaCanadaCanada
DenmarkDenmarkDenmarkDenmarkDenmarkDenmarkDenmarkDenmarkDenmarkDenmarkDenmarkDenmarkDenmarkDenmarkDenmarkDenmarkDenmarkDenmarkDenmarkDenmarkDenmarkDenmarkDenmarkDenmarkDenmarkDenmark
FinlandFinlandFinlandFinlandFinlandFinlandFinlandFinlandFinlandFinlandFinlandFinlandFinlandFinlandFinlandFinlandFinlandFinlandFinlandFinlandFinlandFinlandFinlandFinlandFinlandFinlandFinlandFinlandFinlandFinlandFinlandFinlandFinlandFinlandFinlandFinlandFinlandFinlandFinlandFinlandFinlandFinlandFinlandFinlandFinlandFinlandFinlandFinlandFinlandFinlandFranceFranceFranceFranceFranceFranceFranceFranceFranceFranceFranceFranceFranceFranceFranceFranceFranceFranceFranceFranceFranceFranceFranceFranceFranceFranceFranceFranceFranceFranceFranceFranceFranceFranceFranceFranceFranceFranceFranceFranceFranceFranceFranceFranceFranceFranceFrance
GermanyGermanyGermanyGermanyGermanyGermanyGermanyGermanyGermanyGermanyGermanyGermanyGermanyGermanyGermanyGermanyGermanyGermanyGermanyGermanyGermanyGermanyGermanyGermanyGermanyGermanyGermanyGermanyGermanyGermanyGermanyGermanyGermanyGermanyGermanyGermanyGermanyGermanyGermanyGermanyGermanyGermanyGermanyGermanyGermanyGermanyGermanyGermanyIrelandIrelandIrelandIrelandIrelandIrelandIrelandIrelandIrelandIrelandIrelandIrelandIrelandIrelandIrelandIrelandIrelandIrelandIrelandIrelandIrelandIrelandIrelandIrelandIrelandIrelandIrelandIrelandIrelandIrelandIrelandIrelandIrelandIrelandIreland
ItalyItalyItalyItalyItalyItalyItalyItalyItalyItalyItalyItalyItalyItalyItalyItalyItalyItalyItalyItalyItalyItalyItalyItalyItalyItalyItalyItalyItalyItalyItalyItalyItalyItalyItalyItaly
JapanJapanJapanJapanJapanJapanJapanJapanJapanJapanJapanJapanJapanJapanJapanJapanJapanJapanJapanJapanJapanJapanJapanJapanJapanJapanJapanJapanJapanJapanJapanJapanJapanJapanJapanJapanJapanJapanJapanJapanJapanJapanJapanJapanJapanJapan
NetherlandsNetherlandsNetherlandsNetherlandsNetherlandsNetherlandsNetherlandsNetherlandsNetherlandsNetherlandsNetherlandsNetherlandsNetherlandsNetherlandsNetherlandsNetherlandsNetherlandsNetherlandsNetherlandsNetherlandsNetherlandsNetherlandsNetherlandsNetherlandsNetherlandsNetherlandsNetherlandsNetherlandsNetherlandsNetherlandsNetherlandsNetherlandsNetherlandsNetherlandsNetherlandsNetherlandsNetherlandsNetherlandsNetherlandsNetherlandsNetherlandsNetherlandsNetherlandsNetherlandsNetherlandsNetherlandsNetherlands
NZNZNZNZNZNZNZNZNZNZNZNZNZNZNZNZNZNZNZNZNZNZNZNZNZNZNZNZNZNZNZNZNZNZNZNZNZNZNZNZNZNZNZNZNZNZNZNZNZNZ
NorwayNorwayNorwayNorwayNorwayNorwayNorwayNorwayNorwayNorwayNorwayNorwayNorwayNorwayNorwayNorwayNorwayNorwayNorwayNorwayNorwayNorwayNorwayNorwayNorwayNorwayNorwayNorwayNorwayNorwayNorwayNorwayNorwayNorwayNorwayNorwayNorwayNorwayNorwayNorwayNorwayNorwayNorwayNorwayNorwayNorwayNorwayNorwayNorway
PortugalPortugalPortugalPortugalPortugalPortugalPortugalPortugalPortugalPortugalPortugalPortugalPortugalPortugalPortugalPortugalPortugalPortugalPortugalPortugalPortugalPortugalPortugalPortugal
SpainSpainSpainSpainSpainSpainSpainSpainSpainSpainSpainSpainSpainSpainSpainSpainSpainSpainSpainSpainSpainSpainSpainSpainSpainSpainSpainSpainSpain
SwedenSwedenSwedenSwedenSwedenSwedenSwedenSwedenSwedenSwedenSwedenSwedenSwedenSwedenSwedenSwedenSwedenSwedenSwedenSwedenSwedenSwedenSwedenSwedenSwedenSwedenSwedenSwedenSwedenSwedenSwedenSwedenSwedenSwedenSwedenSwedenSwedenSwedenSwedenSwedenSwedenSwedenSwedenSwedenSwedenSwedenSwedenSwedenSwedenSwedenSweden
SwitzerlandSwitzerlandSwitzerlandSwitzerlandSwitzerlandSwitzerlandSwitzerlandSwitzerlandSwitzerlandSwitzerlandSwitzerlandSwitzerlandSwitzerlandSwitzerlandSwitzerlandSwitzerlandSwitzerlandSwitzerlandSwitzerlandSwitzerlandSwitzerlandSwitzerlandSwitzerlandSwitzerlandSwitzerlandSwitzerlandSwitzerlandSwitzerlandSwitzerlandSwitzerlandSwitzerlandSwitzerlandSwitzerlandSwitzerlandSwitzerlandSwitzerland
UKUKUKUKUKUKUKUKUKUKUKUKUKUKUKUKUKUKUKUKUKUKUKUKUKUKUKUKUKUKUKUKUKUKUKUKUKUKUKUKUKUKUKUKUKUKUKUKUKUK
USUSUSUSUSUSUSUSUSUSUSUSUSUSUSUSUSUSUSUSUSUSUSUSUSUSUSUSUSUSUSUSUSUSUSUSUSUSUSUSUSUSUSUSUSUSUSUSUSUSUS
Elasticity= 1.90 (.43)
46
81
01
21
41
61
8T
op
1%
In
co
me
Sh
are
(%
)
40 50 60 70 80 90Top Marginal Tax Rate (%)
B. Top 1% Share and Top Marginal Tax Rate in 2005−9
Top tax rates include central+local income taxes (Piketty-Saez-Stancheva ’14)
AustraliaAustraliaAustraliaAustraliaAustraliaAustraliaAustraliaAustraliaAustraliaAustraliaAustraliaAustraliaAustraliaAustraliaAustraliaAustraliaAustraliaAustraliaAustraliaAustraliaAustraliaAustraliaAustraliaAustraliaAustraliaAustraliaAustraliaAustraliaAustraliaAustraliaAustraliaAustraliaAustraliaAustraliaAustraliaAustraliaAustraliaAustraliaAustraliaAustraliaAustraliaAustraliaAustraliaAustraliaAustraliaAustraliaAustraliaAustraliaAustralia
CanadaCanadaCanadaCanadaCanadaCanadaCanadaCanadaCanadaCanadaCanadaCanadaCanadaCanadaCanadaCanadaCanadaCanadaCanadaCanadaCanadaCanadaCanadaCanadaCanadaCanadaCanadaCanadaCanadaCanadaCanadaCanadaCanadaCanadaCanadaCanadaCanadaCanadaCanadaCanadaCanadaCanadaCanadaCanadaCanadaCanadaCanadaCanadaCanadaCanada
DenmarkDenmarkDenmarkDenmarkDenmarkDenmarkDenmarkDenmarkDenmarkDenmarkDenmarkDenmarkDenmarkDenmarkDenmarkDenmarkDenmarkDenmarkDenmarkDenmarkDenmarkDenmarkDenmarkDenmarkDenmarkDenmark
FinlandFinlandFinlandFinlandFinlandFinlandFinlandFinlandFinlandFinlandFinlandFinlandFinlandFinlandFinlandFinlandFinlandFinlandFinlandFinlandFinlandFinlandFinlandFinlandFinlandFinlandFinlandFinlandFinlandFinlandFinlandFinlandFinlandFinlandFinlandFinlandFinlandFinlandFinlandFinlandFinlandFinlandFinlandFinlandFinlandFinlandFinlandFinlandFinlandFinland
FranceFranceFranceFranceFranceFranceFranceFranceFranceFranceFranceFranceFranceFranceFranceFranceFranceFranceFranceFranceFranceFranceFranceFranceFranceFranceFranceFranceFranceFranceFranceFranceFranceFranceFranceFranceFranceFranceFranceFranceFranceFranceFranceFranceFranceFranceFrance
GermanyGermanyGermanyGermanyGermanyGermanyGermanyGermanyGermanyGermanyGermanyGermanyGermanyGermanyGermanyGermanyGermanyGermanyGermanyGermanyGermanyGermanyGermanyGermanyGermanyGermanyGermanyGermanyGermanyGermanyGermanyGermanyGermanyGermanyGermanyGermanyGermanyGermanyGermanyGermanyGermanyGermanyGermanyGermanyGermanyGermanyGermanyGermany
IrelandIrelandIrelandIrelandIrelandIrelandIrelandIrelandIrelandIrelandIrelandIrelandIrelandIrelandIrelandIrelandIrelandIrelandIrelandIrelandIrelandIrelandIrelandIrelandIrelandIrelandIrelandIrelandIrelandIrelandIrelandIrelandIrelandIrelandIreland
ItalyItalyItalyItalyItalyItalyItalyItalyItalyItalyItalyItalyItalyItalyItalyItalyItalyItalyItalyItalyItalyItalyItalyItalyItalyItalyItalyItalyItalyItalyItalyItalyItalyItalyItalyItaly
JapanJapanJapanJapanJapanJapanJapanJapanJapanJapanJapanJapanJapanJapanJapanJapanJapanJapanJapanJapanJapanJapanJapanJapanJapanJapanJapanJapanJapanJapanJapanJapanJapanJapanJapanJapanJapanJapanJapanJapanJapanJapanJapanJapanJapanJapan
NetherlandsNetherlandsNetherlandsNetherlandsNetherlandsNetherlandsNetherlandsNetherlandsNetherlandsNetherlandsNetherlandsNetherlandsNetherlandsNetherlandsNetherlandsNetherlandsNetherlandsNetherlandsNetherlandsNetherlandsNetherlandsNetherlandsNetherlandsNetherlandsNetherlandsNetherlandsNetherlandsNetherlandsNetherlandsNetherlandsNetherlandsNetherlandsNetherlandsNetherlandsNetherlandsNetherlandsNetherlandsNetherlandsNetherlandsNetherlandsNetherlandsNetherlandsNetherlandsNetherlandsNetherlandsNetherlandsNetherlands
NZNZNZNZNZNZNZNZNZNZNZNZNZNZNZNZNZNZNZNZNZNZNZNZNZNZNZNZNZNZNZNZNZNZNZNZNZNZNZNZNZNZNZNZNZNZNZNZNZNZ
NorwayNorwayNorwayNorwayNorwayNorwayNorwayNorwayNorwayNorwayNorwayNorwayNorwayNorwayNorwayNorwayNorwayNorwayNorwayNorwayNorwayNorwayNorwayNorwayNorwayNorwayNorwayNorwayNorwayNorwayNorwayNorwayNorwayNorwayNorwayNorwayNorwayNorwayNorwayNorwayNorwayNorwayNorwayNorwayNorwayNorwayNorwayNorwayNorwayPortugalPortugalPortugalPortugalPortugalPortugalPortugalPortugalPortugalPortugalPortugalPortugalPortugalPortugalPortugalPortugalPortugalPortugalPortugalPortugalPortugalPortugalPortugalPortugal
SpainSpainSpainSpainSpainSpainSpainSpainSpainSpainSpainSpainSpainSpainSpainSpainSpainSpainSpainSpainSpainSpainSpainSpainSpainSpainSpainSpainSpain
SwedenSwedenSwedenSwedenSwedenSwedenSwedenSwedenSwedenSwedenSwedenSwedenSwedenSwedenSwedenSwedenSwedenSwedenSwedenSwedenSwedenSwedenSwedenSwedenSwedenSwedenSwedenSwedenSwedenSwedenSwedenSwedenSwedenSwedenSwedenSwedenSwedenSwedenSwedenSwedenSwedenSwedenSwedenSwedenSwedenSwedenSwedenSwedenSwedenSwedenSweden
SwitzerlandSwitzerlandSwitzerlandSwitzerlandSwitzerlandSwitzerlandSwitzerlandSwitzerlandSwitzerlandSwitzerlandSwitzerlandSwitzerlandSwitzerlandSwitzerlandSwitzerlandSwitzerlandSwitzerlandSwitzerlandSwitzerlandSwitzerlandSwitzerlandSwitzerlandSwitzerlandSwitzerlandSwitzerlandSwitzerlandSwitzerlandSwitzerlandSwitzerlandSwitzerlandSwitzerlandSwitzerlandSwitzerlandSwitzerlandSwitzerlandSwitzerland
UKUKUKUKUKUKUKUKUKUKUKUKUKUKUKUKUKUKUKUKUKUKUKUKUKUKUKUKUKUKUKUKUKUKUKUKUKUKUKUKUKUKUKUKUKUKUKUKUKUK
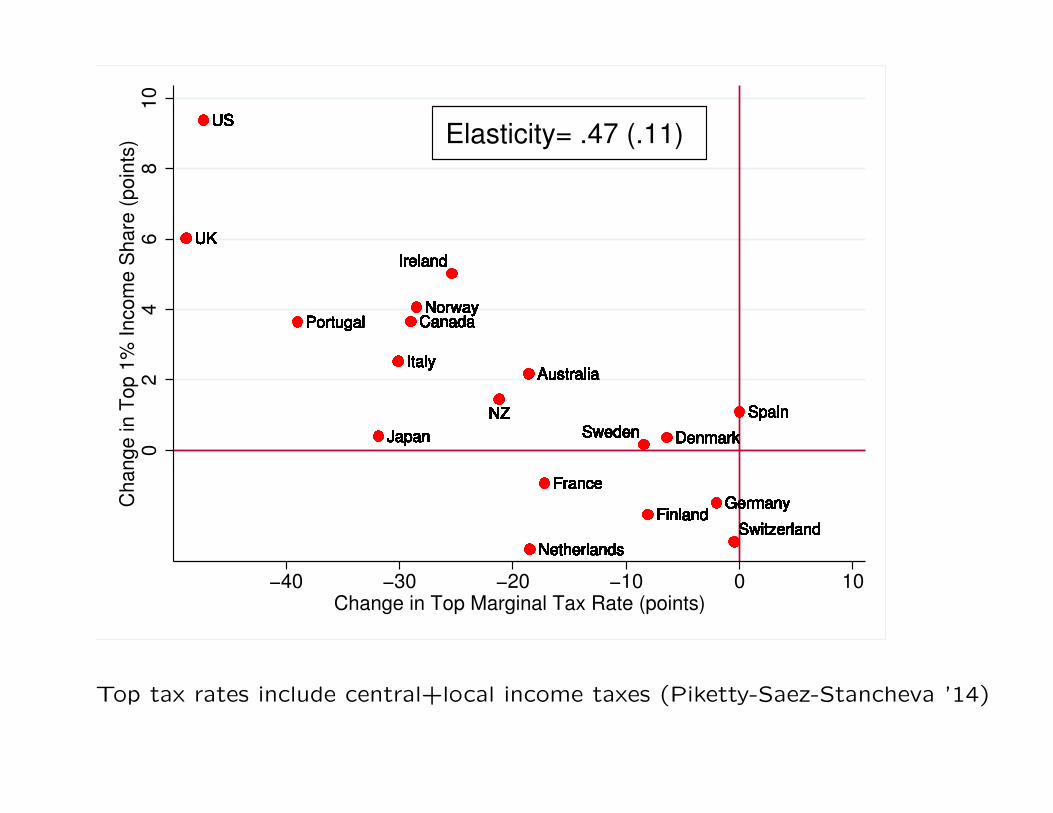
USUSUSUSUSUSUSUSUSUSUSUSUSUSUSUSUSUSUSUSUSUSUSUSUSUSUSUSUSUSUSUSUSUSUSUSUSUSUSUSUSUSUSUSUSUSUSUSUSUSUSElasticity= .47 (.11)
02
46
81
0C
ha
ng
e in
To
p 1
% I
nco
me
Sh
are
(p
oin
ts)
−40 −30 −20 −10 0 10Change in Top Marginal Tax Rate (points)
Top tax rates include central+local income taxes (Piketty-Saez-Stancheva ’14)
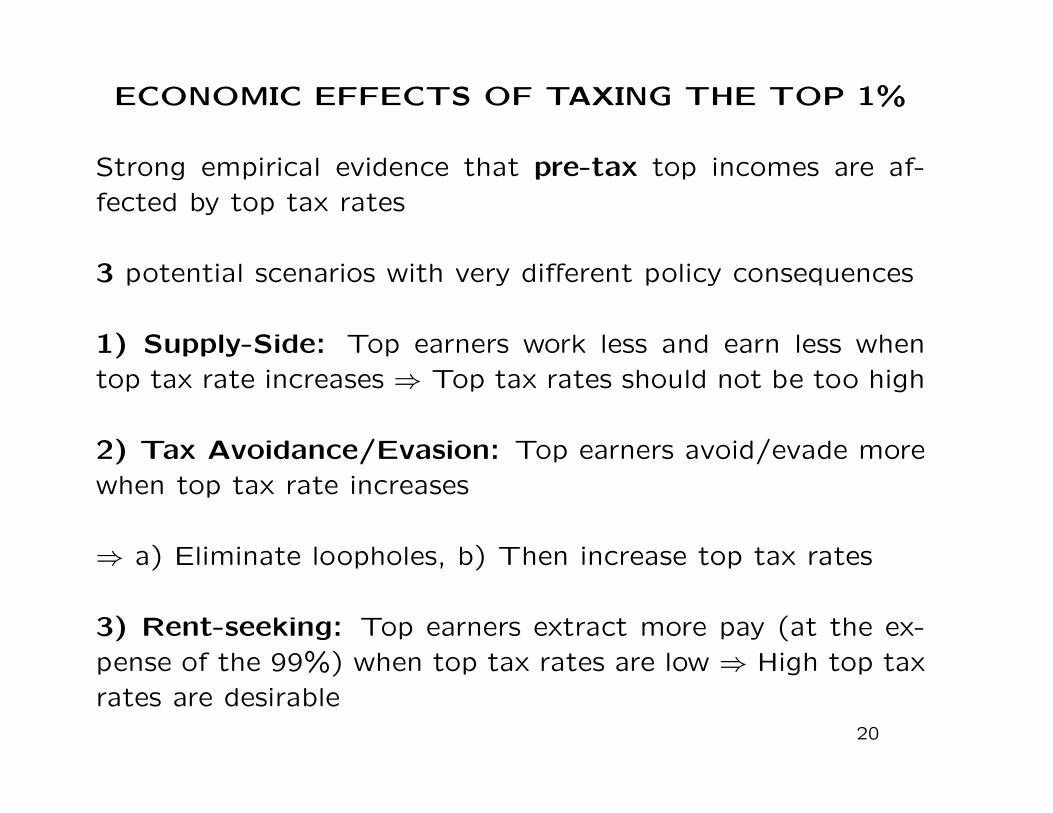
ECONOMIC EFFECTS OF TAXING THE TOP 1%
Strong empirical evidence that pre-tax top incomes are af-fected by top tax rates
3 potential scenarios with very different policy consequences
1) Supply-Side: Top earners work less and earn less whentop tax rate increases ⇒ Top tax rates should not be too high
2) Tax Avoidance/Evasion: Top earners avoid/evade morewhen top tax rate increases
⇒ a) Eliminate loopholes, b) Then increase top tax rates
3) Rent-seeking: Top earners extract more pay (at the ex-pense of the 99%) when top tax rates are low ⇒ High top taxrates are desirable
20

01
02
03
04
05
06
07
08
09
01
00
To
p M
arg
ina
l T
ax R
ate
(%
)
05
10
15
20
25
To
p 1
% I
nco
me
Sh
are
s (
%)
1913 1923 1933 1943 1953 1963 1973 1983 1993 2003 2013Year
Pre−tax Top 1% share Top MTR
Top 1% Income Share (pre−tax) and Top Marginal Tax Rate

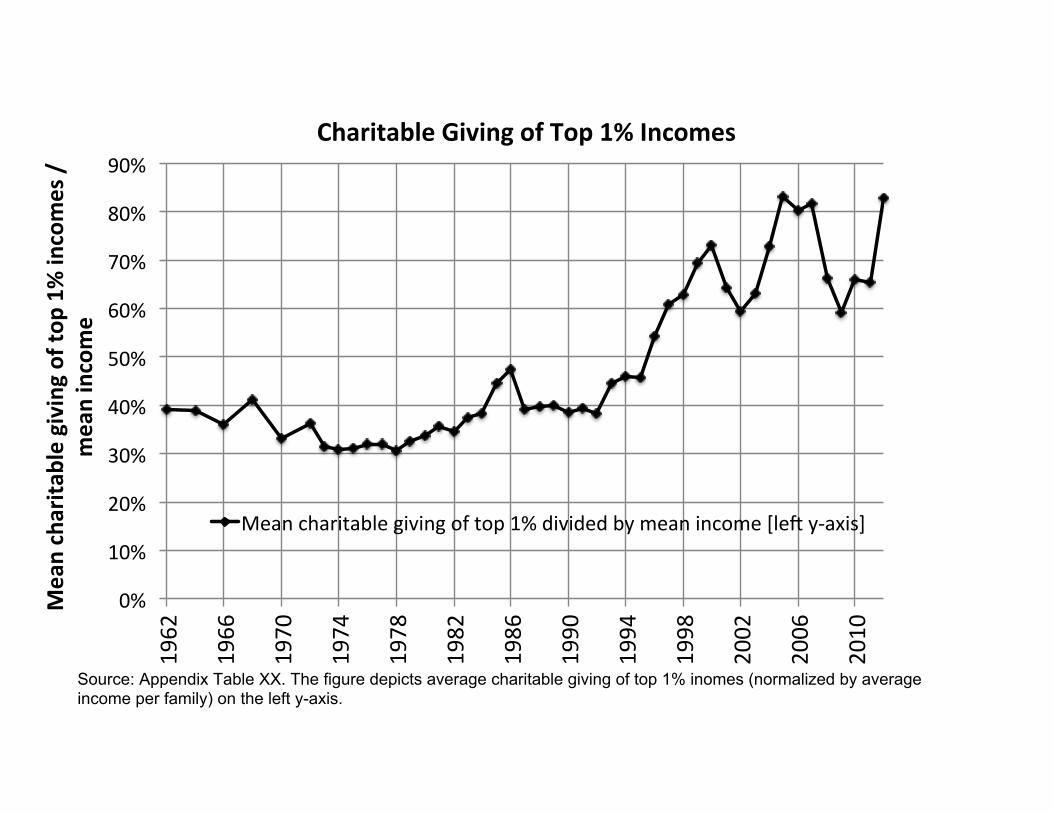
Real changes vs. tax Avoidance?
Test using charitable giving behavior of top income earners
Because charitable is tax deductible, incentives to give are
stronger when tax rates are higher
Under the tax avoidance scenario, reported incomes and re-
ported charitable giving should move in opposite directions
Empirically, charitable giving of top income earners has grown
in close tandem with top incomes
⇒ Incomes at the top have grown for real
21
0%
10%
20%
30%
40%
50%
60%
70%
80%
90% 1962
1966
1970
1974
1978
1982
1986
1990
1994
1998
2002
2006
2010 M
ean charita
ble giving of top
1% incomes /
mean income
Charitable Giving of Top 1% Incomes
Mean charitable giving of top 1% divided by mean income [leA y-‐axis]
Source: Appendix Table XX. The figure depicts average charitable giving of top 1% inomes (normalized by average income per family) on the left y-axis.

0%
5%
10%
15%
20%
25%
0%
10%
20%
30%
40%
50%
60%
70%
80%
90% 1962
1966
1970
1974
1978
1982
1986
1990
1994
1998
2002
2006
2010
Top 1%
income share
Mean charita
ble giving of top
1% incomes /
mean income
Charitable Giving of Top 1% Incomes, 1962-‐2012
Mean charitable giving of top 1% divided by mean income [leA y-‐axis]
Top 1% Income Share [right y-‐axis]
Source: Appendix Table XX. The figure depicts average charitable giving of top 1% inomes (normalized by average income per family) on the left y-axis. For comparison, the figure reports the top 1% income share (on the right y-axis).
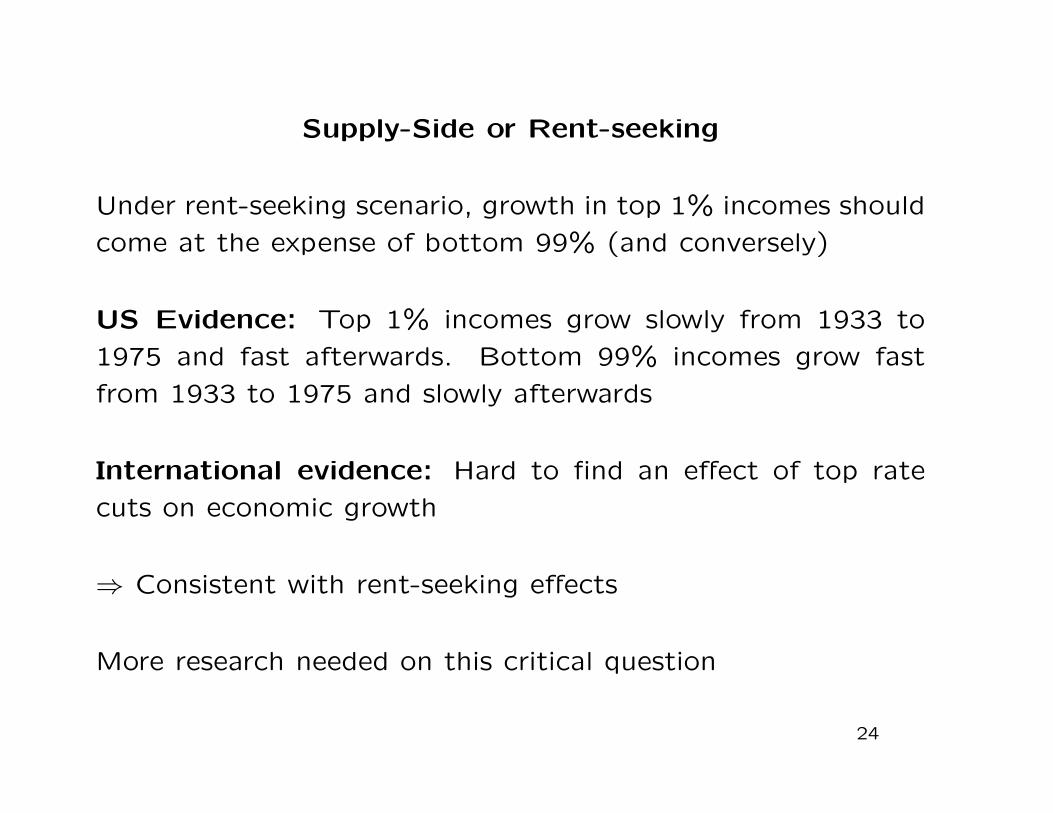
Supply-Side or Rent-seeking
Under rent-seeking scenario, growth in top 1% incomes should
come at the expense of bottom 99% (and conversely)
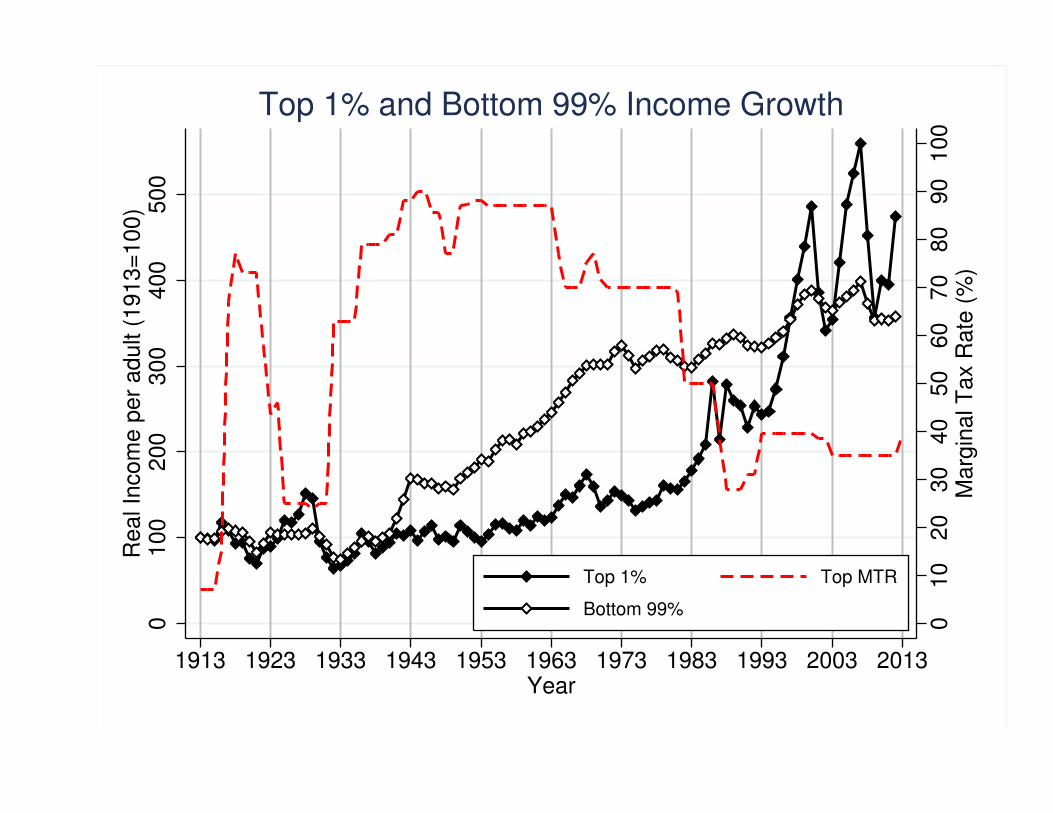
US Evidence: Top 1% incomes grow slowly from 1933 to
1975 and fast afterwards. Bottom 99% incomes grow fast
from 1933 to 1975 and slowly afterwards
International evidence: Hard to find an effect of top rate
cuts on economic growth
⇒ Consistent with rent-seeking effects
More research needed on this critical question
24
010
20
30
40
50
60
70
80
90
100
Marg
inal T
ax R
ate
(%
)
0100
200
300
400
500
Real In
com
e p
er
adult (
1913=
100)
1913 1923 1933 1943 1953 1963 1973 1983 1993 2003 2013Year
Top 1% Top MTR
Bottom 99%
Top 1% and Bottom 99% Income Growth

POLICY CONCLUSIONS
1) US historical evidence and international evidence shows that
tax policy plays a key role in the shaping inequality
2) High top tax rates reduce the pre-tax income gap without
visible effect on economic growth
3) Public will favor more progressive taxation only if it is con-
vinced that top income gains are detrimental to the 99%
4) In globalized world, progressive taxation will require inter-
national coordination to keep tax avoidance/evasion low
25

SUPPLEMENTARY SLIDES
26
010
20
30
40
50
60
70
80
90
100
Top M
arg
inal T
ax R
ate
(%
)
05
10
15
20
25
Top 1
% Incom
e S
hare
s (
%)
1913 1923 1933 1943 1953 1963 1973 1983 1993 2003 2013Year
Pre−tax Top 1% share Top MTR
Top 1% Income Share (pre−tax) and Top Marginal Tax Rate

010
20
30
40
50
60
70
80
90
100
Marg
inal T
ax R
ate
s (
%)
05
10
15
20
25
Top 1
% Incom
e S
hare
s (
%)
1913 1923 1933 1943 1953 1963 1973 1983 1993 2003 2013Year
Top 1% Share Top MTR
Top 1% (excl. KG) MTR K gains
Tax Avoidance: Top 1% Income Shares and Top MTR
Australia
Belgium
Canada
France
Germany
Ireland
Italy
Netherlands
Norway
Sweden
Switzerland
United Kingdom
United States1
.01
.52
.02
.53
.03
.5C
EO
pa
y($
mill
ion
, lo
g−
sca
le)
.4 .5 .6 .7 .8Top Income Marginal Tax Rate
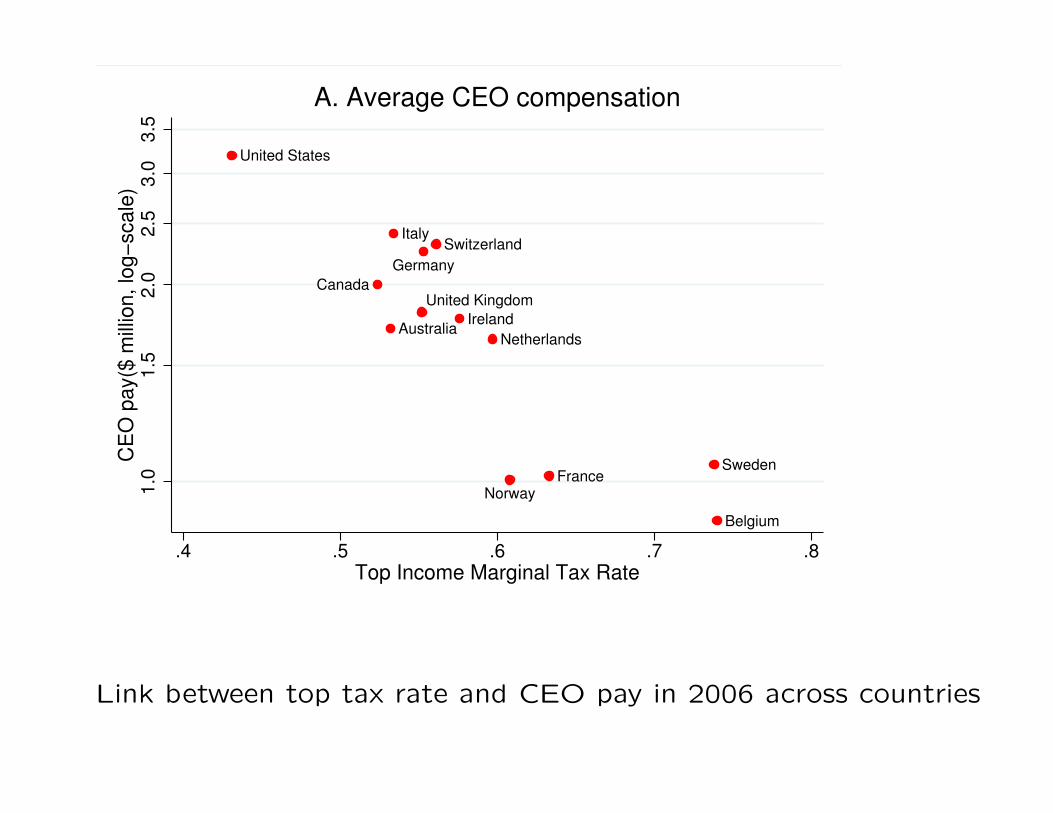
A. Average CEO compensation
Link between top tax rate and CEO pay in 2006 across countries

Australia
Belgium
Canada
France
Germany
Ireland
Italy
Netherlands
Norway
Sweden
Switzerland
United Kingdom
United States
1.0
1.5
2.0
2.5
3.0
3.5
CE
O p
ay($
mill
ion
, lo
g−
sca
le)
with
co
ntr
ols
.4 .5 .6 .7 .8Top Income Marginal Tax Rate
B. Average CEO compensation with controls
Controlling for firm profitability, governance, size, and industry

20
30
40
50
60
70
0 10 20 30 40 50 60 70 80 90 100
Me
an
Child
In
com
e R
an
k
Parent Income Rank
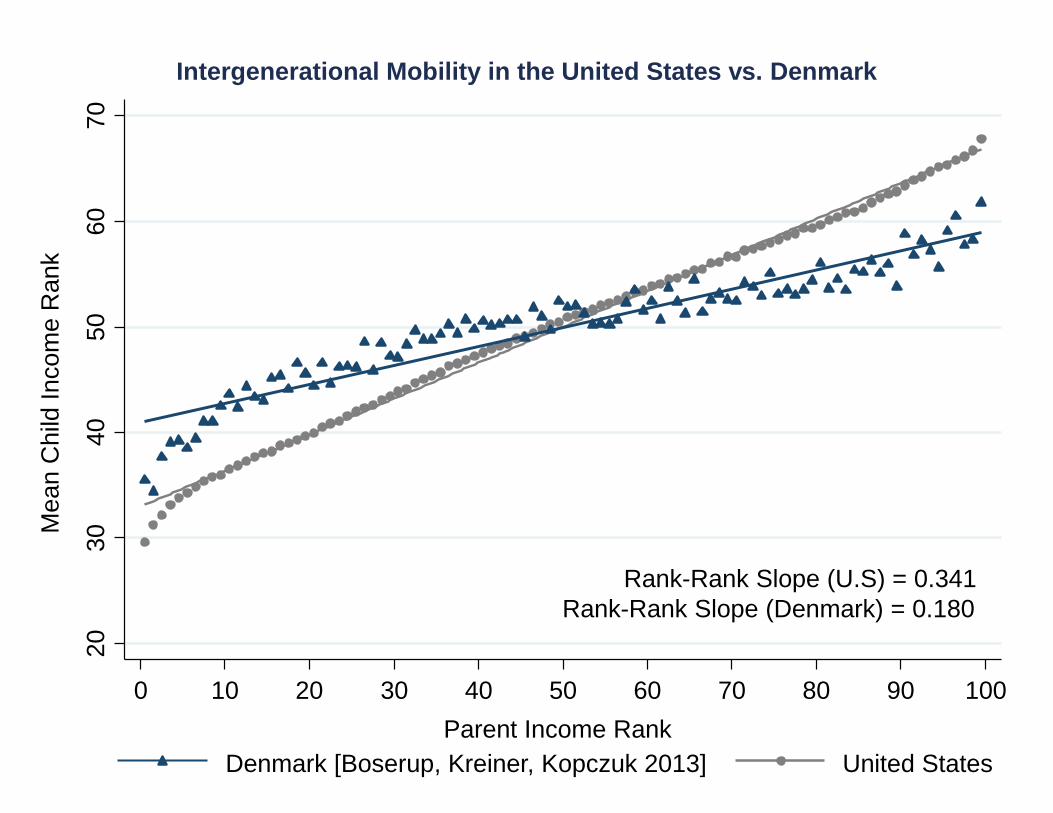
Mean Child Percentile Rank vs. Parent Percentile Rank
Rank-Rank Slope (U.S) = 0.341 (0.0003)
20
30
40
50
60
70
0 10 20 30 40 50 60 70 80 90 100
Me
an
Child
In
com
e R
an
k
Parent Income Rank
United States Denmark [Boserup, Kreiner, Kopczuk 2013]
Rank-Rank Slope (Denmark) = 0.180
Intergenerational Mobility in the United States vs. Denmark
Rank-Rank Slope (U.S) = 0.341

REFERENCES
Alvaredo, Facundo, Atkinson, Anthony, Thomas Piketty, and EmmanuelSaez, The World Top Incomes Database (web)
Atkinson, Anthony, Thomas Piketty, and Emmanuel Saez “Top Incomesin the Long Run of History,” Journal of Economic Literature 49(1), 2011,3-71. (web)
Chetty, Raj, Nathan Hendren, Patrick Kline, and Emmanuel Saez, “Whereis the Land of Opportunity? The Geography of Intergenerational Mobilityin the United States,” NBER Working Paper No. 19843, January 2014,forthcoming Quarterly Journal of Economics (web)
Piketty, Thomas, Capital in the 21st Century, Cambridge: Harvard Uni-versity Press, 2014, (web)
Piketty, Thomas and Emmanuel Saez “Income Inequality in the UnitedStates, 1913-1998”, Quarterly Journal of Economics, 118(1), 2003, 1-39.(web)
Piketty, Thomas and Emmanuel Saez “Inequality in the Long-Run”, Sci-ence 344, 2014, 838-843 (web)
Piketty, Thomas, Emmanuel Saez, and Stefanie Stantcheva “Optimal Tax-ation of Top Labor Incomes: A Tale of Three Elasticities,” AmericanEconomic Journal: Economic Policy 2014, 6(1), 2014, 230-271. (web)
28

Saez, Emmanuel and Gabriel Zucman, “Wealth Inequality in the UnitedStates since 1913: Evidence from Capitalized Income Tax Data,” slidesJuly 2014. (web)


