
1
Incorporating ROI Into R&D Prioritization and Decision-Making
Katie MacFarlane, PharmD
Chief Commercial Officer
Agile Therapeutics
Managing Partner, SmartPharma LLC
R&D Open Innovation and Portfolio Optimization
April 8, 2014
Stacey Seltzer, MBA
Principal
Aisling Capital

2
Session Agenda
• Welcome
• ROI and the Changing Pharma Landscape
– Impact of ROI on investment in pharmaceutical product
development
– Globalization and Health Policy Impact on ROI Analysis
• Break
• Modeling ROI – Elements of Decision-Making
• Decision Matrix Example
• Risks and Pitfalls

3
Introductions
• Session Speakers
– Katie MacFarlane, PharmD
Agile Therapeutics and SmartPharma LLC
– Stacey Seltzer
Aisling Capital
• Participants
• Interactive Session

4
The Challenge:How to Balance Innovation with ROI?
Source: Deloitte Center for Health Solutions and Thomson Reuters Life Sciences, Measuring the return from pharmaceutical innovation
2013. http://thomsonreuters.com. Data based on 12 largest life science companies, products in Phase III or submitted for approval.
• Peak sales and asset value have declined
5
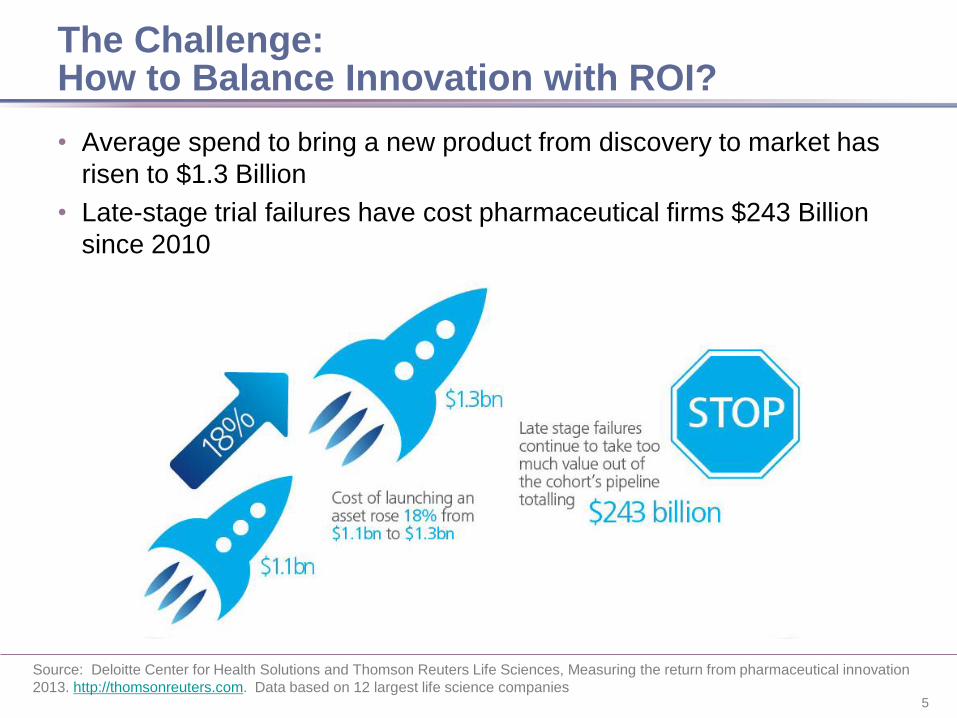
The Challenge:How to Balance Innovation with ROI?
• Average spend to bring a new product from discovery to market has
risen to $1.3 Billion
• Late-stage trial failures have cost pharmaceutical firms $243 Billion
since 2010
Source: Deloitte Center for Health Solutions and Thomson Reuters Life Sciences, Measuring the return from pharmaceutical innovation
2013. http://thomsonreuters.com. Data based on 12 largest life science companies

6
The Challenge:How to Balance Innovation with ROI?
• Expected ROI from the 12 biggest pharma firms late-
stage pipelines has fallen
Source: Deloitte Center for Health Solutions and Thomson Reuters Life Sciences, Measuring the return from pharmaceutical innovation
2013. http://thomsonreuters.com. Data based on 12 largest life science companies, products in Phase III or submitted for approval.
7
Venture Investing as a Driver of R&D Prioritization
• 64% of Pharma pipeline products come from outside the
company (e.g. acquisitions)
• Corporate Pharma R&D continues to move towards an
external innovation hub model
– e.g. J&J Innovation Center, Sanofi’s Sunrise, Pfizer’s CTI
– Big R&D megasites are shedding jobs
• There were 46 US Biotech IPOs in 2013
– 32 of these were for VC-backed biotech companies
• ~ 3.5 Billion was raised into VC funds for life science
investing in 2013
Sources: Life Sci VC, http://lifescivc.com/2014/01/perspectives-on-biotech-looking-backward-forward/ and Deloitte Center for Health
Solutions and Thomson Reuters Life Sciences, Measuring the return from pharmaceutical innovation 2013. http://thomsonreuters.com.
Data based on 12 largest life science companies

8
How Does the Current Environment Effect Investment in Biotech/Startups?
• What are the elements considered by venture investors?
– Time to bring a new product to market?
– Cost to bring a new product to market?
– Potential revenue of new product?
– Probability of success?
– Opportunity for ‘exit’, either by IPO or acquisition?

9
What Types of Investments are VCs Making?
• Are there types of investments that are more or less
attractive to venture investors today?
– First financing / “seed” financing
– Large biotech financings (e.g. >$50 Million)
• Do corporate venture funds invest differently than
traditional venture funds?

10
What Markets Should be Considered for ROI?
Source: IMS Health Market Prognosis, Sep 2010 , at www.asiahealthspace.com

11
The Pursuit of Improved R&D Returns
• Choose assets with higher commercial and therapeutic
potential
• Fulfill genuine unmet needs
• Demonstrate value and cost-effectiveness
Source: Deloitte Center for Health Solutions and Thomson Reuters Life Sciences, Measuring the return from pharmaceutical innovation
2013. http://thomsonreuters.com.

12
Unmet Market Needs
Breakthrough
Source: Forecasting New Product Revenues, LEK Consulting Executive Insights, Volume IV, Issue 2, LEK.com
Juxtapid And Kynamro: Race Of
Two Orphan Drugs To MarketMarch 6, 2013
Amgen's PCSK9 drug slashes
'bad' cholesterol in PhIII,
stoking blockbuster hopesMarch 30, 2014
Demonstrating Need for
Continued Improvement
Cure for Alzheimer's closerby JAMES CHAPMAN, Daily Mail
Could an HIV injection
be on the horizon?
Hope for breakthrough on path
to Parkinson's cure
Drug Makers See Profit
Potential in Rare Diseases

13
Health Policy Effects
• The ACA may bring the US closer to
cost containment strategies in the
rest of the developed world
• The ‘new buyers’ of healthcare are
anticipated to increase influence on
pricing and access
– Payors (regional authorities,
insurers, employers)
– Patients
• Does Cost Effectiveness = ‘cost
replacement’?
Source: Pharma Industry, the Next Challenge – Improving Clinical and Economic Value. Monitor Deloitte, 2013
Lawmakers Attack Cost of New
Hepatitis Drug

14
Questions from the New Buyers
• What outcomes will be achieved in my population?
• What is the clinical rationale for the product price point?
Source: Pharma Industry, the Next Challenge – Improving Clinical and Economic Value. Monitor Deloitte, 2013

15
Break
Incorporating ROI Into R&D Prioritization and Decision-Making

16
Modeling ROI: Revenue Forecasts are an Integral Element
• Forecasting is not a perfect science…in fact, many would
say it is not a science at all

17
Forecasts are Often Inaccurate
• More than 60% of consensus forecasts from sell-side analysts were
over or under by at least 40%
• Forecast accuracy improves only marginally over time, after a drug is
approved
Source: Cha M, et al. Pharmaceutical Forecasting: throwing darts? Nature Reviews 2013;12:737-8 and supplemental information.
Data set consists of more than 1,700 individual analyst forecasts on 260 launched drugs

18
Non-Big Pharma Drugs are More Likely to be Overestimated
Source: Cha M, et al. Pharmaceutical Forecasting: throwing darts? Nature Reviews 2013;12:737-8 and supplemental information.
Data set consists of more than 1,700 individual analyst forecasts on 260 launched drugs

19
Incorporating ROI into R&D Decision-Making
• Elements of Forecasting Revenue for R&D Products
– Market sizing
– Product uptake and usage
– Pricing
– Probability of success
– Net Present Value (NPV)

20
Market Sizing Methodology
• Rx- based
– Requires existing treatments / categories
– May not reflect total potential – e.g. unmet need
• Sales-based
– Requires existing treatments / categories
– Need to adjust for price
• Population based
– Relies on many estimates (prevalent population, etc)
– May overstate the potential if data are not adjusted to reflect the true
population for treatment
• Age and sex
• % diagnosed
• % treated
• compliance

21
Market Sizing:Population Size Hype and Reality
• Example: Alzheimer’s Disease Prevalence
• Market Sizing Factors to Consider
– Source of data – inherent bias
– Surveillance data vs. diagnosed patients
– Incidence and prevalence
• Be careful when applying to population (e.g. including peds)
5.2 Million(Source: Alzheimer’s
Association)
2.4 Million(Source: ADAMS
Study, NIH)
Hype Reality
22
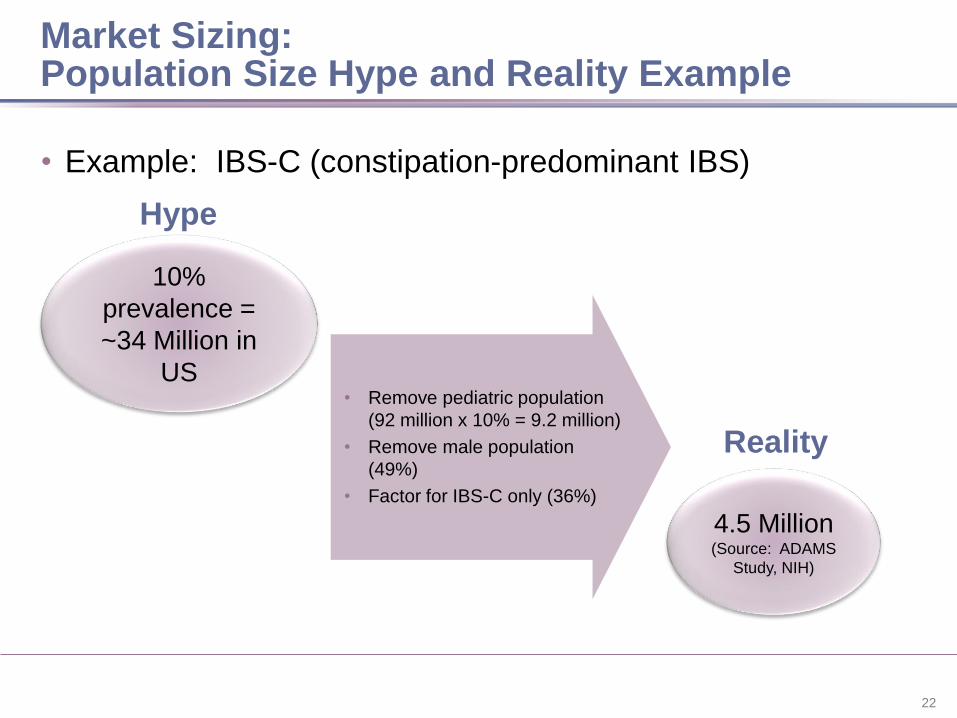
Market Sizing:Population Size Hype and Reality Example
• Example: IBS-C (constipation-predominant IBS)
10%
prevalence =
~34 Million in
US
4.5 Million(Source: ADAMS
Study, NIH)
Hype
Reality
• Remove pediatric population
(92 million x 10% = 9.2 million)
• Remove male population
(49%)
• Factor for IBS-C only (36%)

23
Product Uptake and Usage
• Potential sources of assumptions
– Analysis of product characteristics compared to
existing treatments
– Model based on market analogs
• Peak share
• Time to peak share
– Primary market research to estimate peak share
• Qualitative vs. quantitative
• Prescriber + consumer
$
$$$
Source: Forecasting New Product Revenues, LEK Consulting Executive Insights, Volume IV, Issue 2, LEK.com

24
Product Uptake and Usage
• Need to adjust estimates based upon
– Physician stated intentions vs. actual prescribing behavior
• Crude estimate (50%) vs. proprietary models
• Adjustment may differ with degree of unmet market need
– Changes in market environment over time, as compared to analogs, e.g.
• Number of competitors
• Reimbursement environment
• Influence of consumer in choice
– Expected level of promotional support
Source: Howie and Luby, MM&M August 2009, p.56-58 and LEK Consulting Executive Insights, Volume IV, Issue 2, LEK.com

2525
Probability of Success
Summary of Published Literature on Probability of Success
Source and Study DescriptionPhase I -
Approval
Phase I-
Phase II
Phase II –
Phase III
Phase III-
Approval
DiMasi J, J Health Economics 2003
68 drugs, 1980-199922.2% 71.0% 44.2% 70.7%*
DiMasi J, Clin Pharmacol Ther 2010
1738 drugs, 1993-200419.0% 71.0% 45.0% 64.0%
Davis M, Vaccine 2011
4235 drugs, 132 vaccines, 1995-201126.2%* 74.0% 58.0% 61.0%
BIO BioMed Tracker Study, 2011
4275 drugs9.0% 63.0% 33.0% 44.0%
Average 19.1% 69.8% 45.1% 59.9%
• Allows for adjustment for regulatory risk
• Should be employed at any point along the development
path, including following NDA submission
*calculated value
Source: SmartPharma LLC analysis, 2013

26
Example NPV (US Only)
2014 2015 2016 2017 2018 2019 2020 2021Product X Gross Sales ($000)
Rebates, Returns, Dist ($000)
Product X Net Sales ($000)
Total A&P Expenses ($000) $ 2,000
Annual US R&D Expense ($000) $ 2,000 $ 2,000 $ 2,000 $ 15,000 $ 25,000 $ 40,000 $ 50,000 $ 30,000 COGS ($000)
Product X Net Revenue ($000) $ (2,000) $ (2,000) $ (2,000) $ (15,000) $ (25,000) $ (40,000) $ (50,000) $ (32,000)
2022 2023 2024 2025 2026 2027 2028 2029 2030
Product X Gross Sales ($000) $ 2,623,979 $ 3,427,737 $ 3,517,571 $ 3,006,730 $ 2,611,564 $ 2,335,688 $ 2,431,919
Rebates, Returns, Dist ($000) $ 393,597 $ 685,547 $ 879,393 $ 751,683 $ 652,891 $ 583,922 $ 607,980 Product X Net Sales ($000) $ 2,230,383 $ 2,742,189 $ 2,638,178 $ 2,255,048 $ 1,958,673 $ 1,751,766 $ 1,823,939
Total A&P Expenses ($000) $ 3,500 $ 5,000 $ 100,000 $ 80,000 $ 80,000 $ 100,000 $ 100,000 $ 100,000 $ 100,000
Annual US R&D Expense ($000) $ 15,000 $ 5,000 $ 3,000 $ 2,000 $ 2,000 $ 2,000 $ 2,000 $ 2,000 $ 2,000 COGS ($000) $ 131,199 $ 171,387 $ 175,879 $ 150,337 $ 130,578 $ 116,784 $ 121,596
Product X Net Revenue ($000) $ (18,500) $ (10,000) $ 1,996,184 $ 2,488,803 $ 2,380,300 $ 2,002,711 $ 1,726,095 $ 1,532,982 $ 1,600,343
Net Present Value ($000) $ 1,131,849 Discount Rate 20%
Probability of Success 19%
Probability-Adjusted NPV ($000) $ 216,183

27
Example R&D Decision Matrix
ProjectUnmet
NeedTiming Investment Clinical Risk
Regulatory
Risk
Commercial
Potential
H / M / L years $Millions
H / M / L
(Prob of
Success)
H / M / L
(Prob of
Success)
NPV
($Millions)
XXX-0001
XXX-0002

28
Risks and Pitfalls of Using ROI in Early R&D Decision-Making
• Many unknowns feeding into financials
– Numbers can become very concrete
– Try doing a qualitative analysis first
• High risk programs are most likely to have highest NPV, if they are
fulfilling an unmet market need
– Need to balance portfolio
– Multiple ‘shots on goal’
– Hedge for failure with multiple programs/indications
• Lower-risk programs may not look as desirable / may be difficult to get
funded
– Look for lifecycle opportunities
• ‘Not invented here’ syndrome
– Give appropriate weight to external opportunities

29
Thank You


