
INDIAN OCEAN MEMORANDUM OF UNDERSTANDING ON PORT STATE CONTROL
The Committee is pleased to present the eighth annual Port State Control report for the Indian
Ocean Memorandum of Understanding on PSC. This annual report outlines recent activities &
general introduction to the developments in the region along with statistical port State inspection
data, conducted by the member Authorities of IOMOU in the year 2006.
Indian Ocean MOU on PSC stepped into the eighth year of its establishment. Slowly but steadily it
is making its impact in the shipping world. The dedicated commitment of the member Authorities
to eliminate sub-standard ships from the region is the key to this success. However, the member
Authorities are fully aware that there is more to attain and are striving towards that.
The member Authorities of the MOU are committed to achieve the objectives of improving
maritime safety, working and living conditions as well as the protection of the marine
environment. They are also committed to face the new set of challenges to ensure ship and port
facility security. Taking lead from the Declaration at the end of the Second Joint Ministerial
Conference of the Paris and Tokyo Memoranda of Understanding on Port State Control, the
Committee decided to take steps towards furthering the co-operation with other MOUs in general
and Paris and Tokyo MOU in particular.
The Indian Ocean MOU will continue its efforts to further enhance and improve the port State
control activities in the region.
Sudhir Kumar Bimalesh Ganguli
Chairman Secretary
Port State Control Committee IOMOU Secretariat
FOREWORD
INDIAN OCEAN MEMORANDUM OF UNDERSTANDING ON PORT STATE CONTROL
CONTENTS
page
INTRODUCTION
General ………………………………………………………… 1
List of The Members and The Observers …………………….... 2
ORGANISATIONAL STRUCTURE
Organigram ……………………………………………………… 3
IOMOU Secretariat ……………………………………………… 5
Contact Details …………………………………………………... 5
THE COMMITTEE
A description of its work. Some objectives …………………… 6
TRAINING FOR PORT STATE CONTROL OFFICERS ………… 6
CO-OPERATION WITH OTHER REGIONAL MOUS………….. 7
IOCIS / WEBSITE ……………………………………………………. 8
STATISTICS …………………………………………………………. 9
PORT STATE INSPECTION ACTIVITIES ………………………. 10

INDIAN OCEAN MEMORANDUM OF UNDERSTANDING ON PORT STATE CONTROL
LIST OF TABLES AND FIGURES
page
Table 1 Deficiencies by Type of Ship …………………………….. 11
Table 2 Deficiencies by Flag ………………………………………. 12
Table 3 Deficiencies by Categories …………………………………. 14
Table 4 Deficiencies by Classification Societies …………………... 15
Table 5 Comparison of Inspections and Deficiencies
per Ship Type ……………………………………………... 16
Table 6 Comparison of Inspections and Detentions
per Ship Type ……………………………………………… 17
Table 7 Comparison of Inspections and Detentions
per Flag …………………………………………………….. 18
Table 8 Comparison of Deficiencies by Categories ………………… 21
Table 9 Comparison of Inspections and Deficiencies
per Classification Societies ………………………………… 22
Table 10 Comparison of Inspections and Detentions
per Classification Societies ………………………………… 24
Figure 1 Inspection Efforts ……………………………………... 26
Figure 2 Percentage of Ship Type with Deficiencies………………… 27
Figure 3 Percentage of Detention per Ship Type ……………………. 28
Figure 4 Deficiencies by Flag ……….……………………………… 29
Figure 5 Percentage of Detentions by Flag ………....………………… 30
Figure 6 Deficiency Percentage by Categories .. ……………………… 31
Figure 7 Detention Percentage by Classification
Societies …………………………………………………….. 32
Figure 8 Comparison of Inspections per Ship Type ………………… 33
Figure 9 Comparison of Detentions per Ship Type …………………. 34
Figure10 Summary of 3-year Inspections with
Deficiencies per Ship Type ……………………………….. 35
Figure11 Comparison of Detentions per Flag ………………………… 36
Figure12 Comparison of Deficiencies by Categories ………………… 37
Figure13 Comparison of Inspections per Classification Societies ……. 38
Figure14 Comparison of Detentions per Classification Societies …… 39
REPORT OF CIC ON LIFE BOAT ….……………………………………… 40
PRESENTATION OF MEMBER ADMINISTRATION: SRI LANKA 41

INDIAN OCEAN MEMORANDUM OF UNDERSTANDING ON PORT STATE CONTROL
The Memorandum of understanding on Port State Control, in the Indian Ocean region was finalised
on the basis of the first preparatory meeting in India in October 1997 and the second meeting in
June 1998 in South Africa. The Second Meeting was attended by Australia, Bangladesh, Djibouti,
Eritrea, Ethiopia, India, Iran, Kenya, Maldives, Mauritius, Mozambique, Myanmar, Oman,
Seychelles, South Africa, Sri Lanka, Tanzania and Yemen.
The port State control system, aims to verify whether foreign flagged vessels calling at a port of a
State, comply with applicable international maritime conventions. When vessels are found not to
be in substantial compliance with applicable laws or relevant convention requirements, the PSC
system imposes actions to ensure they are brought into compliance. Ships to be inspected are
selected on the basis of criteria outlined in the Memorandum and a non-discriminatory policy is
observed.
Under the Memorandum each Authority will establish and maintain an effective system of port
State control. The ultimate goal is to identify and eliminate substandard ships from the region.
1
INTRODUCTION
GENERAL

INDIAN OCEAN MEMORANDUM OF UNDERSTANDING ON PORT STATE CONTROL
As at December 2006, there are thirteen countries, which have become parties to the
Memorandum. These are: Australia, Eritrea, India, Iran, Kenya, Maldives, Mauritius, Oman,
Sri Lanka, South Africa, Sudan, Tanzania and Yemen.
Black Sea MOU, Equasis, Ethiopia and West & Central Africa Memorandum of Understanding, the
International Maritime Organisation and International Labour Organisation participate in the
Memorandum as observers. Asia Pacific MOU on PSC and United States Coast Guard have
been accepted as observers, from this year.
2
LIST OF THE MEMBERS AND THE OBSERVERS
INDIAN OCEAN MEMORANDUM OF UNDERSTANDING ON PORT STATE CONTROL
3
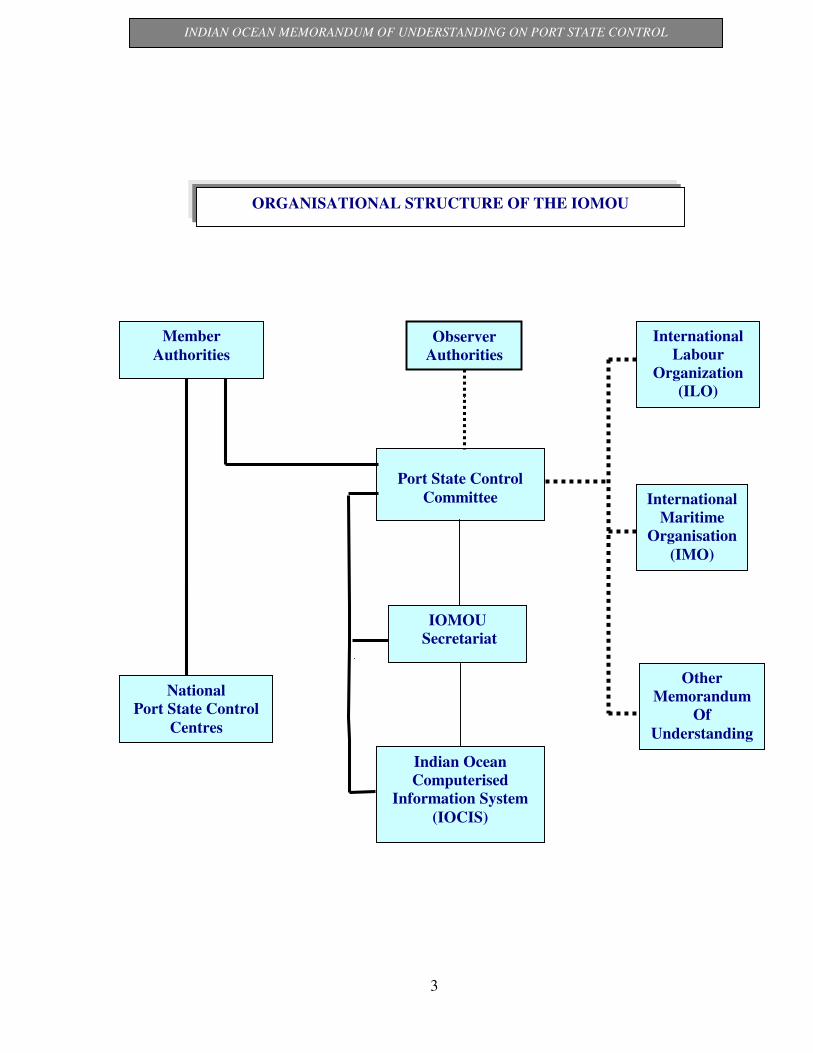
ORGANISATIONAL STRUCTURE OF THE IOMOU
Member
Authorities
National
Port State Control
Centres
Port State Control
Committee
Observer
Authorities
IOMOU
Secretariat
Indian Ocean
Computerised
Information System
(IOCIS)
International
Labour
Organization
(ILO)
International
Maritime
Organisation
(IMO)
Other
Memorandum
Of
Understanding

INDIAN OCEAN MEMORANDUM OF UNDERSTANDING ON PORT STATE CONTROL
INAUGURATION
THE PARTICIPANTS
4

INDIAN OCEAN MEMORANDUM OF UNDERSTANDING ON PORT STATE CONTROL
The Indian Ocean Memorandum of Understanding Secretariat is based at Goa in India. The
Secretariat is governed by and accountable to the Committee of the IOMOU on Port State Control.
It services the Committee meetings and assists the Committee in its activities.
The IOMOU Secretariat is headed by the Secretary, Mr. Bimalesh Ganguli who is assisted by
Office Assistant Mrs. Priyanka Sawant and Data Processor Ms. Sharada Fadte.
Postal Address: The Secretary Email Address: [email protected]
IOMOU Secretariat, [email protected]
38-A, Galliant,
Bogmalo Road, Dabolim
GOA - 403 801.
INDIA.
Website: www.iomou.org
Telephone : +91 832 2538 128
Telefax : +91 832 2538 127
5
IOMOU SECRETARIAT
CONTACT DETAILS

INDIAN OCEAN MEMORANDUM OF UNDERSTANDING ON PORT STATE CONTROL
The Committee of the IOMOU held its Ninth Meeting in Bagamoyo, Tanzania from 4 September to
7 September 2006. The meeting was kindly hosted by the Surface and Marine Transport
Regulatory Authority (SUMATRA), Ministry of Infrastructure Development, Tanzania.
The meeting under the chairmanship of Mr. Sudhir Kumar, Dy Chief Ship Surveyor, Directorate
General of Shipping, India, was attended by representatives from the Maritime Authorities of
Australia, India, Iran, Kenya, South Africa, Sri Lanka, Sudan, and Tanzania as member and
Equasis, IMO as Observer .
Important outcomes of this meeting included:
8� Committee accepted Tokyo MOU and USCG as observers.
8� Agreed the proposals of Tokyo MOU and LRF for Data exchange.
8� Lease Agreement to be signed for the Secretariat’s new accommodation.
8� Member Authority will participate in Joint CIC along with Tokyo MOU and Paris MOU.
8� The creation of Inter-sessional Groups which will look after:
a) Look into the issue of formation of detention panel.
b) Look in to issue of Target Factor as well as white, Grey and Black list for IOMOU
region.
c) Finalise the date, time and Programme and organise Seminar for PSCOs of the region.
d) Draw up the criteria for watch list for publishing banned vessel on website.
8� Finalisation of the venue for the tenth meeting.
8� Proposed the post for Asst. Secretary.
Realizing the need for training and harmonization of the PSC activities in the region, the First
Regional Seminar of the PSCOs, as per the decision of the Committee was held from 9 to 11
February, 2005 at Tolani Maritime Institute in Pune, India. Due to technical reasons no seminar
was held during this year.
6
THE COMMITTEE
TRAINING AND SEMINARS FOR PORT STATE CONTROL
OFFICERS

INDIAN OCEAN MEMORANDUM OF UNDERSTANDING ON PORT STATE CONTROL
The Committee deliberated on the issue of co-operation and harmonization between various MOUs
and decided to conduct joint CIC with Paris and Tokyo MOU in the year 2007 and also to consider
grant of observer status to other MOUs as and when such requests are received by the Committee.
Indian Ocean MOU realized the need of this co-operation right from its inception and obtained the
observer status from the Tokyo MOU and continued to maintain the same by attending their
committee meetings as well as other activities. The Mediterranean MOU has also accepted
IOMOU as observer.
With the similar spirit the IOMOU granted observer status to the MOUs as indicated under the list
of observers.
The representatives of the Secretariats attend each others committee meetings depending upon their
own programmes. During the year the Secretary was invited to attend the following meetings:
West and Central Africa MOU (Abuja MOU)
Black Sea MOU
Asia Pacific MOU ( Tokyo MOU)
The Secretary could attend only the sixteenth meeting of the Asia Pacific MOU on PSC
Committee, held in Victoria, Canada, from 25 to 28 September, 2006.
7
CO-OPERATION WITH OTHER REGIONAL MOUS
INDIAN OCEAN MEMORANDUM OF UNDERSTANDING ON PORT STATE CONTROL
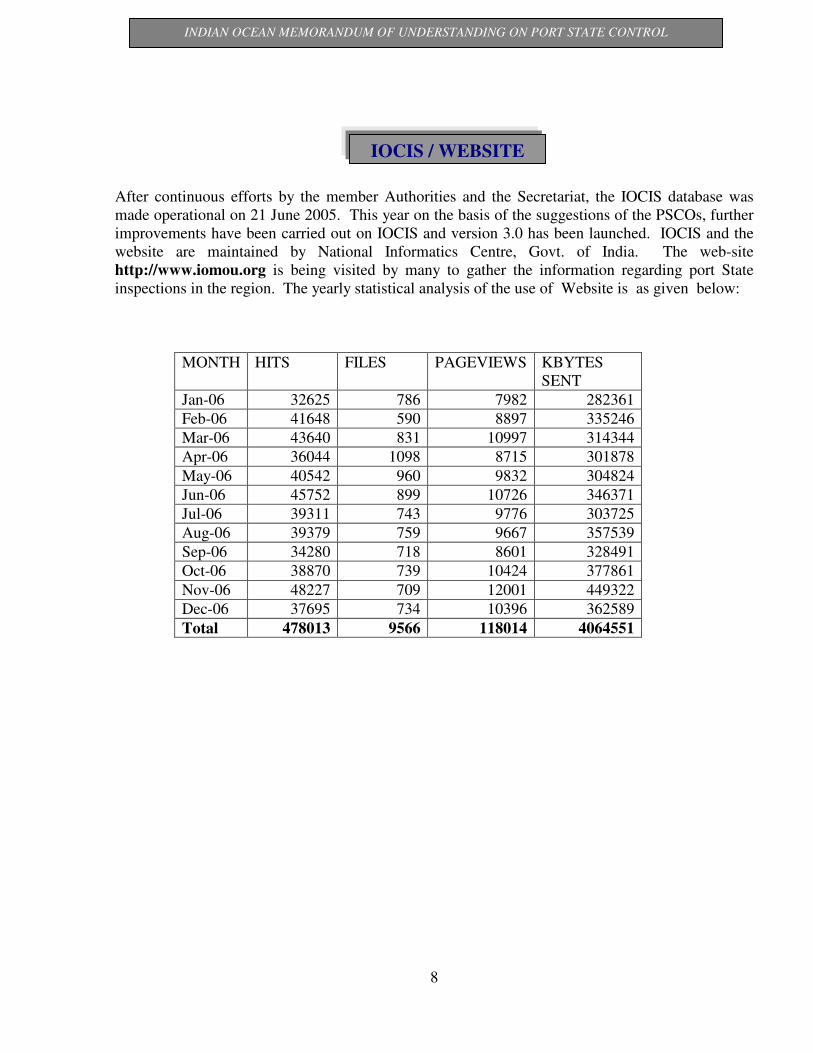
After continuous efforts by the member Authorities and the Secretariat, the IOCIS database was
made operational on 21 June 2005. This year on the basis of the suggestions of the PSCOs, further
improvements have been carried out on IOCIS and version 3.0 has been launched. IOCIS and the
website are maintained by National Informatics Centre, Govt. of India. The web-site
http://www.iomou.org is being visited by many to gather the information regarding port State
inspections in the region. The yearly statistical analysis of the use of Website is as given below:
MONTH HITS FILES PAGEVIEWS KBYTES
SENT
Jan-06 32625 786 7982 282361
Feb-06 41648 590 8897 335246
Mar-06 43640 831 10997 314344
Apr-06 36044 1098 8715 301878
May-06 40542 960 9832 304824
Jun-06 45752 899 10726 346371
Jul-06 39311 743 9776 303725
Aug-06 39379 759 9667 357539
Sep-06 34280 718 8601 328491
Oct-06 38870 739 10424 377861
Nov-06 48227 709 12001 449322
Dec-06 37695 734 10396 362589
Total 478013 9566 118014 4064551
8
IOCIS / WEBSITE
INDIAN OCEAN MEMORANDUM OF UNDERSTANDING ON PORT STATE CONTROL
A total of 5124 inspections were carried out in the year 2006. 2836 ships with deficiencies were
noted during these inspections, with the total number of deficiencies being 16045.
Serious deficiencies noted by PSCOs led to the detention of 406 ships. The detentions allow for
the rectification of the serious deficiencies prior to the ships departure. The overall detention
percentage for the year being 7.92 %. The detention percentage has increased, as compared to last
year, though the total number of inspection is less than in the 2005 year.
The information given in the following tables and charts represents the port State control activities
of Australia, India, Iran, Kenya, Mauritius, Sri Lanka and South Africa.
It may be noted that Australia, being member of two MOUs, namely, Asia Pacific MOU as well as
Indian Ocean MOU, shares their PSC data with both MOUs and so when considering a world
picture of statistics, duplication of data is possible.
A Concentrated Inspection Campaign on Life Boat and Life Boat Launching appliances was
carried out in the region, during the year 2006. The Consolidated report is provided in this Annual
Report.
9
STATISTICS

INDIAN OCEAN MEMORANDUM OF UNDERSTANDING ON PORT STATE CONTROL
STATISTICS FOR 2006
PORT STATE INSPECTIONS CARRIED OUT BY AUTHORITIES
Authority Number of
Inspections
Number of
Inspections with
deficiencies
Number of
Deficiencies
Number of
Detentions
Detention
Percentage
Australia 3079 1783 8958 138 4.48
India 653 506 3452 99 15.16
Iran 579 328 2844 142 24.53
Kenya 132 44 216 6 4.55
Mauritius 20 14 48 4 20.00
South Africa 654 154 476 10 1.53
Sri Lanka 7 7 51 7 100.00
Total
5124 2836 16045 406
10
PORT STATE INSPECTION ACTIVITIES

INDIAN OCEAN MEMORANDUM OF UNDERSTANDING ON PORT STATE CONTROL
Table : 1.
Deficiencies by Type of Ship
Type of Ship Number of
Inspections
Number of
Inspections with
Deficiencies
Number of
Deficiencies
Number of
Detentions
Detention
Percentage
Percentage of
Inspections with
Deficiencies
9
385
68
182
2620
161
540
17
46
2
667
116
105
39
33
17
45
2
11
1
36
22
4
172
29
103
1496
77
237
8
29
1
461
41
53
21
13
10
32
1
4
0
28
16
43
1198
70
612
7682
352
1163
32
153
2
3537
244
193
79
45
28
272
9
22
0
192
117
2
51
0
22
154
6
20
0
4
0
114
7
3
2
0
0
13
0
1
0
4
3
Tanker not otherwise specified
Oil Tanker
Gas Carrier
Chemical Tanker
Bulk Carrier
Vehicle Carrier
Container Ship
Combination Carrier
(includes OBO/O&O)
Ro-Ro Cargo Ship
Ro-Ro Passenger Ship
General Cargo / Multipurpose
ship
Refrigerated Cargo Carrier
Woodchip Carrier
Livestock Carrier
Passenger Ship
Heavy Load Carrier
Offshore Service Vessel
MODU & FPSO
Special Purpose Ship
High Speed Cargo Craft
Tugboat
Other Type
Total 5124 2836 16045 406
22.22
13.25
0.00
12.09
5.88
3.73
3.70
0.00
8.70
0.00
17.09
6.03
2.86
5.13
0.00
0.00
28.89
0.00
9.09
0.00
11.11
13.64
44.44
44.68
42.65
56.59
57.10
47.83
43.89
47.06
63.04
50.00
69.12
35.34
50.48
53.85
39.39
58.82
71.11
50.00
36.36
0.00
77.78
72.73
11

INDIAN OCEAN MEMORANDUM OF UNDERSTANDING ON PORT STATE CONTROL
Table : 2
Deficiencies by Flag
Flag Number of
Inspections
Number of
Inspections
With
Deficiencies
Number of
Deficiencies
Number of
Detentions
Detention
Percentage
Antigua & Barbuda
Bahamas
Bahrain
Bangladesh
Barbados
Belgium
Belize
Bermuda
Bulgaria
Cambodia
Cayman Islands
China
Comoros
Cook Islands
Croatia
Cyprus
Denmark
Dominica
Egypt
Ethiopia
France
Georgia
Germany
Gibraltar
Greece
Honduras
Hong Kong, China
India
Indonesia
Iran
Ireland
Isle of Man
Italy
Jamaica
Japan
Jordan
Korea, D.P.R.
Korea, Republic of
Kuwait
Lebanon
Liberia
Lithuania
Luxembourg
Malaysia
Maldives
Malta
Marshall Island
Mauritius
72
270
3
7
3
12
14
25
1
8
34
116
15
2
14
208
26
8
8
1
17
3
39
9
150
2
393
49
18
16
1
65
38
1
50
11
33
114
6
1
351
2
5
44
1
213
170
2
30
124
3
6
2
4
12
9
0
8
18
52
15
1
6
102
10
5
5
1
7
3
20
5
70
2
219
26
16
12
1
28
18
0
24
11
32
67
4
1
155
2
0
32
1
123
88
2
136
531
56
51
56
9
94
16
0
117
129
249
215
8
24
530
70
28
27
17
26
33
69
40
282
22
990
123
185
55
4
147
70
0
73
169
406
310
11
5
749
8
0
251
5
609
358
7
1
13
2
3
2
0
1
0
0
4
4
3
10
0
0
15
0
1
0
1
0
2
3
0
9
1
10
2
7
0
1
2
2
0
1
9
18
5
0
0
17
1
0
5
0
10
5
0
1.39
4.81
66.67
42.86
66.67
0.00
7.14
0.00
0.00
50.00
11.76
2.59
66.67
0.00
0.00
7.21
0.00
12.50
0.00
100.00
0.00
66.67
7.69
0.00
6.00
50.00
2.54
4.08
38.89
0.00
100.00
3.08
5.26
0.00
2.00
81.82
54.55
4.39
0.00
0.00
4.84
50.00
0.00
11.36
0.00
4.69
2.94
0.00
12

INDIAN OCEAN MEMORANDUM OF UNDERSTANDING ON PORT STATE CONTROL
Table : 2 (Contd.)
Deficiencies by Flag
Flag Number of
Inspections
Number of
Inspections
With
Deficiencies
Number of
Deficiencies
Number of
Detentions
Detention
Percentage
5
8
60
13
5
84
9
1500
16
69
3
2
20
2
3
2
4
266
3
1
2
10
12
106
11
8
27
1
58
6
34
1
8
51
12
33
18
5
6
35
6
2
38
8
878
16
36
2
1
14
2
2
2
4
149
2
1
1
9
12
82
3
6
18
1
33
4
22
1
7
15
3
15
13
81
29
114
17
2
173
44
5236
157
145
4
4
95
3
9
8
50
805
20
15
2
65
199
625
12
15
99
6
219
14
108
5
66
56
5
52
116
2
1
0
1
0
5
2
140
1
5
0
0
1
0
0
0
3
19
0
1
0
3
9
22
1
0
3
0
4
0
3
0
5
1
0
0
4
40.00
12.50
0.00
7.69
0.00
5.95
22.22
9.33
6.25
7.25
0.00
0.00
5.00
0.00
0.00
0.00
75.00
7.14
0.00
100.00
0.00
30.00
75.00
20.75
9.09
0.00
11.11
0.00
6.90
0.00
8.82
0.00
62.50
1.96
0.00
0.00
22.22
Mongolia
Myanmar
Netherlands
Netherlands Antilles
New Zealand
Norway
Pakistan
Panama
Papua New Guinea
Philippines
Portugal
Qatar
Russian Federation
Samoa
Saudi Arabia
Seychelles
Sierra Leone
Singapore
Slovakia
Somalia
Spain
Sri Lanka
St. Kitts and Nevis
St. Vincent & Grenadines
Sweden
Switzerland
Taiwan
Tanzania
Thailand
Tonga
Turkey
Ukraine
United Arab Emirates
United Kingdom
United States of America
Vanuatu
Vietnam
Total
5124
2836
16045
406
13

INDIAN OCEAN MEMORANDUM OF UNDERSTANDING ON PORT STATE CONTROL
Table : 3
Deficiencies by Categories
Code Nature Of Deficiencies Number of Deficiencies Percentage
100
200
300
400
500
600
700
800
900
1000
1100
1200
1300
1400
1500
1600
1700
1800
1900
2000
2100
2200
2300
2500
2600
2700
2800
2900
9900
Ship's Certificates and Documents
Certification and Watch keeping for Seafarers
Crew & Accommodation (ILO 147)
Food & Catering (ILO 147)
Working Spaces (ILO 147)
Life Saving Appliances
Fire Safety Measures
Accident Prevention (ILO 147)
Stability, Structure and Related Equipments
Alarm Signals
Carriage Of Cargo and Dangerous Goods
Load Lines
Mooring Arrangements (ILO 147)
Propulsion & Auxiliary Machinery
Safety Of Navigation
Radio Communications
Marpol Annex I
Oil , Chemical Tankers and Gas Carriers
Marpol Annex II
Solas Related Operational Deficiencies
Marpol Related Operational Deficiencies
Marpol Annex III
Marpol Annex V
ISM Related Deficiencies
Bulk Carriers Additional Safety Measures
Additional Measures to Enhance Maritime Security.
Additional Measures to Enhance Maritime Safety
Marpol Annex IV
All Other Deficiencies
350
340
391
136
278
2031
2374
331
1294
76
197
1593
222
845
2276
697
632
32
1
613
184
1
260
614
160
41
15
2
59
Total
16045
2.18
2.12
2.44
0.85
1.73
12.66
14.80
2.06
8.06
0.47
1.23
9.93
1.38
5.27
14.19
4.34
3.94
0.20
0.01
3.82
1.15
0.01
1.62
3.83
1.00
0.26
0.09
0.01
0.37
14

INDIAN OCEAN MEMORANDUM OF UNDERSTANDING ON PORT STATE CONTROL
Table : 4
Deficiencies by Classification Societies
Classification Society
Abbreviation
Number of
Inspections
Number of
Inspections
with
Deficiencies
Number of
Detentions*
Detention
Percentage
American Bureau of Shipping
Biro Klasifikasi Indonesia
Bulgarski Koraben Registrar
Bureau Veritas
Ceskoslovensky Lodin Register
China Classification Society
China Corporation Register of Shipping
Croatian Register of Shipping
Det Norske Veritas
Germanischer Lloyd
Global Marine Bureau
Hellenic Register of Shipping
Honduras International Surveying &
Inspection Bureau
INCLAMAR
Indian Register of Shipping
International Naval Surveys Bureau
International Register of Shipping
Isthmus Bureau of Shipping
Korean Register of Shipping
Korea Classification Society
Lloyd's Register
Marconi International Marine Company Ltd.
Nippon Kaiji Kyokai
No Class
Panama Maritime Surveyors Bureau Inc.
Panama maritime Documentation Service
Panama Register Corporation
Polski Rejestr Statkow
Registro Italiano Navale
RINAVE Portuguesa
Russian Maritime Register of Shipping
Registro Internacional Naval S.A.
Seefartsaht Helsinki
Turkish Lloyd
Vietnam Register of Shipping
Other **
ABS
BKI
BKR
BV
CS
CCS
CCRS
CRS
DNV
GL
GMB
HRS
HINSIB
INC
IRS
IBS
IS
IBS
KRS
KCS
LRS
MIMC
NKK
--
PMSB
PMDS
PRC
PRS
RINA
RP
RMRS
--
--
TL
VRS
461
14
2
437
1
228
35
14
460
444
2
11
1
1
45
15
39
5
227
27
757
1
1668
1
2
3
3
9
96
2
66
1
1
4
9
32
236
13
1
266
0
121
25
6
227
209
2
11
1
0
28
15
38
5
133
26
417
1
886
0
2
3
3
6
63
1
47
1
0
4
9
30
27
7
1
29
0
15
8
0
27
27
1
9
1
0
5
10
27
2
12
13
43
0
76
0
2
2
2
3
13
0
15
1
0
2
3
23
5.86
50.00
50.00
6.64
0.00
6.58
22.86
0.00
5.87
6.08
50.00
81.82
100.00
0.00
11.11
66.67
69.23
40.00
5.29
48.15
5.68
0.00
4.56
0.00
100.00
66.67
66.67
33.33
13.54
0.00
22.73
100.00
0.00
50.00
33.33
71.88
Total
5124
2836
406
Note: * Deficiencies for which a ship is detained may not necessarily be related to the
matters covered by the certificates issued by the classification society. ** Inspection classed with Bulgarian Register of Shipping, Mediterranean Naval Survey
Bureau, International Ship Classification, International Maritime Bureau, Phoenix
Register of shipping , Dromon Bureau of Shipping, Universal shipping Bureau etc. are
included in this class.
15

INDIAN OCEAN MEMORANDUM OF UNDERSTANDING ON PORT STATE CONTROL
Table : 5
Comparison of Inspections and Deficiencies per Ship Type
Number of Inspections Number of Inspections with
Deficiencies
YEAR YEAR Type of Ship
2004 2005 2006 Total 2004 2005 2006 Total
3-year
average
percentage
Tanker Not Otherwise Specified 27 8 9 44 8 3 4 15 34.09
Oil Tanker 642 390 385 1417 224 144 172 540 38.11
Gas Carrier 67 57 68 192 20 26 29 75 39.06
Chemical Tanker 192 201 182 575 98 124 103 325 56.52
Bulk Carrier 2577 2667 2620 7864 1482 1500 1496 4478 56.94
Vehicle Carrier 158 183 161 502 63 72 77 212 42.23
Container Ship 399 463 540 1402 170 217 237 624 44.51
Combination Carrier 74 27 17 118 62 17 8 87 73.73
Ro-Ro Cargo Ship 69 45 46 160 25 24 29 78 48.75
Ro-Ro Passenger Ship 4 4 2 10 0 1 1 2 20.00
General Cargo / Multipurpose 1130 778 667 2575 744 546 461 1751 68.00
Ship
Refrigerated Cargo Carrier 51 62 116 229 17 18 41 76 33.19
Woodchip Carrier 76 94 105 275 48 44 53 145 52.73
Livestock Carrier 51 39 39 129 35 26 21 82 63.57
High Speed Cargo Craft 0 0 1 1 0 0 0 0 0.00
High Speed Passenger Craft 0 1 0 1 0 0 0 0 0.00
Passenger Ship 28 40 33 101 12 16 13 41 40.59
Heavy Load Carrier 16 16 17 49 11 9 10 30 61.22
Offshore Service Vessel 67 58 45 170 27 36 32 95 55.88
MODU & FPSO 0 6 2 8 0 5 1 6 75.00
Special Purpose Ship 14 11 11 36 12 7 4 23 63.89
Tugboat 30 30 36 96 19 18 28 65 67.71
Other Type 18 25 22 65 10 18 16 44 67.69
Total 5690 5205 5124 16019 3087 2871 2836 8794 54.90
16
INDIAN OCEAN MEMORANDUM OF UNDERSTANDING ON PORT STATE CONTROL
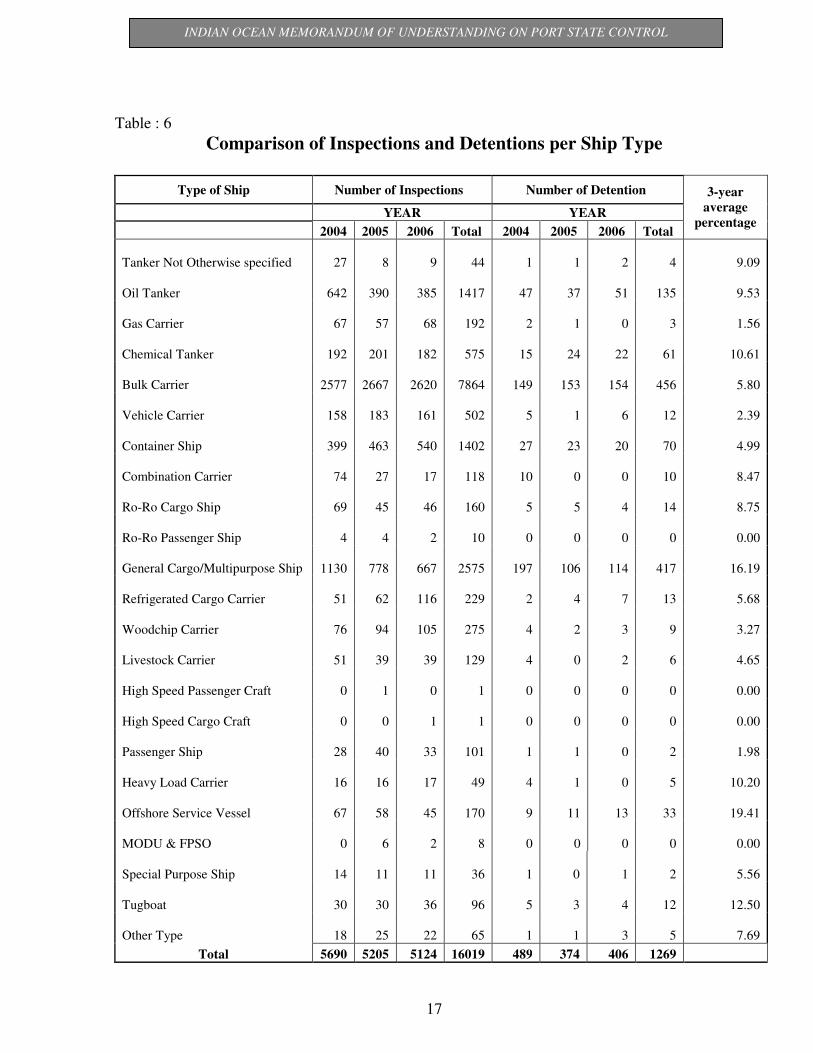
Table : 6
Comparison of Inspections and Detentions per Ship Type
Type of Ship Number of Inspections Number of Detention
YEAR YEAR
2004 2005 2006 Total 2004 2005 2006 Total
3-year
average
percentage
Tanker Not Otherwise specified 27 8 9 44 1 1 2 4 9.09
Oil Tanker 642 390 385 1417 47 37 51 135 9.53
Gas Carrier 67 57 68 192 2 1 0 3 1.56
Chemical Tanker 192 201 182 575 15 24 22 61 10.61
Bulk Carrier 2577 2667 2620 7864 149 153 154 456 5.80
Vehicle Carrier 158 183 161 502 5 1 6 12 2.39
Container Ship 399 463 540 1402 27 23 20 70 4.99
Combination Carrier 74 27 17 118 10 0 0 10 8.47
Ro-Ro Cargo Ship 69 45 46 160 5 5 4 14 8.75
Ro-Ro Passenger Ship 4 4 2 10 0 0 0 0 0.00
General Cargo/Multipurpose Ship 1130 778 667 2575 197 106 114 417 16.19
Refrigerated Cargo Carrier 51 62 116 229 2 4 7 13 5.68
Woodchip Carrier 76 94 105 275 4 2 3 9 3.27
Livestock Carrier 51 39 39 129 4 0 2 6 4.65
High Speed Passenger Craft 0 1 0 1 0 0 0 0 0.00
High Speed Cargo Craft 0 0 1 1 0 0 0 0 0.00
Passenger Ship 28 40 33 101 1 1 0 2 1.98
Heavy Load Carrier 16 16 17 49 4 1 0 5 10.20
Offshore Service Vessel 67 58 45 170 9 11 13 33 19.41
MODU & FPSO 0 6 2 8 0 0 0 0 0.00
Special Purpose Ship 14 11 11 36 1 0 1 2 5.56
Tugboat 30 30 36 96 5 3 4 12 12.50
Other Type 18 25 22 65 1 1 3 5 7.69
Total 5690 5205 5124 16019 489 374 406 1269
17
INDIAN OCEAN MEMORANDUM OF UNDERSTANDING ON PORT STATE CONTROL
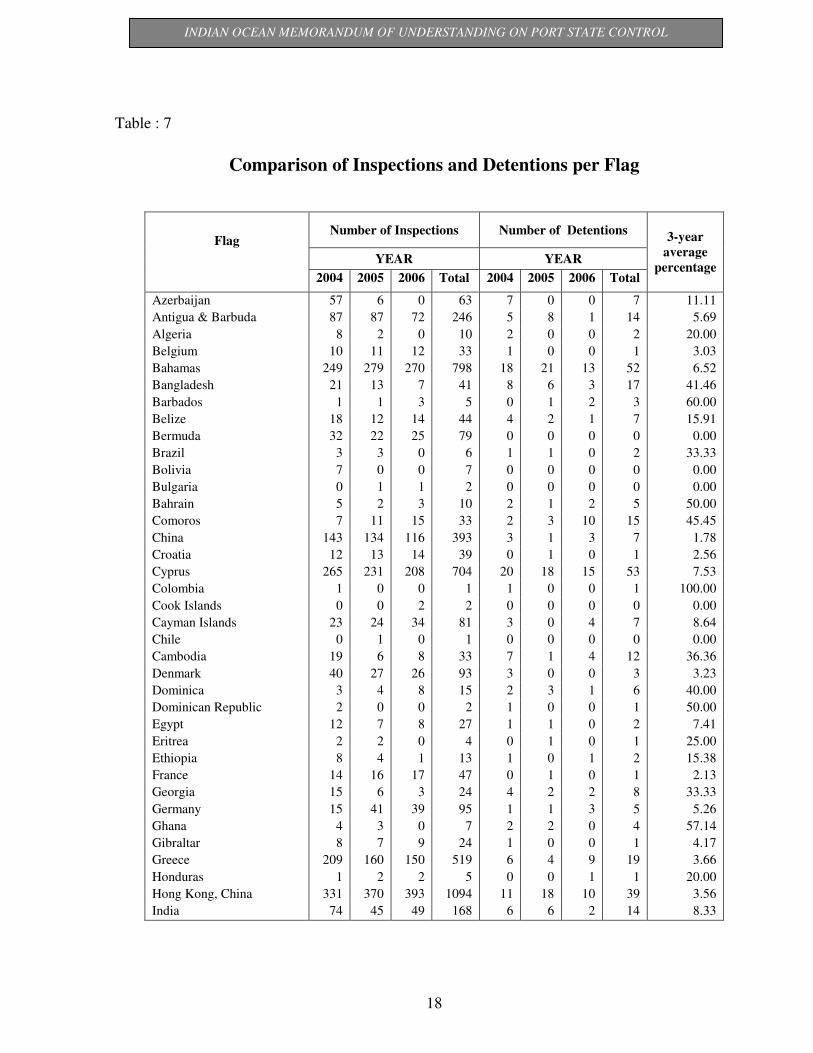
Table : 7
Comparison of Inspections and Detentions per Flag
Number of Inspections Number of Detentions
Flag
YEAR YEAR
2004 2005 2006 Total 2004 2005 2006 Total
3-year
average
percentage
Azerbaijan 57 6 0 63 7 0 0 7 11.11
Antigua & Barbuda 87 87 72 246 5 8 1 14 5.69
Algeria 8 2 0 10 2 0 0 2 20.00
Belgium 10 11 12 33 1 0 0 1 3.03
Bahamas 249 279 270 798 18 21 13 52 6.52
Bangladesh 21 13 7 41 8 6 3 17 41.46
Barbados 1 1 3 5 0 1 2 3 60.00
Belize 18 12 14 44 4 2 1 7 15.91
Bermuda 32 22 25 79 0 0 0 0 0.00
Brazil 3 3 0 6 1 1 0 2 33.33
Bolivia 7 0 0 7 0 0 0 0 0.00
Bulgaria 0 1 1 2 0 0 0 0 0.00
Bahrain 5 2 3 10 2 1 2 5 50.00
Comoros 7 11 15 33 2 3 10 15 45.45
China 143 134 116 393 3 1 3 7 1.78
Croatia 12 13 14 39 0 1 0 1 2.56
Cyprus 265 231 208 704 20 18 15 53 7.53
Colombia 1 0 0 1 1 0 0 1 100.00
Cook Islands 0 0 2 2 0 0 0 0 0.00
Cayman Islands 23 24 34 81 3 0 4 7 8.64
Chile 0 1 0 1 0 0 0 0 0.00
Cambodia 19 6 8 33 7 1 4 12 36.36
Denmark 40 27 26 93 3 0 0 3 3.23
Dominica 3 4 8 15 2 3 1 6 40.00
Dominican Republic 2 0 0 2 1 0 0 1 50.00
Egypt 12 7 8 27 1 1 0 2 7.41
Eritrea 2 2 0 4 0 1 0 1 25.00
Ethiopia 8 4 1 13 1 0 1 2 15.38
France 14 16 17 47 0 1 0 1 2.13
Georgia 15 6 3 24 4 2 2 8 33.33
Germany 15 41 39 95 1 1 3 5 5.26
Ghana 4 3 0 7 2 2 0 4 57.14
Gibraltar 8 7 9 24 1 0 0 1 4.17
Greece 209 160 150 519 6 4 9 19 3.66
Honduras 1 2 2 5 0 0 1 1 20.00
Hong Kong, China 331 370 393 1094 11 18 10 39 3.56
India 74 45 49 168 6 6 2 14 8.33
18

INDIAN OCEAN MEMORANDUM OF UNDERSTANDING ON PORT STATE CONTROL
Table :7 (Contd.)
Comparison of Inspections and Detentions per Flag
Number of Inspections Number of Detentions
YEAR YEAR
Flag
2004 2005 2006 Total 2004 2005 2006 Total
3-year
average
percentage
Indonesia 17 23 18 58 9 8 7 24 41.38
Ireland 4 3 1 8 0 1 1 2 25.00
Iran 26 22 16 64 1 4 0 5 7.81
Italy 30 36 38 104 2 2 2 6 5.77
Isle of Man 65 74 65 204 3 8 2 13 6.37
Jamaica 0 4 1 5 0 4 0 4 80.00
Japan 58 51 50 159 1 0 1 2 1.26
Jordan 8 9 11 28 5 5 9 19 67.86
Kiribati 0 2 0 2 0 2 0 2 100.00
Korea DPR 61 41 33 135 27 18 18 63 46.67
Korea Republic of 85 113 114 312 1 7 5 13 4.17
Kuwait 8 9 6 23 0 3 0 3 13.04
Liberia 346 343 351 1040 19 13 17 49 4.71
Lithuania 0 1 2 3 0 0 1 1 33.33
Luxembourg 2 0 5 7 0 0 0 0 0.00
Lebanon 5 2 1 8 3 0 0 3 37.50
Malaysia 81 65 44 190 5 5 5 15 7.89
Malta 265 223 213 701 24 13 10 47 6.70
Marshall Islands 111 144 170 425 4 5 5 14 3.29
Maldives 2 1 1 4 1 1 0 2 50.00
Mauritius 0 2 2 4 0 0 0 0 0.00
Myanmar 14 13 8 35 3 1 1 5 14.29
Morocco 2 1 0 3 0 0 0 0 0.00
Mongolia 10 11 5 26 7 4 2 13 50.00
Netherlands 49 58 60 167 3 0 0 3 1.80
Netherlands Antilles 7 10 13 30 1 1 1 3 10.00
New Zealand 6 4 5 15 0 0 0 0 0.00
Nigeria 0 1 0 1 0 1 0 1 100.00
Norway 100 94 84 278 3 3 5 11 3.96
Panama 1411 1477 1500 4388 111 101 140 352 8.02
Papua New Guinea 13 14 16 43 4 1 1 6 13.95
Philippines 77 55 69 201 5 1 5 11 5.47
Portugal 2 2 3 7 1 0 0 1 14.29
Pakistan 6 4 9 19 0 2 2 4 21.05
Qatar 8 8 2 18 2 2 0 4 22.22
Russia 358 51 20 429 32 2 1 35 8.16
Samoa 1 2 2 5 0 1 0 1 20.00
St. Kitts and Nevis 0 4 12 16 0 3 9 12 75.00
St.Vincent & Grenadines 134 125 106 365 27 15 22 64 17.53
Saudi Arabia 10 8 3 21 2 0 0 2 9.52
19

INDIAN OCEAN MEMORANDUM OF UNDERSTANDING ON PORT STATE CONTROL
Table :7 (Contd.)
Comparison of Inspections and Detentions per Flag
Number of Inspections Number of Detentions
YEAR YEAR
Flag
2004 2005 2006 Total 2004 2005 2006 Total
3-year
average
percentage
Singapore 260 254 266 780 15 16 19 50 6.41
Somalia 0 0 1 1 0 0 1 1 100.00
South Africa 2 1 0 3 0 0 0 0 0.00
Sierra Leone 2 0 4 6 2 0 3 5 83.33
Spain 0 1 2 3 0 0 0 0 0.00
Sweden 19 15 11 45 0 0 1 1 2.22
Switzerland 11 10 8 29 0 0 0 0 0.00
Slovakia 2 4 3 9 2 0 0 2 22.22
Seychelles 1 2 2 5 1 1 0 2 40.00
Sudan 1 0 0 1 1 0 0 1 100.00
Sri Lanka 17 19 10 46 3 5 3 11 23.91
Sao Tome and Principe 1 0 0 1 0 0 0 0 0.00
Syrian Arab Republic 4 1 0 5 0 0 0 0 0.00
Taiwan 22 27 27 76 1 2 3 6 7.89
Thailand 72 53 58 183 14 3 4 21 11.48
Tanzania 1 0 1 2 0 0 0 0 0.00
Tonga 4 3 6 13 0 0 0 0 0.00
Turkmenistan 5 0 0 5 4 0 0 4 80.00
Turkey 50 40 34 124 7 2 3 12 9.68
Tunisia 2 1 0 3 0 0 0 0 0.00
United Arab Emirates 20 11 8 39 5 3 5 13 33.33
United Kingdom 54 51 51 156 1 0 1 2 1.28
Ukraine 3 6 1 10 1 2 0 3 30.00
United States of America 1 2 12 15 0 0 0 0 0.00
Vanuatu 32 30 33 95 2 0 0 2 2.11
Vietnam 16 11 18 45 1 0 4 5 11.11
Total
5690
5205
5124
16019
489
374
406
1269
20

INDIAN OCEAN MEMORANDUM OF UNDERSTANDING ON PORT STATE CONTROL
Table : 8
Comparison of Deficiencies by Categories
Nature of Deficiencies
Number of Deficiencies
YEAR
2004 2005 2006
Ship's Certificates and Documents 575 427 350
Certification and Watch keeping for Seafarers. 378 247 340
Crew & Accommodation (ILO 147) 347 364 391
Food & Catering (ILO 147) 66 111 136
Working Spaces (ILO 147) 103 148 278
Life Saving Appliances 2024 1999 2031
Fire Safety Measures 2206 2284 2374
Accident Prevention (ILO 147) 281 299 331
Stability Structure and Related Equipment 1670 1381 1294
Alarm Signals 52 56 76
Carriage of Cargo and Dangerous Goods 160 132 197
Load Lines 1507 1379 1593
Mooring Arrangements (ILO 147) 200 200 222
Propulsion & Auxiliary Machinery 627 936 845
Safety of Navigation 1724 1539 2276
Radio Communication 725 601 697
Marpol Annex I 806 714 632
Oil, Chemical Tankers and Gas Carriers 33 41 32
Marpol Annex II 28 4 1
Solas Related Operational Deficiencies 599 771 613
Marpol Related Operational Deficiencies 87 92 184
Marpol Annex III 4 2 1
Marpol Annex V 156 292 260
ISM Related Deficiencies 667 793 614
Bulk Carriers Additional Safety Measures 53 72 160
Additional Measures to Enhance Maritime Security. 0 30 41
Additional Measures to Enhance maritime Safety. 0 12 15
Morpol Annex IV 24 4 2
Other Deficiencies 40 76 59
Total
15142
15006
16045
21
INDIAN OCEAN MEMORANDUM OF UNDERSTANDING ON PORT STATE CONTROL
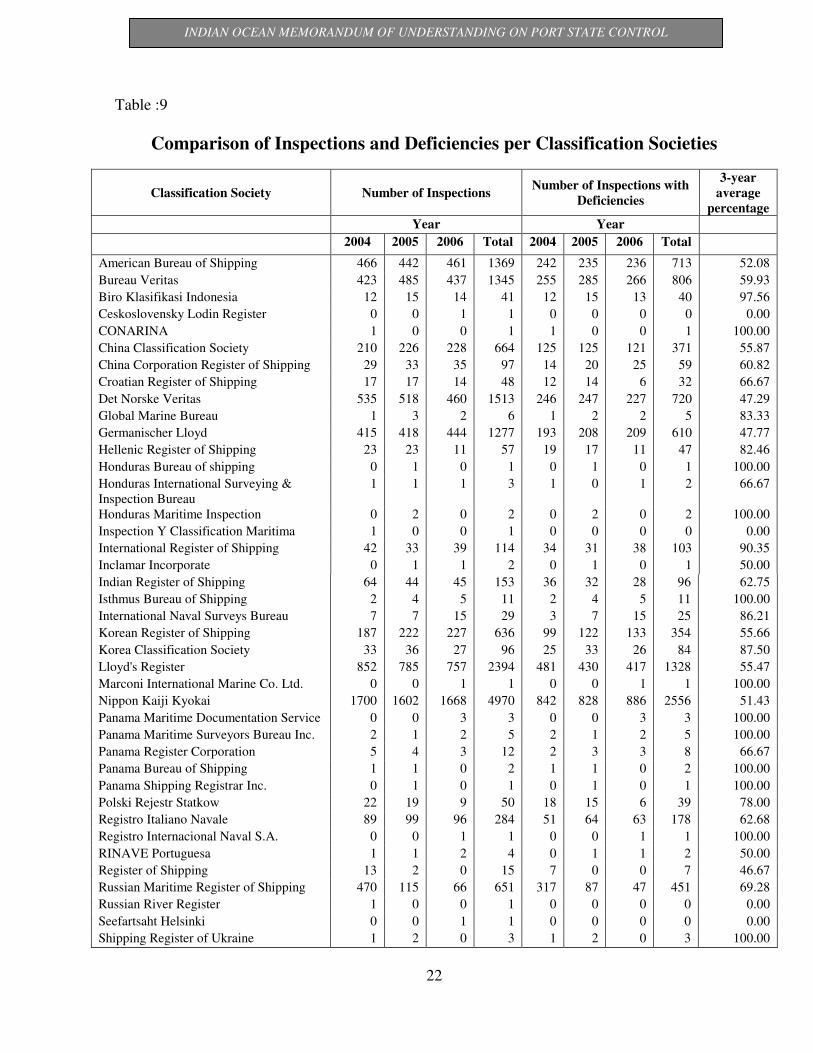
Table :9
Comparison of Inspections and Deficiencies per Classification Societies
Classification Society Number of Inspections Number of Inspections with
Deficiencies
3-year
average
percentage
Year Year
2004 2005 2006 Total 2004 2005 2006 Total
American Bureau of Shipping 466 442 461 1369 242 235 236 713 52.08
Bureau Veritas 423 485 437 1345 255 285 266 806 59.93
Biro Klasifikasi Indonesia 12 15 14 41 12 15 13 40 97.56
Ceskoslovensky Lodin Register 0 0 1 1 0 0 0 0 0.00
CONARINA 1 0 0 1 1 0 0 1 100.00
China Classification Society 210 226 228 664 125 125 121 371 55.87
China Corporation Register of Shipping 29 33 35 97 14 20 25 59 60.82
Croatian Register of Shipping 17 17 14 48 12 14 6 32 66.67
Det Norske Veritas 535 518 460 1513 246 247 227 720 47.29
Global Marine Bureau 1 3 2 6 1 2 2 5 83.33
Germanischer Lloyd 415 418 444 1277 193 208 209 610 47.77
Hellenic Register of Shipping 23 23 11 57 19 17 11 47 82.46
Honduras Bureau of shipping 0 1 0 1 0 1 0 1 100.00
Honduras International Surveying &
Inspection Bureau
1 1 1 3 1 0 1 2 66.67
Honduras Maritime Inspection 0 2 0 2 0 2 0 2 100.00
Inspection Y Classification Maritima 1 0 0 1 0 0 0 0 0.00
International Register of Shipping 42 33 39 114 34 31 38 103 90.35
Inclamar Incorporate 0 1 1 2 0 1 0 1 50.00
Indian Register of Shipping 64 44 45 153 36 32 28 96 62.75
Isthmus Bureau of Shipping 2 4 5 11 2 4 5 11 100.00
International Naval Surveys Bureau 7 7 15 29 3 7 15 25 86.21
Korean Register of Shipping 187 222 227 636 99 122 133 354 55.66
Korea Classification Society 33 36 27 96 25 33 26 84 87.50
Lloyd's Register 852 785 757 2394 481 430 417 1328 55.47
Marconi International Marine Co. Ltd. 0 0 1 1 0 0 1 1 100.00
Nippon Kaiji Kyokai 1700 1602 1668 4970 842 828 886 2556 51.43
Panama Maritime Documentation Service 0 0 3 3 0 0 3 3 100.00
Panama Maritime Surveyors Bureau Inc. 2 1 2 5 2 1 2 5 100.00
Panama Register Corporation 5 4 3 12 2 3 3 8 66.67
Panama Bureau of Shipping 1 1 0 2 1 1 0 2 100.00
Panama Shipping Registrar Inc. 0 1 0 1 0 1 0 1 100.00
Polski Rejestr Statkow 22 19 9 50 18 15 6 39 78.00
Registro Italiano Navale 89 99 96 284 51 64 63 178 62.68
Registro Internacional Naval S.A. 0 0 1 1 0 0 1 1 100.00
RINAVE Portuguesa 1 1 2 4 0 1 1 2 50.00
Register of Shipping 13 2 0 15 7 0 0 7 46.67
Russian Maritime Register of Shipping 470 115 66 651 317 87 47 451 69.28
Russian River Register 1 0 0 1 0 0 0 0 0.00
Seefartsaht Helsinki 0 0 1 1 0 0 0 0 0.00
Shipping Register of Ukraine 1 2 0 3 1 2 0 3 100.00
22

INDIAN OCEAN MEMORANDUM OF UNDERSTANDING ON PORT STATE CONTROL
Table :9 (Contd.)
Comparison of Inspections and Deficiencies per Classification Societies
Classification Society Number of Inspections Number of Inspections with
Deficiencies
3-year
average
percentage
Year Year
2004 2005 2006 Total 2004 2005 2006 Total
Turkish Lloyd 4 2 4 10 4 2 4 10 100.00
Vietnam Register of Shipping 2 6 9 17 1 5 9 15 88.24
Not Classed 7 0 0 7 4 0 0 4 57.14
No Class 0 0 1 1 0 0 0 0 0.00
0ther 51 34 32 117 36 30 30 96 82.05
Total 5690 5205 5124 16019 3087 2871 2836 8794
23

INDIAN OCEAN MEMORANDUM OF UNDERSTANDING ON PORT STATE CONTROL
Table: 10
Comparison of Inspections and Detentions per Classification Societies
Number of Inspections Number of Detentions
YEAR YEAR
Classification Society
2004 2005 2006 Total 2004 2005 2006 Total
3-year
average
percentage
American Bureau of Shipping 466 442 461 1369 42 31 27 100 7.30
Bureau Veritas 423 485 437 1345 52 53 29 134 9.96
Bulgarski Koraben Registar 0 0 2 2 0 0 1 1 50.00
Biro Klasifikasi Indonesia 12 15 14 41 7 7 7 21 51.22
CONARINA 1 0 0 1 1 0 0 1 100.00
China Classification Society 210 226 228 664 6 6 15 27 4.07
China Corporation Register of Shipping 29 33 35 97 2 2 8 12 12.37
Ceskoslovensky Lodin Register 0 0 1 1 0 0 0 0 0.00
Croatian Register of Shipping 17 17 14 48 3 1 0 4 8.33
Det Norske Veritas 535 518 460 1513 23 30 27 80 5.29
Global Marine Bureau 1 3 2 6 0 0 1 1 16.67
Germanischer Lloyd 415 418 444 1277 31 29 27 87 6.81
Hellenic Register of Shipping 23 23 11 57 10 8 9 27 47.37
Honduras Bureau of shipping 0 1 0 1 0 0 0 0 0.00
Honduras International Surveying &
Inspection Bureau
1 1 1 3 1 0 1 2 66.67
Honduras Maritime Inspection 0 2 0 2 0 0 0 0 0.00
Inspection Y Classification Maritima. 1 0 0 1 0 0 0 0 0.00
International Register of Shipping 42 33 39 114 18 16 27 61 53.51
Inclamar Incorporate 0 1 1 2 0 0 0 0 0.00
Indian Register of Shipping 64 44 45 153 7 7 5 19 12.42
Isthmus Bureau of Shipping 2 4 5 11 1 1 2 4 36.36
International Naval Surveys Bureau 7 7 15 29 1 4 10 15 51.72
Korean Register of Shipping 187 222 227 636 6 15 12 33 5.19
Korea Classification Society 33 36 27 96 11 13 13 37 38.54
Lloyd's Register 852 785 757 2394 77 47 43 167 6.98
Marconi International Marine Co. Ltd. 0 0 1 1 0 0 0 0 0.00
Nippon Kaiji Kyokai 1700 1602 1668 4970 76 56 76 208 4.19
Panama Maritime Documentation Services 0 0 3 3 0 0 2 2 66.67
Panama Maritime Surveyors Bureau Inc. 2 1 2 5 1 1 2 4 80.00
Panama Register Corporation 5 4 3 12 1 0 2 3 25.00
Panama Bureau of Shipping 1 1 0 2 0 0 0 0 0.00
Panama Shipping Registrar Inc. 0 1 0 1 0 0 0 0 0.00
Polski Rejestr Statkow 22 19 9 50 7 3 3 13 26.00
Registro Italiano Navale 89 99 96 284 12 13 13 38 13.38
Regiastro Internacional Naval S.A. 0 0 1 1 0 0 1 1 100.00
RINAVE Portuguesa 1 1 2 4 0 0 0 0 0.00
Register of Shipping 13 2 0 15 7 0 0 7 46.67
Russian Maritime Register of Shipping 470 115 66 651 56 11 15 82 12.60
Russian River Register 1 0 0 1 0 0 0 0 0.00
Seefartsaht Helsinki 0 0 1 1 0 0 0 0 0.00
Shipping Register of Ukraine 1 2 0 3 0 0 0 0 0.00
24
INDIAN OCEAN MEMORANDUM OF UNDERSTANDING ON PORT STATE CONTROL
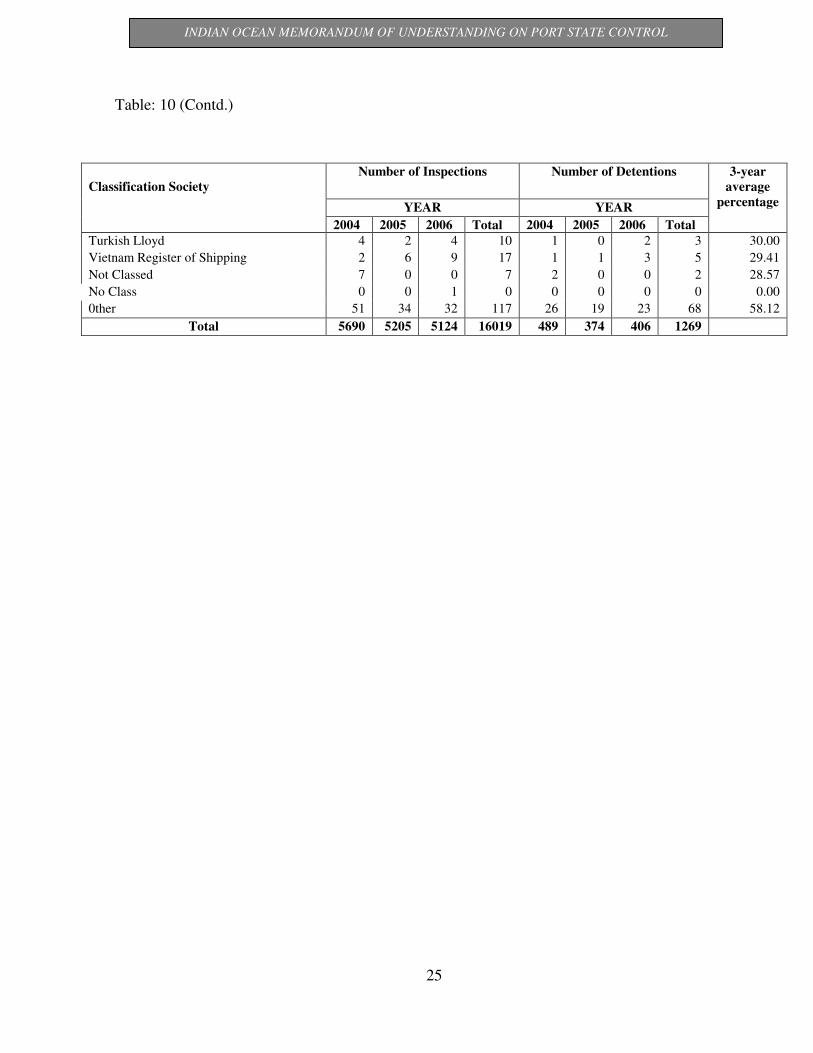
Table: 10 (Contd.)
Number of Inspections Number of Detentions
YEAR YEAR
Classification Society
2004 2005 2006 Total 2004 2005 2006 Total
3-year
average
percentage
Turkish Lloyd 4 2 4 10 1 0 2 3 30.00
Vietnam Register of Shipping 2 6 9 17 1 1 3 5 29.41
Not Classed 7 0 0 7 2 0 0 2 28.57
No Class 0 0 1 0 0 0 0 0 0.00
0ther 51 34 32 117 26 19 23 68 58.12
Total 5690 5205 5124 16019 489 374 406 1269
25

INDIAN OCEAN MEMORANDUM OF UNDERSTANDING ON PORT STATE CONTROL
Fig. 1
26
INSPECTION EFFORTS
AUSTRALIA 3079
(60%)
INDIA 653
(13%)
IRAN 579
(11%)
KENYA 132
[3%]
SOUTH AFRICA 654
[13%]
SRI LANKA 7
MAURITIUS 20
TOTAL INSPECTIONS : 5124

INDIAN OCEAN MEMORANDUM OF UNDERSTANDING ON PORT STATE CONTROL
This graph depicts 20 inspections and above/ Ship Type
27
Percentage of Ship Type with Deficiencies
0.00
10.00
20.00
30.00
40.00
50.00
60.00
70.00
80.00
90.00
Pa
sse
ng
er S
hip
Tu
gb
oa
t
Liv
esto
ck C
arrie
r
Offs
ho
re S
erv
ice
Ve
sse
l
Ro
-Ro
Ca
rgo
Sh
ip
Ga
s C
arrie
r
Wo
od
ch
ip C
arrie
r
Re
frige
rate
d C
arg
o
Ca
rrier
Ve
hic
le C
arrie
r
Ch
em
ica
l Ta
nke
r
Oil T
an
ke
r
Co
nta
ine
r Sh
ip
Ge
ne
ral C
arg
o /
Mu
ltipu
rpo
se
Sh
ip
Bu
lk C
arrie
r
Pe
rce
nta
ge
Fig. 2

INDIAN OCEAN MEMORANDUM OF UNDERSTANDING ON PORT STATE CONTROL
This graph depicts 20 inspections and above/ Ship Type
28
Percentage of Detention per Ship Type
0.00
5.00
10.00
15.00
20.00
25.00
30.00
35.00
Passenger S
hip
Tugboat
Liv
esto
ck C
arrie
r
Offs
hore
Serv
ice V
essel
Ro-R
o C
arg
o S
hip
Gas C
arrie
r
Woodchip
Carrie
r
Refrig
era
ted C
arg
o
Carrie
r
Vehic
le C
arrie
r
Chem
ical T
anker
Oil T
anker
Conta
iner S
hip
Genera
l Carg
o /
Multip
urp
ose S
hip
Bulk
Carrie
r
Pe
rce
nta
ge
Fig. 3

INDIAN OCEAN MEMORANDUM OF UNDERSTANDING ON PORT STATE CONTROL
Deficiencies by Flag
Bahamas
GreeceChina
St. Vincent &
GrenadinesMarshall
Islands
Norway
Korea Republic
of
Panama
Singapoore
Cyprus
Malta
Hongkong
China Liberia
Fig. 4
29
This graph depicts 75 inspections and above / Flag.
INDIAN OCEAN MEMORANDUM OF UNDERSTANDING ON PORT STATE CONTROL
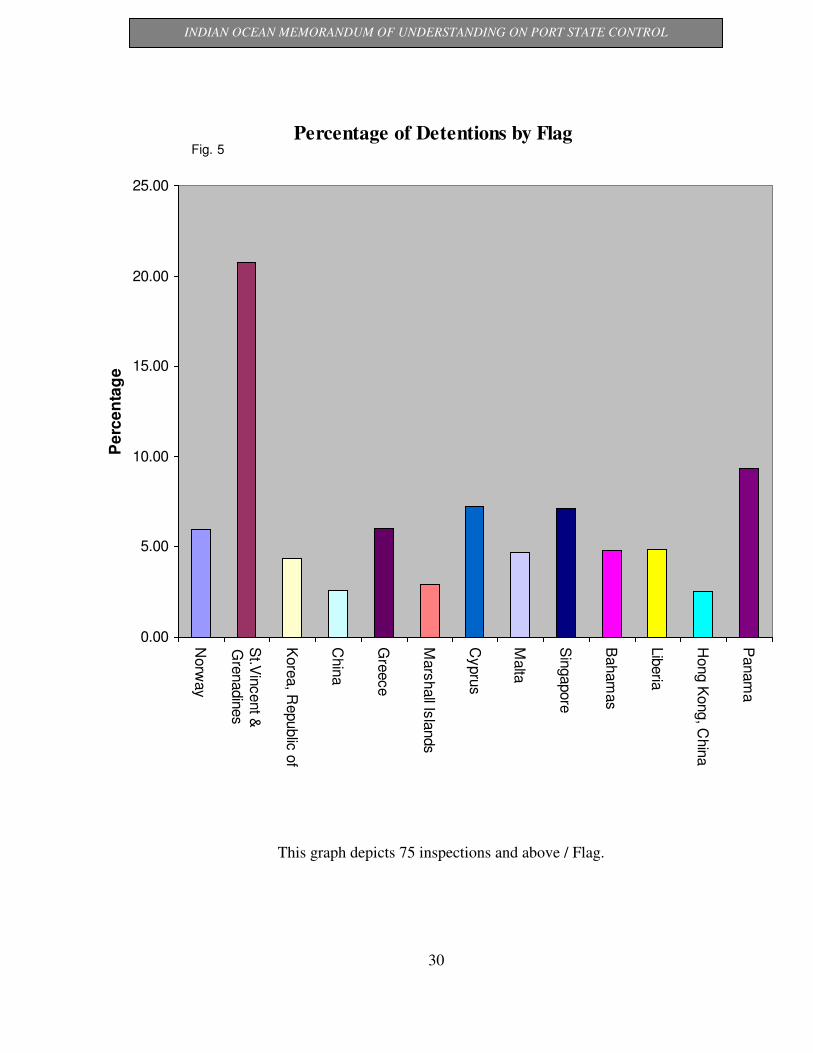
This graph depicts 75 inspections and above / Flag.
30
Percentage of Detentions by Flag
0.00
5.00
10.00
15.00
20.00
25.00
Norw
ay
St.V
incent &
Gre
nadin
es
Kore
a, R
epublic
of
Chin
a
Gre
ece
Mars
hall Is
lands
Cypru
s
Malta
Sin
gapore
Baham
as
Lib
eria
Hong K
ong, C
hin
a
Panam
a
Pe
rce
nta
ge
Fig. 5

INDIAN OCEAN MEMORANDUM OF UNDERSTANDING ON PORT STATE CONTROL
This graph depicts deficiencies percentage 1.5 and above.
31
Deficiency Percentage By Categories
0
2
4
6
8
10
12
14
16
Ship
's C
ertific
ate
s a
nd D
ocum
ents
Certific
atio
n a
nd W
atc
hkeepin
g
Cre
w &
Accom
modatio
n (IL
O 1
47)
Work
ing S
paces (IL
O 1
47)
Life
Savin
g A
pplia
nces
Fire
Safe
ty M
easure
s
Accid
ent P
reventio
n (IL
O 1
47)
Sta
bility
, Stru
ctu
re a
nd R
ela
ted E
quip
ments
Carria
ge o
f Garg
o a
nd D
angero
us G
oods
Load L
ines
Moorin
g A
rrangem
ents
(ILO
147)
Pro
puls
ion &
Auxilia
ry M
achin
ery
Safe
ty o
f Navig
atio
n
Radio
Com
munic
atio
ns
Marp
ol A
nnex I
Sola
s R
ela
ted O
pera
tional D
efic
iencie
s
Marp
ol R
ela
ted O
pera
tional D
eic
iencie
s
Marp
ol A
nnex V
ISM
Rela
ted D
efic
iencie
s
Pe
rce
nta
ge
Fig. 6

INDIAN OCEAN MEMORANDUM OF UNDERSTANDING ON PORT STATE CONTROL
This graph depicts inspections of 10 Ships and above/ Classification Society
.
32
Detention Percentage By Classification Societies
0
10
20
30
40
50
60
70
80
90
He
llen
ic R
eg
iste
r of S
hip
pin
g
Biro
Kla
sifik
asi In
do
ne
sia
Cro
atia
n R
eg
iste
r of S
hip
pin
g
Inte
rna
tion
al N
ava
l Su
rve
ys B
ure
au
Ko
rea
n C
lassific
atio
n S
ocie
ty
Oth
er
Ch
ina
Co
rpo
ratio
n R
eg
iste
r of S
hip
pin
g
Inte
rna
tion
al R
eg
iste
r of S
hip
pin
g
Ind
ian
Re
gis
ter o
f Sh
ipp
ing
Ru
ssia
n M
aritim
e R
eg
iste
r of S
hip
pin
g
Re
gis
tro Ita
lian
o N
ava
le
Ko
rea
n R
eg
iste
r of S
hip
pin
g
Ch
ina
Cla
ssific
atio
n S
ocie
ty
Bu
rea
u V
erita
s
Ge
rma
nis
ch
er L
loyd
De
t No
rske
Ve
ritas
Am
eric
an
Bu
rea
u o
f Sh
ipp
ing
Llo
yd
's R
eg
iste
r
Nip
po
n K
aiji K
yo
ka
iP
erc
en
tag
e
Fig. 7
INDIAN OCEAN MEMORANDUM OF UNDERSTANDING ON PORT STATE CONTROL
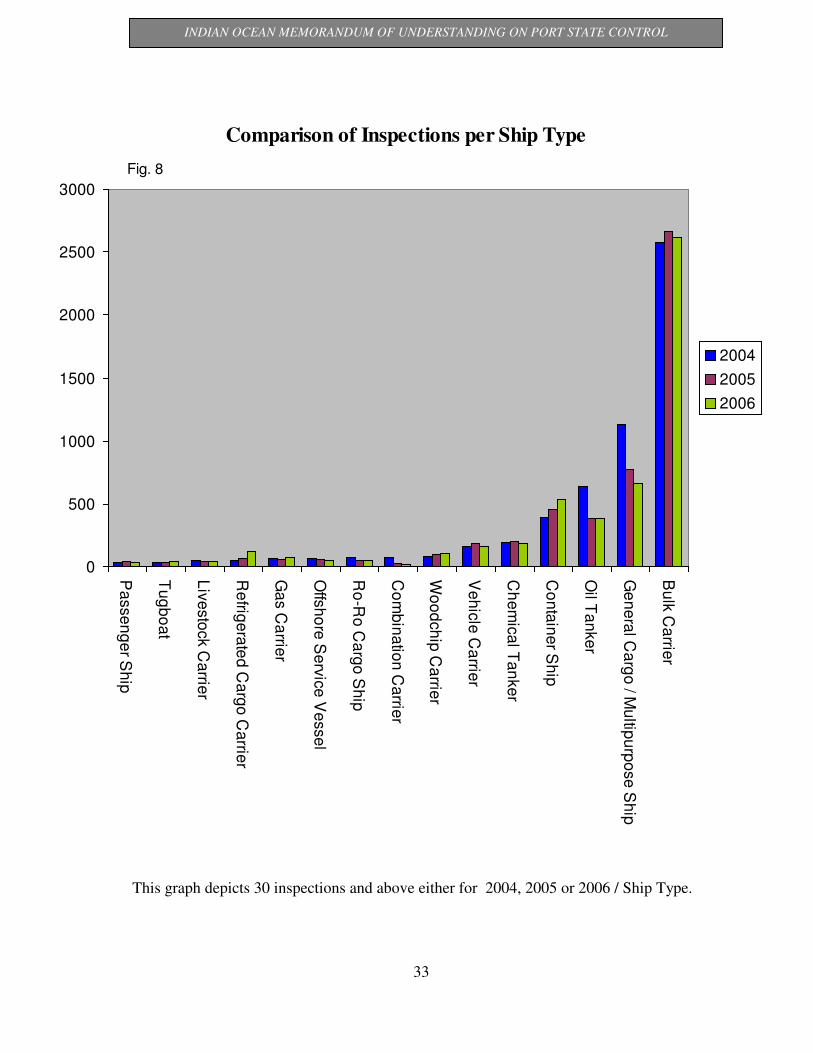
This graph depicts 30 inspections and above either for 2004, 2005 or 2006 / Ship Type.
33
Comparison of Inspections per Ship Type
0
500
1000
1500
2000
2500
3000
Pa
sse
ng
er S
hip
Tu
gb
oa
t
Liv
esto
ck C
arrie
r
Re
frige
rate
d C
arg
o C
arrie
r
Ga
s C
arrie
r
Offs
ho
re S
erv
ice
Ve
sse
l
Ro
-Ro
Ca
rgo
Sh
ip
Co
mb
ina
tion
Ca
rrier
Wo
od
ch
ip C
arrie
r
Ve
hic
le C
arrie
r
Ch
em
ica
l Ta
nke
r
Co
nta
ine
r Sh
ip
Oil T
an
ke
r
Ge
ne
ral C
arg
o / M
ultip
urp
ose
Sh
ip
Bu
lk C
arrie
r
2004
2005
2006
Fig. 8
INDIAN OCEAN MEMORANDUM OF UNDERSTANDING ON PORT STATE CONTROL
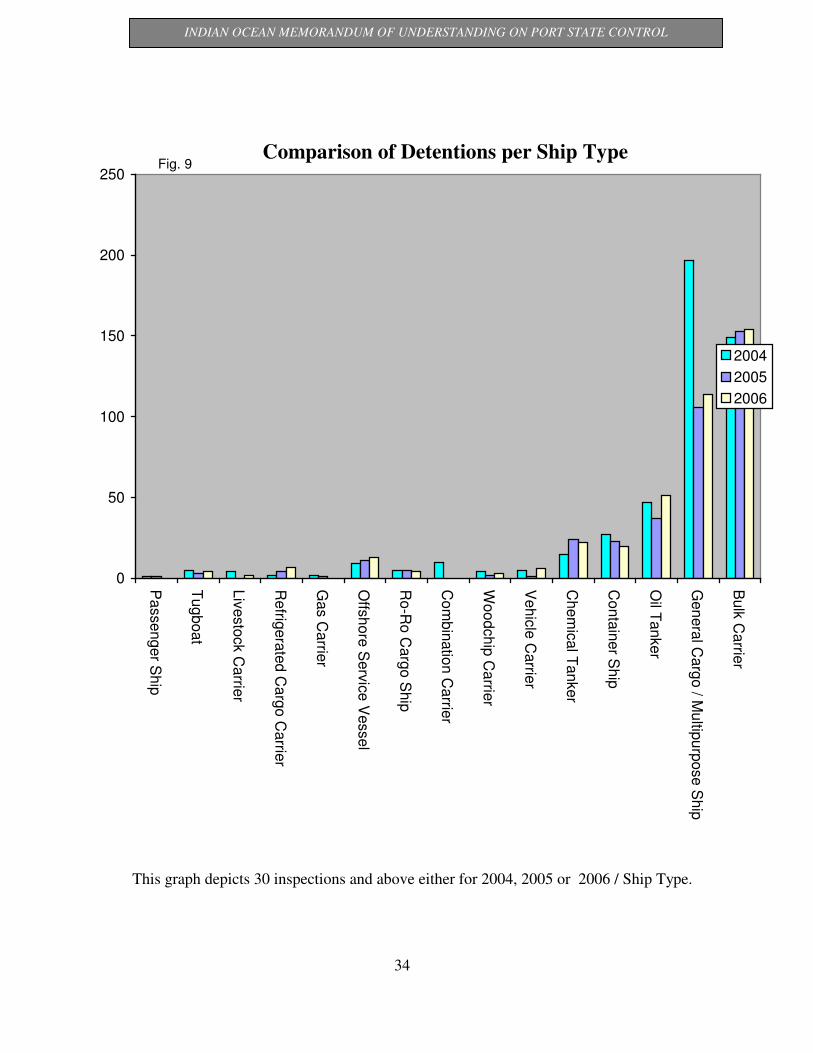
This graph depicts 30 inspections and above either for 2004, 2005 or 2006 / Ship Type.
34
Comparison of Detentions per Ship Type
0
50
100
150
200
250
Passenger S
hip
Tugboat
Liv
esto
ck C
arrie
r
Refrig
era
ted C
arg
o C
arrie
r
Gas C
arrie
r
Offs
hore
Serv
ice V
essel
Ro-R
o C
arg
o S
hip
Com
bin
atio
n C
arrie
r
Woodchip
Carrie
r
Vehic
le C
arrie
r
Chem
ical T
anker
Conta
iner S
hip
Oil T
anker
Genera
l Carg
o / M
ultip
urp
ose S
hip
Bulk
Carrie
r
2004
2005
2006
Fig. 9

INDIAN OCEAN MEMORANDUM OF UNDERSTANDING ON PORT STATE CONTROL
% over (+) or under (-) average
35
Summary of 3-year Inspections with Deficiencies per Ship Type
8.67
-21.71
-15.84
0.98
-6.15
-2.17
-12.67
-10.39
-16.79
2.04
13.1
1.62
18.83
-25 -20 -15 -10 -5 0 5 10 15 20 25
Oil Tanker
Gas Carrier
Chemical Tanker
Offshore Service Vessel
Bulk Carrier
Vehicle Carrier
Container Ship
Ro-Ro Caro Ship
Refrigerated Cargo Ship
Wood Chip Carrier
Fig 10
Live stock carrier
Combination Carrier
General Cargo/Multipurpose Ship

INDIAN OCEAN MEMORANDUM OF UNDERSTANDING ON PORT STATE CONTROL
This graph depicts detentions of 10 and above either for 2004, 2005 or 2006/ flag
36
Comparison of Detentions per Flag
0
20
40
60
80
100
120
140
160
Com
oro
s
Hon
g K
ong
Tha
iland
Sin
gapore
Bah
am
as
Lib
eria
Cyp
rus
Malta
St.V
incent &
Gre
nadin
es
Kore
a D
PR
Russia
Pan
am
a
2004 2005 2006
Fig 11
INDIAN OCEAN MEMORANDUM OF UNDERSTANDING ON PORT STATE CONTROL
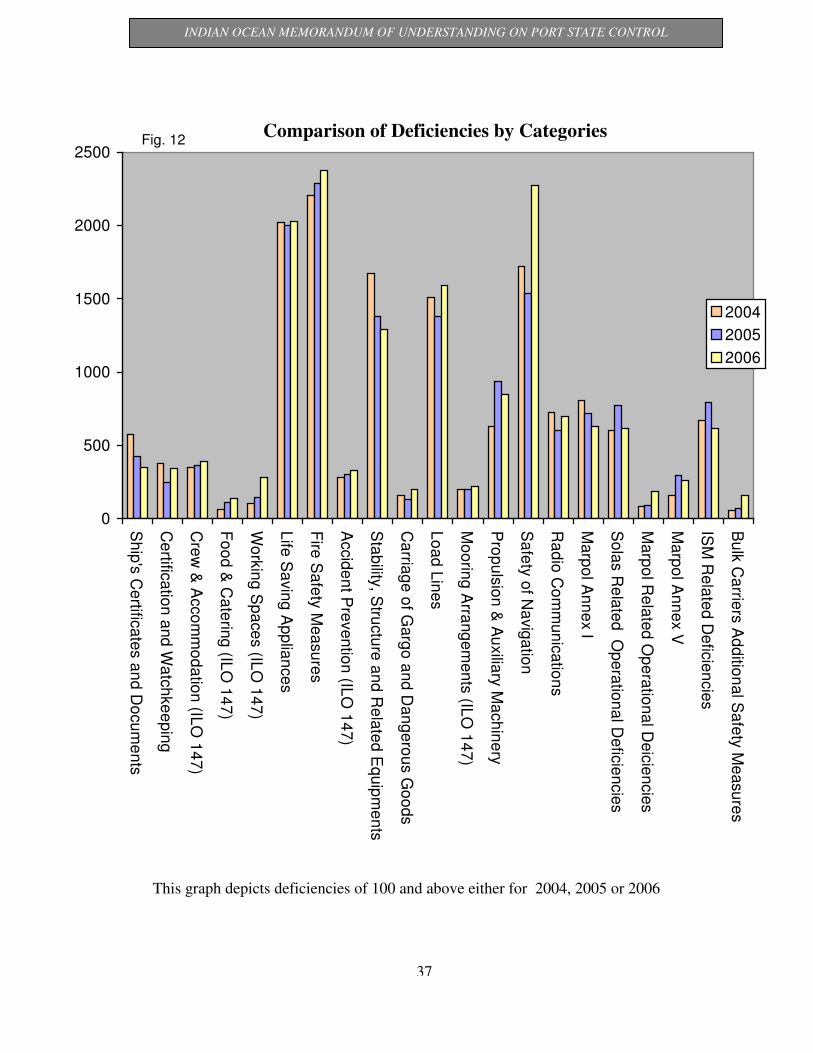
This graph depicts deficiencies of 100 and above either for 2004, 2005 or 2006
37
Comparison of Deficiencies by Categories
0
500
1000
1500
2000
2500
Sh
ip's
Ce
rtificate
s a
nd
Do
cu
me
nts
Ce
rtifica
tion
and
Wa
tch
ke
ep
ing
Cre
w &
Acco
mm
od
atio
n (IL
O 1
47
)
Fo
od
& C
ate
ring
(ILO
14
7)
Wo
rkin
g S
pa
ce
s (IL
O 1
47
)
Life
Sa
vin
g A
pp
lian
ce
s
Fire
Sa
fety
Mea
su
res
Accid
en
t Pre
ven
tion
(ILO
14
7)
Sta
bility
, Stru
ctu
re a
nd
Re
late
d E
quip
me
nts
Ca
rriag
e o
f Garg
o a
nd
Da
ng
ero
us G
oo
ds
Lo
ad
Lin
es
Mo
orin
g A
rrang
em
en
ts (IL
O 1
47
)
Pro
pu
lsio
n &
Au
xilia
ry M
ach
ine
ry
Sa
fety
of N
avig
atio
n
Ra
dio
Co
mm
un
ica
tion
s
Ma
rpo
l An
ne
x I
So
las R
ela
ted O
pe
ratio
na
l De
ficie
ncie
s
Ma
rpo
l Re
late
d O
pe
ratio
na
l De
icie
ncie
s
Ma
rpo
l An
ne
x V
ISM
Re
late
d D
efic
ien
cie
s
Bu
lk C
arrie
rs A
dd
ition
al S
afe
ty M
easu
res
2004
2005
2006
Fig. 12

INDIAN OCEAN MEMORANDUM OF UNDERSTANDING ON PORT STATE CONTROL
This graph depicts inspections of 40 ships and above either for 2004, 2005 or 2006
38
Comparison of Inspections per Classification Societies
0
200
400
600
800
1000
1200
1400
1600
1800
Inte
rna
tion
al R
eg
iste
r
of S
hip
pin
g
Oth
er
Ind
ian
Re
gis
ter o
f
Sh
ipp
ing
Re
gis
tro Ita
lian
o
Na
va
le
Ko
rea
n R
eg
iste
r of
Sh
ipp
ing
Ch
ina
Cla
ssific
atio
n
So
cie
ty
Ge
rma
nis
ch
er L
loyd
Bu
rea
u V
erita
s
Am
eric
an
Bu
rea
u o
f
Sh
ipp
ing
Ru
ssia
n M
aritim
e
Re
gis
ter o
f Sh
ipp
ing
De
t No
rske
Ve
ritas
Llo
yd
's R
eg
iste
r
Nip
po
n K
aiji K
yo
ka
i
2004
2005
2006
Fig. 13

INDIAN OCEAN MEMORANDUM OF UNDERSTANDING ON PORT STATE CONTROL
39
This graph depicts detentions of 5 and above either for 2004, 2005 or 2006
Comparison of Detentions per Classification Societies
0
10
20
30
40
50
60
70
80
90
Inte
rnatio
nal N
aval S
urv
eys B
ure
au
Chin
a C
lassific
atio
n S
ocie
ty
Kore
an R
egis
ter o
f Ship
pin
g
Regis
ter o
f Ship
pin
g
Pols
ki R
egis
ter S
tatk
ow
India
n R
egis
ter o
f Ship
pin
g
Biro
Kla
sifik
asi In
donesia
Helle
nic
Regis
ter o
f Ship
pin
g
Kore
an C
lassific
atio
n S
ocie
ty
Regis
tro Ita
liano N
avale
Inte
rnatio
nal R
egis
ter o
f Ship
pin
g
Det N
ors
ke V
erita
s
Oth
er
Germ
anis
cher L
loyd
Am
eric
an B
ure
au o
f Ship
pin
g
Bure
au V
erita
s
Russia
n M
aritim
e R
egis
ter o
f Ship
pin
g
Nip
pon K
aiji K
yokai
Llo
yd's
Regis
ter o
f ship
pin
g
2004
2005
2006
Fig. 14

INDIAN OCEAN MEMORANDUM OF UNDERSTANDING ON PORT STATE CONTROL
THE REPORT OF CIC ON LIFEBOAT AND LIFEBOAT LAUNCHING APPLIANCES
Summary of answers to questions on CIC checklist
No. Question Yes No NA
1 Lifeboat and lifeboat Launching Appliances
1 Do records indicate that the crew have launched and manoeuvred the
lifeboats in the water as required by SOLAS? 607 25 2
2 Do records indicate the crew maintain the lifeboats and davits? 605 24 5
3 Do records indicate the crew maintain the lifeboat falls? 597 25 12
4 Do records indicate the maintenance and testing of ‘on-load’ release
gear (if fitted)? 401 22 211
5 Do the records indicate that winch brakes have had static and dynamic
tests carried out? 553 42 39
6 Does the vessel have davit-launched lifeboats? 581 46 7
7 Is the condition of the lifeboats hull satisfactory? 611 22 1
8 Is the condition of the lifeboats equipment satisfactory? 589 44 1
9 Are the means of attaching the falls to the lifeboat satisfactory? 584 25 25
10 Can the crew demonstrate an understanding of the operation of the ‘on-
load’ release gear? 425 11 198
11 Are there clear instructions for the use of the ‘on-load’ release gear in
the working language of the crew? 412 19 203
12 Are the davits in a satisfactory condition? 581 20 33
13 Do the sheaves and other moving parts operate correctly? 563 25 46
14 Are the davit limit switches operating correctly? 534 32 68
2 Actions
1 Did the PSCO detain the ship for lifeboat or launching deficiencies? 23 611 0
3 Remarks:
40
INDIAN OCEAN MEMORANDUM OF UNDERSTANDING ON PORT STATE CONTROL
Merchant Shipping Division of Sri-Lanka.
Our Vision
Developing Sri-Lanka as a leading Maritime Centre in the South Asian Region with the most
competitive, user-friendly, high quality ports and shipping services.
Our Mission
• Produce high quality professional seafarers in order to enhance employment prospects.
• Maintain a quality but competitive ship register.
• Implement the provisions of all applicable National and International Conventions and
Regulations.
• Enhance and update the professional knowledge of officials in the Maritime Administration.
• Perform regulatory and service-oriented functions with a high degree of efficiency and
integrity.
• Continuous Improvement in all aspects of maritime activities.
The Merchant Shipping Division which is the shipping administration arm of Sri Lanka performs
its functions in terms of the Merchant Shipping Act No. 52 of 1971, amended in 1998, Licensing of
Shipping Agents Act No. 10 of 1972, Admiralty jurisdiction Act No. 40 of 1983 and regulations
made thereunder. The functions of the Division under these enactments are as follows,
a) Licensing of Shipping Agents,
b) The conduct of examinations and issue of Certificates of Competency to Merchant Navy
Officers and Ratings,
c) Training of Seafarers,
d) Port State Control matters,
e) Safety of Navigation,
f) Matters pertaining to maritime wrecks,
g) Maritime casualty prevention and investigation.
h) Registration of Ships under Sri Lanka Flag,
i) Functions of the Marshal of the Admiralty Court,
j) Enforcement of International Conventions related to Shipping.
The Shipping Agents of Sri Lanka, Freight Forwarders, Non Vessel Operating Common Carriers
(NVOCC), Container Freight Stations, Container Terminals and Container Depot Operators are
directly regulated by this Division.
In accordance with the provisions of the International Convention on Standards of Training,
Certification and Watch Keeping for seafarers 1978, as amended in 1995 (STCW Convention), the
Merchant Shipping Division had submitted a report to The International Maritime Organization
(IMO) on the independent evaluation of the quality assurance system implemented by it’s
Examination Unit.
41
INDIAN OCEAN MEMORANDUM OF UNDERSTANDING ON PORT STATE CONTROL
This submission has been accepted & approved by the IMO and, as a result, Sri Lanka has been
included in the list of countries who have given full & complete effect to the STCW Convention. In
other words, Sri Lanka can continue to train and certify seafarers for the International Shipping
Industry. An estimated 18,000 active seafarers are domiciled in Sri-Lanka. Presently Sri-Lanka has
six maritime training establishments, approved by the Merchant Shipping Division.
Examinations are conducted by the Examination Unit of the Division to issue Certificates of
Competency for Deck and Marine Engineering Officers up to the ranks of Masters and Chief
Engineer Officers. The examinations have been conducted in terms of the regulations issued under
the Merchant Shipping Regulations 1998 (Training, Certification and Watch Keeping)which gave
effect to the International Convention on Standards of Training, Certification and Watch keeping
for seafarers 1978 as amended in 1995 (STCW-78 and STCW-95). The Examination Unit of the
Merchant Shipping Division has obtained ISO 9001 Quality Assurance System Certification from
Det Norske Veritas (DNV), Norway with the aim of maintaining international recognition of
certificates issued to seafarers by Sri-Lanka.
This Division also has the responsibility of carrying out inspections of ships visiting all Sri-Lankan
sea-ports in order to ensure their compliance with relevant international conventions. In 1999, Sri
Lanka became a member of the regional Port State Control Mechanism, which is referred to as the
“Indian Ocean Memorandum of Understanding (IOMOU) on Port State Control”.
These inspections are also an obligation under the “IOMOU on Port State Control” for which Sri-
Lanka is a signatory to. In keeping with stringent international requirements, any ship calling at a
Sri Lanka Port is found to be un seaworthy and/or being a potential pollution threat to the marine
environment is promptly detained by the Port State Control inspectors until any such defects are
rectified. Thus, the commitment shown by Sri Lanka in this regard augurs well with the efforts of
the International Maritime Community to minimize maritime related disasters and pollution.
CONTACT DETAILS
Address. : Merchant Shipping Division,
Ministry of Ports and Aviation,
First Floor, Bristol Building,
43-89, York Street,
Colombo-01
Sri-Lanka.
Telephone : +94 11 2441429 DGMS
+94 11 2441293/94 DDMS(Admin)
+94 11 2435127 GENERAL
Fax. : +94 11 2435160
E-mail : [email protected]
Website : www.ports-aviation.gov.lk
42


