
1
Indiana State Rural Health Plan
July 2011
Submitted by
Affiliated Service Providers of Indiana, Inc.

2
Acknowledgements
The Indiana State Rural Health Plan represents the voices of many who seek to provide
Indiana’s rural citizens with exceptionally high quality, affordable, and accessible health care.
Dozens of administrators and community network representatives provided insight and data
through survey and interview processes that informed the primary themes of this document that
will serve as a starting point for planning and forward movement in rural health care within
Indiana.
3
Table of Contents
Topic Page
Executive Summary 7
Forward 8 Rural Indiana 9
Social Determinants of Health 10
Background and Purpose 14
Process for Developing the Plan 15
Vision 16
Section I. A Picture of Indiana’s Rural Population 18
Indiana’s Rural Demographics 18
Current Economic Picture 20
Employment Change and Migration 20
Other Measures of Economic Distress 24
Age 25
Persons with Disabilities 28
Major Causes of Death 30
Rural Population Summary 31
Section II. Critical Access Hospitals 33
The Medicare Rural Hospital Flexibility Program 33
Indiana’s Critical Access Hospitals 33
Performance Data 35
Critical Access Hospitals Summary 39
Indiana’s Community Health Centers 39
Section III. The Need for Health Professionals 45
Shortages in Indiana 45
The Need for Health Professionals Summary 49
Section IV. Flex Funding Needs Assessment 51
Flex Program Work Plan 51
Work Plan Goals and Objectives 51
Assumptions in Work Plan Goal Development 52
Current Flex Projects 53
Flex Funding Summary 54
Hospitals to be Served through Flex Funding 55
Expected benefits from Flex Program activities 58
Resources and Capabilities 60
Informing Future Efforts 61
Critical Access Hospital Survey Outcomes 61
Key stakeholder Input 71

4
Rural Roundtable Survey Response Summary 72
Section V. Moving Toward a High Performance Rural Health Care System 77
The Indiana State Office of Rural Health 77
External Partners 77
State Matching Fund Support 79
Alignment with Wider Initiatives 82
Rural Health Work Plan Summary 83
VI. Summary 85
Appendix A – Survey Forms 88
Critical Access Hospital Survey 89
Statewide Associations Survey 95
Appendix B – Work Plans 97
Goals Alignment Framework 98
Indiana State Office of Rural Health Work Plan 99
5
List of Figures
Figure Page
Figure 1. State Rankings, BRFSS 2008 8
Figure 2. Counties with Best and worst Physician Access 9
Figure 3. Components of Health Outcomes 11
Figure 4. Community-based Programs and Policies Designed to Alter
the Distribution of Health Factors within the Community 11
Figure 5. Metro and Nonmetro Counties in Indiana 12
Figure 6. Maps of Indiana County Health Outcomes and Health
Factors Rankings 12
Figure 7. Health Outcomes and Health Factor Rankings of Indiana Counties 13
Figure 8. Quartile Distribution of Rural Counties’ Health Outcomes
and Health Factors 14
Figure 9. Indiana State Rural Health Plan Stakeholder Field 16
Figure 10. Population Distribution by Metropolitan Status Indiana
and US 18
Figure 11. Percent Change in Population 2000 – 2010 19
Figure 12. Indiana’s Annual Percent Change in Employment and
Net Migration, 1991 to 2008 20
Figure 13. Net Migration by County, 2009 21
Figure 14. Indiana Unemployment Rates by County, January 2011 22
Figure 15. Unemployment Rate and Population Shifts in Indiana
County Locations of Critical Access Hospitals 24
Figure 16. Indiana Welfare Statistics 2009 25
Figure 17. Population Share, 2008 – 2040 27
Figure 18. Comparison of Projected Median Age of Populations in
CAH Counties 27
Figure 19. Graph Comparing CAH Counties, Indiana, and US
Projected Median Ages 28
Figure 20. Leading Causes of Death: Indiana Residents, 2006 and 2007 30
Figure 21. Risk Factors and Preventive Services, Indiana and United States 31
Figure 22. List of Critical Access Hospitals, Locations, and Number of Beds 34
Figure 23. Critical Access Hospital Locations, Counties with No Hospitals 35
Figure 24. CAH Return on Equity 36
Figure 25. Critical Access Hospital Liquidity Indicators 36
Figure 26. Critical Access Hospital Capital Structure Indicators 36
Figure 27. Critical Access Hospital Revenue Indicators 37
Figure 28. Critical Access Hospital Cost Indicators 37
Figure 29. Critical Access Hospital Utilization Indicators 37
Figure 30. CAH Participation in Hospital Compare in Indiana and Nationally
2005-2008 38
Figure 31. Hospital Compare Results for 2008 Discharges for CAHs in
Indiana and Nationally 38
Figure 32. Comparison of Prevalence of Clinician Types in CAH Counties to

6
MSA Centers 46
Figure 33. Indiana Primary Care Health Professional Shortage Areas and
Populations 47
Figure 34. Open Positions, All Hospitals, 2009 48
Figure 35. Acute Care Open Positions, All Hospitals, 2009 48
Figure 36. Projected Impact of the Indiana Flex Program, 2010-2011 53
Figure 37. Flex Funds Distribution 2010 – 2015 55
Figure 38. Rural Health Plan/Flex Grant Logic Model 56
Figure 39. Flex Advisory Committee, 2010-2011 57
Figure 40. Positions Most Difficult to Recruit, 2009 to 2011 62
Figure 41. Specialties Most Difficult to Recruit, 2011 63
Figure 42. Average Payer Mix of Critical Access Hospitals, 2011 64
Figure 43. Comparison of Payer Mix, 2009 through 2011 64
Figure 44. Benchmarking Entities Reported by CAHs, 2011 66
Figure 45. Technology Use, 2011 67
Figure 46. Barriers to Telehealth/Telemedicine Goals for Critical Access
Hospitals 67
Figure 47. Training Topics Most Needed by Critical Access Hospitals, 2011 68
Figure 48. Training Modalities in Use in Critical Access Hospitals, 2011 68
Figure 49. Interaction with Local Health Departments, 2011 69
Figure 50. Primary Unmet Health Care Needs Cited by Critical Access
Hospitals 70
Figure 51. Unmet Needs and Suggested Solutions Provided by
Critical Access Hospitals 70
Figure 47. Rural Roundtable Participants, 2010 - 2011 71
Figure 53. Goals Integration 81
Figure 54. The Community-Based Network 86

7
Executive Summary
The Indiana Rural Health Plan is a living document that captures the economic, workforce, and
health care needs of counties served by Indiana’s critical access hospitals. Indiana’s rural
populations are at the center of multiple forces that can work in concert to improve and sustain
health. Indiana is fortunate to have established partnerships on a statewide level that are keenly
focused upon issues of workforce development, quality service delivery, patient safety, emerging
telehealth connectivity, data gathering and analysis, training, and collaboration.
Through a review of secondary sources as well as through a dual survey process of key rural
health leaders and statewide organizations addressing rural health care, the current plan
establishes five directives to be addressed in its work plan. These include (1) support
collaborative solutions to issues of rural health service quality and access, (2) provide equitable
and accountable funding strategies for appropriate projects resulting in improved care and/or
provider accountability for rural citizens, (3) utilize existing expertise already working on rural
health issues to the greatest degree possible, (4) aid in accountability of clinical practice and
financial acumen of rural providers, and (5) act as a conduit of accurate information to and from
critical access hospitals, rural providers, training experts, and state policy makers.
Indiana continues to be challenged by shifts in demographic composition, loss of employment,
an uneven distribution of health care professionals, and shifts in payer mix for service providers.
Yet, Indiana’s rural health care providers remain dedicated to serving their communities,
developing skills, and remaining financially viable. Through technology, creativity,
collaboration, efficiencies of scale, and improved training and education, rural health care
providers remain resilient in the face of these challenges.
To support rural providers and their constituent consumers, the Indiana State Office of Rural
Health has formed a Flex Advisory Committee and a Rural Roundtable to enhance multi-
disciplinary communication, project collaboration, and efficiencies through integrative
approaches. Further, Flex funding processes are responsive to the identified needs of Critical
Access Hospitals as recorded through survey and focus group data. The process is objective and
accountable and aligned with categories of funding. The resulting work plan for the current
funding year fits within the parameters of the five state plan directives, relates directly to wider
national initiatives, and fits well within the overall goals for the State Office of Rural Health as
informed by rural stakeholders.
Movement toward an integrated system of care is especially challenging in rural areas as many
essential services (e.g., hospital and physician services, behavioral health, dental care, and EMS
services) are not available in many small communities. As a result, it is critical to develop
linkages with providers in other communities and to use the technology as effectively as
possible. The State Office of Rural Health maintains interest and support for emerging
technologies and models of cooperation that bring high quality coordinated and culturally
sensitive care to Indiana’s rural populations while supporting viable revenue streams for
providers. The Indiana Rural Health Plan is a catalyst for forward movement of initiatives and
collaborations in place within the state.
8
Indiana State Rural Health Plan
Forward
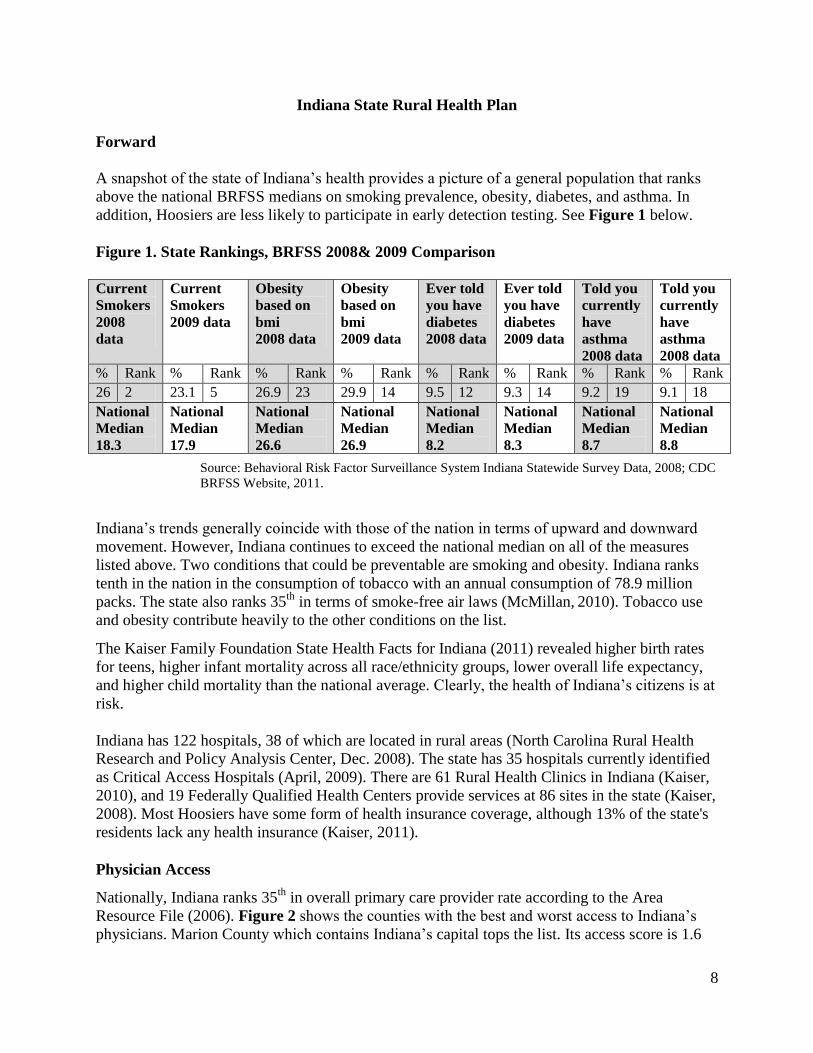
A snapshot of the state of Indiana’s health provides a picture of a general population that ranks
above the national BRFSS medians on smoking prevalence, obesity, diabetes, and asthma. In
addition, Hoosiers are less likely to participate in early detection testing. See Figure 1 below.
Figure 1. State Rankings, BRFSS 2008& 2009 Comparison
Current
Smokers
2008
data
Current
Smokers
2009 data
Obesity
based on
bmi
2008 data
Obesity
based on
bmi
2009 data
Ever told
you have
diabetes
2008 data
Ever told
you have
diabetes
2009 data
Told you
currently
have
asthma
2008 data
Told you
currently
have
asthma
2008 data
% Rank % Rank % Rank % Rank % Rank % Rank % Rank % Rank
26 2 23.1 5 26.9 23 29.9 14 9.5 12 9.3 14 9.2 19 9.1 18
National
Median
18.3
National
Median
17.9
National
Median
26.6
National
Median
26.9
National
Median
8.2
National
Median
8.3
National
Median
8.7
National
Median
8.8
Source: Behavioral Risk Factor Surveillance System Indiana Statewide Survey Data, 2008; CDC
BRFSS Website, 2011.
Indiana’s trends generally coincide with those of the nation in terms of upward and downward
movement. However, Indiana continues to exceed the national median on all of the measures
listed above. Two conditions that could be preventable are smoking and obesity. Indiana ranks
tenth in the nation in the consumption of tobacco with an annual consumption of 78.9 million
packs. The state also ranks 35th
in terms of smoke-free air laws (McMillan, 2010). Tobacco use
and obesity contribute heavily to the other conditions on the list.
The Kaiser Family Foundation State Health Facts for Indiana (2011) revealed higher birth rates
for teens, higher infant mortality across all race/ethnicity groups, lower overall life expectancy,
and higher child mortality than the national average. Clearly, the health of Indiana’s citizens is at
risk.
Indiana has 122 hospitals, 38 of which are located in rural areas (North Carolina Rural Health
Research and Policy Analysis Center, Dec. 2008). The state has 35 hospitals currently identified
as Critical Access Hospitals (April, 2009). There are 61 Rural Health Clinics in Indiana (Kaiser,
2010), and 19 Federally Qualified Health Centers provide services at 86 sites in the state (Kaiser,
2008). Most Hoosiers have some form of health insurance coverage, although 13% of the state's
residents lack any health insurance (Kaiser, 2011).
Physician Access
Nationally, Indiana ranks 35th
in overall primary care provider rate according to the Area
Resource File (2006). Figure 2 shows the counties with the best and worst access to Indiana’s
physicians. Marion County which contains Indiana’s capital tops the list. Its access score is 1.6

9
times as high as that of the second-ranked county, Vanderburgh County, and more than two
times as high as all but four counties. Marion County’s primacy shows that access to physician
care is very unequally distributed across Indiana. Indiana counties with the worst access to
physician care are listed at the bottom of Figure 2. Posey County in southern Indiana has the
worst access to physicians, followed by four other counties located along the Ohio River:
Switzerland, Ohio, Perry, and Spencer counties. The poor access in some of these counties is
mitigated to some extent by physicians in other states. Only two of the 10 counties with the
worst physician access, Benton and Newton counties, are located in the northern portion of the
state. They are part of a vast area along the Illinois border that has also been identified as a
Health Professional Shortage Area according to the criteria of the U.S. Department of Health and
Human Services.
Figure 2. Counties with Best and Worst Physician Access.
Rank County
The Best
1 Marion 1.00
2 Vanderburgh 0.64
3 Hamilton 0.632
4 Monroe 0.538
5 Hancock 0.525
6 St. Joseph 0.500
7 Allen 0.482
8 Boone 0.466
9 Hendricks 0.462
10 Tippecanoe 0.455
The Worst
83 Ripley 0.051
84 Benton 0.048
85 Sullivan 0.046
86 Newton 0.037
87 Crawford 0.018
88 Spencer 0.018
89 Perry 0.018
90 Ohio 0.010
91 Switzerland 0.005
92 Posey 0.000
*The higher the score, the better the access. Source: Purdue Center for Regional Development (2010).
Rural Indiana
Indiana represents a mix of major metropolitan areas with concentrations of industry and
commerce. Sixty percent of Indiana counties (55 of 92) are located in rural or non-metropolitan
areas. Twenty-six (26) of the 55 rural counties in Indiana are partially or completely medically
underserved or have shortages of health professionals. This designation indicates that residents in
certain rural areas have fewer physicians than urban areas and a higher rate of unemployment,
poverty rates, and population over the age of 65 years.
The challenges of health professional shortages are amplified in rural Indiana given the elevated
rates of tobacco use, obesity, diabetes, and hypertension. These rates are directly linked to higher
rates of cancer and heart disease in rural versus urban counties. While these all-too common

10
health problems can be improved through increased physical activity and improved nutrition, the
barriers associated with rural living, such as limited sidewalks, fitness centers, walking trails, as
well as lower socio-economic status make access to these resources a challenge.
The health of Indiana’s rural residents and their access to quality health care, public health
services and preventive health programs differ from urban residents. These statistics are no
surprise given the current economic climate and the rising cost of health insurance. The number
of uninsured and underinsured residents has increased and is causing more individuals to turn to
the Indiana Medicaid program and safety net providers for basic health services, which places a
financial strain on these already-stressed programs.
Social Determinants of Health
Social determinants of health are factors in the social environment that contribute to or detract
from the health of individuals and communities. These factors include, but are not limited to the
following:
Socioeconomic status
Transportation
Housing
Access to services
Discrimination by social grouping (e.g., race, gender, or class)
Social or environmental stressors
Social determinants of health have repeatedly been found to be associated with heart disease and
stroke. These factors work either directly to affect the burden of chronic diseases and their risk
factors, or indirectly, through their influence on health-promoting behaviors. In considering the
status of rural Indiana at this time, all of the determinants are operating against Indiana’s rural
citizens.
Rural Hoosiers are at a greater disadvantage due to higher prevalence of each of these chronic
issues, plus greater unemployment, further distances to treatment, lower income, lower levels of
education, aging patterns, lower levels of insurance coverage and a shortage of health care
workers. In 2010, the University of Wisconsin Population Health Institute published County
Health Rankings 2010. Multiple factors were considered in developing the rankings. The
following graphic depicts the elements that interact with health factors and their distribution
across the community. This interplay of factors and community programs and policies produce
health outcomes.

11
Figure 3. Components of Health Outcomes.
Source University of Wisconsin, 2010.
The types of community programs and policies could be generated from the following
community stakeholders.
Figure 4. Community-based Programs and Policies Designed to Alter the Distribution of
Health Factors within the Community.
Source: Institute of Medicine, 2002
Within Indiana specifically, disparities exist between rural and urban environments because of
the interaction of these factors. The map below separates metropolitan and non-metropolitan
counties within the state.

12
Figure 5. Metro and Nonmetro Counties in Indiana
With the variable of rural and urban counties in mind, the state’s health disparities become
clearer when looking at rankings of health outcomes and health factors.
Figure 6. Maps of Indiana County Health Outcomes and Health Factors Rankings.
Health Outcomes Health Factors
Source: University of Wisconsin Population Health Institute. County Health Rankings 2010
An alternative method of examining the rankings is through the following list. Asterisks identify
rural counties.
Metro and Nonmetro Counties in Indiana
Metropolitan Counties
Nonmetropolitan Counties:
Micropolitan Counties
Noncore Counties
Source: U.S. Census Bureau andOffice of Management and BudgetMap prepared by RUPRI

13
Figure 7. Health Outcomes and Health Factor Rankings of Indiana Counties.
Health
Rank
Health
Outcomes
Rank
Health
Factors
Health
Rank
Health
Outcomes
Rank Health
Factors
1 Hamilton 1 Hamilton 47 Jasper 47 Huntington*
2 Hendricks 2 Hendricks 48 Daviess * 48 Newton
3 Dubois * 3 Warrick 49 Wabash* 49 Howard
4 Boone 4 Boone 50 Fountain * 50 St. Joseph
5 LaGrange * 5 Dubois * 51 Clinton * 51 Shelby
6 Warrick 6 Hancock 52 Montgomery* 52 Perry *
7 Whitley 7 Monroe 53 Randolph * 53 Randolph *
8 Marshall * 8 Wells 54 Jefferson * 54 Cass *
9 DeKalb * 9 Johnson 55 Blackford * 55 Henry *
10 Wells 10 Brown 56 Fulton * 56 Jackson *
11 Putnam 11 Whitley 57 Pulaski * 57 Union *
12 Tippecanoe 12 Spencer * 58 Owen 58 Blackford *
13 Brown 13 Porter 59 Clark 59 Fulton *
14 Tipton 14 Warren * 60 Washington 60 Knox *
15 Adams * 15 Jasper 61 La Porte 61 Fountain *
16 Porter 16 Gibson 62 Union * 62 Steuben *
17 Monroe 17 Dearborn 63 Vermillion 63 Clark
18 Elkhart 18 Tippecanoe 64 Henry * 64 Jay *
19 Gibson 19 Tipton 65 Orange * 65 Miami *
20 Warren * 20 Bartholomew 66 Lawrence * 66 Parke *
21 Johnson 21 Posey 67 Jackson * 67 Rush *
22 Hancock 22 DeKalb * 68 Clay 68 Switzerland*
23 Kosciusko * 23 Franklin 69 Vigo 69 Greene
24 Carroll 24 Ohio 70 Shelby 70 Orange *
25 Dearborn 25 Marshall * 71 Vanderburgh 71 Delaware
26 Ripley * 26 Harrison 72 Newton 72 Sullivan
27 Franklin 27 Carroll 73 Parke * 73 Noble *
28 Posey 28 Clinton * 74 Wayne * 74 Lawrence *
29 Huntington * 29 Putnam 75 Jay * 75 Elkhart
30 White * 30 Vanderburgh 76 Knox * 76 Jefferson *
31 Decatur * 31 Wabash * 77 Grant * 77 La Porte
32 Steuben * 32 Morgan 78 Greene 78 Vigo
33 Allen 33 Benton 79 Madison 79 Scott *
34 Bartholomew 34 Adams * 80 Marion 80 Wayne *
35 Benton 35 Daviess * 81 Delaware 81 Clay
36 Ohio 36 Ripley * 82 Jennings * 82 Owen
37 Noble * 37 Floyd 83 Crawford * 83 Washington
38 Cass * 38 Kosciusko * 84 Lake 84 Grant *
39 Harrison 39 Allen 85 Fayette * 85 Vermillion
40 Morgan 40 White * 86 Perry * 86 Crawford *
41 Miami * 41 Pike * 87 Sullivan 87 Marion
42 St. Joseph 42 Pulaski * 88 Pike * 88 Jennings *
43 Floyd 43 Martin * 89 Martin * 89 Madison

14
44 Spencer * 44 Decatur * 90 Switzerland* 90 Fayette *
45 Rush * 45 Montgomery* 91 Starke * 91 Starke *
46 Howard 46 LaGrange * 92 Scott * 92 Lake
Source: University of Wisconsin Population Health Institute. County Health Rankings 2010
The following chart shows the rural county rankings as they appear in quartiles, demonstrating
the distribution of rural counties as they relate to health factors and health outcomes.
Figure 8. Quartile Distribution of Rural Counties: Health Outcomes and Health Factors.
Quartile 1
Rankings 1 - 23
Quartile 2
Rankings 24-46
Quartile 3
Rankings 47- 69
Quartile 4
Rankings 70-92
Health Outcomes 7 10 15 14
Health Factors 4 14 17 11
A recent Robert Wood Johnson report (March, 2010) identified Indiana as ranking 47th
in State
Public Health Budgets; 50th
in HRSA dollars received in FY 2009; and 48th
in CDC dollars
allocated in FY 2009. Indiana struggles to meet the health needs of its citizens under these
constraints. Adding to low levels of economic support is job loss within the state. Indiana has
lost 209,800 manufacturing jobs since 2000. Over the same span, the actual number of net jobs
lost/ gained in all categories in the state totaled 136,500. This means the state has been losing
factory work faster than enterprises can add jobs in the service economy (www.indy.com, April
2009). Elkhart County, Indiana, has become a symbol for job loss in the current US recession,
with unemployment in that county exceeding 18%.
The current economic picture nationally and within the state have created a shift in payor mix for
Indiana’s CAHs complicated by a recent 5% reduction in Medicaid reimbursement to hospitals
for outpatient and inpatient hospital services. These conditions add pressure to hospital
operations that must rely on sound fiscal leadership and economies of operations to maintain
access to hospital care for Indiana’s rural populations.
Background and Purpose
The purpose of the Indiana Rural Health Plan is to provide a map for improving the health of
Hoosiers through a more accessible, efficient, and accountable system of service delivery and
Flex funds spending. The plan is divided into six sections. Section One identifies some of the
major health and economic concerns of Indiana’s rural population. Section Two describes
Indiana’s Critical Access Hospitals, their impact and necessary support systems. Section Three
discusses the need for health workforce development and retention in Indiana’s rural areas.
Section Four explains the Flex proposal development process, reviews recent CAH statistics,
and summarizes the findings of the planning process leading to the focus of the Indiana State
Rural Health Plan. Section Five addresses the major themes and the associated activities that
will support the evolution and sustainability of high quality, affordable rural health care in
Indiana through the efforts of the State Office of Rural Health and its partners. Section Six
provides a brief summary and direction for the future.

15
Process for Developing the Plan
The development of the Flex-related sections of the Indiana State Rural Health plan evolved
through two primary approaches. The key stakeholders involved in the plan included the CEOs
of Indiana’s Critical Access Hospitals and the members of the Indiana Rural Roundtable, a group
of diverse rural medical stakeholders convened as follow-up to the Rural Health Plan of 2009.
Affiliated Service Providers of Indiana, Inc. served as the facilitative body for the plan, under the
direction of Ann Alley, Director, Primary Care Office, Public Health and Preparedness
Commission, Indiana State Department of Health.
The CEOs of Indiana’s thirty-five critical access hospitals were invited to submit responses to an
electronic survey that captured current-state health care issues within the context of a depressed
economy and increasingly vulnerable consumers of medical care, along with their assessment of
the largest issues facing the critical access hospitals, with potential solutions. The survey
instrument is included in Appendix A. Outcome data is presented and discussed in Section Four
of this plan. The survey was fundamentally a repeat of the survey conducted in 2010, with the
additional goal of being able to track changes within the one-year time span.
The Rural Roundtable meets quarterly. The group members with their respective organizations
are found in the chart below. Additional members are expected to be recruited as the group
continues to respond to rural health issues.
Indiana Rural Round Table Members 2011
Ann Alley Director, Primary Care Office, Public Health Preparedness Commission,
Indiana State Department of Health
Don Kelso Indiana Rural Health Association
Cindy Large IRHA, Flex Coordinator for Indiana
Kathy Cook Affiliated Service Providers of Indiana, Inc.
Jerry King Indiana Public Health Association
Phil Morphew Indiana Primary Health Care Association
Rick Kiovsky Indiana AHEC
Becky Royer Health Care Excel
Spencer Grover Indiana Hospital Association
Gina DelSanto Indiana Workforce Development
Brittany Knick State Office of Rural Health
Anna Barrett Traumatic Brain Injury Association of Indiana
Carole Kacius Indiana University School of Medicine Dept. of Public Health
Figure 9 below demonstrates the supportive relationship of these stakeholders to the success of
the Critical Access Hospitals

16
Figure 9. Indiana State Rural Health Plan Stakeholder Field.
This document summarizes existing research, statistics, previous health planning work, and
knowledge gained through reports, plans, surveys, and interviews to create a comprehensive,
living document that will serve as a foundation for current and future planning. It is hoped that
its strategies and recommendations will lend information and support for the combined efforts of
policymakers, health care providers, educational institutions, the Office of Rural Health,
professional associations, and other stakeholders to improve the health of Indiana’s rural
population.
Vision
The primary goal of the Indiana Flex Plan is for Indiana to become a leader in supporting
rural health providers and in providing rural citizens with the quality and performance
improvement support needed by critical access hospitals.
CRITICAL ACCESS HOSPITALS
A
S
P
I
N
HEALTH
CONSUMERS
Indiana State Office of
Rural Health
FLEX FUNDING
HEALTH
CONSUMERS
I
P
H
A
A
H
E
C
I
P
H
C
A
I
H
A
I
R
H
A

17
A healthy rural Indiana will result from the provision of funding, performance improvement
support, and collaborative problem-solving for sustainable solutions to support Indiana’s Critical
Access Hospitals and their key stakeholders.
References
Centers for Disease Control and Prevention and The Merck Company Foundation. (2007).The
State of Aging and Health in America 2007. Whitehouse Station, NJ: The Merck
Company Foundation
Kaiser Family Foundation (2010). Indiana Health Facts. Retrieved from
http://www.statehealthfacts.org.
McMillan, R. (2010). Mississippi tobacco Data: State Rankings 2010. Mississippi State
University Social Science Research Center, http://surveillance.mstobaccodata.org.
University of Wisconsin Population Health Institute. County Health Rankings 2010.

18
Section I. A Picture of Indiana’s Rural Population
Indiana’s Rural Demographics
Indiana is in the Great Lakes region of the United States, with shoreline on Lake Michigan. The
state is located in the Corn Belt, and most years has almost half of its cropland devoted to corn.
Residents of Indiana are known as Hoosiers, which is also the team name for Indiana University
athletic teams. Indiana covers 35,867 square miles, with a 2008 estimated population of
6,273,900 people with approximately 28% living in non-metropolitan areas.
Figure 10. Population Distribution by Metropolitan Status Indiana and US
Population Distribution by Metropolitan Status, Indiana (2008-2009), U.S. (2009)
IN 2008
#
IN 2009
#
IN
%
US
%
Metropolitan 4,499,200 546,600 72% 84%
Non-Metropolitan 1,774,700 1,774,500 28% 16%
Total 6,273,900 6,423,113 100% 100%
Notes: Non-Metropolitan includes both respondents living in non-metropolitan areas and areas not
classified in either category.
Percentages may not sum to 100% due to rounding effects.
For more details, see "Notes to Demographic and Health Coverage Topics Based on the CPS" at
http://www.statehealthfacts.kff.org/methodology.
Sources: Urban Institute and Kaiser Commission on Medicaid and the Uninsured estimates based on the
Census Bureau's March 2007, 2008, 2009. Current Population Survey (CPS: Annual Social and
Economic Supplements)
Definitions: Metropolitan Statistical Area must include at least one city with 50,000 or more inhabitants, or a
Census-Bureau defined urbanized area of at least 50,000 inhabitants and a total metropolitan
population of 100,000 or more (75,000 in New England). For more information, visit the Census
Bureau website at http://www.census.gov/population/www/estimates/aboutmetro.html
NSD: Not Sufficient Data
Indianapolis, the capital, is located in the central part of the state. The state’s largest cities are
Indianapolis, Fort Wayne, and Evansville. According to the U.S. Census Bureau, 87.8% of the
state’s population is white, 9.2% is African-American/Black, 1.5% is Asian, 0.3% is American
Indian, and 5.5% is of Hispanic/Latino origin2.
The average per-capita income for all Hoosiers in 2009 was $36,620. According to the USDA
Economic Research Service (2011) a poverty rate of 14.1% exists in rural Indiana, compared to a
14.5% level in urban areas of the State. These figures demonstrate an increase in poverty for both
classifications over 2008 levels which were 13% and 12.6% respectively.
The following map represents percent change in population across Indiana from census data in
2000 to that in 2010. Notable population losses fell within primarily rural areas, with highest
growth centered in counties surrounding the capital of Indianapolis.

19
Figure 11. Percent Change in Population, 2000-10.
Source: U.S. Census Bureau, Census 2000 and 2010 Census Redistricting Data Summary File
20
Current Economic Picture
―The patterns of demographic change in rural America are often complex and subtle, but their
impact is not. We see it in persistent poverty and diminished community capacity in declining
rural communities, and in strained infrastructure, pressed institutions, and rising housing costs in
growing communities.‖ (Carsey Institute, 2006).
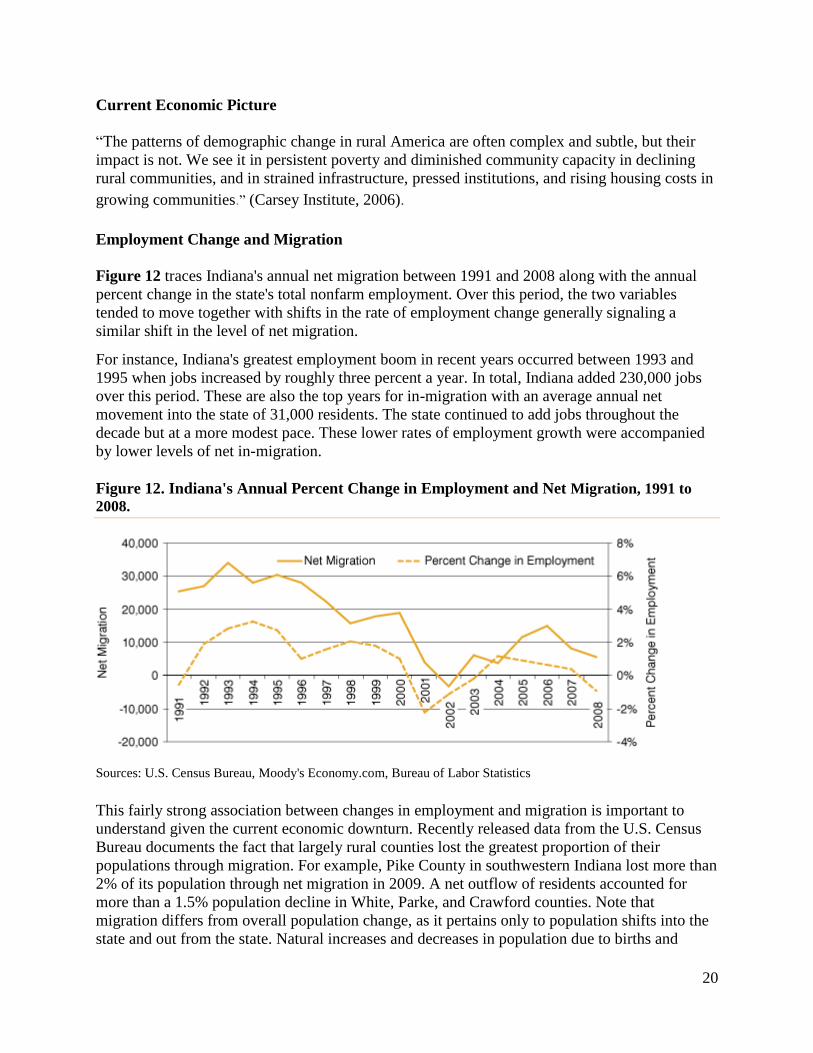
Employment Change and Migration
Figure 12 traces Indiana's annual net migration between 1991 and 2008 along with the annual
percent change in the state's total nonfarm employment. Over this period, the two variables
tended to move together with shifts in the rate of employment change generally signaling a
similar shift in the level of net migration.
For instance, Indiana's greatest employment boom in recent years occurred between 1993 and
1995 when jobs increased by roughly three percent a year. In total, Indiana added 230,000 jobs
over this period. These are also the top years for in-migration with an average annual net
movement into the state of 31,000 residents. The state continued to add jobs throughout the
decade but at a more modest pace. These lower rates of employment growth were accompanied
by lower levels of net in-migration.
Figure 12. Indiana's Annual Percent Change in Employment and Net Migration, 1991 to
2008.
Sources: U.S. Census Bureau, Moody's Economy.com, Bureau of Labor Statistics
This fairly strong association between changes in employment and migration is important to
understand given the current economic downturn. Recently released data from the U.S. Census
Bureau documents the fact that largely rural counties lost the greatest proportion of their
populations through migration. For example, Pike County in southwestern Indiana lost more than
2% of its population through net migration in 2009. A net outflow of residents accounted for
more than a 1.5% population decline in White, Parke, and Crawford counties. Note that
migration differs from overall population change, as it pertains only to population shifts into the
state and out from the state. Natural increases and decreases in population due to births and

21
deaths are also considered in population change. The following map (Figure 13) illustrates the
percent of population change in each county that was due to net migration.
Figure 13. Net Migration by County, 2009.
Source: Indiana Business Research Center, using U.S. Census Bureau data
Indiana, like much of the nation, has seen heavy job losses In fact, between May 2008 and May
2009, Indiana lost 156,000 jobs, which exceeds the state's greatest decline during the previous
recession (132,600 jobs lost between May 2000 and July 2003).According to the Kaiser
Foundation, employment in Indiana is rebounding However, this is not occurring evenly across
the state. (See Figure 14.)

22
Figure 14. Indiana Unemployment Rates by County, January 2011.

23
Indiana has not escaped the recent national economic downturns. The following table includes
the counties in which Critical Access Hospitals are located, comparing unemployment statistics
from June of 2008 through January 2011. These figures were prepared in cooperation with the
U.S. Bureau of Labor Statistics and have been adjusted to the current population survey for use
in allocating federal funds. Although gains in employment are apparent, these counties continue
to have unemployment rates higher than the state and national averages.
Figure 15. Unemployment Rate and Population Shifts in Indiana County Locations of
Critical Access Hospitals
County Location
of Critical
Access Hospital
Rate
June
2008
Rate
June
2009
Rate
June
2010
Rate
January
2011
Unemployment
Change in % from
June 2010 to
January 2011
Population Shift
in %
2000 – 2009
Adams 5.5 14.8 10.0 9.2 - 8% +1.9
Blackford 7.2 15.5 12.6 11.3 - 10.3% -7.1
Clay 7.3 13.1 10.6 11.7 +10.4% -0.1
Clinton 5.1 11.6 10.1 9.5 - 6% +1.5
Decatur 6.1 13.2 10.6 10.6 No Change +2.1
Fulton 5.9 12.7 10.6 10.6 No Change -1.2
Gibson 5.3 9.4 8.2 7.5 - 8.5% +0.8
Greene 6.3 8.7 9.3 9.4 +1.1% -2.1
Harrison 5.6 9.7 8.3 10.5 +26.5% +9.4
Jasper 5.3 9.5 10.3 10.9 +6% +9.2
Jay 5.5 12.1 9.2 8.7 -5.4% -3.2
Jennings 6.2 13.6 11.1 12.2 +9.9% +1.8
LaGrange 6.7 15.8 11.1 11.0 -1% +6.6
Lawrence 6.8 13.0 11.0 11.6 +5.5% -0.2
Madison 6.6 11.4 11.6 11.3 -2.6% -1.5
Marshall 6.3 13.5 10.6 11.1 +4.7% +3.9
Miami 7.4 16.5 11.4 11.6 +1.8% -.02
Orange 5.6 10.5 10.6 10.4 -1.9% +1.3
Perry 5.1 10.1 9.5 9.6 +1% -0.5
Pulaski 5.3 11.1 8.8 8.6 -2.3% -1.0
Putnam 7.2 11.4 11.2 12.7 +13.4% +2.3
Randolph 6.9 12.3 11.1 11.4 +2.7% -6.2
Ripley 5.6 10.7 10.4 10.9 +9.6% +3.4
Rush 5.8 10.5 9.7 9.3 -4.1% -5.9
Scott 6.4 13.5 11.3 11.5 +1.8% +2.9
Steuben 6.4 14.9 11.5 11.1 -3.5% +1.1
Sullivan 7.3 9.9 10.6 10.0 -5.7% -2.7
Tipton 7.0 16.3 10.9 11.6 +6.4% -4.1
Vermillion 6.8 11.9 12.4 13.1 +6.5% -3.7
Wabash 7.3 13.8 10.7 9.8 -8.4% -6.9
Warren 3.8 11.8 9.2 7.6 -11% +0.9
Warrick 4.9 7.9 8.1 7.7 -4.9% +11.7
Washington 6.9 13.2 9.4 11.7 +24.5% +1.9

24
White 4.9 11.0 9.9 10.1 +2% -7.2
US Overall 5.7 9.7 9.5 9.0 -5.3%
Indiana Overall 5.7 10.6 10.1 9.5 -5.9% +2.5%
CAH Counties
Overall
6.1 12.2 10.4 10.5 +1% +.27%
Source: Indiana Department of Workforce Development
*Source: U.S. Census Bureau, 2000 Censuses of Population (corrected), and 2009 county estimate files. January
2011 Unemployment Rates from Indiana business Research Center, Indiana Department of Workforce
Development. Retrieved from http://www.ers.usda.gov/Data/Population/PopList.asp?ST=IN&LongName=Indiana
The counties served by a Critical Access Hospital have unemployment rates higher than the rest
of the state and are less likely to increase in population.
Other Measures of Economic Distress
In March 2010, the Indiana Institute for Working Families completed The Status of Working
Families in Indiana, 2009 which was a comprehensive report on the economic challenges facing
low-income, working families in Indiana. The Status of Working Families in Indiana: 2010
Update is the 8th annual publication of the annual Status report and uses the best available data
from the 2009 U.S. Census Bureau to update the data contained in the Institute’s 2009 Status
report. This 2010 report analyzes Indiana’s economic conditions and its effects on Hoosier
workers and their families. To reference the 2009 report, visit: www.incap.org/iiwfRandP.html.
Hoosier workers and their families are toiling to stay afloat while the effects of the national
recession linger on. Among the report’s most significant findings, data from the 2009 U.S.
Census Bureau’s Current Population Survey shows:
One in three Hoosiers are now low-income—that is they earn less than 200 percent of the
Federal Poverty Guidelines (FPG) ($36,620 for a family of three in 2009). These
individuals, despite their best efforts, are struggling to meet their most basic needs.
Hoosier incomes have declined over the decade. In 1999, the median household income
in Indiana was $50,896. By 2009 the median household income had fallen 15 percent to
$44,305.
Hoosier workers continue to earn a median wage lower than the average American and
have throughout the past decade. Workers in Indiana earned 96 cents for every dollar
earned by the average worker.
Unemployment and underemployment have increased and have disproportionately
affected Indiana’s African-American and Hispanic workers. African-Americans have an
unemployment rate of 18.7 percent and underemployment rate of 25.5 percent. While
Hispanics have an unemployment rate of 17.3 percent and underemployment rate of 35.5
percent.
National long-term unemployment—lasting longer than 26 weeks—is at its highest level
since 1948. Long-term unemployment continues to plague Hoosier workers as Indiana’s

25
economy remains weak—58 percent of unemployed Hoosier workers have exhausted
their 26 weeks of benefits in 2009.
With each additional level of educational attainment, Hoosier workers are less likely to
be unemployed, underemployed, and working part-time for economic reasons. Workers
with a Bachelor’s degree or higher are weathering this recession better than workers with
lower levels of educational attainment.
Poverty is more prevalent in Indiana than in the U.S., as 1 in every 6 Hoosiers lives
below the Federal Poverty Guideline - $22,050 for a family of four in 2009.
It is estimated that 16.2% of Indiana families are food insecure. Food insecurity is defined as the
ISDA’s measure of lack of access, at times, to enough food for an active, healthy life for all
household members; limited or uncertain availability of nutritionally adequate foods. Based on
national averages, about 29% of food insecure individuals are above 185% of the poverty line
and are typically ineligible for most food assistance programs (Nord, Coleman-Jensen, Andrews,
& Carlson, 2010). Indiana counties in which Critical Access Hospitals are located reflect an
overall 16.7% food insecurity rating, higher than the state average. This can have significant
impact on health. Another measure of economic distress is the number of children receiving free
and reduced lunches in the state. The data in Figure 11 are overall figures for Indiana in 2009. It
appears that the number of children in poverty is increasing over time.
Figure 16. Indiana Welfare Statistics in 2009.
Welfare Statistics in 2009
Number 10 Year Change 10 Year Percent Change
TANF Families 34,097 1,360 4.2%
Food Stamp Recipients 311,036 11,157 3.7%
Total Lunch Recipients 436,945 160,547 58.1%
Free Lunch 346,885 128,304 58.7%
Reduced Fee Lunch 90,060 32,243 55.8%
Source: Indiana Family and Social Services
Age
Population projections released by the Indiana Business Research Center (IBRC) at Indiana
University’s Kelley School of Business (2011) portray big changes on the horizon in the size,
geographic distribution, and age composition of Indiana’s population.
Labor Force
A potential labor shortage may hinder economic development efforts across much of Indiana
over the next twenty years, according to new projections issued by the IBRC. Population in the
prime working ages of twenty-five to fifty-four can be expected to shrink in seventy-three of

26
Indiana’s ninety-two counties between 2000 and 2020. This twenty-five to fifty-four age range
could be considered the most economically productive in the entire life span, since labor force
participation is typically highest at these ages. A large share of the population under age twenty-
five is still focusing on education, while at age fifty-five and older, the impacts of early
retirement and disability result in lower labor force participation rates.
The relatively few counties that can be expected to gain population in the twenty-five to fifty-
four age group are concentrated mainly in the center of the state, near Indianapolis. The ten-
county Indianapolis Metropolitan Statistical Area (metro) is expected to gain approximately
86,000 people in the twenty-five to fifty-four age group in the twenty years after 2000, while the
rest of the state will lose 140,000. Even within the metro area, change in this age group will be
geographically uneven, with strong growth in Hamilton, Hendricks, and Johnson counties
overcoming a large loss in Marion County. In addition to Marion, six other counties primarily
located in the northwestern corner of the state are expected to lose more than 5,000 people in the
prime working ages over the twenty-year period.
Losses in the twenty-five to fifty-four age group would likely reduce the labor force in the
impacted areas, unless labor force participation rises substantially among the older population, or
those under twenty-five. Keeping older workers active in the labor force could have multiple
benefits for Indiana and the nation, but increased participation at younger ages would probably
have a negative effect on educational attainment.
While job opportunities in the Indianapolis metro may exercise a pull on people in the prime
working ages, most counties across the state would inevitably experience a decline in this age
group even if all county borders were closed and no migration were permitted. The large baby
boom generation outnumbers subsequent generations in most counties, and this uneven age
structure is responsible for much of the decline in the prime working ages through 2020.
Elderly
The entry of Baby Boomers into the traditional retirement age of sixty-five will also transform
the state. Figure 17 depicts the changing population shares in two age groups at opposite ends of
the age spectrum: under fifteen and sixty-five or older. By 2035, Indiana is expected to have
more residents age sixty-five or older than those under fifteen. At the beginning of the projection
period, about one in eight Hoosiers had reached their sixty-fifth birthday. This proportion was
expected to remain stable through 2010, but it will climb steadily after that point, reaching 21
percent in 2040. The population share under fifteen, by contrast, remains relatively stable
throughout the entire projection period.

27
Figure 17. Population Share, 2000 to 2040.
Figure 18 compares the projected median ages of populations within Indiana counties containing
critical access hospitals with state and national figures. Figure 18 graphically demonstrates that
counties covered by Indiana’s critical access hospitals are home to older and faster aging
populations.
Figure 18. Comparison of Projected Median Age of Populations in CAH Counties.
County Location of Critical
Access Hospital
Median Age
2010
Median Age
2020
Median Age
2030
Adams 33.5 33.3 33.0
Blackford 41.5 43.3 43.7
Clay 38.1 39.7 41.1
Clinton 36.5 37.4 37.9
Decatur 38.1 40.2 40.0
Fulton 40.5 42.2 42.7
Gibson 39.1 39.8 41.4
Greene 40.5 42.1 43.0
Harrison 39.4 42.1 44.4
Jasper 36.7 38.5 39.5
Jay 38.7 40.1 38.7
Jennings 36.7 38.7 39.7
LaGrange 30.8 32.1 32.5
Lawrence 41.4 43.6 44.2
Madison 39.9 41.2 41.9
Marshall 36.3 38.4 38.7
Miami 39.8 41.8 41.9
Orange 39.2 41.2 41.7
Perry39.6 39.6 41.6 44.7
Pulaski 40.6 43.4 46.0
Putnam 36.7 38.6 39.8

28
Randolph 41.1 42.5 42.7
Ripley 37.8 39.4 39.8
Rush 40.8 42.8 41.2
Scott 37.6 40.9 42.7
Steuben 37.6 38.7 39.9
Sullivan 38.3 40.6 42.2
Tipton 41.8 44.4 45.0
Vermillion 41.3 43.1 44.4
Wabash 39.5 38.7 39.3
Warren 41.1 43.5 45.3
Warrick 39.5 40.9 42.7
Washington 38.2 40.8 42.4
White 40.2 41.2 40.8
US Overall 36.9 37.7 38.7
Indiana Overall 36.4 37.7 38.9
Critical Access Hospital
Counties Overall 38.8 40.5 41.3
Source: Indiana Business Research Center, IU Kelley School of Business
Figure 19. Graph Comparing CAH Counties, Indiana, and US Projected Median Ages.
Median Age Projections
38.8
40.5
41.3
36.4
37.7
38.9
36.9
37.7
38.7
33
34
35
36
37
38
39
40
41
42
2010 2020 2030
Year
Ag
e
CAH Counties
Indiana
US
In general, Indiana is close to trend with United States median age statistics. The rural counties
served by critical access hospitals include a population that is older and will be aging faster than
the average, increasing the likelihood of medical care needs.
Persons with Disabilities
The presence of citizens with disabilities poses added considerations in terms of adaptive
communities, specialized education and specialists in health care. Persons with disabilities may

29
require more support for activities of daily living and find employment to be a great challenge in
rural communities.
Indiana is home to a greater percentage of persons with disabilities than is true of the United
States as a whole, 12.7% vs. 12.1% respectively. The following statistics indicate the social and
economic status of non-institutionalized people with disabilities in the United States, using data
from the 2008 American Community Survey (ACS), and summarized within the 2008 Disability
Status Report: Indiana published by the Cornell University Rehabilitation Research and
Training Center on Disability Demographics and Statistics.
Age: In 2008, the prevalence of disability in Indiana was:
12.7 percent for persons of all ages
0.8 percent for persons ages 4 and under
5.7 percent for persons ages 5 to 15
6.5 percent for persons ages 16 to 20
11.6 percent for persons ages 21 to 64
27.3 percent for persons ages 65 to 74
49.7 percent for persons ages 75+
Gender: In 2008, 13.0 percent of females of all ages and 12.4 percent of males of all ages in
Indiana reported a disability.
Hispanic/Latino: In 2008, the prevalence of disability among persons of all ages of Hispanic or
Latino origin in Indiana was 6.7%.
Race: In 2008, the prevalence of disability for working-age people (ages 21 to 64) was: 11.3 %
among Whites 14.5 % among Black / African Americans 4.8 % among Asians, 28.3 % among
Native Americans, and 13.8% among persons of other race(s).
Employment: In 2008, the employment rate of working-age people (ages 21 to 64) with
disabilities in Indiana was 39.8%, with 25.2% working full-time/full-year, and 10.3 % of
unemployed people with disabilities actively looking for work.
Annual Earnings: In 2008, the median annual earnings of Indiana’s working-age people with
disabilities working full-time/full-year were $33,600.
Annual Household Income: In 2008, the median annual income of Indiana households with
working-age people with disabilities was $36,700.
Poverty: In 2008, the poverty rate of working-age people with disabilities in Indiana was 25.5
percent.
Supplemental Security Income: In 2008, 15.5 % of working-age people with disabilities were
receiving SSI payments in Indiana.

30
Educational Attainment: In 2008, the percentage of Indiana’s working-age people with
disabilities with only a high school diploma or equivalent was 37.4%; with only some college or
an associate degree was 28.3 %; with a bachelor's degree or more was 9.9%. This leaves
approximately one-fourth of the population without a high school education.
Veterans Service-Connected Disability: In 2008, the percentage of working-age civilian
veterans with a VA-determined Service-Connected Disability in Indiana was 15.9%.
Health Insurance Coverage: In 2008, 80.5 %of working-age people with disabilities in Indiana
had health insurance.
Major Causes of Death
Based upon Indiana’s Mortality Report of Leading Causes of Death the following illnesses are
contributing heavily to loss of life in Indiana.
Figure 20. Leading Causes of Death: Indiana Residents, 2006 and 2007.
Cause of Death Male
2006
Male
2007
Female
2006
Female
2007
Total
2006
Total
2007
Heart disease 7,105 6,835 7,191 6,880 14,296 13,715
Acute Myocardial
Infarction 4,929 1,850 4,230 1,424 9,159 3,274
Stroke 1,263 1,148 1,961 1,853 3,224 3,001
Chronic Lower
Respiratory Disease 1,585 1,584 1,695 1,640 3,280 3,224
Cancer 6,705 6,707 6,167 6,043 12,872 12,750
Diabetes 804 727 875 837 1,679 1,564 Source: Indiana State Department of Health www.in.gov/isdh
These deaths are disproportionately represented in rural areas. The Age-Adjusted Death Rate for
all Hoosiers in 2006 was 845.12 per 100,000. The average Age-Adjusted Death Rates for
Hoosiers living in the thirty-four rural counties in which a Critical Access Hospital is located
was 859.35 per 100,000. Regarding 2007 statistics, heart disease accounted for 25.5% of all
deaths; and cancer accounted for 23% of all deaths. Chronic lower respiratory disease was the
third leading cause of death for total and white residents; stroke was the third leading cause of
death for black residents. Diabetes was the fourth leading cause of death for black residents.
These deaths could be related to the poor scorecard that Indiana has with regard to prevention of
chronic disease. See Figure 21 below.
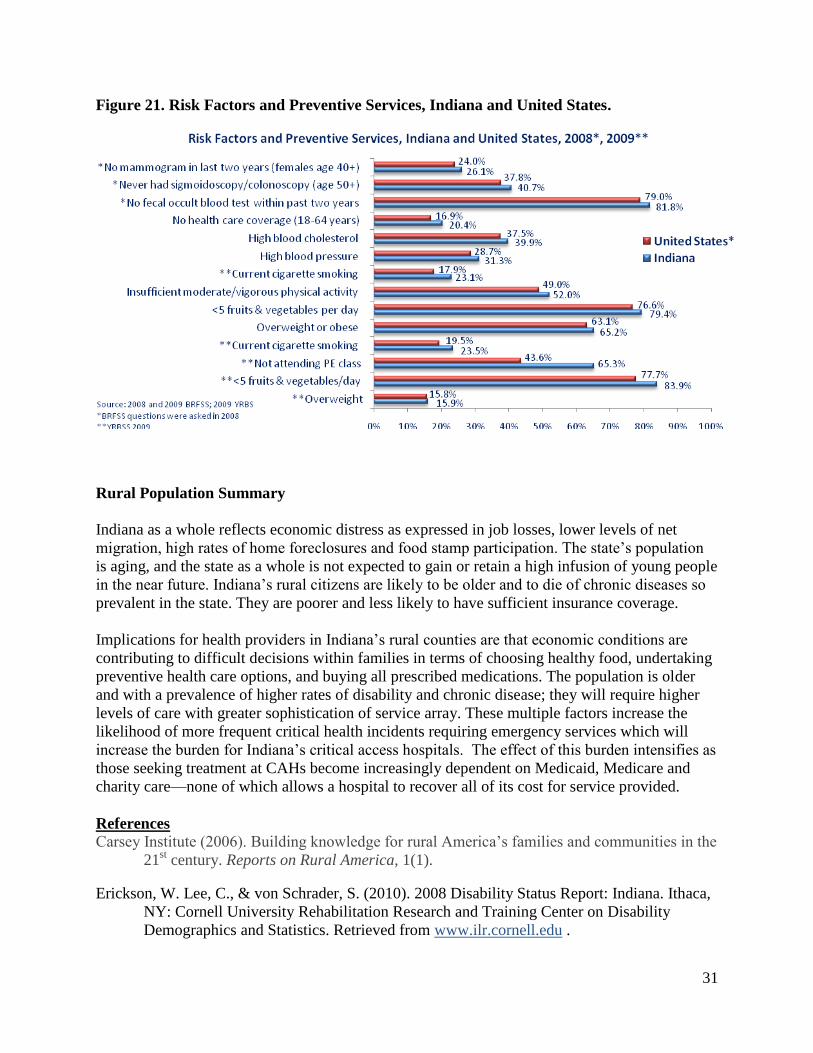
31
Figure 21. Risk Factors and Preventive Services, Indiana and United States.
Rural Population Summary
Indiana as a whole reflects economic distress as expressed in job losses, lower levels of net
migration, high rates of home foreclosures and food stamp participation. The state’s population
is aging, and the state as a whole is not expected to gain or retain a high infusion of young people
in the near future. Indiana’s rural citizens are likely to be older and to die of chronic diseases so
prevalent in the state. They are poorer and less likely to have sufficient insurance coverage.
Implications for health providers in Indiana’s rural counties are that economic conditions are
contributing to difficult decisions within families in terms of choosing healthy food, undertaking
preventive health care options, and buying all prescribed medications. The population is older
and with a prevalence of higher rates of disability and chronic disease; they will require higher
levels of care with greater sophistication of service array. These multiple factors increase the
likelihood of more frequent critical health incidents requiring emergency services which will
increase the burden for Indiana’s critical access hospitals. The effect of this burden intensifies as
those seeking treatment at CAHs become increasingly dependent on Medicaid, Medicare and
charity care—none of which allows a hospital to recover all of its cost for service provided.
References
Carsey Institute (2006). Building knowledge for rural America’s families and communities in the
21st century. Reports on Rural America, 1(1).
Erickson, W. Lee, C., & von Schrader, S. (2010). 2008 Disability Status Report: Indiana. Ithaca,
NY: Cornell University Rehabilitation Research and Training Center on Disability
Demographics and Statistics. Retrieved from www.ilr.cornell.edu .

32
Kinghorn, M. (2009). Population and employment changes in Indiana. InContext, Indiana
Business Research Center.
Nord, M., Coleman-Jensen, A., Andrews, M. & Carlson, S. (2010). USDA ERS. Household
Food Security in the United States, 2009. Economic Research Report No. (ERR-108) 68
pp, November 2010, http://www.ers.usda.gov/publications/err108/.
United States Census Bureau. 2008 Population Estimates. Information retrieved from
http://factfinder.census.gov/
United States Department of Agriculture Economic Research Service (2009). Information
retrieved from www.ers.usda.gov/StateFacts/
United States Department of Agriculture Economic Research Service (2009). Information
retrieved from www.ers.usda.gov/StateFacts/
United States Department of Agriculture Economic Research Service (2009). Information
retrieved from www.ers.usda.gov/StateFacts/

33
Section II. Providers of Care: Critical Access Hospitals, FQHCs, CHCs
The Medicare Rural Hospital Flexibility Program
The Medicare Rural Hospital Flexibility Program (Flex Program), created by Congress in1997,
allows small hospitals to be licensed as Critical Access Hospitals (CAHs) and offers grants to
States to help implement initiatives to strengthen the rural health care infrastructure. To
participate in the Flex Program, States are required to develop a rural health care plan that
provides for the creation of one or more rural health networks, promotes regionalization of rural
health services in the State, and improves the quality of and access to hospital and other health
services for rural residents of the State. Consistent with their rural health care plans, states may
designate eligible rural hospitals as CAHs.
CAHs must be located in a rural area or an area treated as rural; be more than 35 miles (or 15
miles in areas with mountainous terrain or only secondary roads available) from another hospital,
or be certified before January 1, 2006 by the State as being a necessary provider of health care
services. CAHs are required to make available 24-hour emergency care services that a State
determines are necessary. CAHs may have a maximum of 25 acute care and swing beds, and
must maintain an annual average length of stay of 96 hours or less for their acute care patients.
CAHs are reimbursed by Medicare on a cost basis (i.e., for the reasonable costs of providing
inpatient, outpatient, and swing bed services).
The legislative authority for the Flex Program and cost-based reimbursement for CAHs are
described in the Social Security Act, Title XVIII, Sections 1814 and 1820, available
at http://www.ssa.gov/OP_Home/ssact/title18/1800.htm.
Indiana’s Critical Access Hospitals
Currently, 35 Critical Access Hospitals are certified in Indiana. Based upon data supplied by the
Flex Monitoring Team in their publication Community Benefit Activities of Critical Access
Hospitals, Non-Metropolitan Hospitals, and Metropolitan Hospitals: National and Indiana Data
(Race, Gale, & Coburn, 2010), Indiana Critical Access Hospitals outperform both non-
metropolitan and metropolitan hospitals in twelve measures:
1. Has a long-term plan for improving the health of the community
2. Provides adult day care
3. Provides home health services
4. Has a mission statement that includes a focus on community benefit
5. Provides support for community building activities
6. Makes financial contributions, provides in-kind support, or participates in fund-raising
for community programs not directly affiliated with the hospital
7. Uses health status assessments to identify unmet needs, excess capacity, or
duplicative services in the community
8. Works with other providers to collect, track, and communicate clinical and health
information across cooperating organizations
9. Community outreach

34
10. Health fairs
11. Health screenings
12. Immunization programs
It is obvious that Indiana’s Critical Access hospitals are sensitive to the needs of the community
and see themselves as members of the communities that they serve. There are no non-certified
CAHs that receive funding under the Small Rural Hospital Improvement Grant Program.
Currently, 33 of the 35 CAHs within Indiana receive funding through the Small Rural Hospital
Improvement Grant Program. The office has been reaching out to the non-participating CAHs
and is hopeful 34 hospitals will participate in the upcoming year. The sustained interest in the
Small Rural Hospital Improvement Grant program indicates the strength of relationships
between SORH and the CAHs. The following chart lists Indiana’s Critical Access Hospitals,
their locations, and number of beds.
Figure 22. List of Critical Access Hospitals, Locations, and Number of Beds (2011)
Name City State Zip Beds
Adams Memorial Hospital Decatur Indiana 46733 25
Bremen Community Hospital of Bremen Indiana 46506 24
Cameron Memorial Community
Hospital
Angola Indiana 46703 25
Decatur County Memorial Hospital Greensburg Indiana 47240 25
Dukes Memorial Hospital Peru Indiana 46970-
1698 25
Gibson General Hospital Princeton Indiana 47670-
1043 25
Greene County General Hospital Linton Indiana 47441-
9457 25
Harrison County Hospital Corydon Indiana 47112 25
Indiana University Health Bedford
Hospital
Bedford Indiana 47421 25
Indiana University Health Blackford
Hospital
Hartford City Indiana 47348 15
Indiana University Health Paoli
Hospital
Paoli Indiana 47454-
0499 25
Indiana University Health Tipton
Hospital
Tipton Indiana 46072 25
Jasper County Hospital Rensselaer Indiana 47978 25
Jay County Hospital Portland Indiana 47371-
1322 25
LaGrange Hospital (Parkview) LaGrange Indiana 46761 25
Margaret Mary Community Hospital Batesville Indiana 47006 25
Perry County Memorial Hospital Tell City Indiana 47586 25
Pulaski Memorial Hospital Winamac Indiana 46996 25
Putnam County Hospital Greencastle Indiana 46135 25
Rush Memorial Hospital Rushville Indiana 46173 25
Scott Memorial Hospital Scottsburg Indiana 47170 25
St. Mary's Warrick Hospital Boonville Indiana 47601 25

35
St. Vincent Clay Hospital Brazil Indiana 47834-
2675 25
St. Vincent Dunn Memorial Hospital Bedford Indiana 47421 25
St. Vincent Frankfort Hospital Frankfort Indiana 46041 25
St. Vincent Jennings Community
Hospital, Inc.
North
Vernon
Indiana 47265 25
St. Vincent Mercy Hospital Elwood Indiana 46036 25
St. Vincent Randolph Hospital Winchester Indiana 47394 25
St. Vincent Salem Hospital Salem Indiana 47167 15
St. Vincent Williamsport Hospital Williamsport Indiana 47993-
0215 16
Sullivan County Community Hospital Sullivan Indiana 47882 25
Wabash County Hospital Wabash Indiana 46992 25
Union Hospital Clinton Clinton Indiana 47842-
0349 25
White County Memorial Hospital Monticello Indiana 47960 25
Woodlawn Hospital Rochester Indiana 46975 25
Figure 23. Critical Access Hospital Locations, Counties with No Hospitals
Source: Indiana Hospital
Association 2009

36
Performance Data
Comparative data on the financial condition and performance of hospitals is beneficial to the
hospitals and to the SORH office. The most current available financial comparison data is from
calendar year 2008. Below are the performance dimensions and indicators that reflect how
Indiana performed compared to the rest of the nation.
Profitability indicators measure the ability of the organization to generate the financial return
required to replace assets, and meet increases in services demands.
Total margin- the control of expenses relative to revenues
Cash flow margin- the ability to generate cash flow from providing patient care services
Return on equity- the net income generated by equity investment (net assets)
Figure 24. CAH Return on Equity
% total margin % cash flow margin % return on equity
US 3.64 5.98 9.96
IN 4.05 10.09 8.15 Source: Flex Monitoring Team. 2009
Liquidity indicators measure the ability of an organization to meet its cash obligations in a timely
manner.
Current ratio- the number of times short-term obligations can be paid using short-term assets
Days cash on hand- the number of days an organization could operate if no cash was
collected or received
Days revenue in accounts receivable- the number of days it takes an organization to collect
its receivables
Figure 25. Critical Access Hospital Liquidity Indicators
Current ratio Days cash on
hand
Days revenue in accounts
receivable (lower is better)
US 2.25 58.65 59.08
IN 2.42 48.63 61.04 Source: Flex Monitoring Team, 2009
Capital structure indicators measure the extent to which an organization uses debt and equity
financing.
Equity financing- the percentage of total assets financed by equity
Debt service coverage- the ability to pay obligation related to long-term debt, principal
payments, and interest expense
Long-term debt to capitalization- the percentage of total capital that is debt
Figure 26. Critical Access Hospital Capital Structure Indicators
Equity financing Debt service coverage Long-term debt to capitalization
US 61.44 3.25 26.23
IN 59.78 3.33 28.55 Source: Flex Monitoring Team, 2009

37
Revenue indicators measure the amount and mix of different sources of revenue
Outpatient revenues to total revenues- the percentage of total revenues that are for outpatient
revenues
Patient deductions- the allowances and discounts per dollar of total outpatient revenues
Medicare inpatient payer mix- the percentage of total inpatient days that are provided to
Medicare patients
Medicare outpatient payer mix- the percentage of total out-patient charges that are for
Medicare patients
Medicare outpatient cost to charge- outpatient Medicare costs per dollar of outpatient
Medicare charges
Medicare revenue per day- the amount of Medicare revenue earned per Medicare day
Figure 27. Critical Access Hospital Revenue Indicators
Outpatient
revenues
to total
revenues
Patient
deductions
Medicare
inpatient
payer mix
Medicare
outpatient
payer mix
Medicare
outpatient cost
to charge
Medicare
revenue per
day
US 67.99 34.04 74.52 34.63 0.49 1545
IN 76.21 44.82 44.82 67.73 33.13 0.37 1603 Source: Flex Monitoring Team, 2009
Cost indicators measure the amount and mix of different types of costs
Salaries to total expenses- the percentage of total expenses that are labor costs
Average age of plant- the average age in years of the fixed assets of an organization
FTEs per adjusted occupied bed- the number of full-time employees per each occupied bed
Figure 28. Critical Access Hospital Cost Indicators
Salaries to total expenses Average age of plant FTEs per adjusted
occupied bed
US 44.35 10.33 5.62
IN 44.46 7.75 5.09 Source: Flex Monitoring Team, 2009
Utilization indicators measure the extent to which fixed assets are fully occupied
Average daily census swing-SNF beds- the average number of swing-SNF beds occupied per
day
Average daily census acute beds- the average number of acute care beds occupied per day
Figure 29. Critical Access Hospital Utilization Indicators
Swing-SNF beds Acute beds
US 1.64 4.43
IN 1.70 8.71 Source: Flex Monitoring Team, 2009
Indiana will use hospital specific data to target areas of concern and launch quality improvement
initiatives.

38
The SORH understands the importance of CAH financial feasibility, not only for the hospital,
but the community as well. SORH will work with CAH financial experts to provide training
opportunities for CAH CEOs and CFOs. Information concerning cost reporting, allocated costs,
variable costs, and CAH economics will be disseminated to the CAHs. Indiana also recognizes
the importance of CAHs participating in the CMS Hospital Compare program. The SORH has
taken steps to increase the number of CAHs reporting to Hospital Compare and increase the
number of core measures reported.
Indiana continues to encourage and support the Hospital Compare submission of data. In
Indiana, 29 of the 35 CAHs in 2009 reported data to Hospital Compare on at least one inpatient
process of care measure for 2009 discharges (Figure 30). The Indiana participation rate of 82.9%
was higher than the national rate of 71.9%. The Indiana rate remained unchanged from 2007 to
2009.
Figure 30. CAH Participation in Hospital Compare in Indiana and Nationally 2005-2009.
# % participating \
2005 2006 2007 2008 2009
Indiana 24 (66.7%) 25 (71.4%) 29 (82.9%) 29 (82.9%) 29 (82.9%)
National 678 (53.4%) 812 (63.1%) 892 (69.1%) 914 (70.3%) 943 (71.9%)
Source: Flex Monitoring Team, 2009
Figure 31. Hospital Compare Results for 2008 and 2009 Discharges for CAHs in Indiana
and Nationally.
Measure Indiana % of CAH
patients receiving
recommended
care (n=29 both years)
2008 2009
National Percent of
CAH patients
receiving
recommended care
(n=918) (n= 933)
2008 2009
AMI Aspirin at arrival 88.90% 93.2% 90.60% 92.1%
Aspirin at discharge 92.20% 96.6% 88.60% 90.2%
ACEI or ARB for LVSD 93.20% 95.1% 84.80% 87.4%
Smoking cessation advice 96.20% 93.8% 80.80% 89.7%
Beta blocker at discharge 94.40% 96.7% 88.50% 90.5%
Heart Failure Discharge instructions 76.20% 82.4% 71.30% 75.5%
Assessment of LVS 87.40% 89.0% 80.00% 82.7%
ACE inhibitor or ARB for
LVSD
86.90% 89.3% 83.80% 84.7%
Smoking cessation advice 88.20% 94.1% 83.30% 85.6%
Pneumonia Pneumococcal vaccination 86.10% 89.3% 82.70% 85.9%
Blood culture prior to first
antibiotic
89.10% 88.6% 90.70% 92.0%
Smoking cessation advice 88.90% 91.5% 83.00% 86.2%
Initial antibiotic(s) within 6
hours
95.00% 95.8% 94.40% 95.0%

39
Most appropriate initial
antibiotic(s)
87.10% 86.7% 86.90% 87.4%
Influenza vaccination 77.60% 86.9% 79.90% 83.1%
Surgical Care
Improvement
Preventative antibiotic(s) 1
hour before incision
90.10% 94.4% 88.40% 91.6%
Received appropriate
preventative antibiotic(s)
95.00% 96.5% 94.70% 96.0%
Preventative antibiotic(s)
stopped within 24 hours after
surgery
85.70% 87.7% 86.50% 91.2%
Doctors ordered blood clot
preventative treatments
86.90% 86.2% 87.70% 88.6%
Received blood clot
prevention treatment 24
hours pre/post surgery
84.70% 84.1% 86.00% 87.7%
Source: Flex Monitoring Team, 2009; 2011
The quality measures cited above indicate that on 17 of the 20 measures, Indiana’s CAHs
improved when comparing data from 2008 to 2009. Indiana performs better on 75% of the
measures when compared to national performance percentages.
Critical Access Hospitals Summary
Indiana’s Critical Access Hospitals provide a tremendous contribution toward the health and
well-being of the citizens of their respective counties and in some cases for those of neighboring
rural counties without hospitals of their own. Clearly, the ability of Indiana’s Critical Access
Hospitals to generate cash flow from providing patient care services is more constrained and has
in all likelihood deteriorated due to increased economic distress within the counties they serve.
Yet, the ability of these hospitals to efficiently collect receivables and to manage cash is
laudable. Lean staffing as measured by FTEs per adjusted occupied bed is demonstrated.
Indiana’s CAH administrators are dedicated to quality performance and improvement as
demonstrated by their participation in data collection efforts and ongoing training and technical
assistance efforts. A continuation of support for data coordination, financial expertise
development, information management for forecasting, and informed management decision-
making will continue to be necessary as these hospitals cope with the changing landscape of the
state economy, workforce, population trends, technology and aging physical plants.
Collaboration and networking will continue to be key to their viability.
Indiana’s Community Health Centers
Indiana has State-Funded Community Health Centers which receive operating monies from
tobacco settlement funds received by the state, and Federally Qualified Health Centers (FQHC).
The FQHCs are funded primarily through the Bureau of Primary Health Care (BPHC), part of
the US Department of Health and Human Services, and they may also receive state money from
the tobacco settlement. In total, there are 48 Community Health Centers in Indiana, 19 of which
are FQHCs.

40
The Centers are public or private not-for-profit organizations that provide some or all of the
following services depending on the need and support within the specific local Indiana
community:
Primary medical care Diagnostic laboratory and radiological services Preventive services including: prenatal and perinatal services, cancer and other disease
screenings, well child services, immunizations against vaccine-preventable diseases,
screenings for elevated blood lead levels, cholesterol testing, etc. Eye, ear and dental screening for children Voluntary family planning services Preventive dental services Emergency medical services Pharmaceutical services as appropriate to the particular Center Referrals to other providers of medical and health-related services including substance
abuse and mental health services Patient case management services, including referral, follow-up, and eligibility
assessment for and gaining access to Federal, State, and local support and financial
programs for various medical, social, and related services Enabling services including outreach, transportation, translation, etc. Education about health services availability and appropriate use.
Community Health Centers are characterized by five essential elements that differentiate them
from other providers: They must be located in or serve a documented high-need community. Designations,
each with its own specific criteria, include Medically Underserved Areas (MUAs),
Medically Underserved Populations (MUPs), and Health Professional Shortage Areas
(HPSAs). They must provide comprehensive primary care services, as well as supportive / enabling
services such as translation and transportation that promote access to care; Their services must be available to all residents of their service areas regardless of
income status, with fees formally adjusted for patients' ability to pay; They must be governed by a Community Board that includes a majority of members who
are Center patients ("consumers"); and, They must meet specific performance and accountability requirements for administrative,
clinical, and financial operations.
The following data summarizes the contributions of the FQHCs and State-funded community
health centers in meeting the health needs of Indiana. The most recent data available is from
2008.
Federally Qualified Health Centers and Community Health Centers
*Data provided by the Indiana Primary Health Care Association. Retrieved April 11, 2011 from
http://www.indianapca.org/aboutchcs/factsandfigures.html.

41
The Health Care Need in Indiana
(Estimated State Population, 2007-08: 6,376,792)
Estimated Persons < 133% Poverty: 1,428,000
Estimated Uninsured Persons: 734,600
Estimated Homeless Persons: 7,395
Availability of Services (2008)
(Based on responses from all Federally Qualified Health Centers and State-Funded Centers)
Total Number of Persons Served by All Responding Primary Health Care Sites: 399,560
Total Number of Persons Served by FQHCs: 216,079
Persons Enrolled in Medicaid (Dec. 2008): 766,500
Persons Enrolled in Medicaid Served by Responding Primary Health Care Sites: 142,210
Uninsured Persons Served by Responding Primary Health Care Sites: 132,052
Indiana's Federally Qualified Health Centers 2009 Summary
(19 FQHCs at time of data collection) Source: HRSA Unified Data Report Data as of 5/12/10
Funding Sources
Private Pay $10,315,202
Medicaid $58,100,206
Medicare $6,876,072
Self Pay $35,634,233
Other Public Payor $822,507
Grants under Sec. 329/330/340 of the Public Service Act $21,996398
State $19,601,075
City/County $2,066,773
Private Foundations $5,530,020
Donations/St, local indigent /Other $5,138,935
Other non-patient revenue $4,595,522
TOTAL FUNDS $170,676,943
Patient Income Levels
At/Below Poverty 107,018
101 – 150% Poverty 23,571
151 – 200% Poverty 6,833
200% + Poverty 7,022
Unknown 71,635

42
TOTAL 216,079
Insurance
Medicaid 87,335
Medicare 11,052
Uninsured 89,134
Other 28,137
Unknown 421
TOTAL 216,079
Race & Ethnicity
White, Non-Hispanic 111,222
Black, Non-Hispanic 48,951
Hispanic, All Races 39,237
American Indian 321
Asian/Pacific Islander 2,526
Unknown 13,822
TOTAL 216,079
Patient Age
0 – 14 Years 73,795
15 – 19 Years 17,506
20 – 44 Years 78,189
45 – 64 Years 38,118
65 And Over 8,471
Unknown 0
TOTAL 216,079
Indiana's State-Funded-Only Health Centers 2008 Summary*
*Three centers did not provide 2008 data; therefore, their 2007 data was included.
Funding Sources
Private Pay $1,826,010
Medicaid $4,152,364
Medicare $1,677,245
Private Insurance $2,591,641

43
Grants under Sec. 329/330/340 of the Public Service Act $0
State $5,220,535
City/County $992,027
Private Foundations $421,887
Donations/Other $1,359,939
Other Public $139,218
TOTAL FUNDS $18,380,866
Patient Income Levels*
At/Below Poverty 20,279
101 – 150% Poverty 11,577
151 – 200% Poverty 6,293
200% + Poverty 7,481
Unknown 105,677
TOTAL 151,307
* Please note: not all State-funded-only health
centers provided complete patient income
information.
Insurance
Medicaid 54,875
Medicare 27,334
Uninsured 42,918
Other 56,204
Unknown 2,150
TOTAL 183,481
Race & Ethnicity
White, Non-Hispanic 95,293
Black, Non-Hispanic 45,099
Hispanic, All Races 28,234
American Indian 104
Asian/Pacific Islander 891
Unknown 13,860

44
TOTAL 183,481
Patient Age
0 – 14 Years 59,370
15 – 19 Years 16,887
20 – 44 Years 46,999
45 – 64 Years 41,090
65 And Over 15,644
Unknown 3,491
TOTAL 183,481
It is clear that these health centers meet a huge need for primary and preventive care in the state.
Community Health Centers (CHCs) are a major component of America's health care safety net,
providing high quality primary health care to low-income citizens, the uninsured, and other
vulnerable populations. Indiana’s 48 Community Health Centers serve as "health care homes"
for residents in more than 50 of the 92 counties in Indiana.

45
Section III. The Need for Health Professionals
Note: The following workforce information is an excerpt from an Issue Brief: Indiana’s Health Professions
Workforce Shortages & Maldistribution (2007), by the Workforce & Workforce Development Subcommittee of
the Indiana University Health Care Reform Study Group.
―The impending health care and human services workforce shortage is a national concern that is
growing more urgent every day. The U.S. Department of Labor’s Bureau of Labor Statistics
(BLS) predicts that health care and social assistance will be the fastest growing industry.1
Between 2006 and 2016, a high percentage of growth is projected for a broad range of health and
human services occupations in non-metropolitan counties: the need for personal and home care
aides will increase by 50.6 percent; medical assistants will increase by 35.4 percent; and
pharmacy technicians will increase by 32.0 percent.2
The Committee has noted over the years
that the presence of a skilled workforce is the foundation for further development of a quality
health and human services delivery system. Rural areas, in particular, are in need of more
qualified workers across the full range of health and human services professions to provide
adequate services for their citizens. Meeting service needs will also help economic development,
by keeping stable jobs in rural communities.
As people born in the baby boomer generation retire and leave the workforce, the available pool
of health and human services workers will shrink, since fewer people were born during the
successive years.3
The lack of an adequate workforce is magnified in rural areas because the
elderly population is growing more rapidly in rural than in urban areas.4
With an influx of baby
boomers retiring to rural areas, rural America is experiencing a disproportionately large and
growing elderly population—a population that often needs more health care and human services,
which places a greater demand on the workforce. Compounding this problem is an out-migration
of talented youth from some rural areas in search of broader educational and job opportunities.5
In the face of expected workforce shortages, maintaining a qualified workforce that can
adequately meet the needs of the community poses some challenges for many rural areas.6
Shortages in Indiana
Many communities across the state experience a shortage of health professionals in most
disciplines from medical assistants to medical doctors. Many of the communities with the most
serious shortages also experience the most poverty and the poorest health status. These
communities increase the health care cost in our state because the individuals in those
communities tend to wait to access healthcare until it is urgent and tend to access healthcare in
the most expensive and least effective way -- through hospital emergency rooms. The costs
incurred in this fashion are often covered by Medicaid, resulting in an increased tax burden, or
remain uncompensated to the hospitals, resulting in unavoidable shifting of costs, which
increases medical premiums for businesses and their employees. These medically underserved
communities, which suffer from health professional shortages, can exist anywhere, but tend to be
concentrated in rural communities and urban inner city areas where there are economically
disadvantaged individuals. Despite the poverty in these areas that may make the communities
appear unattractive to some health professionals, there are many strategies to recruit students to
practice in medically underserved communities7. Evidence shows that the strongest predictor of

46
where a health professional will practice is where that health professional came from, validating
the supposition that those who practice in medically underserved communities are most likely to
have come from underserved populations. However, evidence also shows that students from
underserved backgrounds are less likely to enter higher education and health professions training
programs than their economically advantaged counterparts, unless they are equipped to
overcome the educational and financial barriers that they face 8,9
.
The supply of health professionals varies greatly based on certain geographic, demographic and
socioeconomic factors resulting in a mal-distribution of health professionals across the state of
Indiana. Health professionals are more likely to be concentrated in areas of economic affluence
and less likely to be concentrated in areas where the population is less dense. These are also
areas where the population has higher proportions of low income and racial and ethnic minorities 10-14
. Medically underserved populations suffer disproportionately from poorer health status and
higher health care costs because of their lack of access to primary and preventive care. These
disparities are due to many factors, but are certainly due in part to lack of health coverage and an
insufficient numbers of providers. Disparities are most prevalent in Indiana’s urban inner cities
and rural areas.‖
A review of information provided by the Workforce and Workforce Development Subcommittee
of the Indiana University Health Care Reform Study Group (2007) cited current levels of
primary care physicians and non-physician clinicians in each county as a rate per 100,000
inhabitants in 2005. The thirty-four Indiana counties and their levels of primary care physicians
and non-physician clinicians are averaged in the table below and compared with the averages of
counties comprising Metropolitan Statistical Area center counties.
Figure 32. Comparison of Prevalence of Clinician Types in CAH Counties to MSA Centers.
Clinician Type CAH
Counties
MSA Centers
Family Medicine Physician 417 1273
General Int. Med. Physician 91 809
Gen. Pediatric Physician 77 490
Osteopathic Physician 91 511
Prim. Care Physician Assistants 10 56
Nurse Practitioners 127 864
Total 813 4003
Rate per 100,000 (2005) 813/34 = 24 4003/16 = 250
Within Indiana many primary care health professional shortage areas and populations exist. See
Figure 33 below.
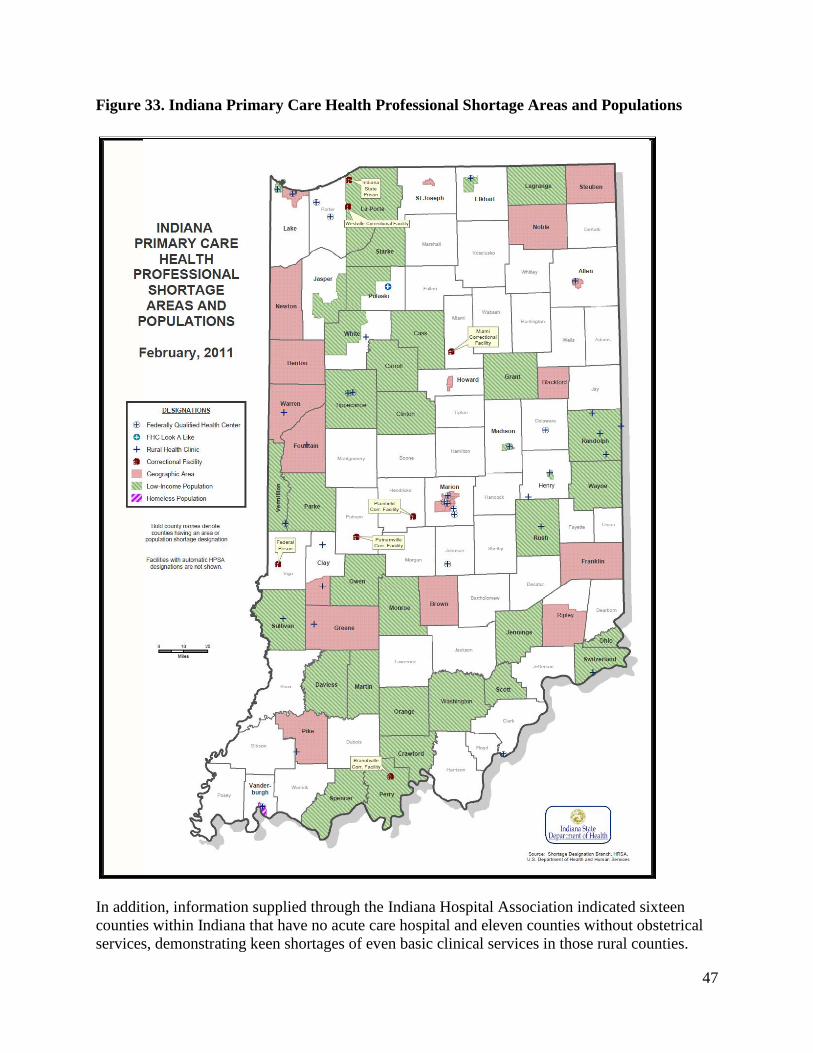
47
Figure 33. Indiana Primary Care Health Professional Shortage Areas and Populations
In addition, information supplied through the Indiana Hospital Association indicated sixteen
counties within Indiana that have no acute care hospital and eleven counties without obstetrical
services, demonstrating keen shortages of even basic clinical services in those rural counties.
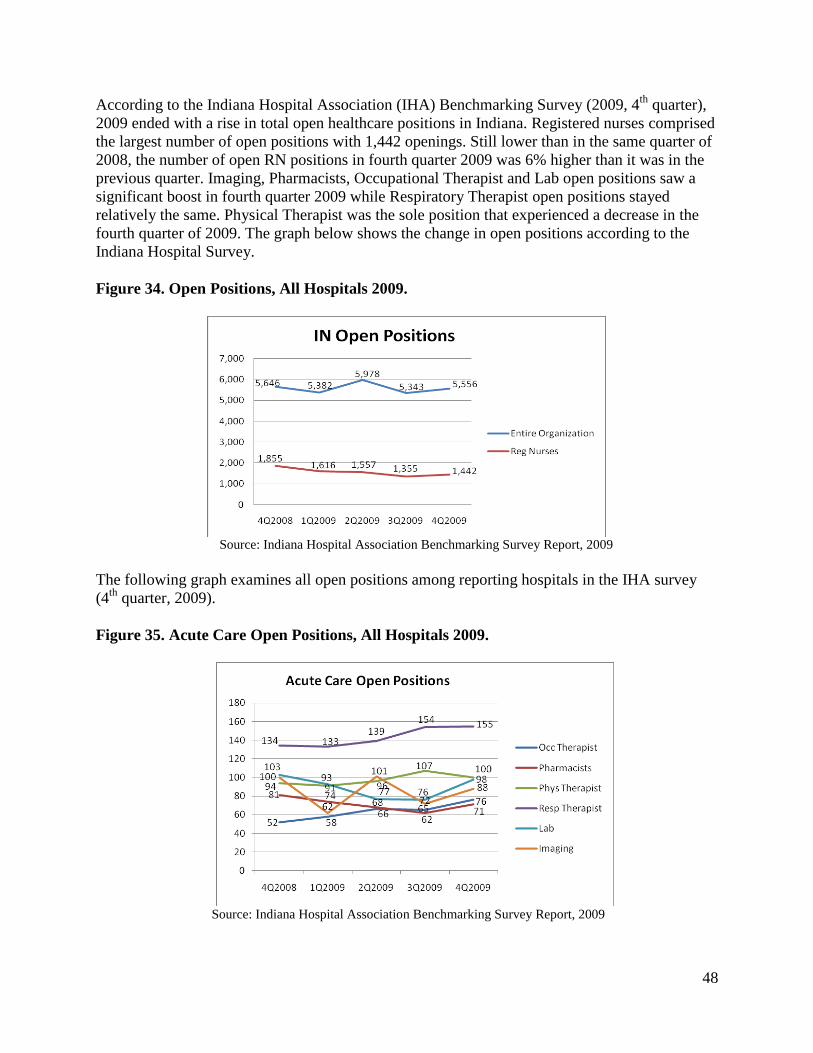
48
According to the Indiana Hospital Association (IHA) Benchmarking Survey (2009, 4th
quarter),
2009 ended with a rise in total open healthcare positions in Indiana. Registered nurses comprised
the largest number of open positions with 1,442 openings. Still lower than in the same quarter of
2008, the number of open RN positions in fourth quarter 2009 was 6% higher than it was in the
previous quarter. Imaging, Pharmacists, Occupational Therapist and Lab open positions saw a
significant boost in fourth quarter 2009 while Respiratory Therapist open positions stayed
relatively the same. Physical Therapist was the sole position that experienced a decrease in the
fourth quarter of 2009. The graph below shows the change in open positions according to the
Indiana Hospital Survey.
Figure 34. Open Positions, All Hospitals 2009.
Source: Indiana Hospital Association Benchmarking Survey Report, 2009
The following graph examines all open positions among reporting hospitals in the IHA survey
(4th
quarter, 2009).
Figure 35. Acute Care Open Positions, All Hospitals 2009.
Source: Indiana Hospital Association Benchmarking Survey Report, 2009

49
The Behavioral and Mental Health Professionals Re-Licensing Report for 2004 & 2006 (2010)
indicated that based upon surveys received, counties with the largest populations tended to have
the most mental health professionals and the highest ratios per 100,000 population. All Indiana
counties had at least one mental health professional. Seven counties lacked even one social
worker. Forty-six counties (50.0%) did not have a marriage and family therapist who responded
to the survey. Thirteen counties (14.1%) did not have a mental health counselor who responded
to the survey. Twenty counties (21.7%) did not have other mental health professionals who
responded to the survey.
The number of mental health professionals licensed in Indiana has slightly decreased from 2004
to 2006. Most mental health professionals were white, non-Hispanic, female, and in the 45-54
age group. Most of their professional time was spent in social work activities followed by mental
health counseling activities. The top three practice areas were general mental health, mood
disorders, and anxiety disorders. Over four-fifths of the psychiatric and mental health nurse
respondents were actively working as psychiatric mental health nurses in Indiana. Almost all
were female, white, and non-Hispanic/Latino. Over two-thirds provided patient care as a
registered nurse. Their major activities included psychopharmacological interventions and
clinical supervision/education. Less than three-fifths anticipated retiring in ten or more years.
There is a need to train, recruit and retain more mental health professionals actively working in
Indiana.
The number of some specific types of professionals appeared to have declined in 2006 compared
to 2004. In addition, many mental health professionals are reaching the retirement age, especially
marriage and family therapists. Also, the data clearly shows a gender and minority gap in the
workforce, which could have an impact on the patient population who seek help from mental
health professionals.
Health Professional Summary
Indiana’s health care workforce is lacking in rural areas. Recruitment and retention are essential
activities for most providers. Not only does Indiana need sufficient coverage of medical
providers from many disciplines who are able and willing to work with citizens from rural
counties, but those providers must be highly skilled and comfortable with the lifestyle that rural
communities provide.
Efforts to provide rural rotation experiences are underway. Indiana’s Area Health Education
Centers are actively working across the state to develop an interest and vision among Indiana’s
young people to promote the pursuit of health-related careers and eventual practice in Indiana’s
underserved areas. Further, they actively recruit candidates for training that match the
demographic characteristics and culture of persons in underserved communities. Supporting
health care workforce development activities and connecting existing efforts with providers
seeking health care workers is essential. Creating connections between needed specialists and
needy communities are key efforts in developing Indiana’s health care workforce.
References 1 Bureau of Labor Statistics. (December 4, 2007). ―Employment Projections.‖ (Pub. no. USDL 07-1847).
Washington, D.C.: U.S. Department of Labor. http://www.bls.gov/ news.release/ecopro.t01.htm

50
2 Woods, R. (February 20, 2008). ―Workforce Projections.‖ Remarks to the NACRHHS, February Meeting.
3 Fonkert, J. (September 24, 2008). ―The Rural Healthcare Workforce Challenge: a Minnesota
Perspective.‖ Remarks to the NACRHHS, September Meeting
4 Economic Research Service. (February 1, 2007). ―Nonmetro America Faces Challenges From an Aging
Population.‖ (Rural Population and Migration Briefing). Washington, D.C.: U.S. Department of
Agriculture. http:// www.ers.usda.gov/Briefing/Population/Challenges.htm
5 Arts, G. (December, 2003). ―Rural Area Brain Drain: Is It a Reality.‖ Choices Magazine. 4th Quarter. 11- 16.
6 Excerpt from The National Advisory Committee on Rural Health and Human Services (2009) The 2009Report to
the Secretary: Rural Health and Human Services Issues. Retrieved from
http://ruralhealth.hrsa.gov/reports/2009_NAC.pdf
7 Health Resources and Services Administration (HRSA) Bureau of Health Professions. (2002). State
Responses to Health Worker Shortages: Results of a 2002 Survey of States: U.S. Department of Health and
Human Services.
8 Haycock K. (2006). Promise Abandoned: How Policy Choices and Institutional Practices Restrict College
Opportunities: The Education Trust and the Lumina Foundation for Education
9 Gerald, D. & Haycock K.(2006). Engines of Inequality: Diminishing Equity in the Nation’s Premier
PublicUniversities: The Education Trust and the Lumina Foundation for Education.
10 Indiana University School of Medicine Physician Workforce Task Force.(2006). Task Force Findings and
Recommendations: Indiana Physician Profile, Analysis and Projection - Final Report, 2006.
Indianapolis, IN: Indiana University School of Medicine.
11 Zollinger T. , Przybylski M. , Sutton B., & Jackson L. (2006). 2005 Indiana Registered Nurse Survey Report.
Indianapolis: Indiana University School of Medicine.
12 Yoder K. (2007). Indiana’s dental workforce: distribution and related issues. JIDA., 16-20.
13 Larson, E., Johson, K., Norris T., Lishner,, D., Rosenblatt R., & Hart L. (2003). State of the Health
Workforce in Rural America: Profiles and Comparisons: WWAMI Rural Health Research Center.
14 Wade, M., Brokaw, J., Zollinger, T., et al.(2007). Influence of hometown on family physicians' choice to
practice in rural settings. Family Medicine, 39 (4), 248-254.

51
Section IV. Flex Funding
The Medicare Rural Hospital Flexibility (Flex) Program was established by the Balanced Budget
Act of 1997. The purpose of the program is to help rural communities preserve access to
primary and emergency health care services by:
Enhancing emergency medical services;
Improving health care quality and performance; and
Promoting rural health networks and community development
Flex grants help rural health care providers and rural communities respond in a comprehensive,
collaborative, and more effective fashion to major changes affecting the rural health system and
rural communities. Local and regional partners are encouraged to work together to assess their
environments and community needs and to plan and implement strategic responses to improve
rural health care delivery. Grants are available for activities ranging from planning through
implementation, with an emphasis on activities leading to measurable outcomes.
Flex Program Work Plan
The Flex Program Work Plan provides a detailed description of the Indiana Flex Program for
year one, including program/project overview, needs assessment, proposed activities, and
measures (outcome and process). The goals, objectives, strategies, activities (inputs), staffing
needs, responsibilities, outcome measures (outputs) both qualitative and quantitative, timeframes
for program/project start and completion, and overall outcomes are outlined in the tables and
narrative provided. As required, the Work Plan outlines in detail each activity’s relationship with
one or more of the four core areas of the Flex Program.
Flex Core Area 1 – CAH Support for Quality Improvement
Flex Core Area 2 – CAH Support for Financial and Operational Improvement
Flex Core Area 3 – CAH Support for Health System Development and Community
Engagement
Flex Core Area 4 – Facilitate CAH Conversion of Small Rural Hospitals to CAH Status
A proposed five-year plan with Program timeframes for each anticipated Program activity is
documented.
Work Plan Goals and Objectives
The goals and objectives of the Program have been designed around the Flex core areas for the
Rural Hospital Flexibility Program 2010- 2015 and were adopted by the Flex Committee in an
attempt to meet the needs of rural health care providers and ultimately those of rural residents in
Indiana.
Program Goal 1:
Core Area 1: Provide CAH Support for Quality Improvement (QI)
Develop a statewide data reporting and sharing system via a secure portal for data
exchange.

52
Support CAHs in building upon a multi-hospital quality improvement project involving
hospital readmissions targeting chronic diseases to increase patient safety and quality of
care
Increase access to care for specialty and subspecialty services through telehealth
initiatives.
Program Goal 2:
Core Area 2: Provide CAH Support for Operational and Financial Improvement
Support CAHs with planning and implementing evidence-based strategies for improving
financial performance.
Program Goal 3:
Core Area 3: Provide CAH Support for Health System Development and Community
Engagement
Develop and expand use of electronic tools and e-learning to enhance communication,
training and education, and interaction among CAHs in Indiana to increase access to
health care services by residents in Indiana.
Program Goal 4:
Core Area 4: Facilitate Conversion of Small Rural Hospitals to CAH status
Facilitate conversion of small rural hospitals to CAH status in accordance with federal
and state regulation as needs arise among Indiana rural hospital providers.
Assumptions in Work Plan Goal Development
The goals of the Indiana Flex Program were developed with the assumption that the initiatives
and projects will benefit rural CAH providers throughout the state of Indiana. Specifically, it is
assumed that by implementing the initiatives and projects, participating rural CAH providers
would have access to resources, services, and programs that they otherwise would not have.
Examples of outcomes expected once these resources, services, and programs are applied
include:
Improved operational efficiency of rural CAH providers
Improved connectivity of rural CAH providers and communities
Increased utilization of Health Information Technology and videoconferencing
capabilities
Provision of education programs developed specifically to meet the needs of rural CAH
providers and communities
Increased ability to meet Information Technology needs of rural CAH providers through
group purchasing and service agreements
Development of self-sustaining programs that add value to rural CAH providers and
organizations
It is assumed that an infusion of resources, services, and programs will enhance the quality of
provided services, thereby making rural CAH providers more competitive and their services
more attractive to local patients. Although these assumptions were made, the SORH based
programming and direction with the aid of practitioners. It has also been assumed that, by
receiving funds through the HRSA Flex Program Grant, rural Indiana CAH providers will be

53
able to enhance the overall clinical and financial performance of their hospitals, thereby creating
a positive impact upon the rural communities they serve.
Figure 36. Projected Impact of the Indiana Flex Program, 2010-2015.
Flex Core Area 1 Flex Core Area 2 Flex Core Area 3
I. Statewide CAH Benchmarking
Program
Clinical data and outcomes
Statewide CAH Benchmarking
Program
Financial data and operational
outcomes
Statewide CAH
Benchmarking Program
Educational training and
support
II. Statewide CAH Quality
Program Project #1
CAH Readmissions
Clinical data and outcomes
Statewide CAH Quality Program Project #1
CAH Readmissions
Financial data and operational
outcomes
Statewide CAH Quality
Program Project #1
CAH Readmissions
Educational training
Statewide CAH Quality
Program Project #2
TeleStroke Network
Telemedicine Network
Clinical data and outcomes
Statewide CAH Quality Program Project #2
TeleStroke Network
Telemedicine Network
Financial data and operational
outcomes
Statewide CAH Quality
Program Project #2
TeleStroke Network
Telemedicine Network
Educational training
III. CAH Educational Programs
Quality (clinical)
Leadership
CAH Educational Programs
Quality (financial)
Leadership/BOD
HIT
CAH Educational Programs
HIT
IV. Videoconferencing & E-learning
Program Years 2 – 5
Phase 2
E-learning/virtual education
Videoconferencing & E-learning
Program Years 2 – 5
Phase 2
E-learning/virtual education
Videoconferencing & E-
learning Program Years 1 – 5
Phase 1
Videoconferencing/virtual
meetings
V. Flex Core Area 4 - Facilitate Conversion of Small Indiana Rural Hospitals to CAH Status (2011 – 2015) to
facilitate appropriate conversion of small rural hospitals to CAH status in accordance with federal and state
regulation. SORH will provide resources as needs arise. Currently, no CAH conversions are anticipated.
Current Flex Projects
CAH Readmission Project
The objective of supporting CAHs in implementing a quality/patient safety project focused on
reducing avoidable readmissions through improvements in discharge processes. Site visits were
conducted with each of seven participating hospitals to review CHF/PM readmission rates and
strengths and weaknesses of current discharge processes. Project activities center on shift-to-shift
communication, patient reconciliation tools, timely sharing of patient discharge information
patient education/health literacy, collaborative partnerships among providers, and the use of
personal health records. Technical assistance is being provided to assist CAHs with change
implementation. Utilization, length of stay, and financial data are being collected as indicators of
change.
Benchmarking/State Portal Project
The Indiana Flex benchmarking initiatives will be tracked through the Medicare Beneficiary
Quality Improvement Project. The State Office of Rural Health will begin using the Center

54
Activity Tracking System (CATS) for reporting performance improvement measures to HRSA as
well as tracking at least 10 additional statewide measures focused on current Flex projects. The
SORH will continue to look into options and needs for statewide reporting into a statewide
portal. Additionally CAHs will be trained on the submission of data to Hospital Compare.
Medicare Beneficiary Quality Improvement Project (MBQIP)
Baseline data was established for this project with support from Health Care Excel, the Indiana
QIO. The goal of this project is to increase participation in Hospital Compare to improve
publicly available data and to motivate CAHs to implement related quality improvement
initiatives.
Telehealth Network Project
This project supports the continued development of the Indiana Statewide Rural Health Network
(InSRHN) TeleStroke Network Project and its objectives: (1) to deliver specialty services
statewide through telehealth focusing on stroke, and (2) to implement evidence-based practice
guidelines for stroke care by partnering with the American Heart Association and the Indiana
QIO to implement the Get with the Guidelines for stroke care. This model can be expanded in
terms of membership and/or adapted for other medical conditions.
CAH Educational Programs Project
Funding for this initiative supports major educational events, a newsletter, technical assistance,
and evaluation activities throughout the year aimed at hospital quality improvement and/or
operational and financial improvement.
Videoconferencing and E-Learning Project
The objective of this project is to create a statewide rural videoconferencing platform for CAHs
to use for meeting, training, and educational opportunities. The first phase of this project,
establishing the videoconferencing bridge has been accomplished through the purchase of a 12-
port Tandberg Codian bridge and the connection of six pilot CAH locations to that bridge.
Next, equipment for the continued development of the network must be obtained and installed.
Then group purchasing of existing online courses will occur. Partnerships with the Indiana
University Department of Public Health will allow access to a learning management system for
continuing education records management.
CAH Conversion
No conversions are in process at this time.
Flex Funding Summary
Flex funding for FY 2011 addresses core areas of national concern formulated into statewide
approaches to address the health needs of Indiana’s rural communities. Figure 37 shows the
proposed distribution of Flex funds for the year.

55
Figure 37. Flex Funds Distribution 2010 - 2011.
Hospitals to be served through Flex funding
Through the selected programs and projects, all thirty-five CAHs will benefit. Over the five year
Flex grant period, initiatives will be phased in using a sequence that serves the priorities of the
Flex constituencies and results in meaningful absorption and change.
The Indiana Rural Health Association is also providing a platform for technology use applicable
to these efforts as it was the lead applicant in a grant funded by the Federal Communications
Commission’s (FCC’s) Rural Health Care Pilot Program in 2007. Since that time IRHA has
begun building a 100 megabit fiber network to all 35 critical access hospitals as a consortium
partner in the Indiana Telehealth Network. This dedicated broadband can be used for multiple
purposes including telemedicine, health information exchange, distance education and training,
public health surveillance, emergency preparedness and trauma system exchange development.
In addition, IRHA was the lead applicant in a HRSA Outreach Network Grant that is creating
telemental health within rural areas of Indiana. These combined resources, along with the
SORH’s dedicated portal form a strong foundation for the use of Flex funding to utilize
broadband applications and secure a videoconferencing bridge to benefit all CAHs.
The Indiana Rural Health Plan/Flex Grant Logic Model included below shows the
connections between program inputs, outputs and outcomes expected as a result of the efficient
use of Flex funds as proposed.

56
Figure 38. Rural Health Plan/Flex Grant Logic Model
Full-time Flex Program Coordinator
In order to successfully implement the Flex-funded CAH activities, the SORH has hired a full-
time Flex Coordinator, Cindy Large, who will be responsible for overseeing implementation of
the Flex strategies and activities prescribed in the work plan within the identified time period.
Rural Health
Plan Themes
Flex Grant
Core Areas
Baseline Inputs Outputs Outcomes
1. Support
Collaborative
solutions to issues
of rural health
services quality
and access.
2. Provide
equitable and
accountable
funding strategies
for appropriate
projects resulting
in improved care
and/or provider
accountability for
rural citizens.
3. Utilize existing
expertise already
working on rural
health issues to
greatest degree
possible.
4. Aid in
accountability of
clinical practice
and financial
acumen of rural
providers.
5. Act as conduit
of accurate
information to and
from Critical
Access Hospitals,
rural providers,
training experts,
and state policy
makers.
1.Support for
Quality
Improvement
2. Support
for
Operational
and Financial
Improvement
3. Support
for Health
System
Development
and
Community
Engagement
4. Facilitate
Conversion
of Small
Rural
Hospitals to
CAH status
Current State
Extent of the
Problem
Need for change
a. Data Gathering
b. Reporting
c. Increased
Measurement
d. Protocol
Development
e. Research
f.
Materials/product
development
g. Equipment/
Technology or
other
Training
h.
Implementation
of EBP
i. Assessment of
need
j. Collaborative
Agreements
a. Increased
reporting
b. Change as
result of training
c. Increased data
available
d. Greater
utilization of
HIT/EHR
e. Increased
collaboration
with other
CAHs
f. Increased
efficiency
g. Increased
revenue
h. Increased
access
i. Infection
control
j. Reduced
chronic
admissions
a. Increased
knowledge
b. Improved
health of
constituents
c. Increased
internal
efficiency
d. Improved
networking
e. Increased
transparency
f. Increased
resources
g. Increased
capacity
h. Habit change
i. Social change
Baseline
Measures
Input
Measures
Output
Measures
Outcome
Measures Waiting List
Wait Times
Repeat
Admissions
Accidents
Culture Surveys
Follow up
Services
Health Record
Issues
Documentation
Issues
Communication
Issues
Level of
participation
Amount and
type of
assistance
Activities to
promote positive
change
Training
activities and
level of
participation
Connectivity
ratings
Extent of the
change against
baseline
Impact of
change on
defined issue
Dissemination
of improved
processes

57
Flex Advisory Committee
The SORH has convened a Flex Advisory Committee comprised of a diverse group of CAH
leaders, rural health care experts, key stakeholders, and others. The mission of the Flex Advisory
Committee is to support efforts to improve and sustain the quality of care provided by CAHs to
ensure that Indiana rural citizens receive appropriate care in their communities. The SORH and
Flex Coordinator will draw upon the expertise and experience of the Flex Advisory Committee
and CAH leaders to identify the needs and challenges of Indiana’s rural CAH providers and the
communities they serve, develop methods for addressing these needs and challenges, and
implement additional activities as identified that will benefit the overall needs of the Indiana
CAHs.
Figure 39. Flex Advisory Committee, 2010-2011.
Committee Member Name Title Organization
1. Ann Alley Director Indiana State Office of Rural Health
Flex Advisory Committee Chairperson
2. Brad Dykes CAH, CEO Bedford Regional Medical Center
3. Brad Smith CAH, CEO Rush Memorial Hospital
Indiana Hospital Association Council on Rural
4. Hicham Rahmouni IT Specialist Richard G. Lugar Center for Rural Health
5. Spencer Grover Vice President Indiana Hospital Association
6. Becky Sanders Network Development Director Indiana Rural Health Association
7. Cindy Large FLEX Coordinator Indiana Rural Health Association
8. Julie Liersch VP of Clinical Services Jasper County Hospital
9. Deb Rasper CAH, CEO St. Vincent Mercy
10. Dennis Weatherford CAH, CEO Putnam County Hospital
11. Don Kelso Executive Director Indiana Rural Health Association
12. Jim Miller Special Projects Coordinator Indiana Rural Health Association
13. Matt Serricchio Asst. Network Dev. Dir. Indiana Rural Health Association
14. Emmett Schuster CAH, CEO Gibson General Hospital
15. Gregg Malott CAH, CFO Pulaski Memorial Hospital
16. Jerry King Executive Director Indiana Public Health Association
17. Joe Biggs Executive Administrator Richard G. Lugar Center for Rural Health
18. Stephanie Long CEO White County Memorial Hospital
19. John Alley CAH, CEO Woodlawn Hospital
20. Brittany Knick Manager State Office of Rural Health
21. Marilyn Custer-
Mitchell
CAH, CEO Wabash County Hospital
22. Ann Yates Director of Nurrsing St. Vincent Mercy Hospital
23. Andrea Koontz R.N., D.O.N. Community Hospital of Bremen
24. Trish Niswonger Dir. Of Inpatient Services St. Mary’s Warrick Hospital
25. Rebecca Royer QIO, Dir. Clinical Services /Ops Health Care Excel and Consulting, Inc.
26. Tim Putnam President/CEO Margaret Mary Community Hospital
27. Scott Graybill CAH, CEO Community Hospital of Bremen
28. Mary Minier COO, CCO White County Memorial Hospital
29. Diane McKinney Vice President Decatur County Memorial Hospital
30. Kathy Lewis Dir. Ed., Quality, & Compliance IU Health Bedford Hospital
31. Sam Mishelow EVP, President Meyer-Najem; IRHA Board
32. Jeanette Huntoon Chief Executive Logansport Memorial Hospital

58
Most Flex Committee members volunteered while others were referred by the community. Members
are experts in rural Indiana health care representing Indiana CAHs, the SORH, associations and other
rural-serving entities. The Committee’s input and direction will be accommodated by the Flex
Coordinator and the SORH through meetings, minutes, and written recommendations. The Flex
Advisory Committee is charged with helping to update the Indiana Rural Health Plan and advising the
Flex grant application at least annually. This 32-member committee has a diversified rural
background, predominantly representing the Indiana CAHs, and will serve as a support and resource
for the Flex Program.
The Indiana Flex Advisory Committee meets a minimum of three times a year via face-to-face
meetings or conference calls, to be facilitated by the SORH/Flex Coordinator who will be responsible
for insuring implementation of statewide Flex program and initiatives. During these meetings, Flex
Program goals, strategies, and activities will be discussed, and the SORH/Flex Coordinator will
provide direction to the committee members regarding tasks that must be accomplished in order to
successfully complete the initiatives/activities described in this grant application. In addition,
concerns and obstacles will be identified and strategies will be developed to address and overcome
these issues.
Expected Benefits from Flex Program Activities
Increase in Access to Quality Health Care Services
It is anticipated that rural communities and residents will experience increased quality of care
services and more stable access to rural health care services as a result of Flex Program
initiatives. This will occur through combined efforts across diverse issues, resulting in
economies of scale, resource sharing, and shared programs. A few of the potential health care
system improvements that may occur as a result of network activities include:
Implementation of quality improvement initiatives
Implementation of best practices and evidence-based practice guideline for chronic
disease management
Reduction in readmission rates
Access to needed specialty and subspecialty services in their communities
Health Information Technology (HIT) resources, collaborative purchasing, and utilization
Education and training for CAH leadership, management, and health care professional
staff
Education accessibility for rural communities and residents
In addition, the activities of the Flex Program will enable rural health providers to leverage the
resources needed to create economies of scale, improve access to health care services, and
ultimately improve the health and well-being of Indiana’s rural residents.
While the design of the Indiana Flex Program will positively impact rural health providers, it is
anticipated that urban and suburban health care providers may lose patients as a result of
improvements in the rural health care delivery system. However, it is believed that shifts in
health care utilization will be small in comparison to the overall business of a large hospital or

59
clinic. Conversely, these same changes in health care utilization will result in a substantial
positive impact for rural health care providers.
It is clear that those CAHs participating in and benefiting from the Flex Program initiatives are
able to obtain advantages that otherwise would be unavailable. These advantages include:
Strengthened collaborative efforts among rural health providers in Indiana
Access to resources to strengthen rural health care delivery resulting in higher expectations
regarding performance improvement initiatives among CAHs
Structured environment for statewide networking opportunities for CAHs that would
otherwise be impossible
Improved employee and physician satisfaction scores
As a result of the Flex Program initiatives, it is anticipated that Indiana’s rural CAH providers
will establish a more efficient and cost-effective rural health care system that will ensure their
sustainability. Accordingly, if these rural health care providers are cost-effective, they will
remain viable locations for the provision of high quality health care services for years to come;
ultimately improving the quality of life for Indiana’s rural residents.
The Flex program will strengthen the ability of Indiana’s rural health providers to serve their
respective rural communities by providing needed services, products, and programs that they
would otherwise not be able to access due to financial and staffing limitations. Examples of
potential services, products, and programs that could be purchased and/or implemented through
efforts of the Flex Program include:
Mandatory annual training/education via electronic communication methods
Increased ability to attend meetings and/or educational programs via electronic modalities
Participation in rural health quality programs focusing on disease processes identified as
a statewide improvement area
Access to specialists and subspecialists, while keeping patients in their own communities
Development of collaborative agreements that enable the provision of virtual training,
meetings, and webinars.
Reallocation of time formerly spent in travel to meetings toward patient and
management-centered activities
Collaborative agreements among network members to develop joint training programs
and performance improvement measures
In addition, by convening the Flex Program user groups, each participating CAH organization
will have the opportunity to draw upon the expertise of the other CAHs or organizations. Lastly,
the Flex Program initiatives develop and nurture affiliations with other rural providers, state
associations, and universities, creating opportunities for CAHs individually and collectively to
expand the types and quality of services they provide.

60
Resources and Capabilities
Collaborations
Key stakeholders include both rural health care providers and organizations that serve CAHs
throughout the state of Indiana. These key stakeholders bring statewide and national resources to
support successful outcomes of Indiana’s Flex Program. The collaborative seeks to:
Provide support, resources, technical assistance, and expertise necessary for
successful program implementation
Provide knowledge regarding the needs and challenges faced by rural health care
providers in Indiana as they pertain to quality improvement activities and the skills to
address these needs and challenges
Participate in Flex Program meetings and/or conference calls as needed
Provide meeting space for meetings, as deemed appropriate
Dedicate staff time to assist with successful implementation of Flex Program
activities
Below is a listing of stakeholders that have committed to Indiana’s Flex Program activities with
a description of the organization, the skills, knowledge, and expertise they bring, and the ways in
which they add value to the Flex Program.
Indiana Rural Health Association (IRHA): IRHA was founded in 1997 as a not-for-profit
corporation for the purpose of improving the health of all rural citizens in Indiana. The
mission of IRHA is to enhance the health and well-being of rural populations in Indiana
through leadership, education, advocacy, collaboration, and resource development. In
keeping with the organization’s mission, IRHA has historically implemented projects and
programs that are beneficial to rural health care providers and the patients that they serve.
Given the previously established relationships and prior collaborative history with CAHs and
other statewide rural health organizations in Indiana, IRHA is well positioned to support the
SORH and the Flex activities proposed within this application, as well as to meet and exceed
Program requirements and expectations. IRHA is supportive of the Indiana Flex Program and
has provided a letter of support regarding the proposed Flex initiatives.
Indiana Hospital Association (IHA): A state and regional organization representing 166
Hoosier hospitals and health systems, IHA works to provide leadership, representation, and
services in the common best interests of its members as they promote the improvement of
community health status. IHA is supportive of the Indiana Flex Program and has provided a
letter of support regarding the proposed Flex initiatives.
Health Care Excel, Indiana Quality Improvement Organization (QIO): Health Care Excel
(HCE) is recognized as one of the most experienced health care utilization management and
quality improvement organizations in the United States. Given Health Care Excel’s expertise
regarding health care quality improvement activities, the organization’s extensive
collaborations with SORH and Indiana CAHs, as well as their commitment to the Flex
Program activities, it is anticipated that the organization will prove a formidable partner that
will help ensure successful quality improvement activity implementation. HCE is supportive

61
of the Indiana Flex Program and has provided a letter of support regarding the proposed Flex
initiatives.
Critical Access Hospitals (CAHs): There are 35 CAHs in the state of Indiana. These small
rural hospitals that have 25 beds or less and are located in rural areas of the state of Indiana
provide access to needed services for rural residents. The participation of these hospitals in
the Flex Program will provide needed combined services that will benefit Indiana’s rural
communities. The responsibilities of the CAHs participating in the Flex Program are:
Participation in program meetings and/or conference calls as requested
Dedicate staff time to assist with successful implementation of program activities
Provide a portion of staff time as an in-kind contribution(s) to help ensure successful
implementation of Program activities
Informing Future Efforts
The Flex Advisory Committee determined that it would be beneficial to repeat the initial Critical
Access Hospital survey distributed in years 2009 and 2010 to begin to collect longitudinal data
on CAH issues and performance. ASPIN conducted the survey electronically in May of 2011.
The information gathered served several purposes. First, the hospitals collectively establish an
overall picture of the impact of the economy on human resources, funding, and services within
their areas. Next, the survey identified areas of greatest concern, issues of vulnerable
populations, current benchmarking and statistical reporting mechanisms, level of telehealth
involvement, and training needs. In addition, the survey identified primary unmet community
healthcare needs and requested input regarding the ways that Flex program might be able to
respond to those unmet needs. The full survey instrument is included in Appendix A.
Critical Access Hospital Survey Outcomes – May 2011
The following section summarizes the results of Indiana State Department of Health Survey of
Critical Access Hospitals. Input provided by the CEOs of the Critical Access Hospitals
established an up-to-date snapshot of emerging health needs in our state in response to
demographic, administrative, and economic shifts, as well as defined categories of need for Flex
funds.
Responses
The survey was distributed electronically to CEOs of all thirty-five of Indiana’s critical access
hospitals. The survey was divided into three sections with an electronic link to each section in
order to allow for internal forwarding to subject matter experts in Human Resources,
Administration, and Finance. It was therefore the responsibility for each hospital to complete
three separate surveys. Not all hospitals completed all surveys. The completion rate for the
Administration survey was 43% (15 of 35 reporting); the rate for the Finance surveys was 54%
19 of 35 reporting); and the rate for Human Resources was 49% (17 of 35 reporting). Responses
are summarized in the aggregate in the following paragraphs around themes of workforce, effects

62
of the external economy, data management and technology, training needs, interaction with local
health departments, and unmet community health care needs.
Issues of Greatest Concern
The CEOs of the participating Critical Access Hospitals identified issues of greatest concern
from their administrative perspective. These are ranked as follows:
1. Recruiting/Retaining Physicians
2. Financial Performance
3. Health Care Reform Impacts
4. (tied ranking)
Reimbursement
Recruiting/Retaining Nurses
Electronic Medical Records
Patient Safety
These issues fall into two primary categories: Workforce and Financial.
Workforce Issues
The critical access hospitals are experiencing from one to seven full-time positions open at each
critical access hospital on a weekly basis; a range of from zero to ten part-time positions are
typically available. It was indicated that it could take months to fill open positions. The positions
hardest to recruit are primary care physicians, pharmacists, nurses, and specialty care physicians.
See Figure 40 below that compares the recruitment difficulty of four positions over time. In
2011, the ability to fill pharmacy positions was indicated as difficult by 50% of survey
respondents. It appears that nursing positions are more easily filled now than in the past. This
may be due to downsizings in some organizations that create skilled workforce availability for
others.
Figure 40. Positions Most Difficult to Recruit, 2009 to 2011.
Position Yes – Difficult to
Recruit in 2009
Yes – Difficult to
Recruit in 2010
Yes – Difficult to
Recruit in 2011 Nurses 44% 32% 38% Primary Care Physicians 76% 54% 62% Adv. Practice Nurses 96% 10% 25%
Specialty Care Physicians 68% 42% 38%
Of the specialty care physician positions, the ones most difficult to fill are summarized below.

63
Figure 41. Specialties Most Difficult to Recruit, 2011.
Some hospitals have had to resort to reductions in force as a response to economic downturn. In
2010, six hospitals reported reductions of an average of 24 persons, slightly higher than the
reported 20 persons in 2009. In 2011, two respondents acknowledged reductions in force
averaging 20 individuals each.
Effects of External Economy
Plant closings, downsizings, and/or business failures have had staggering impacts on Indiana’s
rural communities. Forty-three percent (43%) of survey respondents indicated that within the last
year, downsizings have continued with both manufacturing and small business losses. Hospitals
are also noticing reductions in health coverage and higher deductibles in response to budget cuts
among existing employers. In many cases, employees with chronic conditions cannot pay the
annual deductibles that often reach the $5,000 per year range. The economy in these rural areas
is not rebounding; the impact of recession continues.
By averaging payer mix responses from all hospitals, an aggregate picture of current-state payer
mix was developed and graphed in Figure 37. According to 2011 survey respondents, Medicaid
accounted for a range of between 4 and 43% of patient receivables; Medicare accounted for a
range of 9-57% of patient receivables; Commercial insurance created from 28.4 to 41% of
patient receivables; Uninsured/Self payers ranged from 3.5 to 11.9%; and Charity accounted for
between 1 and 8% of hospital patient billings. It is clear that the CAHs represent varying levels
of payer complexities depending upon local economy and demographic mix.
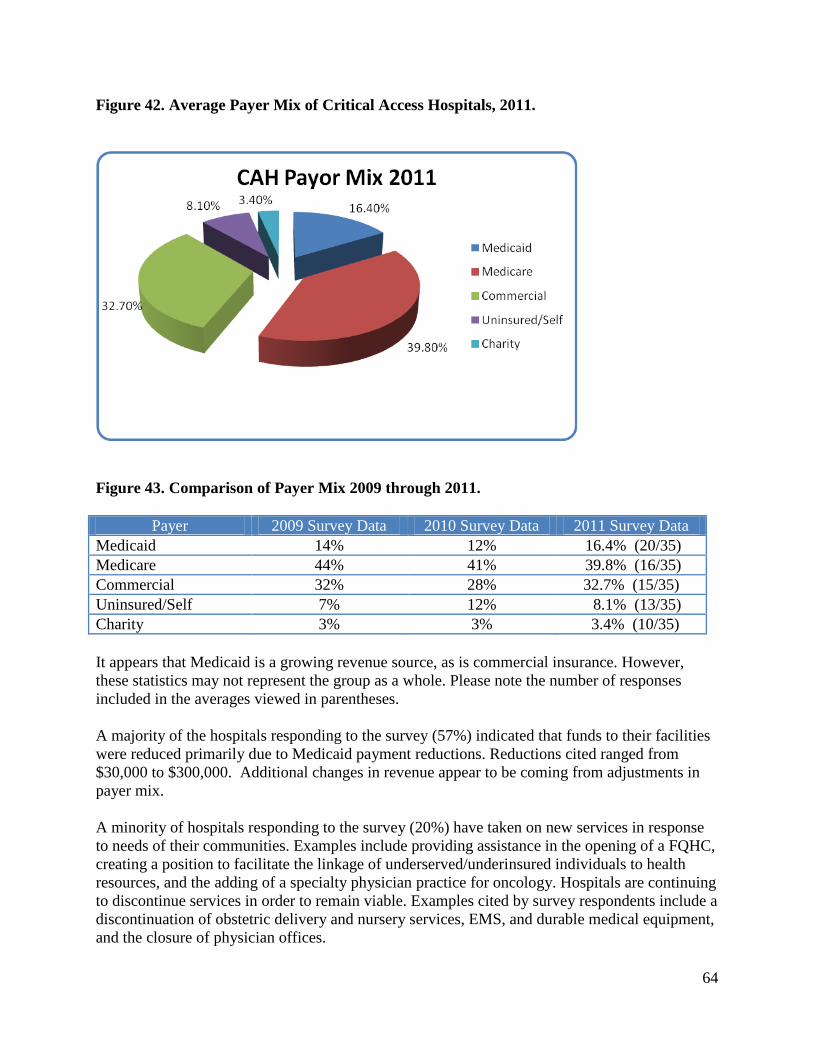
64
Figure 42. Average Payer Mix of Critical Access Hospitals, 2011.
Figure 43. Comparison of Payer Mix 2009 through 2011.
Payer 2009 Survey Data 2010 Survey Data 2011 Survey Data
Medicaid 14% 12% 16.4% (20/35)
Medicare 44% 41% 39.8% (16/35)
Commercial 32% 28% 32.7% (15/35)
Uninsured/Self 7% 12% 8.1% (13/35)
Charity 3% 3% 3.4% (10/35)
It appears that Medicaid is a growing revenue source, as is commercial insurance. However,
these statistics may not represent the group as a whole. Please note the number of responses
included in the averages viewed in parentheses.
A majority of the hospitals responding to the survey (57%) indicated that funds to their facilities
were reduced primarily due to Medicaid payment reductions. Reductions cited ranged from
$30,000 to $300,000. Additional changes in revenue appear to be coming from adjustments in
payer mix.
A minority of hospitals responding to the survey (20%) have taken on new services in response
to needs of their communities. Examples include providing assistance in the opening of a FQHC,
creating a position to facilitate the linkage of underserved/underinsured individuals to health
resources, and the adding of a specialty physician practice for oncology. Hospitals are continuing
to discontinue services in order to remain viable. Examples cited by survey respondents include a
discontinuation of obstetric delivery and nursery services, EMS, and durable medical equipment,
and the closure of physician offices.

65
Concern for vulnerable populations and ways to best serve them also was in evidence. The CEOs
collectively supplied the following unduplicated list of vulnerable populations that are present in
their areas. This is not a ranked list. The diversity in the identified populations underlines the
variety of needs in CAH communities.
Latino Community
Growing Medicaid populations
Families with very limited resources/working poor
Amish population
Elderly
Persons with multiple chronic diseases
Uninsured
Underinsured
Persons with Behavioral Health Needs
Children
Non-English Speaking Populations
Meeting the needs of these vulnerable populations requires high levels of resource utilization as
well as specialized support systems. The following comments are paraphrased qualitative
responses from CAH CEOs regarding the impact that serving the vulnerable populations has on
the hospital’s resources. The comments are not rank-ordered and may represent issues cited by
more than one hospital.
Patients wait too long to receive care. When they finally receive care, it is often for major
procedures that are very costly. They oftentimes can’t meet the deductible and we have
to write-off a significant portion of the bill as uncollectible.
Patients without primary care access use services that are very expensive like ER.
Greater demand is being put on us to serve all with increasing costs and declining
reimbursement. At some point we can no longer afford to meet all needs.
We need to provide services in a manner that integrates effectively with unique cultures.
Lack of transportation in rural areas inhibits ability to keep appointments, see
specialists, and have medications filled.
School nurses report that nutrition is a predominant issue as well as meeting needs of
diabetic and asthmatic children.
We frequently have issues transferring behavioral health patients for appropriate
treatment.
It appears that initiatives related to cultural competency, rural community health transportation,
and prevention of chronic disease are especially needed in the rural areas.

66
Data Management and Technology
The survey identified that most (87%) of responding critical access hospitals submit data to
Hospital Compare through the U.S. Department of Health and Human Services. Further,
responders indicated that they submit between one and seven data sets.
In addition, most (85%) share statistics with other outside entities. The following is an
unduplicated list of entities mentioned. Hospitals that are part of a larger network are less sure of
where data is submitted annually, as it is done centrally by the network.
Healthcare Excel
Indiana Hospital Association
St. Vincent Health
JCAHO
Anthem Hospital Quality Program
CMS
Leapfrog
Indiana Rural Health Association
Rural Performance Management
Alliant Management, Inc.
KART
Press Ganey
The hospitals also participate in various benchmarking programs. Most submit data to the
Indiana Hospital Association the Indiana Rural Health Association/RPM system, and Healthcare
Excel Kart Tool.
Figure 44. Benchmarking Entities Reported by CAHs, 2011.

67
Various technological applications are in place in the hospitals. The applications in greatest
evidence were related to webinar trainings, web conferencing, and electronic health records.
Telemedicine applications in use continue to demonstrate increases.
Figure 45. Technology Use, 2011.
Survey respondents were asked to identify barriers to greater telehealth/telemedicine use.
This question invited respondents to check all that apply, creating multiple answers per
respondent. The following table shows the frequency of issues selected from 2009 through 2011
surveys.
Figure 46. Barriers to Telehealth/Telemedicine Goals for Critical Access Hospitals.
Barrier # indicating the
barrier 2009
# indicating the
barrier 2010
# indicating the
barrier 2011
Financial 13 12 9
Staff Time for Implementation 9 5 6
Bandwidth 6 2 2
Billable Rates 6 7 5
Staff Training Support 6 7 7
IT Support 4 6 4
Connectivity 4 1 4
FCC Match 2 0 2
Board Support 1 1 0
No barriers 1 3 1
It appears that the mechanical aspects of incorporating technology are being solved, although the
staff and financial issues remain significant along with a need for ongoing IT support. Six of the
2011 respondents identified a lack of physician support as an additional barrier.

68
Training Needs
The training topics most needed by the critical access hospitals are summarized in the following
table. Health Care Reform training led the list for both the 2009 and 2010 surveys. The 2010
survey also identified Management in Changing Times, Accreditation Support, Cultural
Competency, and Telemedicine as significant training needs.
Figure 47. Training Topics Most Needed by Critical Access Hospitals, 2011.
Training modalities most used by the critical access hospitals include staff meetings, internal
workshops, self-paced online courses, and webinars. It appears that modalities that require little
travel and minimal time away from the workplace are favored. The following graph
demonstrates the types of modalities used as indicated by survey respondents. The modality cited
in the ―Other‖ category pertained to vendor-specific equipment and products.
Figure 48. Training Modalities in Use in Critical Access Hospitals, 2011.

69
Approximately 12% of responding hospitals indicated that they currently maintain training
contracts with outside entities. CareLearning was named as a provider with mandatory and
voluntary course offerings in web-based formats. Overall annual training budgets shared by
participating respondents ranged from $5,000 to over $2,000,000.
Interaction with Local Health Departments
In general, the survey results discovered that the critical access hospitals do not interact to a great
degree with local health departments. The most often-cited affiliations fell under the categories
of preparedness activities and shared immunization clinics.
Figure 49. Interaction with Local Health Departments, 2011.
Unmet Community Health Care Needs
In answer to a request for the top three unmet health care needs in their respective communities,
twenty-two different needs were identified. The top needs identified were primary care access,
weight management support, behavioral health care, cardiac specialty care, transportation,
OBGYN care, and care for the underinsured. Figure 50 below summarizes the needs identified.

70
Figure 50. Primary Unmet Health Care Needs Cited by Critical Access Hospitals.
Community Need Number of
Respondents
Identifying Timely Access to Primary Care 5 Weight Management Support 4 Behavioral Health Care 4 Specialty Care - Cardiac 3 Transportation 2 Specialty Care - OBGYN 2 Care for un/underinsured 2 Specialty Care - Pulmonary 1 Specialty Care - Ortho 1
Specialty Care - Oncology 1 Specialty Care - Dermatology 1 Specialty Care - GI 1 Assisted Living/Intermediate Care for Seniors 1 Diabetes Support 1 Wellness Education/screening 1 Preventative Services 1 Local Lab Services 1 Tobacco Cessation Support 1
Besides identifying issues, respondents were asked to supply potential solutions. The following
table summarizes the issues and solutions suggested.
Figure 51. Unmet Needs and Suggested Solutions Provided by Critical Access Hospitals.
Issue Suggested Solution
Wellness/Screening a. Establish a mobile clinic that travels to rural communities
b. Create more funding for hospitals to provide screenings
Obesity/Nutrition a. Support education for diet and exercise, provide
incentives for wellness
b. Obesity/fitness/nutrition programs for children
c. Exercise education for adults
Transportation In-depth study of needs
Primary Care Access Rural training opportunities, Rural recruitment assistance,
loan repayment support
Behavioral Health Increase number of available beds
Specialty care Recruitment support, telemedicine support
More community
programs for disease
management
Development of better community follow-up systems

71
The Indiana Office of Rural Health has formed a Flex Committee to meet quarterly. With this
group in place and work plans from subsequent Flex and grants and other funding sources, the
State Office of Rural Health will move forward to meet the needs of the Critical Access
Hospitals and their respective communities.
Key Stakeholder Input from Indiana’s Rural Roundtable
A second set of data was gathered through a survey process conducted with executives currently
participating on the Indiana Rural Roundtable convened by Ann Alley, the Director of the
Indiana State Office of Rural Health. This group meets quarterly to exchange information,
network, and collectively begin to address universal healthcare needs affecting rural Indiana.
These leaders provided information regarding gaps in health care viewed from their perspectives
and tied their information to the ways in which their organizations support the efforts of
Indiana’s critical access hospitals.
The Indiana Rural Roundtable is viewed as a coalition to bring forward information and
collaborative solutions to address rural health needs. It is also meant to streamline duplication
and uneven distribution of information. Moving forward, those represented within the Rural
Roundtable will apply energy to shared concerns through powerful collaborations for diversified
funding, program development, and statewide models of care, technical assistance, and growth
among entities concerned with the health care of rural citizens. The Indiana State Office of Rural
Health relies upon these entities to identify needs, review models, and to attempt creative
resolution of issues of care in rural areas.
The following individuals and their respective organizations are represented on the Rural
Roundtable:
Figure 52. Rural Roundtable Participants, 2010 – 2011.
Name Organization
Ann Alley State Office of Rural Health
Don Kelso Indiana Rural Health Association
Matt Serricchio Indiana Rural Health Association
Cindy Large Flex Coordinator
Kathy Cook Affiliated Service Provi1ders of Indiana, Inc.
Martha Levey Affiliated Service Provid1ers of Indiana, Inc.
Phil Morphew Indiana Primary Health Ca1re Association
Rick Kiovsky Indiana AHEC
Jerry King Indiana Public Health Association
Spencer Grover Indiana Hospital Association
Rebecca Royer Indiana Healthcare Excel
Anna Garrett Brain Injury Association of Indiana
Gina DelSanto Indiana workforce Development
Brittany Knick State Office of Rural Health Manager
Carole Kacius IU School of Medicine Dept. of Public Health

72
In May of 2011, a survey was emailed to Roundtable members. A copy of the survey questions is
included in Appendix A. What follows is a summary of the responses to the survey.
Rural Roundtable Survey Response Summary (7 Respondents)
Question 1: From your perspective, what are the major barriers facing rural health care
consumers in Indiana and what solutions would you recommend to address these issues?
Issue Proposed Solution
Access to Primary Health Care a. Indiana Access Plan provides a discussion of leading
factors influencing local access
b. Telehealth
c. Examine credentialing requirements
d. Remove disincentives for rural practice
e. Increase reimbursement for Medicare/Medicaid
f. Mental health integration
Competing demands for attention
(Economy, employment, costs of
items) push down health care as a
priority
a. Encourage displaced workers (unemployed) to enter
training for health care careers
Access to specialty care a. Encourage more individuals from rural population to
enter training to become providers to rural populations.
b. Telehealth
Perception that rural health care
is of less quality
a. Use students to help deliver needed health promotion
programs to the community
b. Share CAH quality data with local communities
Rural population may not relate
openly with a provider because
they don’t want to seem
unknowledgeable.
a. Increase provider skill in relating to rural populations.
b. Develop a statewide health literacy program for local
communities to conduct.
Lack of insurance
coverage/sufficient funds to pay
for services and/or deductibles
a. Offer financial incentives to improve wellness
b. Support statewide smoking ban
c. Access to safe exercise environments
d. Use educational technology to educate consumers
regarding disease and health access
Question 2: From your perspective, what are the major barriers facing rural health care
―providers‖ in Indiana and what solutions would you recommend to address these issues?
Issue Proposed Solution
Lack of Primary Care Providers a. Robust, sustainable recruitment program
b. Create alternative training/delivery options
c. Expose more students to providers in rural settings

73
d. Partner with health insurance companies to support
pilot projects to help students understand the value of
working in rural health
e. Lower medical school costs
f. Increase number of open slots in medical schools
Inadequate network of local
specialty care
a. Increase number of medically underserved areas and
populations to create FQHCs
b. Include inter-professional education to help develop
teams to address community health issues
c. Develop stronger linkages between providers and local
residency programs and other training programs
Insufficient number of physicians
accepting Medicaid
a. Restructure Medicaid reimbursement for telehealth
services
b. Decrease number of federal regulations
Slim business margin makes it
difficult to manage
uncompensated care
a. Provide incentives to encourage providers such as tax
breaks, differential reimbursement, debt re-payment,
funding to key preceptors
Communication gaps/cultural
barriers with foreign-trained
physicians
a. Assess the needs of local providers to determine their
needs – training, resources, etc.
b. Assign a established physician as a mentor to foreign
trained physicians
Poor patient adherence a. Increase patient education
b. Provide walk-in clinics
c. Integrate mental health services in primary care
d. Develop a statewide health literacy program for local
communities to conduct.
Question 3: How does your organization currently identify unmet community health care needs?
Survey (3)
Direct discussion with constituents (4)
Research (4)
First-hand knowledge (3)
Secondary data (3)
Question 4: How does your organization currently address the needs of vulnerable populations?
Support for community health centers
Provision of technical assistance and training (5)
Advocacy efforts (3)
Emergency preparedness activities (2)
Workforce development programs such as J2 Waivers, National Health Service Corps
Partnerships with other organizations (4)
Community-based student learning opportunities drawing from vulnerable populations
Input from diverse group of board members
Grant funds that provide added technology, education, collaboration (3)
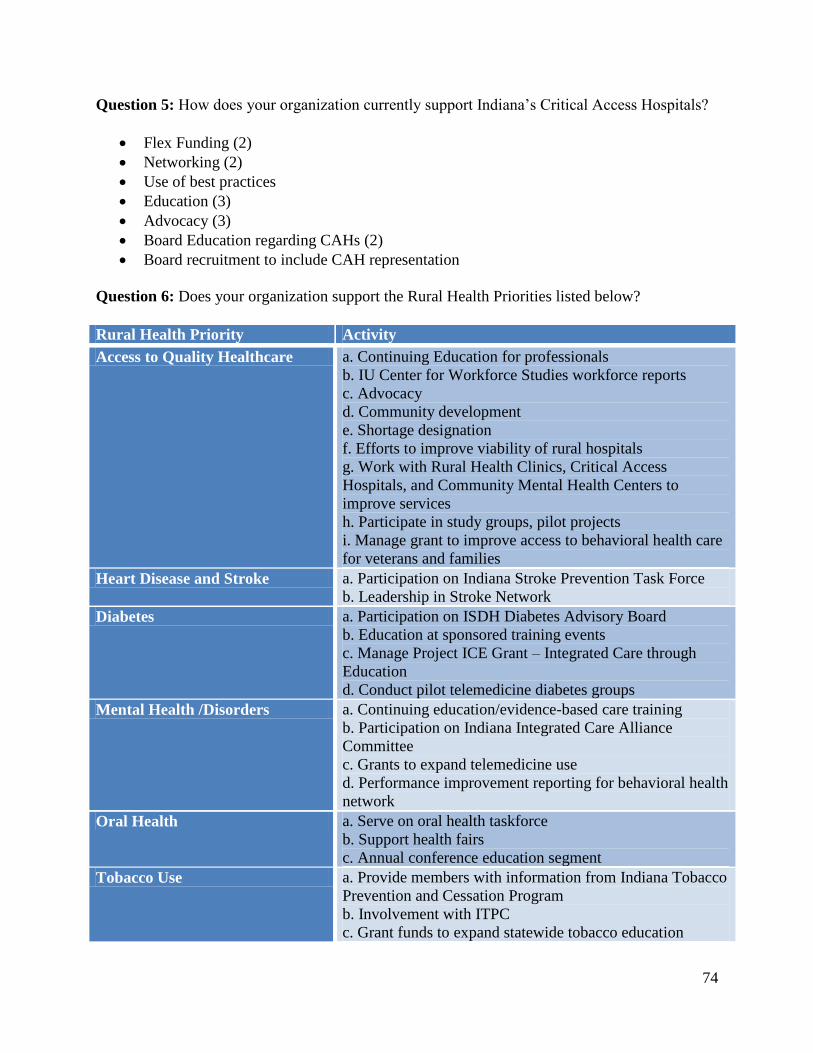
74
Question 5: How does your organization currently support Indiana’s Critical Access Hospitals?
Flex Funding (2)
Networking (2)
Use of best practices
Education (3)
Advocacy (3)
Board Education regarding CAHs (2)
Board recruitment to include CAH representation
Question 6: Does your organization support the Rural Health Priorities listed below?
Rural Health Priority Activity
Access to Quality Healthcare a. Continuing Education for professionals
b. IU Center for Workforce Studies workforce reports
c. Advocacy
d. Community development
e. Shortage designation
f. Efforts to improve viability of rural hospitals
g. Work with Rural Health Clinics, Critical Access
Hospitals, and Community Mental Health Centers to
improve services
h. Participate in study groups, pilot projects
i. Manage grant to improve access to behavioral health care
for veterans and families
Heart Disease and Stroke a. Participation on Indiana Stroke Prevention Task Force
b. Leadership in Stroke Network
Diabetes a. Participation on ISDH Diabetes Advisory Board
b. Education at sponsored training events
c. Manage Project ICE Grant – Integrated Care through
Education
d. Conduct pilot telemedicine diabetes groups
Mental Health /Disorders a. Continuing education/evidence-based care training
b. Participation on Indiana Integrated Care Alliance
Committee
c. Grants to expand telemedicine use
d. Performance improvement reporting for behavioral health
network
Oral Health a. Serve on oral health taskforce
b. Support health fairs
c. Annual conference education segment
Tobacco Use a. Provide members with information from Indiana Tobacco
Prevention and Cessation Program
b. Involvement with ITPC
c. Grant funds to expand statewide tobacco education

75
d. Years of supporting webinars, conference calls, process
improvement regarding screening
e. Development of online course addressing tobacco use and
mental illness
f. Integration of tobacco information into Certified
Recovery Specialist curriculum
Substance Abuse a. Support health fairs
b. Annual conference education segment
c. Provide continuing education for clinical staff
Educational &Community-Based
Programs
a. K-12: prevention clinic
b. Workshops on nutrition, weight management, stress
management and fitness for WorkOne clients
c. Participated in Indiana Coalition for Healthier Rural
Community focusing on access to care and tobacco
cessation
d. Participation in Community Health Engagement Program
to increase meaningful research
e. Hosted multiple programs
f. Conducts training for clinicians and community
Maternal, Infant & Child Health a. K-12: Focus on Health
b. Participation on Indiana Perinatal Network Advisory
Board
Nutrition & Overweight a. K-12: Charting Calories/ Discovery Digestive System
b. K-12: Nutrition and Exercise
c. Support health fairs
d. Provided numerous education offerings
e. Developed online course addressing nutrition and
diabetes
Cancer a. Continuing education
Public Health Infrastructure a. K-12: Introduction to careers in public health
b. Collaboration with IUPUI School of Public Health on
numerous community projects
Immunization & Infectious
Disease
a. K-12: STDs/STIs Myths Facts First Aid and Blood
b. Continuing education
c. Support health fairs
d. Dissemination of information regarding immunizations
e. Hosted conference call on improving immunization rates
f. Participation on Indiana Immunization Coalition Board
Injury & Violence Prevention a. Annual conference education segment
b. Partnership with companies like Pioneer Seed Corn to
improve farmer safety
Family Planning
Environmental Health
Other Contributions:
Internships, Research, Service Learning

76
This small group of respondents representing less than half of the Rural Roundtable members
generated a number of proposed solutions to rural health needs and demonstrated that they
actively work to make positive change in provider skills, workforce expansion, organizational
effectiveness, and health information dissemination. Collaboration was repeatedly mentioned as
supportive of increased impact and creative solution development. These organizations are
involved in multiple collaborations and are well-known to each other, serving as a rural nucleus
and forum for knowledge transfer and systems change. The outcome of this survey will serve as
a foundation for further discussion within the group.
Data from both the Critical Access CEO survey and the Rural Roundtable reinforce one another.
For example, issues of workforce recruitment and retention are presented through both surveys.
The increasing importance of health information technologies to fill gaps in specialist care was
identified in both. The need for continuing education for clinical practitioners and business
leadership is recognized by all. As communities face economic hardship and high-need
populations, the need for collaboration and creative solutions becomes even more evident.

77
Section V. Moving Toward a High Performance Rural Health Care System
The Indiana State Office of Rural Health
Established in 1992, the State Office of Rural Health (SORH) is located in Indiana State
Department of Health’s (ISDH) Primary Care Office (PCO). The mission of the SORH is to
enhance the growth of public health services, funding sources, and educational opportunities for
every rural Hoosier. The SORH lost its director in July of 2009 and will not be able to offer a
state employee position to the replacement rather; a contractual position has been created. A
full-time FLEX Coordinator position has been contractually created and is half funded with the
SORH grant. The SORH operates with the Director of the PCO and a Grants Manager who
serves as the SHIP Project Director as well as supporting general SORH activities. Additional
operational and programmatic support is provided by the Office of Primary Care Manager
through underserved area designation activities affecting National Health Service Corps
placements in rural areas, the ISDH Finance Department that provides accounting and financial
management of the SORH grant fund, and the ISDH Contract Division that assists contract
execution through the state process. The PCO Director currently oversees the SORH, Flex, and
SHIP programs. The PCO Contracts and Grants Manager administers the SHIP program for the
office. The state program meets the program requirements of the authorizing statute.
The SORH operates within the PCO and as such is able to leverage its federal and state funds in
a more effectively to better serve all Indiana rural residents. Complementary--internal partners
and programs within the PCO include the J-1 Visa Waiver Program, State Funded Programs for
Community Health Centers, State Loan Repayment Program, National Health Service Corps,
Shortage Designations, Trauma, Injury Prevention, and Spinal Cord and Traumatic Brain Injury
Research.
External Partners
The SORH works with external key partners to address rural health needs. These external
partnerships broaden the SORHs capacity to enable core and additional statutory functions aimed
toward improving access to health care and addressing health deficits.
35 Critical Access Hospitals
Indiana Rural Health Association (IRHA)
Indiana Hospital Association (IHA)
Affiliated Service Providers of Indiana, Inc. (ASPIN)
Richard G. Lugar Center for Rural Health
Emergency Nurses Association (ENA)
Indiana Statewide Rural Health Network (InSRHN)
Area Health Education Center Program (AHEC)
Telehealth Advisory Consortium (TAC)
Indiana Health Information Exchange (IHIE)
Indiana Primary Health Care Association (IPHCA)
Indiana Department of Homeland Security
Indiana Criminal Justice Institute (ICJI)

78
Indiana Trauma Task Force
Health Care Excel (HCE)
Bowen Center for Health
Indiana Bioterrorism and Preparedness Task Force
Indiana Rural Health Association (IRHA)
Indiana Hospital Association (IHA)
Emergency Nurses Association (ENA)
Indiana Statewide Rural Health Network (InSRHN)
The SORH’s primary and collaborative partner is the IRHA. The office provides state, FLEX and
SORH funds in support of the annual IRHA Rural Conference, various publications, and
workshops. Through IRHA the SORH provides rural residents of Indiana the latest perspectives on
local, state, regional, and national rural health initiatives. IRHA facilitates communication via site
visits to CAHs for the purpose of determining individual technical assistance needs and community
perspectives. This year the SORH is contracting with IRHA to provide a full-time FLEX
Coordinator who will aid the fledgling FLEX Advisory Committee that was formed in August of
2009. Through IRHAs expertise, the SORH is increasing its reach into the CAHs and other rural
serving entities. To accomplish this, IRHA is implementing data collection and evaluation
activities to monitor and modify, as needed program planning, implementation, and evaluation
efforts to assess progress toward the desired outcomes among rural health centers.
The SORH and the Indiana Hospital Association (IHA) have a productive working relationship
which allows SORH to stay abreast of hospital insider concerns and opportunities. IHA holds a
―Council on Rural‖ for all chief executive officers of CAHs and rural hospitals. At each of these
meetings, SORH staff present findings on the most recent events and on assistance provided by
SORH. IHA uses data collected by ISDH and SORH to address the needs of CAHs. IHA serves as
a financial information warehouse and has shared information with other rural partners, including
the SORH, IRHA, and CAH staff.
The Lugar Center for Rural Health has evolved as a tripartite partner in the areas of health care
delivery, telemedicine and workforce development. Recently the SORH has partnered with the
Lugar Center for Rural Health on telehealth and telemedicine projects. Other
telehealth/telemedicine partners include TAC and IHIE.
The SORH began working with ASPIN to explore behavioral and mental health issues pertaining
to rural Hoosiers and has evolved into a rural health planning partner. ENA and the Indiana
Trauma Task Force continue to enable the office to stay up to date on issues pertaining to
emergency care and trauma system development. Indiana’s Governor established a formal Trauma
Committee by executive order this year. Partnerships have been established among SORH, AHEC,
IPHCA (3RNet), and the Bowen Center for Health. AHEC and IPHCA represent the workforce
recruitment and retention arm of Indiana, while the Bowen Center provides workforce research.
The InSRHN, a subsidiary organization of IRHA, and SORH are working to meet rural health
network needs. These needs include increased financial viability and sustainability among
Indiana’s rural healthcare providers that will ensure access to care for rural residents; increased
access and use of Health Information Technology among Indiana’s rural health care providers;
increased connectivity among Indiana’s rural health care providers that will enable the sharing of
resources, services, implementation and participation in education programs, and increases in

79
quality improvement activities among Indiana’s rural health care providers. InSRHN had its first
Board Retreat on February 12, 2009.
IPHCA has assisted the Primary Care Office (PCO) with developing clinical, governance,
administrative, and financial standards for community health centers, 11 of which are designated as
rural health clinics. IPHCA will assess the centers once standards are formally adopted in 2009, a
final report of findings will be submitted.
SORH and the PCO continue to capitalize on the opportunities present in local collaborations.
IPHCA is assisting with community health center and local health department collaborations.
IPHCA assists the PCO with providing data and support for National Health Service Corps
activities, for health professional shortage area/medically underserved populations area
designations, and J-1 visa waiver applications.
IPHCA is the 3RNet entity in Indiana. 3RNet is made up of organizations such as State Offices of
Rural Health, AHECs, Cooperative Agreement Agencies and State Primary Care Associations.
These not-for-profit organizations help health professionals locate practice sites in rural and
underserved areas throughout the country. Grant monies will be used to ensure outreach to rural
providers.
The PCO/SORH is assessing how future state and federal resources should be deployed using
medically underserved areas (MUAs), health professional shortage areas and both internal and
publicly available data sets as components of an evaluation. The PCO, ISDH Geographic
Information System (GIS) specialists, IPHCA and the SORH have formed a workgroup and will
engage other community and federal partners once an access plan on the basis of the evaluation is
drafted. Recommendations from this workgroup will be presented to the state health commissioner
for her determination of where programmatic resources could be posited based on a geographically
displayable definition of need, accessibility and health status.
In addition to ensuring a broad base of expertise to advise the direction of the program, the Indiana
SORH is committed to the utilization and collection of data for assisting decision making and
grants management. Every grant managed by the Indiana State Department of Health (ISDH)
focuses on at least one of four health initiatives established by State Health Commissioner. The
health initiative met through the SORH grant is the collection of data to promote ISDH’s Data
Driven Initiatives and Policies. The data collected through SORH initiatives will be disseminated
to ISDH, as well as to rural health partners and will be posted on SORH’s website for the public.
State Matching Fund Support
State funds pay for the time the PCO Director and Contract Manager devote a total .4 FTE to the
SORH and Flex Programs ($82,670) which strengthens state and local partnerships as a result of
the programs the PCO oversees. In addition, state funds provide resources ($889,500) to rural
health clinics through the Richard Lugar Center for Rural Health and Hoosier Uplands which, in
addition to eight other clinics serve 46,000 rural patients a year. Grant funds for these rural health
centers are awarded based on state funding criteria. The Indiana Rural Health Plan is a living
document that captures the economic, workforce, and health care needs of counties served by
Indiana’s critical access hospitals. The needs assessment processes used informed the SORH
regarding areas that can be addressed through Flex funding and set the tone for the office’s future

80
collaborations. Indiana’s rural populations are at the center of multiple forces that can work in
concert to improve and sustain health. Indiana is fortunate to have established partnerships on a
statewide level that are focused on issues of workforce development, quality service delivery,
patient safety, emerging telehealth connectivity, data gathering and analysis, training, and
collaboration.
Movement toward an integrated system of care is especially challenging in rural areas as many
essential services (e.g., hospital and physician services, behavioral health, dental care, and EMS
services) are not available in many small communities. As a result, it is critical to develop linkages
with providers in other communities and to use the technology as effectively as possible. The
SORH maintains interest and support for emerging technologies and models of cooperation that
bring high quality coordinated and culturally sensitive care to Indiana’s rural populations while
supporting viable revenue streams for providers.
Through a review of secondary sources as well as through a dual survey process of key rural health
leaders and statewide organizations addressing rural health care, the Plan establishes five directives
to be addressed in its work plan. These include (1) support collaborative solutions to issues of rural
health service quality and access, (2) provide equitable and accountable funding strategies for
appropriate projects resulting in improved care and/or provider accountability for rural citizens, (3)
utilize existing expertise already working on rural health issues to the greatest degree possible, (4)
aid in accountability of clinical practice and financial acumen of rural providers, and (5) act as a
conduit of accurate information to and from critical access hospitals, rural providers, training
experts, and state policy makers.
Within these broad directives, the goals of the various funding bodies that support the work of the
State Office of Rural Health are assured. In addition, the goals are in alignment with Flex Goals,
the Healthy People 2020 Goals, and the Ten Essential Public Health Services. The following
graphic demonstrates the interplay of these initiatives. The impact of the development of the
Indiana Rural Health Plan and the distribution of Flex funding in the current year is in alignment
with local and national priorities. The Indiana Rural Health Plan is a catalyst for forward
movement of initiatives and collaborations in place within the state through integration of
programmatic goals, cross-discipline training, information exchange, and partnership development.
The following graphic demonstrates the ways in which all efforts undertaken by the State Office of
Rural Health are complementary in terms of moving the focus areas of funders and stakeholders
forward through its various initiatives.
Figure 53. Goals Integration.
State Rural Health
Plan Theme
State Rural Health
Plan Goal
Flex Core Areas Healthy People
2020/Rural
Healthy People
2010 Goal
Alignment
Public
Health
Essential
Services
Alignment 1. Support
collaborative solutions
to issues of rural health
services quality and
access.
Coordination of
rural health
resources and
activities Statewide.
Support for Health
System Development and
Community Engagement
Statewide CAH Quality
Program for CAH
Readmissions
HP 1, 2, 3, 4
RHP 1 - 12
3, 4, 5, 7, 8

81
2. Provide equitable
and accountable
funding strategies for
appropriate projects
resulting in improved
care and/or provider
accountability for rural
citizens
Provision of
technical assistance.
Provides contract
management
oversight to all
partners receiving
rural health funding
through SORH,
FLEX and SHIP. Is
the fiscal agent for the
HIT-CAH grant.
Support for Operational
and Financial
Improvement
Statewide CAH Reporting
Program
HP 1, 2, 3, 4
RHP 1-12
4, 5, 9, 10
3. Utilize existing
expertise already
working on rural
health issues to
greatest degree
possible.
Provision of
technical assistance.
Support rural health
partners as needed.
Support for Health
System Development and
Community Engagement
Statewide CAH
Educational Programs
HP 2, 3, 4
RHP 1, 2, 3,
1, 4, 8, 9, 10
4. Aid in
accountability of
clinical practice and
financial acumen of
rural providers.
Provision of
technical assistance.
Support rural health
partners as needed.
Support for Quality
Improvement
Statewide CAH Reporting
Program
Statewide CAH Quality
Program for CAH
Readmissions
HP1,2, 3, 4
RHP 2-12
1, 2, 3, 5, 6, 8,
9, 10
5. Act as conduit of
accurate information to
and from Critical
Access Hospitals, rural
providers, training
experts, and state
policy makers.
To improve
collection and
dissemination of
information.
Support for Health
System Development and
Community Engagement
Statewide
Videoconferencing and e-
learning Program
HP 1, 2, 3, 4
RHP 1 - 12
1, 3, 4, 5, 6, 8,
10

82
The Indiana Rural Health Work Plan for 2011-2012 creates movement across 5 key themes
identified through survey processes. These themes include:
a. Support collaborative solutions to issues of rural health services quality and access.
b. Provide equitable and accountable funding strategies for appropriate projects resulting
in improved care and/or provider accountability for rural citizens
c. Utilize existing expertise already working on rural health issues to greatest degree
possible.
d. Aid in accountability of clinical practice and financial acumen of rural providers.
e. Act as conduit of accurate information to and from Critical Access Hospitals, rural
providers, training experts, and state policy makers.
This plan is meant to be a working document that will expand and contract as work is completed
and new projects added under each theme. For example, the project column contains a minimum
set of projects to be accomplished, however, new ones can be added as issues emerge or are
resolved. In this way, this year’s work plan essentially provides input for that of the following
year.
Alignment with Wider Initiatives
Healthy People 2020 Goals
All rural initiatives developed and/or supported through the Indiana State Office of Rural Health
are in support of the four primary goals outlined in Healthy People 2020 which provides a 10-
year agenda for improving the nation’s health.
Healthy People 2020 strives to identify nationwide health improvement priorities, increase
public awareness and understanding of the determinants of health, disease, and disability and the
opportunities for progress. It also provides measurable objectives and goals that are applicable at
the national, state, and local levels. Its aim is to engage multiple sectors to take actions to
strengthen policies and improve practices that are driven by the best available evidence and
knowledge. In addition, the initiative seeks to identify critical research, evaluation, and data
collection needs. Healthy People 2020 established four overarching goals:
1. Attain high quality, longer lives free of preventable disease, disability, injury, and
premature death;
2. Achieve health equity, eliminate disparities, and improve the health of all groups;
3. Create social and physical environments that promote good health for all;
4. Promote quality of life, healthy development, and healthy behaviors across all life
stages
Rural Healthy People Goals
The Rural Healthy People 2010 report is intended to inform constituents regarding current rural
health conditions and provide insights into possible methods to improve rural health conditions.
The report is a companion to Healthy People 2010, and identifies ten areas of health concern
especially prevalent in rural areas. These include: (1) access to insurance, (2) access to primary
care, (3) access to emergency medical services, (4) heart and stroke, (5) diabetes mellitus, (6)

83
mental health and mental disorders, (7) oral health, (8) tobacco use, (9) substance abuse, (10)
maternal infant and child health, (11) nutrition and overweight, and (12) cancer. These are issues
noted in surveys of Critical Access Hospitals and statewide associations as ones that are of great
concern in Indiana at this time. The updated version, Rural Healthy People 2020 has not been
released as of this writing.
The Essential Public Health Services
The Essential Public Health Services (1994)3 provide a fundamental framework by describing the
public health activities that should be undertaken in all communities. The Core Public Health
Functions Steering Committee developed the framework for the Essential Services in 1994. This
steering committee included representatives from US Public Health Service agencies and other
major public health organizations.
The Essential Services provide a working definition of public health and a guiding framework
for the responsibilities of local public health systems. The Indiana Office of Rural Health relates
these ten essential services to its efforts.
1. Monitor health status to identify and solve community health problems.
2. Diagnose and investigate health problems and health hazards in the community.
3. Inform, educate, and empower people about health issues.
4. Mobilize community partnerships and action to identify and solve health problems.
5. Develop policies and plans that support individual and community health efforts.
6. Enforce laws and regulations that protect health and ensure safety.
7. Link people to needed personal health services and assure the provision of health care
when otherwise unavailable.
8. Assure competent public and personal health care workforce.
9. Evaluate effectiveness, accessibility, and quality of personal and population-based
health services.
10. Research for new insights and innovative solutions to health problems.
Rural Health Work Plan Summary
The impact of the development of the Indiana Rural Health Plan and the distribution of Flex
funding in the current year is in alignment with several national priorities, notably those that
support improved emergency medical care through training regarding trauma response, through
support for telehealth expansion to meet specialist demand in emergency care, and through
careful assessment of rural health care needs and focus on removing disparities in care and
access. The Indiana Rural Health Plan is a catalyst for forward movement of initiatives and
collaborations in place within the state.

84
References
Public Health Functions Steering Committee, Members (1994). The ten essential public health
services. Retrieved August 18, 2009, from
http://www.cdc.gov/od/ocphp/nphpsp/essentialphservices.htm
U.S. Department of Health and Human Services. (2010).Healthy People 2020.Retrieved from
www.healthypeople.gov.

85
VI. Summary
Previous Sections of this plan have described many barriers and challenges to delivering health
care services in rural Indiana. For example, in some areas there is not a sufficient supply of
health professionals to care for complex and chronic populations. Also, most areas have lost
revenue because of challenging economic times. Finally, most areas have not developed a well-
coordinated and integrated health care delivery system offering medical homes and team
approaches to service delivery.
A rural integrated health system is based on the following assumptions:
1. An integrated system requires accurate data, planning, communication systems, and
methods applicable to the needs of specific geography and populations.
2. Multiple and diverse approaches are necessary because of the differences in the needs of
the population, the economic characteristics of the area, and the local culture.
3. Integrated systems should foster cooperation, collaboration, and integration of
services and activities, including innovative technology such as telecommunication.
4. Although the planning of an integrated system should begin at the community level, the
collaborative network must be expanded to include other hospitals, physician and dental
clinics, pharmacies, EMS units, nursing homes, behavioral health services, and public
health services in a region. It must also extend to regional and urban centers because rural
patients need the specialized services offered in larger communities.
5. All integrated systems should develop performance measures based on the six quality
aims (safety, effectiveness, patient-centeredness, timeliness, efficiency, and equity) that
were developed by the Institute of Medicine (2005) to evaluate the overall performance
of each health care delivery system.
6. An integrated system should focus on both population health and personal health.
Providers in rural Indiana communities often practice independently of one another. This lack of
coordination is frequently the result of previous practice models and of poor communication. It is
magnified by the shortage of health professionals and frequent referrals or transfers to providers
in larger communities. As a result, many patients and families must navigate unassisted across
different providers and care settings. The lack of communication and clear accountability for a
patient among multiple providers may lead to medical errors, waste, and duplication of care
(Shih, Davis, Schoenbaum, Gauthier, Nuzum, & McCarthy, 2008).
According to the Commonwealth Fund Commission on a High Performance Health System
(2008), there are six attributes of an ideal health care delivery system. These attributes are:
1. Patients’ clinically relevant information is available to all providers at the point of care
and to patients through electronic health records.
2. Patient care is coordinated among multiple providers, and transitions across care settings
are actively managed.
3. Providers (including nurses and other members of care teams) both within and across
settings have accountability to each other, review each other’s work, and collaborate to
reliably deliver high-quality, high-value care.

86
4. Patients have easy access to appropriate care and information, including after hours; there
are multiple points of entry to the system; and providers are culturally competent and
responsive to patients’ needs.
5. There is clear accountability for the total care of patients.
6. The system is continuously innovating and learning in order to improve the quality,
value, and patients’ experiences of health care delivery.
A system with these attributes is likely to be more achievable in rural areas for many reasons.
Rural health care systems are smaller and can be coordinated more quickly. Rural providers are
generally more knowledgeable about and more familiar with their patients. Some emerging
systems of care have the potential to achieve this ideal because of excellent leaders, existing
associations, and cooperative alliances capable of guiding the development of these new delivery
systems within the state of Indiana.
Figure 54. The Community-Based Health Network.
87
It is clear that community health and health care are influenced by multiple institutions and
influences upon a given community. Indiana’s rural populations are at the center of multiple
forces that can work in concert to improve and sustain health. Indiana is fortunate to have
established partnerships on a statewide level that are keenly focused upon issues of workforce
development, quality service delivery, patient safety, emerging telehealth connectivity, data
gathering and analysis, training, and collaboration.
Movement toward an integrated system of care is especially challenging in rural areas as many
essential services (e.g., hospital and physician services, behavioral health, dental care, and EMS
services) are not available in many small communities. In addition, the needs of each community
are unique. The challenge to planning is to provide sufficient latitude for individual communities
to find relevant and effective solutions to address the special populations and unique
demographics present within their service areas. As a result, it is critical to develop linkages with
providers in other communities and to use the technology as effectively as possible. The State
Office of Rural Health maintains interest and support for emerging technologies and models of
cooperation that bring high quality coordinated and culturally sensitive care to Indiana’s rural
populations while supporting viable revenue streams for providers.
References
Institute of Medicine (2005). Quality Through Collaboration: The Future of Rural Health.
Washington, DC: The National Academies Press.
Shih, A., Davis, K., Schoenbaum, S., Gauthier, A., Nuzum, R., & McCarthy, D. (August 2008).
Organizing the U.S. Health Care Deliver System for High Performance. New York, NY:
The Commonwealth Fund.
The Medicare Rural Hospital Flexibility Steering Committee (2008).Nebraska Rural Health
Plan.

88
Appendix A – Survey Forms
1. Critical Access Hospital Survey 2011
2. Statewide Associations Focus Group Survey

89
Appendix A
Indiana State Department of Health Survey of Critical Access Hospitals (2011)
The Critical Access Survey is divided into five sections that can be forwarded as
distinct survey links. In this way, each hospital CEO may forward a link for a given
section to a key informant most able to respond accurately to that section. The CEO
is primarily responsible for assuring that all sections are completed in a timely
manner.
Section 1 – Administrative
1A. Name of Organization:
2A. Rank your organization’s greatest concerns as you look forward to the next two years
Please number each box in order of preference from 1 to 15.
Health Care Reform Impacts
Reimbursement
Recruiting/Retaining Physicians
Expansion of Services
Rules and Regulations
Financial Performance
Recruiting/Retaining Nurses
Strategic Planning
Succession Planning
Information technology
Electronic Medical Records
Telemedicine
Patient Safety
Health Outcomes
Other
3A. If you selected "Other" in the previous question, please list it here.
4A. What vulnerable populations require special considerations regarding care in your
facility? Please identify.
5A. How does meeting the needs of the population listed above affect your services?
Please explain.
6A. Do you currently submit data to Hospital Compare through the U.S. Department of
Health and Human Services?
Yes
No

90
7A. If yes to the above question, how many data sets do you submit?
8A. Do you share statistics with other outside entities?
Yes
No
9A. If yes to the above question, list those entities.
Entity One
Entity Two
Entity Three
Entity Four
Entity Five
10A. How is data transmitted to the outside entities?
Entity One
Entity Two
Entity Three
Entity Four
Entity Five
11A. Check all benchmarking systems to which your organization provides data
Please choose all that apply:
IRHA/RPM/Performance Management Institute benchmarking tool
Indiana Hospital Association
Healthcare Excel KART Tool
Other:
12A. What are the three primary unmet community healthcare needs of citizens in your
community?
13A. How can the FLEX Program assist in addressing these needs? List one strategy for
each concern cited above.
14A. In what ways do you interact with the local health department? Choose all that
apply.
County Preparedness Activities
Shared Immunization Clinics
Shared Labs/Lab Services
Shared Staff
15A. What, if any, Health Information Technology devices do you currently use? Choose
all that apply.
Electronic Health Records
Telehealth assessment/triage
Telemedicine consultation

91
Web conferencing
Webinar trainings
Other:
16A. What are the barriers to your telehealth/telemedicine goals? Choose all that apply.
None
Financial Constraints
FCC Match
Connectivity
Bandwidth
Staff training/support
Board Support
IT Support
Billable Rates
Staff time for implementation
Lack of physician support
17A.Please provide additional comments here.
Section 2 – Financial
1F. Name of Organization:
2F. What is your payor mix (by percentage, total should equal 100%)?
● Medicaid
● Medicare
● Commercial
● Uninsured/Self
● Charity
3F. Has local funding been cut to your facility?
● Yes
No
4F. If local funding has been cut, estimate the extent from each source.
Please choose all that apply and provide a comment:
● State Dollars:
● County Dollars:
● Other:
5F. Has your organization taken on new services due to local government spending
reductions?
● Yes
● No

92
6F. If yes to the previous question, which services has your organization added or
expanded?
7F. Has your organization discontinued any services due to changes in funding?
● Yes
● No
8F. If yes to the above question, which services were eliminated?
9F. Have plant closings, downsizings, and/or business failures in your communities
impacted your hospital’s payor mix since July 2009?
● Yes
● No
10F. If yes to the previous question, list each company and estimated job losses since
July 2009.
Please choose all that apply and provide a comment:
● Company One (jobs lost)
● Company Two (jobs lost)
● Company Three (jobs lost)
● Company Four (jobs lost)
● Company Five (jobs lost)
11F. Please provide additional comments here. Section 3 – Human Resources
1H. Name of Organization:
2H. What is your overall personnel turnover rate expressed as FTEs?
3H. Has your organization conducted a recent RIF due to economic trends since July
2009?
● Yes
● No
4H. If yes to the above question, how many FTEs were released?
5H. On average, how many full-time positions are open in a given week?
6H. On average, how many part-time positions are open in a given week?
7H. What essential positions are hardest to recruit?
Please choose all that apply:
Nurses

93
Primary Care Physicians
Advanced Practice Nurses
Specialty care MDs
Pharmacists
Psychiatric Nurses
8H. If Specialty MDs was checked above, please specify.
9H. What types of training resources are most often used by staff at your facility? Check
all that apply.
Please choose all that apply:
Webinars
Teleconferences
Training workshops (internal)
Training workshops (external)
Self-paced online courses
Assigned reading/manuals
Staff meetings
Other:
10H. From which of the following training topics would your organization most benefit?
Please choose all that apply:
Claims processing
Payment Policy
NPI-National Provider Identification
Enrollment in payer programs
Management in Changing Times
Accreditation Support
Integration of Medical and Behavioral Health Services
Health Care Reform
Cultural Competency
Health Literacy
Telemedicine
Other:
11H. Do you currently have contracts with third party organizations for staff training?
If the answer is yes to Question 10, please complete Questions 12, 13, 14, and 15. If no,
you may skip to Question 16.
12H. Please identify the third party organization(s).
13H. Are these trainings:
All Mandatory ___yes ___no
All Voluntary ___yes ___no

94
Mixture of Mandatory and Voluntary ___yes ___no
14H. Are these trainings:
Traditional Face-to-Face ___yes ___no
Web-based (webinars or teleconference) ___yes ___no
Online courses ___yes ___no
15H. Please provide an estimate of total training budget for your facility.
16H. Please provide additional comments here.

95
Appendix A
Rural Roundtable Survey for Indiana Office of Rural Health State Plan Organization:
________________________________________Date:____________________
1. From your perspective, what are the major barriers facing rural health care
“consumers” in Indiana and what solutions would you recommend to address these
issues?
2. From your perspective, what are the major barriers facing rural health care
―providers” in Indiana and what solutions would you recommend to address these
issues?
3. How does your organization currently identify unmet community health care needs?
4. How does your organization currently address the needs of vulnerable populations?
5. How does your organization currently support Indiana’s Critical Access Hospitals?
6. Does your organization support the Rural Healthy Priorities identified in Rural Healthy
People 2010 listed below? Check all that are a focus and briefly list the activities you conduct
that support each priority.
_____Access to Quality Healthcare
Activity:___________________________________________________________________
______Heart Disease and Stroke
Activity:___________________________________________________________________
______Diabetes
Activity:___________________________________________________________________
______Mental Health & Mental Disorders
Activity:___________________________________________________________________
______Oral Health
Activity:___________________________________________________________________
_____Tobacco Use
Activity:___________________________________________________________________
______Substance Abuse
Activity:___________________________________________________________________
______Educational & Community Based Programs
Activity:___________________________________________________________________
______Maternal, Infant & Child Health
Activity:__________________________________________________________________
______Nutrition & Overweight
Activity:___________________________________________________________________
______Cancer
Activity:___________________________________________________________________
______Public Health Infrastructure
Activity:___________________________________________________________________
______Immunization & Infectious Disease

96
Activity:___________________________________________________________________
______Injury & Violence Prevention
Activity:___________________________________________________________________
______Family Planning
Activity:___________________________________________________________________
______Environmental Health
Activity:___________________________________________________________________
Please return to Martha Levey ([email protected]). Thank you for your input.

97
Appendix B – Work Plans
1. Goals Alignment Framework
2. Indiana State Office of Rural Health Work Plan
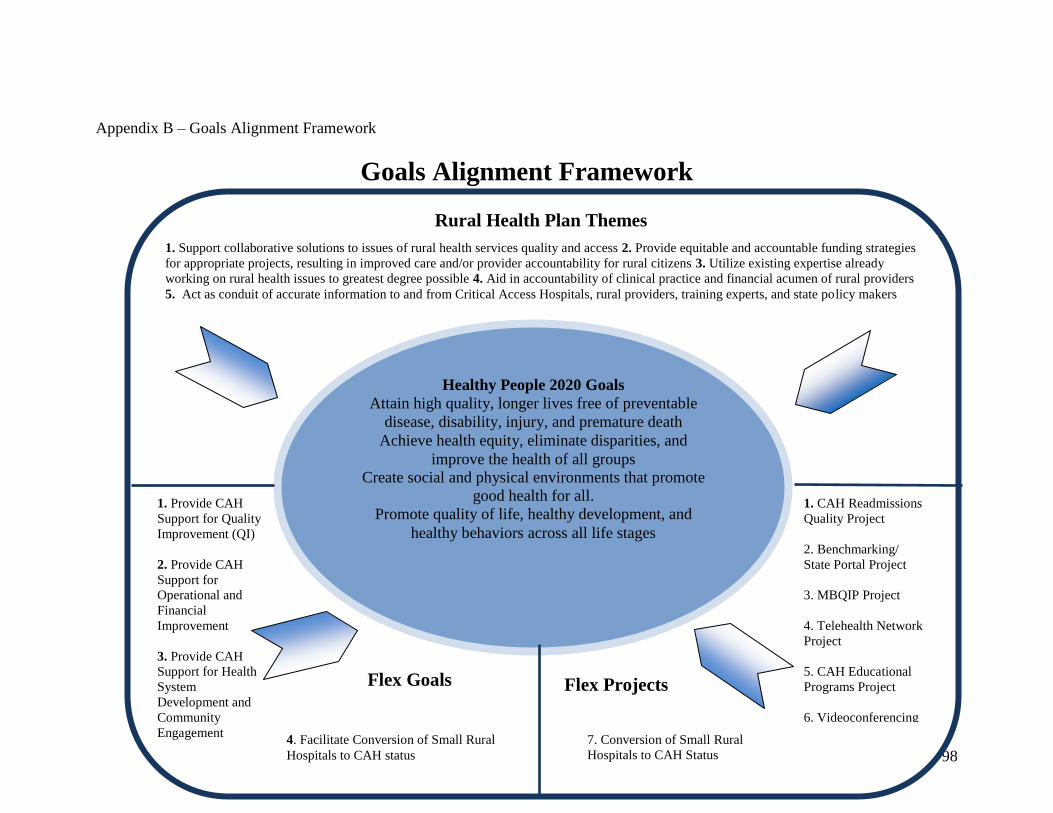
98
Healthy People 2020 Goals
Attain high quality, longer lives free of preventable
disease, disability, injury, and premature death
Achieve health equity, eliminate disparities, and
improve the health of all groups
Create social and physical environments that promote
good health for all.
Promote quality of life, healthy development, and
healthy behaviors across all life stages
Appendix B – Goals Alignment Framework
Goals Alignment Framework
1. Support collaborative solutions to issues of rural health services quality and access 2. Provide equitable and accountable funding strategies
for appropriate projects, resulting in improved care and/or provider accountability for rural citizens 3. Utilize existing expertise already
working on rural health issues to greatest degree possible 4. Aid in accountability of clinical practice and financial acumen of rural providers
5. Act as conduit of accurate information to and from Critical Access Hospitals, rural providers, training experts, and state policy makers
Rural Health Plan Themes
1. Provide CAH
Support for Quality
Improvement (QI)
2. Provide CAH
Support for
Operational and
Financial
Improvement
3. Provide CAH
Support for Health
System
Development and
Community
Engagement
4. Facilitate Conversion of Small Rural
Hospitals to CAH status
Flex Goals
1. CAH Readmissions
Quality Project
2. Benchmarking/
State Portal Project
3. MBQIP Project
4. Telehealth Network
Project
5. CAH Educational
Programs Project
6. Videoconferencing
and E-Learning Project
7. Conversion of Small Rural
Hospitals to CAH Status
Flex Projects

99
2011 - 2012 Budget Period Plan and Performance Measures
Core Function (1): Collection and Dissemination of Information
Objective:
1. Collect and disseminate information concerning rural health.
2. Provide up to date education, alerts and communication through several mediums
3. Provide a forum through which partners will focus on rural issues and participation as
appropriate for individual missions, including healthcare delivery, education,
workforce development and public health support.
Product/Service/Activity: 1. Update and distribute the Rural Health Plan through ASPIN ($30,000.)
2. Sponsor the IRHA conference ($30,000);
3. SORH staff will attend regularly scheduled partner meetings and will continue to
convene the Rural Health Round Table that more directly focuses partners on rural
issues.
Projected Progress:
1. The plan will be distributed electronically to the public and partners
2. IRHA will host a conference for its 1600+ members.
IRHA’s Annual Conference brings together physicians, nurses, pharmacists, public
health professionals, and other rural health practitioners and advocates with residents
of rural communities. Practitioners from the field and national experts discuss current
topics, as well as share the experiences of others in public health and rural health care
delivery, along with the latest information regarding the start-up and on-going
management of rural health care delivery models.
3. Meeting attendance will present funding opportunities, research, and policy updates
Process Measures:
1. The plan will provide updated rural health pertinent statistics, analyses, and
intervention strategies that will be distributed to partners and the public electronically
and via its website and those of partners. The State has restricted marketing and
communication expenditures and requires they be the exception when disseminating
information.
2. Develop a multi-partner collaboration with a rural focus including internal partners
the Chronic Disease Division, Immunization Division, the Cancer Registry, and the
Division of Physical Activity and Nutrition.
3. 465 individuals attended the 2010 IRHA Annual Conference; therefore, the turnout
for the 2011 event is expected to be strong as well. It will be conducted over 2 days
in June and will include 2 keynote speakers, five concurrent session tracks,
networking opportunities, poster presentations, and exhibits and displays by leading
health care providers and vendors. Tracks for the 2011 conference will be similar to
last year’s, i.e. quality improvement, health information technology, clinical
education, leadership initiatives, and emergency/disaster preparedness.

100
Projected Qualitative Impacts:
1. Indiana’s rural health profile and strategies for improvement will educate rural
residents and elevate rural issues in the state.
2. Common projects with will convey consistent messages through websites, webinars,
and gatherings and deploy resources in areas of greatest need. Multiple affiliations
will keep rural health on the agenda of important components of health care delivery
and economic development.
3. IRHA Annual Conference attendees will make new connections, acquire new
information that will be useful to their health care endeavors.
Core Function (2): Coordination of Rural Health Resources & Activities Statewide-
Objective:
1. Use webinars (ISDH and IRHA capabilities) for educational activities.
2. Assess CAH/RHC needs and distribute funds accordingly.
3. SORH attendance at meetings, participation in research informing resource
distribution.
4. Increase rural resident access to health care.
Product/Service/Activity:
1. Webinar topics of interest to CAHs and RHCs will be aired.
2. ASPIN will investigate and document CAH needs through a survey and by supporting
the FLEX Advisory Committee meetings.
3. SORH will analyze the impact of new rules for shortage area designations, examine
the effect of J-1 Visa Waiver determinations on rural providers, and increase rural
participation in the state loan repayment program.
4. Fund Hoosier Uplands 3 rural health clinics and the Lugar Center for Rural Health
with state matching funds ($889,500.)
Projected Progress:
1. Create and air a webinar of interest
2. Include survey/meeting results in the Rural Health Plan Update that will inform future
funding distribution.
3. Use state resources for activities in # 3 above. The designation analysis will be based
on when/if a new rule is issued. Partners will be used to advise the J-1 process and to
market the state loan repayment program.
4. The rural community health centers and rural health clinics will provide health care to
residents on a sliding fee scale.
Process Measures:
1. A webinar experience will be evaluated for effectiveness.
2. Resources will be deployed according to documented need.
3. State resources will be distributed in concert with rural needs.
4. CHCs and RHCs have become increasingly critical in rural areas as population
seeking care has increased.

101
Projected Qualitative Impacts:
1. Webinars will become a new, efficient way to bring rural partners together.
2. Rural health providers will become more informed, be assisted in quality
improvement projects and improve their overall health care delivery.
3. Access to health care in rural areas will be improved.
4. The health status of rural residents will improve.
Core Function (3): Provision of Technical Assistance-
Objective: 1. Use resources to assist rural providers become certified for meaningful use of EHRs.
2. Assist rural providers and residents with questions about underserved/health
professional shortage area designations and programs for which they are prerequisite.
3. Discover and prioritize areas for technical assistance
Product/Service/Activity: 1. The SORH will contract ($30,000) with the Regional Extension Service, I-HITEC to
provide on-site workshops for CAHs in preparation for meaningful use of electronic
health records.
2. The Office of Primary Care will provide information and assistance.
3. The SORH Manager, ($55,000) will visit CAHs and RHCs and help prepare
databases and analyses needed to distribute and track funding, subcontractor
performance and research informing rural issues.
Projected Progress:
1. At least 10 hospitals will be assisted on site. Video-tape sessions for webinars.
Hospital staff will be able to see his/her function in context and relative to what is
being required by the EHR use standard.
2. Approximately half of the designations will be rural.
3. The SORH Manager will organize and track assistance and outcomes for all
subcontractors and beneficiaries, CAHs and RHCs.
Process Measures: 1. The workshops feature analysis of the current state of EHR use within the
participating hospital and education on each of the 24 objectives that hospitals must
meet in Stage One.
2. Rural designations will increase.
3. The SORH will deliver resources based on informed need and best practice.
Projected Qualitative Impacts:
1. 10 additional hospitals will be better prepared to institute EHRs.
2. Indiana will be able to attract additional providers to practice in rural, underserved
areas.
3. Rural serving organizations will be better prepared to improve the health of residents.

102
Additional Function (4): Encourage Recruitment and Retention of Health Professionals
in Rural Areas-
Objective:
1. Increase and retain our ―home grown‖ health care professionals who may serve in a
variety of rural care settings.
2. Increase rural recruitment and retention activities in Indiana
Product/Service/Activity:
1. Fund AHEC’s annual conference ($19, 825.)
2. ARRA and PCO projects benefitting rural health due to collaboration with AHEC
and, primary care office; IPHCA: recruitment and retention site determination for
National Health Service Corps.
Projected Progress:
1. The Meeting brings together Indiana AHEC Program Statewide Staff and Advisory
Board Members; health professions workforce development stakeholders including
K-12 schools, higher education, hospitals and community-based healthcare providers,
public health officials, government agencies, minority health partners; and high
school students from underserved communities from Indiana who are interested in a
career in healthcare (expected attendance 175).
2. Additional funding available for recruitment and retention of health professionals
dedicated to rural areas.
Process Measures:
1. Students and professionals will share learnings and unique rural medical practice
experiences and receive information pertinent to attaining and maintaining health care
delivery in rural settings.
2. Increase rural providers in health professional shortage areas through the J-1 Visa
Waiver Program, State Loan Repayment Program, and National Health Services
Corps recruitment of health professionals.
Projected Qualitative Impacts:
1. Students and medical residents will see the benefits of a rural practice.
2. Rural Indiana will receive quality care by qualified health professionals.
Additional Function (5): Participate in Strengthening State, Local and Federal
Partnerships-
Objective:
1. Participate in education and planning efforts with IRHA and the Indiana Primary
Health Care Association
1. Strengthen knowledge of other state programs through federally offered means.
Product/Service/Activity:

103
1. Meet monthly: Rural Health Roundtable: Includes IRHA, Indiana Public Health
Association, Indiana University, Indiana Hospital Association, Health Care Excel,
Indiana Primary Health Care Association, and ASPIN.
2. Host the Region C State Offices of Rural Health Meeting.
Projected Progress:
1. Rural Health Roundtable members meet to share data and discuss common projects.
2. The meeting will be held in August and will have a peer to peer presentation format
Process Measures: 1. Members of the Round Table will collaborate on one or more projects.
2. The Region C meeting will have all 10 states participate—both attending and
presenting.
Projected Qualitative Impacts:
1. Projects will be designed and implemented to benefit rural residents.
2. States will increase their knowledge of other state’s approaches to rural programming
and understand how to employ them to their advantage in their home settings.


