
SUPPLEMENT TO THE WELDING JOURNAL APRIL 2005 Sponsored by the American Welding Society and the Welding Research Council
Influence of Molybdenum on Ferritic High-Strength SMAW All-Weld-Metal Properties As molybdenum increased, hardness, yield, and tensile strengths increased
BY E. SURIAN, M. RAMINI DE RISSONE, AND L. DE VEDIA
ABSTRACT. The investigation described in this paper is part of a long-term study on the influence of alloying elements on the mechanical properties and microstructure of high-strength SMAW electrode weld metal of the ANSI/AWS A5.5-96 E10018/11018/12018M type. The objective of this work was to study the influence of Mo variations from nominal 0 to 0.90% for an all-weld metal alloyed with C 0.05%, Ni 1.8%, and two values of Mn: 1 and 1.5% in both the as-welded and stress-relieved conditions in order to contribute to a comprehensive picture on the influence of alloying elements on high-strength weld deposits. Tensile, impact, and CTOD testing were employed to assess the mechanical properties. Full chemical and microstructural analyses were conducted and complemented with a hardness survey. It was found that as Mo increased, hardness, yield, and tensile strengths increased. The same effect was achieved with an increment of Mn. As a general tendency, Mo was deleterious for toughness for 1 % Mn, but a maximum of toughness was achieved at 0.25% Mo for 1.5% Mn. Postweld heat treatment (PWHT) produced a drop in tensile properties and a benefit on toughness, especially for Mo contents up to 0.5%. Some suggestions concerning the electrode formulation to obtain an optimum combination of tensile strength and toughness are presented.
Introduction
In recent years there has been an increase in the use of medium- and high-
E. SURIAN is with Research Secretary, Engineering Faculty, with National University of Lamas de ZamoralDeytema, Regional Faculty San Nicolas. National Technological University, Buenos Aires, Argentina. M. RAMINI DE RISSONE is with Deytema-Material Development and Technology Center. Regional Faculty San Nicolas, National Technological University, Buenos Aires, Argentina. L. DE VEDIA is with Sabato Institute, National University of San Marlin-CNEA, CIC. Buenos Aires, Argentina.
strength structural steels leading to a requirement for adequate welding consumables for such materials. This resulted in a significant advance in electrode formulation to obtain weld deposits with high values of strength and toughness (Ref. 1). Structural safety and a tolerance to discontinuities in welded joints are obtained by imposing requirements on toughness. This is done by setting minimum Charpy V-notch levels at a specified temperature, and minimum CTOD values at the lowest design temperature (Ref. 2). The achievement of adequate CTOD values becomes increasingly difficult as the weld metal tensile strength increases. One way to obtain improved weld metal toughness is through the control ofthe microstructure, which requires taking into account the weld metal chemistry, lt is generally accepted that acicular ferrite is the optimum microstructure for as-welded C-Mn weld metal (up to approximately 650 MPa of tensile strength), leading to an adequate combination of strength and fracture toughness at low temperature (Refs. 3, 4). Acicular ferrite has a very fine grain size and a high concentration of dislocations that are responsible for its toughness and ductility (Ref. 5). Several workers have reported that a low transition temperature can be obtained in a C-Mn weld deposit provided the proportion of acicular ferrite is maintained at a high level, and if the amount of grain boundary ferrite with aligned M-A-C is sufficiently low (Refs. 1,
KEY WORDS
Acicular Ferrite Heat Treatment High-Strength Alloys Mechanical Properties SMAW Toughness
2,5, 6). At higher strength levels, obtained through increased alloying, acicular ferrite tends to be replaced by other micro-constituents such as ferrite with second phases. Thus maintaining a satisfactory combination of strength and toughness requires a precise chemical composition of the weld metal.
This investigation is part of a long-term study on the influence of alloying elements on the mechanical properties and microstructure of high-strength weld metal deposited with SMAW using an electrode of the ANSI/AWS A5.5-96 E10018/11018/12018M (Ref. 7) type. Previous studies on the influence of Mn (Ref. 8), C (Ref. 9), and Cr (Refs. 10 and 11) revealed that optimum toughness was achieved with a Mn content between 1.0 and 1.4%, very low C content (less than 0.05%), Ni 2.0%, and Mo 0.30%. With higher C (up to 0.10%) and Mn (up to 1.70%), or by adding Cr (up to 0.75%), it is still possible to have good toughness values that satisfy ANSI/AWS A5.5-96 (Ref. 7) requirements, which are 27 J minimum at -51°C (-60°F). This work studied the influence of Mo variations from nominal 0 to 0.90% for an all-weld metal alloyed with C 0.05%, Ni 1.8%, and 1 and 1.5% Mn. In order to contribute to a comprehensive picture on the influence of alloying elements on high-strength weld deposits, they were studied in the as-welded (AW) and stress-relieved (SR) conditions,.
Experimental Procedure
Electrodes
Eight low-hydrogen iron powder experimental electrodes were designed varying the amount of metallic molybdenum powder in the coating, in such a way as to obtain in the all-weld metal nominal 0, 0.25,0.50, and 0.90% Mo for two values of Mn at 1 and 1.5%. Ni was maintained in 1.8% and no Cr was added. The core wire diameter was 4 mm and the coating factor
WELDING JOURNAL

poiwr or TEMPERATURE MEASUREMENT
r
WELD DIRECTION
r-v
19.05
—
150
;i I "\ 1 i
— IK Z.7mn
T,
1.65 in all cases. To ensure identical starting conditions, the electrodes were re-dried for one hour at 350°C (662°F) before being used.
All-Weld-Metal Test Coupons
With each of the eight electrodes, two all-weld-metal test coupons were welded according to ANSI/AWS A5.5-96 (Ref. 7) using a carbon steel base plate of % in. (19 mm) thickness — Fig. 1. Welding was performed in the flat position, changing the welding direction after each bead and using two beads per layer, except for the last layer where only one bead was deposited, but with the same heat input so as to obtain a center bead for metallographic study. No evidence of weld cracking was found. Table 1 shows the welding parameters used on all weld coupons.
Mechanical Testing
After conducting an X-ray examination, the following test specimens were extracted from each test coupon (Fig. 1): minitrac (Ref. 12) specimen (total length = 55 mm, gauge length = 25 mm, reduced section diameter = 5 mm, gauge length to diameter ratio = 5:1), to measure tensile properties; a cross section to conduct a hardness survey and to perform a metallographic study; bend specimens for CTOD determination; and approximately 20 Charpy V-notch impact specimens in order to assess the absorbed energy vs. test temperature curve. All specimens were tested in the as-welded condition and after a postweld stress relief heat treatment of 1 h at 621 ± 14°C (1150 ± 25°F) (cooling rate: 100°C/h). Tensile properties were determined at room temperature after a hydrogen removal treatment at 100°C (212°F) during 24 hours, and impact energies were measured at temperatures between 20°C (68°F) and -70°C (-94°F). Vickers hardness (HV10) was measured in the top down direction along the centerline of the weld cross section — Fig. 2.
Fig. 1 —A — Test plate showing coupon design and locations of test specimens; B — location of impact test specimen and Charpy V-notch test location: C — location of all-weld-metal tension test specimen.
Table 1 -
Number of
layers
7
- Welding Parameters Used in ANSI/AWS A5.5-
Number of
passes
15
Interpass temperature
eq 103
Intensity (A)
170
96 All-Weld-Metal Coupons
Tension (V)
24
Welding speed
(mm/s)
1.9
Heat input
(kJ/mm)
2.2
Metallographic Study
Examination of cross sections (etched with Nital 2%) was carried out in the top beads and the adjacent reheated zones as described previously (Ref. 13). The percentages of columnar and reheated zones were measured at 500x at the notch location for the Charpy test — Fig. 2. The average width of the columnar grain size (the prior austenite grains) was measured in the top bead ofthe samples at lOOx. To quantify the microstructural constituents of the columnar zones in each weld. 10 fields of 100 points were measured in the top bead at 500x by light microscopy. The reheated fine-grain size was measured in the heat-affected zone of the top bead, according to the Linear Intercept Method (ASTM El 12 standard). X-ray diffraction was employed to detect the presence of retained austenite in the columnar zone.
CTOD Testing
Fracture toughness of the as-welded and stress-relieved specimens was assessed by means of CTOD testing. For this
purpose, full-thickness, single-edge-notched, three-point bend specimens were extracted from each weld, with the notch in the through-thickness direction as indicated in Fig. 3. An initiating fatigue crack, with initial crack depth-to-width ratio of a/w = 0.5, was used in all cases. In order to promote plane strain conditions at the crack tip, 25% side grooving of the specimens were adopted (Ref. 14). Testing was conducted at-10°C (14°F) according to ASTM 1820 (Ref. 15).
Results and Discussion
Chemical Composition
Table 2 shows the all-weld-metal chemical composition analysis results. It can be observed that the values for each element were fairly uniform, except for the two levels of Mn (1 and 1.5%) and the Mo, which varied systematically from 0.01 to 0.87%. Nitrogen and O contents were within the normal values for this type of electrode (Refs. 16, 17). The observed variations in the values among the different specimens were within the range accepted for this de-
APRIL2005

Hardness test location
Charpy-V notch location L ( see Figure 1B )
Fig. 2 — Schematic drawing of all-weld-metal test assembly cross section.
!̂ TO!W? i i l l i n i u m
Fig. 3 — Schematic drawing of CTOD test specimen and dimensions: W and B.
Table 2 — All-Weld-Metal Chemical Composition
Element All weld metal samples
lMnOMo lMn25Mo LMn50Mo lMn90Mo 15MnOMo 15Mn25Mo 15Mn50Mo 15Mn90Mo
C
0.06 0.06 0.06 0.05 0.05 0.05 0.06 0.06
P
0.012 0.018 0.019 0.019 0.018 0.020 0.019 0.018
S
0.009 0.009 0.012 0.010 0.009 0.011 0.010 0.011
Si
0.37 0.40 0.39 0.37 0.58 0.41 0.45 0.43
Mn
1.03 l.ll 1.03 0.95 1.54 1.48 1.43 1.45
Ni
1.93 1.91 1.85 1.82 1.87 1.89 1.79 1.84
Mo
0.01 0.28 0.58 0.87 0.01 0.27 0.57 0.87
O
399 340 406 421 310 327 398 407
N
107 100 108 119 95
100 93 83
All [he elements in wt-rr except O and N. which arc in ppm. As, W, Co, V, Nb, Ti, and Al < 0.01%; Cu < 0.07%; Cr < 0.06%.
termination (Ref. 18). It was observed that as Mn increased, O levels decreased due to the deoxidizing effect of Mn. Increasing Mo led in general to higher oxygen values although no explanation could be advanced to account for this effect. In general, it can be observed that a "very clean" alloy base was achieved with these electrodes, with the level of residual elements being very low. Carbon values were also very low, as intended, according to previous results (Ref. 9).
Metallographic Study
General
Table 3 — Relative Distribution ofthe Columnar and Refined Regions at Location
All Weld Metal
lMnOMo lMn25Mo lMn50Mo lMn90Mo 15Mn0Mo 15Mn25Mo 15Mn50Mo 15Mn90Mo
Columnar AW
22 28 48 54 14 30 55 59
Regions (%) SR
20 27 45 52 22 30 57 59
Coarse AW
32 27 19 15 44 32 IS 16
Refined Reg Grains
SR
32 27 IN 17 42 31 16 16
the Charpy V-Notch
ons (%) Fine Grains
AW SR
46 48 45 46 33 37 31 31 42 36 38 39 27 27 25 25
Macrographs of multirun weldments containing 0 and 0.90% Mo and 1.5% Mn are shown in Fig. 4. They depict the observed difference in etching response (Nital 2%) on alloying, as previously found by Evans (Ref. 19). The "memory" effect quoted by Evans, which consisted of retaining the underlying columnar forma
tion, was found in the samples with 0 to 0.90% Mo for both Mn values. However, this effect was less marked than in the case mentioned by Evans due to the fact that in the present work all the specimens contained 1.8% Ni, and that has a similar, although less strong, "memory" effect than Mo on C-Mn systems (Ref. 20).
Table 3 shows the distribution of the columnar and reheated zones along the vertical central line for the Charpy V-notch location of the all-weld-metal specimens for AW and SR conditions. It can be seen that as the Mo content increased, the percentages of columnar zones also increased. Manganese seemed to have a
WELDING JOURNAL
H i l l
Fig. 4 — Macrophotographs ofmultirun deposit transverse cuts.
"IMnOMo 1Mn25Mo
agsg m
1Mn50Mo 1Mn90Mo
15MnOMo 15Mn25Mo
15Mn50Mo 15Mn90Mo
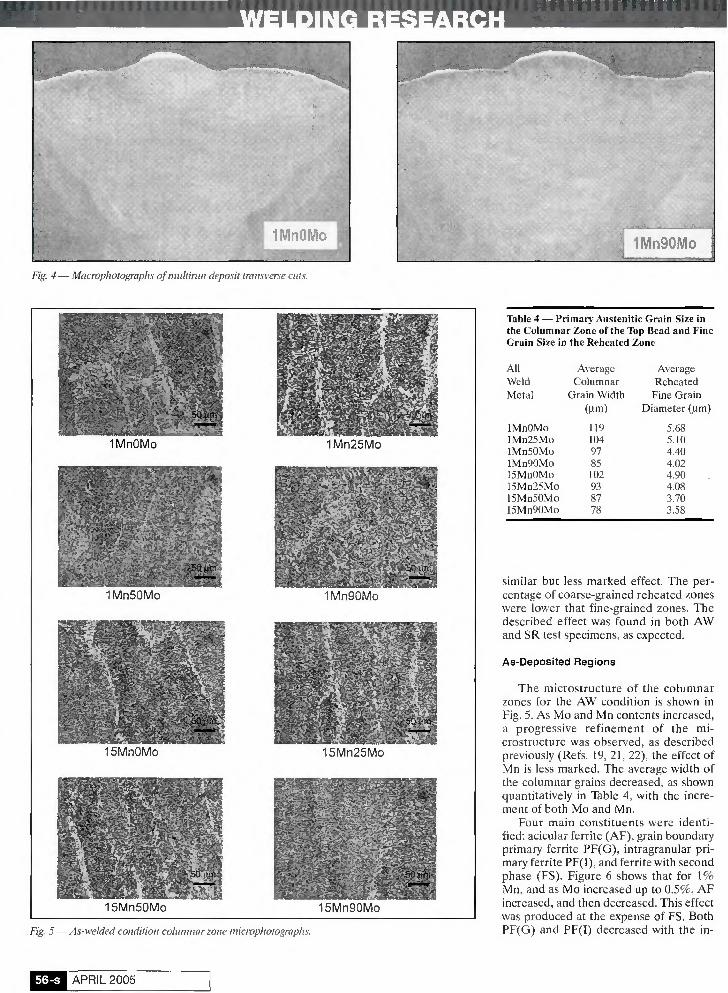
Table 4 — Primary Austenitic Grain Size in the Columnar Zone ofthe Top Bead and Fine Grain Size in the Reheated Zone
All Weld Metal
IMnOMo l.Mn25Mo lMn50Mo lMn90Mo ISMnOMo 15Mn25Mo l5Mn50Mo 15Mn90Mo
Average Columnar
Grain Width (Um)
119 104 97 85 102 93 87 78
Average Reheated
Fine Grain Diameter (pm)
5.68 5.10 4.40 4.02 4.90 4.08 3.70 3.58
Fig. 5 —As-welded condition columnar zone microphotographs.
similar but less marked effect. The percentage of coarse-grained reheated zones were lower that fine-grained zones. The described effect was found in both AW and SR test specimens, as expected.
As-Deposited Regions
The microstructure of the columnar zones for the AW condition is shown in Fig. 5. As Mo and Mn contents increased, a progressive refinement of the microstructure was observed, as described previously (Refs. 19, 21, 22), the effect of Mn is less marked. The average width of the columnar grains decreased, as shown quantitatively in Table 4, with the increment of both Mo and Mn.
Four main constituents were identified: acicular ferrite (AF), grain boundary primary ferrite PF(G), intragranular primary ferrite PF(I), and ferrite with second phase (FS). Figure 6 shows that for 1% Mn, and as Mo increased up to 0.5%, AF increased, and then decreased. This effect was produced at the expense of FS. Both PF(G) and PF(I) decreased with the in-
APRIL2005

Fig. 6 — Top bead microconstituents vs. Mo content. A — 1% Mn; B — 1.5% Mn.
crement of Mo content. For 1.5% Mn, no PF(I) was measured, and the same behavior was found for 1 % Mn. Acicular ferrite increased up to 0.5% Mo, and then decreased at the expense of FS. Grain boundary primary ferrite decreased with Mo increment. The same effect was found by Evans (Ref. 19 and 21).
Reheated Zones
Table 4 also shows that with increasing Mo and Mn contents there was a progressive microstructural refinement in the reheated regions subjected to austenitizing temperature by the subsequent passes, as previously reported (Refs. 19,21, 22). Figure 7 shows examples of the fine-grain areas for the extreme values of both Mo and Mn. Again, a general grain refinement could be observed.
Retained Austenite
A small amount of retained austenite was measured in the last run columnar zone (Table 5). An increase in the amount of retained austenite was observed for higher Mn content. The maximum values for retained austenite for each Mn content was found in the absence of Mo. A minimum of retained austenite was found at 0.25% Mo, but no apparent reason was detected for this effect.
.:•> \ S C > » 1
'\ .
i ijfcr
jae 1 Mn 0 Mo
*"
-• —
1
\ -"-
• ' • .
M "
* • £ - . :.:•
...:y y-y
15 Mr
~'\
l 0 Mo
- ' • M M
j
'y
- v * • ',y> *• * y^z * v r
ISM*}?*-» i.y^,: %•,
- yyi BV» i"*
' . ^
Mn 90 Mo
.-'-
15 m
£ZK.ME£ggir
90 MO
Rg. 7 — As-welded condition reheated zone microphotographs.
Mechanical Properties
The 18 all-weld-metal specimen radiographs were free of defects.
Hardness Survey conditions. As expected, hardness values increased as the Mo and Mn increased in
Table 6 shows the average values of agreement with the tensile test results, hardness measurements in the AW and SR Stress relieving seemed to produce a slight
WELDING JOURNAL

uuuiriii "I ly
Distance from top surface (mm)
Fig. 8 — Hardness measurement results.
-1MnAW -1MnSR -15MnAV -15MnSR
Fig. 9 — Effect of molybdenum on yield strength.
decrease in hardness for low levels of Mo and the opposite effect for Mo higher than 0.5% — Fig. 8.
All-Weld-Metal Tensile Properties
Table 6 and Figs. 9 and 10 show the tensile properties measured for AW and SR conditions. It can be seen that in all cases an increase in Mo led to increased tensile and yield stresses. For Mo contents up to 0 .5%, the postweld heat t rea tment produced a moderate decrease in tensile values . However , this effect vanishes for higher Mo contents and even becomes reversed in the measured values for yield strength, in total accordance with the average hardness values measured . This
softening effect of the stress relief heat t r ea tmen t for Mo con ten t lower than 0.5%, and hardening effect for higher Mo values, is in agreement with that reported by Evans for C-Mn ferritic deposits (Ref. 19). As expected, an increase in Mn led in all cases to a corresponding increase in tensile properties (Refs. 21, 22).
Taking into account the AWS requirements for this type of electrode (Ref. 7) (Table 7), it can be seen that the minimum tensile strength values needed for the classification ofthe E10018M weld metal in the as-welded condition were achieved onlv bv the 1.0Mn-0.90Mo and 1.5Mn-0.90Mo welds, and this is with the maximum Mo levels used in this work, at least with the heat input employed in the welding of those sam-
Table 5 — Percentages of Retained Austenite in the Last Bead Columnar Zone, Analyzed by X-ray
Retained Austenite (%) IMnOMo lMn25Mo lMn50Mo lMn90Mo 15MnOMo 15Mn25Mo 15Mn50Mo 15Mn90Mo
0.01185 0.00278 0.00668 0.00723 0.01500 0.00834 0.01542 0.02688
pies. If an increase in tensile properties in these deposits was desired, it would be necessary either to reduce the heat input (Refs. 23, 24). or to increase the content of alloying elements. In this last case, taking into account the deleterious effect of increasing Mo (Ref. 19) and an excess of Cr (Refs. 10, 25, and 26), the content of this e lement should be adjusted for a specific Mo level like, for example, that found as optimum in this work for 1.5% Mn and 0.25% Mo. This is what is being done in this type of ferritic deposits in order to obtain electrodes classified as E11018M and E12018M (Refs. 27-30).
All-Weld-Metal Charpy V-Notch Impact Properties
The individual Charpy V-notch impact values and the calculated averages for different test t empera tu res obta ined from the eight coupons are given in Table 8, in the as-welded and stress-relieved conditions, respectively. Values comfortably in excess of the minimum ANSI/AWS A5.5-96 requirements , 27 J at -51°C (-60°F),
Table 6 — All-Weld-Metal Tensile Property and Hardness Measurements
Property
TS (MPa) YS (MPa) E ( % ) Hardnessw
IMnOMo
515 438 36.6
205
lMn25Mo
557 477 28
227
As-Welded Condition lMn50Mo lMn90Mo 15Mn0Mo
604 500 30.4
236
652 575
25.0 259
607 505
32.6 215
l.-iMn25Mo
639 570
25.8 249
15Mn50Mo
657 562
26.6 266
15Mn90Mo
760 611 22.0
288
Property
TS (MPa) YS (MPa) E (%) Hardnessial
1 MnOMo
476 447 35.2
18(1
lMn25Mo
531 486
33.4 216
Stress
lMn50Mo
600 545
28.6 248
-Relieved Condit
lMn90Mo
660 598
25.6 267
un
15 MnOMo
558 500
30.0 201
15Mn25Mo
( 537
29.0 242
15Mn50Mo
652 593
23.8 268
15Mn90Mo
738 714
22.2 294
(a) Average Vickers 10-kg measurements.
APRIL 2005

were achieved with all the assemblies at the mentioned temperature. The average values were similar to those obtained with commercial E100/110/12018M type electrodes (Refs. 23, 24). Figures 11 and 12 show the curves of absorbed energy vs. test temperature for each group of electrodes corresponding to both Mn contents and both AW and SR conditions. It can be observed that for 1 % Mn, Mo between 0 and 0.9% had a deleterious effect on toughness in both AW and SR conditions. The PWHT produced an improvement in toughness that decreased as Mo increased and disappeared for 0.9% Mo. For 1.5% Mn in the AW condition, the best impact values were achieved with 0.25% Mo. In this case, the PWHT had a beneficial effect on toughness, especially for low Mo contents. For Mo higher than 0.25%, toughness markedly deteriorated in both AW and SR conditions. All these effects can be seen in Fig. 13. which comparatively shows the transition temperatures for 100 J of absorbed energy.
Impact values corresponding to 1% Mn were, as a general tendency, larger than those of 1.5% Mn, but this difference became smaller as the Mo content increased. Evans (Ref. 19) detected an optimum for 0.25%> Mo in C-Mn ferritic deposits in the AW condition, for Mn content of 1.0%; this optimum disappeared for higher Mn values. In the present work, no such maximum was found for 1% Mn, since impact toughness deteriorated continuously as Mo increased. A relative maximum of toughness was found for 1.5% Mn at 0.25% Mo. This change in the Mn content for which a relative maximum was obtained in this work could be due to the presence of 1.8% Ni. Coincidently with Evans (Ref. 19) for PWHT deposits, Mo was deleterious for toughness, especially for values higher than 0.5%.
Considering the AWS Charpy V-notch requirement of 27 J at -5TC (-60°F) in the as-welded condition, there was not a single value below this requirement. However, for this type of material, the consumable producer commercial catalogs (Refs. 27-30) report toughness around 50 J at -51°C. Then, to obtain the adequate tensile properties without compromising toughness values, Mo content should be maintained not higher than 0.25%. This conclusion allows to compromise the all-weld-metal Mo content required by ANSI/AWS A5.5-96 for E100/110/12018M electrodes, of 0.25 to 0.50% for the two first classifications and 0.30 to 0.55% for the last one, with the optimum Mo level for this system.
CTOD Results
thickness specimens extracted from the all-weld-metal welds are shown for the AW and SR conditions. A general trend toward decreasing CTOD values with increasing Mo content was observed, for both conditions. The same deleterious effect was obtained with Mn, as previouslv found (Ref. 8) in a similar alloying system. PWHT led'to an improvement in fracture toughness Fig. 10 — Effect of molybdenum on ultimate tensile strength.
A
3SO —
$30 -
Z'JO —
JOO —
SO —
A W - V O M n
^ / " "
/ y
" i i i i i i i i i n -&J -60 - *0 -2G 0 20
Ttf'st tempera ture <*Cl
B ,=,
200 —
5
g* 150 -g •q
S 'co — •X.
50 —
0
AW-1 .5Mn
# ?> s s y *y
/ yy
'S
t i i i i i i i i i i -so -so - *.c -ao o ;c
Te&t lemper-aiure t°CJ
Fig. 11 — Charpy V-notch impact results for all-weld metals in the as-welded condition. A — 1% Mn; —1.5% Mn.
*so —
yoo —
? 5 0 —
XQQ —
• 5 0 —
W-0 —|
so —
0
^ S R - 1 0 M n y ^
-^y y
/
/ y
/ s op* / * ' . . - - • "
y''
! 1 1 1 ! "1 1 : 1 | !
Te-it t E m p c r a l u r e <"CJ
B lS0
z^
? 150 —
C
•a
S l o o -
50 —
0
y S R - 1 .5Mn <*/
/ / ^y
/ y / s /.-•-' yy<'
/ ,<.-'-•" ^yy „- ' .-*• '
s / -•"
/''•** <&&/ •**" 1 1 1 1 ; 1 i l i i
-so -so --C -ZO o 20 Test t e m p e r a t u r e f°C>
In Table 9 and Fig. 14A and B. average CTOD test results corresponding to the full
Fig. 12 — Charpy V-notch impact results for all-weld metals in the stress relief condition. A — 1% Mn; B—1.5%Mn.
WELDING JOURNAL

I . ^ramfi;
for Mo up to 0.5% with 1% of Mn, and up to 0.25% for 1.5% Mn in general agreement with the trend found in impact, hardness, and tensile test results.
Final Remarks
The literature (Refs. 8-10, 23, 24. 31, 32) has shown that in the high-strength.
low-alloy ferritic system, the problem is not so much good toughness but to achieve adequate tensile strength levels to satisfy the requirements in the relevant standards. Additionally, these materials are very sensitive to heat input (Refs. 23, 24, 31) and the guidelines to produce the all-weld metal test coupons for mechanical properties determination allow for
Table 7 — AWS Tensile Property Requirement
As-Welded Condition
Property
TS (MPa) YS (MPa)
im
E10018M
690 610-690
20
E11018M
760 680-760
20
E12018M
830 745-830
18
ample procedure variations (Refs. 7, 33, 34). On the other side, for deposits of the same type (high-strength C-Mn-Ni-Mo and C-Mn-Ni-Mo-Cr low-alloy weld deposits) obtained by different welding processes (SMAW, FCAW, MCAW, and SAW), the tensile requirements ofthe relevant standards differ. For SMAW the range of yield strength values are specified along with minimum tensile strength, while for FCAW, MCAW, and SAW minimum values of yield strength and a range for tensile strength values are given (Refs. 7, 33 and 34). Thus, a stringent welding procedure must be defined within the limits imposed by the corresponding AWS standard in order to ensure repeatability of the resulting tensile properties of a given weld metal in this system.
Table 8 — All-Weld Metal Charpy-V Impact Values
As-Welded Condition T(°C)
20
0
-20
-30
-40
-50
-60
-70
TCP) 20
0
-20
-30
-40
-50
-60
-70
IMnOMo
336-234 285
318-234 276
184-184 184
197-157-194 183
158-150-90 133
139-116-89 115
77-102-104 94
77-103 90
IMnOMo
356-344 350
352-272 312
269-289 279
232-249-239 240
224-234-174 211
178-203-26 202
124-176-175 158
140-144 142
lMn25Mo
188-194 191
140-132 136
136-134 135
91-93-85 90
97-97-83 92
55-81-82 73
47-73-57 59
52-60 56
lMn25Mo
198
174-158 166
160-160 160
153-150-150 151
139-144-128 137
144-124-127 12
124-108-128 120
100-67 84
lMnSOMo
136-150 143
142-112 127
110-94 102
87-81-81 83
80-68-75 74
36-57-55 49
36-50-43 43
37-27 32
lMn90Mo
120-132 126
110-75 93
88-64 76
77-70-61 69
60-55-70 62
42-88-57 62
40-62-44 49
36-24 30
15MnOMo
134-140 137
118-118 118
60-86 73
55-63-59 59
40-50-55 48
27-26-27 27
25-44-55 41
12-13 13
Stress-Relieved Condition
lMn50Mo
156-158 157
132-132-132 132
108-116 112
92-65-85 81
83-65-90 79
55-60-62 59
64-62-57 61
48-72 60
lMn90Mo
120-132 126
110-76 93
8-64 76
77-70-61 69
60-55-70 62
42-88-57 62
40-62-44 49
35-24 30
15Mn0Mo
230
178-190 184
146-140 143
130-130-146 135
158-129-126 138
120-114-130 121
96-88-74 86
81-95 88
15Mn25Mo
168-176 172
146-134 140
108-110 109
114-89-105 103
90-83-90 88
90-63-60 71
47-69-45 54
25-30 28
15Mn25Mo
168-190 179
156-144 150
143-121 132
136-101-123 120
129-120-108 119
120-101-102 108
75-88-70 78
77-91 84
15Mn50Mo
132
116
80-94 87
75-70-66 70
71-71-70 71
34-61-61 52
40-59-47 49
27-21 24
15Mn50Mo
132
120-102 111
90-96 93
84-99-82 88
82-32-53 56
59-66-70 65
35-32-17 28
30-34 32
15MN90Mo
116
109
82-80 81
76-76-68 73
60-54-58 58
60-38-56 51
48-50-93 49
30-40 35
15MN90Mo
116
109
82-80 81
76-76-68 73
60-54-60 58
60-38-56 51
48-50-93 64
30-41 36
Table 9 — All-Weld Metal CTOD Values
Critical Displacement 8, (mm) Condition MnOMo
AW 1.22 SR 1.30
lMn25Mo
0.73 1.01
1 g | APRIL 2005
lMnSOMo
0.44 0.53
lMn90Mo
0.35 0.22
15MnOMo
0.77 0.80
15Mn25Mo
0.39 0.57
15Mn50Mo
0.34 0.17
15MN90MO
0.24 0.07

:=W=M:M Conclusions
When Mo content was increased from 0 to 0.9%, for Mn contents of 1 and 1.5%, in 1.8%Ni, Cr-free ferritic all-weld metal, the following was found:
1) As Mn increased, O levels decreased due to the deoxidizing effect of Mn. Increasing Mo led in general to higher oxygen values, although no explanation could be advanced to account for this effect.
2) As the Mo content increased, the percentages of columnar zones also increased. Manganese seemed to have a similar but less marked effect. Coarsegrained reheated zones were lower that fine-grained zones.
3) As Mo and Mn contents increased, a progressive refinement of the microstructure was observed in the columnar regions, with the effect of Mn less marked. The average width of the columnar grains decreased with the increment of both Mo and Mn. For 1% Mn and as Mo increased, AF increased up to 0.5% Mo and then decreased. This effect was produced at the expense of FS. Both PF(G) and PF(I) decreased with the increment of Mo content. For 1.5% Mn, no PF(I) was measured and the same behavior was found for 1% Mn. Acicular ferrite increased up to 0.5% Mo and then decreased at the expense of FS. Granular primary ferrite decreased with Mo increment.
4) As a result of the increasing Mo and Mn contents, there was also a progressive microstructural refinement in the reheated regions subjected to austenitizing temperature by the subsequent passes.
5) Small amounts of retained austenite were measured in the last run columnar zone. An increase in the amount of retained austenite was observed for higher Mn content.
6) Hardness values increased as the
A
50 —
u
o o
-s o —
Q .
E -50 —
> •
>» -C ° - 1 0 0 -
1.0Mn-100J
yy
JS
^ - " * " " / " / / S
&y ty
i i 0 0.50
Mo in we ld (%)
I 1.00
B
50 -
u
o o
Qj
Ol
E - 5 0 -
> n j
u - 1 0 0 -
1.5Mn-100J
/ N ^ ^fr"'~
/ y^-^
i i 0 0.50
Mo inweld (%]
1.00
Fig. 13— Test temperature for 100 J absorbed energy. A — 1% Mn; B— 1.5% Mn.
Mo and Mn increased in agreement with the tensile test results. Stress relieving seemed to have produced a slight decrease in hardness for low levels of Mo and the opposite effect for Mo higher than 0.5%.
7) In all cases, an increase in Mo led to increased tensile and yield stresses. For Mo content up to 0.5%, the postweld heat treatment produced a moderate decrease in these values. However, this effect vanishes for higher Mo contents and even becomes reversed in the measured values of yield strength, in total accordance with the average hardness values measured. As expected, an increase in Mn led in all cases to a corresponding increase in tensile properties.
8) Values comfortably in excess of the minimum ANSI/AWS A5.5-96 requirements of 27 J at -51°C (-60°F) were achieved with all the assemblies. The average values were similar to those obtained with commercial E100/110/12018M elec
trodes. For 1% Mn, Mo between 0 and 0.9% had a deleterious effect on toughness in both AW and SR conditions. The PWHT produced an improvement in toughness that decreased as Mo increased and disappeared for 0.9% Mo. For 1.5% Mn, in the AW condition the best impact values were achieved with 0.25% Mo. In this case, the PWHT had a beneficial effect on toughness, especially for low Mo contents. For Mo higher than 0.25%, toughness markedly deteriorated in both AW and SR conditions.
9) Impact values corresponding to 1% Mn were as a general tendency larger than those of 1.5% Mn, but this difference became smaller as the Mo content increased.
10) A relative maximum of toughness was found for 1.5% Mn at 0.25% Mo.
11) A general trend toward decreasing CTOD values with increasing Mo content was observed, for both AW and SR conditions. The same deleterious effect was ob-
0.25 0.5
Mo(%)
? 1.2-£
.pla
ce
me
nt
Ol
CO
-J
H5 B 0.4 -o
g 0.2
0 -
1 t
l 1
1 DAW HSR
• SI 1 _*•__ I ~h m
0.9
Fig. 14 — CTOD test results:A — 1% Mn; B — 1.5 % Mn.
WELDING dOURNAL

LW=UJI!M:]=W=M:M! tained with Mn variation. Postweld heat t reatment led to an improvement in fracture toughness for Mo up to 0.5 % with 1 % of Mn, and up to 0.25% for 1.5% Mn, which is in general agreement with the trend found in impact, hardness, and tensile test results.
Acknowledgments
The authors wish to express their gratitude to Conarco Alambres y Soldaduras SA for the fabrication of the experimental electrodes, to Air Liquide Argentina SA for the facilities to weld the test specimens, to Fundacion Latinoamericana de Soldadura for the facilities to weld and to perform mechanical test ing, and to ANPCyT Argentina, for the funding support. They are also very grateful to Eng. Edmundo Tolabin, Jujuy National University, Argentina, for carrying out the metallographic study and the supervision of mechanical testing.
References
1. George. M.. Still. 1., and Terry, P. 1981. Gas metal arc welds for high toughness applications — microstructure and other factors. Metal Construction 13(12): 730-737.
2. Keeler, T. 1981. Innershield welding, part i — development and applications. Metal Construction 13(11): 667-673.
3. Garland. 1. C . and Kirkwood, P. R. 1975. Towards improved submerged arc weld metal — part 1. Metal Construction 7(5): 275-283.
4. Garland. 1. C , and Kirkwood. P. R. 1975. Towards improved submerged arc weld metal — part 2. Meta! Construction 7 (5): 320-330.
5. Pickering. F. B. 1978. Physical Metallurgy and the Design of Steels. Materials Science Series, London: Applied Science Publishers.
6. Abc, N.. Kitada. T. and Miyata, S. 1980. Effects of alloying elements on the toughness and microstructure of high current density gas shielded arc process weld metals. Transact, of the JWS, 11(4): 29-34.
7. ANSI/AWS A5.5-96. Specification for Low-Alloy Sleel Electrodes for Shielded Metal Arc Welding. Miami, Fla.: American Welding Society.
8. Surian, E., Trotti. 1.. Cassanelli. A. N, and de Vedia, L. 1987. Influence of Mn content on mechanical properties and microstructure of a high strength SMA electrode weld metal. IIW-IIS Doc. II-A-724-87.
9. Surian, E., Trotti, J., Herrera. R.. and de Vedia, L. A. 1991. Influence of C on mechanical properties and microstructure of weld metal from a high-strength SMA electrode. Welding Journal 70(6): 133-s to 140-s.
10. Surian, E., Trotti. 1.. Cassanelli. L. A., and de Vedia. L. A. 1994. Influence of chromium on mechanical properties and mi
crostructure ofweld metal from a high strength SMAelectrode. IIW-IIS Doc. 11-1204-92. Welding Journal 73(3): 45-s to 53-s.
11. Bott, I. de S.. Souza, L.. lorge. 1.. and Surian, E. Microstructural evaluation of a high strength weld metal with varying Cr content by means of scanning electron microscopy. IIW-IIS Doc. II-A-936-94.
12. Schnadt. H. M.. and Leinhard. E. W. 1963. Experimental investigation ofthe sharp-notch behavior of 60 steels at different temperature and strain rates. 1963. IIW-IIS Doc. 196-343-63.
13. Guide to the light microscope examination of ferrite steel weld metals. IIW Doc. IX-1533-88.
14. Gordon. 1. R. 1985. The Welding Institute procedure for the determination of the fracture resistance of fully ductile metals. The Welding Institute Research Report, p. 275.
15. Standard Test Method for Measurement of Fracture Toughness. ASTM E 1820-96.
16. Blake, P. D. 1979. Nitrogen in weld metals. Metal Construction, April.
17. Boniszewski, T. 1992. Self-Shielded Arc Welding. (Tables 2.1 and 2.2). Cambridge. England: Abington Publishing.
18. Raitcr. V. and Timerman. R. 1985. Chemical analysis of N and O in weld metal, round robin Test. IIW Doc. 11-10459-85.
19. Evans. G. M. 1988. The influence of molybdenum on the microstructure and properties of C-Mn all-weld-metal deposits. Join. Mat. 1(5): 239-s to 246-s.
20. Evans, G. 1991. The effect of nickel on the microstructure and properties of C-Mn all-weld metal deposits. Joining Sciences 1(1): 2-s to 13-s: Welding Research Abroad 37(2/3): 70-83. IIW Doc. IIA-791-89.
21. Evans. G. 1980. Effect of manganese on the microstructure and properties of all-weld metal deposits. IIW Doc. II-A-432-77. Welding Journal 59(3): 67-s to 75-s.
22. Surian. E.. and Boniszewski. T. 1992. Effect of manganese and type of current on the properties and microstructure of all-weld-metal deposited with E7016-1 electrodes. Welding Journal 71(9): 348-s.
23. Verccsi. 1.. and Surian. E. 1996. The effect of welding parameters on high-strength SMAW all-weld-metal, part 1: AWS El 1018M. I1S-1IW Doc II-A-915-94. Weiding Journal 75(6): 191-sto 196-s.
24. Verccsi. 1.. and Surian. E. 1997. The effect of welding parameters on high-strength SMAW all-weld-metal, part 2: AWS E10018M and E12018M. IIW-IIS Doc II-A-934-94. Welding Journal 77(4): 164-s to 171-s.
25. Evans. G. M. 1989. The effect of chromium on the microstructure and properties of C-Mn all-weld-metal deposits. Weld. Met. Fab. 57(7): 346-358.
26. Jorge. J. C. E, Souza. L. F. G.. Rebello. J. M. A., and Evans. G. M. 1994. Effect of chromium on the microstructure/toughness relationship in C-Mn-Mo weld deposits. IIW/IIS Doc. II-A-930-94.
27. Catalog of Conarco manual electrodes (F-C-CO-001-001).
28. Welding consumables ESAB SeAH Corp., catalog SS-03-E. Rev. 7. 0101.
29. SAF welding consumable catalog, edition 2000.
30. Welding consumables catalog, Kobe Steel, Kobelco.
31. Surian. E.. and Verccsi, J. 1997. The effect of heat input on all-weld metal mechanical properties of AWS A5.29-80 EXXXT5-K3/K4 types flux cored wires. Presented at the Professional Program, AWS Show and Annual Convention, Los Angeles, Calif.
32. Ramini de Rissone, M., Svoboda, H., Surian. E.. and Vedia. L. 2004. Influence of procedure variables on C-Mn-Ni-Mo metal cored wire ferritic all-weld metal. Presented at the Professional Program. AWS Annual Convention. Chicago. 111.
33. ANSI/AWS A5.5-96. Specification for Low-Alloy Steel Electrodes for Shielded Metal Arc Welding. Miami, Fla.: American Welding Society.
34. ANSI/AWS A5.23-97. Specification for Low-Alloy Steel Electrodes and Fluxes for Submerged Arc Welding. Miami, Fla.: American Welding Society.
Want to be a Welding Journal
Advertiser? For information, contact
Rob Saltzstein at (800) 443-9353, ext. 243,
or via e-mail at [email protected].
Change of Address?
Moving?
Make sure delivery of your Welding Journal is not interrupted. Contact the Membersh ip D e p a r t m e n t with your new address information — (800) 443-9353. ext. 480: jleon(aaws.org.
APRIL 2005


