Informal Workers in Formal and Informal Enterprises in India: a comparative
analysis
Rosa Abraham PhD Scholar, Institute for Social and Economic Change, Bangalore, India
Abstract
Employing workers in formal enterprises without the benefit of employment-related social security is a
recent form of informalisation of the labour market. In India, the share of such workers has increased
considerably in recent years. How different are these informal workers in the formal enterprises from
their counterparts in the informal enterprises? Following on overview of the coverage of various
employment-related social security benefits across the Indian labour force, using a job and enterprise-
based definition, this paper categorises workers into formal workers, informal workers in formal
enterprises, informal workers in informal enterprises and self employed. The paper analyses the trends
and incidence of such types of employment. It finds considerable overlap between the formal workers
and the informal workers in the formal enterprises. This is confirmed with a multinomial probit analysis
– highly educated and experienced individuals are hired by formal enterprise, but in informal
arrangements. This dispels the traditional notion of the informal workforce as being illiterate or
undereducated, or on either end of the age spectrum. An analysis of the structure of wages reveals
considerable wage inequality within this emergent form of informalisation. A regression-based
decomposition analysis reveals the differential contribution of various factors to wage inequality within
each employment group. The increasing trends towards informalisation of the labour market despite
higher average educational attainment points towards a ‘low road to growth’ strategy’ and the
perpetuating of inequities within the labour market.
1. Introduction
The ‘alternative’, ‘atypical’ or informal workforce has grown in developed and developing countries
alike (Charmes, 2011; Katz & Krueger, 2016). The manifestations of and motivations for this
informality among the workforce have differed. Some theorise that the informal economy is intrinsically
linked to the formal and hence grows in tandem (‘structuralists’) through subcontracting and outsourcing
arrangements (Ghose & Chandrasekhar, 2015; Unni & Naik, 2013) while others opine that participation
in the informal economy may be voluntary because the benefits of informal employment outweigh those
of the formal employment (‘voluntarists’) (Amuedo-Dorantes, 2004; Günther & Launov, 2012;
Maloney, 2003).
In India, informal employment has persisted over the years. Various estimates place it at anywhere
between 60 to 90% of total employment (Unni & Naik, 2013; NCEUS, 2008; Charmes, 2012)
depending on the definition adopted. It occurs in various forms, including self employment or wage
employment. One of the more recent evolutions of informal employment has been of informal
employment within formal enterprises. In the interest of flexibility and cost-reduction, many formal
firms in India and across the world increasingly hire workers on a temporary or informal basis. Labour
regulations, in more ways than one, have implicitly supported this informalisation or ‘contractualisation’
of the work force.
How different is the workforce engaged in this emergent form informal employment when compared to
those in the more traditional informal employment, i.e. the self employed and the informal workers in
informal enterprises?
Being employed in formal enterprises allows these workers access to more capital and technology.
Consequently, their productivities may be higher and earnings relatively more than their counterparts in
the informal enterprises, leading some to conclude that this informalisation has been for the benefit of
the workforce (A.K. Ghose, 2016). However, this form of employment may also be a trend towards
‘precariatisation’ (Standing, 2014), the creation of a workforce having ‘none of the ‘social contract
relationships of the proletariat’ (Standing, 2014 p 9), whose labour is ‘instrumental (to live),
opportunistic (taking what comes) and precarious (insecure)’. In this context, this paper attempts to
place the growing informalisation of the labour market in India within these debates. It compares the
evolution of the broad forms of informality in the Indian labour market between 1999 and 2012. It
examines the broad trends and incidence of these forms of employment, as well as the difference in the
structure of wage inequality within these employment forms.
2. Defining Informal Employment in India
Moving away from a purely enterprise-based definition of informal employment (as all employment in
the informal sector) as was done in the 15th ICLS, the 17th International Conference on Labour
Statisticians (ICLS) combined the enterprise and employment concepts to identify informal
employment. Informal employment, therefore, comprised of all ‘informal jobs ... whether carried out in
formal sector enterprises, informal sector enterprises or households’ (ILO 2003). This included the
own account workers or employers in their own informal enterprises, contributing family workers,
members of informal producers’ cooperatives and employees holding informal jobs in formal or
informal sector enterprises. Employees were considered to have informal jobs “if their employment
relationship is, in law or in practice, not subject to national labour legislation, income taxation, social
protection or entitlement to certain employment benefits (advance notice of dismissal, severance pay,
paid annual or sick leave, etc.)”.
Reflecting the international definition of informal employment, in India, the National Commission for
Enterprises in the Unorganised Sector defined informal employment to include those individuals
“…working in the unorganised enterprises or households, excluding regular workers with social security
benefits, and the workers in the formal sector without any employment/ social security benefits provided
by the employers" (NCEUS, 2008 p.27 para 2.7.3). Therefore, informal employment could exist in
formal enterprises or informal enterprises where informal enterprises are defined based on their
size/scope for regulation. In India, the ‘informal sector’ or ‘informal enterprises’ includes all
unincorporated proprietary and partnership enterprises, as defined by the National Sample Survey
Organisation (NSSO, 1999).
However, while theoretical definitions and conceptualisations of informality (whether in the context of
employment or enterprise type) often invoke multiple dimensions and characteristics (including
technology use, size, legality, payment of taxes, social security payments), the empirical application of
the concept has been limited to using one or two criterion to identify informality (Kundu, 1999).
Indeed, in India, even if the NCEUS definition is adopted, since various authors have used different
interpretations of social security benefits, the measurement of informal employment varies. Unni &
Rani (2003) consider all workers without the benefit of paid leave as informally employed. So here, paid
leave is the benchmark social security benefit. Sastry (2003) identifies the informally employed as all self
employed in informal enterprises, casual labourers, and regular workers who are either part-time or
temporary or not covered under provident fund. In Kolli & Sinharay (2011, 2014) , the presence of a
written contract is a basic minimum social security and they define informal jobs as any job not subject
to written contracts for more than one year. For the 66th Round, since information on job contracts was
largely missing, the presence of social security (PF/Gratuity/Healthcare) was also taken into account.
Unni & Naik (2013) identify various degrees of informal employment – IE1, IE2 & IE3. Under IE1, an
individual with either standard social security protection (Employee’s State Insurance/Provident
Fund/Gratuity) or paid leave qualifies as formally employed. An individual who does not have either of
these is an informal worker. IE2 adds an additional criterion – the presence of an open-ended contract
for more than a year. IE3 adds provision of state-sponsored pension. So, in each successive definition
an additional indicator of social security is appended. This is used to identify degrees of informal
employment.
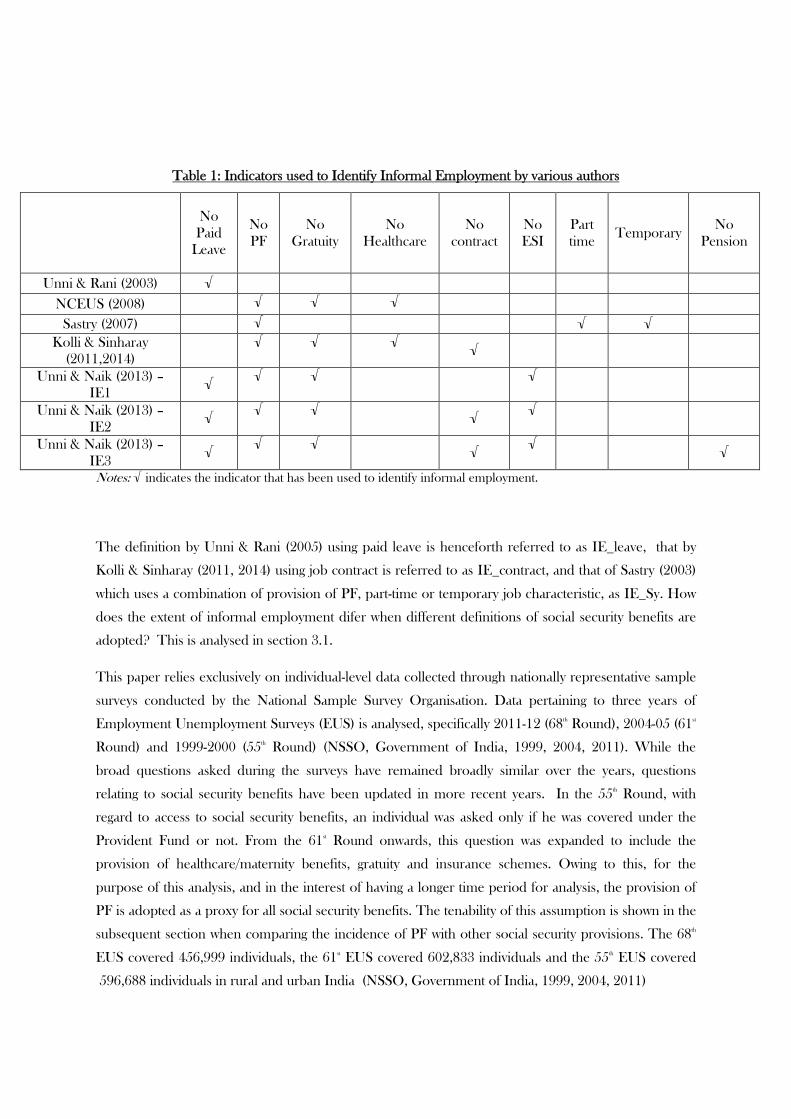
Table 1: Indicators used to Identify Informal Employment by various authors
No
Paid Leave
No PF
No Gratuity
No Healthcare
No contract
No ESI
Part time
Temporary No
Pension
Unni & Rani (2003) √
NCEUS (2008) √ √ √
Sastry (2007) √ √ √ Kolli & Sinharay
(2011,2014)
√ √ √ √
Unni & Naik (2013) – IE1
√ √ √
√
Unni & Naik (2013) – IE2
√ √ √
√ √
Unni & Naik (2013) – IE3
√ √ √
√ √
√
Notes: √ indicates the indicator that has been used to identify informal employment.
The definition by Unni & Rani (2005) using paid leave is henceforth referred to as IE_leave, that by
Kolli & Sinharay (2011, 2014) using job contract is referred to as IE_contract, and that of Sastry (2003)
which uses a combination of provision of PF, part-time or temporary job characteristic, as IE_Sy. How
does the extent of informal employment difer when different definitions of social security benefits are
adopted? This is analysed in section 3.1.
This paper relies exclusively on individual-level data collected through nationally representative sample
surveys conducted by the National Sample Survey Organisation. Data pertaining to three years of
Employment Unemployment Surveys (EUS) is analysed, specifically 2011-12 (68th Round), 2004-05 (61st
Round) and 1999-2000 (55th Round) (NSSO, Government of India, 1999, 2004, 2011). While the
broad questions asked during the surveys have remained broadly similar over the years, questions
relating to social security benefits have been updated in more recent years. In the 55th Round, with
regard to access to social security benefits, an individual was asked only if he was covered under the
Provident Fund or not. From the 61st Round onwards, this question was expanded to include the
provision of healthcare/maternity benefits, gratuity and insurance schemes. Owing to this, for the
purpose of this analysis, and in the interest of having a longer time period for analysis, the provision of
PF is adopted as a proxy for all social security benefits. The tenability of this assumption is shown in the
subsequent section when comparing the incidence of PF with other social security provisions. The 68th
EUS covered 456,999 individuals, the 61st EUS covered 602,833 individuals and the 55th EUS covered
596,688 individuals in rural and urban India (NSSO, Government of India, 1999, 2004, 2011)
Based on this definition, for the purpose of this study and in the context of the secondary data used,
informal employment is defined as any employment without the provision of Provident Fund,
irrespective of the (formal or informal) nature of the enterprise. Accordingly, forms of employment are
categorised into formal employment (FE), informal employment in informal enterprises (IIE), informal
employment in formal enterprises (IFE) and self employment (SE). In rural areas, two additional
categories are included – the agricultural labourers and cultivators. The next section provides an
overview of the broad trends in these forms of employment, with particular focus on the emergence of
the informal workforce in the formal enterprises.
3. Forms of Informal Employment: Trends and Incidence
3.1 Measuring Types of Informality among Wage Workers
Precarious employment takes several forms. Workers are not assured continuity in their employment
status, have limited or no availability of paid leave, have very insecure work arrangements with no
written contracts, or have little or no benefits attached to their employment (gratuity, employers’
contributions to provident fund, health insurance etc). The incidence of these forms of precarity is
revealed below.
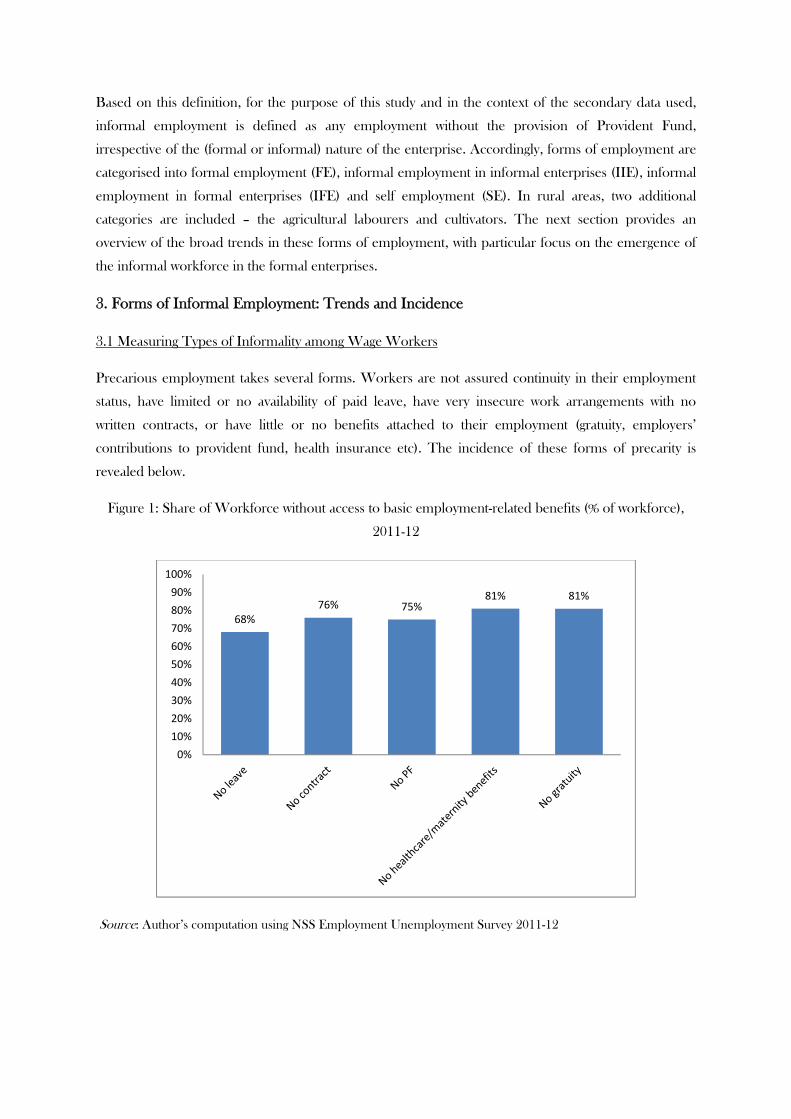
Figure 1: Share of Workforce without access to basic employment-related benefits (% of workforce),
2011-12
Source: Author’s computation using NSS Employment Unemployment Survey 2011-12
68%76% 75%
81% 81%
0%
10%
20%
30%
40%
50%
60%
70%
80%
90%
100%
The majority of wage workers did not have basic employment benefits, as Figure 1 reveals. As
mentioned earlier, the provision of PF is taken as a proxy for all social security benefits. The analysis of
employment data revealed that almost 90 per cent of workers who did not have PF did not have access
to paid leave or a written job contract. Therefore, the availability of PF provision was a tenable indicator
of the provision of other social security benefits, justifying the adoption of this definition of informal
employment i.e. all workers without PF, for the purpose of this analysis. Proceeding with the definition
of informal employment as those without any PF, the broad trends and incidence of forms of
employment may be analysed
3.2. Trends in Employment Outcomes
In India, the self employed have formed the majority of the workforce, and are the most prominent of
the informally employed. In 2011-12, the (non-agricultural) self employed continued to be the most
prominent in the workforce.. The majority of these self employed (95%) are own-account workers while
the remaining are employers. The own account workers constitute a ‘mixed bag’ (Papola & Sahu, 2012).
About 37% of these self employed own account workers were engaged in agricultural activities, while
another 20% were engaged in retail trade activities largely as vegetable vendors, petty traders and other
small-scale retail activities. Given the ease of entry into such activities and the unavailability of formal
employment, it is not surprising that self employment was the most prevalent economic activity.
However, since 2004-05, their numbers in the workforce have declined. As will be seen, this has been
accompanied by an increase in the wage workers in rural and urban areas.
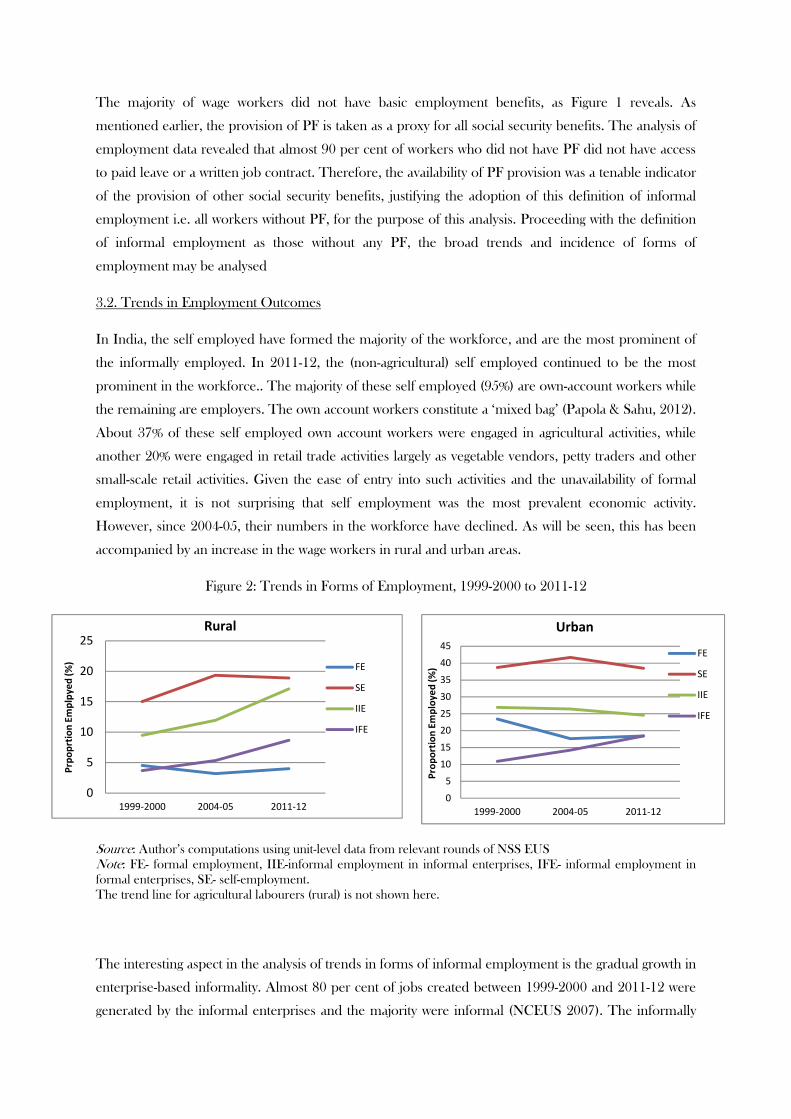
Figure 2: Trends in Forms of Employment, 1999-2000 to 2011-12
Source: Author’s computations using unit-level data from relevant rounds of NSS EUS Note: FE- formal employment, IIE-informal employment in informal enterprises, IFE- informal employment in formal enterprises, SE- self-employment. The trend line for agricultural labourers (rural) is not shown here.
The interesting aspect in the analysis of trends in forms of informal employment is the gradual growth in
enterprise-based informality. Almost 80 per cent of jobs created between 1999-2000 and 2011-12 were
generated by the informal enterprises and the majority were informal (NCEUS 2007). The informally
0
5
10
15
20
25
30
35
40
45
1999-2000 2004-05 2011-12
Pro
po
rtio
n E
mp
loye
d (%
)
Urban
FE
SE
IIE
IFE
0
5
10
15
20
25
1999-2000 2004-05 2011-12
Prp
op
rtio
n E
mp
lpye
d (%
)
Rural
FE
SE
IIE
IFE
employed in informal enterprises (henceforth IIE) increased in rural areas from 9 per cent in 1999-
2000 to 17 per cent in 2011-12. This may be a consequence of the greater proliferation of informal
enterprises in these regions (Ghani, Goswami & Kerr, 2012) On the other hand, the share of IIE has
remained fairly stagnant in urban areas at around 25 per cent. Formal enterprises on the other hand
have contributed less than 20 per cent to employment creation in the last decade (NCEUS 2007).
These jobs have been mainly in the urban areas, having increased from 10 per cent of the labour force
to 18 per cent in 2011-12. In fact, the hiring of formal workers by these formal enterprises (FE) has
declined over the years. Instead they have increasingly hired informal workers, creating a new form of
informal employment, i.e. informal employment in formal enterprises (henceforth IFE). This trend,
i.e. the informalisation of the formal sector, indicates the growing tendency of large, formal firms to hire
workers under vulnerable and insecure employment arrangements. Labour laws in India have also
implicitly facilitated the informalisation of the labour force (Chakraborty, 2015).
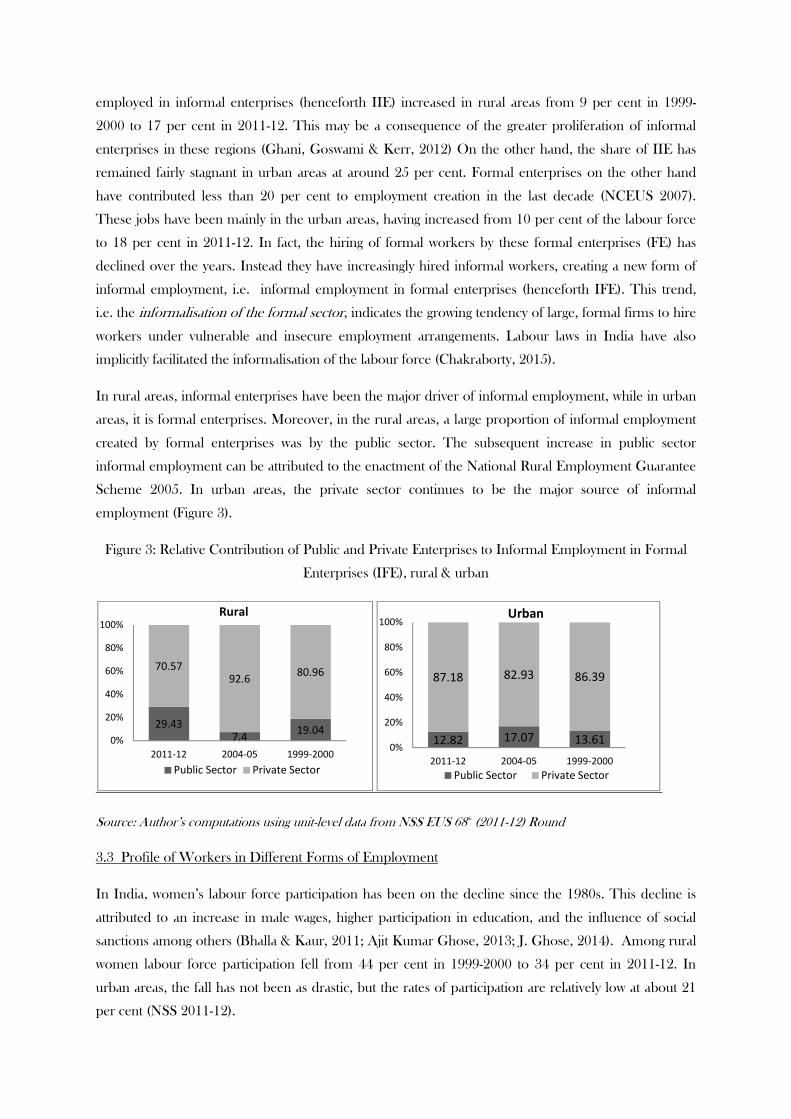
In rural areas, informal enterprises have been the major driver of informal employment, while in urban
areas, it is formal enterprises. Moreover, in the rural areas, a large proportion of informal employment
created by formal enterprises was by the public sector. The subsequent increase in public sector
informal employment can be attributed to the enactment of the National Rural Employment Guarantee
Scheme 2005. In urban areas, the private sector continues to be the major source of informal
employment (Figure 3).
Figure 3: Relative Contribution of Public and Private Enterprises to Informal Employment in Formal
Enterprises (IFE), rural & urban
Source: Author’s computations using unit-level data from NSS EUS 68th (2011-12) Round
3.3 Profile of Workers in Different Forms of Employment
In India, women’s labour force participation has been on the decline since the 1980s. This decline is
attributed to an increase in male wages, higher participation in education, and the influence of social
sanctions among others (Bhalla & Kaur, 2011; Ajit Kumar Ghose, 2013; J. Ghose, 2014). Among rural
women labour force participation fell from 44 per cent in 1999-2000 to 34 per cent in 2011-12. In
urban areas, the fall has not been as drastic, but the rates of participation are relatively low at about 21
per cent (NSS 2011-12).
29.437.4
19.04
70.5792.6
80.96
0%
20%
40%
60%
80%
100%
2011-12 2004-05 1999-2000
Rural
Public Sector Private Sector
12.82 17.07 13.61
87.18 82.93 86.39
0%
20%
40%
60%
80%
100%
2011-12 2004-05 1999-2000
Urban
Public Sector Private Sector
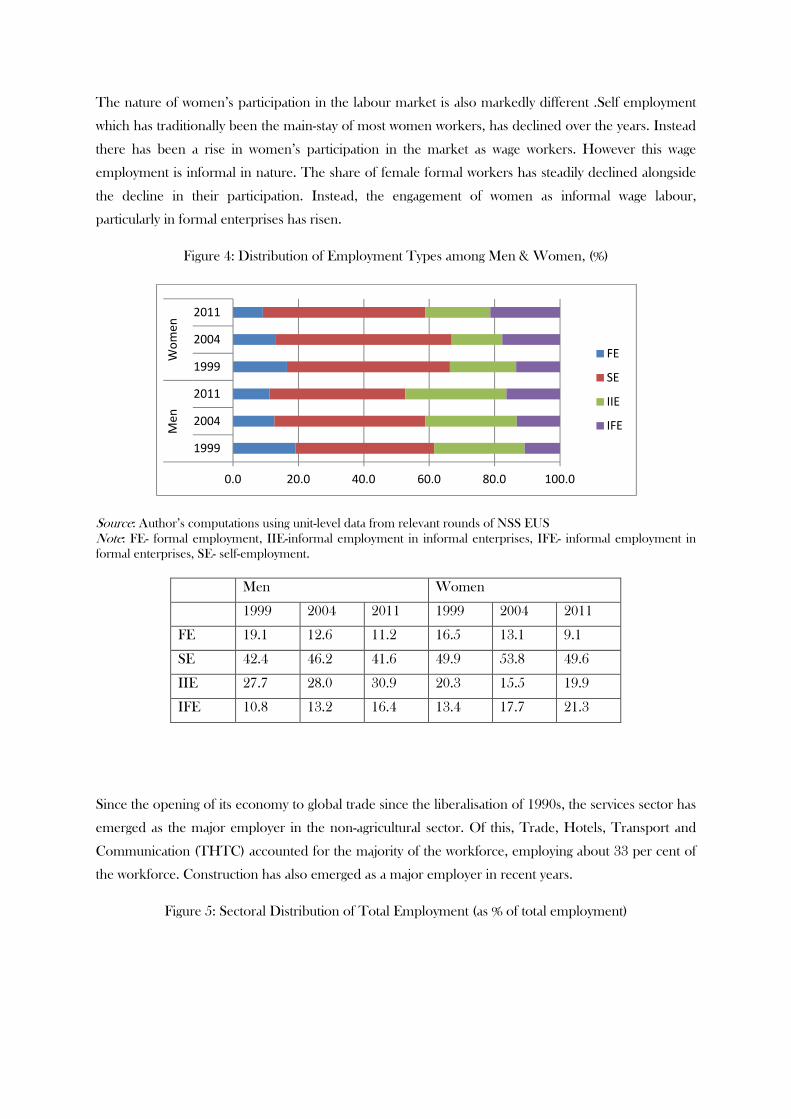
The nature of women’s participation in the labour market is also markedly different .Self employment
which has traditionally been the main-stay of most women workers, has declined over the years. Instead
there has been a rise in women’s participation in the market as wage workers. However this wage
employment is informal in nature. The share of female formal workers has steadily declined alongside
the decline in their participation. Instead, the engagement of women as informal wage labour,
particularly in formal enterprises has risen.
Figure 4: Distribution of Employment Types among Men & Women, (%)
Source: Author’s computations using unit-level data from relevant rounds of NSS EUS Note: FE- formal employment, IIE-informal employment in informal enterprises, IFE- informal employment in formal enterprises, SE- self-employment.
Men Women
1999 2004 2011 1999 2004 2011
FE 19.1 12.6 11.2 16.5 13.1 9.1
SE 42.4 46.2 41.6 49.9 53.8 49.6
IIE 27.7 28.0 30.9 20.3 15.5 19.9
IFE 10.8 13.2 16.4 13.4 17.7 21.3
Since the opening of its economy to global trade since the liberalisation of 1990s, the services sector has
emerged as the major employer in the non-agricultural sector. Of this, Trade, Hotels, Transport and
Communication (THTC) accounted for the majority of the workforce, employing about 33 per cent of
the workforce. Construction has also emerged as a major employer in recent years.
Figure 5: Sectoral Distribution of Total Employment (as % of total employment)
0.0 20.0 40.0 60.0 80.0 100.0
1999
2004
2011
1999
2004
2011
Men
Wo
men
FE
SE
IIE
IFE
Source: Author’s computations using unit-level data from relevant rounds of NSS EUS Note: FE- formal employment, IIE-informal employment in informal enterprises, IFE- informal employment in formal enterprises, SE- self-employment. Mfing – Manufacturing, Const- Construction, THTC – Trade, Hotels, Transport and Communication, FIRE – Financial Services, Insurance and Real Estate, PACS – Public Administration, Community Services
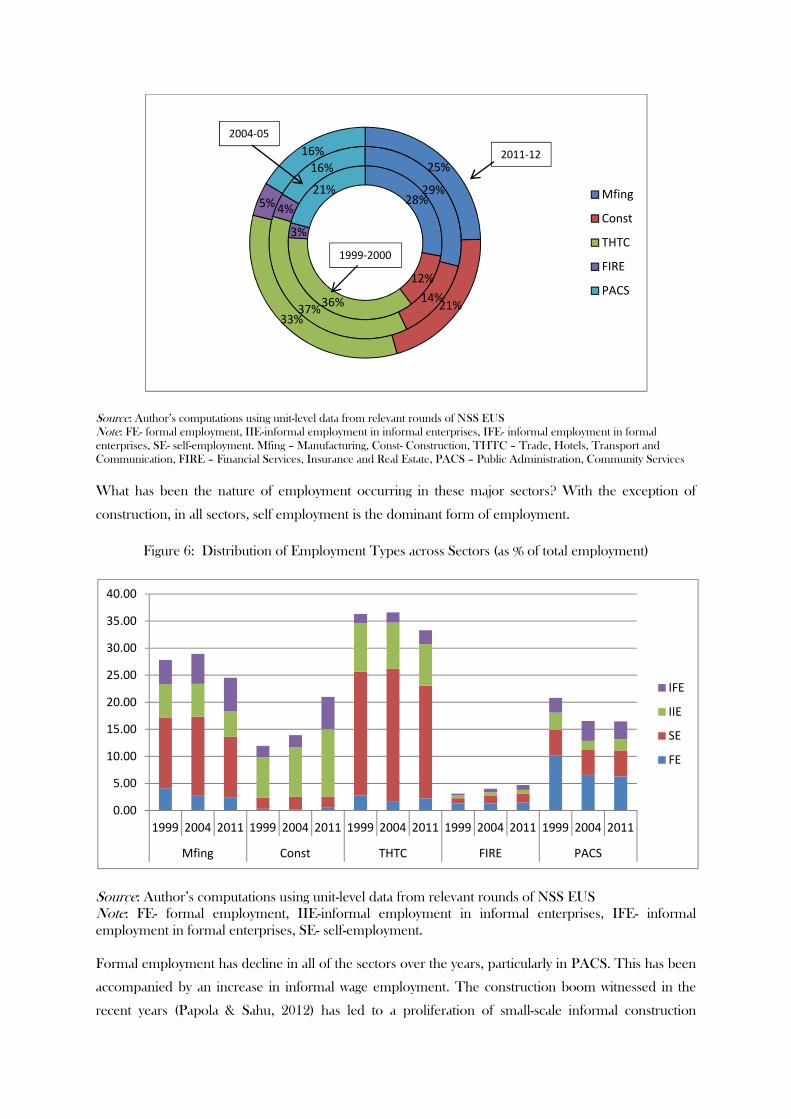
What has been the nature of employment occurring in these major sectors? With the exception of
construction, in all sectors, self employment is the dominant form of employment.
Figure 6: Distribution of Employment Types across Sectors (as % of total employment)
Source: Author’s computations using unit-level data from relevant rounds of NSS EUS Note: FE- formal employment, IIE-informal employment in informal enterprises, IFE- informal employment in formal enterprises, SE- self-employment. Formal employment has decline in all of the sectors over the years, particularly in PACS. This has been
accompanied by an increase in informal wage employment. The construction boom witnessed in the
recent years (Papola & Sahu, 2012) has led to a proliferation of small-scale informal construction
28%
12%
36%
3%
21% 29%
14%37%
4%
16% 25%
21%33%
5%
16%
Mfing
Const
THTC
FIRE
PACS
2011-12
2004-05
1999-2000
0.00
5.00
10.00
15.00
20.00
25.00
30.00
35.00
40.00
1999 2004 2011 1999 2004 2011 1999 2004 2011 1999 2004 2011 1999 2004 2011
Mfing Const THTC FIRE PACS
IFE
IIE
SE
FE
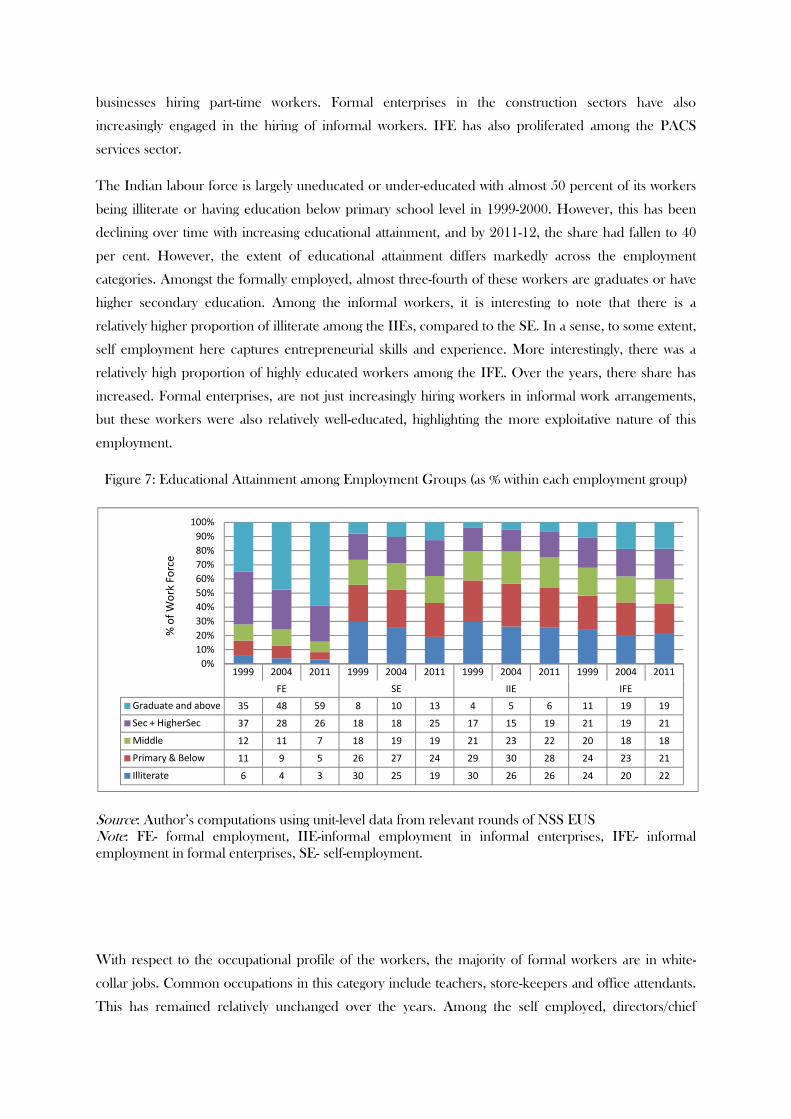
businesses hiring part-time workers. Formal enterprises in the construction sectors have also
increasingly engaged in the hiring of informal workers. IFE has also proliferated among the PACS
services sector.
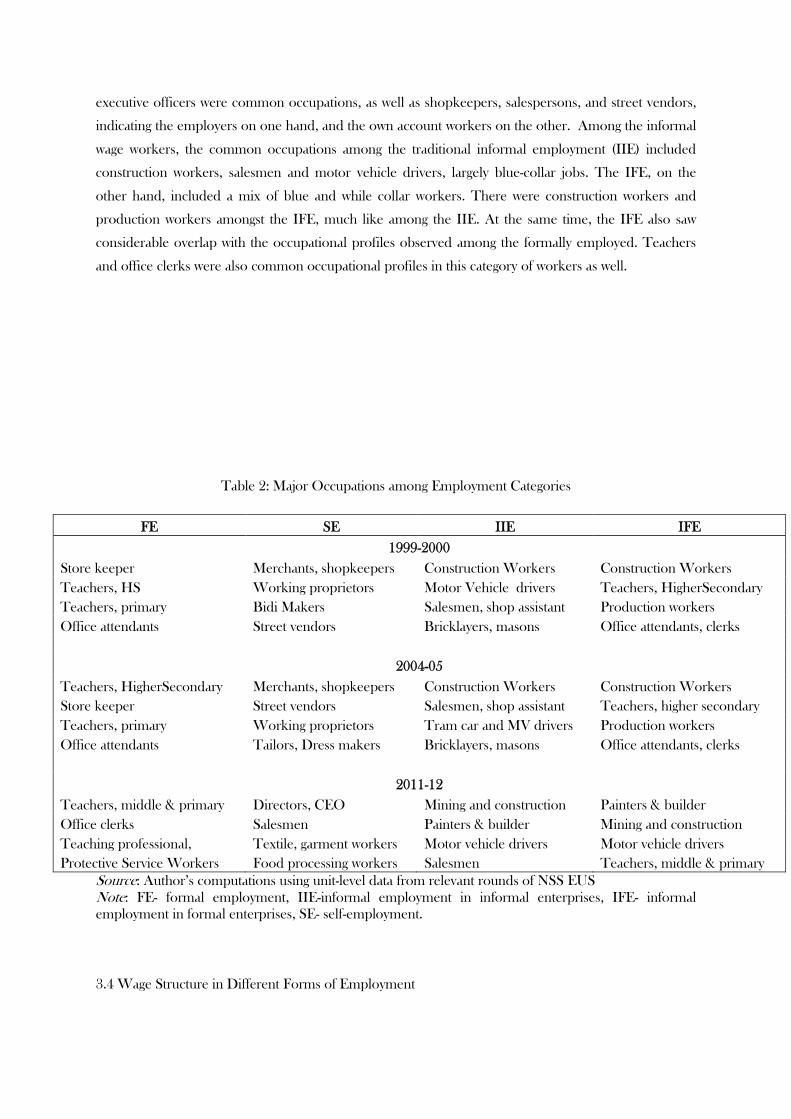
The Indian labour force is largely uneducated or under-educated with almost 50 percent of its workers
being illiterate or having education below primary school level in 1999-2000. However, this has been
declining over time with increasing educational attainment, and by 2011-12, the share had fallen to 40
per cent. However, the extent of educational attainment differs markedly across the employment
categories. Amongst the formally employed, almost three-fourth of these workers are graduates or have
higher secondary education. Among the informal workers, it is interesting to note that there is a
relatively higher proportion of illiterate among the IIEs, compared to the SE. In a sense, to some extent,
self employment here captures entrepreneurial skills and experience. More interestingly, there was a
relatively high proportion of highly educated workers among the IFE. Over the years, there share has
increased. Formal enterprises, are not just increasingly hiring workers in informal work arrangements,
but these workers were also relatively well-educated, highlighting the more exploitative nature of this
employment.
Figure 7: Educational Attainment among Employment Groups (as % within each employment group)
Source: Author’s computations using unit-level data from relevant rounds of NSS EUS Note: FE- formal employment, IIE-informal employment in informal enterprises, IFE- informal employment in formal enterprises, SE- self-employment.
With respect to the occupational profile of the workers, the majority of formal workers are in white-
collar jobs. Common occupations in this category include teachers, store-keepers and office attendants.
This has remained relatively unchanged over the years. Among the self employed, directors/chief
1999 2004 2011 1999 2004 2011 1999 2004 2011 1999 2004 2011
FE SE IIE IFE
Graduate and above 35 48 59 8 10 13 4 5 6 11 19 19
Sec + HigherSec 37 28 26 18 18 25 17 15 19 21 19 21
Middle 12 11 7 18 19 19 21 23 22 20 18 18
Primary & Below 11 9 5 26 27 24 29 30 28 24 23 21
Illiterate 6 4 3 30 25 19 30 26 26 24 20 22
0%
10%
20%
30%
40%
50%
60%
70%
80%
90%
100%
% o
f W
ork
Fo
rce
executive officers were common occupations, as well as shopkeepers, salespersons, and street vendors,
indicating the employers on one hand, and the own account workers on the other. Among the informal
wage workers, the common occupations among the traditional informal employment (IIE) included
construction workers, salesmen and motor vehicle drivers, largely blue-collar jobs. The IFE, on the
other hand, included a mix of blue and while collar workers. There were construction workers and
production workers amongst the IFE, much like among the IIE. At the same time, the IFE also saw
considerable overlap with the occupational profiles observed among the formally employed. Teachers
and office clerks were also common occupational profiles in this category of workers as well.
Table 2: Major Occupations among Employment Categories
FE SE IIE IFE
1999-2000
Store keeper Merchants, shopkeepers Construction Workers Construction Workers
Teachers, HS Working proprietors Motor Vehicle drivers Teachers, HigherSecondary
Teachers, primary Bidi Makers Salesmen, shop assistant Production workers
Office attendants Street vendors Bricklayers, masons Office attendants, clerks
2004-05
Teachers, HigherSecondary Merchants, shopkeepers Construction Workers Construction Workers
Store keeper Street vendors Salesmen, shop assistant Teachers, higher secondary
Teachers, primary Working proprietors Tram car and MV drivers Production workers
Office attendants Tailors, Dress makers Bricklayers, masons Office attendants, clerks
2011-12
Teachers, middle & primary Directors, CEO Mining and construction Painters & builder
Office clerks Salesmen Painters & builder Mining and construction
Teaching professional, Textile, garment workers Motor vehicle drivers Motor vehicle drivers
Protective Service Workers Food processing workers Salesmen Teachers, middle & primary Source: Author’s computations using unit-level data from relevant rounds of NSS EUS Note: FE- formal employment, IIE-informal employment in informal enterprises, IFE- informal employment in formal enterprises, SE- self-employment.
3.4 Wage Structure in Different Forms of Employment
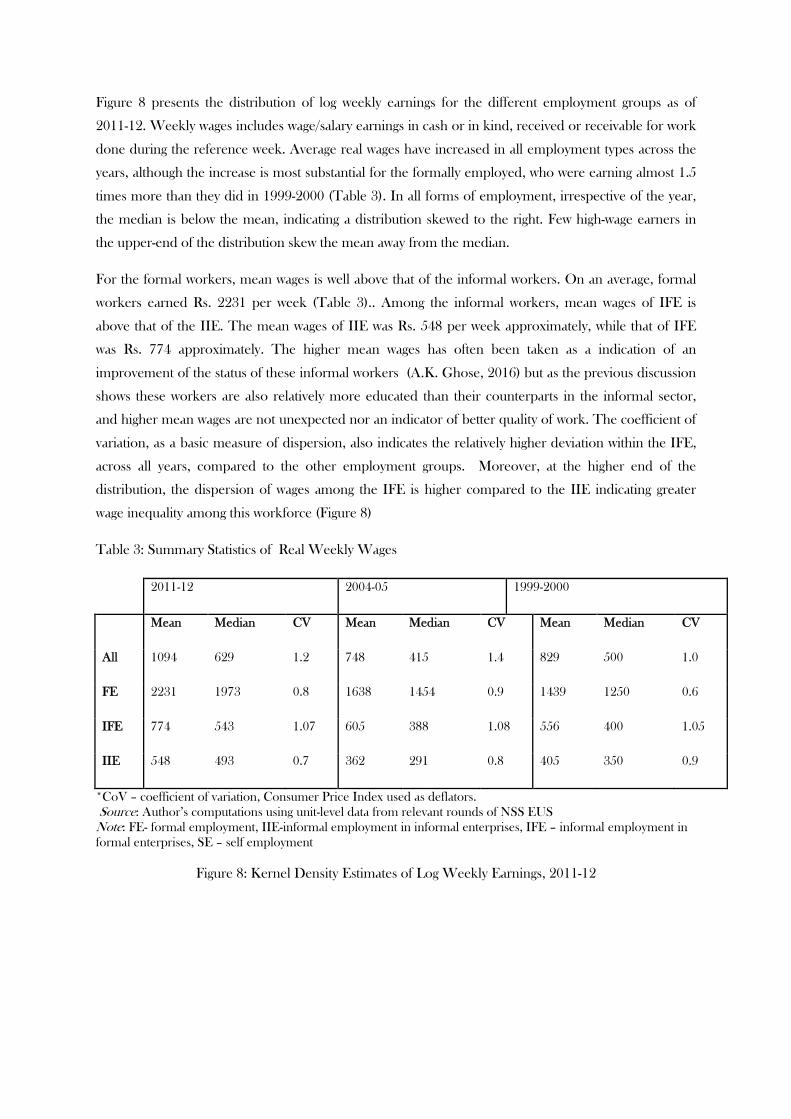
Figure 8 presents the distribution of log weekly earnings for the different employment groups as of
2011-12. Weekly wages includes wage/salary earnings in cash or in kind, received or receivable for work
done during the reference week. Average real wages have increased in all employment types across the
years, although the increase is most substantial for the formally employed, who were earning almost 1.5
times more than they did in 1999-2000 (Table 3). In all forms of employment, irrespective of the year,
the median is below the mean, indicating a distribution skewed to the right. Few high-wage earners in
the upper-end of the distribution skew the mean away from the median.
For the formal workers, mean wages is well above that of the informal workers. On an average, formal
workers earned Rs. 2231 per week (Table 3).. Among the informal workers, mean wages of IFE is
above that of the IIE. The mean wages of IIE was Rs. 548 per week approximately, while that of IFE
was Rs. 774 approximately. The higher mean wages has often been taken as a indication of an
improvement of the status of these informal workers (A.K. Ghose, 2016) but as the previous discussion
shows these workers are also relatively more educated than their counterparts in the informal sector,
and higher mean wages are not unexpected nor an indicator of better quality of work. The coefficient of
variation, as a basic measure of dispersion, also indicates the relatively higher deviation within the IFE,
across all years, compared to the other employment groups. Moreover, at the higher end of the
distribution, the dispersion of wages among the IFE is higher compared to the IIE indicating greater
wage inequality among this workforce (Figure 8)
Table 3: Summary Statistics of Real Weekly Wages
2011-12 2004-05 1999-2000
Mean Median CV Mean Median CV Mean Median CV
All 1094 629 1.2 748 415 1.4 829 500 1.0
FE 2231 1973 0.8 1638 1454 0.9 1439 1250 0.6
IFE 774 543 1.07 605 388 1.08 556 400 1.05
IIE 548 493 0.7 362 291 0.8 405 350 0.9
*CoV – coefficient of variation, Consumer Price Index used as deflators. Source: Author’s computations using unit-level data from relevant rounds of NSS EUS Note: FE- formal employment, IIE-informal employment in informal enterprises, IFE – informal employment in formal enterprises, SE – self employment
Figure 8: Kernel Density Estimates of Log Weekly Earnings, 2011-12
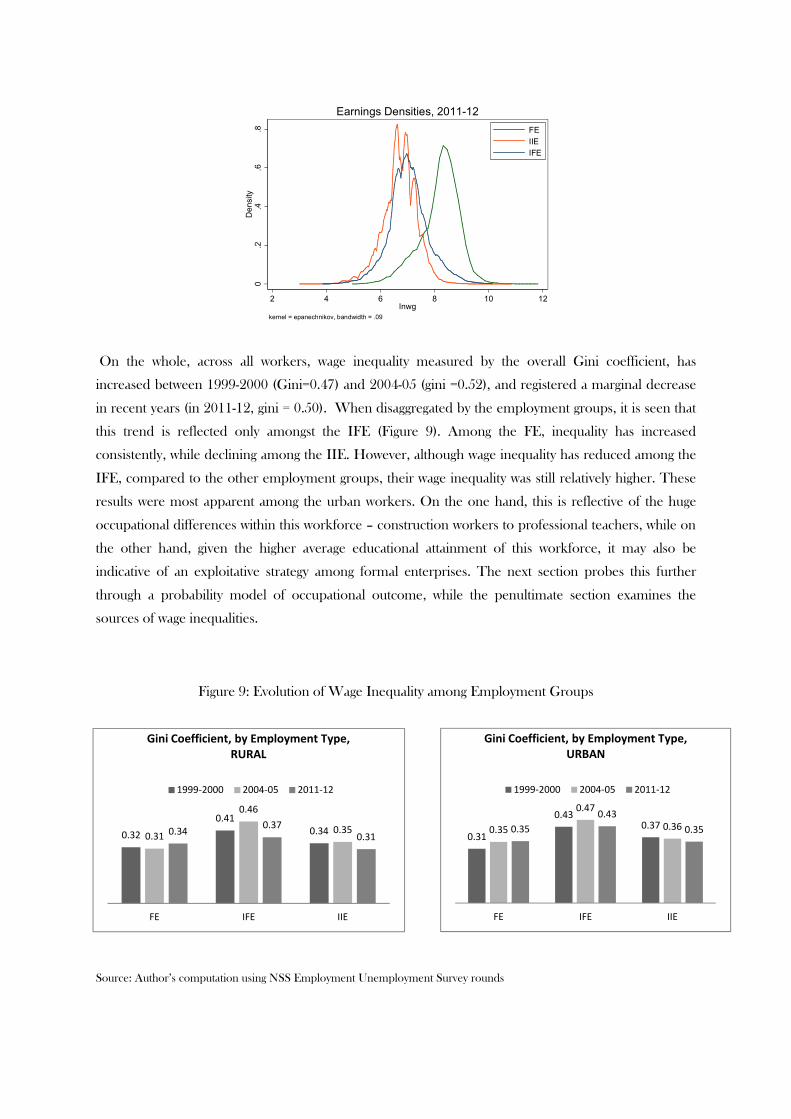
On the whole, across all workers, wage inequality measured by the overall Gini coefficient, has
increased between 1999-2000 (Gini=0.47) and 2004-05 (gini =0.52), and registered a marginal decrease
in recent years (in 2011-12, gini = 0.50). When disaggregated by the employment groups, it is seen that
this trend is reflected only amongst the IFE (Figure 9). Among the FE, inequality has increased
consistently, while declining among the IIE. However, although wage inequality has reduced among the
IFE, compared to the other employment groups, their wage inequality was still relatively higher. These
results were most apparent among the urban workers. On the one hand, this is reflective of the huge
occupational differences within this workforce – construction workers to professional teachers, while on
the other hand, given the higher average educational attainment of this workforce, it may also be
indicative of an exploitative strategy among formal enterprises. The next section probes this further
through a probability model of occupational outcome, while the penultimate section examines the
sources of wage inequalities.
Figure 9: Evolution of Wage Inequality among Employment Groups
Source: Author’s computation using NSS Employment Unemployment Survey rounds
0.2
.4.6
.8D
ensity
2 4 6 8 10 12lnwg
FE
IIE
IFE
kernel = epanechnikov, bandwidth = .09
Earnings Densities, 2011-12
0.31
0.430.370.35
0.47
0.360.35
0.43
0.35
FE IFE IIE
Gini Coefficient, by Employment Type, URBAN
1999-2000 2004-05 2011-12
0.32
0.410.340.31
0.46
0.350.340.37
0.31
FE IFE IIE
Gini Coefficient, by Employment Type, RURAL
1999-2000 2004-05 2011-12
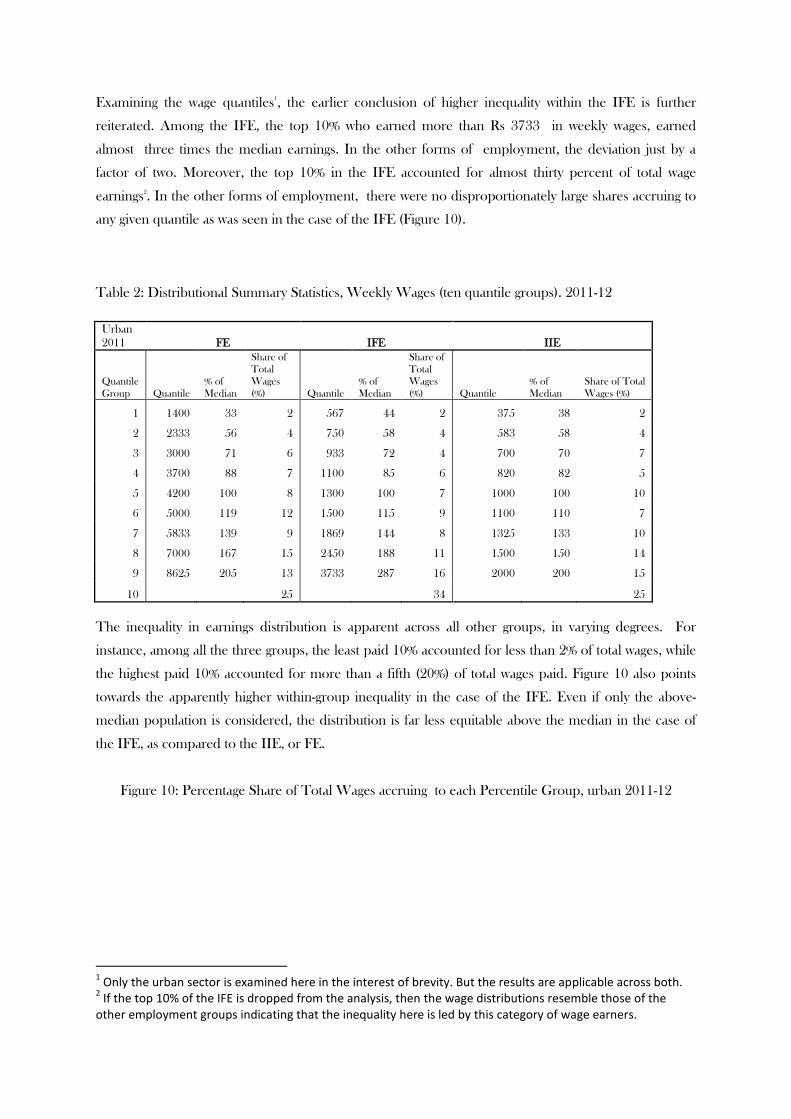
Examining the wage quantiles1, the earlier conclusion of higher inequality within the IFE is further
reiterated. Among the IFE, the top 10% who earned more than Rs 3733 in weekly wages, earned
almost three times the median earnings. In the other forms of employment, the deviation just by a
factor of two. Moreover, the top 10% in the IFE accounted for almost thirty percent of total wage
earnings2. In the other forms of employment, there were no disproportionately large shares accruing to
any given quantile as was seen in the case of the IFE (Figure 10).
Table 2: Distributional Summary Statistics, Weekly Wages (ten quantile groups). 2011-12
Urban 2011 FE IFE IIE
Quantile Group Quantile
% of Median
Share of Total Wages (%) Quantile
% of Median
Share of Total Wages (%) Quantile
% of Median
Share of Total Wages (%)
1 1400 33 2 567 44 2 375 38 2
2 2333 56 4 750 58 4 583 58 4
3 3000 71 6 933 72 4 700 70 7
4 3700 88 7 1100 85 6 820 82 5
5 4200 100 8 1300 100 7 1000 100 10
6 5000 119 12 1500 115 9 1100 110 7
7 5833 139 9 1869 144 8 1325 133 10
8 7000 167 15 2450 188 11 1500 150 14
9 8625 205 13 3733 287 16 2000 200 15
10 25 34 25
The inequality in earnings distribution is apparent across all other groups, in varying degrees. For
instance, among all the three groups, the least paid 10% accounted for less than 2% of total wages, while
the highest paid 10% accounted for more than a fifth (20%) of total wages paid. Figure 10 also points
towards the apparently higher within-group inequality in the case of the IFE. Even if only the above-
median population is considered, the distribution is far less equitable above the median in the case of
the IFE, as compared to the IIE, or FE.
Figure 10: Percentage Share of Total Wages accruing to each Percentile Group, urban 2011-12
1 Only the urban sector is examined here in the interest of brevity. But the results are applicable across both.
2 If the top 10% of the IFE is dropped from the analysis, then the wage distributions resemble those of the
other employment groups indicating that the inequality here is led by this category of wage earners.
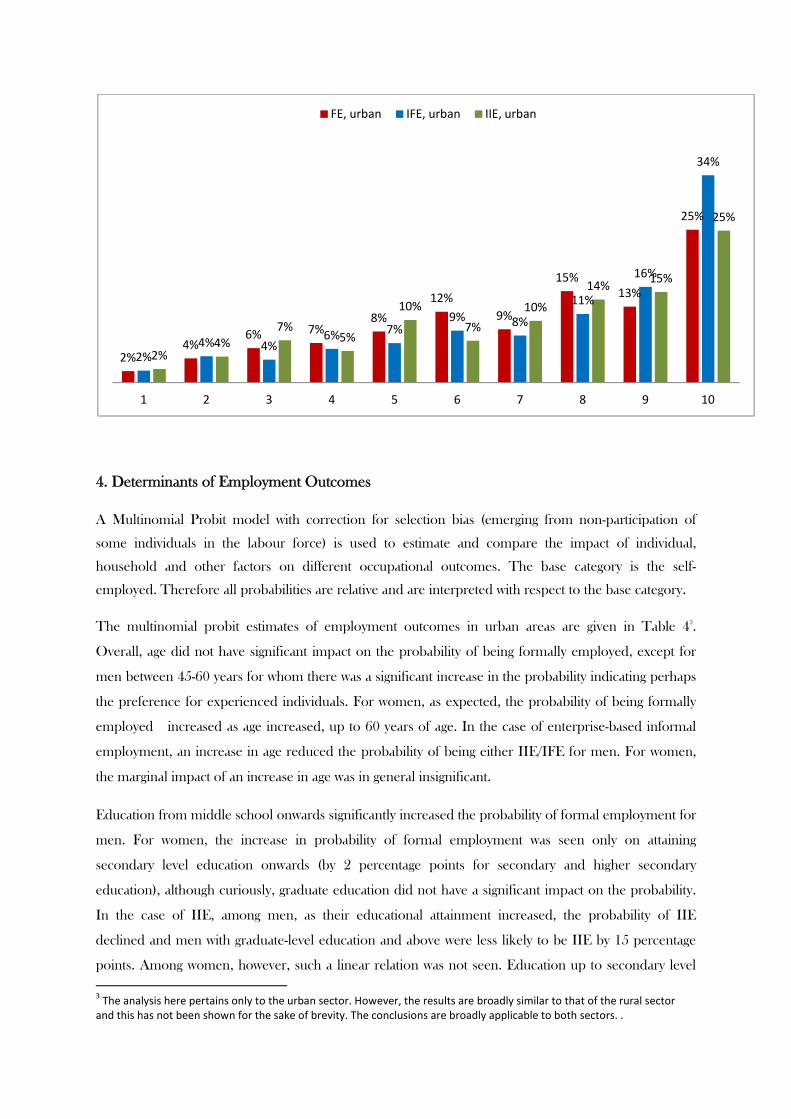
4. Determinants of Employment Outcomes
A Multinomial Probit model with correction for selection bias (emerging from non-participation of
some individuals in the labour force) is used to estimate and compare the impact of individual,
household and other factors on different occupational outcomes. The base category is the self-
employed. Therefore all probabilities are relative and are interpreted with respect to the base category.
The multinomial probit estimates of employment outcomes in urban areas are given in Table 43.
Overall, age did not have significant impact on the probability of being formally employed, except for
men between 45-60 years for whom there was a significant increase in the probability indicating perhaps
the preference for experienced individuals. For women, as expected, the probability of being formally
employed increased as age increased, up to 60 years of age. In the case of enterprise-based informal
employment, an increase in age reduced the probability of being either IIE/IFE for men. For women,
the marginal impact of an increase in age was in general insignificant.
Education from middle school onwards significantly increased the probability of formal employment for
men. For women, the increase in probability of formal employment was seen only on attaining
secondary level education onwards (by 2 percentage points for secondary and higher secondary
education), although curiously, graduate education did not have a significant impact on the probability.
In the case of IIE, among men, as their educational attainment increased, the probability of IIE
declined and men with graduate-level education and above were less likely to be IIE by 15 percentage
points. Among women, however, such a linear relation was not seen. Education up to secondary level
3 The analysis here pertains only to the urban sector. However, the results are broadly similar to that of the rural sector
and this has not been shown for the sake of brevity. The conclusions are broadly applicable to both sectors. .
2%4%
6% 7%8%
12%
9%
15%13%
25%
2%4% 4%
6% 7%9% 8%
11%
16%
34%
2%4%
7%5%
10%
7%
10%
14%15%
25%
1 2 3 4 5 6 7 8 9 10
FE, urban IFE, urban IIE, urban
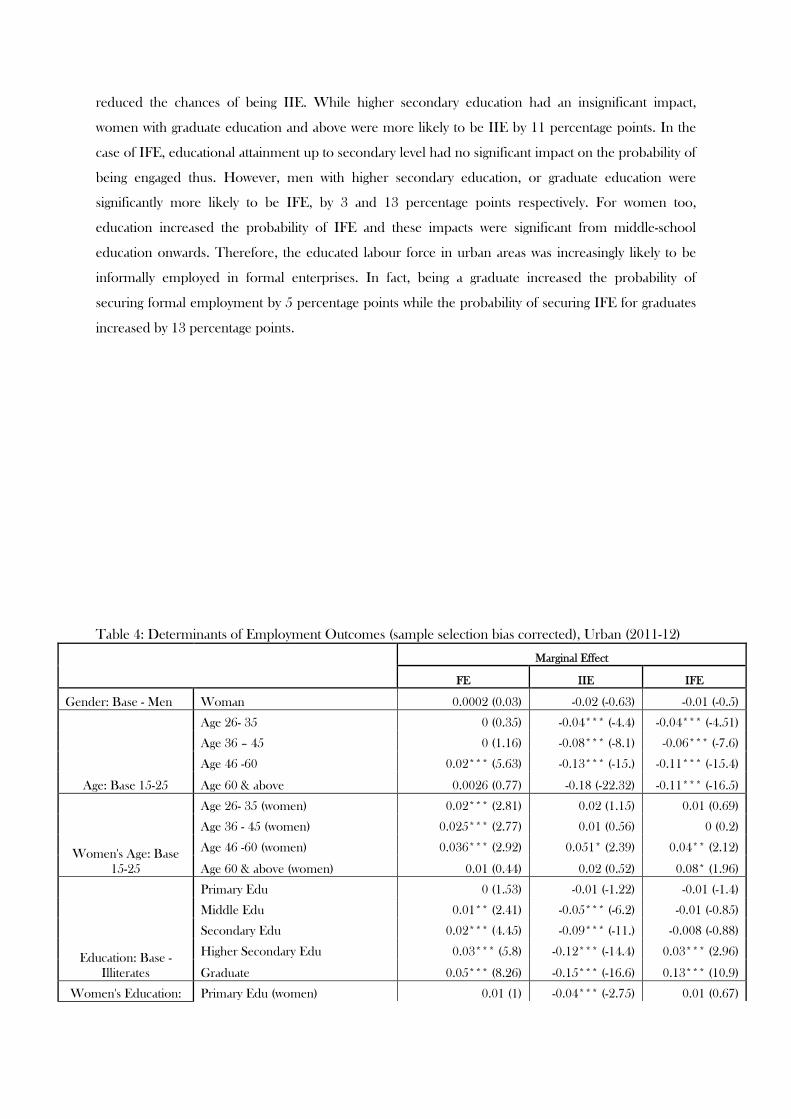
reduced the chances of being IIE. While higher secondary education had an insignificant impact,
women with graduate education and above were more likely to be IIE by 11 percentage points. In the
case of IFE, educational attainment up to secondary level had no significant impact on the probability of
being engaged thus. However, men with higher secondary education, or graduate education were
significantly more likely to be IFE, by 3 and 13 percentage points respectively. For women too,
education increased the probability of IFE and these impacts were significant from middle-school
education onwards. Therefore, the educated labour force in urban areas was increasingly likely to be
informally employed in formal enterprises. In fact, being a graduate increased the probability of
securing formal employment by 5 percentage points while the probability of securing IFE for graduates
increased by 13 percentage points.
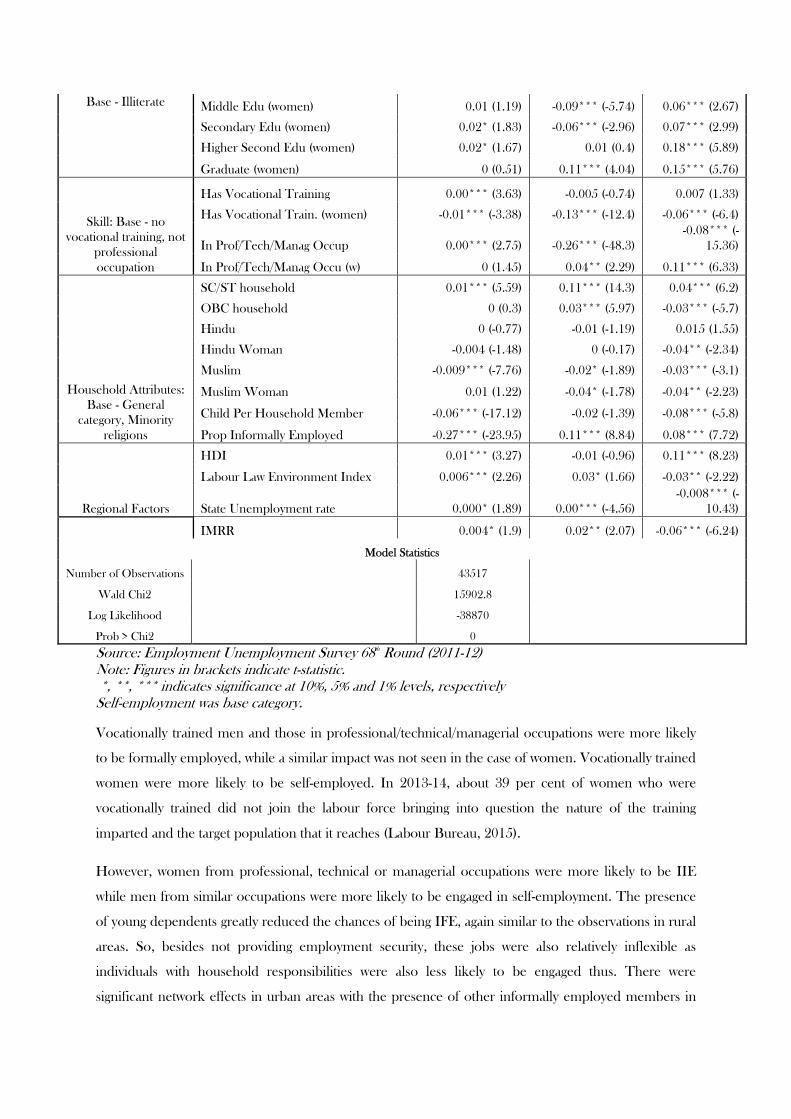
Table 4: Determinants of Employment Outcomes (sample selection bias corrected), Urban (2011-12)
Marginal Effect
FE IIE IFE
Gender: Base - Men Woman 0.0002 (0.03) -0.02 (-0.63) -0.01 (-0.5)
Age: Base 15-25
Age 26- 35 0 (0.35) -0.04*** (-4.4) -0.04*** (-4.51)
Age 36 – 45 0 (1.16) -0.08*** (-8.1) -0.06*** (-7.6)
Age 46 -60 0.02*** (5.63) -0.13*** (-15.) -0.11*** (-15.4)
Age 60 & above 0.0026 (0.77) -0.18 (-22.32) -0.11*** (-16.5)
Women's Age: Base 15-25
Age 26- 35 (women) 0.02*** (2.81) 0.02 (1.15) 0.01 (0.69)
Age 36 - 45 (women) 0.025*** (2.77) 0.01 (0.56) 0 (0.2)
Age 46 -60 (women) 0.036*** (2.92) 0.051* (2.39) 0.04** (2.12)
Age 60 & above (women) 0.01 (0.44) 0.02 (0.52) 0.08* (1.96)
Education: Base - Illiterates
Primary Edu 0 (1.53) -0.01 (-1.22) -0.01 (-1.4)
Middle Edu 0.01** (2.41) -0.05*** (-6.2) -0.01 (-0.85)
Secondary Edu 0.02*** (4.45) -0.09*** (-11.) -0.008 (-0.88)
Higher Secondary Edu 0.03*** (5.8) -0.12*** (-14.4) 0.03*** (2.96)
Graduate 0.05*** (8.26) -0.15*** (-16.6) 0.13*** (10.9)
Women's Education: Primary Edu (women) 0.01 (1) -0.04*** (-2.75) 0.01 (0.67)
Base - Illiterate Middle Edu (women) 0.01 (1.19) -0.09*** (-5.74) 0.06*** (2.67)
Secondary Edu (women) 0.02* (1.83) -0.06*** (-2.96) 0.07*** (2.99)
Higher Second Edu (women) 0.02* (1.67) 0.01 (0.4) 0.18*** (5.89)
Graduate (women) 0 (0.51) 0.11*** (4.04) 0.15*** (5.76)
Skill: Base - no vocational training, not
professional occupation
Has Vocational Training 0.00*** (3.63) -0.005 (-0.74) 0.007 (1.33)
Has Vocational Train. (women) -0.01*** (-3.38) -0.13*** (-12.4) -0.06*** (-6.4)
In Prof/Tech/Manag Occup 0.00*** (2.75) -0.26*** (-48.3) -0.08*** (-
15.36)
In Prof/Tech/Manag Occu (w) 0 (1.45) 0.04** (2.29) 0.11*** (6.33)
Household Attributes: Base - General
category, Minority religions
SC/ST household 0.01*** (5.59) 0.11*** (14.3) 0.04*** (6.2)
OBC household 0 (0.3) 0.03*** (5.97) -0.03*** (-5.7)
Hindu 0 (-0.77) -0.01 (-1.19) 0.015 (1.55)
Hindu Woman -0.004 (-1.48) 0 (-0.17) -0.04** (-2.34)
Muslim -0.009*** (-7.76) -0.02* (-1.89) -0.03*** (-3.1)
Muslim Woman 0.01 (1.22) -0.04* (-1.78) -0.04** (-2.23)
Child Per Household Member -0.06*** (-17.12) -0.02 (-1.39) -0.08*** (-5.8)
Prop Informally Employed -0.27*** (-23.95) 0.11*** (8.84) 0.08*** (7.72)
Regional Factors
HDI 0.01*** (3.27) -0.01 (-0.96) 0.11*** (8.23)
Labour Law Environment Index 0.006*** (2.26) 0.03* (1.66) -0.03** (-2.22)
State Unemployment rate 0.000* (1.89) 0.00*** (-4.56) -0.008*** (-
10.43)
IMRR 0.004* (1.9) 0.02** (2.07) -0.06*** (-6.24)
Model Statistics
Number of Observations 43517
Wald Chi2 15902.8
Log Likelihood -38870
Prob > Chi2 0
Source: Employment Unemployment Survey 68th Round (2011-12) Note: Figures in brackets indicate t-statistic. *, **, *** indicates significance at 10%, 5% and 1% levels, respectively Self-employment was base category.
Vocationally trained men and those in professional/technical/managerial occupations were more likely
to be formally employed, while a similar impact was not seen in the case of women. Vocationally trained
women were more likely to be self-employed. In 2013-14, about 39 per cent of women who were
vocationally trained did not join the labour force bringing into question the nature of the training
imparted and the target population that it reaches (Labour Bureau, 2015).
However, women from professional, technical or managerial occupations were more likely to be IIE
while men from similar occupations were more likely to be engaged in self-employment. The presence
of young dependents greatly reduced the chances of being IFE, again similar to the observations in rural
areas. So, besides not providing employment security, these jobs were also relatively inflexible as
individuals with household responsibilities were also less likely to be engaged thus. There were
significant network effects in urban areas with the presence of other informally employed members in

the same household greatly increasing the chance of the individual being informally employed
themselves.
5. Sources of Wage Inequality
To estimate the sources of wage inequality, a regression based decomposition (Fields, 2003)
methodology is adopted here. Based on a semi-log wage regression model
ln(��) = � + � ���� + ��
�
… . (4)
the decomposition method estimates �� =��������,����
�� �� �
where each ��(ln �) represents the ‘factor inequality weight’ capturing the contribution of factor variable
Xj to overall inequality. The results of the regression decomposition are given in Table 5.
Table 5: Relative Inequality Shares, 2011-12
FE IIE IFE
Gender 3.5 35.9 21.3
Education 32.3 9.9 41.6
Age 26.7 12.3 2.8
Occupation 24.0 3.1 15.3 Social Group/Religion 3.0 2.4 4.4
Industry 2.0 5.3 4.2
State 8.6 31.1 10.4
Total 100 100 100
Note: Occupation type – indicates whether occupation is professional/technical/managerial. Social Religion goup is an aggregate of relative factor shares accruing to dummy variables capturing membership in SC/ST and Muslim households. Industry is an aggregate of dummies representing manufacturing, construction and services
Among the formal workers, education accounted for 32% of wage inequality, followed by experience
and occupation-type, together accounting for half of the wage inequality amongst these workers. Among
the IIE, on the other hand, education had a relatively smaller contribution to wage inequality. Instead,
gender and state/region had important contributions, together accounting for more than half of the wage
inequality. This is indicative of IIE workers being less educated in general, and their wage incomes
largely depending on the function of the informal enterprises. Among the IFE, again, there were close
similarities with the formal workers. Education accounted for a significant share of wage inequality. As
seen earlier, this group of workers also had large variations in the educational attainment amongst them.
Therefore, these variations in educational attainment also accounted for the wage variations within
them. Gender also accounted for a prominent share of inequality among the IFE.
6. Conclusion
Informal employment constitutes more than three-quarters of the workforce in India. Over time, this
proportion has remained high, irrespective of how informal employment is defined and measured.
However, within informal employment, there have been interesting developments. By explicitly
accounting for the increasing informalisation of the formal labour market by separating informal
employment in terms of the nature of the employer (self , formal enterprise , informal enterprise), the
disaggregate analysis of informal employment provided some interesting insights.
The analysis of determinants of employment outcome revealed the varied motivations and profile of the
labour force. While the self-employed informal workers largely fit the typical profile of informally
employed – old and uneducated – the enterprise-based informal workers challenged these notions.
Instead, young and experienced individuals, with educational qualifications were increasingly employed
by the formal sector. The analysis of wage inequality within employment groups revealed the higher
disparities and inequalities within the informal workers in the formal sector. While wage inequality had
declined over time, it was still relatively high amongst these workers. Further the regression-based
decomposition identified education as being a prominent contributor to wage inequality among both the
formal workers and the informal workers in formal enterprises.
While the informal workers in formal enterprises may earn relatively higher wages than their
counterparts in the informal enterprises, it is not indicative of an improvement in quality of jobs. As this
analysis showed, the informal hiring in formal enterprises is a representation of a perverse form of
economic growth, where educated and qualified individuals are working in less than ideal employment
arrangements, reinforcing the notion of the creation of a ‘precariat’ class, the ‘first class in history
expected to labour and work at a lower level than the schooling it typically acquires’ (Standing, 2014, p.
x).. This is indicative of the exploitative practices prevalent in formal enterprises where profits and
returns on investments are being secured by supporting services provided by the informal economy
rather than increasing productivity or through innovations. Implicitly facilitated by ineffective and
counter-productive labour laws (Chakraborty, 2015) , this ‘low road to growth’ led by lowering wages
and labour standards rather than innovating or improving productivity (‘high road to growth’) signals a
race to the bottom (Sharma, 2006) in the pursuit of economic growth, with a perpetuation of existing
inequalities.
References
Amuedo-Dorantes, C. (2004). Determinants and Poverty Implications of Informal Sector Work in
Chile. Economic Development and Cultural Change, 52(2), 347–68.
Bhalla, S., & Kaur, R. (2011). Labour Force Participation of Women in India: Some facts, some
queries (Working Paper No. 40). London: London School of Economics. Retrieved from
http://www.lse.ac.uk/asiaResearchCentre/_files/ARCWP40-BhallaKaur.pdf
Chakraborty, A. (2015). Reforming Labour Markets in States. Economic and Political Weekly, 50(20),
52–57.
Charmes, J. (2011). Informality after 40 years of debates: origins, development and ambiguities of a
successful concept. Presented at the WIEGO Research Conference, Cape Town, South Africa.
Retrieved from http://www.erudite.univ-paris-est.fr/evenements/colloques-et-conferences/atm-
2013-communications-full-papers/?eID=dam_frontend_push&docID=25213
Fields, G. (2003). Accounting for income inequality and its change: a new method, with application to
the distribution of earnings in the united states. In Worker Well-Being and Public Policy (Vol.
22, pp. 1–38). Emerald Group Publishing Limited. Retrieved from
http://www.emeraldinsight.com/doi/abs/10.1016/S0147-9121%2803%2922001-X
Ghani, E., Goswami, A. G., & Kerr, W. R. (2012). Is India’s Manufacturing Sector Moving Away From
Cities? (Working Paper No. 17992). National Bureau of Economic Research. Retrieved from
http://www.nber.org/papers/w17992
Ghose, A. K. (2013). The Enigma of Women in the Labour Force. Indian Journal of Labour
Economics, 56, 635–642.
Ghose, A. K. (2016). India Employment Report 2016: challenges and the imperative of manufacturing-
led growth. Institute for Human Development (New Delhi): Oxford University Press.
Ghose, J. (2014). The Curious Case of the Jobs that did not Appear: Structural Change, Employment
and Social Patterns in India. Indian Journal of Labour Economics, 57(1).
Ghose, J., & Chandrasekhar, C. P. (2015). Growth, Employment patterns and inequality in Asia: A case
study of India (Working Paper). Bangkok: ILO. Retrieved from
http://www.ilo.org/wcmsp5/groups/public/---asia/---ro-
bangkok/documents/publication/wcms_334063.pdf
Günther, I., & Launov, A. (2012). Informal employment in developing countries: Opportunity or last
resort? Journal of Development Economics, 97(1), 88–98.
https://doi.org/10.1016/j.jdeveco.2011.01.001
Katz, L., & Krueger, A. (2016). The Rise and Nature of Alternative Work Arrangements in the United
States, 1995-2015 (No. w22667). Cambridge, MA: National Bureau of Economic Research.
Retrieved from http://www.nber.org/papers/w22667.pdf
Kolli, R., & Sinharay, A. (2011). Informal Employment by Institutional Sectors and Activities in India.
The Journal of Income and Wealth, 33(2), 79–89.
Kolli, R., & Sinharay, A. (2014). Trends of Informal Employment in Institutional sectors. The Journal
of Income and Wealth, 36(2), 55–69.
Labour Bureau. (2015). Report on Fourth Annual Employment and Unemployment Survey 2013-14.
Delhi: Ministry of Labour and Employment, Government of India. Retrieved from
http://labourbureau.nic.in/Report%20Vol%203%20final.pdf
Maloney, W. F. (2003). Informal Self-Employment: Poverty Trap or Decent Alternative? In G. S.
Fields & G. Pfeffermann (Eds.), Pathways Out of Poverty (pp. 65–82). Springer Netherlands.
Retrieved from http://link.springer.com/chapter/10.1007/978-94-010-0009-3_4
NSSO. (1999). 55th (1999-2000) Round Informal Non-Agricultural Enterprises Survey. Kolkota:
National Sample Survey Organisation.
NSSO, Government of India. (2004). 61st (2004-05) Round Employment and Unemployment Survey.
Kolkota: National Sample Survey Organisation.
NSSO, Government of India. (2011). 68th (2011-12) Round Employment and Unemployment Survey.
Kolkota: National Sample Survey Organisation.
Papola, T., & Sahu, P. (2012). Growth and Structure of Employment in India. Delhi: Institute for
Studies in Industrial Development. Retrieved from
http://isidev.nic.in/pdf/ICSSR_TSP_PPS.pdf
Sharma, A. (2006). Flexibility, Employment and Labour Market Reforms in India. Economic and
Political Weekly, XLI(21).
Standing, G. (2014). The precariat: the new dangerous class. London, UK ; New York, NY:
Bloomsbury.
Unni, J., & Naik, R. (2013). Measuring Informality of employment in urban India. The Indian Journal
of Labour Economics, 56(4), 493–508.
Unni, J., & Rani, U. (2003). Employment and Income in the Informal Economy: A Micro Perspective.
In Informal economy centrestage: new structures of employment (p. 288). Sage.


