Integrated Health/Person Centered
Health Home
Austin Travis County Integral Care
Kathleen A. Casey
Dawn R. Handley
June 20, 2014
Influencing factors
• Strong track record of successful integration with
FQHC partner CommUnity Care
– E-Merge Program
– Health Integration Program (HIP)
– 1115 Waiver Integration Project
– SAMHSA/HRSA Integration in Crisis Services
• SB 58- Health Home Pilot Opportunity
• Meadows Mental Health Policy Institute
• Data on clinical outcomes

Clinical Health Indicator Improvementsand Hospital Usage Report
Health Integration Project
December 2013

Health Integration Project
Clinical Health Indicator Improvements
• All consumers in study had minimum of 1 year enrollment in HIP
with a minimum of 3 appointments.
• Health Indicator measures were taken at first appointment and
most recent appointment, then compared.
• Study only tracks consumers with measures outside of a healthy
range at first appointment, since measures in a healthy range do
not require treatment.

Health Integration Project
Clinical Health Indicator – Blood Pressure
154
136
75
95
115
135
155
175
Average atFirst
MeasurementReading
Average atLast
MeasurementReading
Systolic
99
83
50
60
70
80
90
100
110
Average atFirst
MeasurementReading
Average atLast
MeasurementReading
Diastolic
83%
17%
Systolic
% withImprovement
% withoutImprovement
89%
11%
Diastolic
% withImprovement
% withoutImprovement
• Blood Pressure reading is
systolic/diastolic.
• Consumers tracked with
hypertension (140/90 and
above) at first appointment.
• Average Change in measure
18/15.
• Average blood pressure fell
from “hypertension” to “pre-
hypertension” range.
• For every reduction of blood
pressure by 20/10, risk of heart
attack and stroke is cut in half.

Health Integration Project
Clinical Health Indicator – Blood Glucose
• Consumers only tracked with Diabetic Blood
Glucose Levels (126 and above) at first
appointment.
• Average change in measure 36mg/dL
• People with diabetes are twice as likely to
develop heart disease.
• People with blood glucose of greater than
200mg/dL considered most at risk.
• Average measure fell out of high risk range, from
227mg/dL to 191 mg/dL.
227
191
100
120
140
160
180
200
220
240
Average atFirst Measurement
Reading
Average atLast Measurement
Reading
Glucose
63%
37%
Glucose
% withImprovement
% withoutImprovement

Health Integration Project
Clinical Health Indicator – Body Mass Index (BMI)
• BMI is a height to weight ratio.
• Consumers only tracked with overweight or
obese BMI reading (25 and above) at first
appointment.
• Only measure to not show improvements, with
average change in a 0.3 gain.
• BMI of 30 and above considered obese and most
at risk for multiple health conditions.
• BMI can not be medically treated, and the only
effective intervention is diet and exercise.
• Atypical anti-psychotics known to induce weight
gain.
34.1 34.4
20.022.024.026.028.030.032.034.036.0
Average atFirst Measurement
Reading
Average atLast Measurement
Reading
BMI
46%54%
BMI
% withImprovement
% withoutImprovement
Health Integration Project
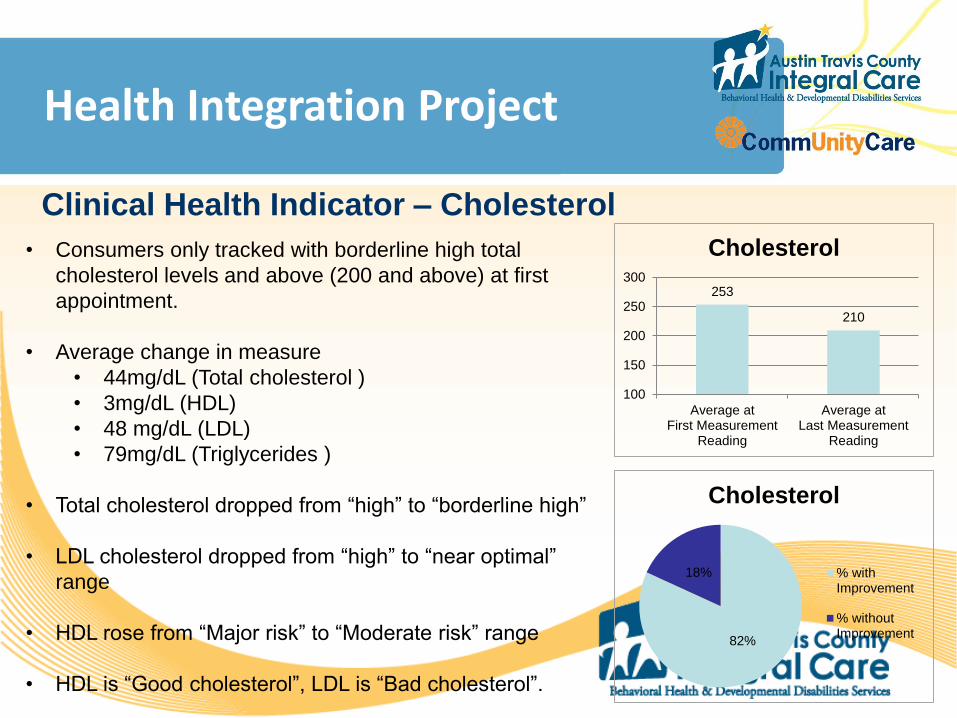
Clinical Health Indicator – Cholesterol
• Consumers only tracked with borderline high total
cholesterol levels and above (200 and above) at first
appointment.
• Average change in measure
• 44mg/dL (Total cholesterol )
• 3mg/dL (HDL)
• 48 mg/dL (LDL)
• 79mg/dL (Triglycerides )
• Total cholesterol dropped from “high” to “borderline high”
• LDL cholesterol dropped from “high” to “near optimal”
range
• HDL rose from “Major risk” to “Moderate risk” range
• HDL is “Good cholesterol”, LDL is “Bad cholesterol”.
• Poor cholesterol leads to development of heart disease
253
210
100
150
200
250
300
Average atFirst Measurement
Reading
Average atLast Measurement
Reading
Cholesterol
82%
18%
Cholesterol
% withImprovement
% withoutImprovement

Health Integration Project
Clinical Health Indicator – Cholesterol
3841
20
25
30
35
40
45
Average atFirst Measurement
Reading
Average atLast Measurement
Reading
HDL/Good Cholesterol
175
127
50
100
150
200
Average atFirst Measurement
Reading
Average atLast Measurement
Reading
LDL/Bad Cholesterol
298
218
100
150
200
250
300
350
Average atFirst Measurement
Reading
Average atLast Measurement
Reading
Triglyceride
55%45%
HDL/Good Cholesterol
% withImprovement
% withoutImprovement
87%
13%
LDL/Bad Cholesterol
% withImprovement
% withoutImprovement 78%
22%
Triglyceride
% withImprovement
% withoutImprovement

Health Integration Project
Hospital Usage
• Study included consumers enrolled in 2012 with a minimum of a
year in HIP services, and with emergency department (ED), or
inpatient admits to local hospitals within two year range, one year
before enrollment and one year after.
• Sum of ED admits and inpatient days both one year before
enrollment in HIP and after taken and compared.
• Average cost of ED admits and inpatient days applied to difference
to estimate cost savings.
• One year time frames used to take into consideration seasonal
variables, e.g. flu season, etc…

Health Integration Project
Hospital Usage
• ED admits
• 342 consumers
• 618 less ED admits in year post HIP enrollment
• Average of $1429 per admit
• Estimated annual savings $883,122
1777
1159
0
200
400
600
800
1000
1200
1400
1600
1800
2000
year pre enrollment in HIP year post enrollment in HIP
Sum of ED admits
$2,539,333
$1,656,211
$0
$500,000
$1,000,000
$1,500,000
$2,000,000
$2,500,000
$3,000,000
year pre enrollment inHIP
year post enrollment inHIP
Cost Estimate
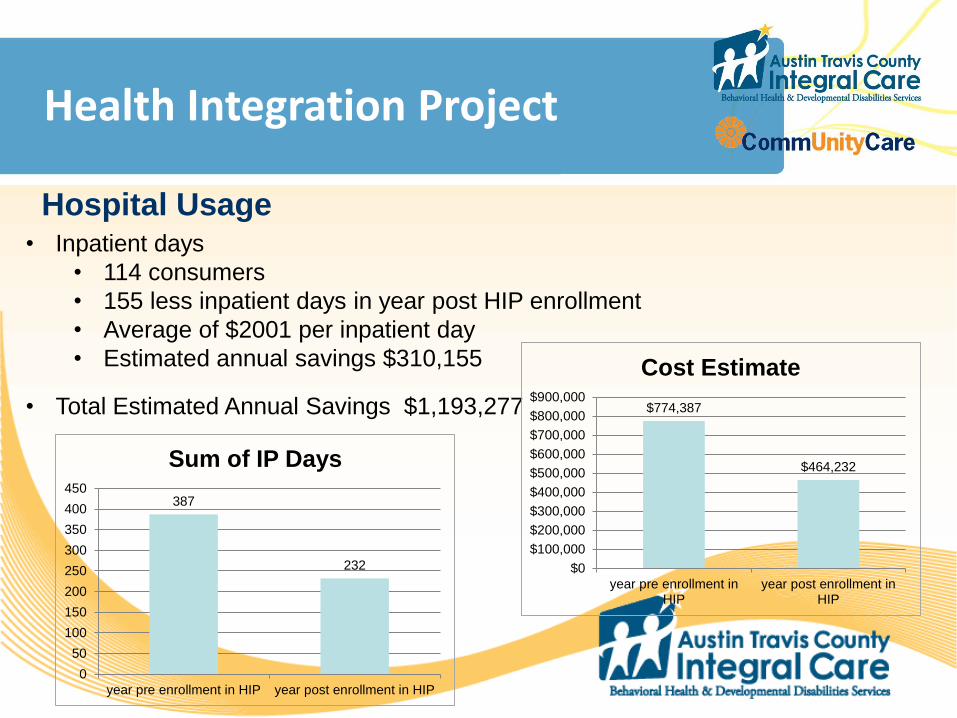
Health Integration Project
Hospital Usage• Inpatient days
• 114 consumers
• 155 less inpatient days in year post HIP enrollment
• Average of $2001 per inpatient day
• Estimated annual savings $310,155
• Total Estimated Annual Savings $1,193,277
387
232
0
50
100
150
200
250
300
350
400
450
year pre enrollment in HIP year post enrollment in HIP
Sum of IP Days
$774,387
$464,232
$0
$100,000
$200,000
$300,000
$400,000
$500,000
$600,000
$700,000
$800,000
$900,000
year pre enrollment inHIP
year post enrollment inHIP
Cost Estimate

Progress to Date
• 4 ATCIC/MMHPI Institute Meetings
• Interviews with Community Partners
• Implementation of OATI Readiness Tool
• Enhanced Integration Planning with CommUnity
Care

Next Steps
• Expansion of Readiness Assessment throughout
the organization
• Enhanced Integration with CommUnity Care
• Re-convene community partners to plan
integration for Austin and Travis County

Questions?


